


 DownLoad:


-
The summer rainfall amount in eastern Sichuan (ES) is about 600 mm (Lu and Ye, 2011; Hu et al., 2014; Qian et al., 2015; Zeng et al., 2016), even slightly higher than that in the Yangtze River Basin , which roughly ranges from 100° to 125°E and from 25° to 35°N (Qian et al., 2002). Therefore, the ES is prone to heavy rainfall, which frequently causes great economic loss and human deaths (You et al., 2008; Li et al., 2012; Ji et al., 2015; Deng et al., 2017). In addition, the summer rainfall in Sichuan exhibits a great interannual variability. For instance, the interannual standard deviation of summer rainfall averaged over the ES is about 90 mm, greater than that in the Yangtze River Basin (about 60 mm). Therefore, it is necessary to understand the interannual variability of summer rainfall, especially extreme rainfall, over Sichuan.
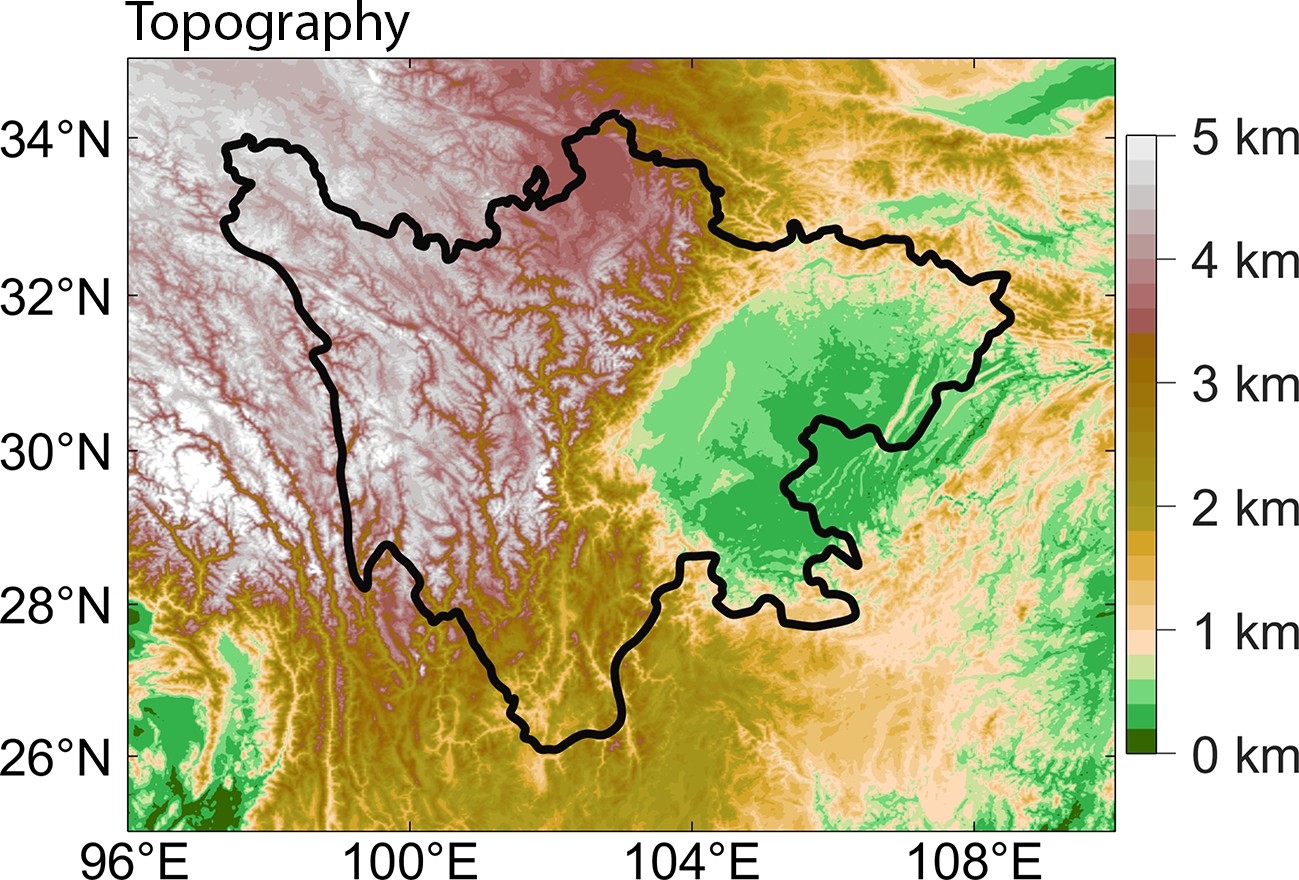
The precipitation in Sichuan shows a clear regional characteristic, which is closely related to the topography and is characterized by the difference of altitude between western Sichuan (WS) and ES (Fig. 1). The WS region is characterized by the eastern component of the huge Tibetan Plateau. The terrain height is dramatically reduced in the middle of Sichuan, representing the boundary of the western plateau and eastern basin in Sichuan. In addition, the terrain height decreases from about 4000 to 2000 m at the south end of the western plateau in Sichuan. On the other hand, the ES is characterized by a basin, which is one of the four largest basins in China, extending southeastward into Chongqing. This basin is surrounded by the Ta-pa and Qinling mountains to the north. The mountains are relatively lower at the eastern boundary of the basin than other boundaries. In association with this topography, summer precipitation in the ES is much greater than that in the WS (Liang et al., 2005; Zhang and Li, 2014). The amount of summer precipitation in the ES is ~ 600 mm, while it is ~ 400 mm in the WS. Accordingly, heavy rainfall tends to occur more frequently in the ES. For instance, a serious flood occurred in the western part of the ES during 18–19 August 2010, with rainfall amount being > 200 mm (Li et al., 2016). The heavy rainfall in the WS, despite occurring less frequently than in the ES, can also trigger serious geological disasters (Zhao et al., 2021). Furthermore, summer precipitation in the WS also shows a notable interannual variability. The interannual standard deviation of summer precipitation in the WS is about 50–60 mm, which is comparable with that in the Yangtze River Basin. In addition, due to the lesser rainfall amount, the coefficient of variation, which is defined by the ratio of standard deviation to average, is comparable between the WS and ES. Therefore, we can conclude that summer rainfall has a notable interannual variability both in the WS and ES.

Figure 1. The topography (shaded, km) of Sichuan and adjacent areas.
Some previous studies investigated the atmospheric circulation and sea surface temperature (SST) anomalies associated with the interannual variation of summer rainfall in the ES. Hu et al. (2014) analyzed the summer rainfall variability in the ES and its related circulation anomalies. They suggested that the circulation anomalies of wet (dry) years in the ES are characterized by southerly (northerly) anomalies over the ES, which are at the western periphery of an anticyclonic (cyclonic) anomaly over the western North Pacific (WNP) in the lower troposphere, indicating the westward (eastward) displacement of the WNP Subtropical High (WNPSH). In addition, Jiang et al. (2015) studied the interannual variation of frequency of heavy rainfall events in the ES and indicated that this westward (eastward) movement of the WNPSH is induced by the warm (cool) SST anomaly in the WNP. On the other hand, the interannual variability of summer precipitation in the WS is even less well documented, in comparison with the ES. Chen et al. (2010) indicated that the increased precipitation in the WS corresponded to a cyclonic anomaly over North China both at 100 and 500 hPa.
In this study, we find that the interannual variations of precipitation in the WS and ES, especially extreme rainfall, are roughly independent. It is also found that the interannual variation of extreme rainfall is remarkably similar to that of rainfall, so in this paper we only show the results for extreme rainfall for conciseness. In order to reveal the reason for the different variations, we investigate the anomalous circulation both in the upper- and lower-troposphere associated with the extreme rainfall anomalies over the two regions, respectively. The results show that these anomalies are quite different for the WS and ES, and different SST anomalies are possibly responsible for them. In addition, the large- and regional-scale features are also predominant for lower-tropospheric circulation anomalies both for the WS and ES. We suggest that these regional-scale anomalies are closely related to the topography in Sichuan and its surrounding areas.
The remaining part of this paper is arranged as follows. A description of datasets and methodology is given in section 2. The distributions of extreme rainfall and precipitation are displayed in section 3. The circulation anomalies related to extreme rainfall anomaly are explored in section 4. Additional studies of the SST anomalies and their related anomalies are performed in section 5. Finally, this paper is concluded with the summary and discussion in section 6.
-
Daily precipitation dataset over Sichuan is obtained from the National Meteorological Information Center of the China Meteorological Administration for the period of 1979–2017. There are 39 meteorological stations in Sichuan, as shown in Fig. 2a. The monthly precipitation amount in Sichuan reaches its peak in July and August. Moreover, the July–August precipitation amount accounts for about 40 percent of annual precipitation amount. Therefore, July and August are chosen for analysis as the mid-summer. In this study, the extreme rainfall is defined as the day with daily precipitation amount greater than the 95th percentile of all rain days in July and August for the period of 1979–2017. This definition is appropriate for evaluating the extreme rainfall at different stations in China, especially in a region with an inhomogeneous rainfall distribution (Zhai et al., 2005).

Figure 2. Spatial distribution of (a) average precipitation (dots; units: mm d−1), (b) precipitation variance (dots; units: mm2 d−2) and (c) the 95th percentiles of daily precipitation (dots; units: mm d−1) in Sichuan during July and August. Gray areas indicate the regions above 1500 m. Red dots indicate the stations in western Sichuan, while blue dots indicate the stations in eastern Sichuan.
The monthly mean atmospheric and SST datasets used in this study cover the period of 1979–2017. The atmospheric dataset is provided by the European Centre for Medium-Range Weather Forecasts interim reanalysis, with a horizontal resolution of 0.5° × 0.5° (Uppala et al., 2005; Dee et al., 2011). The atmospheric variables include relative vorticity at 200 hPa and horizontal winds at 200, 500, 650, 850 and 900 hPa. The SST dataset is provided by the National Oceanic and Atmospheric Administration (NOAA) Extended Reconstructed SST version 5 (ERSSTv5), with a horizontal resolution of 2° × 2° (Huang et al., 2017). The Niño indices (i.e., Niño-3 index, Niño-3.4 index and Niño-4 index) are calculated by using the ERSSTv5, which are provided by the NOAA Climate Prediction Center (
https://psl.noaa.gov/data/climateindices/list/ ). In addition, the topographic dataset is from the ETOPO1 1 arc-minute Global Relief Model, which is taken from the National Geophysical Data Center (Amante and Eakins, 2009). -
Figure 2 shows the distributions of July−August rainfall, interannual variance and the 95th percentiles of daily precipitation in Sichuan. The shading indicates the regions higher than 1500 m, which are used to distinguish the WS and ES in this study. It is apparent that the precipitation is much larger in the ES than WS (Fig. 2a). The precipitation averaged over the stations in the ES is 15.3 mm d−1, which is about two times the average value (7.4 mm d−1) for the WS stations. Furthermore, the station with minimum precipitation in the ES shows 12.2 mm d−1, which is similar to the maximum station precipitation (12.4 mm d−1) in the WS, confirming the clear distinction in precipitation intensity between the WS and ES. On the other hand, there is a regional distinction for the precipitation both in the WS and ES. Over the WS, precipitation is greatest at the southernmost stations, tends to decrease northwards until about 29°N, and becomes stable to the north of this latitude. This distribution of the precipitation agrees with the topography showed in Fig. 1.
In agreement with the distribution of precipitation, the precipitation variance in the ES is also much greater than that in the WS, especially in the west of the ES. The precipitation variance averaged over the ES stations is 7.9 mm2 d−2, which is four times greater than the average value (1.8 mm2 d−2) for the WS stations. Moreover, the regional character of the variance is different between the WS and ES. The variance in the WS is weak to the north of 28°N and strong to the south, while the variance in the ES is strong over the west and north areas.
Figure 2c illustrates the distribution of 95th percentile of daily precipitation in Sichuan, which is associated with the amounts of precipitation and variance, namely, large precipitation and high variances correspond to high percentiles. Therefore, the percentile in the ES is higher than that in the WS. The percentile averaged over the ES stations is 64.3 mm d−1, which is nearly 2.5 times the value (26 mm d−1) averaged over the WS stations. Moreover, the percentile at all the ES stations exceeds the traditional criterion of rainstorm (50 mm d−1), while the percentile at a single station in the southmost of the WS is above this criterion, which confirms the difference of percentile between the ES and WS.
Figure 3 shows some features related to extreme rainfall in Sichuan. The extreme rainfall in the ES is stronger than that in the WS (Fig. 3a), which is similar to the distribution of the precipitation (Fig. 2a). Over the ES stations, the range of extreme rainfall is from 74.8 to 127.6 mm d−1, which is larger than that (22.3–69.4 mm d−1) over the WS stations, verifying the distinction of extreme rainfall in the WS and ES. In contrast to the extreme rainfall in the ES, such as the low value in the south, the extreme rainfall in the WS is high in the south, which exceeds 30 mm d−1. In addition, the extreme rainfall over more than half of the Sichuan stations, or more exactly, 9 WS stations and all 16 ES stations, exceed 30 mm d−1, indicating that extreme rainfall occurs frequently in Sichuan, even in the WS.
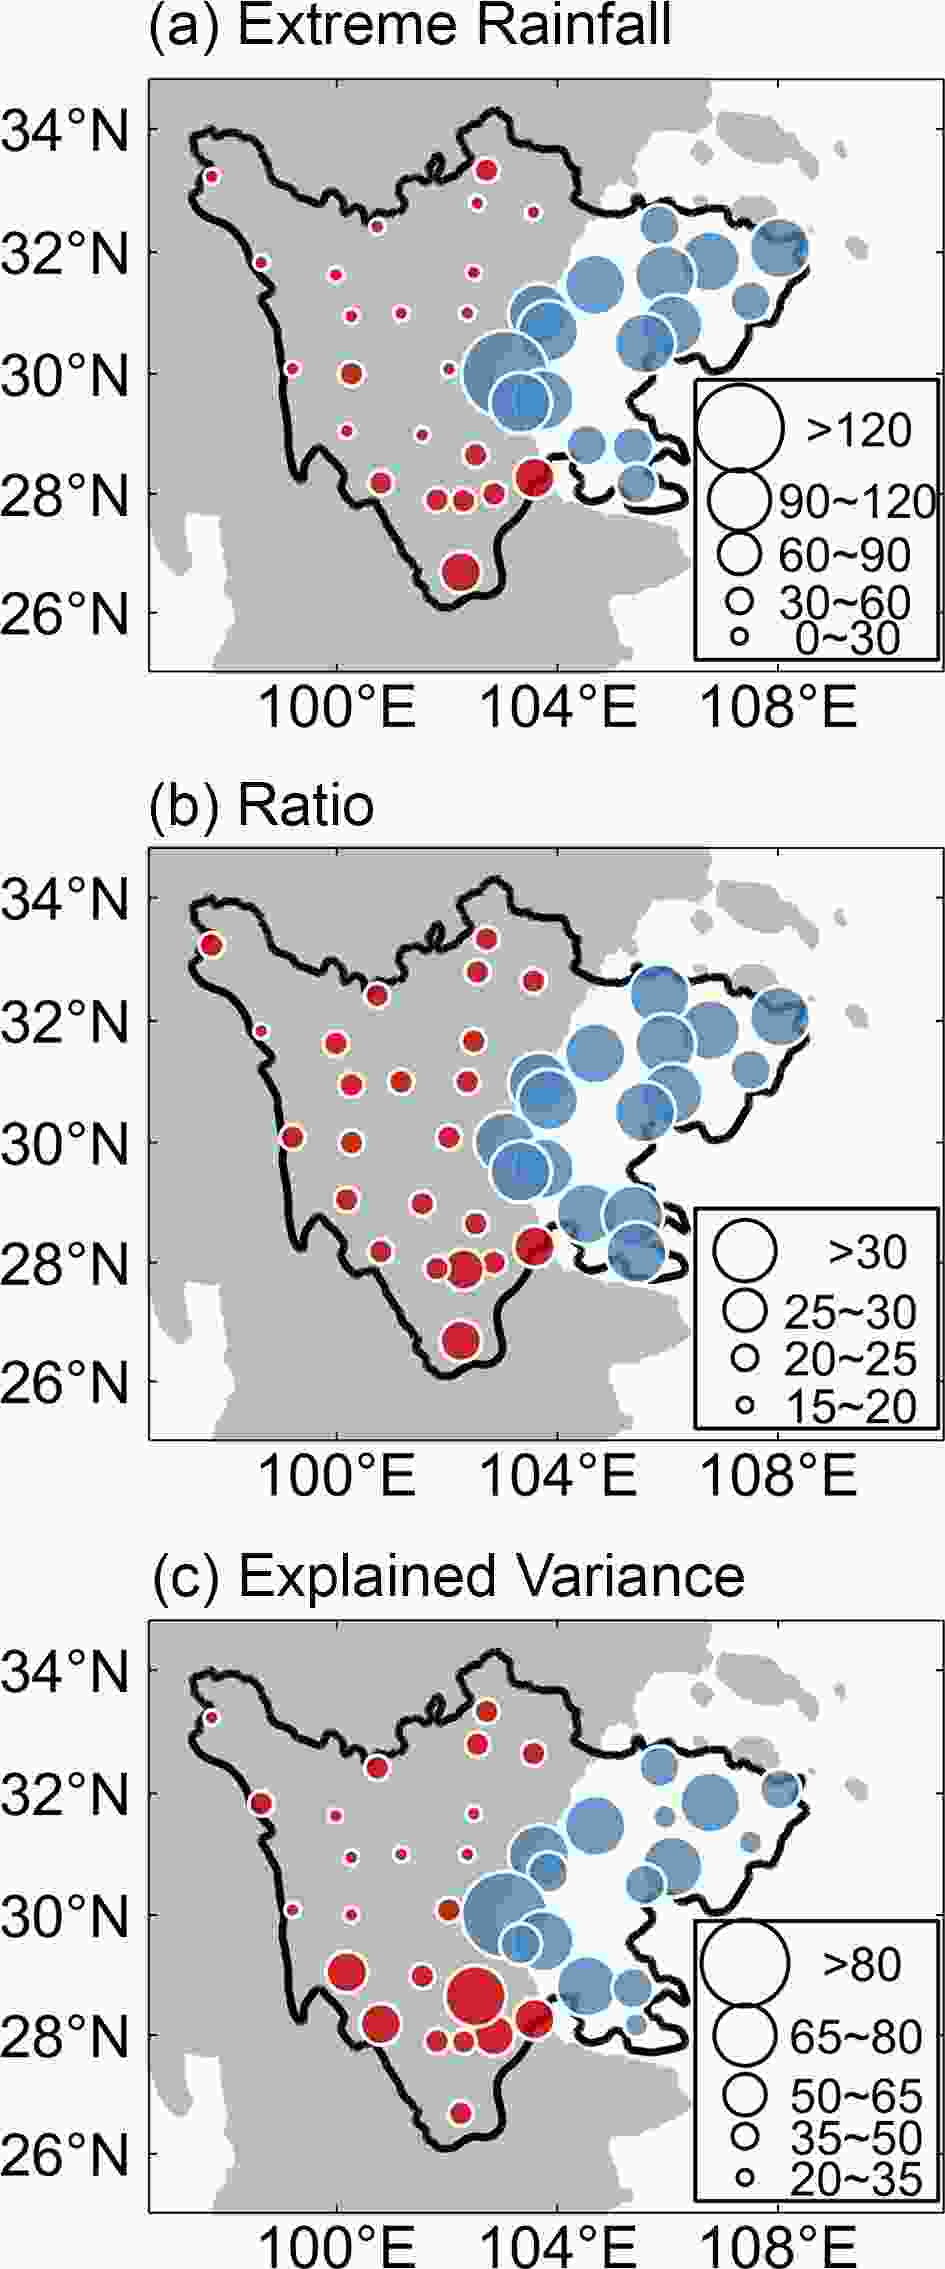
Figure 3. Spatial distribution of (a) average extreme rainfall (dots; units: mm d−1), (b) ratio of extreme rainfall to precipitation (dots; units: %), and (c) explained variance of extreme rainfall (dots; units: %) in Sichuan during July and August. Gray areas indicate the region above 1500 m. Red dots indicate the stations in western Sichuan, while blue dots indicate the stations in eastern Sichuan.
In general, the extreme rainfall contributes 20%–35% of total precipitation (Fig. 3b) over each station in Sichuan, which confirms that extreme rainfall occupies a crucial portion in total precipitation. The ratio in the ES is apparently higher than that in the WS. The ratio averaged over the ES is 32.4%, which is higher than that (22.8%) over the WS. Furthermore, the station with minimum ratio (27.9%) in the ES is similar to the station with maximum ratio (28.5%) in the WS, which further verifies the difference of the ratio between the WS and ES. The ratio in the WS is large in southeast, which is aligned with that of the extreme rainfall in the WS (Fig. 3a). On the other hand, the ratio tends to be uniformly distributed over the ES, which is in the range of 30%–35% at most stations.
Figure 3c shows the distribution of explained variance of extreme rainfall in Sichuan. The explained variance at all the stations exceeds 20%, and the maximum value at the westernmost station of the ES exceeds 88.4%, suggesting that the extreme rainfall represents a large portion of interannual variability of total precipitation. Furthermore, the explained variance in the ES is greater than that in the WS, which can be confirmed by the difference of explained variance averaged over the ES (61.2%) and WS (40.9%). In addition, the regional feature of explained variance in the WS is similar to that of extreme rainfall in the WS (Fig. 3a).
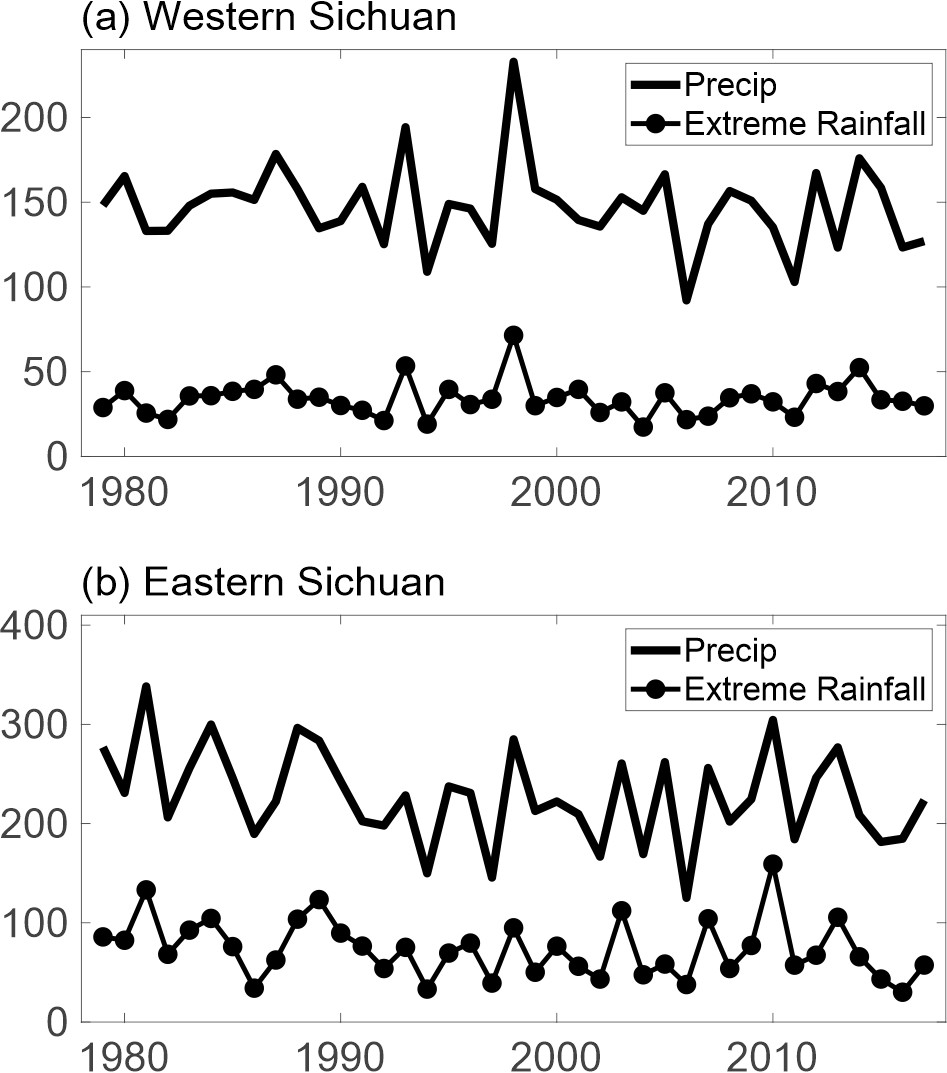
To quantify the variability, we define extreme rainfall and precipitation indices as the extreme rainfall and precipitation averaged over the WS and ES, respectively, and Fig.4 shows the time series of these indices. Obviously, the extreme rainfall indices show similar interannual variabilities to the precipitation indices, both for the WS (Fig. 4a) and ES (Fig. 4b). The similarity between the extreme rainfall and precipitation indices can be confirmed by the high correlation coefficients between them, which are 0.82 and 0.88 for the WS and ES, respectively. Therefore, the extreme rainfall can represent a large portion of interannual precipitation variability both over the WS and ES. In addition, the correlation coefficient between the two precipitation indices is 0.36, which is significant at the 95% confidence level. However, the two extreme rainfall indices are roughly independent, indicated by the low correlation coefficient between them (0.14). Based on these results, we can conclude that the two extreme rainfall indices can serve as a good indicator of the precipitation variability. Moreover, the fact that the correlation coefficient between the two extreme rainfall indices is lower than that between the precipitation indices suggests that the extreme rainfall indices can highlight the distinctions between the WS and ES. Therefore, in the following we will focus on extreme rainfall in the WS and ES.
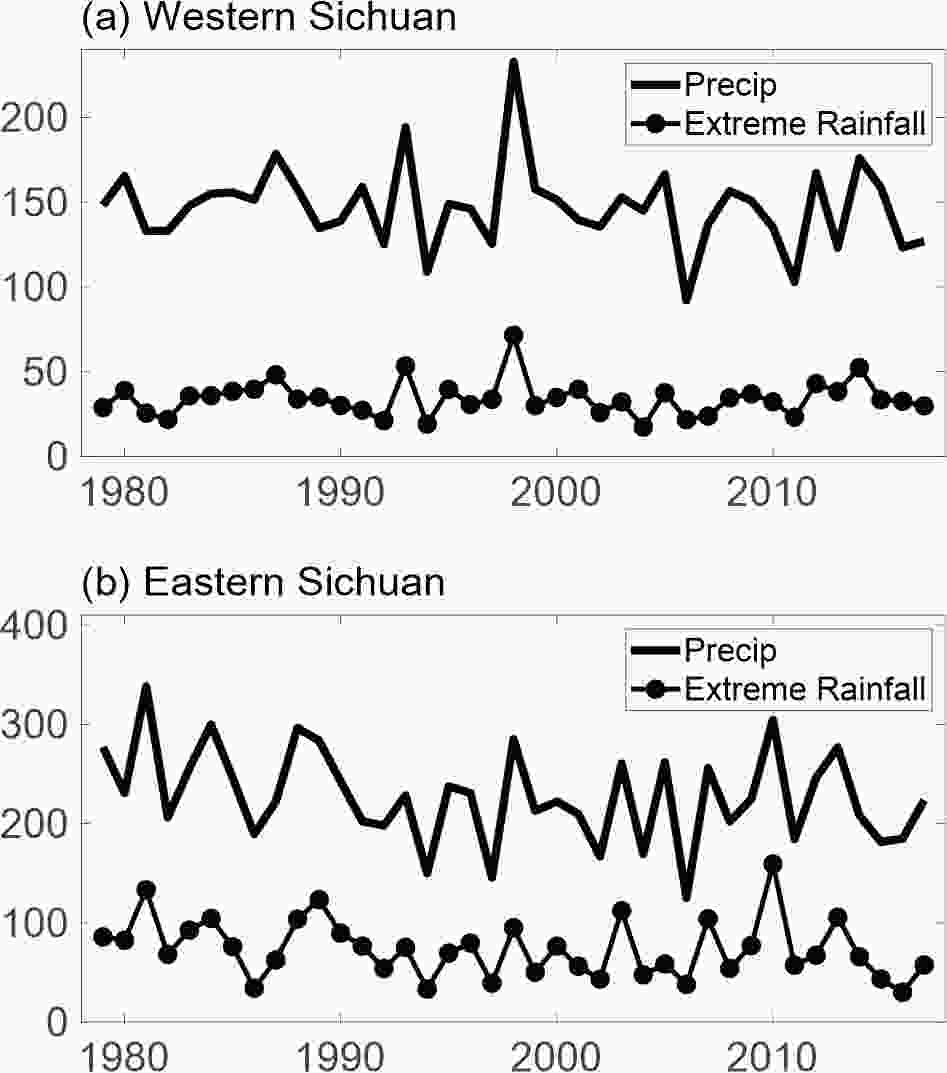
Figure 4. Time series of indices for (a) western and (b) eastern Sichuan. Solid (dotted) lines are the precipitation (extreme rainfall) indices (units: mm).
-
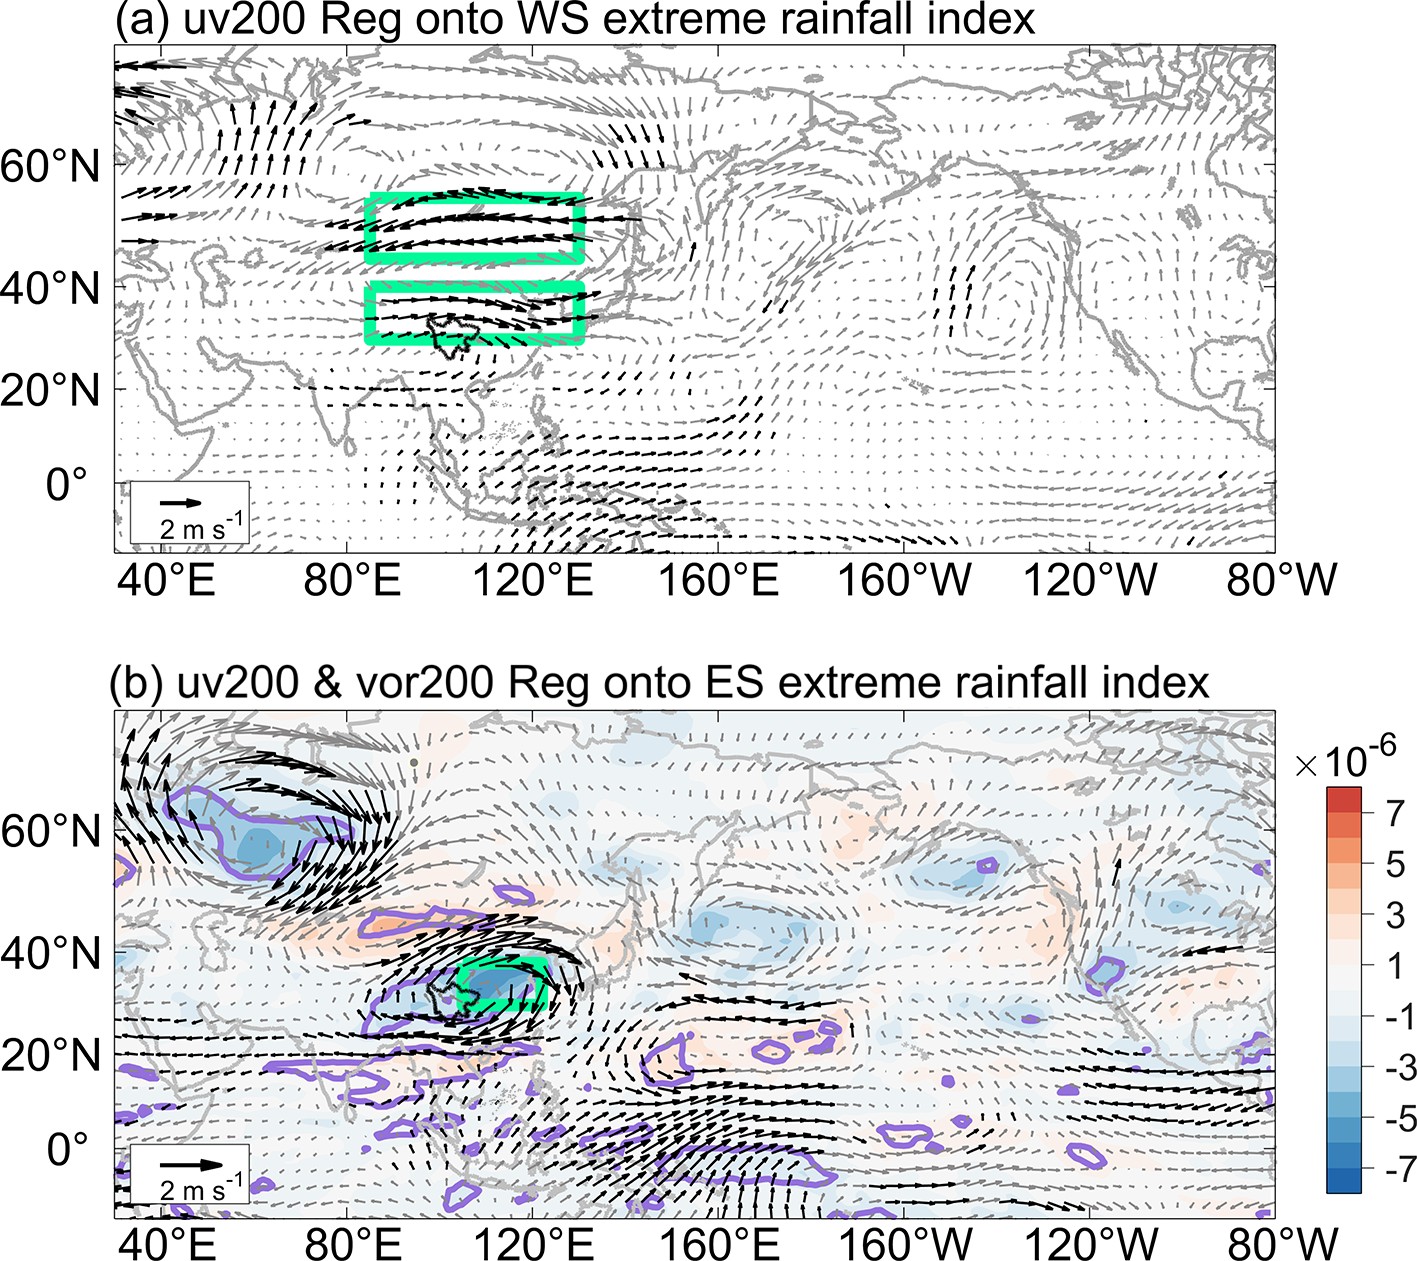
Figure 5 shows the 200-hPa horizontal wind anomalies regressed onto the normalized extreme rainfall index for the WS and ES, respectively. This analysis indicates that both indices are significantly related to large-scale circulation anomalies. However, the circulation anomalies associated with the two indices are apparently different, which is consistent with the low correlation coefficient between the indices (0.14).
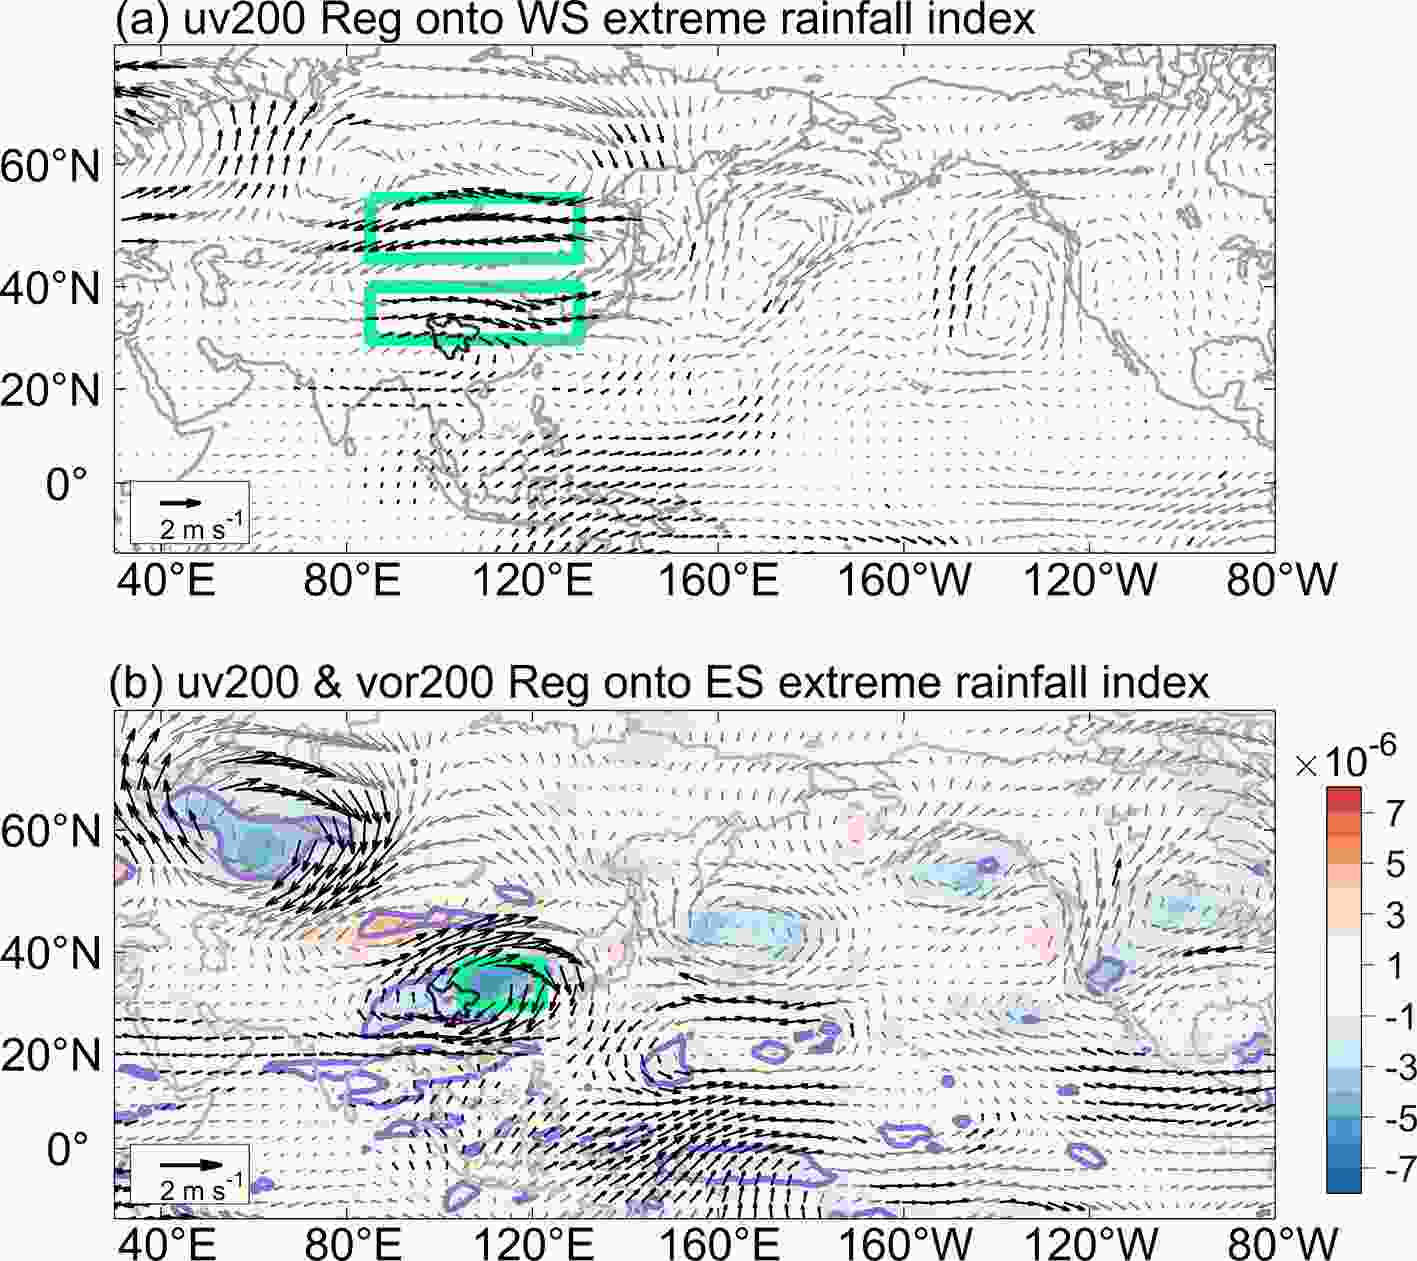
Figure 5. Horizontal wind anomalies (vectors, m s−1) at 200 hPa regressed onto the normalized extreme rainfall indices for (a) western and (b) eastern Sichuan during July and August. Relative vorticity anomalies (shaded, 10−6 s−1) at 200 hPa regressed onto the normalized western Sichuan extreme rainfall index during July and August. Black vectors indicate the significant anomalies of either zonal or meridional wind at the 95% confidence level using F-test. Purple lines indicate the significant anomalies of relative vorticity at the 95% confidence level using F-test. Two green rectangles in (a) are used to define the Asian westerly jet index, while a green rectangle in (b) is used to define the anticyclone index.
The wind anomalies related to the positive WS extreme rainfall index are characterized by a dipole pattern of zonal wind anomalies: the easterly anomalies along 50°N and westerly anomalies along 35°N, both extending from 85°E to 130°E (Fig. 5a). These zonal wind anomalies signify a southward displacement of the Asian westerly jet (AWJ), considering that the axis of AWJ is along 40°N climatologically (Lu, 2004). To quantitatively estimate the relationship between this dipole pattern and the WS extreme rainfall, we define an AWJ index (AWJI) as the difference of zonal winds at 200 hPa between the south (30°–40°N, 85°–130°E) and north regions (45°–55°N, 85°–130°E), which are marked by the two green rectangles in Fig. 5a, respectively. The positive (negative) AWJI indicates an equatorward (poleward) displacement of the AWJ. The correlation coefficient between the AWJI and WS extreme rainfall index is 0.54, which is significant at the 99% confidence level. This suggests that the equatorward shift of the AWJ corresponds to the enhanced WS extreme rainfall. In addition, there is a cyclonic anomaly over Northwest Europe, easterly anomalies over South Asia, and southwesterly anomalies over the Maritime Continent.
By contrast, the wind anomalies regressed onto the ES extreme rainfall index tend to be geographically widespread (Fig. 5b). A significant anticyclonic anomaly appears over China. In addition, there is an anticyclonic anomaly over the mid-high latitude region of Eastern Europe and a cyclonic anomaly over central Asia. These two anomalies and the anticyclonic anomaly over China appear like a wave train.
Although there are also the westerly and easterly anomalies in association with the anticyclonic anomaly over China, these zonal wind anomalies are quite different, both in the shape and location, from the dipole pattern of zonal wind anomalies shown in Fig. 5a. First, the westerly and easterly anomalies in Fig. 5b, together with the significant southerly and northerly anomalies, tend to be the components of the typical anticyclonic anomaly over China, while the dipole pattern of zonal wind anomalies in Fig. 5a tend to be related to a meridional shear of zonal wind anomalies. Second, the westerly and easterly anomalies in Fig. 5b are roughly along 45°N and 25°N over China, where the zonal anomalies are weak in Fig. 5a. To highlight the anticyclonic anomaly over China, we define an anticyclone index (ACI) as the 200-hPa vorticity anomalies averaged over the domain (30°–38°N, 105°–122°E), which is marked by a green rectangle in Fig. 5b and multiplied by minus one. The correlation coefficient between the ACI and ES extreme rainfall index is 0.59, significant at the 99% confidence level, which signifies that the anticyclonic anomaly is significantly related to the increased ES extreme rainfall. On the other hand, the difference in circulation anomalies associated with the WS and ES extreme rainfall indices can be confirmed by an extremely weak correlation coefficient between the AWJI and ACI of only 0.05. It is interesting that the extreme rainfall activities over the two adjacent regions in Sichuan are related to quite different large-scale circulation anomalies. This issue is discussed further below.
There are also significant wind anomalies in the tropics associated with the ES extreme rainfall index (Fig. 5b). There are westerly or southwesterly anomalies over the Maritime Continent and western Pacific, and easterly anomalies extending westwards from Southeast Asia into North Africa. These wind anomalies resemble those associated with the WS extreme rainfall index (Fig. 5a) but are stronger and more significant.
In the following, we investigate the wind anomalies at lower levels associated with the extreme rainfall anomalies in the WS and ES, since the lower-level winds transport the bulk of the water vapor, which is essential for inducing extreme rainfall. Considering the complex topography of Sichuan (Fig. 1), we investigate the wind anomalies at 500 and 650 hPa associated with the WS extreme rainfall index and those at 850 and 900 hPa corresponding to the ES extreme rainfall index. These pressure levels are used to represent the lower levels where circulations play a crucial role in transporting water vapor. In addition, one can find in the following that these levels can also depict to some extent the impacts of topography.
Figure 6 shows the wind anomalies at 500 and 650 hPa regressed onto the WS extreme rainfall index. The wind anomalies at 500 hPa are characterized by the westerly and easterly anomalies around 30°N and 50°N, extending from 80°E to 140°E (Fig. 6a). These wind anomalies correspond well to the 200-hPa anomalies (Fig. 5a), suggesting a roughly barotropic structure of these extratropical circulation anomalies. However, the westerly anomalies at 500 hPa are shifted slightly southwards, in comparison with those at 200 hPa, which are at ~35°N. On the other hand, the easterly anomalies around 50°N do not exhibit an appreciable meridional shift. The wind anomalies do not uniformly appear as westerly anomalies and are statistically significant over Sichuan (Fig. 6b). Rather, they tend to appear as southwesterly anomalies over central and eastern Sichuan, which deepens the climatological trough there. These regional features may be not related to the 200-hPa wind anomalies, since the 500-hPa wind anomalies regressed onto the AWJI show uniformly significant westerly anomalies over Sichuan (not shown). We further discuss this issue in the subsequent section. Due to the topography, the 650-hPa westerly anomalies shift further southwards and appear around the southern slope of the Tibetan Plateau, turning into the southwesterly anomalies over the southeastern slope of the Plateau (Fig. 6d). These wind anomalies encounter the topography at the southwest of Sichuan (Fig. 6d), implying anomalous upslope winds there. In sharp contrast with the 500-hPa wind anomalies, there are significant northeasterly anomalies over central and northern Sichuan at 650 hPa (Fig. 6d), and they encounter the eastern slope of the Tibetan Plateau, again implying anomalous upslope winds over the WS. These northeasterly anomalies over central and northern Sichuan are found to be closely related to the 200-hPa wind anomalies, since the AWJI-regressed wind anomalies show stronger and more significant northeasterly anomalies over this region at 650 hPa (not shown). We also examined the water vapor transport at these two levels and found that the transport anomalies resemble very well the wind anomalies, with the anomalous water vapor convergence appearing over the WS (not shown), which enhances the extreme rainfall there. This suggests that the wind anomalies play a fundamental role in affecting water vapor transport and convergence.
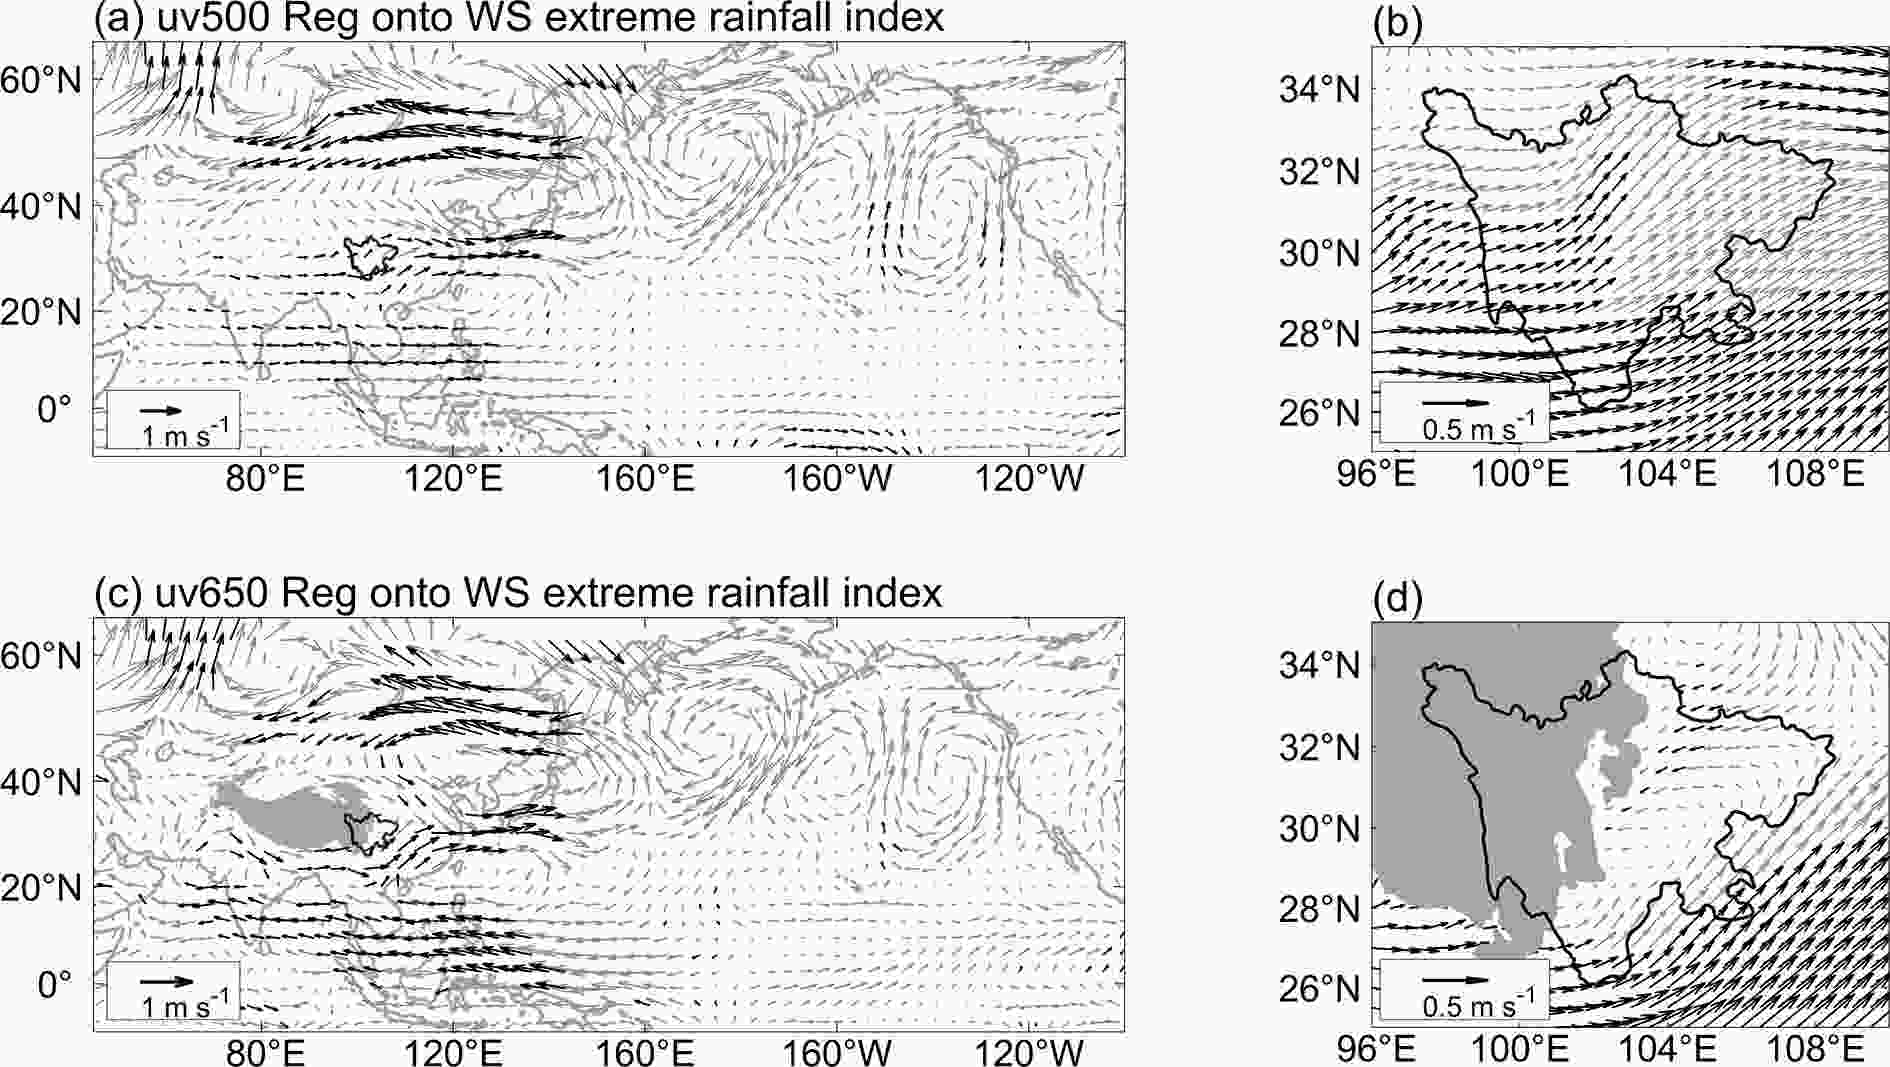
Figure 6. Horizontal wind anomalies (vectors, m s−1) at (a) 500 and (c) 650 hPa regressed onto the normalized western Sichuan extreme rainfall index during July and August. (b) and (d) are the local amplifications of (a) and (c), respectively. Black vectors indicate the significant anomalies of either zonal or meridional wind at the 95% confidence level using F-test. Grey areas indicate the surface pressure below 650 hPa in (c) and (d).
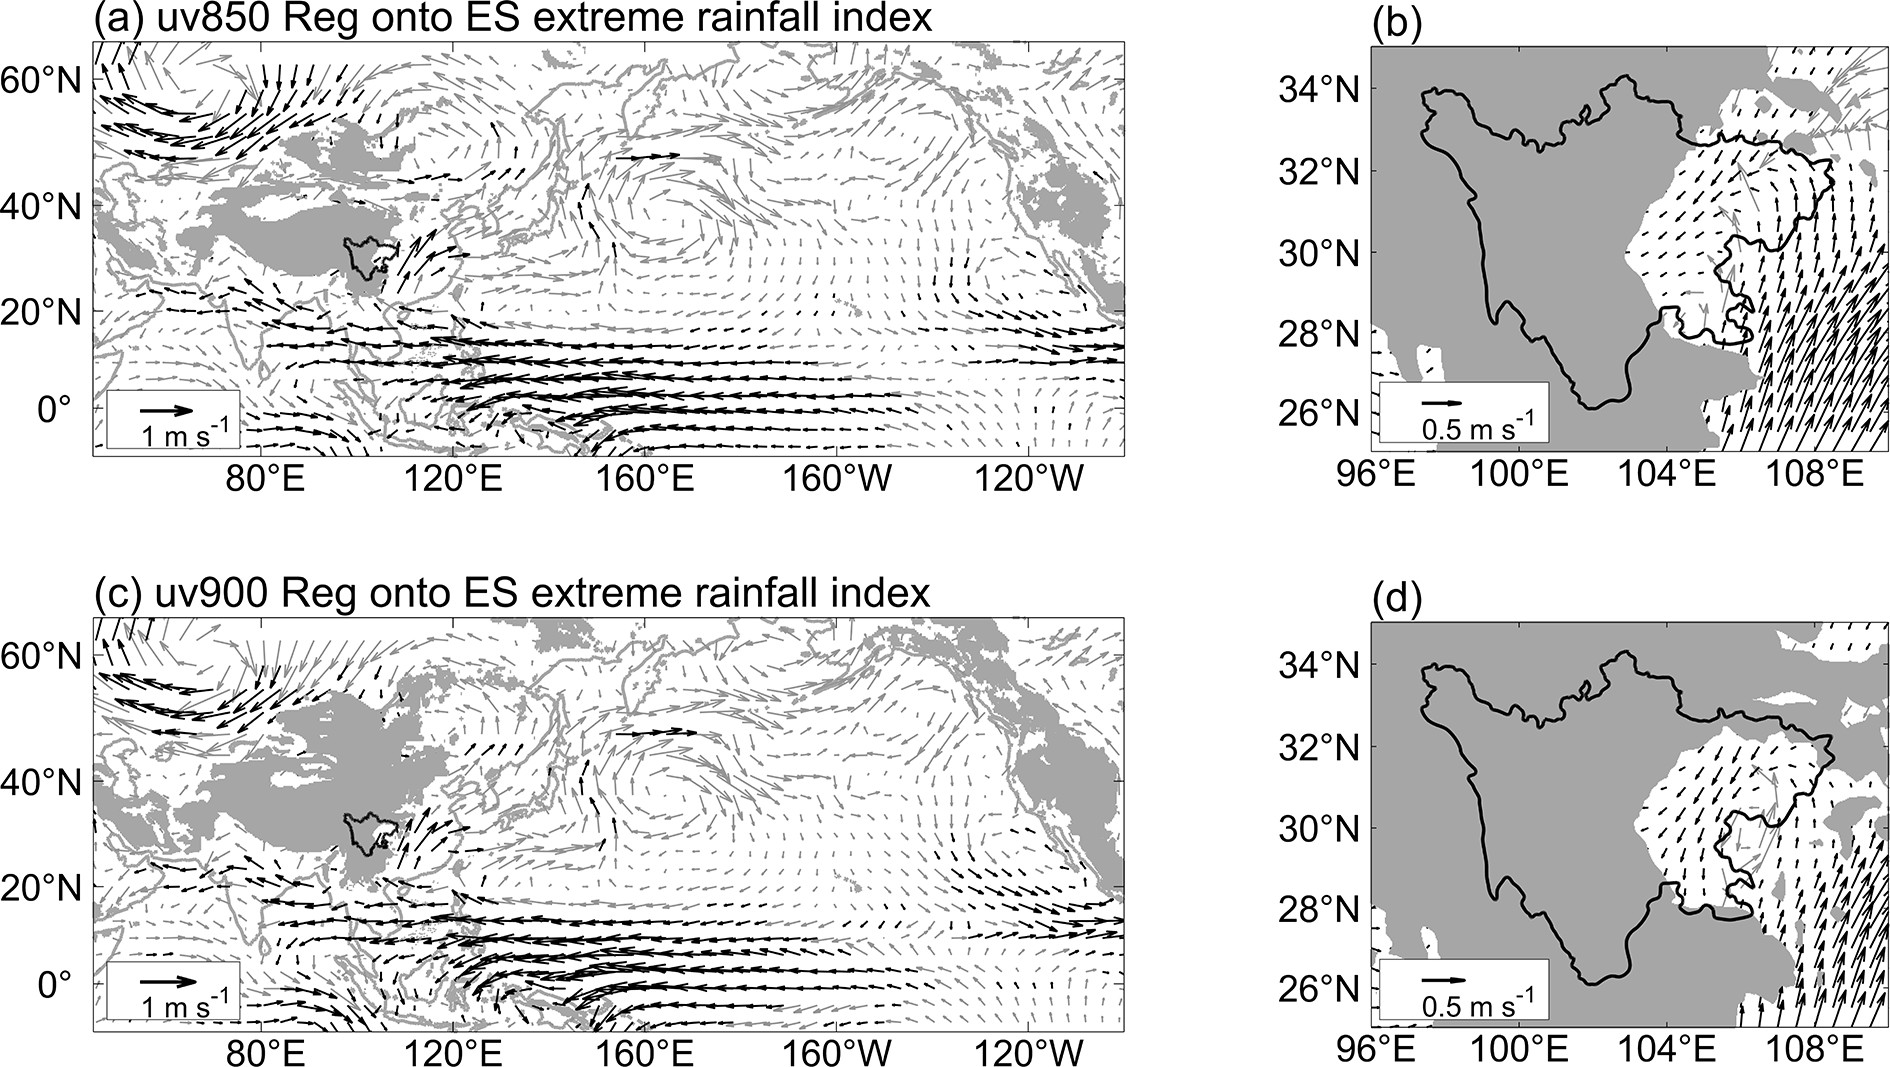
Figure 7 shows the wind anomalies at 850 and 900 hPa regressed onto the normalized ES extreme rainfall index. There is an anticyclonic anomaly over the subtropical WNP. This anticyclonic anomaly is mainly manifested as easterly anomalies over the tropical western and central Pacific and southerly anomalies over Southeast China. These southerly anomalies are associated with the upper-tropospheric anticyclonic anomaly over China (Fig. 5b), indicated by the middle- and low-level wind anomalies regressed onto the ACI (not shown). The wind anomalies over Sichuan are highlighted in Figs. 7b and 7d. The anomalous southerlies turn westward into the Sichuan basin as they meet the Ta-pa and Qinling mountains to the north of the basin, and northeasterly anomalies dominate over the basin. In addition, the northeasterly anomalies over the basin can be partly attributed to those from the north, which seem to be from across the Ta-pa and Qinling mountains at 850 hPa, although not at 900 hPa. These lower-tropospheric wind anomalies transport water vapor into the basin and favor the extreme rainfall, which can be indicated by an anomalous cyclonic water vapor transport over the basin related to the enhanced ES extreme rainfall (not shown). These results suggest that the lower-level southerly anomalies to the east of Sichuan play a crucial role in inducing extreme rainfall in the basin, under the special topography around Sichuan.
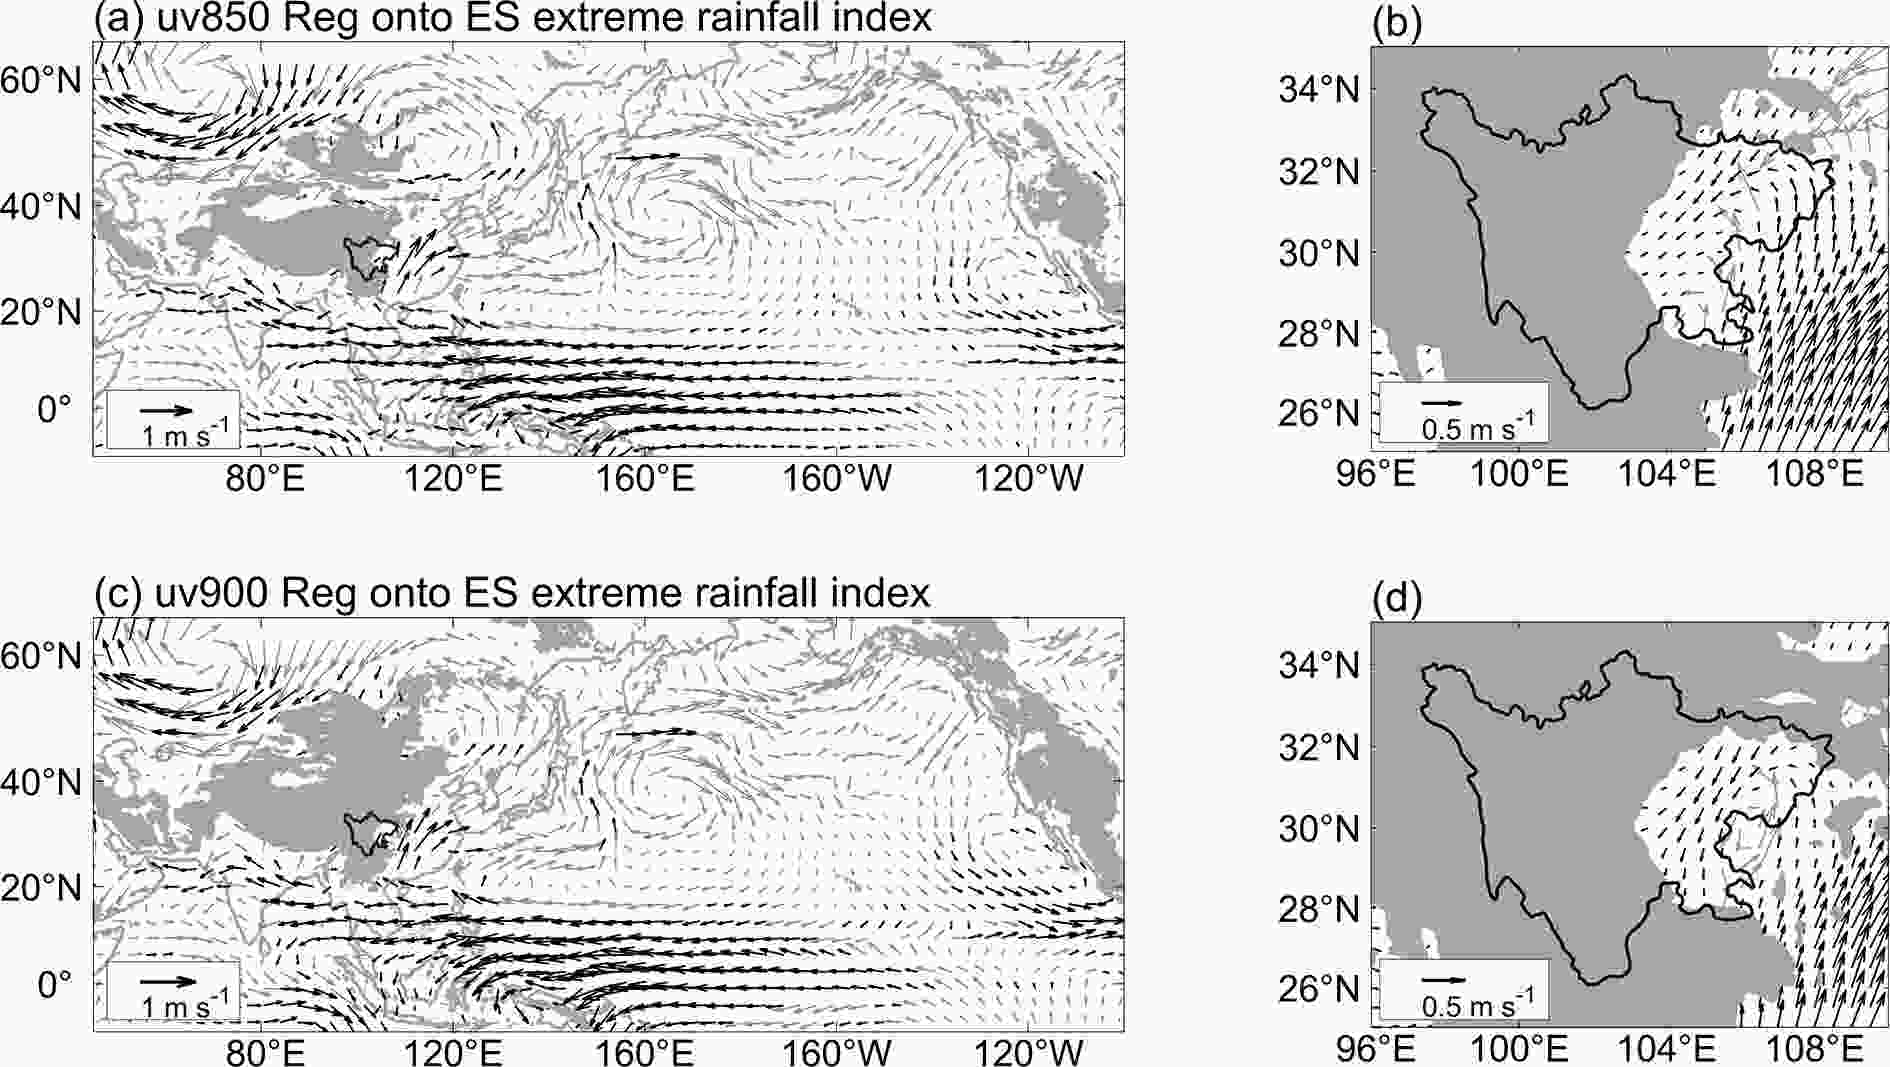
Figure 7. As in Fig. 6, but for wind anomalies at 850 (upper panels) and 900 hPa (lower panels) regressed onto the normalized eastern Sichuan extreme rainfall index. Grey areas indicate surface pressure below 850 hPa in (a) and (b), and 900 hPa in (c) and (d).
Additionally, we also examine the water vapor transport anomalies at 850 and 900 hPa corresponding to the increased ES extreme rainfall, both for large-scale and small-scale (not shown). The water vapor transport anomalies are well matched with the wind anomalies (Fig. 7), which suggest that the wind anomalies and terrain both favor the water vapor transport and convergence over the ES.
-
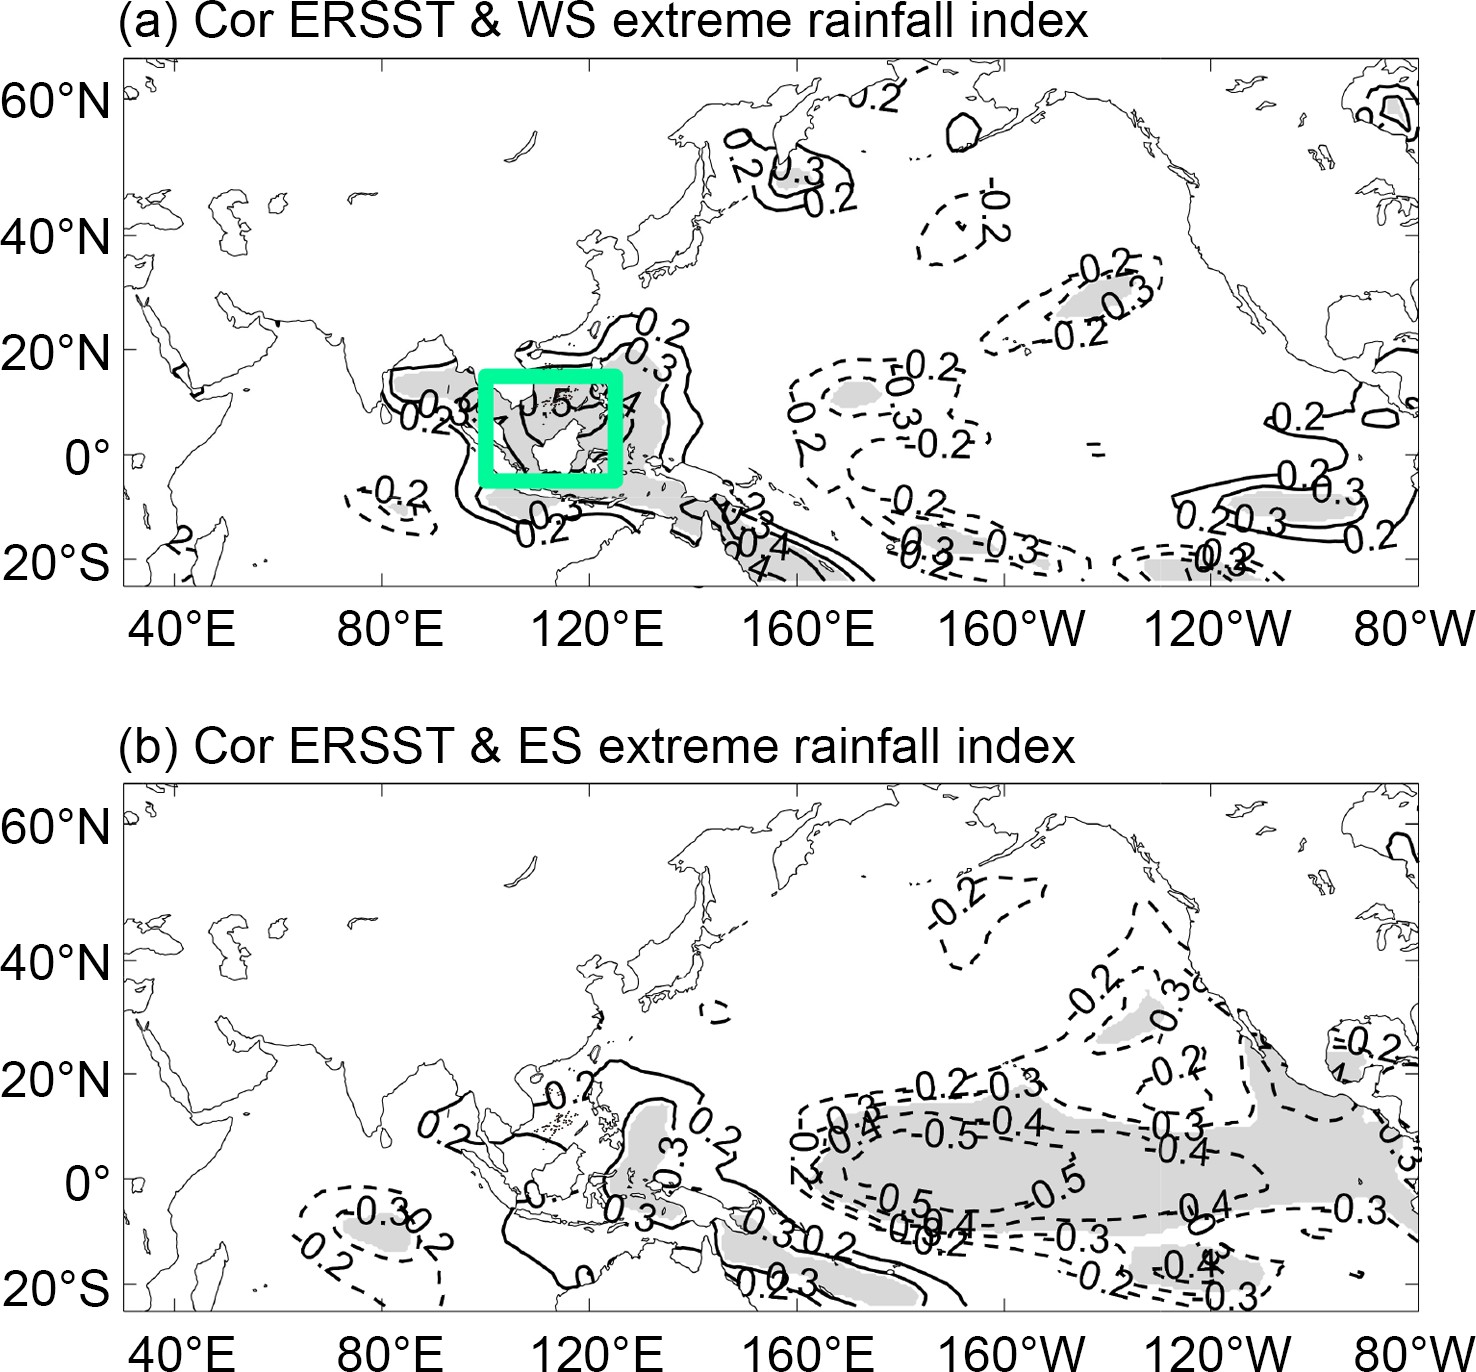
Figure 8 shows the spatial distribution of correlation coefficients between SSTs and the extreme rainfall indices for the WS and ES, respectively. The WS extreme rainfall index is significantly correlated with the positive SST anomalies around the Maritime Continent (Fig. 8a). Based on this distribution of correlation coefficients, an SST index, named the Maritime Continent SST index (MC-SSTI), is defined as the averaged SST anomalies in the region (5°S–15°N, 100°–125°E), marked by a green rectangle in Fig. 8a. The correlation coefficient between the MC-SSTI and WS extreme rainfall index is 0.50, significant at the 99% confidence level. On the other hand, the ES extreme rainfall index is negatively correlated with the SST anomalies in the equatorial central and eastern Pacific, while the strongest correlation coefficients appear in the central Pacific (Fig. 8b). The correlation coefficients between the ES extreme rainfall index and Niño-4, Niño-3.4, and Niño-3 indices are −0.57, −0.50 and −0.45, respectively, all significant at the 99% confidence level, confirming the close relationship between the ES extreme rainfall index and SST anomalies in the equatorial central and eastern Pacific, and a relatively closer relationship in the central Pacific. Besides, it should be mentioned that these SST-extreme rainfall relationships are not appreciably affected by long-term SST changes such as warming trends. For the WS (ES), the correlation coefficient between the extreme rainfall index and SST index after subtracting its 9-year running mean is 0.51 (−0.50).

Figure 8. Spatial distribution of correlation coefficients between sea surface temperature and extreme rainfall indices for (a) western and (b) eastern Sichuan during July and August. Gray areas indicate sea surface temperature anomalies at the 95% confidence level using F-test. The green rectangle in (a) is used to define the Maritime Continent SST index.
We also investigated the evolution of SST anomalies associated with the extreme rainfall indices for the WS and ES, respectively, and found that the SST anomalies over the Maritime Continent for the WS extreme rainfall index tend to appear simultaneously, i.e., around July and August, while those in the central and eastern Pacific for the ES extreme rainfall index tend to correspond to the ENSO developing (not shown). Furthermore, the two SST indices, i.e., the MC-SSTI and Niño-4 index do not show an appreciable relationship, as indicated by the very weak correlation coefficient (0.06) between them. These SST indices, which are closely related to the extreme rainfall indices for the WS and ES, respectively, do not relate significantly to the counterpart extreme rainfall indices. The correlation coefficient between the WS extreme rainfall index and Niño-4 index is –0.19, and that between the ES extreme rainfall index and MC-SSTI is 0.25. These results indicate that the extreme rainfall indices for the WS and ES are associated with quite different SST anomalies in the tropics.
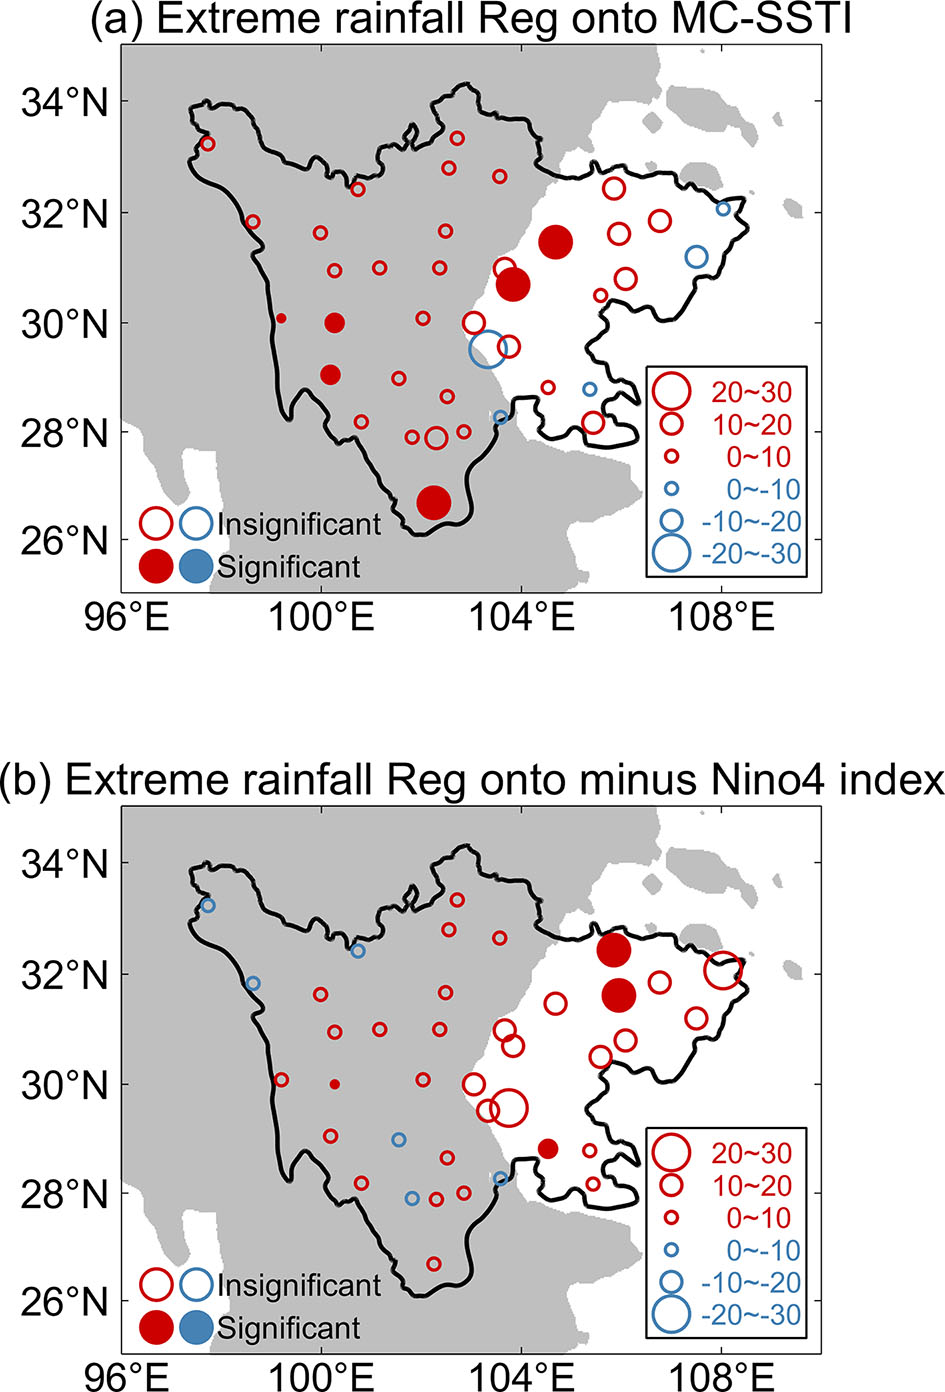
Figure 9 shows the extreme rainfall anomalies in Sichuan associated with the normalized MC-SSTI and Niño-4 index, respectively. At all the WS stations, except the ones in the southeast corner, extreme rainfalls are positively related to the MC-SSTI, and the rainfall anomalies at four stations are statistically significant at the 95% confidence level (Fig. 9a). The MC-SSTI is positively correlated to the extreme rainfall over a majority of basin stations, and the positive relationship is even statistically significant at the two stations. However, there are also four stations showing negative relationships with the MC-SSTI. By contrast, the minus Niño-4 index shows positive regression coefficients of extreme rainfall over all the ES stations, with three stations showing anomalies significant at the 95% confidence level (Fig. 9b). On the other hand, the extreme rainfall anomalies regressed onto the minus Niño-4 index are weak over all the plateau stations, being lower than 10 mm d−1. The results shown in Fig. 9 confirm that the SST anomalies around the Maritime Continent and in the equatorial central and eastern Pacific are associated with distinct regional differences in extreme rainfall anomalies, i.e., between the WS and ES. Therefore, it would be interesting to investigate how the large-scale SST anomalies in the tropics lead to the relatively small-scale extreme rainfall anomalies over Sichuan.
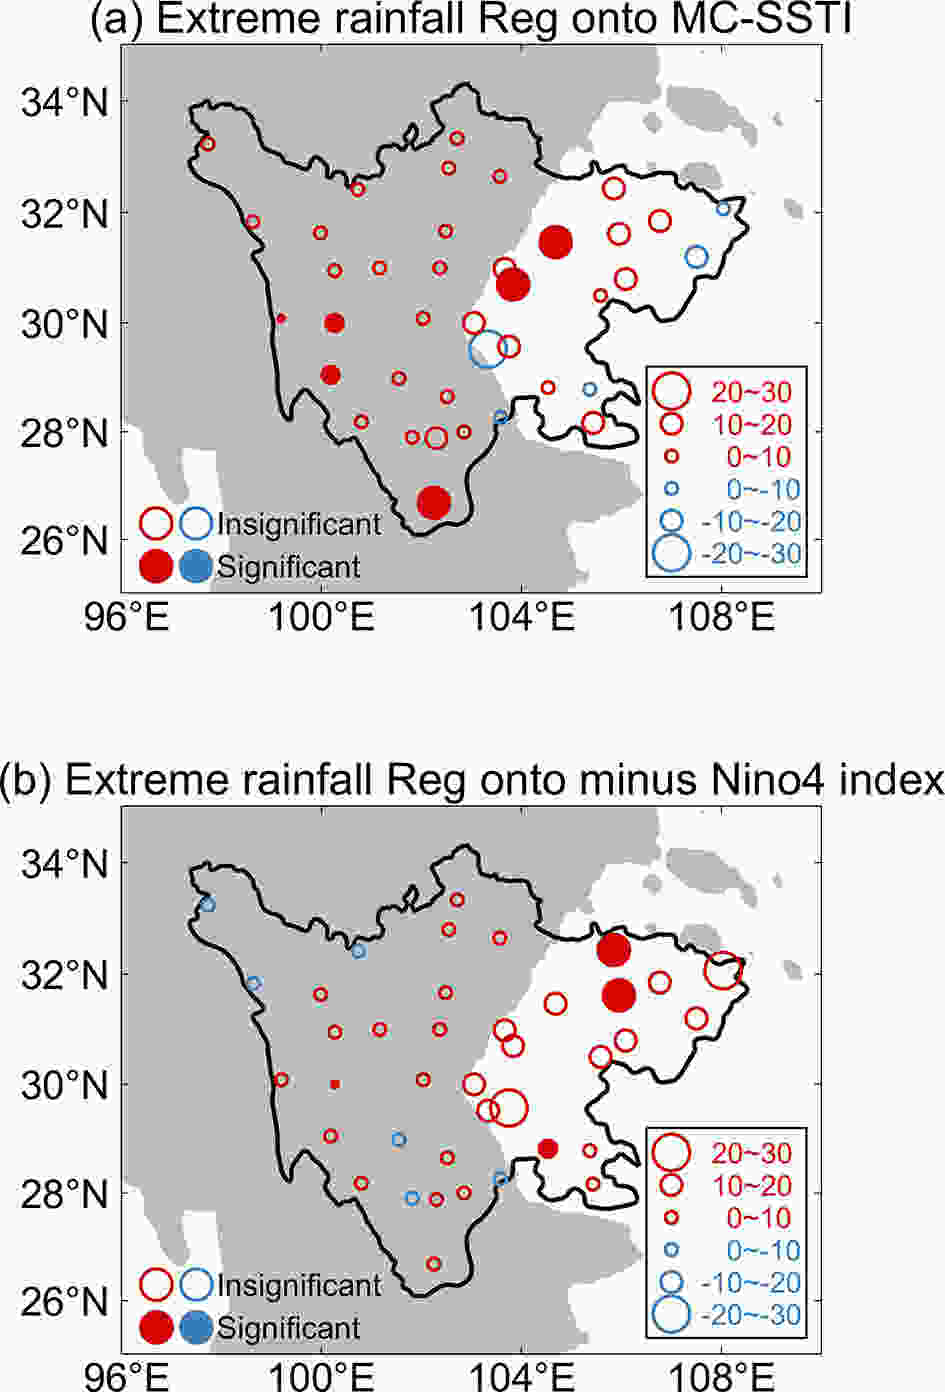
Figure 9. Extreme rainfall anomalies (dots; units: mm d−1) regressed onto the normalized (a) MC-SSTI and (b) minus Niño-4 index during July and August. Solid points indicate extreme rainfall anomalies at the 95% confidence level using F-test. Red dots indicate positive values, while blue dots indicate negative values. Grey areas indicate the region above 1500 m.
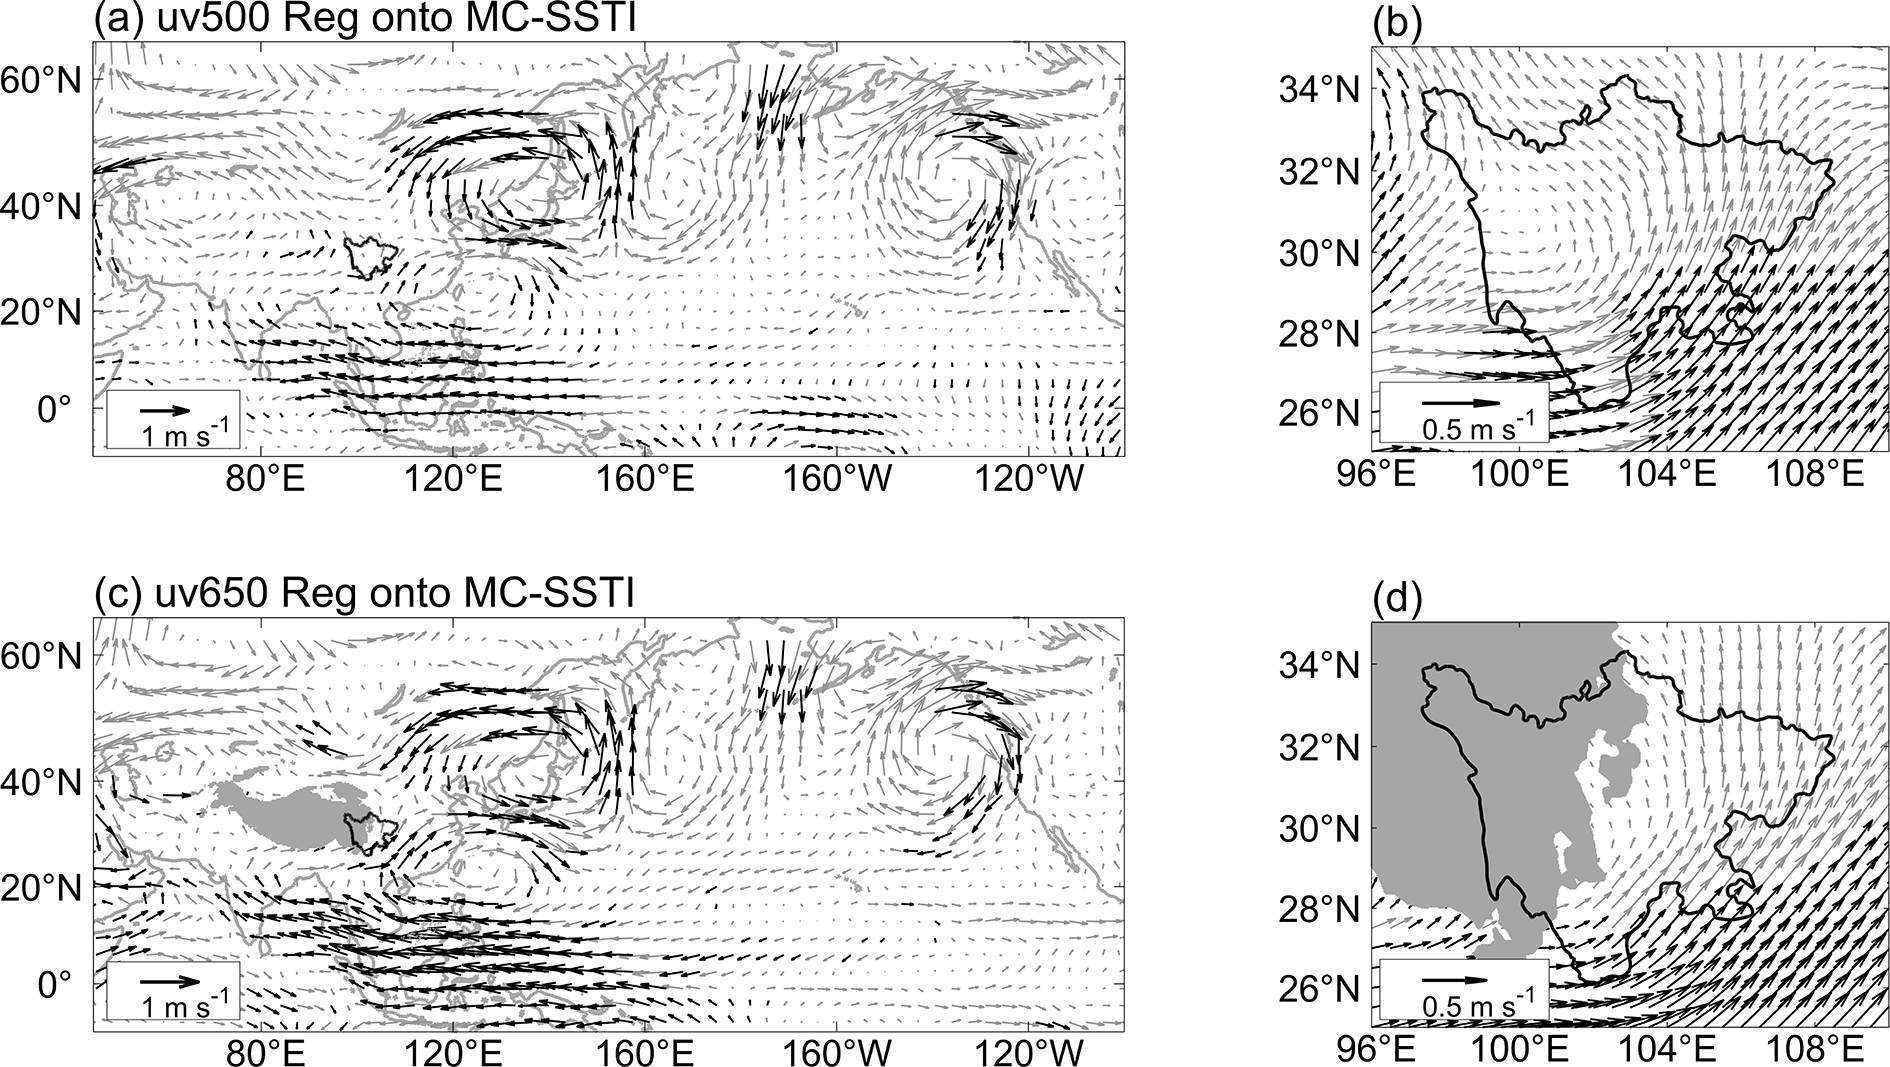
Figure 10 shows the wind anomalies at 500 and 650 hPa regressed onto the normalized MC-SSTI. Associated with the positive SST anomalies around the Maritime Continent, there is an anticyclonic anomaly over the tropical and subtropical WNP both at 500 and 650 hPa (Figs. 10a and 10c). The anticyclonic anomalies also appear at the lower pressure levels, such as 850 hPa (not shown). Associated with this anticyclonic anomaly, there are significant southwesterly anomalies over Southeast China. However, the wind anomalies are generally statistically insignificant over Sichuan, and tend to curve to the plateau, especially at 650 hPa (Figs. 10b and 10d). The curved anomalous flows and the westerly/southwesterly anomalies over the southern part of the plateau may favor the water vapor transport over the plateau and result in more extreme rainfall there.

Figure 10. As in Fig. 6, but for the wind anomalies regressed onto the normalized MC-SSTI.
There are some distinct differences over Sichuan between Fig. 10 and Fig. 6, which shows the wind anomalies associated with the WS extreme rainfall index, although this index is significantly correlated with MC-SSTI. First, the 500-hPa wind anomalies in Fig. 10b show a more curved feature. As mentioned in the preceding section, the WS extreme rainfall index is also strongly correlated with the AWJI, and the AWJI is associated with straight westerly anomalies over Sichuan (not shown). Therefore, it may be hypothesized that the wavy wind anomalies at 500 hPa over Sichuan in Fig. 6b are related to the MC-SSTI. Second, at 650 hPa the significant northeasterly anomalies over central and northern Sichuan shown in Fig. 6d disappear completely in Fig. 10d. It was mentioned in the preceding section that these northeasterly anomalies are related to the AWJI. Although both the MC-SSTI and AWJI are strongly correlated with the WS extreme rainfall index, the wind anomalies related to those two indices are different, which is consistent with the low correlation coefficient (0.10) between those two indices. Finally, the cyclonic anomaly in the mid latitudes tends to be concentrated over East Asia in Fig. 10 but extends into central Asia in Fig. 6.
The possible physical processes, through which the SST anomalies around the Maritime Continent induce the anticyclonic anomaly over the WNP, may be briefly postulated as follows. Warmer SSTs around the Maritime Continent may induce more rainfall over the Maritime Continent and the adjacent eastern Indian Ocean. More rainfall, as a heating anomaly, can result in a cyclonic anomaly over the northeast Indian Ocean and an anticyclonic anomaly over the WNP, as shown by the result of a linear baroclinic model (Jiang et al., 2016, their Fig. 10). The details of possible physical processes relate to the atmosphere-ocean interaction around the Maritime Continent and are beyond the scope of this study.
Figure 11 illustartes the wind anomalies at 850 and 900 hPa regressed onto the minus Niño-4 index. A negative Niño-4 index is associated with an anticyclonic anomaly over the WNP, and easterly anomalies over the tropical western and central Pacific. The easterly anomalies signify the enhancement of the Walker circulation. This correspondence between the large-scale circulation and SST anomalies has been well documented in previous studies (e.g., Lu and Lu, 2014; Tan et al., 2020), which indicated that cooler SSTs in the central and eastern equatorial Pacific enhance the Walker circulation, strengthen the precipitation in the tropical eastern Indian Ocean and Maritime Continent, and induce an anticyclonic anomaly over the WNP. The southwesterly anomalies over Southeast China are associated with the anticyclonic anomaly curve to northeasterly anomalies over the basin, possibly due to the hinderance effect of the mountains to the north of the basin, i.e., Ta-pa and Qinling mountains. These lower-tropospheric wind anomalies are similar to those shown in Fig. 7, suggesting that they are favorable for extreme rainfall in the basin. A negative Niño-4 index is also associated with an anticyclonic anomaly over East Europe, which is consistent with Sun et al. (2016), who indicated a decadal change in the relationship between ENSO and circulation, i.e., the relationship has strengthened and become significant since 1981 but was vague earlier. Note that the analysis period of the present study is from 1979, roughly coinciding with the period of strong relationship. In addition, the ACI is also associated with that over Eastern Europe (not shown), which may be related to the teleconnection pattern from Eastern Europe to East Asia as shown in Fig. 5b. Actually, the correlation coefficient between the ACI and Niño-4 index is –0.25, which is moderate but hints at a relationship between these factors affecting the ES extreme rainfall. The ACI is also associated with the curved wind anomalies or cyclonic anomaly over the basin both at 850 and 900 hPa (not shown). These similarities between the circulation anomalies associated with the Niño-4 index and ACI make distinguishing their roles in affecting extreme rainfall in the basin difficult, but it can be concluded that both the SST and upper-tropospheric wind anomalies are favorable for extreme rainfall in the basin.
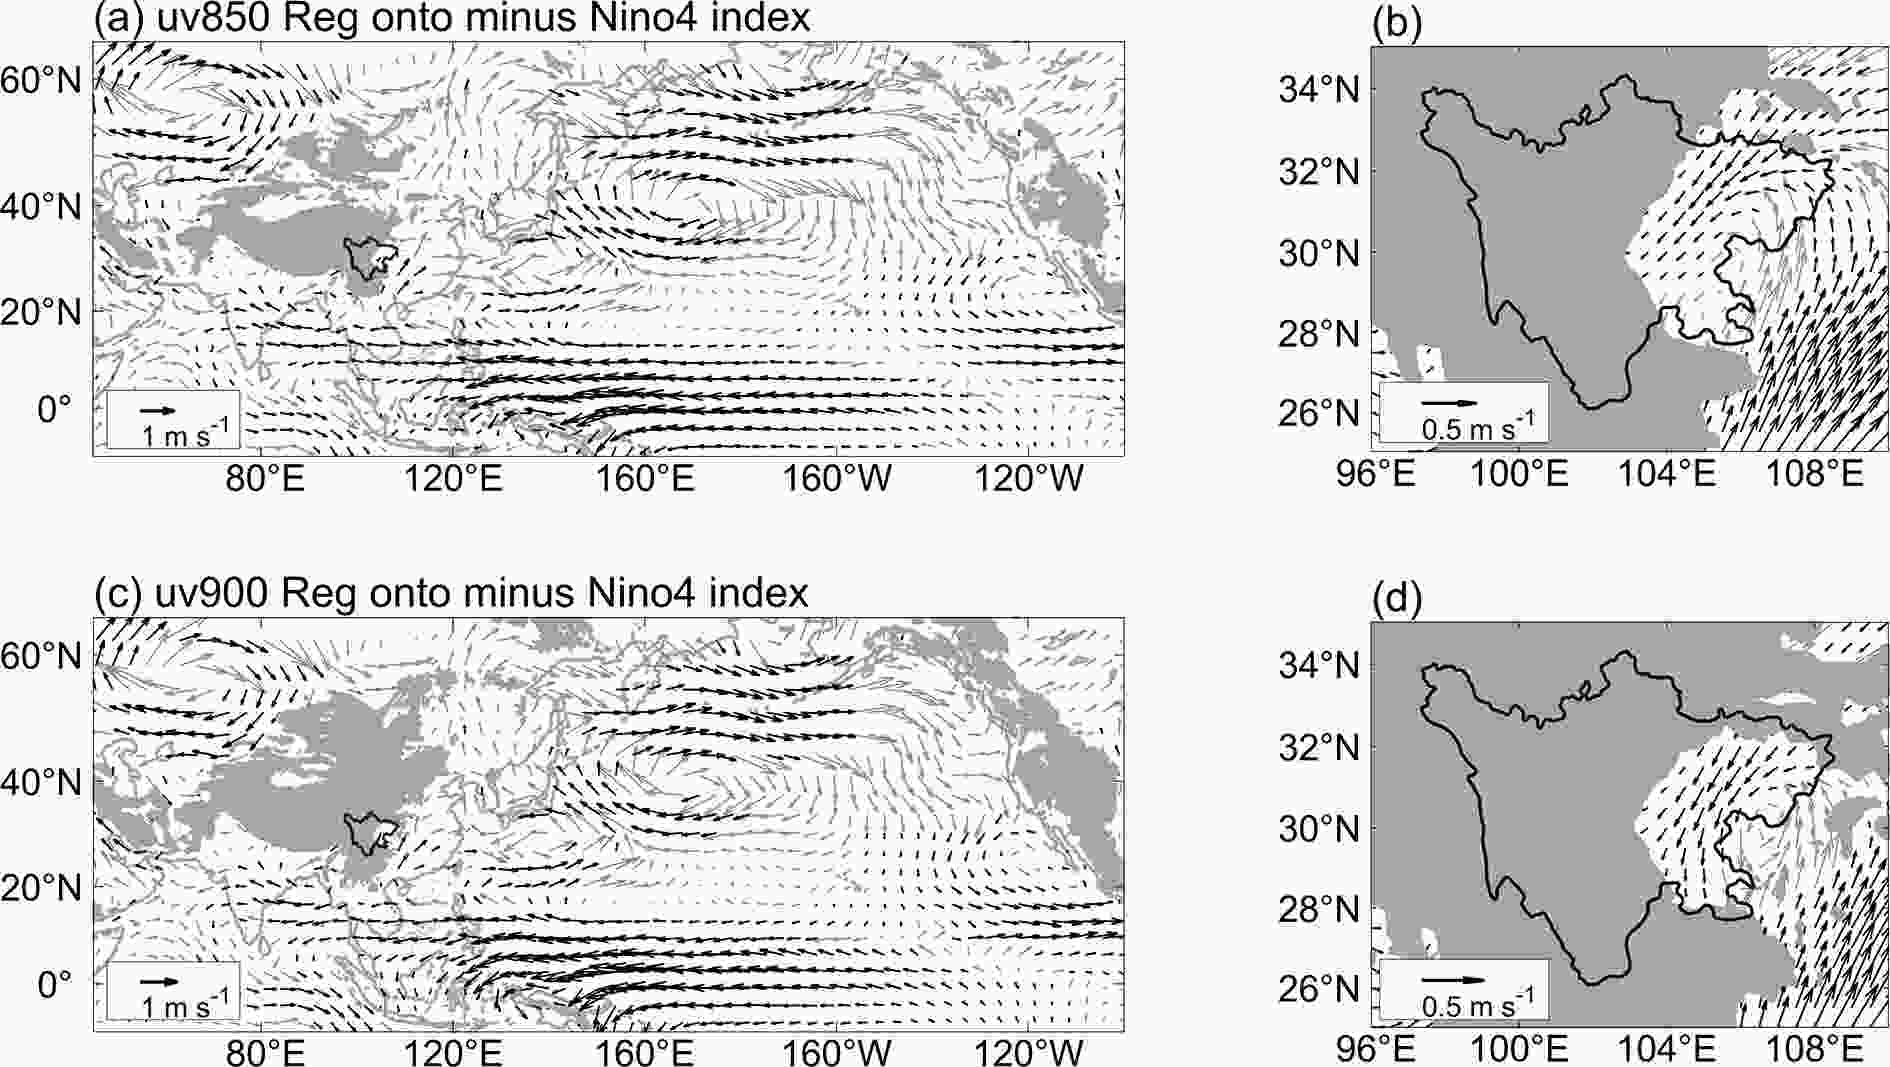
Figure 11. As in Fig. 6, but for the wind anomalies at 850 (upper panels) and 900 hPa (lower panels) regressed onto the minus normalized Niño-4 index. Grey areas indicate the surface pressure below 850 hPa in (a) and (b), and 900 hPa in (c) and (d).
Furthermore, the present results concerning lower-tropospheric circulation and SST anomalies are similar to those shown by Jiang et al. (2015). Jiang et al. (2015) analyzed the interannual variation of heavy rainfall events in July over the Sichuan basin during the period 1961–2013 and found that heavier rainfall is associated with the lower-tropospheric anticyclonic anomaly over Southeast China and the WNP. They also examined the SST anomalies, and suggested an asymmetric relationship, that is, warmer SSTs in the equatorial central and eastern Pacific are associated with less heavy rainfall in July, but cooler SSTs are not significantly associated with more heavy rainfall. We performed a composite analysis based on the more versus less extreme rainfall, similar to Jiang et al. (2015) but for July and August and found a symmetric relationship between the extreme rainfall in the basin and SSTs in the equatorial central and eastern Pacific, i.e., the increased (decreased) extreme rainfall is significantly related to the cooler (warmer) SSTs (not shown). This difference between the present study and Jiang et al. (2015) possibly resulted from the different analysis periods, that is, July and August in this study but July in Jiang et al. (2015). The longer period in this study might highlight the role of SSTs in affecting extreme rainfall in the basin.
-
In this study, we investigated the interannual variations of precipitation and extreme rainfall in July and August over Sichuan. Both precipitation and extreme rainfall show clear differences between the WS and ES, which are characterized by the plateau (altitude roughly higher than 1500 m) and basin, respectively. The extreme rainfall, which is represented by the 95th percentiles of daily precipitation, is much heavier in the ES than WS. In addition, the extreme rainfall can represent a large portion of interannual variability of precipitation both in the WS and ES. The ratios of explained variance by extreme rainfall exceed 20% at all the stations, with the maximum being 88.4%, and correlation coefficients between the precipitation and extreme rainfall indices are 0.82 and 0.88 for the WS and ES, respectively. Furthermore, the interannual variations of extreme rainfall are roughly independent between the WS and ES, as indicated by the weak correlation coefficient (0.14) between the indices.
The interannual variations of extreme rainfall in the WS and ES are associated with distinct large-scale circulation anomalies in the upper troposphere. The enhanced extreme rainfall in the WS is related to the southward shift of the AWJ, which is characterized by the easterly anomalies along 50°N and westerly anomalies along 35°N over 85°‒130°E. In contrast, the enhanced extreme rainfall in the ES corresponds to an anticyclonic anomaly over China, which constitutes a wave train together with an anomalous anticyclone over Eastern Europe and a cyclone over central Asia.
We also investigated the lower-level wind anomalies, which play an important role in transporting water vapor. Considering the topography, 500 and 650 hPa are used to show the circulation anomalies associated with the extreme rainfall over the WS, and 850 and 900 hPa for the ES. Corresponding to the enhanced extreme rainfall in the WS, there are westerly anomalies at 650 hPa over the southern slope of the Tibetan Plateau, which encounter the topography at the southwest of Sichuan, inducing anomalous upslope winds there. In addition, northeasterly anomalies appear over central and northern Sichuan, and encounter the eastern slope of the Tibetan Plateau, again implying anomalous upslope winds and a deepened trough over the WS. In the middle levels, the water vapor transport anomalies resemble the wind anomalies over the WS, suggesting that the wind anomalies favor the moisture convergence there. On the other hand, the enhanced extreme rainfall in the ES corresponds to the anomalous southerlies to the southeast of Sichuan. The southerly anomalies turn westward into the Sichuan basin when they encounter the Ta-pa and Qinling mountains to the north of the basin, and curve into northeasterly anomalies over the basin. Moreover, the related water vapor transport anomalies show a similar pattern. The present results regarding the lower-level circulation indicate that the topography in and around Sichuan plays a crucial role in inducing extreme rainfall.
The enhanced extreme rainfall over the WS and ES is significantly related to the SST anomalies in the Maritime Continent and equatorial central Pacific, respectively. Positive SST anomalies in the Maritime Continent correspond to an anticyclonic anomaly over the tropical and subtropical WNP both at 500 and 650 hPa, and the southerly anomalies associated with the anticyclonic anomaly tend to curve to the WS, favoring more extreme rainfall. On the other hand, the negative SST anomalies in the equatorial central Pacific strengthen the Walker circulation, and an anticyclonic anomaly appears in the lower troposphere over the WNP. The southerly anomalies associated with this anticyclonic anomaly turn westward into the basin under the effect of mountains in the northern ES.
We also repeated the analysis by using the precipitation anomalies averaged over the WS and ES, and the results (not shown) are similar to those shown in this paper, confirming the crucial contribution of extreme rainfall in summer rainfall in Sichuan on the interannual timescale. For instance, the correlation coefficient between the precipitation anomalies averaged over the WS and MC-SSTI is 0.33, and that between precipitation anomalies averaged over the ES and Niño-4 index is –0.65, both of them being similar to the correlation coefficients using extreme rainfall indices (0.50 and –0.57).
Acknowledgements. This work was supported by the Strategic Priority Research Program of Chinese Academy of Sciences (Grant No. XDA23090102) and the Second Tibetan Plateau Scientific Expedition and Research (STEP) program (Grant No. 2019QZKK0102).
Contrasts between the Interannual Variations of Extreme Rainfall over Western and Eastern Sichuan in Mid-summer
- Manuscript received: 2021-06-07
- Manuscript revised: 2021-09-20
- Manuscript accepted: 2021-10-20
Abstract: Rainfall amount in mid-summer (July and August) is much greater over eastern than western Sichuan, which are characterized by basin and plateau, respectively. It is shown that the interannual variations of extreme rainfall over these two regions are roughly independent, and they correspond to distinct anomalies of both large-scale circulation and sea surface temperature (SST). The enhanced extreme rainfall over western Sichuan is associated with a southward shift of the Asian westerly jet, while the enhanced extreme rainfall over eastern Sichuan is associated with an anticyclonic anomaly in the upper troposphere over China. At low levels, on the other hand, the enhanced extreme rainfall over western Sichuan is related to two components of wind anomalies, namely southwesterly over southwestern Sichuan and northeasterly over northeastern Sichuan, which favor more rainfall under the effects of the topography. Relatively speaking, the enhanced extreme rainfall over eastern Sichuan corresponds to the low-level southerly anomalies to the east of Sichuan, which curve into northeasterly anomalies over the basin when they encounter the mountains to the north of the basin. Therefore, it can be concluded that the topography in and around Sichuan plays a crucial role in inducing extreme rainfall both over western and eastern Sichuan. Finally, the enhanced extreme rainfall in western and eastern Sichuan is related to warmer SSTs in the Maritime Continent and cooler SSTs in the equatorial central Pacific, respectively.
摘要: 四川东部盆地盛夏(7、8月)的降水量显著大于四川西部的高原地区。本研究发现,四川东西部极端降水的年际变化基本是相互独立的,分别对应不同的大尺度环流和海温异常。在对流层高层,川西地区极端降水的偏多与亚洲西风急流位置偏南有关,而川东地区极端降水的偏多则与中国上空的反气旋异常环流相联系。在对流层低层,川西地区极端降水的偏多对应四川西南上空的西南风异常和四川东北上空的东北风异常。在地形作用的影响下,这两支风场异常都有利于川西地区降水增加。相对而言,川东地区极端降水的偏多对应四川以东的低层南风异常。该南风异常受盆地北部的山脉阻挡,在盆地上空转为东北风异常,有利于川东地区的降水。因此,四川及其周边地区的地形是川西和川东极端降水异常的重要因素。此外,川西地区极端降水的偏多对应海洋性大陆周边的暖海温异常,而川东地区极端降水的偏多则对应赤道中太平洋的冷海温异常。
 AAS Website
 AAS WeChat