


 DownLoad:


HTML
-
The Northwest Pacific Ocean is an area of frequent tropical cyclones (TCs), accounting for more than 36% of TCs that occur in the global ocean (Zhu et al., 2007). Studies of cloud parameters and precipitation in this area help to improve our understanding of typhoon generation, evolution, and dissipation characteristics, as well as climate feedback effects. Furthermore, these studies provide an observational foundation for the simulation of cloud-to-rain transitions in models, thereby improving the capability to predict the track and intensity of TCs (Zhao et al., 2012). Many studies have focused on the structure and precipitation that is associated with TCs. Ren et al. (2007) estimated TC precipitation from station observations by an objective technique. Hence and Houze (2012) determined the typical vertical structure of the concentric eyewalls of TCs undergoing eyewall replacement by analysis of the Tropical Rainfall Measurement Mission (TRMM) satellite’s Precipitation Radar (PR). Jiang and Zipser (2010) used TRMM’s precipitation feature database to assess the impact of TC rainfall in altering the regional, seasonal, and interannual distribution of global total rainfall during the TC season. In addition, the Hurricane Rainband and Intensity Change Experiment (or RAINEX) was conceived to address the hurricane internal dynamics via intensive aircraft observations and high-resolution numerical modeling, obtaining eyewall and rainband structures and behaviors of hurricanes (Houze et al., 2006; Hence and Houze, 2008).
It is known that clouds play a significant role in the climate system due to their modification effects on the global radiation balance and atmospheric water cycle (Wu et al., 2007; Zhao et al., 2014). They influence Earth’s energy budget by affecting a large part of the incoming solar radiation and longwave radiation (also known as infrared or thermal radiation) through processes of reflection, absorption, and emission (Ramanathan, 1987; Ramanathan et al., 1989). Understanding the evolution of cloud parameters can help with monitoring and identifying the conditions and seedable areas for large-scale weather modification operations. Furthermore, cloud development, to a certain extent, will produce precipitation, which is closely related to human life. The cloud microphysical processes that affect precipitation are complex, and whether cloud parameters can be used as indicators for precipitation or vice versa requires further study.
In the process from formation of clouds to occurrence of precipitation, knowledge on the actual linkage between precipitation and cloud parameters is limited because of the complicated microphysics inside the cloud. Most previous studies on the relationship between cloud parameters and precipitation have compared precipitation data from ground-based observations with cloud parameter information from satellite inversions. Letu et al. (2019) investigated the relationship between ice cloud microphysical parameters from Himawari-8 satellite measurements and precipitation data from ground-based Doppler weather radar. This applied study indicates that the microphysical properties of ice cloud have the potential to allow the estimation of precipitation information, such as intensity and height. Zhou et al. (2011) investigated the relationship between cloud parameters and precipitation using the cloud structural characteristic parameters retrieved by the FY-2C satellite and radiosounding data, combined with ground-based precipitation observations. Sheng et al. (2010) analyzed the correlation between satellite-retrieved cloud parameters and surface precipitation from ground automatic station observations, and concluded that the cloud liquid water path was highly indicative of precipitation. Nauss and Kokhanovsky (2006) proposed a new method for the delineation of precipitation using cloud properties derived from optical satellite data. They analyzed Moderate Resolution Imaging Spectroradiometer (MODIS) scenes and retrieved functions for the computation of an auto-adaptive threshold value of the effective cloud droplet radius with respect to the corresponding optical thickness, which links these cloud properties with rainfall areas detected by ground-based radar on a pixel basis. However, these kinds of satellite data and ground-based observations are not synchronized in time and space, which causes errors in the results.
Chen et al. (2011) and Suzuki et al. (2011) used CloudSat and MODIS satellite observations to investigate cloud-to-rain processes and compared modeling results with the corresponding statistics from the observations. Under the ideal hypothesis of cloud physics, Rosenfeld et al. (1998, 2014), Lensky and Rosenfeld (1997), and Woodley et al. (2000) suggested that the features of cumulus cloud and the formation of precipitation can be identified by the relationship between the effective radius of particles and cloud-top height or temperature. However, this hypothesis needs to be further tested using more experiments with observations. Nowadays, information on cloud parameters can be obtained only by finite flight observations (Woodley et al., 2003). Lin and Rossow (1997) estimated the cloud water content and rainfall rate of precipitation systems over oceans using a combination of data from the Special Sensor Microwave/Imager (SSM/I) and the International Satellite Cloud Climatology Project (ISCCP). Owing to the poor sampling diurnal variations of the SSM/I, the estimates only represented the average of early morning and late afternoon observations and they suggested that TRMM could provide a better understanding of this sampling problem. Moreover, Fu (2014) revealed that cloud optical thickness (COT), cloud effective radius (CER), and cloud water path (CWP) near cloud tops retrieved by the Visible and Infrared Scanner (VIRS) onboard the TRMM satellite were effective for identifying the thickness and intensity of convective precipitating clouds.
Satellite-based cloud remote sensing has been an active research field for several decades. With the progress in instruments, the technology for retrieval of cloud parameters has been improved, which provides a new opportunity to understand the properties of cloud. In particular, observations from the 36 channels of MODIS on Aqua and Terra, 16 channels of the Advanced Himawari Imager (AHI) on Himawari-8, and 14 channels of the Advanced Geostationary Radiation Imager (AGRI) on the Fengyun-4 series of satellites have promoted studies on cloud parameters (Platnick et al., 2003, 2017; Baum and Platnick, 2006; Min et al., 2017; Shang et al., 2017; Letu et al., 2020). Large quantities of valuable data gathered by the TRMM satellite have been archived. Even though the Visible and Infrared (VIR) instrument onboard the TRMM satellite does not have as many channels as MODIS, AHI or AGRI, the radiometer also meets the requirements of cloud properties inversion.
However, the observations of VIR channels are incapable for precipitation. In the visible and infrared spectrum, the radiation is highly attenuated by cloud droplets through both scattering and absorption processes, resulting in little information about precipitation in the satellite-derived signals (Olson et al., 1996). Fortunately, TRMM carries the first space-borne active microwave instrument, which can obtain the three-dimensional structures of precipitation (Simpson et al., 1996). The many merged datasets of TRMM PR and VIRS make it possible to investigate the relationship between tropical clouds and precipitation by satellite synthetic data, which could overcome the bad spatiotemporal consistency between spaceborne VIR measurements and precipitation inferred from ground-based rain gauges or radars. Therefore, TRMM has its unique advantages for precipitation measurements, aside from its ability to retrieve cloud parameters like other geostationary and polar-orbiting satellites. CWP is one of the key parameters for determining the onset and growth rate of precipitation (Li et al., 2015). It reflects cloud column information and has a physical correlation with precipitation intensity. To better understand the specific relationship between large-scale CWP and precipitation intensity, it is necessary to obtain both cloud parameters and precipitation information at the same time. On this basis, we combined the time- and space-synchronized precipitation and spectral data obtained by the PR and VIRS onboard the TRMM satellite to establish a merged dataset of near-surface rain rate (RR) and corresponding CWP. Then, we used this dataset to analyze the correlation between cloud microphysical properties and precipitation, to deepen our understanding of the evolution of cloud to rain.
The organization of this paper is as follows: Section 2 presents information on the TRMM datasets and cloud microphysical property retrievals used in this study, as well as the collocated typhoon cases. Section 3 provides the spectral features and precipitation distributions of Typhoon Sudal. Section 4 describes the relationships between the CWP and RR of mature TCs with different precipitation types, precipitation cloud phases, and vertical depths of precipitation. Section 5 summarizes the salient findings of this study.
-
Jointly conducted by NASA and the Japan Aerospace Exploration Agency (JAXA), the TRMM satellite was launched in November 1997 and stopped collecting data in April 2015. TRMM operated at an altitude of 403 km (370 km before a boost in August 2001) with an orbital inclination of 35°, and its sun-asynchronous orbit took 92.5 min to round the Earth, accomplishing nearly 16 orbits between 38°S and 38°N per day, which allowed sampling of the diurnal cycle over this entire region using a variety of instruments (Mao and Wu, 2012). Furthermore, the TRMM satellite measured collocated visible and infrared radiances from VIRS, microwave radiance from the TRMM Microwave Imager, radar reflectivity from the PR, flashes from the Lightning Imager Sensor, and radiance intensity from the Clouds and the Earth’s Radiant Energy System. The PR was the first spaceborne meteorological radar working in the Ku-band (13.8 GHz). It had a swath of 247 km, with a horizontal resolution of 5 km for 49 positions and a vertical resolution of 250 m at nadir ranging from the surface to 20 km. VIRS received upward radiances at five wavelengths ranging from the visible to thermal infrared bands, i.e., 0.63, 1.6, 3.7, 10.8, and 12.0 μm. The cross-track scanning of VIRS resulted in an 833 km swath on the Earth’s surface with a horizontal resolution of about 2.4 km for 261 positions at nadir (more information at
https://trmm.gsfc.nasa.gov/ ). The TRMM satellite provided accurate synchronous measurements of the vertical structure of precipitation (from PR) and multichannel cloud-top upwelling radiances (from VIRS), offering the unique opportunity to integrate cloud and precipitation measurements.The TRMM dataset became the space standard for measuring precipitation, and improved our understanding of TC structure and evolution. The TRMM standard products of PR 2A25 and VIRS 1B01, version 7, from 1998 to 2012, provided by GSFC/NASA, were both used in this study. Precipitation information, including the location in longitude and latitude, RR near the surface, and three-dimensional radar reflectivity, were given in each PR profile (Steiner et al., 1995). In addition, a key component of the TRMM project was the Ground Validation (GV) effort, which consisted of collecting data from ground-based radar, rain gauges and disdrometers. The validation products were produced for comparison with TRMM satellite products after quality control. Comparison of GV rain intensities to satellite retrievals from TRMM PR showed that the GV and satellite estimates agreed quite well over the open ocean (Wolff et al., 2005). Besides, ground validation sites were established to provide products that included one for convective stratiform classification (see
http://trmm-fc.gsfc.nasa.gov/trmm_gv ). The validation results indicated that the TRMM PR system precipitation characteristics were sufficiently stable and accurate to ensure reliable rainfall measurements.The similar cross-track scanning mode of VIRS and PR resulted in little lag in observing the same target, which made merging 1B01 with 2A25 feasible, using the resolution of the latter. Hence, Fu et al. (2011) generated a spatially and temporally collocated 2A25 and 1B01 dataset with a PR-swath resolution using a weight-averaged method, which picked the mean value of VIRS at PR pixels. Here, we disregarded the observation time difference of both sensors focusing on the same target, even though they were nearly 1 min out of synchronization. The radiance from the five VIRS channels at each uniform horizontal resolution was obtained by weighting the average radiance of VIRS pixels located within the PR pixel resolution. Consequently, a merged dataset containing precipitation information from the PR and radiances from VIRS was obtained. Previous studies have illustrated that signals at channel 10.8 μm change little as a result of the data-merging process. Statistics indicate that the mean value and root-mean-square error vary less than 0.7% and 2.5%, respectively, for a swath. Therefore, it has been concluded that the merging process does not distort the VIRS observations (Fu et al., 2011).
-
The bispectral reflectance (BSR) algorithm is the most representative method for the retrieval of cloud microphysical properties among numerous methods. It was first proposed by Twomey and Seton (1980) to evaluate COT and CER. Nakajima and King (1990) improved the method to retrieve cloud-top parameters from MODIS observations, which are within an acceptable level of accuracy. In general, the BSR algorithm takes advantage of the characteristics of the negligible absorbing effect in visible bands and distinct absorbing effect in near-infrared bands to synchronously retrieve COT (dimensionless) and CER (units: μm). Fu (2014) presented a retrieval scheme of cloud microphysical properties using TRMM VIRS data. In this scheme, the visible and near-infrared radiative lookup table for COT and CER of water cloud and ice cloud are established with the Santa Barbara DISORT Atmospheric Radiative Transfer Model (SBDART), considering various geometrical conditions, surface types, and atmospheric states. Then, the true COT and CER values are interpolated using the bivariate method by comparing the observed reflectance with the simulated one. After COT and CER are obtained from the reflectance at 0.63 μm and 1.6 μm in VIRS by the use of the BSR method, the value of CWP (in g m−2 or kg m−2) is calculated using the following function (Han et al., 1994; King et al., 2003, 2006):
where ρ is the density of ice and water hydrometeors, using a water density of 1.0 g cm−3 and ice density of 0.93 g cm−3, τc is the COT, and Re is the CER. It is worth noting that the capability of solar radiation in the visible and near-infrared bands to penetrate through the cloud layers is so poor that the retrieved information only represents the cloud microphysical properties near the cloud tops. As a combined variable of COT and CER, CWP has the best association with precipitation and denotes the total amount of water that a cloud can precipitate as rain.
-
To systematically study the relationship between cloud microphysical parameters and precipitation intensity, and make the conclusion convincing, we collected 25 typical mature TCs from the TRMM Tropical Cyclones Database, produced by the Earth Observation Research and Application Center of JAXA, for the period January 1998 to December 2012. In addition, considering the accuracy of the inversion for the cloud microphysical properties, only the day-time satellite observations have been used in this study. Table 1 lists the 25 typical mature TCs observed by TRMM, including the name and granule of the TCs, as well as the development stage at the time of TRMM observation. The best-track data from the China Meteorological Administration (CMA) dataset were also used (Ying et al., 2014) (see Fig. 1), along with its 2-min maximum sustained wind (MSW), classification of TC intensity per 6 h, and so on. According to the CMA dataset, TCs were classified into six categories based on their MSW: tropical depression (10.8 m s−1 ≤ MSW ≤ 17.1 m s−1); tropical storm (17.2 m s−1 ≤ MSW ≤ 24.4 m s−1); super tropical storm (24.5 m s−1 ≤ MSW ≤ 32.6 m s−1); typhoon (32.7 m s−1 ≤ MSW ≤ 41.4 m s−1); strong typhoon (41.5 m s−1 ≤ MSW ≤ 50.9 m s−1); and super typhoon (MSW ≥ 51.0 m s−1). In Fig. 1, different colors are used to distinguish the intensity changes during typhoon development, and black dots indicate the location of each typhoon at the time of TRMM observation. The 25 collocated TRMM overpasses of typhoons in this study are all at the mature stage, with MSW ≥ 33 m s−1. There are 8 cases in the typhoon stage, 7 cases in the strong typhoon stage, and 10 cases in the super typhoon stage, all distributed in the region of the Northwest Pacific Ocean. In addition, we tested more mature TC cases and the conclusions of the paper were similar.
No. Name Granule Intensity 1 DAN 10710 TY 2 KIROGI 14985 STY 3 PRAPIROON 15869 TY 4 NARI 21868 TY 5 ECOT 32625 TY 6 LUPIT 34385 SuperTY 7 SUDAL 36522 STY 8 SUDAL 36537 STY 9 SUDAL 36552 STY 10 MINDULLE 37723 STY 11 CHABA 38639 SuperTY 12 CHABA 38670 STY 13 HAITANG 43707 SuperTY 14 MATSA 43986 TY 15 NABI 44439 SuperTY 16 SHANSHAN 50316 TY 17 SHANSHAN 50347 SuperTY 18 CIMARON 51018 SuperTY 19 MAN-YI 55036 TY 20 SEPAT 55567 SuperTY 21 KROSA 56330 SuperTY 22 SINLAKU 61692 STY 23 DAMREY 83808 TY 24 SANBA 84481 SuperTY 25 SANBA 84496 SuperTY Table 1. List of 25 mature typhoon cases over the Northwest Pacific Ocean captured by TRMM (TY, typhoon; STY, strong typhoon; SuperTY, super typhoon)

Figure 1. Best tracks of typhoon cases discussed in this paper covered by the CMA dataset. Different colored lines represent the wind speed categories, and black dots indicate the location of each typhoon at the time of TRMM observation
2.1. Instruments and datasets
2.2. Bispectral reflectance algorithm
2.3. Typhoon lists
-
Before studying the relationship between cloud microphysical properties and precipitation intensity statistically, we focused on one example of a mature typhoon system in the Northwest Pacific Ocean. This case study provides detailed insights into the characteristics of the distribution of radiance and retrieved CWP, as well as the precipitation features in mature typhoon systems, which lays a good foundation for the statistical study.
Sudal was the first typhoon in 2004. It formed in the Northwest Pacific Ocean on 2 April and developed to typhoon level on 5 April. The intensity of Sudal continued to increase from 7 April and remained until 15 April. Due to the severe damage it caused, the name of “Sudal” has been delisted. Typhoon Sudal reached its mature phase on 13 April 2004 and was perfectly captured by the TRMM satellite, when the center wind speed was 45 m s−1 and the pressure was about 950 hPa (see more at
https://typhoon.weather.com.cn/ ). -
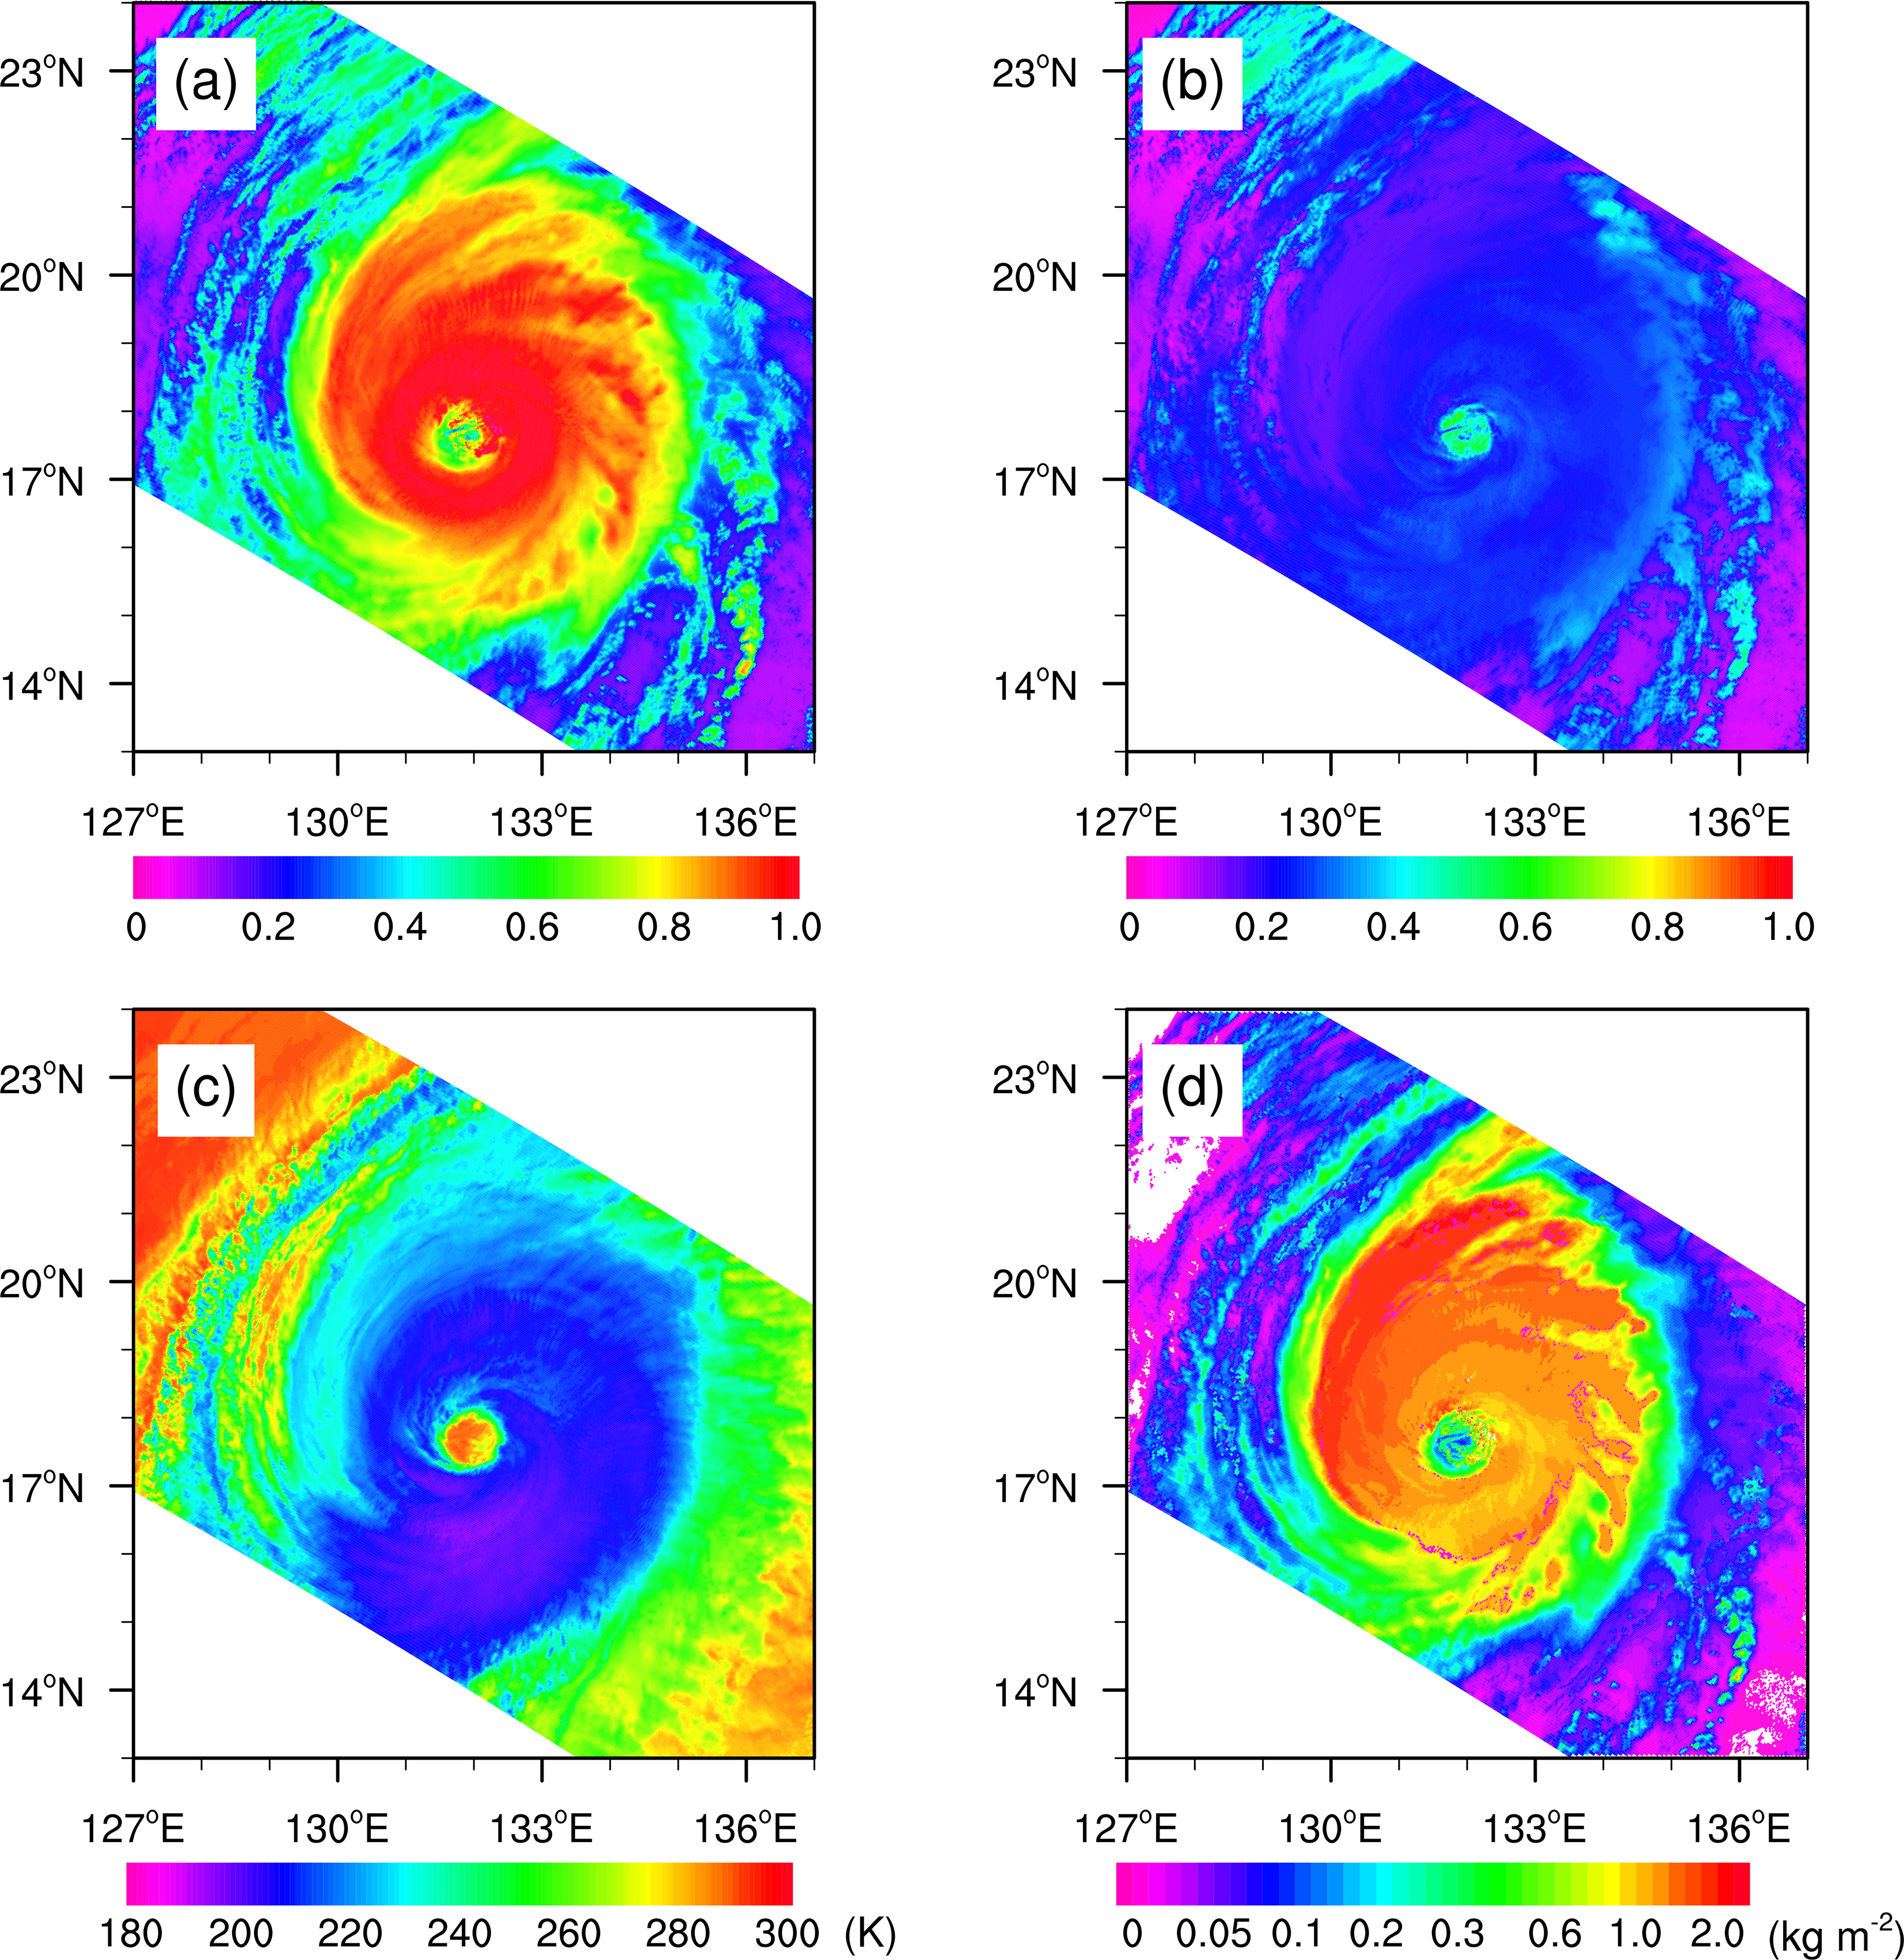
Figure 2 shows the signals detected by the visible, near-infrared, and thermal infrared channels of VIRS onboard TRMM, as well as the retrieved CWP of Sudal at 0415 UTC. At this time, the typhoon central eye was located near (18°N, 132°E). The typhoon spiral cloud system and the eyewall area are clearly visible; plus, the typhoon structure was complete, and the typhoon was developing vigorously. Reflected visible signals at window-wavelength are also commonly used as an ancillary index for detecting clouds, especially during the day.

Figure 2. Signals detected by the (a) visible, (b) near-infrared, and (c) thermal infrared channels of VIRS onboard TRMM, and (d) the retrieved CWP of Typhoon Sudal at 0415 UTC 13 April 2004
The reflectivity at 0.63 μm is mostly related to COT, and the higher the COT value, the greater the reflectivity; whereas, 1.6 μm is an important water absorptive band, especially for ice cloud, and is therefore associated with CER. The equivalent brightness temperature of a blackbody at 10.8 μm indicates the cloud-top height, and the higher the cloud top, the lower the brightness temperature at 10.8 μm.
In Fig. 2, the reflectance of the visible channel is more than 0.8, and the near-infrared channel is below 0.3 over the main typhoon region, indicating that many large-size and deep-seated ice cloud droplets were dominant. In addition, the brightness temperature of the thermal infrared channel is less than 220 K, with high cloud development. In contrast, the radiation in the typhoon central eye is characterized by low visible reflectance and high near-infrared reflectance and thermal infrared temperature, reflecting a typhoon warm core dominated by water cloud. This indicates that the signals obtained by TRMM/VIRS had a strong detection capability for cloud-top structure, and could be used to understand the appearance of typhoons, as well as monitor and provide alerts for typhoon activity (Fu et al., 2007).
Figure 2d shows the distribution of CWP retrieved by the BSR method from the visible and near-infrared channels of TRMM/VIRS. MODIS operational cloud products (MYD06_L2) were used to validate the performance of TRMM VIRS−retrieved CWPs based on time proximity and spatial consistency. The results showed that these two products are well matched, with the correlation coefficients significant at the 99% confidence level. Therefore, the retrieved CWPs of TRMM VIRS provided fairly accurate results. Figure 2d shows the spiral structure of the typhoon system and that the CWP within about 200 km from the typhoon center was more than 1.0 kg m−2, which was higher than that of the surrounding cloud.
-
The PR 2A25 dataset was used to reveal the precipitation features of Typhoon Sudal. Figure 3a shows the distribution of precipitation intensity near the surface, also called RR. The typhoon central eye, the strong-rain area near the eyewall (RR nearly 100 mm h−1), the inner spiral rainbelt (RR more than 10 mm h−1), the outer spiral rainbelt (RR less than 10 mm h−1), and some sporadic precipitation zones, can be clearly seen. By comparing Figs. 2 and 3a, it is apparent that only part of the typhoon cloud produced precipitation, and there was no rain in the typhoon central eye and the peripheral part of the surrounding cirrus cloud. In other words, the spatial distribution of precipitation in Sudal was characterized by a multi-helical rainbelt, and only near the typhoon cloud wall and the inner and outer spiral rainbelts had a high RR exceeding 20 mm h−1.
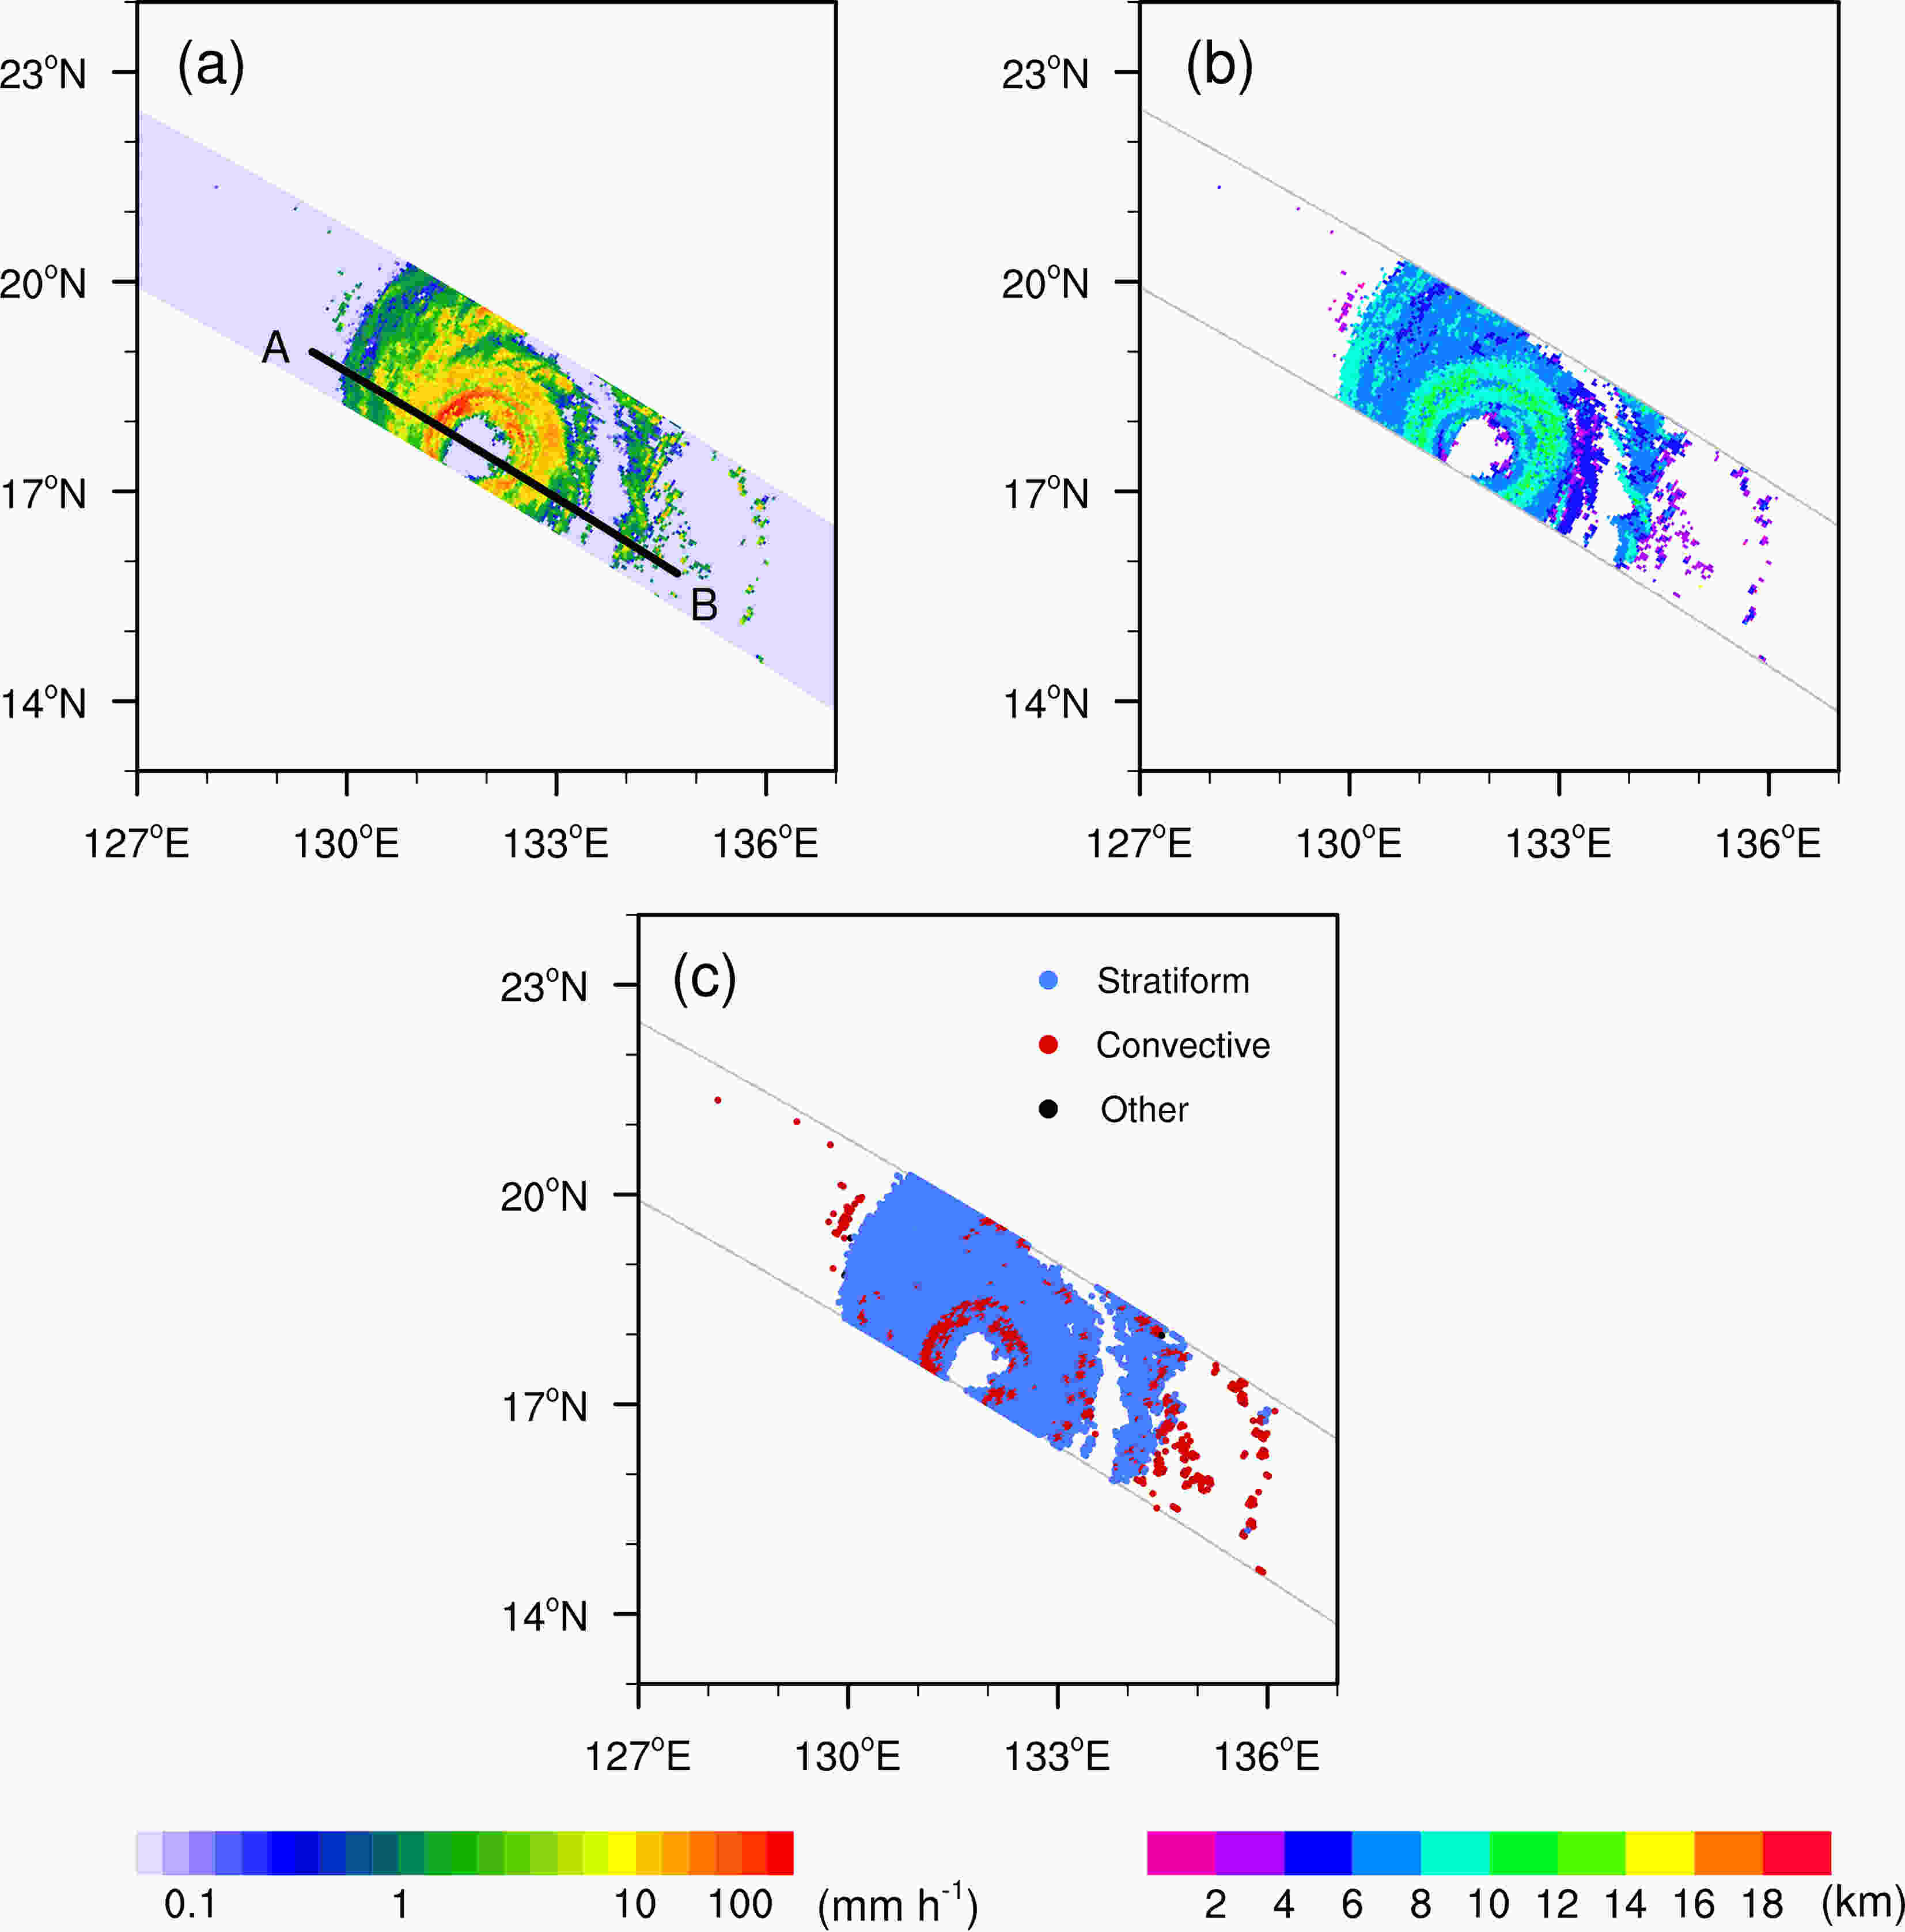
Figure 3. The precipitation of Typhoon Sudal derived from TRMM PR at 0415 UTC 13 April 2004: (a) RR, overlaid with the “A−B” section passing through the typhoon center for subsequent analysis; (b) STH; and (c) distribution of precipitation types with red (blue) dots denoting the convective (stratiform) precipitation pixels and black dots denoting other types of precipitation
Figure 3b shows the distribution of the storm-top height (STH) of precipitation in Typhoon Sudal. The STH is the maximum height of particles at the top of precipitating clouds detected by the PR, which is related to updraft strength and the atmospheric stability. Higher STH altitudes, which always correspond to stronger updrafts inside thicker clouds with larger particles at the top of clouds, often generate heavier precipitation. Different methods have been used to define the STH observed by the PR in previous studies. Alcala and Dessler (2002) required the profile to contain a top layer with a thickness of at least six range gates (~1.5 km) where all the reflectivity exceeded a minimum threshold of 12 dBZ. Liu et al. (2007a) used the first layer from the top to the ground with a minimum radar echo exceeding 20 dBZ as the STH. Sensitivity tests have shown that there is no substantial difference in the seasonal STH obtained from these two methods (Chen et al., 2016). Taking sensitivity of the PR into consideration, we defined the STH as the highest altitude with at least three continuous radar bins greater than 17 dBZ (Pan and Fu, 2015).
It can be seen from Fig. 3b that the STH in the typhoon eyewall is the largest, reaching more than 10 km. The STH then gradually decreases and then increases outward from the eyewall. The STH between the inner and outer spirals is less than 8 km, while the outer spiral and outward is larger. This distribution is in agreement with the internal thermodynamic structure of the typhoon cloud system. The convection is strongest at the position of the eyewall in the typhoon system, resulting in the highest STH. The inner spiral rainbelt and outward is a transition area of convective to stratiform precipitation, so the STH decreases from the inside outward. The spiral rainbelt outside the typhoon is mostly the intersection of the typhoon and local-environment air masses, where the gradients of temperature and humidity are large, resulting in active convection and a large STH.
The PR 2A25 algorithm classifies precipitation into three categories—stratiform, convective, and “other”—according to the vertical pattern of the profile and the horizontal variability of the radar echo. In simple terms, a precipitation profile is classified as stratiform when the PR detects a bright band near the freezing level (Awaka et al., 1997), which includes eight categories in the 2A25 dataset and is defined as integers from 100 to 170. If no bright band exists and any value of radar reflectivity in the beam exceeds a predetermined value of about 39 dBZ, the profile is classified as convective, which includes 14 categories and is signified by integers from 200 to 291 in the 2A25 dataset. If the profile is not stratiform or convective, it is labeled “other”. Convective precipitation regions are generally associated with intermittently strong vertical velocities, high RRs, and small, intense, horizontally inhomogeneous radar echo. Stratiform precipitation areas are characterized by statistically small vertical velocities, low RRs, and widespread, horizontally homogeneous radar echo.
Stratiform and convective precipitation are the focus of this study. When total precipitation is referred to, this includes all three kinds of precipitation: stratiform, convective, and “other”. The PR 2A25 dataset is widely used in determining the distribution of tropical and subtropical precipitation. Fu et al. (2008, 2012) investigated the frequency, intensity, and vertical structure of convective and stratiform precipitation at the seasonal scale in Asia on the basis of TRMM PR measurements over 10 years and revealed characteristics of the STH, including its diurnal variations during convective and stratiform precipitation and its relationship with surface RR.
Figure 3c shows the distribution of different types of precipitation, with red (green) dots denoting the convective (stratiform) precipitation pixels and black dots denoting other types of precipitation. It is clear that stratiform precipitation is dominant, accounting for more than 85% of the total precipitation. Yokoyama and Takayabu (2008) also concluded that the stratiform precipitation rain ratio is larger in typhoon systems using TRMM data. Furthermore, convective precipitation pixels are mainly distributed inside the typhoon eyewall with a ring structure, followed by the outer region of the spiral rainbelt, where the convective activity is vigorous.
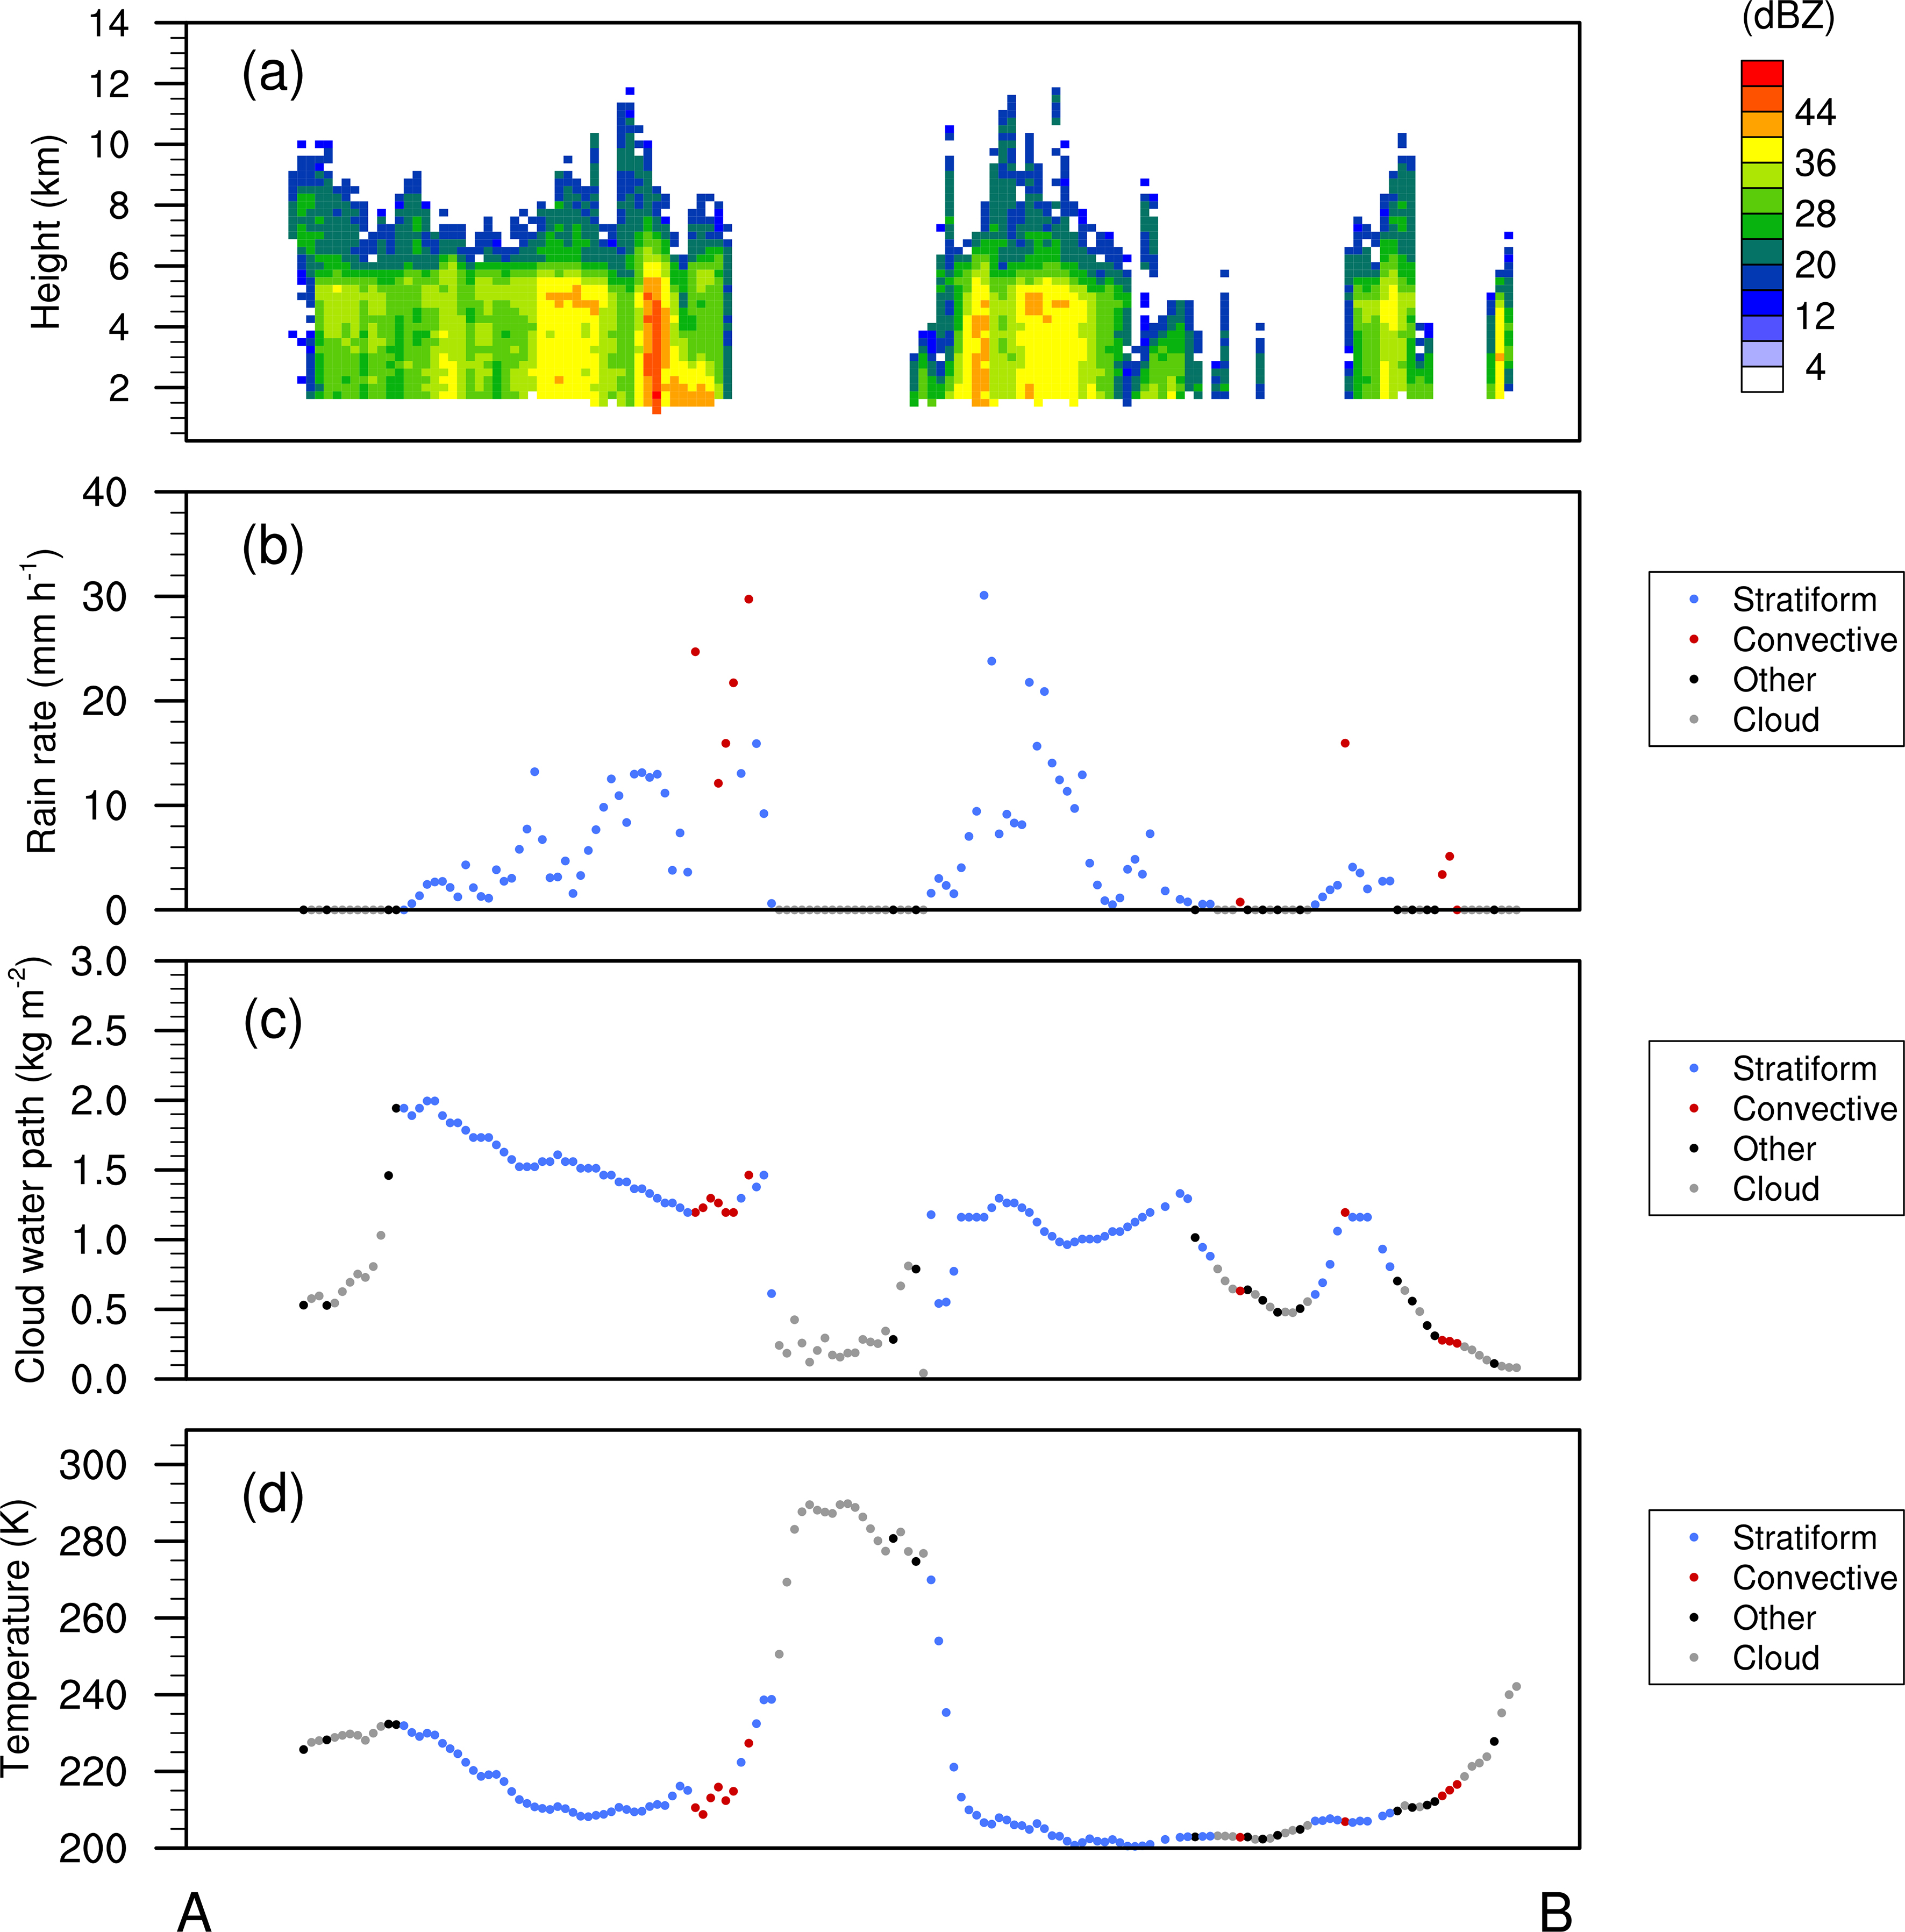
To analyze the distribution characteristics of the typhoon system in more detail, and to better reveal the corresponding relationship between precipitation and cloud microphysical properties, Fig. 4 shows the along-line distribution of the height−distance cross section of radar reflectivity and RR derived from the PR, CWP retrieved from VIRS, and infrared brightness temperature at 10.8 μm, passing through the typhoon center as the “A−B” section plotted in Fig. 3a. Note that the “A−B” section is parallel to the track of TRMM, for the purpose of obtaining more typhoon pixels captured by the satellite.
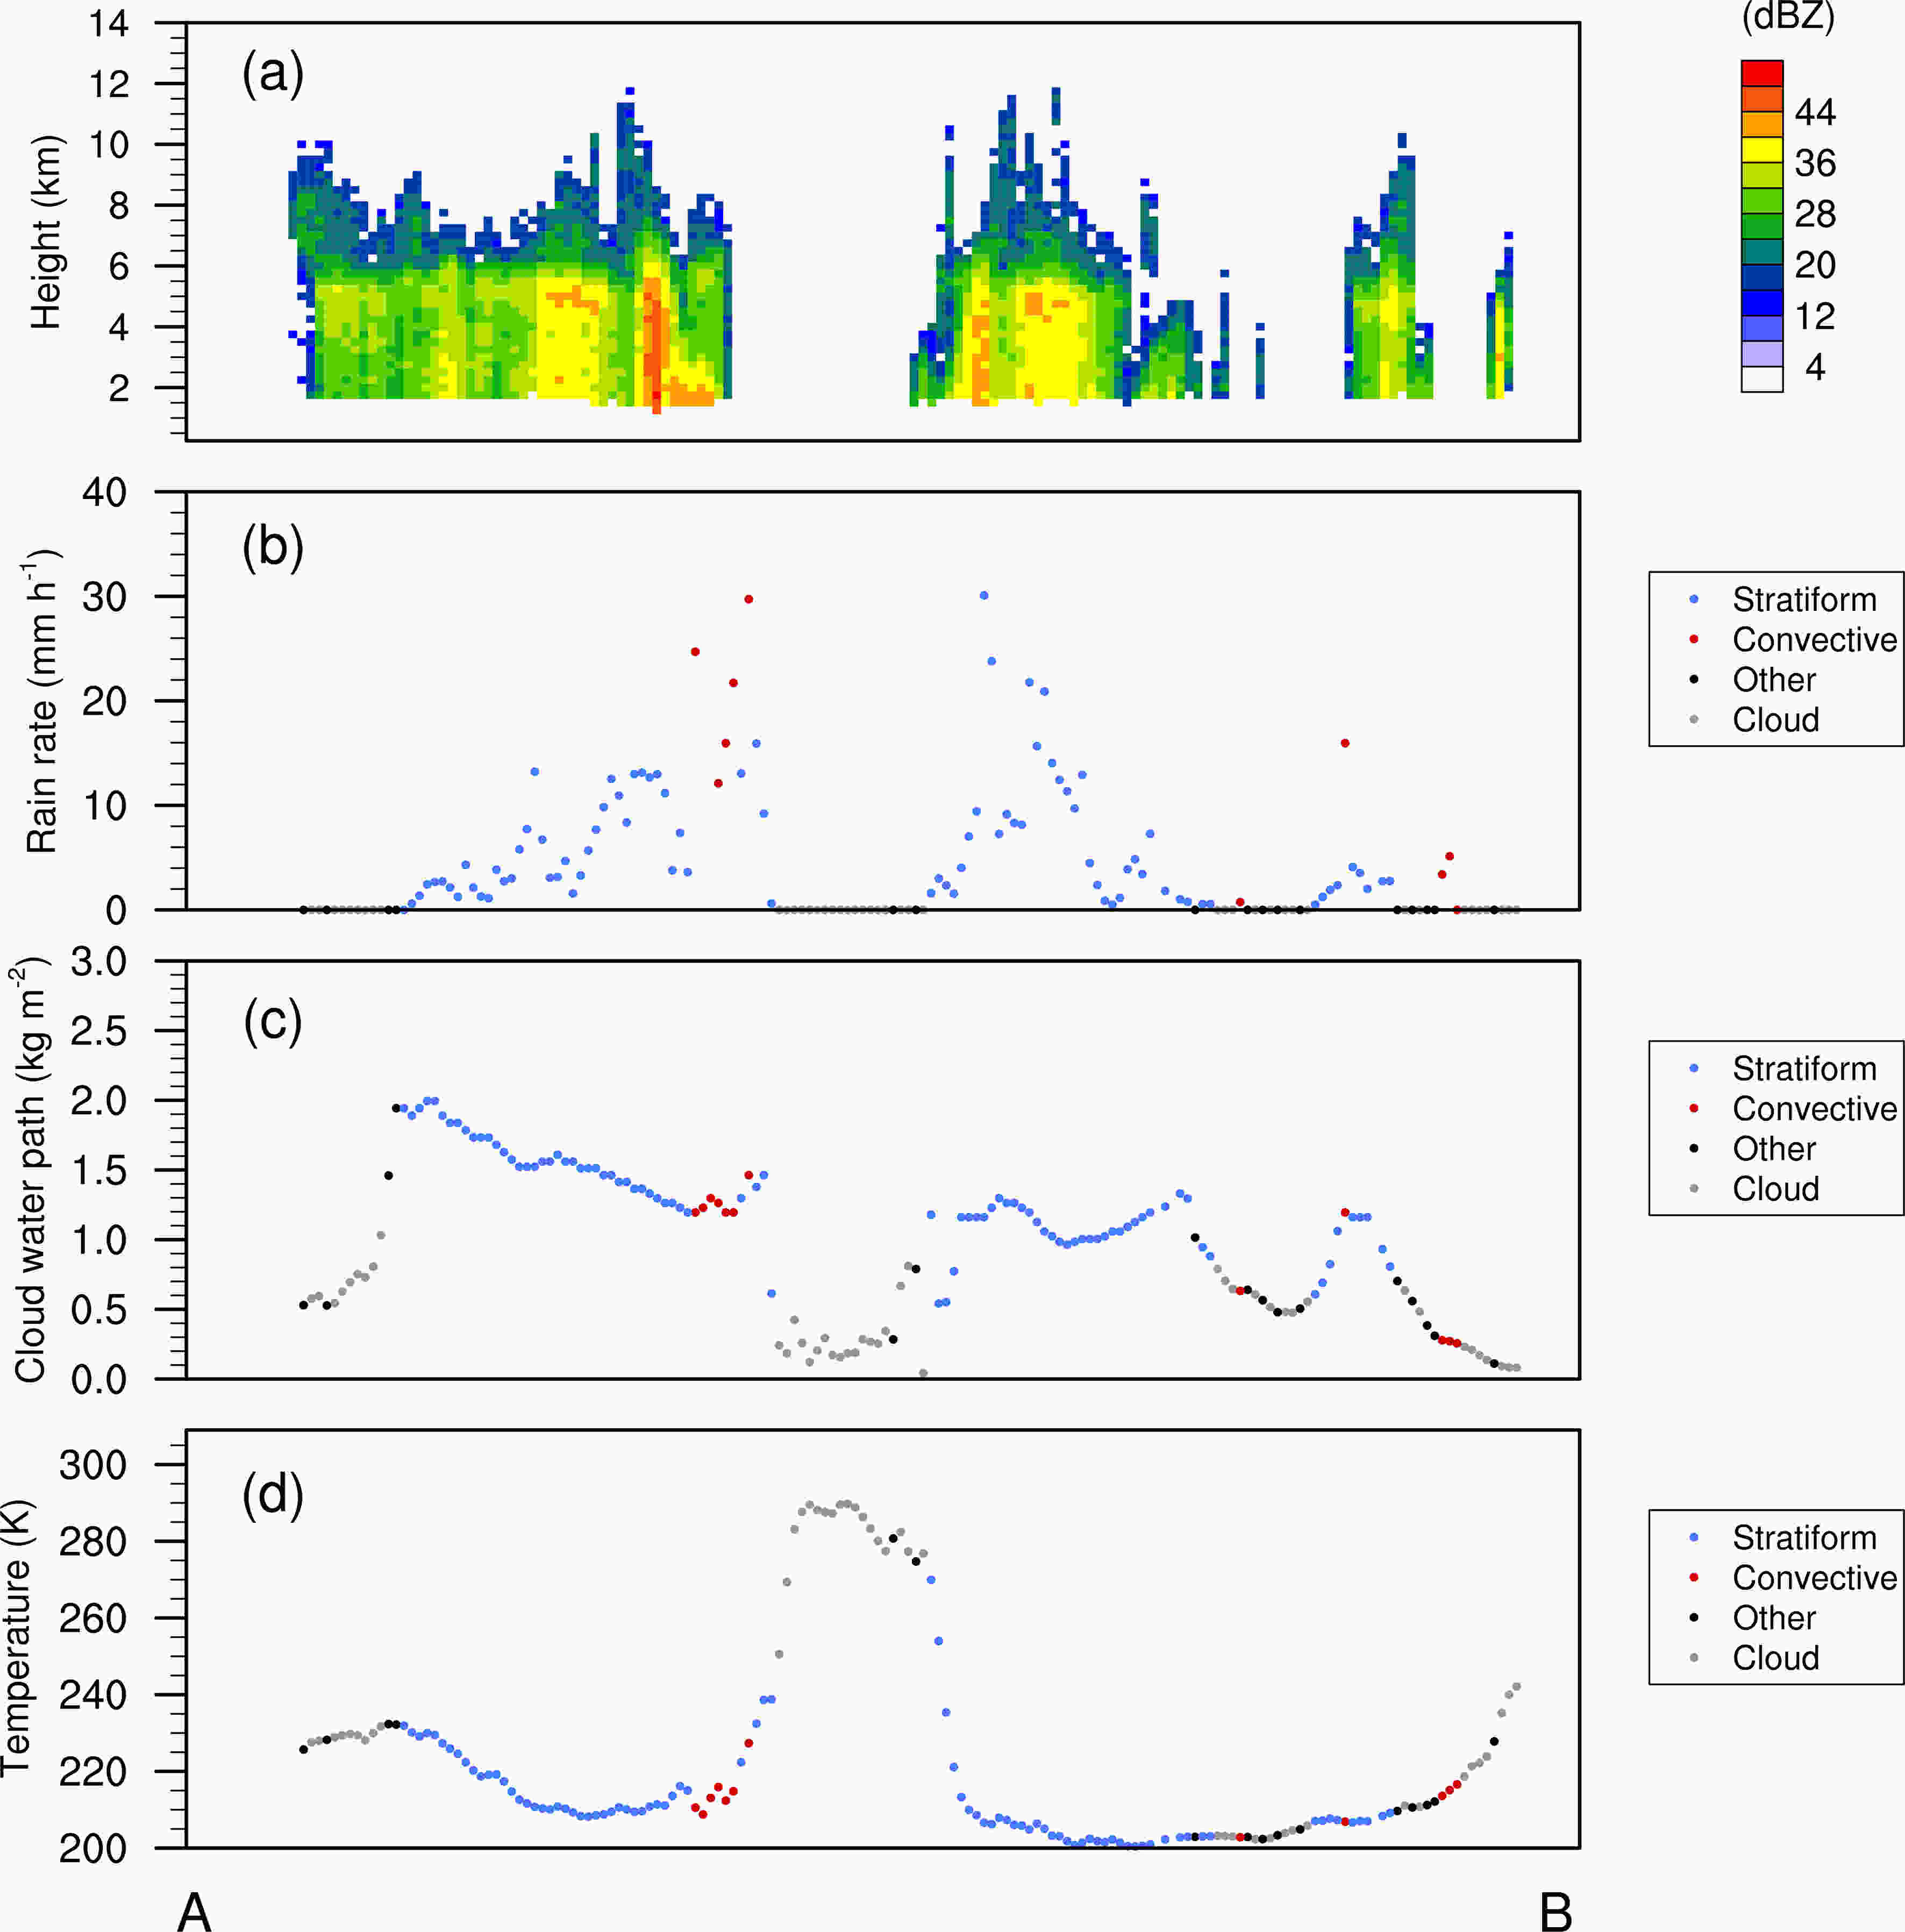
Figure 4. The along-line distribution of (a) the height--distance cross-section of radar reflectivity, (b) RR derived from PR, (c) CWP retrieved from VIRS, and (d) infrared brightness temperature at 10.8μm, passing through the typhoon center as per the “A−B” section plotted in Fig. 3a
On the left-hand side of the typhoon central eye, the radar reflectivity is above 44 dBZ (Jou et al., 2008), and the maximum STH is more than 8 km, mostly concentrated in the inner rainbelt. Figures 4b-d distinguish the different types of precipitation and non-precipitation clouds using different colors. The near-surface precipitation intensity of the typhoon central eye is almost zero, and the corresponding CWP is less than 0.5 kg m−2. The 10.8 μm brightness temperature is greater than 280 K, indicating that the typhoon central eye is covered by non-precipitating warm clouds. In the rainbelts, the high precipitation area corresponds to a high CWP, which is greater than 1.0 kg m−2 and composed of ice particles below 233 K.
3.1. Distribution of radiance and retrieved CWP
3.2. Distribution of precipitation
-
To obtain the relationship between CWP and RR based on a large, statistically significant sample, 25 mature TCs over the Northwest Pacific Ocean were analyzed. Owing to power constraints, the PR has a relatively low sensitivity of ~17 dBZ, which corresponds to an RR of ~0.4 mm h−1 (Schumacher and Houze, 2003). Pixels with near-surface RRs smaller than 0.4 mm h−1 were ignored in this study to avoid the ambiguity of sampling at lower reflectivities. Meanwhile, stratiform and convective precipitation were separated to compare the effects of different precipitation types on the relationship between CWP and RR. Table 2 shows the sample numbers and average values of RR and CWP for stratiform, convective, and total precipitation in mature TCs. Undoubtedly, the following results are statistically significant owing to the large number of samples (144 515) used in our study. The amount of stratiform precipitation accounts for 83.42% of the total precipitation with 120 553 pixels, whereas convective precipitation accounts for only 15.06% with 21 762 pixels. Hence, typhoon precipitation systems are dominated by stratiform precipitation, which is consistent with the conclusion in section 3. The average RR of convective precipitation exceeds 10 mm h−1, which is three times that of stratiform precipitation. In general, typhoon systems have a high water content and the average CWP of the total precipitable water is greater than 1.0 kg m−2. In addition, the CWP of the stratiform precipitable water is slightly larger than that of convective precipitation.
Precipitation type Number (percentage) Average RR (mm h−1) Average CWP (kg m−2) Stratiform 120 553 (83.42%) 4.67 1.22 Convective 21 762 (15.06%) 14.95 0.96 Total precipitation 144 515 6.18 1.17 Table 2. Sample numbers and average values of RR and CWP for different precipitation types
Next, we analyzed the spectral distribution of RR and CWP for stratiform, convective, and total precipitation. The RR was divided into eight intervals from 0.4 mm h−1 to more than 100 m h−1, and the frequencies of different types of precipitation were counted, as shown in Fig. 5a. The peak frequency of total precipitation occurs in the range of 2−5 mm h−1, which accounts for 26.9% of the precipitation, followed by the 1−2 mm h−1 interval accounting for 21.5%. The precipitation intensity of stratiform precipitation is mainly distributed below 20 mm h−1, accounting for 96.7%, while convective precipitation above 20 mm h−1 accounts for 23.3%. The proportion of stratiform precipitation is larger than that of convective precipitation below 5 mm h−1, and the opposite above 5 mm h−1.

Figure 5. Frequency distribution of (a) RR (mm h-1) and (b) CWP (kg m-2) for different types of precipitation
Similarly, the average CWPs of stratiform, convective, and total precipitation were divided into five intervals between 0 to 3 kg m−2, and the spectral distribution of the CWP for different types of precipitation are shown in Fig. 5b. It can be seen that, for all precipitation types, the peak frequency of CWP is 1−1.5 kg m−2, which accounts for 45.6% of stratiform precipitation and 32.8% of convective precipitation, indicating that stratiform precipitation dominates the precipitation in the 1−1.5 kg m−2 interval. In addition, the percentage of pixels with convective precipitation in the interval of 0−0.5 kg m−2 is nearly 30%, in which stratiform precipitation accounts for less than 10%.
-
The STH and brightness temperature at 10.8 μm are important parameters of precipitation and spectral data, respectively. The former indicates the height of the precipitation top, while the latter reflects the cloud-top height. The average distribution characteristics of RR in mature TCs were analyzed using a combination of the STH and CWP, as well as brightness temperature at 10.8 μm and CWP.
Firstly, we calculated the precipitation intensity of mature TCs under different CWPs and STHs. Figure 6 shows the distribution of RR in a two-dimensional diagram of CWP (x-axis) and STH (y-axis) for total precipitation, stratiform precipitation, and convective precipitation, overlaid with their joint probability density functions for CWP and STH (shaded colors). It can be seen from the two-dimensional probability density distribution that the region with the highest precipitation probability is concentrated in the CWP range of 1−1.5 kg m−2 and in the STH range of 6−9 km. In addition, the higher the STH, the higher the precipitation intensity. It is worth noting that there is a boundary line in the STH of about 7 km, above which the RR is more than 5 mm h−1. Figures 6b and c show the distribution of stratiform and convective precipitation, respectively. Stratiform precipitation is in agreement with total precipitation, whereas the RR of convective precipitation is stronger in general and the boundary line is lower.
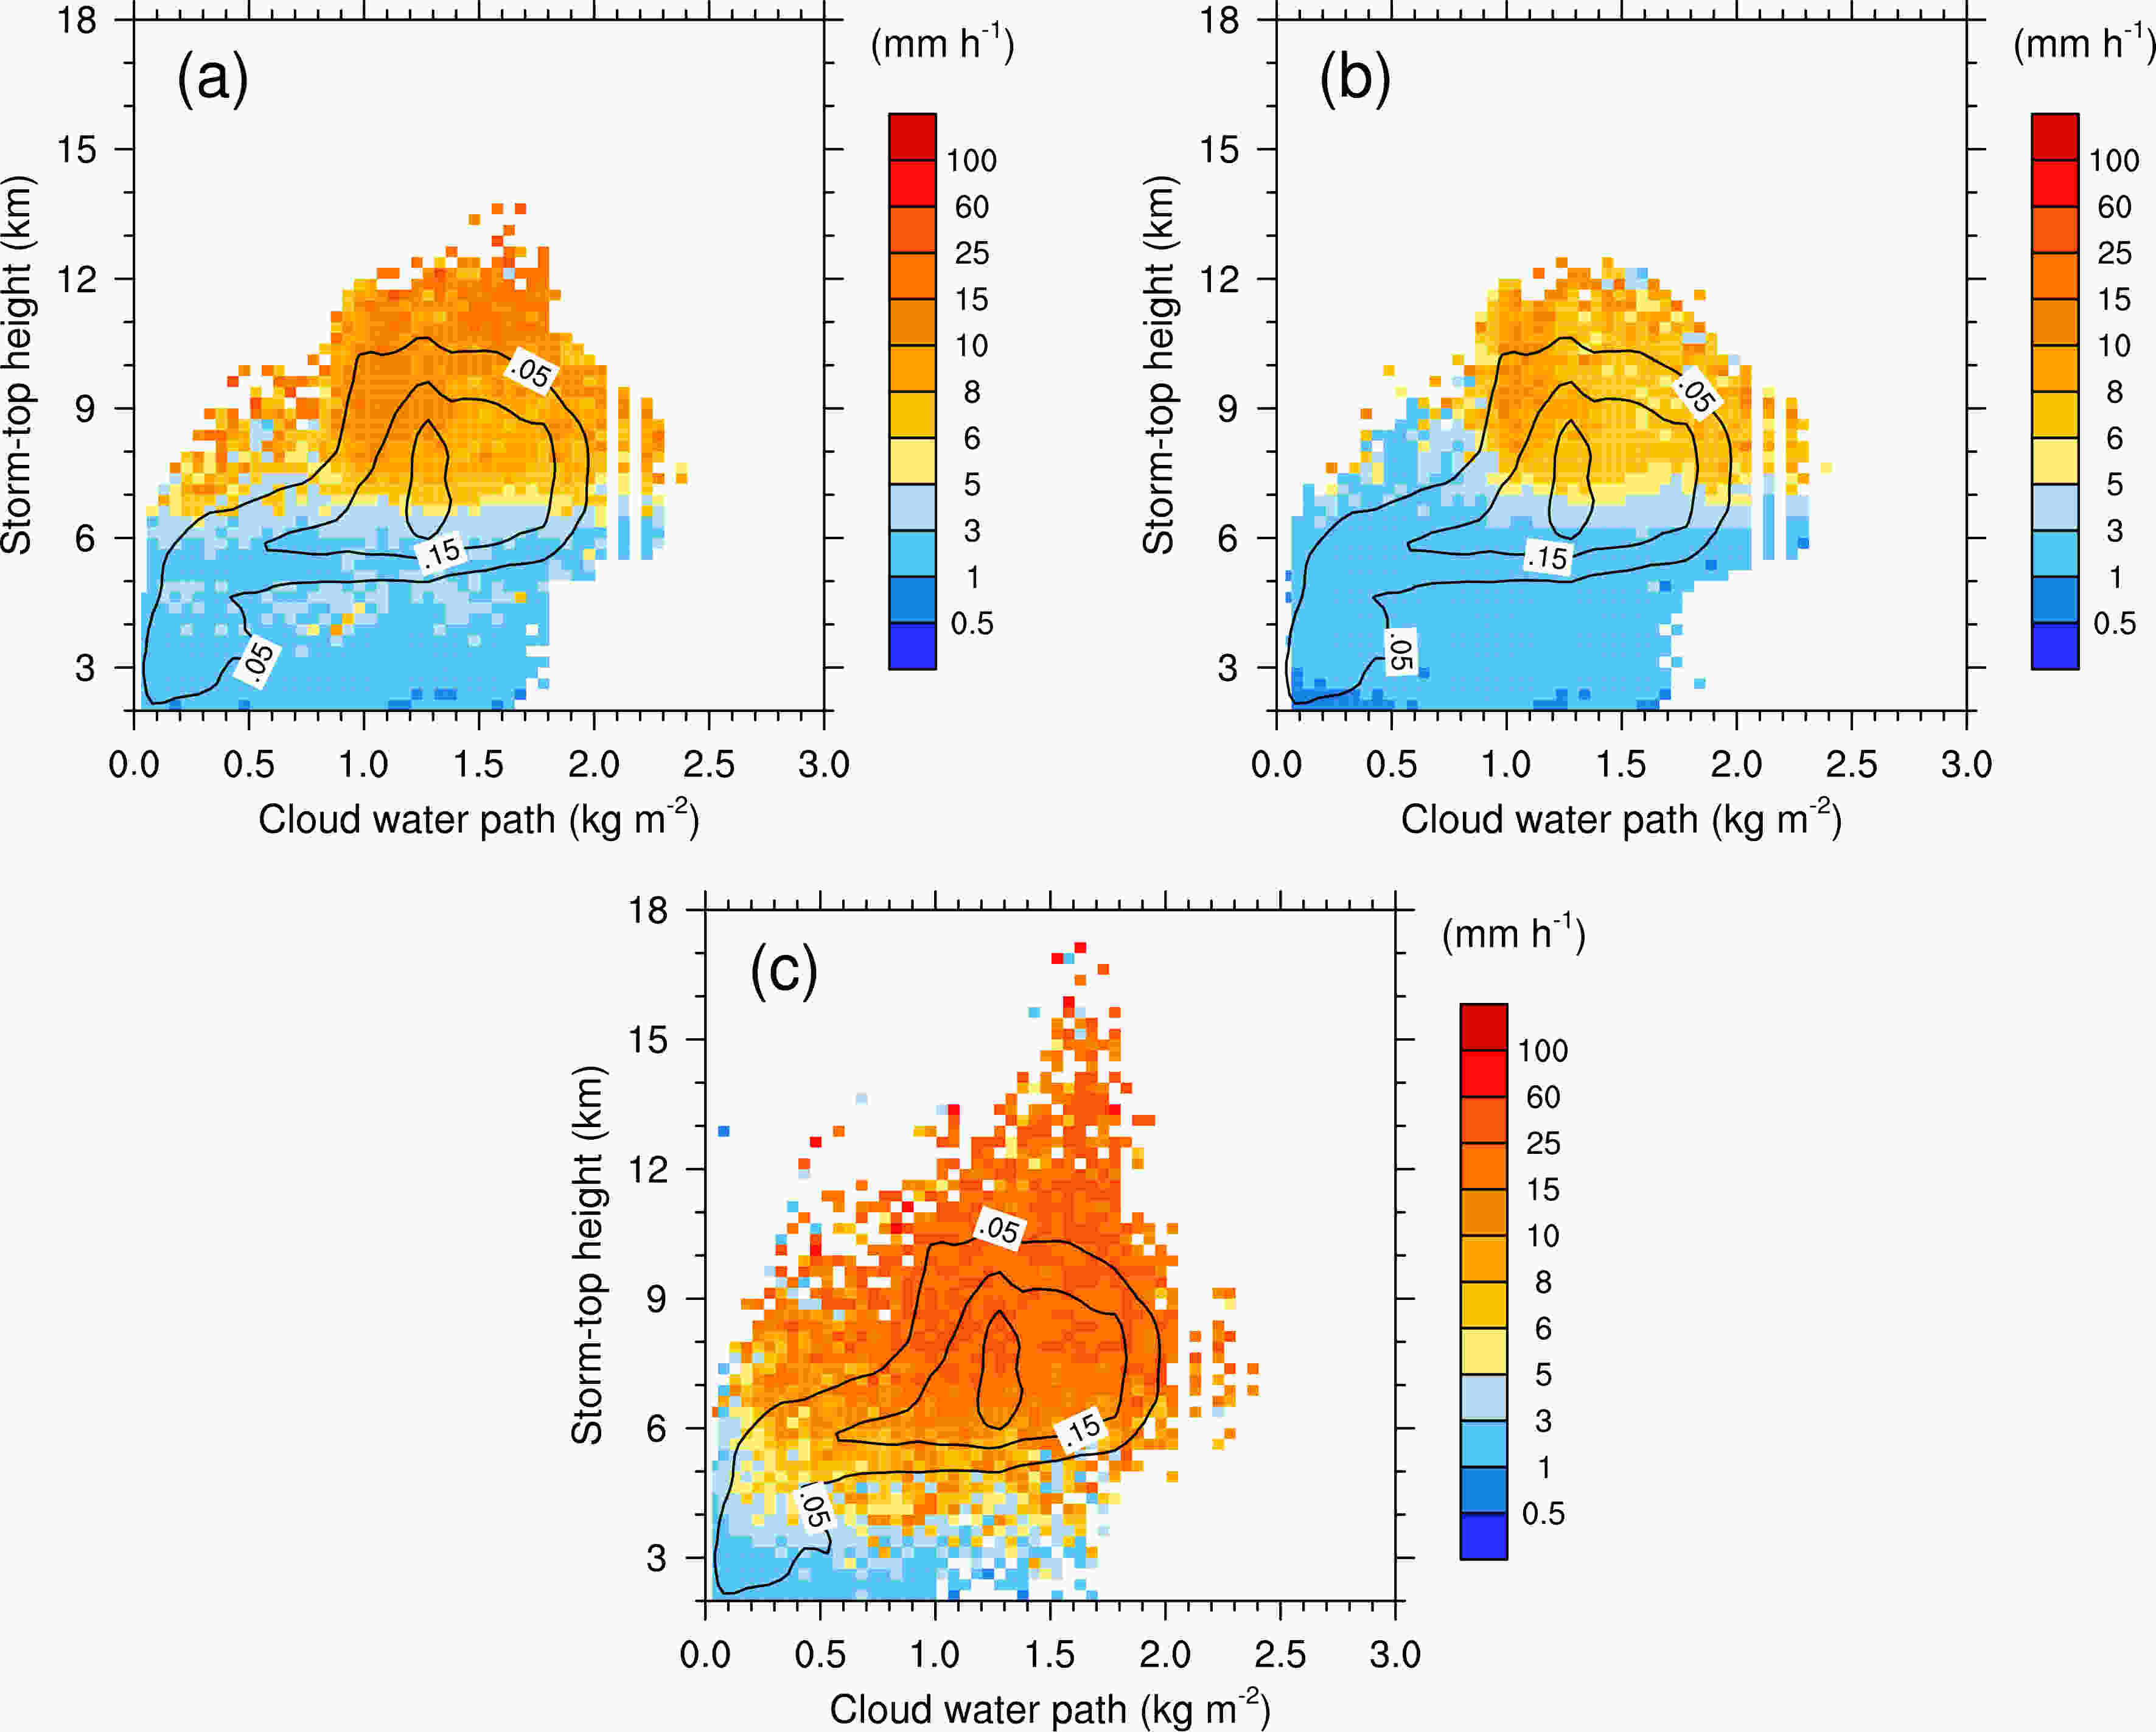
Figure 6. Distribution of RR in a two-dimensional diagram of CWP (x-axis) and STH (y-axis) for (a) total precipitation, (b) stratiform precipitation, and (c) convective precipitation, overlaid with their joint probability density functions for CWP and STH (shaded colors)
Figure 7 shows the distribution characteristics of RR at different CWPs and brightness temperatures at 10.8 μm. From the joint probability density functions of the 10.8-μm brightness temperature and the CWP, we find most of the precipitation clouds are distributed in the CWP of more than 1.0 kg m−2 and temperature below 240 K, where the RR is above 5 mm h−1. Figures 7b and c show the distribution of stratiform precipitation and convective precipitation, respectively. The convective precipitation is similar to the two-dimensional probability density distribution of stratiform precipitation, with a consistently high precipitation probability. The difference is that the convective precipitation intensity is stronger than stratiform precipitation in general, and the former also occurs when the CWP is below 0.5 kg m−2.

Figure 7. As in Fig. 6, but with the y-axis representing brightness temperature at 10.8 μm
-
The shaded colors in Fig. 8 show the joint probability density functions of RR and CWP in mature TCs. It can be seen that the precipitation pixels are mainly concentrated where the CWP exceeds 1 kg m−2 and the RR is up to 50 mm h−1. Two important types of precipitation clouds, nimbostratus and deep convective clouds, are detected at a CWP threshold of 250 g m−2 in the ISCCP data (Rossow and Schiffer, 1999). According to Fig. 8, for more than 95% of the precipitation pixels the CWP exceeds 250 g m−2.
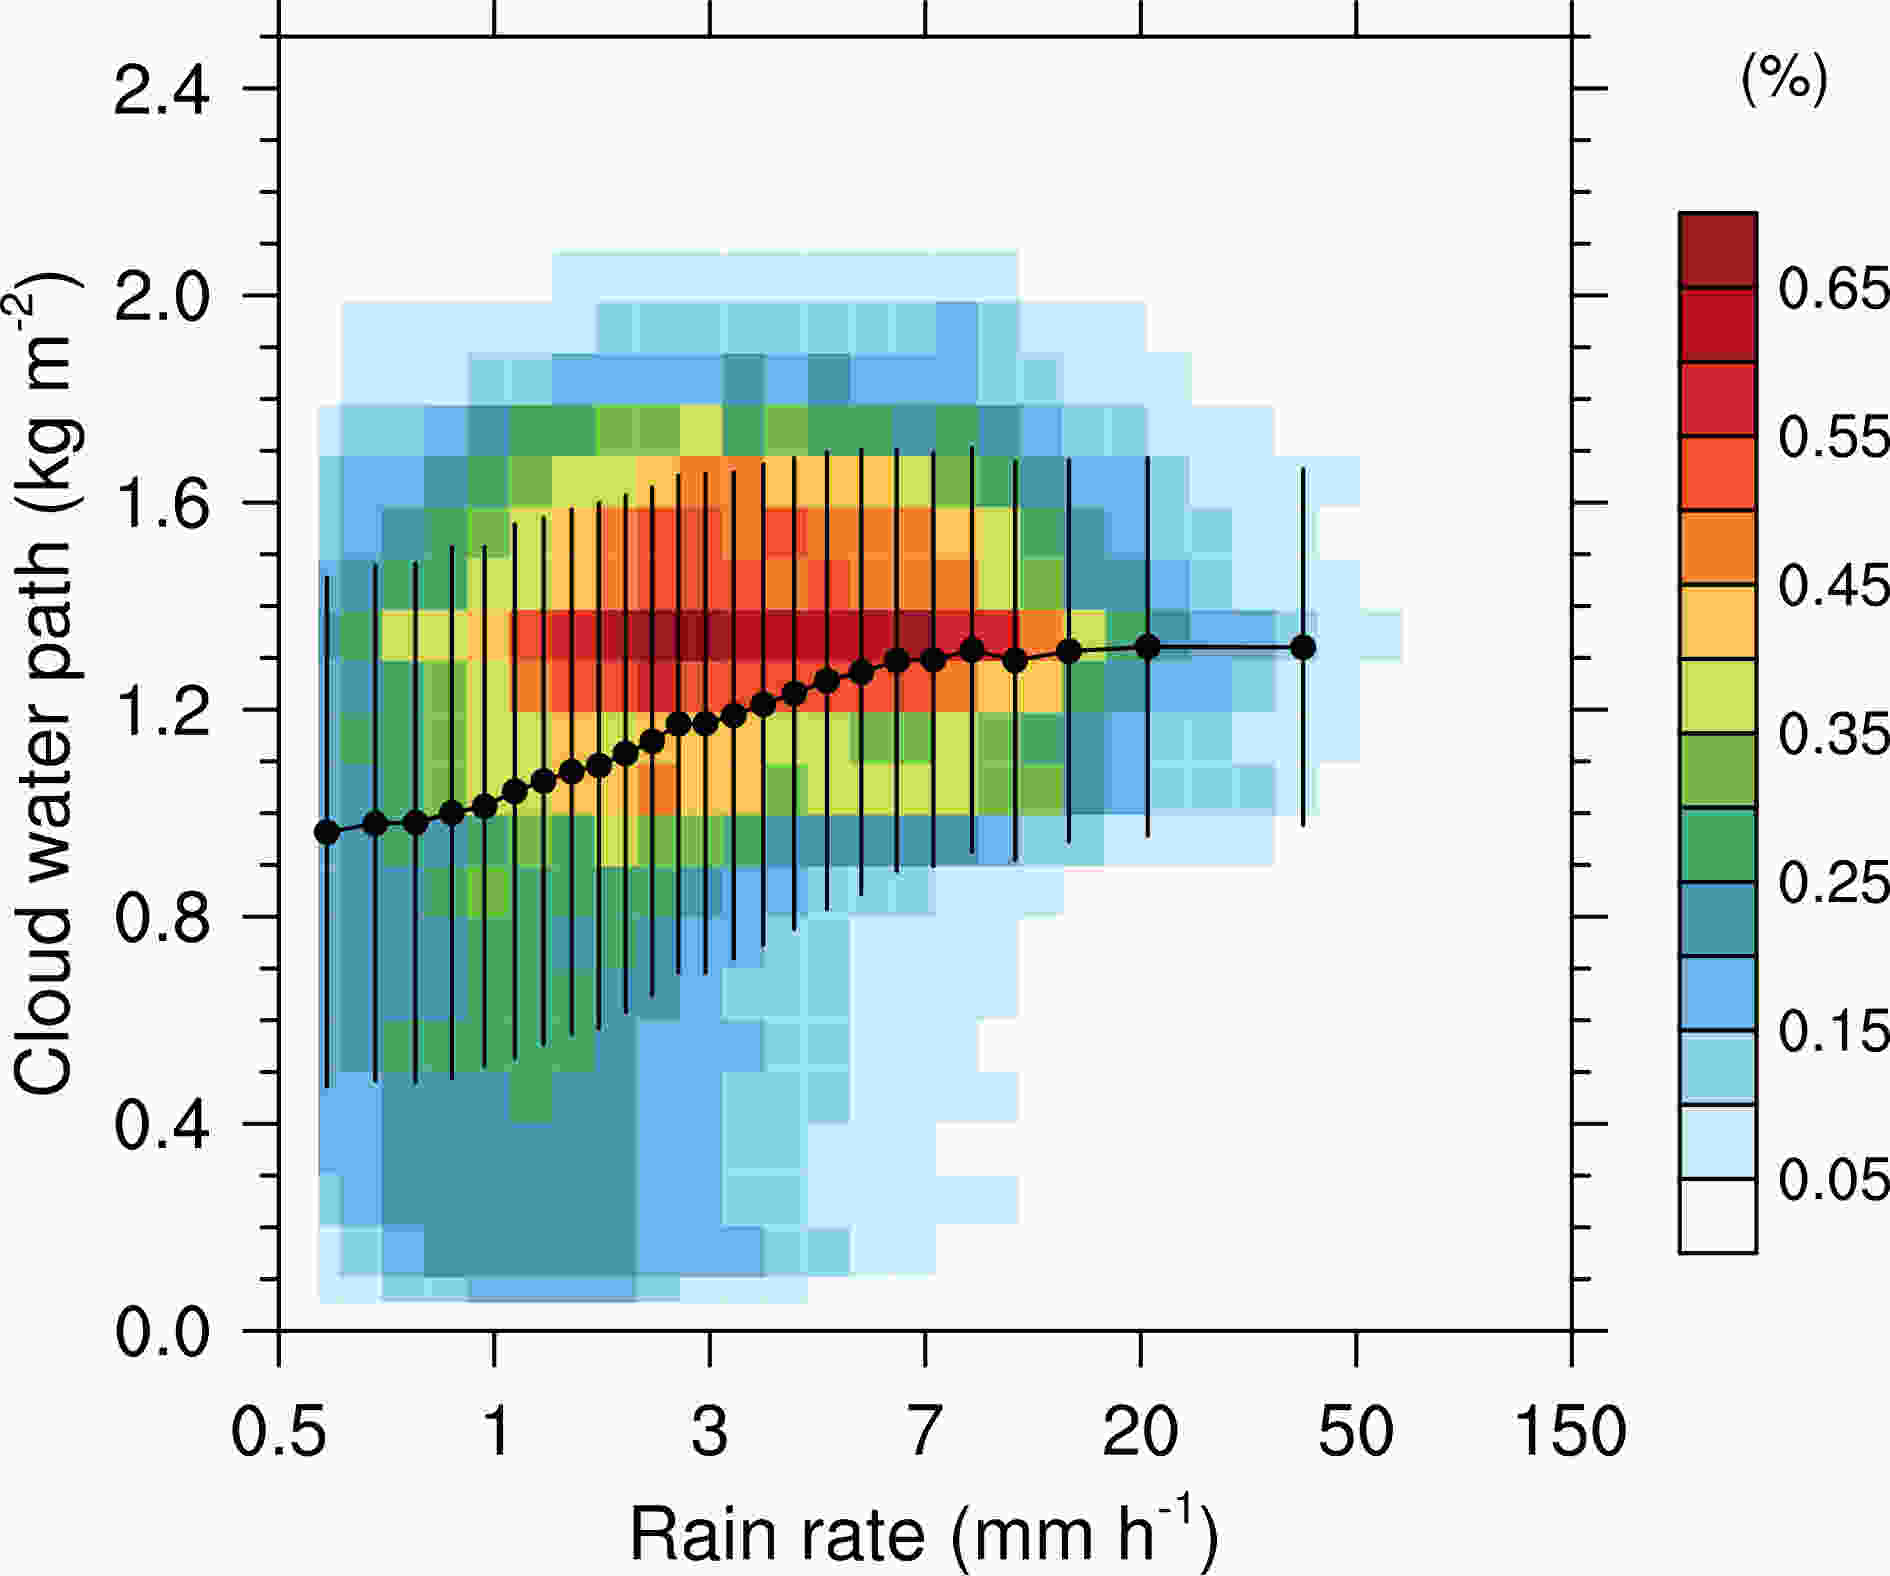
Figure 8. The joint probability density functions of RR and CWP in mature typhoon systems, overlaid with their mean values and standard deviations with equal samples in each 4% RR interval after sorting
To make our statistical results more robust, equal samples in each RR interval were used to calculate the relationship between RR and the corresponding cloud microphysical properties for total precipitation. Figure 8 is a scatterplot of the mean values for CWP and RR after sorting and equal-samples statistics, and the vertical line is their standard deviation. The trend of the average value of CWP and RR goes through three stages with increasing RR. First, when the precipitation is less than 1 mm h−1, CWP grows slowly, and then faster with increasing RR. When the RR is above 10 mm h−1, CWP changes gradually. A previous theoretical framework pointed out that the cloud water content reaches saturation at a certain level (Wang et al., 2008), which is corroborated by this study. In terms of the standard deviation, this decreases with increasing RR, indicating that when the rainfall is heavy, the variation of cloud water content is reduced.
-
Figure 9 shows the mean values and standard deviations of RR and CWP with equal samples in each 4% RR interval for convective and stratiform precipitation, overlaid with their fitted curves. The logarithmic coordinate of RR (x-axis) is taken to express the relationship between RR and CWP more clearly. In general, the logarithm of RR is positively correlated with CWP. In other words, CWP increases with RR and will be saturated (~1.3 kg m−2) when the precipitation reaches a certain intensity. The turning point appears around 7 mm h−1 for stratiform precipitation, whereas for convective precipitation it is about 20 mm h−1. In addition, the rate of increase of convective precipitation is larger than that of stratiform precipitation, while the CWP of stratiform precipitation is larger than that of convective precipitation under the same RR, resulting in a higher water content for stratiform precipitation at a specific RR. Furthermore, regardless of the precipitation type, the standard deviation gradually decreases as RR increases.
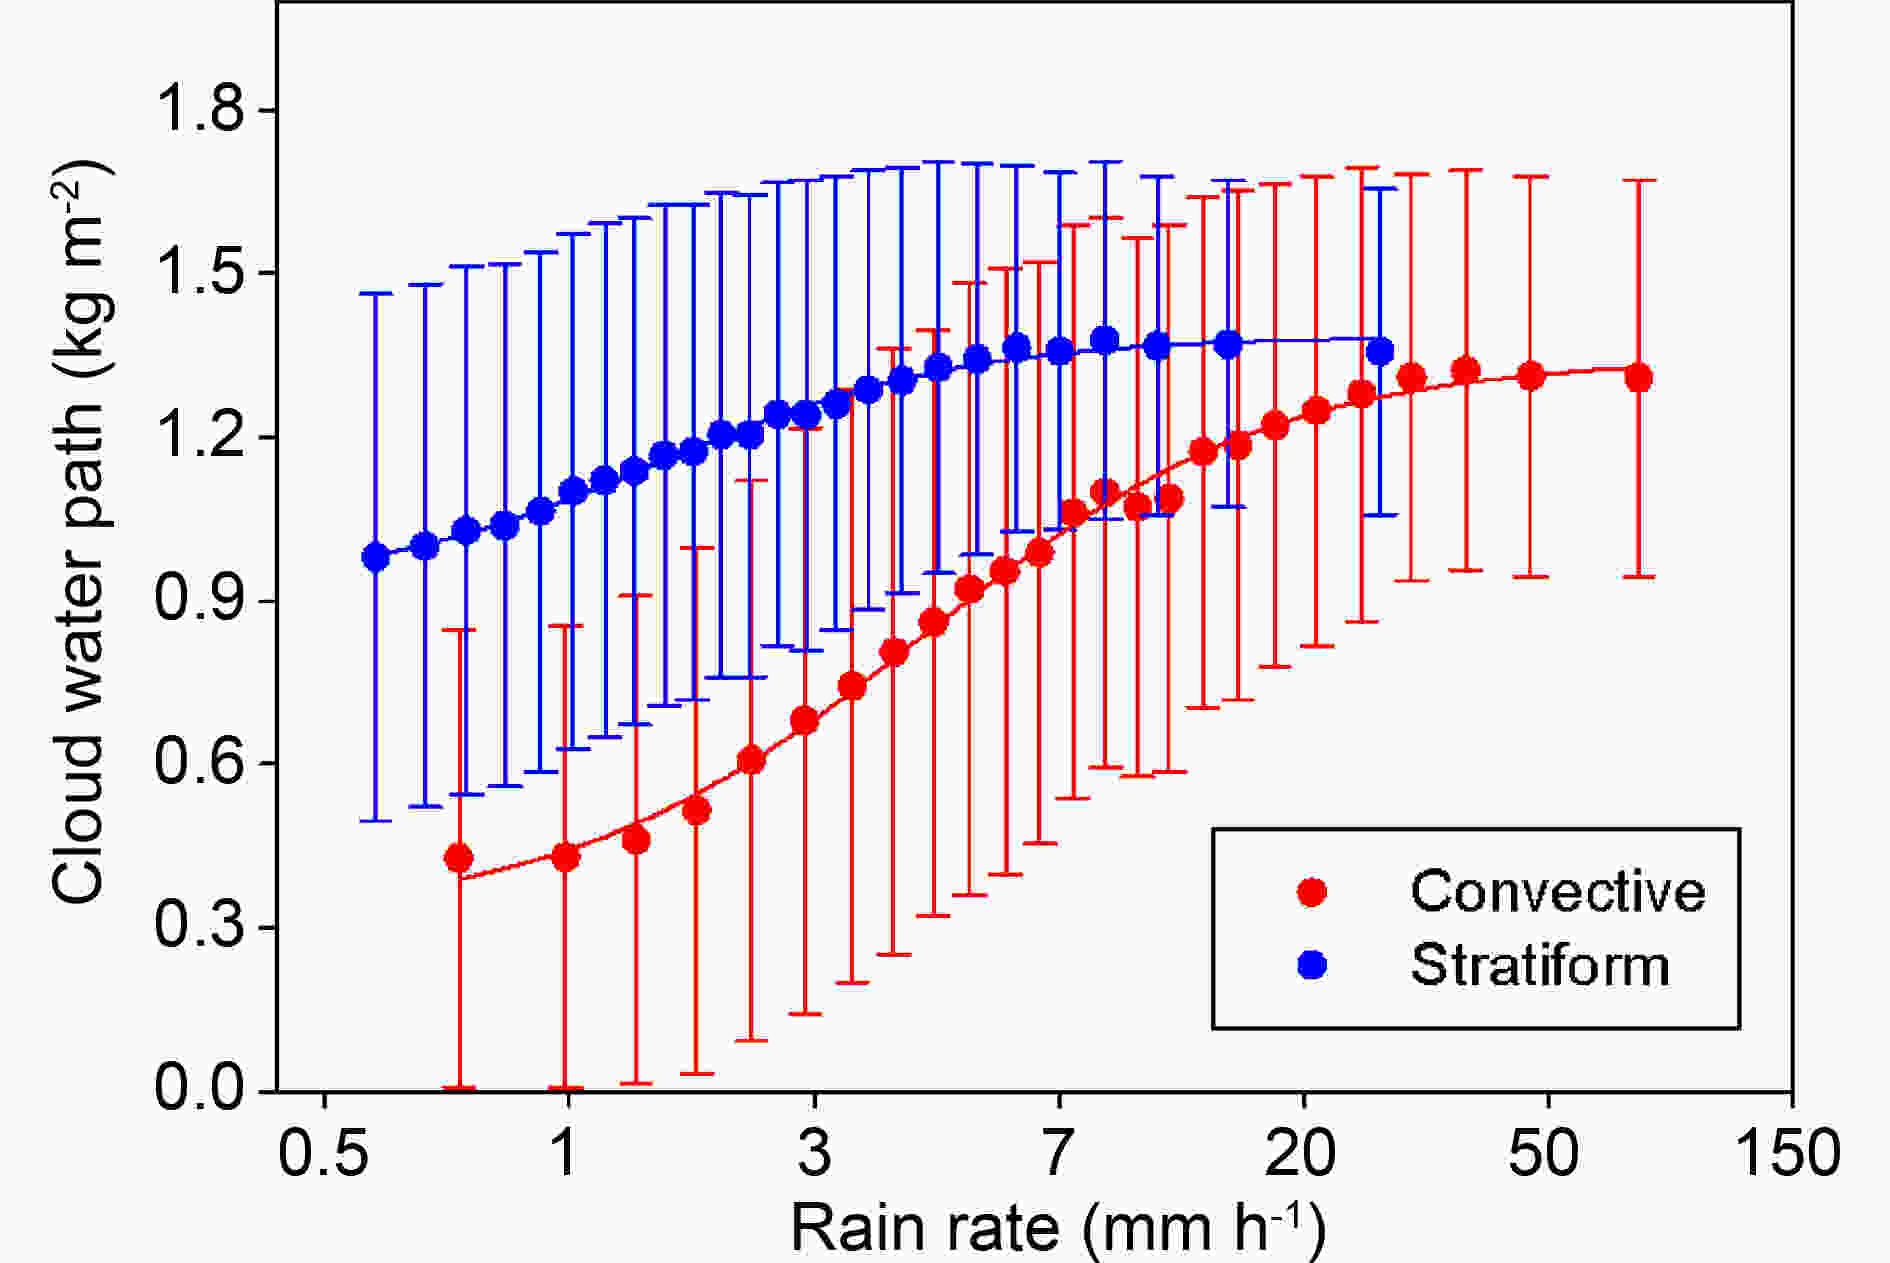
Figure 9. The mean values and standard deviations of RR and CWP with equal samples in each 4% RR interval for different precipitation types, overlaid with their fitted curves
These results were then used to perform sigmoid fitting calculations for the given data and to produce diagrams of their function, i.e.,
where x is the natural logarithm of RR (units: mm h−1), y is CWP (units: kg m−2), and x0, y0, a, and b are the fitted coefficients listed in Table 3. The R2 regression values are above 0.99, implying a notable relationship between RR and CWP, which may be useful for estimating CWP and parameterizing precipitation in numerical models.
a b x0 y0 R2 Precipitation type Convective 1.0266 0.7273 1.4357 0.3185 0.9947 Stratiform 0.4642 0.6247 0.3652 0.9200 0.9936 Precipitation cloud phase Ice 0.2936 0.5001 0.4240 1.0516 0.9958 Mixed 0.6377 0.9619 1.4152 0.5640 0.9731 Water 0.7878 1.1204 2.9094 0.1545 0.9368 Vertical depth of precipitation Shallow 0.3390 0.8263 0.9072 0.8638 0.9816 Deep 0.0945 0.1853 −0.1302 1.2857 0.6406 Table 3. Coefficients and R2 values for the relationship between RR and CWP
-
Usually, the 10.8-μm thermal infrared channel is a simple way to identify phases near the cloud top. Precipitation can be categorized into three phases, i.e., ice phase, mixed phase, and water phase (also called warm cloud precipitation), according to the 10.8-μm brightness temperature. Portions of clouds with temperatures less than or equal to 233 K near the top of precipitating cloud in the thermal infrared channel (Rogers and Yau, 1989) are classified as ice phase (precipitation in ice phase), and those with temperatures greater than or equal to 268 K are classified as water phase (precipitation in water phase). Regions with temperatures between 233 K and 268 K (King et al., 2004) are classified as mixed phase (precipitation in mixed phase). Sample numbers and average values of RR and CWP in different precipitation cloud phases are provided in Table 4. TCs are dominated by ice cloud precipitation with cloud-top temperatures less than 233 K, which accounts for more than 80% of the total samples, followed by mixed-phase precipitation. The probability of warm-cloud precipitation is the smallest, indicating that TCs develop vertically very high and the cloud-top temperature is low. The statistical characteristics of the average values of RR and CWP can also be determined from Table 4. Ice cloud precipitation results in the largest RR and CWP, followed by mixed cloud precipitation, and water cloud precipitation leads to the smallest RR.
Phase Number (percentage) Average RR (mm h−1) Average CWP (kg m−2) Ice 121 879 (84.3%) 6.56 1.25 Mixed 18 866 (13.1%) 4.43 0.80 Water 3770 (2.6%) 2.63 0.26 Table 4. As in Table 2, but for different phases of precipitation cloud
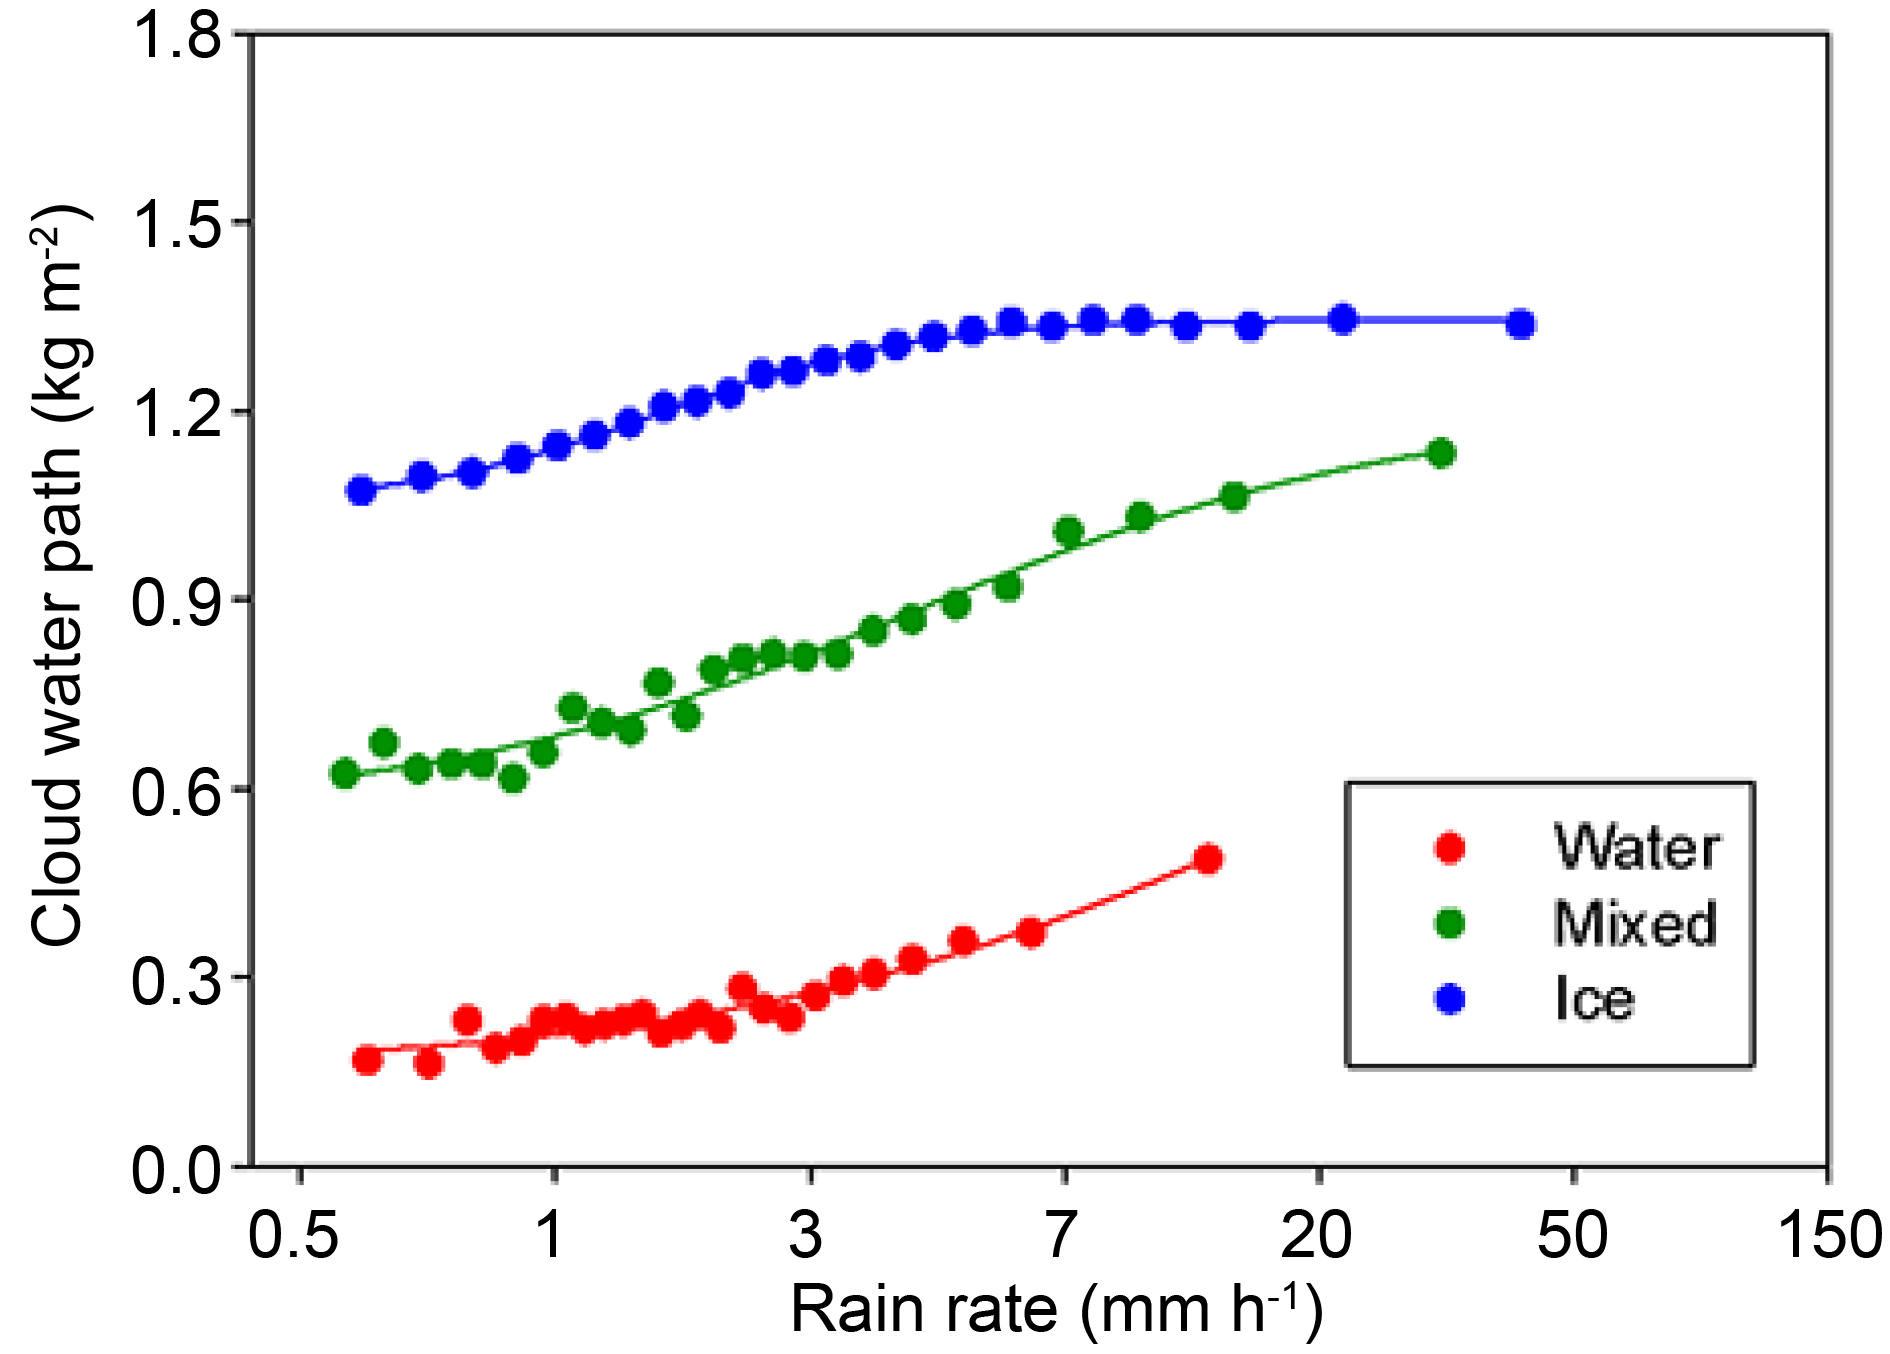
Similarly, the average values of CWP with equal samples of RR were calculated, and the correlations were fitted for different phases of precipitation cloud (see Fig. 10 and Table 3). The R2 values of the fitting coefficients are above 0.9 for ice, mixed, and water cloud precipitation. Furthermore, the correlation coefficient of warm cloud precipitation is slightly smaller, indicating that the fitting relationships between CWP and RR of ice- and mixed-phase precipitation are more significant than that of warm cloud precipitation.
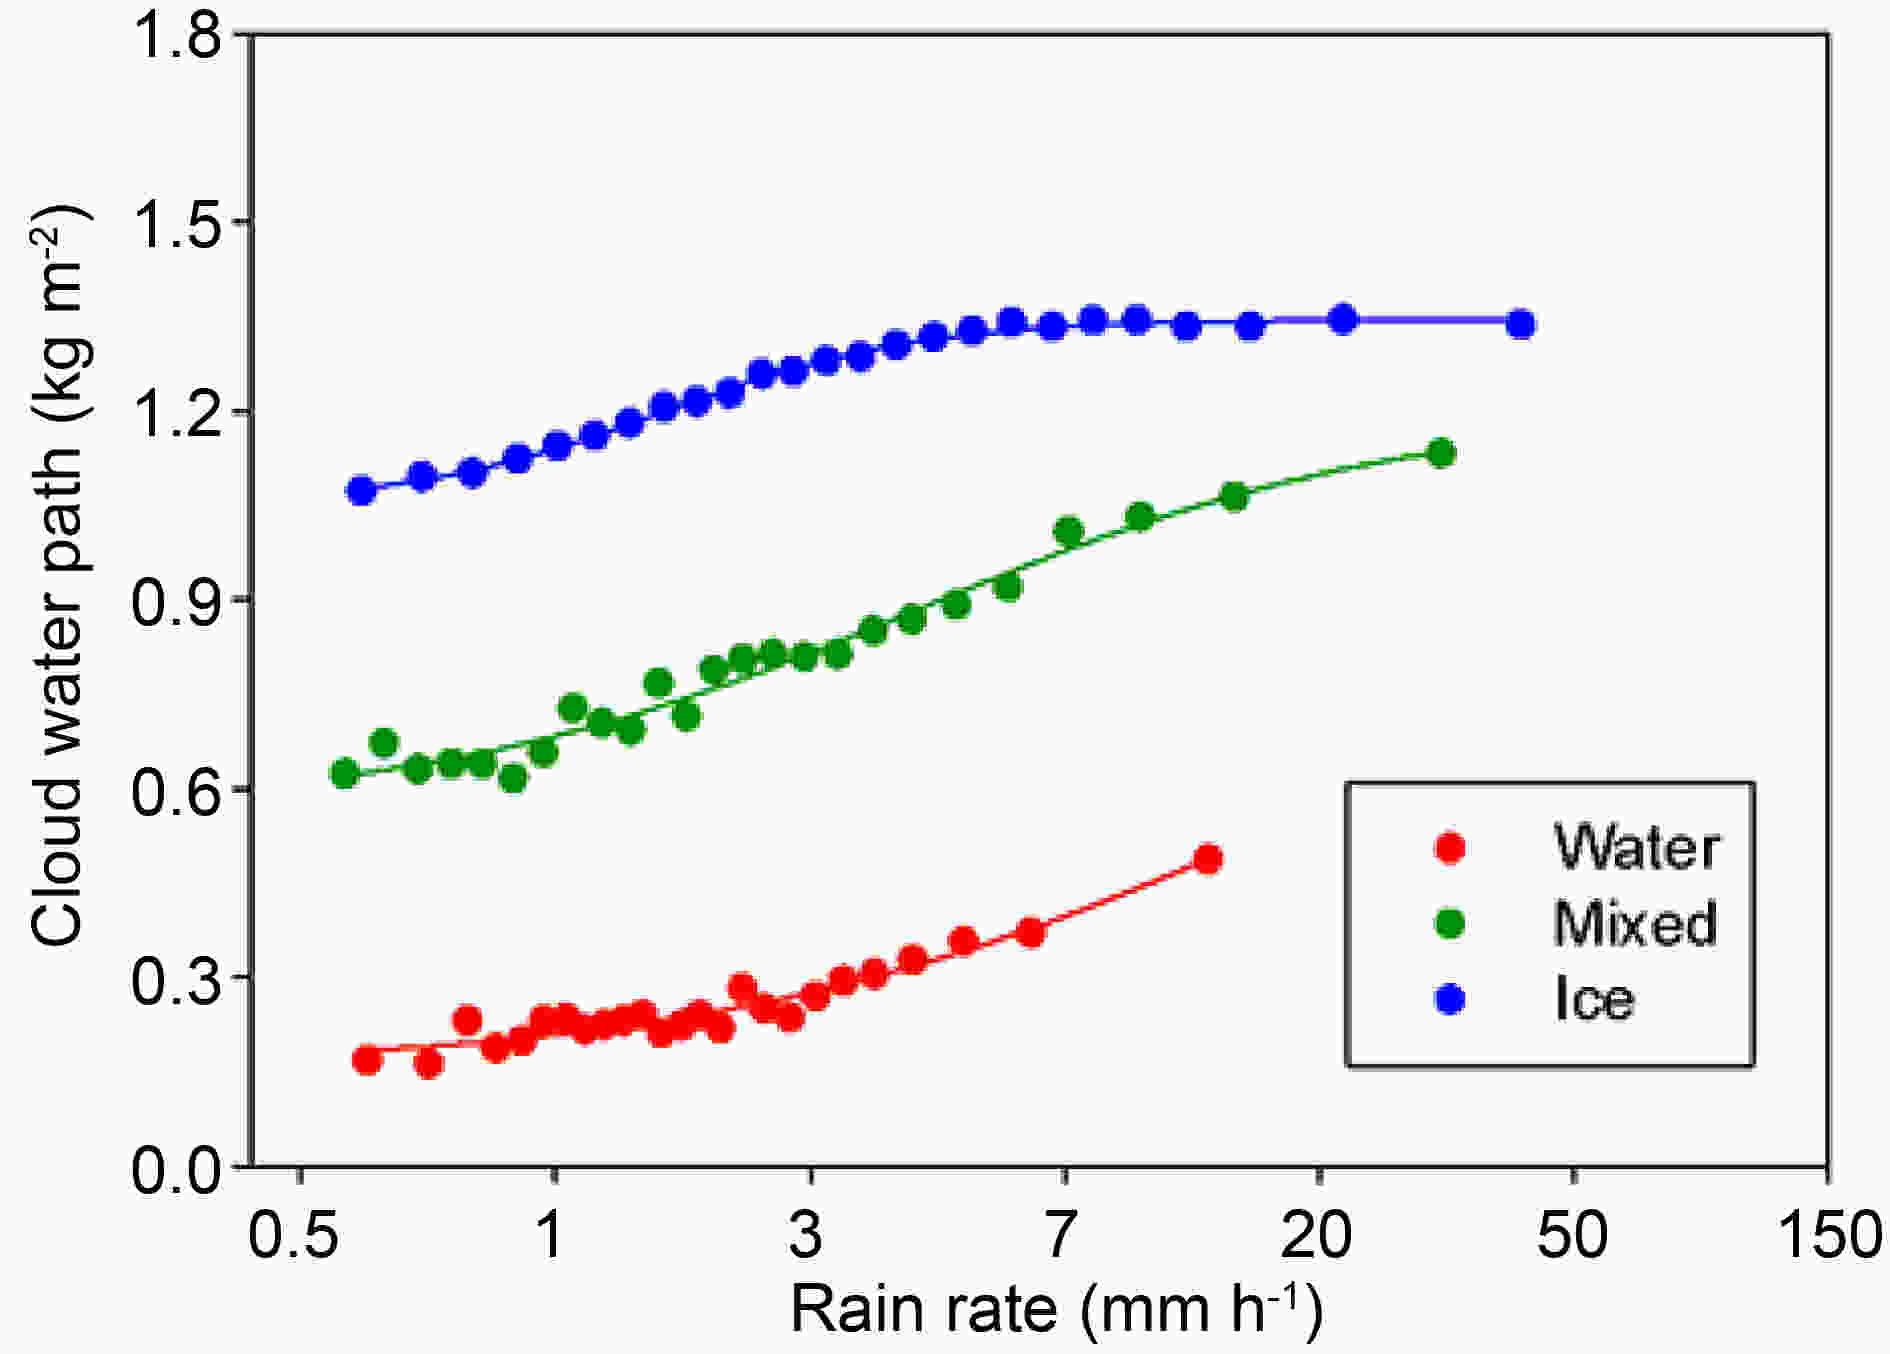
Figure 10. The mean values of RR and CWP with equal samples in each 4% RR interval for different precipitation cloud phase, overlaid with their fitted curves
-
A typhoon is a violent weather system with convective activity, and the STH represents the vertical depth of typhoon precipitation. According to the statistics in the previous section (see Fig. 6a), a height of 7 km is the boundary of precipitation intensity. Therefore, 7 km is defined as the threshold height of deep and shallow precipitation. Table 5 shows the sample numbers and average values of RR and CWP for shallow and deep vertical depths of precipitation. The pixel numbers of shallow precipitation are slightly more than those of deep precipitation, but the precipitation intensity of shallow precipitation is significantly smaller than that of deep precipitation, as well as the average value of CWP.
Depth Number (percentage) Average RR (mm h−1) Average CWP (kg m−2) Shallow 83 250 (57.6%) 3.54 1.01 Deep 61 265 (42.4%) 9.76 1.37 Table 5. As in Table 2, but for different vertical depths of precipitation
We fitted the relationship between CWP and RR at different vertical depths of precipitation, as before (see Fig. 11). The fitting shows good results for shallow precipitation, but the fitting for deep precipitation is worse, due to the difficulty in CWP retrieval for thick precipitation clouds.
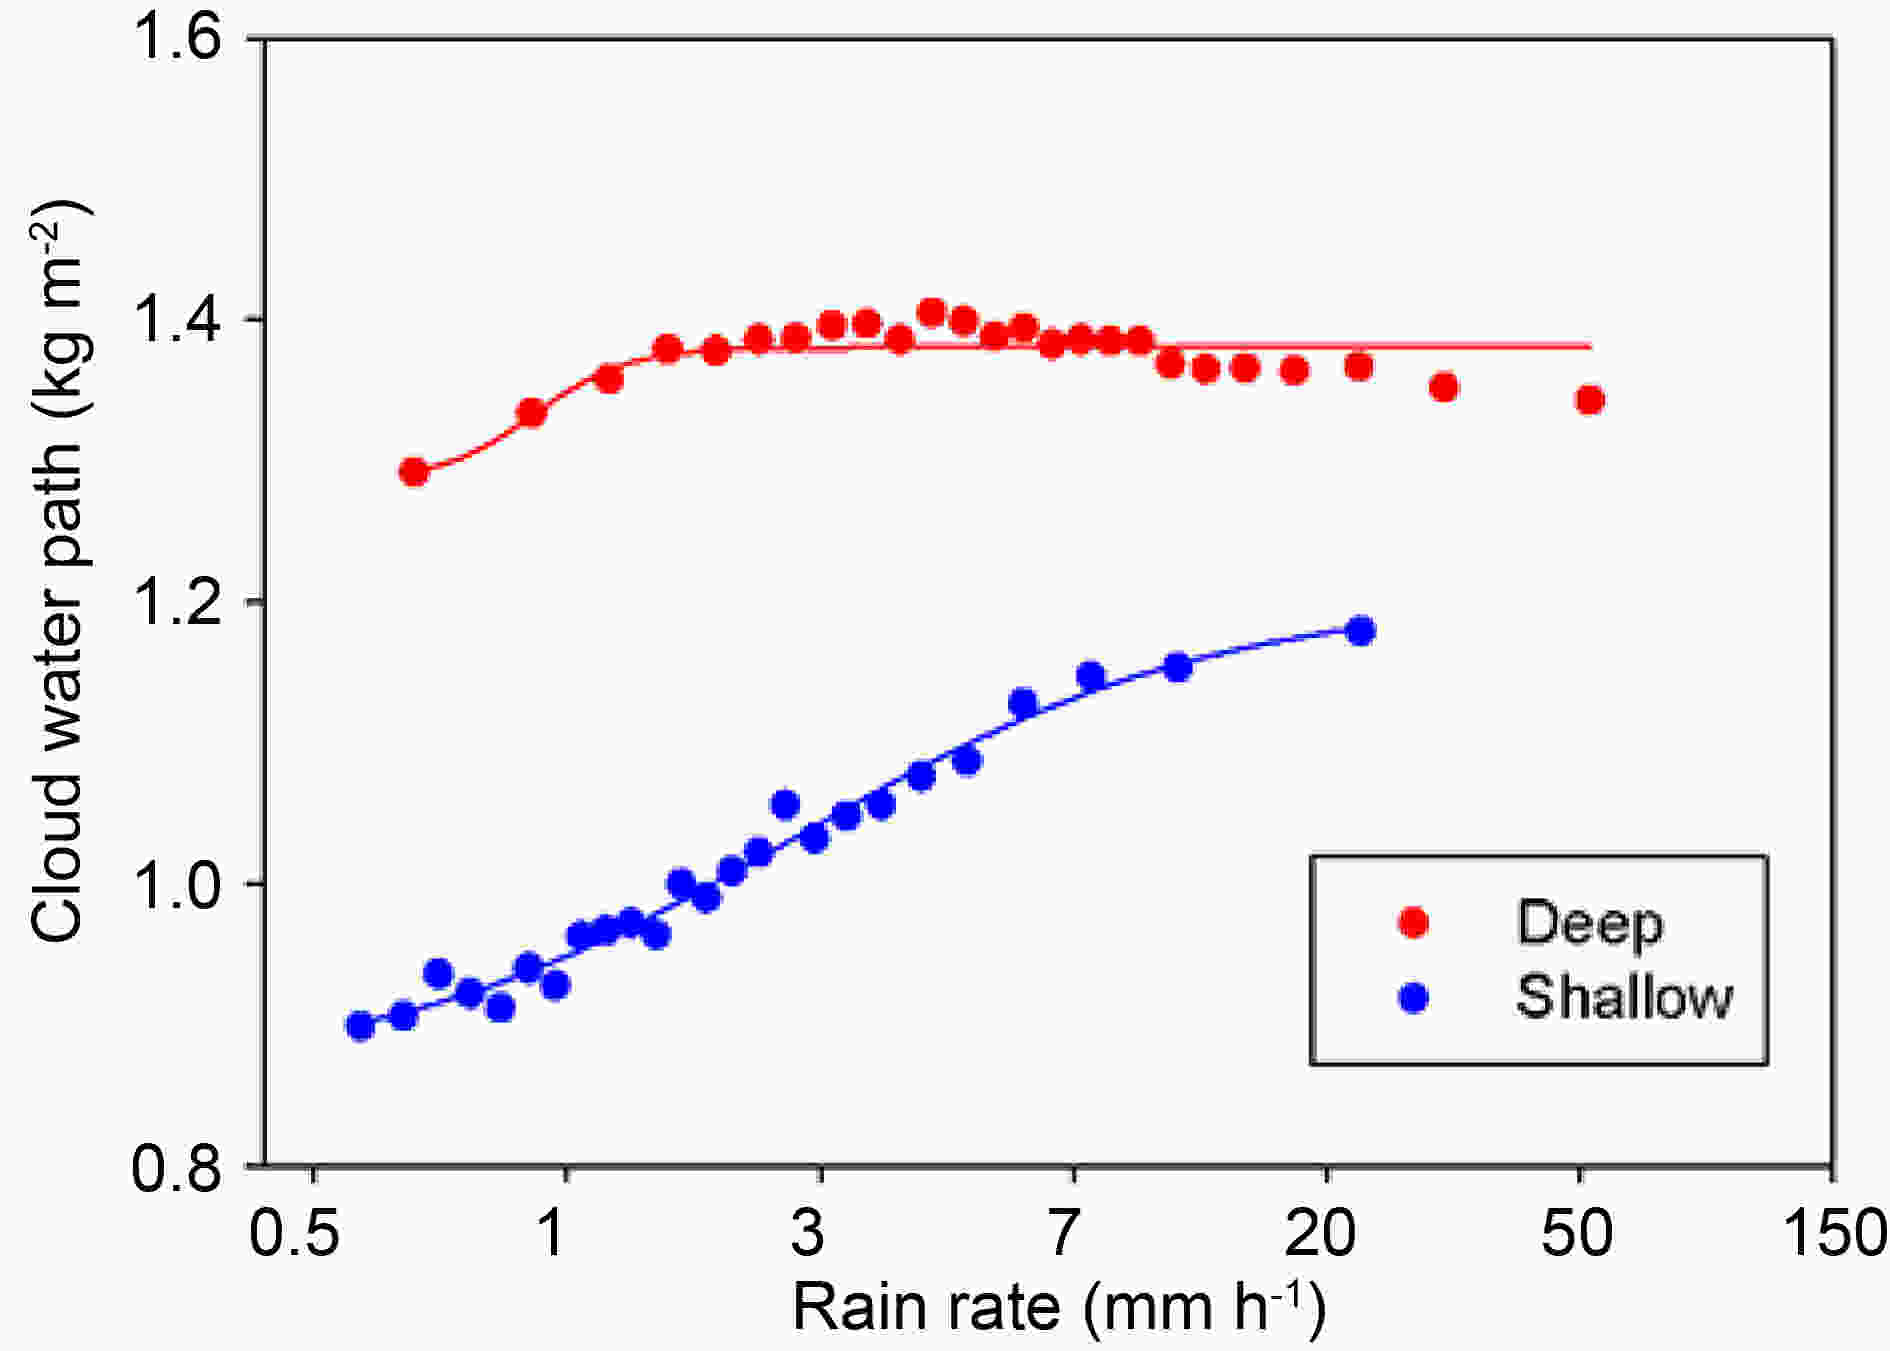
Figure 11. As in Fig. 10, but for different vertical depths of precipitation
-
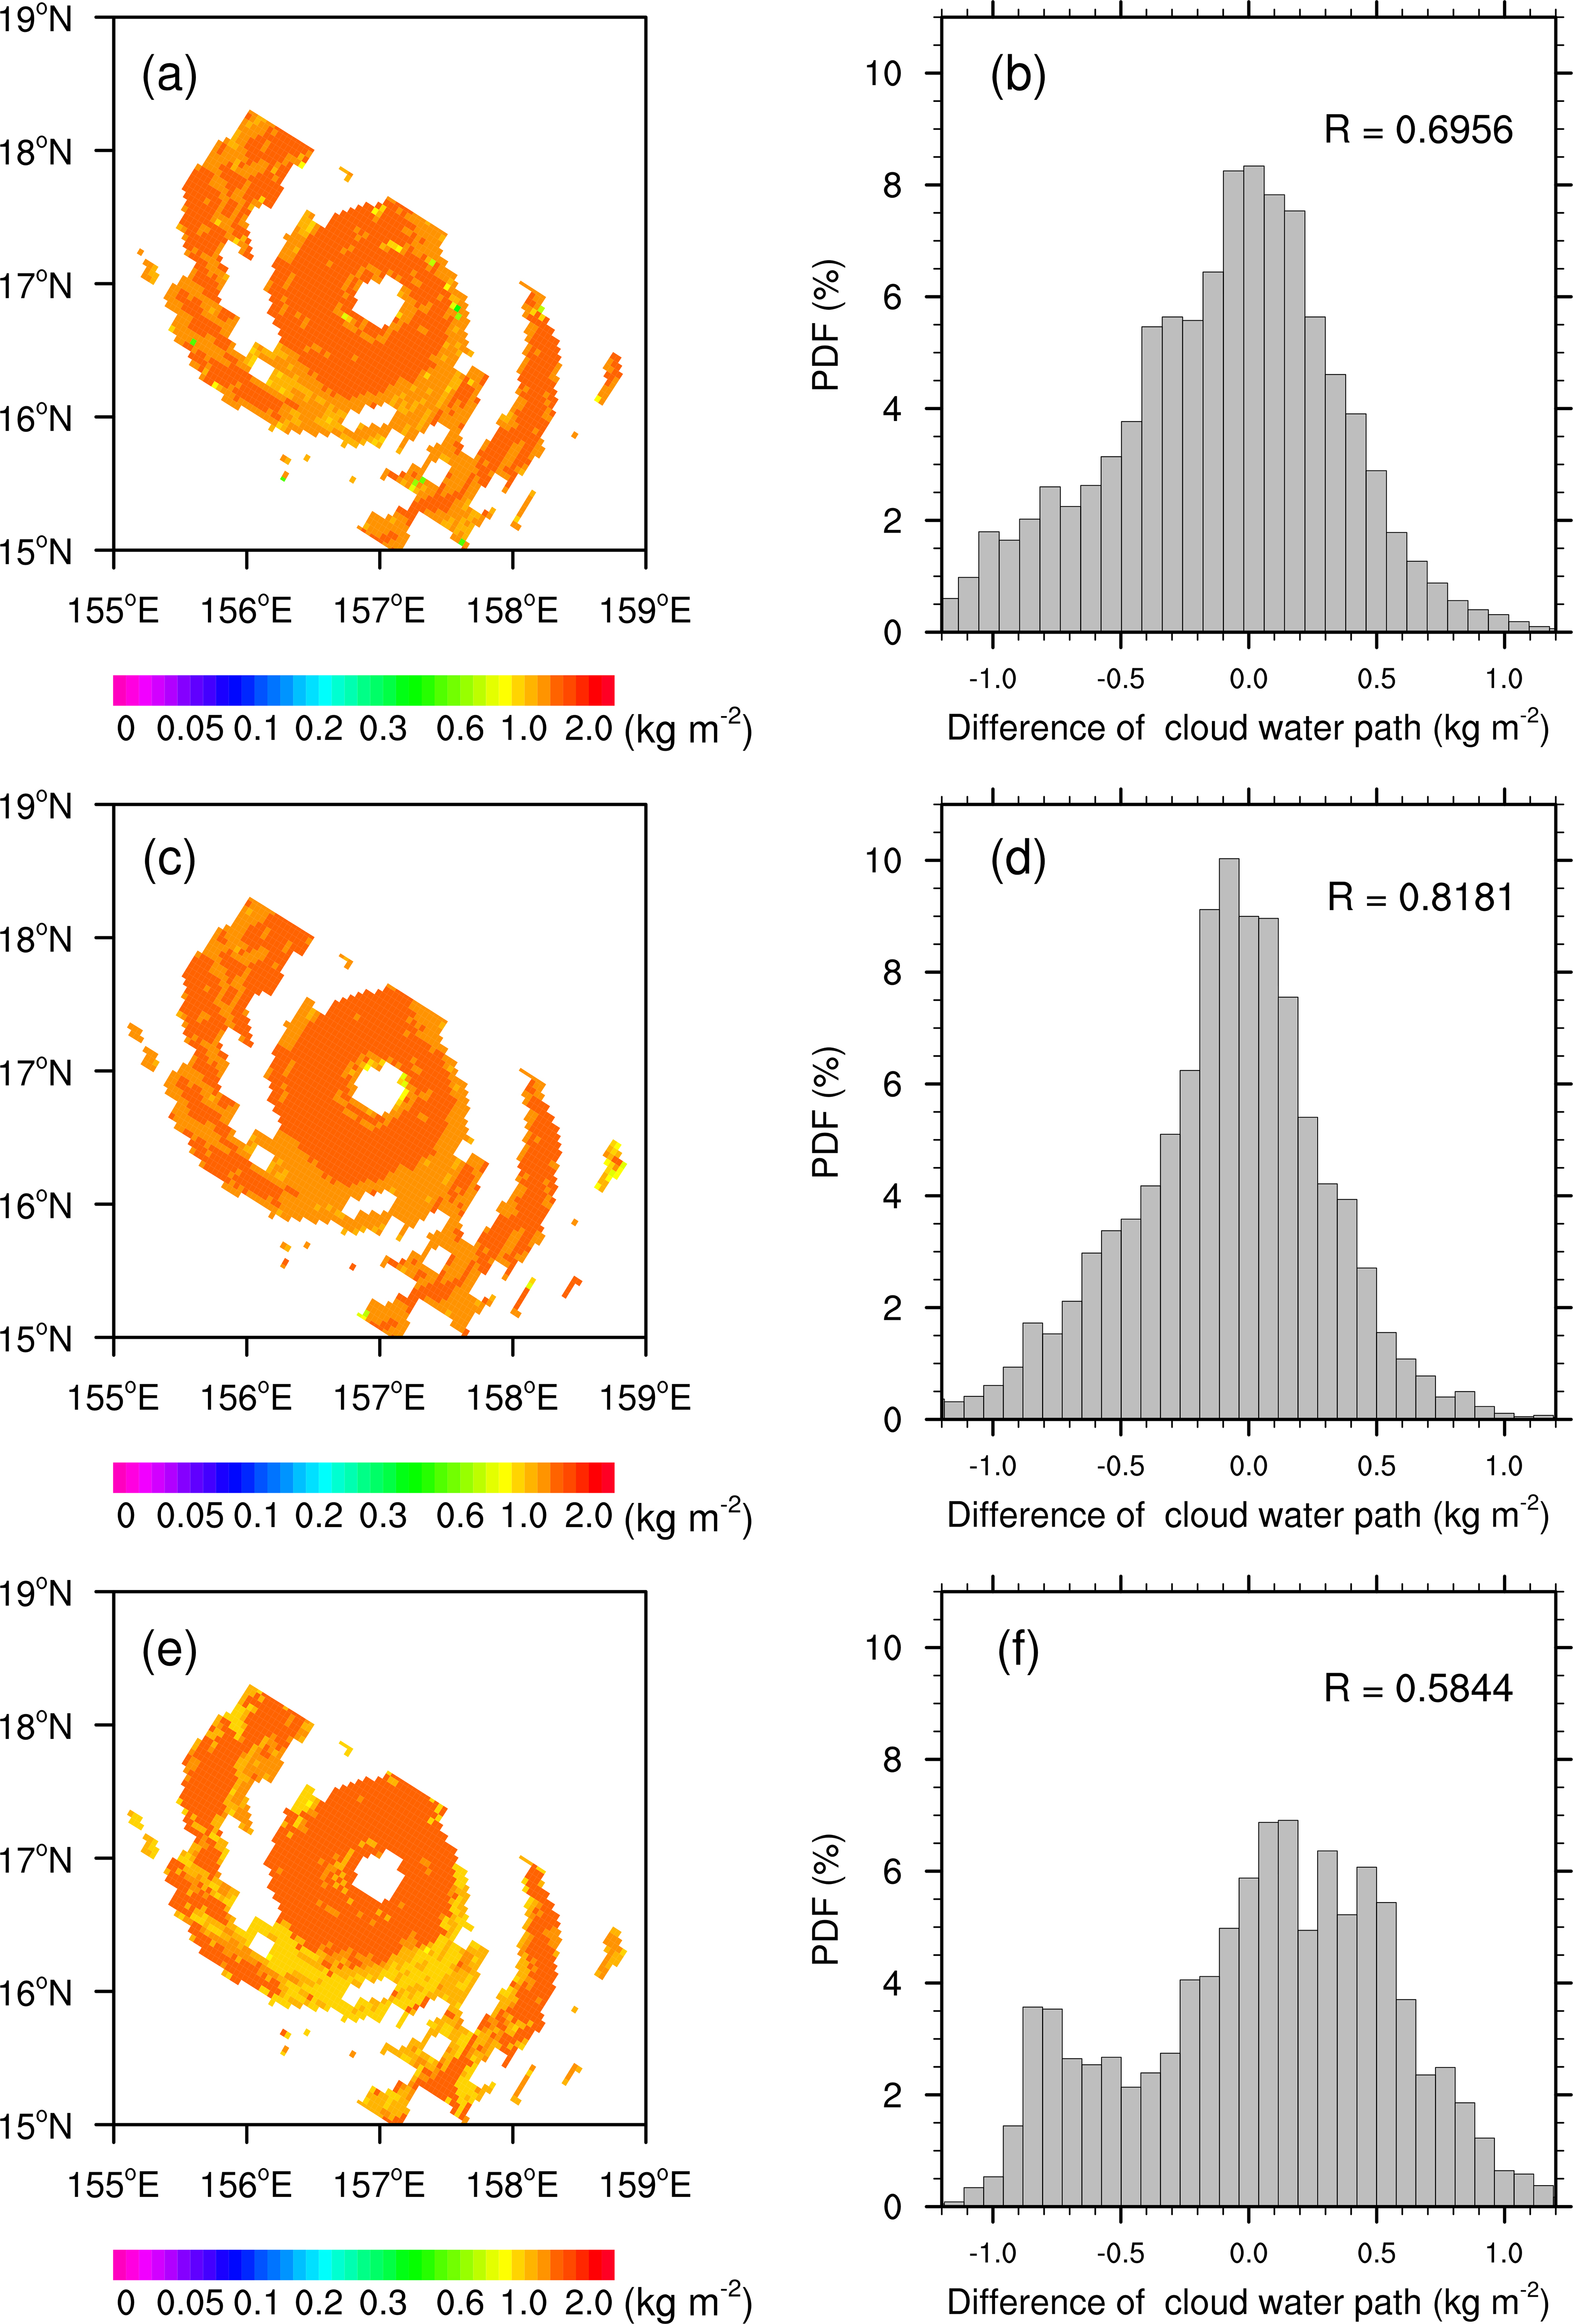
In our quadratic equation, we have established an empirical relationship between RR and CWP, which provides another way to estimate CWP from precipitation observations. In this section, we test CWP retrievals from RRs of more than 0.4 mm h−1 by applying the sigmoidal equation derived above. Figure 12 shows the distribution of RR from the TRMM PR and CWP retrieved from the TRMM VIRS (after merging) of Typhoon Podul at 0352 UTC 24 October 2001. The TC spiral cloud belt can be clearly seen, in which the CWP is greater than 1.0 kg m−2 for precipitation pixels (RR ≥ 0.4 mm h−1). We infer the CWP from Eq. (2) using the RR for the precipitation pixels (Figs. 13a, c, e) and compare the differences between the calculated and retrieved CWPs (Figs. 13b, d, f), in terms of precipitation type, precipitation cloud phase, and vertical depth of precipitation of the TCs, respectively. It can be seen that the calculated CWP is similar to the retrieved CWP, with most values exceeding 1.0 kg m−2. From the probability distribution function of the difference, they are all normally distributed, and the errors are concentrated when considering different precipitation types and precipitation cloud phases.

Figure 12. Distribution of (a) RR from TRMM PR and (b) CWP retrieved from TRMM VIRS (after merging) of Typhoon Podul at 0352 UTC 24 October 2001

Figure 13. Distribution of calculated CWP from RR (a, c, e) and the differences between TRMM VIRS−retrieved CWP and calculated CWP (b, d, f), considering different precipitation types (a, b), precipitation cloud phases (c, d), and vertical depths of precipitation (e, f). R is the correlation coefficient calculated in a 0.5° grid
In addition, the pixels were resampled to a 0.5° × 0.5° grid box, and the correlation coefficients (R) between the calculated CWP and retrieved CWP were counted and significance testing performed. The results demonstrate that the R values are about 0.6−0.8. Among them, R is the highest when considering different precipitation cloud phases, reaching above 0.8, and passing the 99% confidence test. Therefore, RR is significant indicator of the CWP.
4.1. Frequency distribution of RR and CWP
4.2. Correlation of combined parameters and precipitation
4.3. Relationship between RR and CWP
4.3.1. Precipitation type
4.3.2. Precipitation cloud phase
4.3.3. Vertical depth of precipitation
4.4. Application of the relationship
-
Knowledge of the relationship between precipitation properties and cloud microphysical properties in typhoon system is still limited because of the shortage of time- and space-synchronized data. In this study, we used a PR and VIRS collocated dataset from the TRMM satellite, as well as cloud microphysical properties retrieved using the BSR method, to obtain merged precipitation and cloud information. Typhoon Sudal was taken as an example to analyze the characteristics of the distribution of radiance, retrieved CWP, and precipitation. Furthermore, 25 collocated satellite overpasses of mature TC cases in the Northwest Pacific Ocean from 1998 to 2012 were obtained (144 515 pixels in total), and the average distribution characteristics of RR in mature TCs were analyzed using a combination of parameters. Furthermore, the relationship between CWP and RR in mature TCs with different precipitation types, precipitation cloud phases, and vertical depths of precipitation have been discussed and analyzed in detail. The results can be summarized as follows:
First, we showed that the amount of stratiform precipitation accounts for more than 80% of the total precipitation in mature TCs. Convective precipitation is mainly distributed inside the TC eyewall and outside of the spiral rainbelt, where CWP exceeds 1.0 kg m−2, and the average RR of convective precipitation is three times that of stratiform precipitation. In general, the CWP of stratiform precipitation is larger than that of convective precipitation. The highest probability of precipitation occurs when the CWP is in the range of 1−1.5 kg m−2.
Next, we showed that the trend of the average values of CWP and RR goes through three stages with increasing RR. When the precipitation is less than 1 mm h−1, the CWP grows slowly and then grows faster with increasing RR. When the RR is above 10 mm h−1, the CWP changes gradually. In other words, CWP exhibits an oblique S-type change with increasing RR and ultimately tends toward saturation.
Finally, we showed that the relationship between the CWP and RR of mature TCs with different precipitation types, precipitation cloud phases, and vertical depths of precipitation can be fitted by simple functions. The relationship was applied and tested using an independent sample to show that RR is a significant indicator of the CWP.
It should be pointed out, however, that there are several limitations in our application of CWP and RR retrievals. For instance, the inversion of cloud microphysical properties using the spectroscopy method for thick precipitation cloud is difficult, which leads to a slightly weaker relationship between RR and CWP in deep precipitation. Another limitation is that the SBDART model contains an internal parameters database for clouds composed of spherical water or ice droplets, which was computed with a Mie scattering code. However, in fact, not all precipitation clouds are spherical, and the theory of Mie scattering may induce errors. Besides, ice formation in stratiform and convective clouds are different, and this should be considered in future work.
This paper has only analyzed the correlation between CWP and precipitation, regardless of other microphysical parameters. According to previous studies, COT also has a certain effect on precipitation. Wang et al. (2019) found that the optical thickness has more indicative significance to the precipitation probability than other cloud parameters, based on a statistical analysis of hourly cloud structural characteristic parameters retrieved by the FY2E satellite and hourly rain gauge data. Stenz et al. (2016) suggested the observed precipitation area is close to the cloud optical depth, and a new rain mask algorithm incorporating both brightness temperature and cloud optical depth has been developed to reduce overestimates of precipitation in anvil regions. Liu et al. (2007b) mentioned that when COT increases or maintains large values in a period of six hours, strong precipitation will occur on the surface. A good positive relationship exists between precipitation and COT. The stronger the precipitation, the thicker the COT, or the more precipitation, the larger the optical thickness difference during the six hours. Hence, we could analyze the precipitation occurrence process based on the combined COT and CWP parameters in future work.
In addition, spaceborne spectroradiometers are unable to capture information inside the cloud, and the retrieval algorithm of cloud microphysical properties is based on merged data, which contain the measurements of the spaceborne spectroradiometer, as well as a passive microwave imager, rain radar, cloud radar, and laser radar. Therefore, this needs to be further developed to obtain not only the cloud microphysical properties near the cloud tops, but also the profiles of cloud parameters inside the cloud, which is essential to analyzing the correlation between cloud and precipitation profiles.
Acknowledgements. This work is jointly funded by the National Natural Science Foundation of China (grant no. 91837310, 41675041, 41705011), the National Key R&D Program of China (2018YFC1507200, 2017YFC1501402), the Key research and development projects in Anhui province (201904a07020099), the Third Tibetan Plateau Scientific Experiment: Observations for Boundary Layer and Troposphere (Grant No. GYHY201406001), and CLIMATE-TPE (ID 32070) in the framework of the ESA-MOST Dragon 4 program. We thank the Japan Aerospace Exploration Agency and Goddard Space Flight Center for providing the TRMM PR 2A25 and VIRS 1B01 version 7 data, as well as the Earth Observation Research and Application Center and China Meteorological Administration for providing detailed typhoon information. We are grateful for the comments from the anonymous reviewers.
 AAS Website
 AAS WeChat