


 DownLoad:


-
In recent years, the duration of persistent heavy rainfall events (PHREs) in many regions has shown a notable increasing trend (Trenberth et al., 2003; Du et al., 2019). For instance, short-duration (1–7 days) extreme precipitation events in the United States increased at a rate of 3% per decade in 1931–96 (Kunkel et al., 1999). The increased precipitation frequency for regions around the Bohai Sea Rim and South China is largely caused by the prolonged duration of rainfall events (Li et al., 2016). Compared with shorter-lived rainfall events, PHREs usually present a greater threat to human life and property. For example, severe floods due to PHREs occurred over central Europe in summer 2002, affecting more than 2 million people, with economic losses amounting to ?30 billion (Grazzini and van der Gum, 2002); and the southern Great Plains of the United States experienced PHREs in the summer of 2007, resulting in four fatalities and US$350 million in damage (Schumacher, 2011). In China, particularly in the warm season (from May to September), PHRE-related floods frequently occur, such as the famous flood over the Yangtze River Valley in 1998, which resulted a death toll of about 3,000 and direct economic losses of 250 billion yuan (US$40 billion) (Tao et al., 2001; Bei et al., 2002); and the record-breaking flood over the Yangtze–Huaihe River Valley (YHRV) in summer 2020, with direct economic losses of 179 billion yuan (US$25.8 billion) (Hou, 2020).
The climatological characteristics of PHREs are an important research topic. In China, numerous efforts have been made to further the understanding of the climatological characteristics of PHREs (Tang et al., 2006; Bao, 2007; Yin et al., 2009). For instance, Tang et al. (2006) found that during 1951–2004, PHREs tended to occur in North China, Northeast China, the Huaihe River Valley, the YHRV, the Yangtze River Valley, the southeast coastal area, and Southwest China. Bao (2007) found that PHREs in South China and in the southern area of the Yangtze River Valley showed an increase in frequency after the 1990s.
China is greatly affected by the Asian summer monsoon and its associated rainfall. Many previous studies have indicated that the summer monsoon has a large impact on the formation and evolution of rainbands in the YHRV and South China (Tao and Chen, 1987; Ding, 1992; Huang and Sun, 1992). The intensity and evolution of rainbands in the East Asian summer monsoon region are regulated by low-frequency oscillations (Lau et al., 1988). For example, intraseasonal oscillations from the tropical Indian Ocean trigger a monsoon surge in the South China Sea and southern China, and the monsoon surge then interacts with cold air from northern China to form rainstorms near the stationary front (Tao and Wei, 2007)
Floods are often caused by the occurrence of one or more PHREs, the duration of which is typically much shorter than the typical period of the intraseasonal oscillation. Some specific PHREs have been investigated in terms of the climatology and synoptic weather circulations, e.g., the PHREs during the mei-yu season of 1991, 1998, and 1999 in the YHRV (Ding, 1993; Ding and Sun, 2001; Tao et al., 2001). These studies indicated that PHREs often occur in a quasi-stationary pattern, when the synoptic scale and mesoscale systems coexist in the same area or propagate along the same paths, resulting in significant cumulative rainfall (Ding, 1993). Chen and Zhai (2014) classified the circulation patterns responsible for extreme PHREs into two types according to the stationary locations of the blocking high, and found that only the East Asia/Pacific teleconnection has the potential to independently induce PHREs, whereas other teleconnection needs to work together with the East Asia/Pacific teleconnection (Chen et al., 2019). Furthermore, a quantitative calculation of the energy conversion between systems of different scales showed that the large-scale background circulation is the main energy source that maintains the sub-synoptic and/or mesoscale systems that directly induce heavy precipitation (Fu et al., 2016, 2018). Sun et al. (2018) determined the stability mechanism of troughs and ridges in the mid-latitudes during PHREs over the YHRV based on the energy dispersion of the Rossby wave train in Eurasia, and the sources and transportation paths of cold and warm air.
The record-breaking mei-yu in the YHRV in 2020 was characterized by an early onset, delayed retreat, long duration, abundant precipitation, and unusually intensified and persistent rainfall events, which caused the worst flooding in YHRV in recent decades (Ding et al., 2021). However, how many PHREs took place in the YHRV in 2020? How unusual were the PHREs in 2020? The variation and formation mechanism of PHREs are not clear yet. The present paper will focus on following questions. What is the variation of PHREs that occurred during 1981–2020 in the YHRV? What are their major characteristics and possible formation mechanism? What are the major characteristics of the PHREs during the mei-yuseason of 2020?
The remainder of this paper is organized as follows. Section 2 describes the data and methodology used in this study. The characteristics of composite circulations and a possible mechanism for different types of PHRE and individual events in 2020 are analyzed in sections 3 and 4, respectively. The sources of cold air and water vapor for the PHREs associated with the different types of PHRE in 2020 are analyzed in section 5. The final section gives a summary and discussion.
-
In this study, PHREs in the YHRV between 1981 and 2020 were classified by utilizing the daily precipitation data from 2,420 national stations in China. The objective selection was based on the following criteria: more than 10 grids (0.25° × 0.25°) in the area with daily precipitation of more than 50 mm lasting more than 5 days with rainband coincidence in two adjacent days greater than 20% (interruption of at most 1 day is allowed) (Wang et al., 2014). Since Wang et al. (2014) used 756 national stations to identify PHREs, use of both 756 stations and 2,420 stations data were compared in this study. We found that the criteria worked well for both datasets, that chosen events from both datasets during 1981–2011 were roughly the same, and that most of the identified non-typhoon PHREs in the YHRV were consistent with the events in other studies (Chen and Zhai, 2013).
Objective pattern correlation statistics for rainbands regions (Santer et al., 1993) were used to classify the PHREs in the YHRV (Fig. 1). After eliminating the cases with correlation coefficient < |0.3|, a total of 39 PHREs were classified into three types (Table 1): rainbands in the southern part of the YHRV (type-A), rainbands in the northern part of the YHRV (type-B), and rainbands along the Yangtze River Valley (type-C). A typical rainbands for each of the three types is shown in Fig. 1. The rainbands of all three types were found to be oriented zonally, however, most of the remaining 12 rainbands were oriented meridionally, and in some cases, the centers were positioned near the western boundary of the YHRV. Four PHREs occurred in 2020 (Fig. 1), which is the only mei-yuseason during 1981–2020 that included all three PHRE types. Hu et al. (2013) used rotated empirical orthogonal function analysis to obtain three precipitation patterns to the east of 110°E, i.e., the “South” pattern, the Yangtze–Huaihe pattern, and the Yangtze pattern, which are similar to the three types of events in our study. They also revealed that the precipitation of the Yangtze pattern shows no significant relationship with that of the South pattern or the Yangtze–Huaihe pattern, acting as a more independent precipitation pattern.

Figure 1. The accumulated precipitation (shadings, mm) and corresponding standardized anomalies (black contour) of the PHREs. Typical events of (a) type-A (12–27 June 1998), (b) type-B (29 June–12 July 1991), (c) type-C (24 June–1 July 1999), and the four events that occurred in 2020: (d) 2–6 June (type-A); (e) 12–23 June (type-B); (f) 15–20 July (type-B); (g) 2–10 July (type-C). The pink rectangle indicates the YHRV.
NO Start date End date Duration (days) Type A
Events1 28 Jun 1989 4 Jul 1989 7 2 2 Jul 1992 8 Jul 1992 7 3 12 Jun 1994 21 Jun 1994 10 4 7 Jul 1997 12 Jul 1997 6 5 12 Jun 1998 27 Jun 1998 16 6 8 Jun 2000 12 Jun 2000 5 7 14 Jun 2002 18 Jun 2002 5 8 18 Jun 2005 22 Jun 2005 5 9 4 Jun 2006 8 Jun 2006 5 10 17 Jun2010 25 Jun2010 9 11 18 Jun 2014 24 Jun 2014 7 12 11 Jun 2016 18 Jun 2016 8 13 3 Jul 2019 10 Jul 2019 8 14 2 Jun 2020 6 Jun 2020 5 Type B
Events1 18 Jul 1982 22 Jul 1982 5 2 23 Jun1983 27 Jun 1983 5 3 18 Jul 1983 23 Jul 1983 6 4 2 Jul 1987 6 Jul 1987 5 5 12 Jun 1991 16 Jun 1991 5 6 29 Jun 1991 12 Jul 1991 14 7 28 Jun 1996 6 Jul 1996 9 8 14 Jul 1996 18 Jul 1996 5 9 19 Jun2000 28 Jun2000 10 10 19 Jun2002 23 Jun2002 5 11 30 Jun 2003 4 Jul 2003 5 12 6 Jul 2005 10 Jul 2005 5 13 29 Jul 2006 3 Jul 2006 5 14 5 Jul 2007 9 Jul 2007 5 15 1 Jul 2016 6 Jul 2016 6 16 12 Jun 2020 23 Jun 2020 12 17 15 Jul 2020 20 Jul 2020 6 Type C
Events1 27 Jun 1981 1 Jul 1981 5 2 4 Jul 1983 10 Jul 1983 7 3 18 Jun 1988 22 Jun 1988 5 4 30 May 1995 3 Jun 1995 5 5 20 Jul 1998 26 Jul 1998 7 6 24 Jun 1999 1 Jul 1999 8 7 7 Jun 2015 11 Jun 2015 5 8 2 Jul 2020 10 Jul 2020 9 Table 1. The classification of PHREs without the effect of typhoon over the YHRV during 1981–2020.
Composite analysis is an effective method to explore the synoptic-scale characteristics of a particular meteorological phenomenon. In this study, we applied composite analysis on the newly released daily reanalysis data from National Centers for Environmental Prediction and Department of Energy (NCEP/DOE) with a horizontal resolution of 2.5° × 2.5° (Kanamitsu et al., 2002) to analyze the composite circulation pattern of the PHREs and the individual events.
-
The HYSPLIT model (Draxler and Hess, 1998; Stein et al., 2015) was applied to reveal the trajectories of the moisture and cold air responsible for the PHREs over the YHRV. The HYSPLIT was run with the NCEP/NCAR reanalysis data available from NOAA’s Air Resources Laboratory. The dataset contains several basic fields, including the u and v components of the horizontal wind, vertical velocity, temperature, and relative humidity, that are archived every 6 h with a spatial resolution of 2.5° × 2.5° across the world.
A backward-trajectory analysis was conducted for each PHRE to trace the cold air back to its source and track the water vapor transport. The HYSPLIT model was used to calculate 240 h back trajectories for air parcels at three critical levels (500 m, 1500 m and 3000 m) over the YHRV region (27.5°–35°N, 112.5°–122.5°E) at 6 h intervals. The cluster technique was used to minimize the intra-cluster differences among trajectories while maximizing the inter-cluster differences, to extract patterns that help to understand the major features. The clustering of trajectories is based on the total spatial variance method (Draxler, 1999), and the optimal number of clusters is determined by calculating the sum of all clusters’ total spatial variance for all the possible number of clusters until the total variance of the individual trajectories about their cluster mean starts to increase substantially (Stein et al., 2015).
The total moisture supply contribution is calculated as
where m is the number of trajectories in each cluster, n is the total number of trajectories in all clusters, and qit is the specific humidity of the air parcel at each time step along each trajectory (240 for the 240 h backward tracking in this study).
-
Quasi-stationary Rossby wave propagation associated with the PHREs was analyzed by applying the wave-activity flux defined by Takaya and Nakamura (2001). This flux is independent of the wave phase and is parallel to the local group velocity of a stationary Rossby wave train in the Wentzel–Kramers–Brillouin approximation, indicating the energy propagation direction. The wave-activity flux W, defined in the log-pressure coordinate, can be expressed as
where
$ \psi ' $ denotes the perturbation geostrophic stream function,${\boldsymbol{u'}} = \left( {u',v'} \right)$ is the perturbation geostrophic wind velocity,${\boldsymbol{U}} = \left( {u,v} \right)$ is a horizontal basic flow velocity,$ p $ is the pressure in hPa,$ {R_{\text{a}}} $ is the gas constant of dry air,$ {H_0} $ is the constant scale height,$ {N^2} $ is the Brunt–Väisälä frequency, and$ T' $ is the perturbation temperature. The flux is useful for illustrating a “snapshot” of a packet of stationary Rossby waves propagating through the zonally asymmetric westerlies. By applying the flux, the dynamics of the summer blocking high over East Asia (Nakamura and Fukamachi, 2004; Shi et al., 2016) and the summer Pacific–Japan teleconnection pattern (Kosaka and Nakamura, 2006) have been investigated through composite analyses. Bueh et al. (2008) and Zong et al. (2014) also used this flux to discuss the possible mechanisms of the snowy and rainy weather processes in South China in January 2008. In the evaluation of composite energy propagation, anomalies associated with the PHREs are regarded as stationary Rossby waves embedded in the climatological mean in three dimensions for the same periods over the 30 years (from 1981 to 2010). However, for the evolution of energy propagation in an individual event, the 31-day running-mean field is regarded as the basic state in which stationary Rossby waves are embedded, and the 5-day low-pass anomalies are regarded as the wave-associated fluctuations. -
A total of 39 PHREs, which occurred from June to August in 1981–2020, were classified into the three types (Table 1): 14 type-A, 17 type-B, and 8 type-C. The number of type-C events was less than that of type-A or type-B. The type-B events (late June to mid-July) occurred later than type-A events (from early June to mid-June). Generally, the rainband during warm season in east China gradually moved from South China to North China because of the advance or retreat of the summer monsoon. Since Type-B rainbands are located to the north of Type-A, most of the Type-B events occurred later than Type-A. There were 9 events and 16 events in the 1980s and 1990s, respectively, whereas in the 21st century, there were 13 events and 8 events in the 2000s and 2010s, respectively. We can see that the number of PHREs peaked in the 1990s, including three severe flooding years of 1991 (two type-B events), 1998 (one type-A event and one type-B event), and 1999 (one type-B event and one type-C event) (Ding, 1993; Ding and Sun, 2001; Tao et al., 2001). It seems that type-B events occurred more frequently in flooding years. Moreover, in the first year of the 2020s, 5 PHREs occurred during the long-last record-breaking mei-yu season, which is the highest yearly number of events in recent 40 years (Fig. 2). In the past 40 years, the annual number of PHREs in most years is less than 3 events, and in fact, more than 3 events have occurred in only 5 years. The total duration of all PHREs in 2020 is more than 30 days, but that of the other years is less than 25 days. Therefore, we first investigate the composite circulation characteristics and possible formation mechanism of the three types PHRE without the events in 2020, and then reveal the specific circulation characteristics of the four PHREs in 2020.
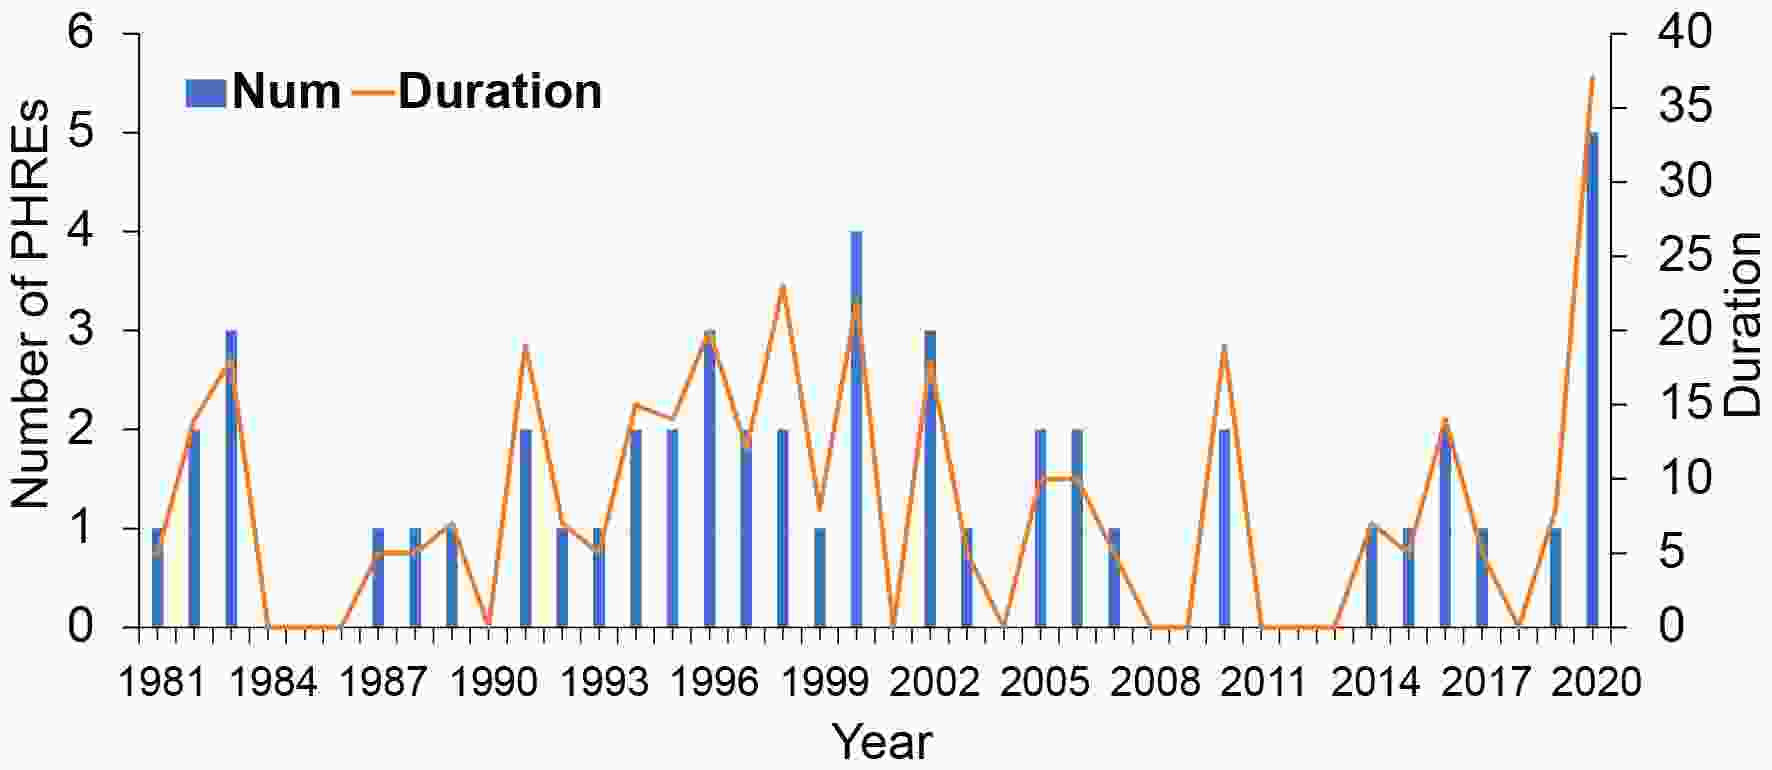
Figure 2. The number of PHREs (bar, left coordinate, units: number) and the total duration (line, right coordinate, units: days) from 1981 to 2020.
-
The 14 type-A PHREs persisted for 5–16 days (Table 1). Two PHREs that occurred in 1994 and 1998 persisted for 10 and 16 days, respectively, and induced severe flooding (Sun and Zhao, 2000; Tao et al., 2001; Bei et al., 2002). In general, the maximum accumulated precipitation amount of each event varies from 200 to 500 mm and the corresponding normalized mean daily precipitation anomalies are 3.0–5.0 (not shown).
Figure 3 shows the composite standardized anomalies of the mean 200 hPa and 700 hPa geopotential height for the three types of PHRE excluding the events in 2020. It is found that positive and negative anomaly centers of geopotential height at 200 hPa originate from the eastern North Atlantic, the Mediterranean, the Caspian Sea, the Iranian Plateau, the Mongolian Plateau to the YHRV, and the western Pacific Ocean (Fig. 3a), which are aligned along the westerly jet with composite wind speeds greater than 25 m s−1 in the upper troposphere. The synoptic systems successively along the westerly jet are: the ridge over the eastern North Atlantic, the trough over the Mediterranean, the ridge from the Ural Mountains to the Caspian Sea, the trough from the Iranian Plateau to Lake Balkhash, the ridge from the Tibetan Plateau to Lake Baikal, and the trough from the YHRV to the Japan Sea, which all correspond to the centers of standardized anomalies. The positive and negative anomalies along the westerly jet correspond to the development of these ridges and troughs, respectively (Fig. 3a). The composite South Asian high (SAH) extends from North Africa to the South China Sea, and the 12 560 gpm contour for the eastern edge of the SAH is 10° to the east of the climatological contour. There is a significant cyclonic circulation anomaly to the south of the Aleutian Islands in the middle and lower troposphere (Fig. 3b), which depicts an enhanced mid-ocean trough. To the south of the mid-ocean trough, the western Pacific subtropical high (WPSH) extends farther westward than the climatic conditions (Fig. 3b).

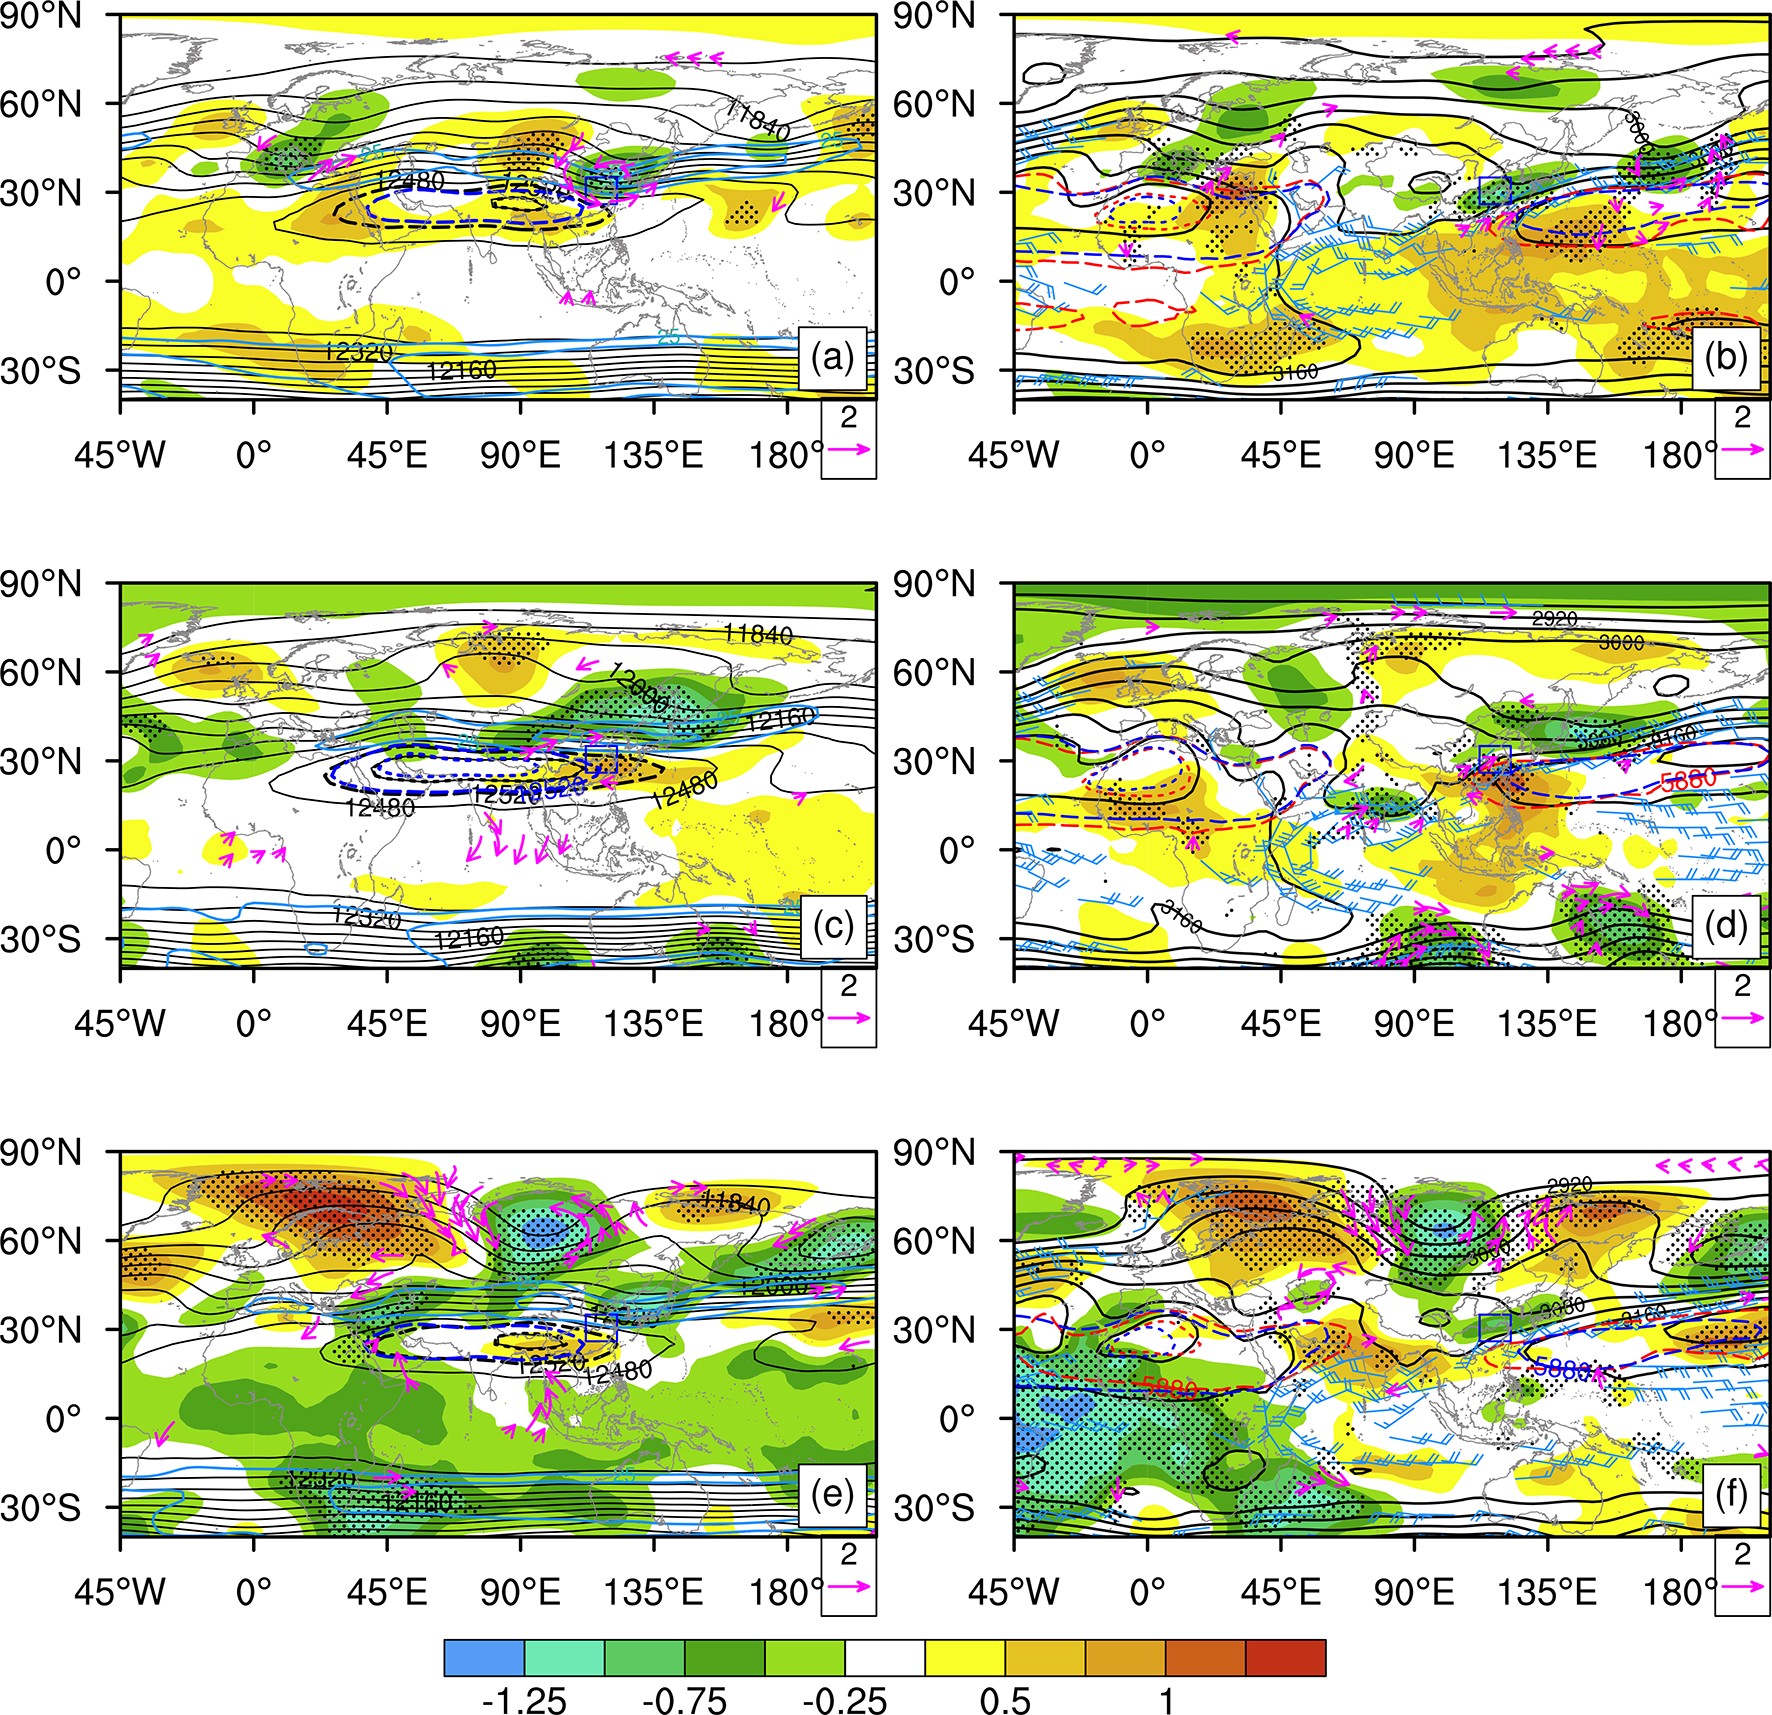
Figure 3. Composite maps (excluding the events in 2020) of geopotential height (black contours, gpm) and corresponding standardized anomalies (shadings) at (a, c, e) 200 hPa (the black and the blue dashed lines are the 12 520−12 560 gpm isolines of PHREs and corresponding climatological means respectively; the light blue solid lines indicate the upper level jet), and at (b, d, f) 700 hPa (the red and the blue dashed in lines are the 5880−5920 gpm isolines of PHREs and corresponding climatological means at 500 hPa respectively; the blue wind barb represents the low-level jet 850 hPa, full barb: 4 m s−1) for type-A (a, b), type-B (c, d), and type-C (e, f) PHREs. Blue solid boxes indicate the YHRV. Dots and pink arrows areas show the height and wind anomalies, respectively, that are significant at the 95% confidence level based on a t-test.
The cyclonic anomalous wind field centered over the YHRV corresponds to the cyclonic disturbance along the westerly jet (Fig. 3a) at 200 hPa and the negative geopotential height anomaly in the southern areas of the YHRV in the mid–lower troposphere (Fig. 3b), which exhibits an equivalent-barotropic synoptic structure. Moreover, in the lower troposphere (Fig. 3b), the southwesterly low-level jet is located south of the critical system, coupled with cyclonic wind perturbation around it. The geopotential height anomalies also indicate intensification of the subtropical high in the Southern Hemisphere (Fig. 3b). In particular, the Somali cross-equatorial jet tends to intensify with the development of the Mascarene high in the subtropical regions in the Southern Hemisphere.
Chang (1999) revealed that downstream development along the waveguide is a general characteristic of synoptic-scale waves in the mid-latitudes. Tao and Wei (2006) demonstrated that the advance or retreat of the subtropical high is caused by the propagation of the stationary Rossby waves along the subtropical westerly jet in the upper troposphere, forming a long-wave ridge or trough along the coast of China; meanwhile, the subtropical high advances northwestward or retreats southeastward. To represent the three-dimensional propagation of the composite Rossby wave trains in each type of PHRE, we utilized the phase-independent wave-activity flux formulated by Takaya and Nakamura (2001).
The equivalent-barotropic structure in the troposphere for stream function anomalies over Eurasia and a particular wave packet can be traced with the wave-activity flux involved in the maintenance of the type-A PHREs (Fig. 4a, b). The successive divergence and convergence centers of the wave-activity flux along the wave packet reveals the downstream energy dispersion mechanism (Enomoto et al., 2003; Nakamura and Fukamachi, 2004). The eastern North Atlantic (the British Isles) shows a strong horizontal divergence center of wave-activity flux in the upper troposphere (Fig. 4a). Most of the wave-activity flux vectors associated with the wave train downstream of this region are oriented southeastward, with an eastward turn near the convergence region around the Mediterranean, where strong convergence is associated with the negative stream function anomaly center. The accumulated wave-activity energy is favorable for intensification of the trough there (Fig. 3a), which persists for the next few days. Meanwhile, the wave train propagates along the westerly jet across the Eurasia until it splits into two branches. The northern branch propagates northeastward through Lake Baikal and finally converges over the YHRV, merging with the southern branch of the flux which moves southeastward (Fig. 4a). The convergence center of the flux corresponds to the trough and the negative anomaly center extending throughout the entire troposphere (Fig. 3a, b). Some previous studies have shown that upper-tropospheric waves have two waveguides over Asia, one from the northwest over Siberia and the other from the southwest along the subtropical jet across southern Asia (Chang and Yu, 1999; Hoskins and Hodges, 2002). Our analysis is partly consistent with those works, for the northern waveguide breaks over the Western Siberia in this study. In addition, the wave-activity fluxes associated with the wave train in the middle troposphere are consistent with those in the upper troposphere; however, due to the barrier of the Iranian Plateau and the Tibetan Plateau, the associated Rossby wave flux is blocked over these areas in the mid–lower troposphere and cannot disperse to the YHRV consecutively (not shown).
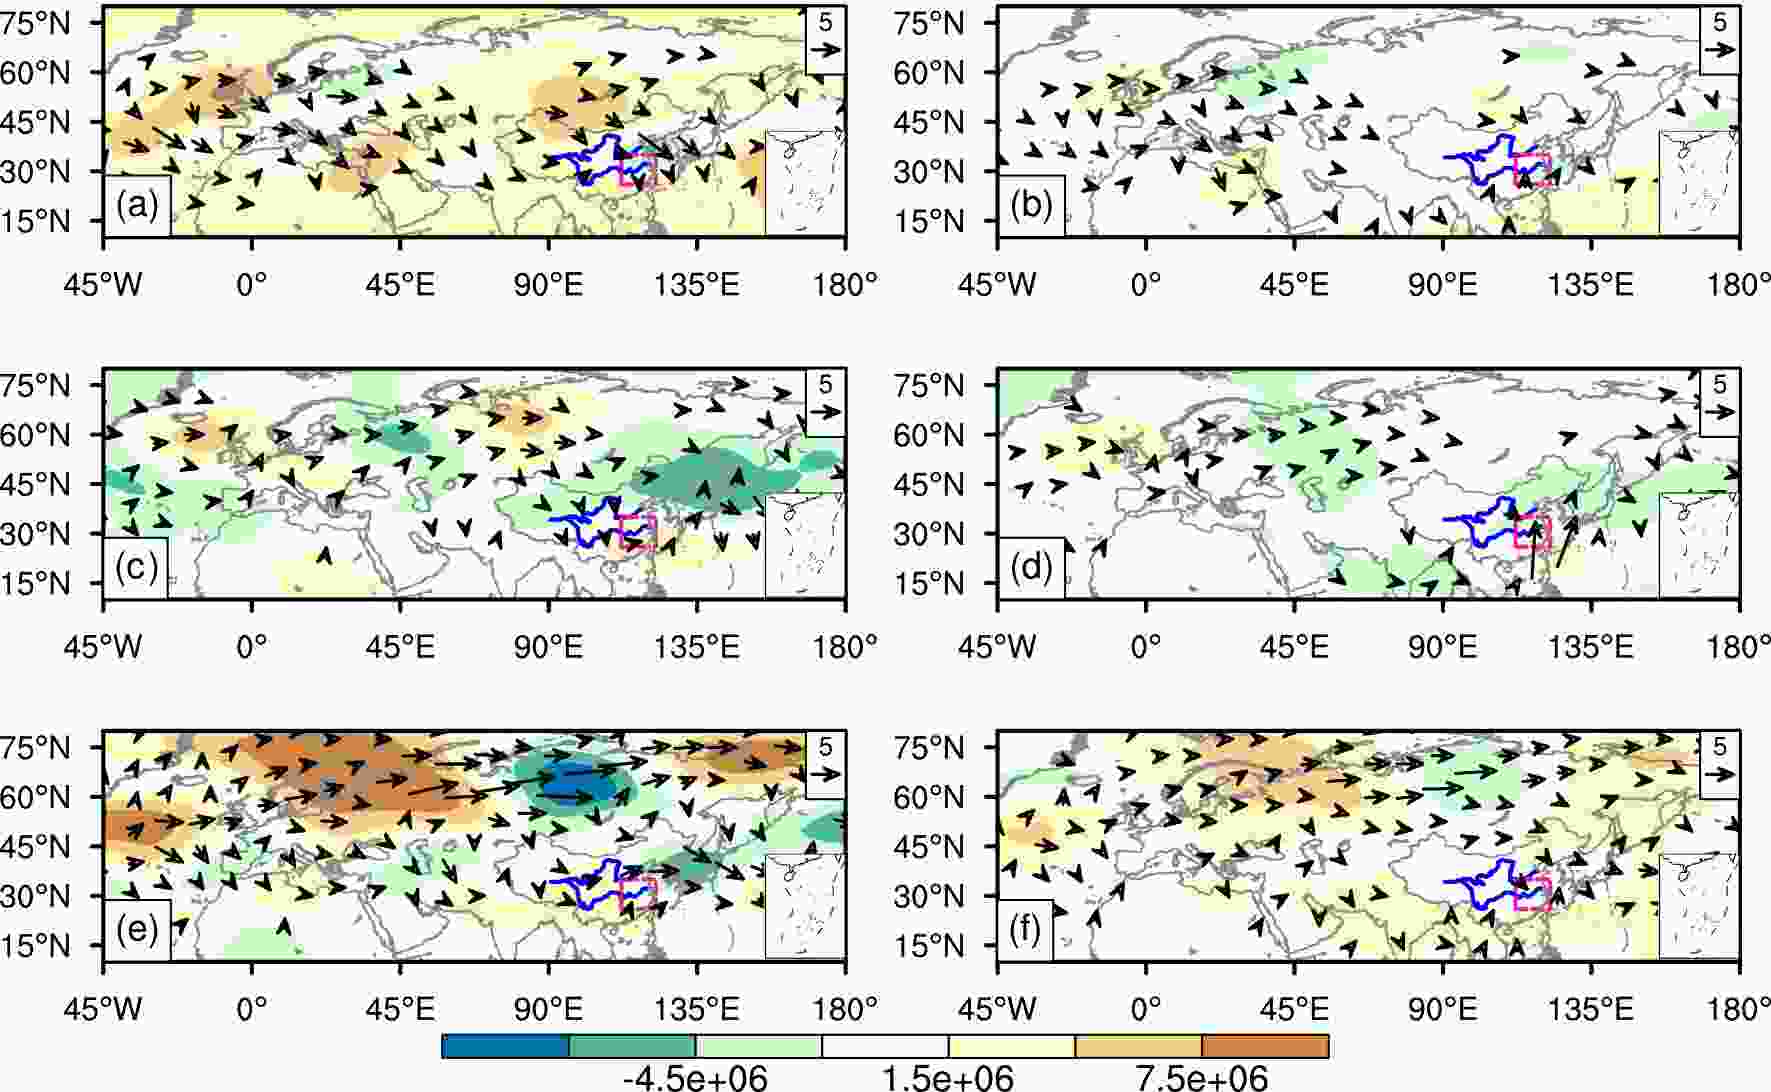
Figure 4. Composite horizontal component of wave-activity fluxes (arrows, m2 s−2) and corresponding stream function anomalies (shadings, m2 s−1) at 300 hPa (a, c, e) and at 700 hPa (b, d, f) for type-A (a, b), type-B (c, d), and type-C (e, f) PHREs.
Besides the zonal waveguides in the high–middle latitudes, the northward wave-activity energy propagation from the western Pacific in the mid-lower troposphere also converges over the southern part of the YHRV (Fig. 4b). The composite vertical profiles of wave-activity fluxes over the YHRV (not shown) reveal that the convergence region over the YHRV extends throughout the entire troposphere, with two strong convergence centers at 300 hPa and 700 hPa respectively. Therefore, the evolution and maintenance of the disturbance over the southern area of the YHRV is related to both zonal and meridional wave packets in type-A PHREs.
The above analysis indicates that the main characteristics of the composite circulation of type-A PHREs are as follows. There are successive anomalous centers of geopotential height along the westerly jet corresponding to the anomalous troughs and ridges over the Eurasian continent in the upper–middle troposphere, which are favorable for the invasion of cold air from the mid–high latitudes to the YHRV. In particular, the anomalous cyclonic disturbance inducing an intensified frontal perturbation over the YHRV in the lower troposphere is the critical synoptic system of type-A PHREs. In addition, the WPSH extends westward, the SAH extends farther eastward, and the Mascarene High is stronger than the climatic conditions. The intensity and location of these subtropical highs influence the convective activities over adjacent regions and moisture transportation to the YHRV.
The wave-activity flux divergence is a strong energy source over western North America, the eastern Atlantic, Europe, and parts of Asia, and the energy flux clearly acts to redistribute baroclinic wave energy from the regions where it is generated to downstream regions (Chang et al., 2002). Enomoto et al. (2003) revealed that the Bonin high near Japan in summer is formed as a result of the propagation of stationary Rossby waves along the Asian jet in the upper troposphere (the Silk Road pattern). Hsu and Lin (2007) showed that the tripole rainfall pattern in East Asia is closely related to the Silk Road pattern and the Pacific–Japan pattern. The results from our study suggest that the type-A PHREs are associated with wave-energy propagation in two directions: the zonal waveguide along the subtropical westerly jet in the mid–upper troposphere, and the northward propagation from the western Pacific in the mid–lower troposphere. However, the detailed impact of the zonal and meridional wave packets on the PHREs and their interaction will be discussed in future work.
-
The 17 type-B PHREs persist for 5–14 days (Table 1). The two longest type-B PHREs occurred in 1991 and 2020, persisting for 14 and 12 days, respectively, and induced severe flooding (Ding, 1993; Ding et al., 2021). The maximum accumulated precipitation amount from these events varies from 200 to 700 mm and the corresponding normalized mean daily precipitation anomalies are 3.0–5.0 (not shown). The event in 1991 had the longest duration and the largest total precipitation of more than 700 mm.
At high latitudes, the positive and negative anomaly centers of the geopotential height at 200 hPa originate from the northeast Atlantic Ocean, and propagate to eastern Europe, then the Ural Mountains, the Mongolian Plateau, finally arriving in the YHRV and the northwestern Pacific Ocean (Fig. 3c). Moreover, the geopotential height at high, middle, and low latitudes shows positive, negative, and positive zonally anomalous features at 200 hPa over the Asian continent to the east of 60°E (Fig. 3c). The upper-level jet and relatively straight mid-latitude flow is conducive to the cold air flowing southward to the northern part of the YHRV. Compared with the characteristics of type-A events, the WPSH extends more westward and northward, and the SAH extends farther northward. The subtropical SAH and WPSH propagate in opposite directions, and the low-level jet causes the southwesterly warm, humid air flowing northward to converge with the cold air in the northern part of the YHRV.
The wave-activity flux along the northern branch of the zonal-jet waveguide in type-B events is stronger than that of type-A events, but the southern branch of the zonal-jet waveguide is very weak and could not be recognized. However, the meridional waveguide in the mid–lower levels is stronger than that of type-A events (Fig. 4). The Rossby wave-activity flux in the mid–upper troposphere propagates in the mid–high latitudes of Eurasia, and part of the energy is intercepted on the eastern side of the Urals, resulting in energy accumulation, which helps to strengthen and maintain the abnormal development of the Ural blocking high (Fig. 3c). In addition, part of the energy continues to disperse to the mid-latitudes, and finally is intercepted over the region of the Sea of Japan and the northern part of the YHRV, which results in strengthening of the negative anomaly center of the mei-yu trough (Fig. 4d). At the same time, the energy of the Rossby wave in the mid–lower troposphere disperses northward from the subtropical regions, which intensifies the negative anomalous center over the Sea of Japan and the northern part of the YHRV. In addition to the above-mentioned differences related to the Rossby wave train, the subtropical jet of type-B events is approximately 5°N farther north than that of type-A events. Correspondingly, the SAH in the upper level and the WPSH in the mid–lower levels on the south side of the jet are located farther north than those of type-A events.
-
The 8 type-C PHREs persisted for 5–9 days (Table 1), and there were no events lasting more than 10 days. Two PHREs that occurred in 2020 and 1999 had 9 and 8 persistent days, respectively, and induced severe flooding (Ding and Sun, 2001; Chen et al., 2020). The maximum accumulated precipitation amount of each event varies from 200 to 500 mm and the corresponding normalized mean daily precipitation anomalies are 3.0–5.5 mm (not shown). The event in 1999 had the longest duration and the largest total precipitation of more than 500 mm (Fig. 1).
Figures 3e and f shows the standardized anomalies of the mean 200 hPa and 700 hPa geopotential height of all type-C events excluding the events in 2020. Figures 4e and f shows the corresponding composite horizontal component of wave-activity fluxes and stream function anomalies. The composite circulation of type-C events is the typical “two ridges and one trough” over the high latitudes of the Eurasian continent (Fig. 3e). The two ridges are located in northern Europe, and from northeast China to the coastal area of Siberia. This circulation pattern in the mid–high latitudes is basically consistent from the low-levels to the high-level troposphere (Fig. 3e, f), and is the typical circulation pattern of the mei-yu season (Tao et al., 1980; Ding, 1993). The relatively straight upper-level jet in the mid-latitudes is similar to that of type-B events, which is conducive to the continuous penetration of cold air to the Yangtze River region. The location of the SAH is abnormally eastward, whereas that of the WPSH is abnormally westward, and the north–south location is between type-A and type-B events. However, the anomalous intensity of the WPSH and the trough of the rainfall area are weaker than those of type-A and type-B events. In other words, the significant anomaly signal of type-C circulation appears in the high-latitude regions. The wave-activity flux transport along the northern branch of the zonal-jet waveguide of type-C is much stronger than that of type-A and type-B events, and the southern branch of the zonal-jet waveguide is very weak and could not be discerned. However, the meridional waveguide in the middle–lower layers is weaker than that of type-A and type-B events (Fig. 4). The stronger wave-activity flux transport results in the meridional development of “two ridges and one trough” in the high latitudes of the Eurasian continent.
-
On the basis of the definition of a PHRE in the present study, four classified PHREs (Table 1) were selected during the mei-yu season of the YHRV (1 June–2 August) in 2020: 2–6 June (case 1, type-A), 12–23 June (case 2, type-B), 15–20 July (case 3, type-B), and 2–10 July (case 4, type-C). The total precipitation of the four PHREs is shown in Fig. 1. The stable and long duration of cases 2 and 4 resulted in a large amount of precipitation and flooding in 2020 (Chen et al., 2020).
Case 1 (type-A) in 2020 had the shortest duration (5 days) and the least precipitation among the four PHREs in 2020. The composite synoptic circulation of case 1 is basically consistent with that of the composite characteristics of all type-A events (Figs. 3a, b, and 5–7a), with weaker meridional circulation in the mid–high latitudes and stronger disturbance with the westerly jet , but the location of the SAH is not abnormally eastward (Fig. 5a). The two type-B PHREs in 2020 have the same meridional distribution (i.e. positive, negative, and positive center in turn from high to low latitudes) of geopotential height anomalies (Figs. 5b, c) as composite type-B events (Fig. 3b). However, in the high latitudes, there is a ridge from eastern Siberia to the Sea of Okhotsk, and there is a broad trough over Lake Baikal. The westerly jet and mid-latitude flow are relatively straight, which is conducive to the cold air flowing southward to the northern part of the Yangtze River region. One of the mid–high latitude ridges for case 3 is located in the Ural Mountains, which is consistent with the composite type-B events (Figs. 5c and 6c), but the corresponding ridge of case 2 is located to the west of the Ural Mountains (Figs. 5c and 6b). The location of the SAH in case 2 and case 3 moved eastward as in type-B events (Fig. 5b, c), and the SAH of case 2 is much stronger and farther eastward than in case 3. The conspicuous westward WPSH controls the pattern over southern China (Fig. 6b, c) and causes the southwesterly warm, humid air flow northward to converge with the cold air in the northern part of the YHRV (Fig. 7b, c). The composite mid–high latitude circulation of type C is “two ridges and one trough” in the mid–upper troposphere (Fig. 3e, f), but this feature in case 4 is weaker than in the composite circulation of type-C events, especially the ridge in the coastal region of northeast Asia (Figs. 5–6d).
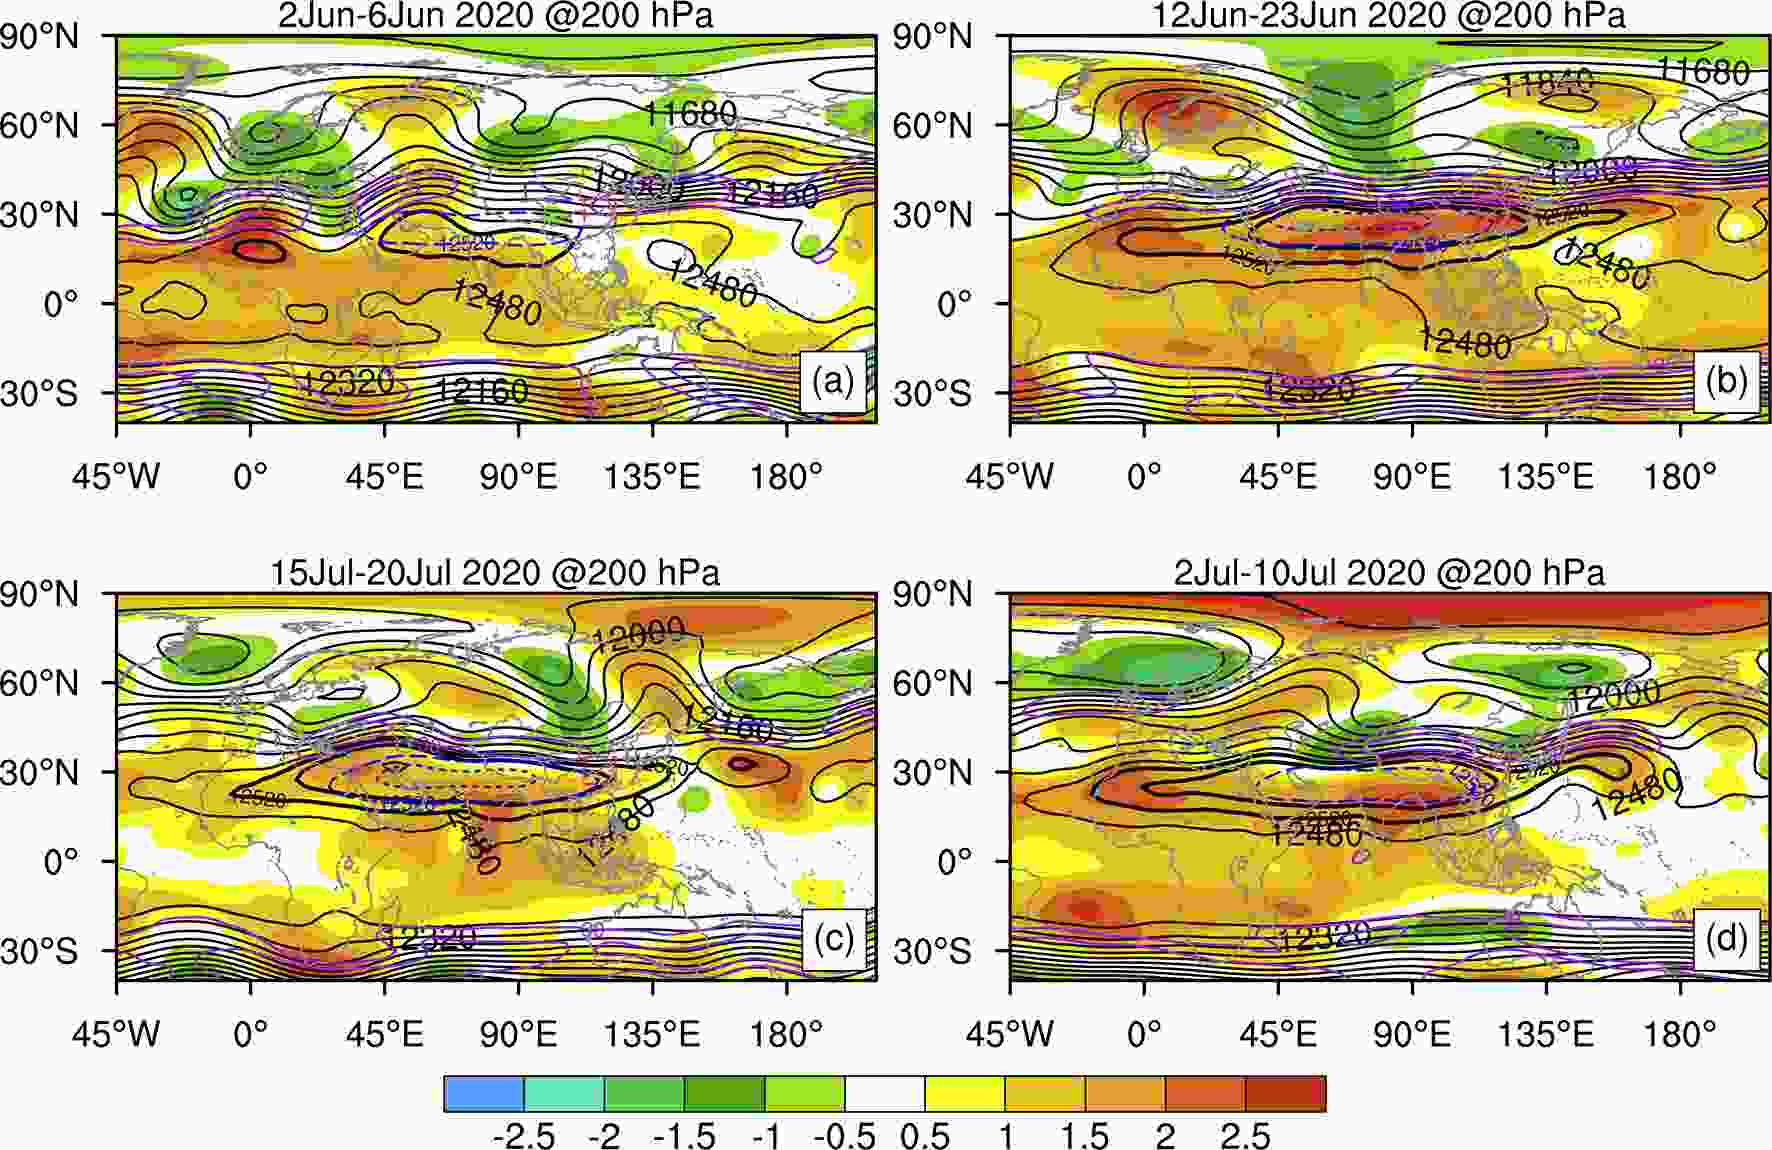
Figure 5. Composite maps of geopotential height (black contours, gpm) and corresponding standardized anomalies (shadings) at 200 hPa for PHREs in 2020. The black thick lines and the blue dashed lines are the 12 520 and 12 560 gpm isolines of the event and corresponding climatological mean, respectively. The purple solid lines indicate the upper-level jet (wind speeds ≥30 m s−1) at 200 hPa. The pink dashed boxes indicate the YHRV. (a) 2–6 June (case 1, type-A), (b) 12–23 June (case 2, type-B), (c) 15–20 July (case3, type-B), and (d) 2–10 July (case 4, type-C).

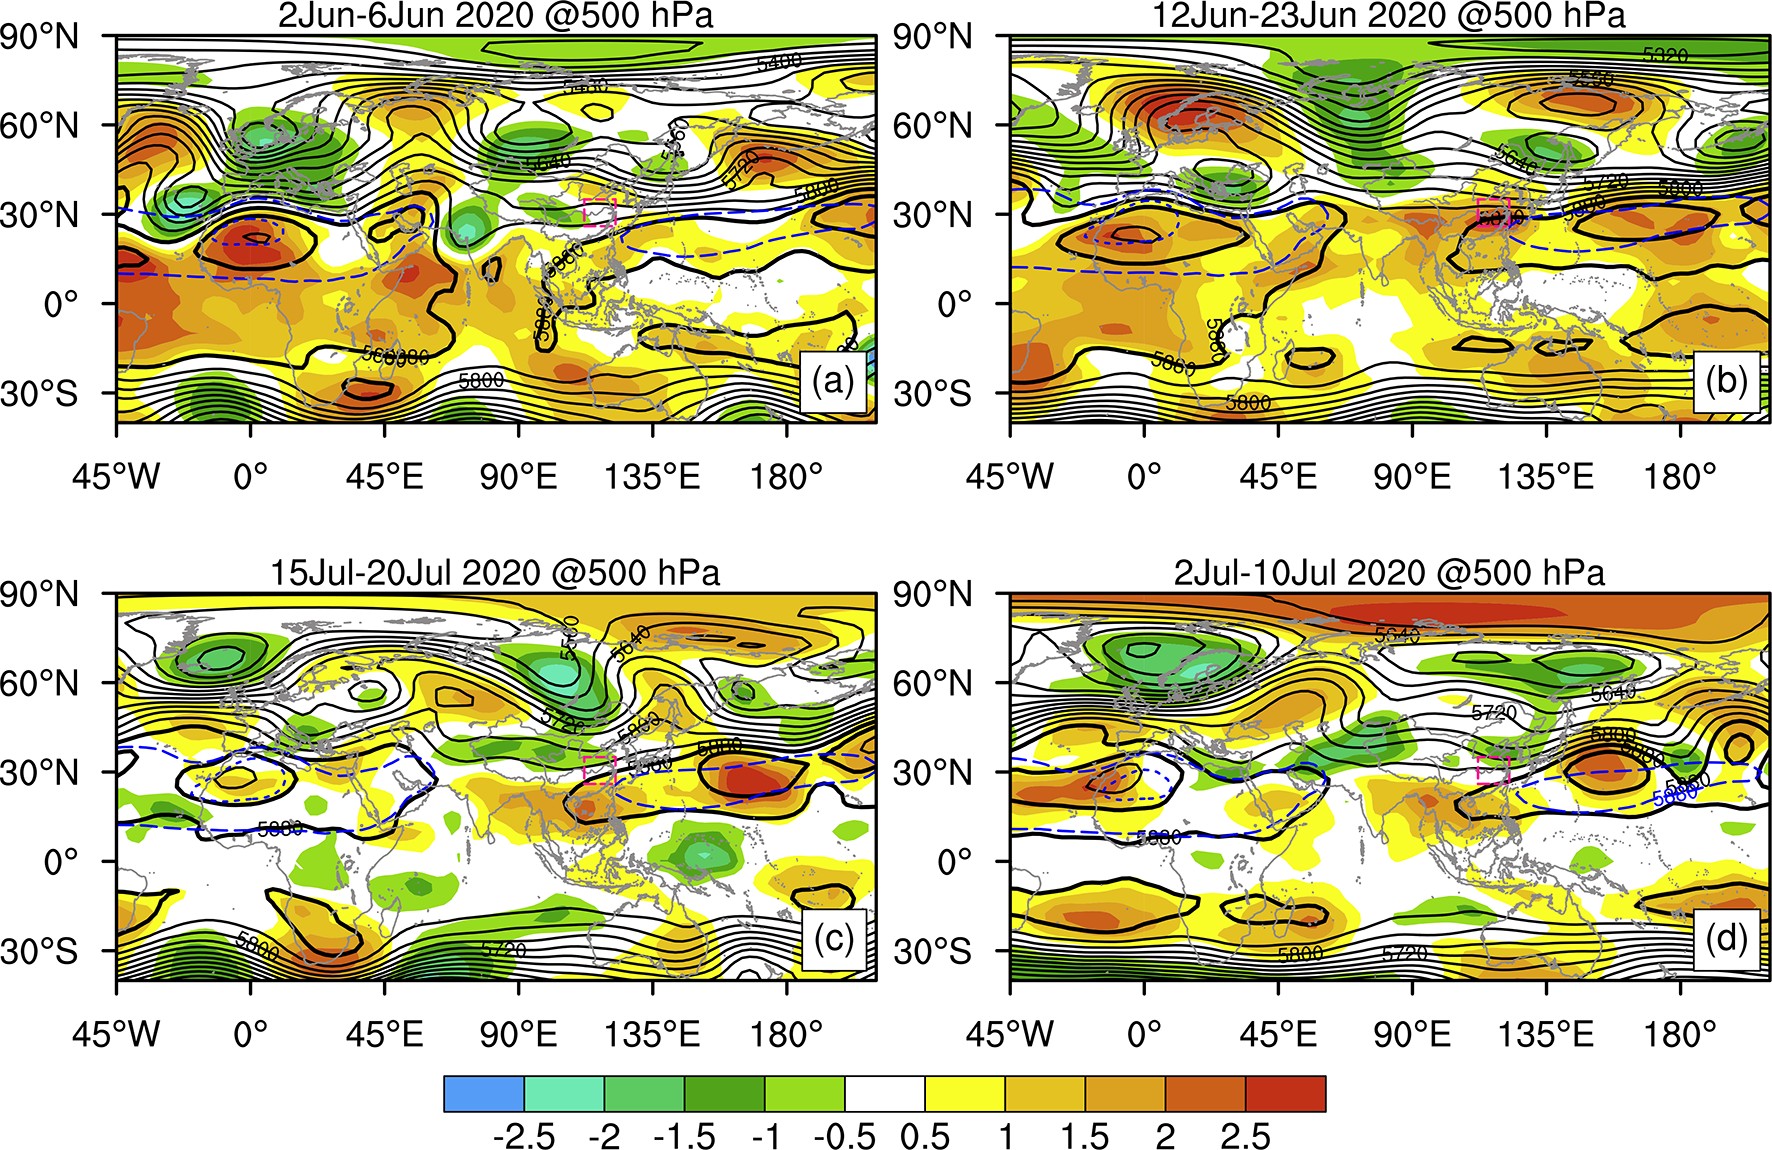
Figure 6. Composite maps of geopotential height (black contours, gpm) and corresponding standardized anomalies (shadings) at 500 hPa for PHREs in 2020. The black thick lines and the blue dashed lines are the 5880 and 5920 gpm isolines of event and corresponding climatological mean, respectively. The pink dashed boxes indicate the YHRV. (a) 2–6 June (case 1, type-A), (b) 12–23 June (case2, type-B), (c) 15–20 July (case3, type-B), and (d) 2–10 July (case 4, type-C).
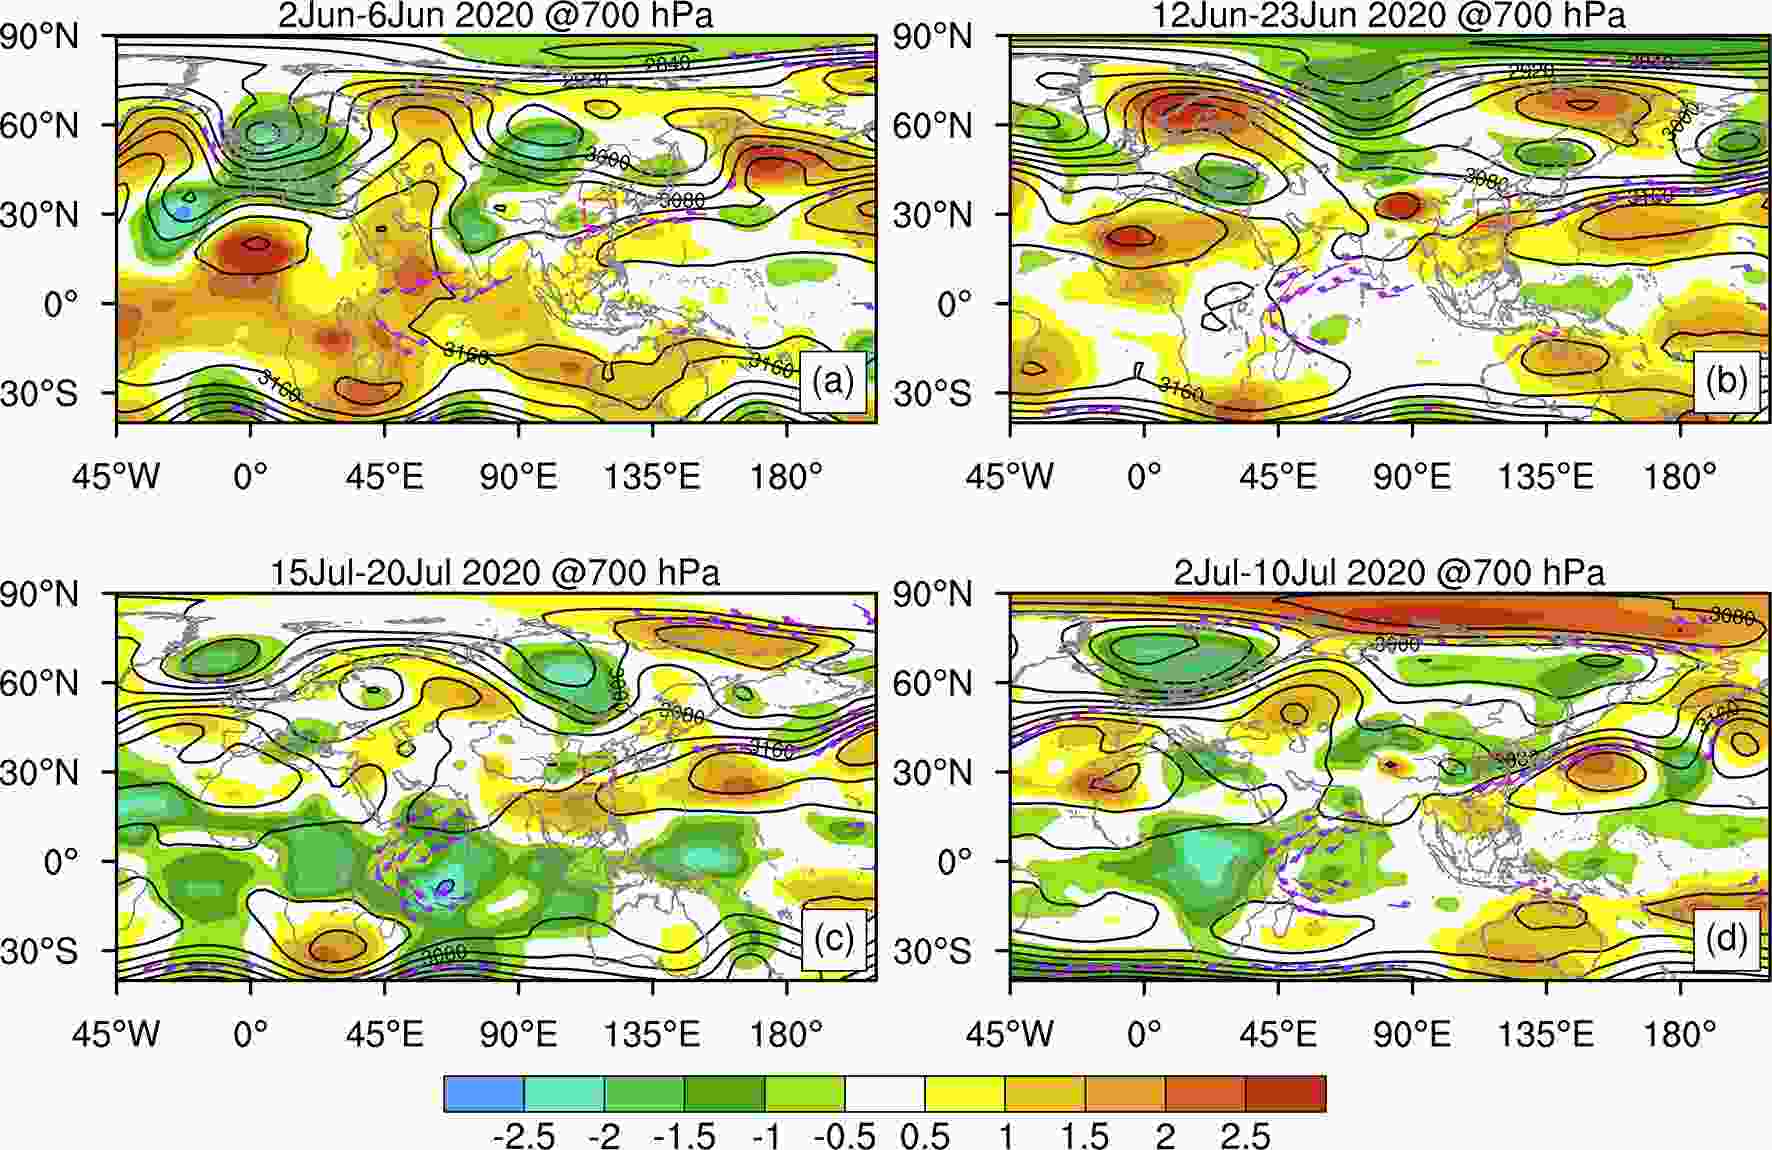
Figure 7. Composite maps of geopotential height (black contours, gpm) and corresponding standardized anomalies (shadings) at 700 hPa for PHREs in 2020. The purple wind barb represents the low-level jet 850 hPa (plotted for wind speeds ≥12.0 m s−1, full barb: 4 m s−1). The pink dashed boxes indicate the YHRV. (a) 2–6 June (case 1, type-A), (b) 12–23 June (case 2, type-B), (c) 15–20 July (case 3, type-B), and (d) 2–10 July (case 4, type-C).
In the four PHREs of 2020, the position of the WPSH is obviously westward and northward of its mean position (Fig. 6). The cross-equatorial currents in the lower troposphere can be found in Somalia and the low-level jet is located within the northwest rim of the WPSH (Fig. 7). A pressure trough strongly influenced the YHRV region. The trough in case 4 is the strongest one, which resulted in the greatest intensity and range of precipitation among the four PHREs in 2020. Ding et al. (2021) proposed a schematic model of atmospheric circulation conditions for the formation of the record-breaking mei-yu in 2020. The main characteristics are two blocking highs persisting in the mid–high latitudes over Eurasia, along with a major trough near the Lake Balkhash region. At the same time, the trough along the East Asian coast was also active. However, in the present study, the circulation patterns for the four PHREs are different, especially the location and intensity of the ridges and troughs in mid–high latitudes over Eurasia that modulate the path and intensity of cold air that intrudes southward and merges with the warm and moist air mass from the low latitudes over the YHRV.
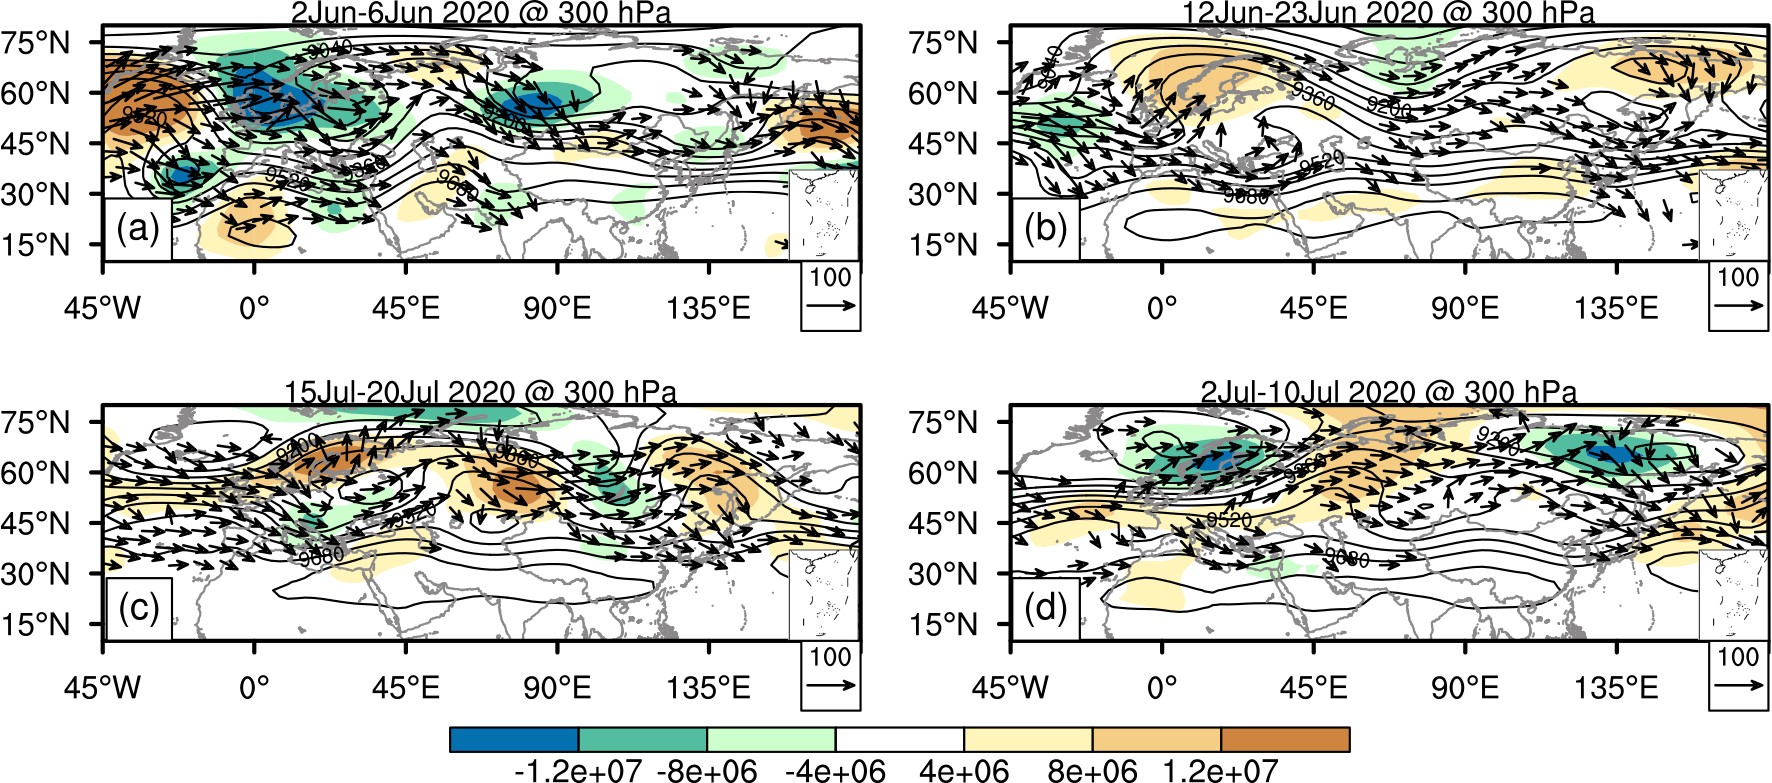
The composite wave-activity fluxes and stream function anomalies of the three types of PHRE were used to reveal the formation of persistent large-scale weather patterns. The same analysis was also used to study the four PHREs in 2020. The main characteristics of wave-activity fluxes and stream function anomalies of case 1 are similar to these of type A events (Fig. 8a). For example, it is found that the North Atlantic has a strong horizontal divergence center of wave-activity flux in the upper troposphere and that most of the wave-activity flux associated with the wave train propagates along the westerly jet. The negative anomaly centered over the northern Mediterranean is associated with strong convergence of the wave-activity flux. The wave train propagates along the westerly jet and splits into two branches. For type-B events, wave-activity fluxes and stream function anomalies for case 3 show that the zonal wave train is stronger than that of case 2, but the meridional waveguide in the middle–lower layers in the composite analysis (Figs. 4c, d) does not appear in the two individual events (Figs. 8b, c). As the “two ridges and one trough” in the mid–high latitudes of the mid–upper troposphere of case 4 are weaker than that in the composite circulation of type-C events, the zonal wave train in the high latitudes of case 4 is also weaker than that of type-C events. The composite circulation and wave train reveals the main characteristics of most PHREs, but from the analysis of the four PHREs in 2020, the characteristics of some events may be significantly different from the composite characteristics. Therefore, for the PHREs in the abnormal mei-yu season of 2020, their formation mechanism of persistent rainfall needs to be further studied.
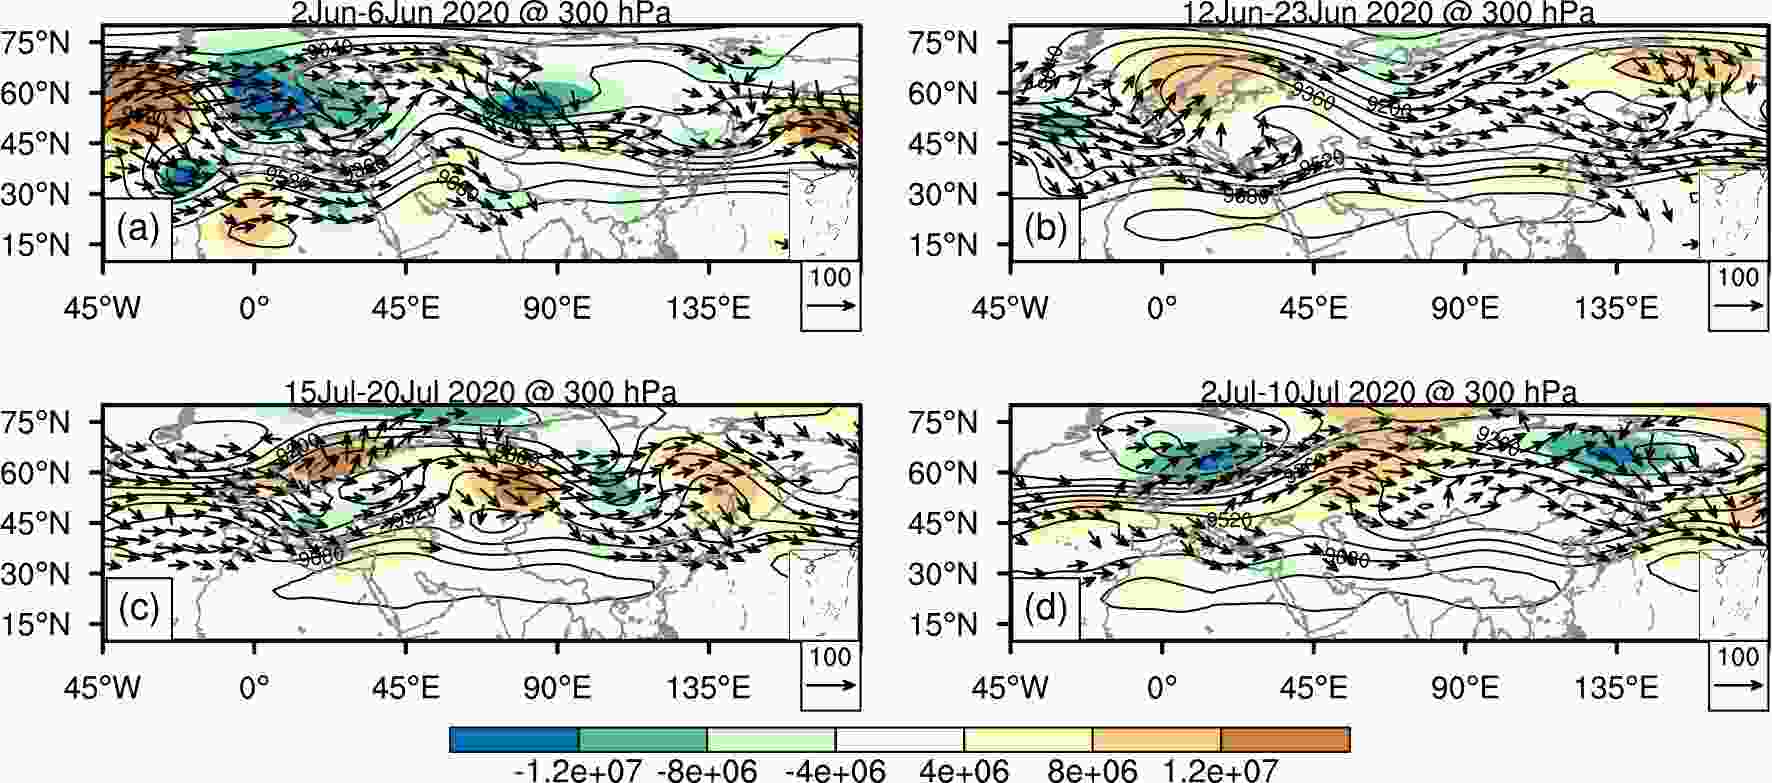
Figure 8. Averaged geopotential height (contours, gpm), wave-activity fluxes (arrows, m2 s−2), and corresponding stream function anomalies (shadings, m2 s−1) at 300 hPa for the PHREs in 2020, (a) 2–6 June (type-A), (b) 12–23 June (type-B), (c) 15–20 July (type-B), and (d) 2–10 July (type-C).
-
Sun et al. (2016) studied the transport pathways of moisture and cold air sources for PHREs in the YHRV using the HYSPLIT trajectory model. There are three main sources of moisture: the southwesterly path from the tropical Indian Ocean to the south of the Indian peninsula, the southerly path from Indonesia and the South China Sea, and the southeasterly path from the western Pacific. The first two paths are the main sources of moisture. The main moisture sources are slightly different for the different types of PHRE, but in general there are the above-mentioned two or three moisture transport paths. In addition, the moisture transport in the three types of PHRE is mainly affected by the Somali cross-equatorial jet, the cross-equatorial current to the south of the Bay of Bengal and the Indonesian archipelago, and the WPSH. There are two cold air trajectories: the northwesterly path from the Mediterranean to the Eurasia, and the northeast path from the Mongolian Plateau. The cold air of the northeast path from the Mongolian Plateau is replenished with water vapor through the Bohai Yellow Sea region, and then transports water vapor to the YHRV. As the sources of water vapor and cold air for the PHREs in the YHRV have been analyzed by Sun et al. (2016), the present study does not track and analyze water vapor and cold air in all events, but only makes a simple analysis of the four PHREs in 2020.
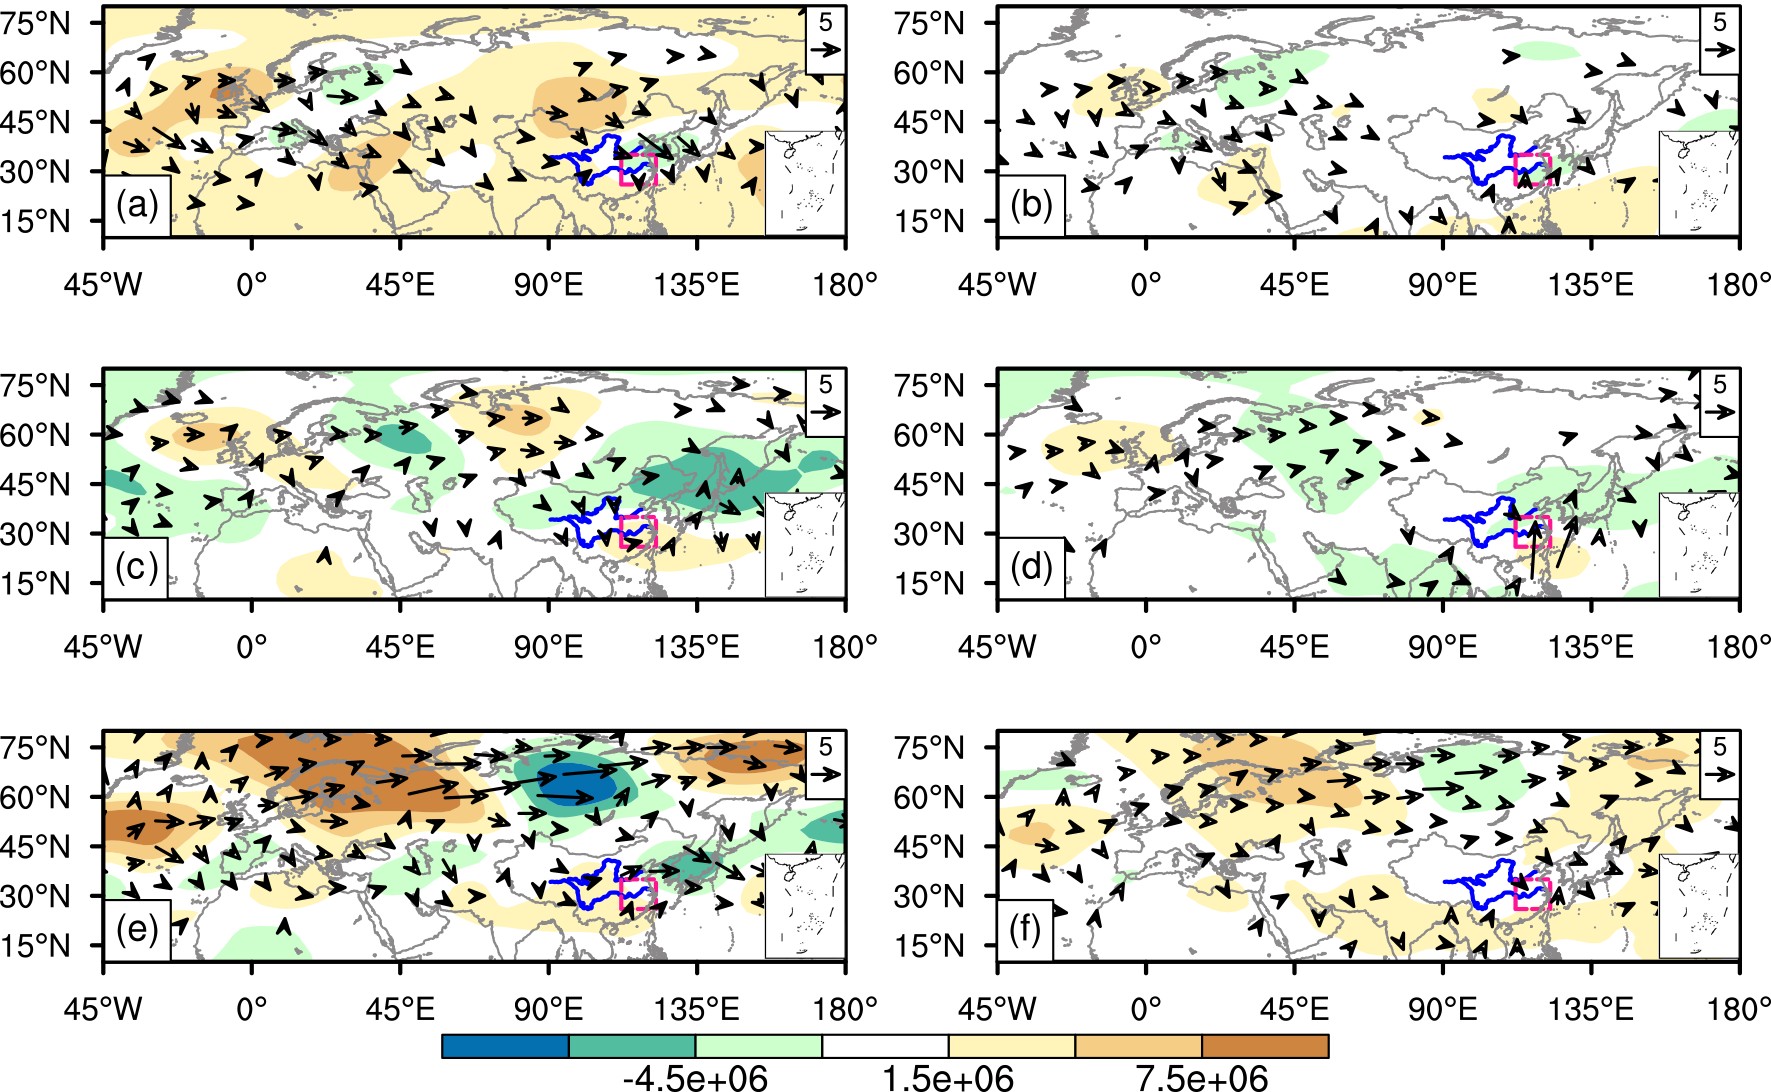
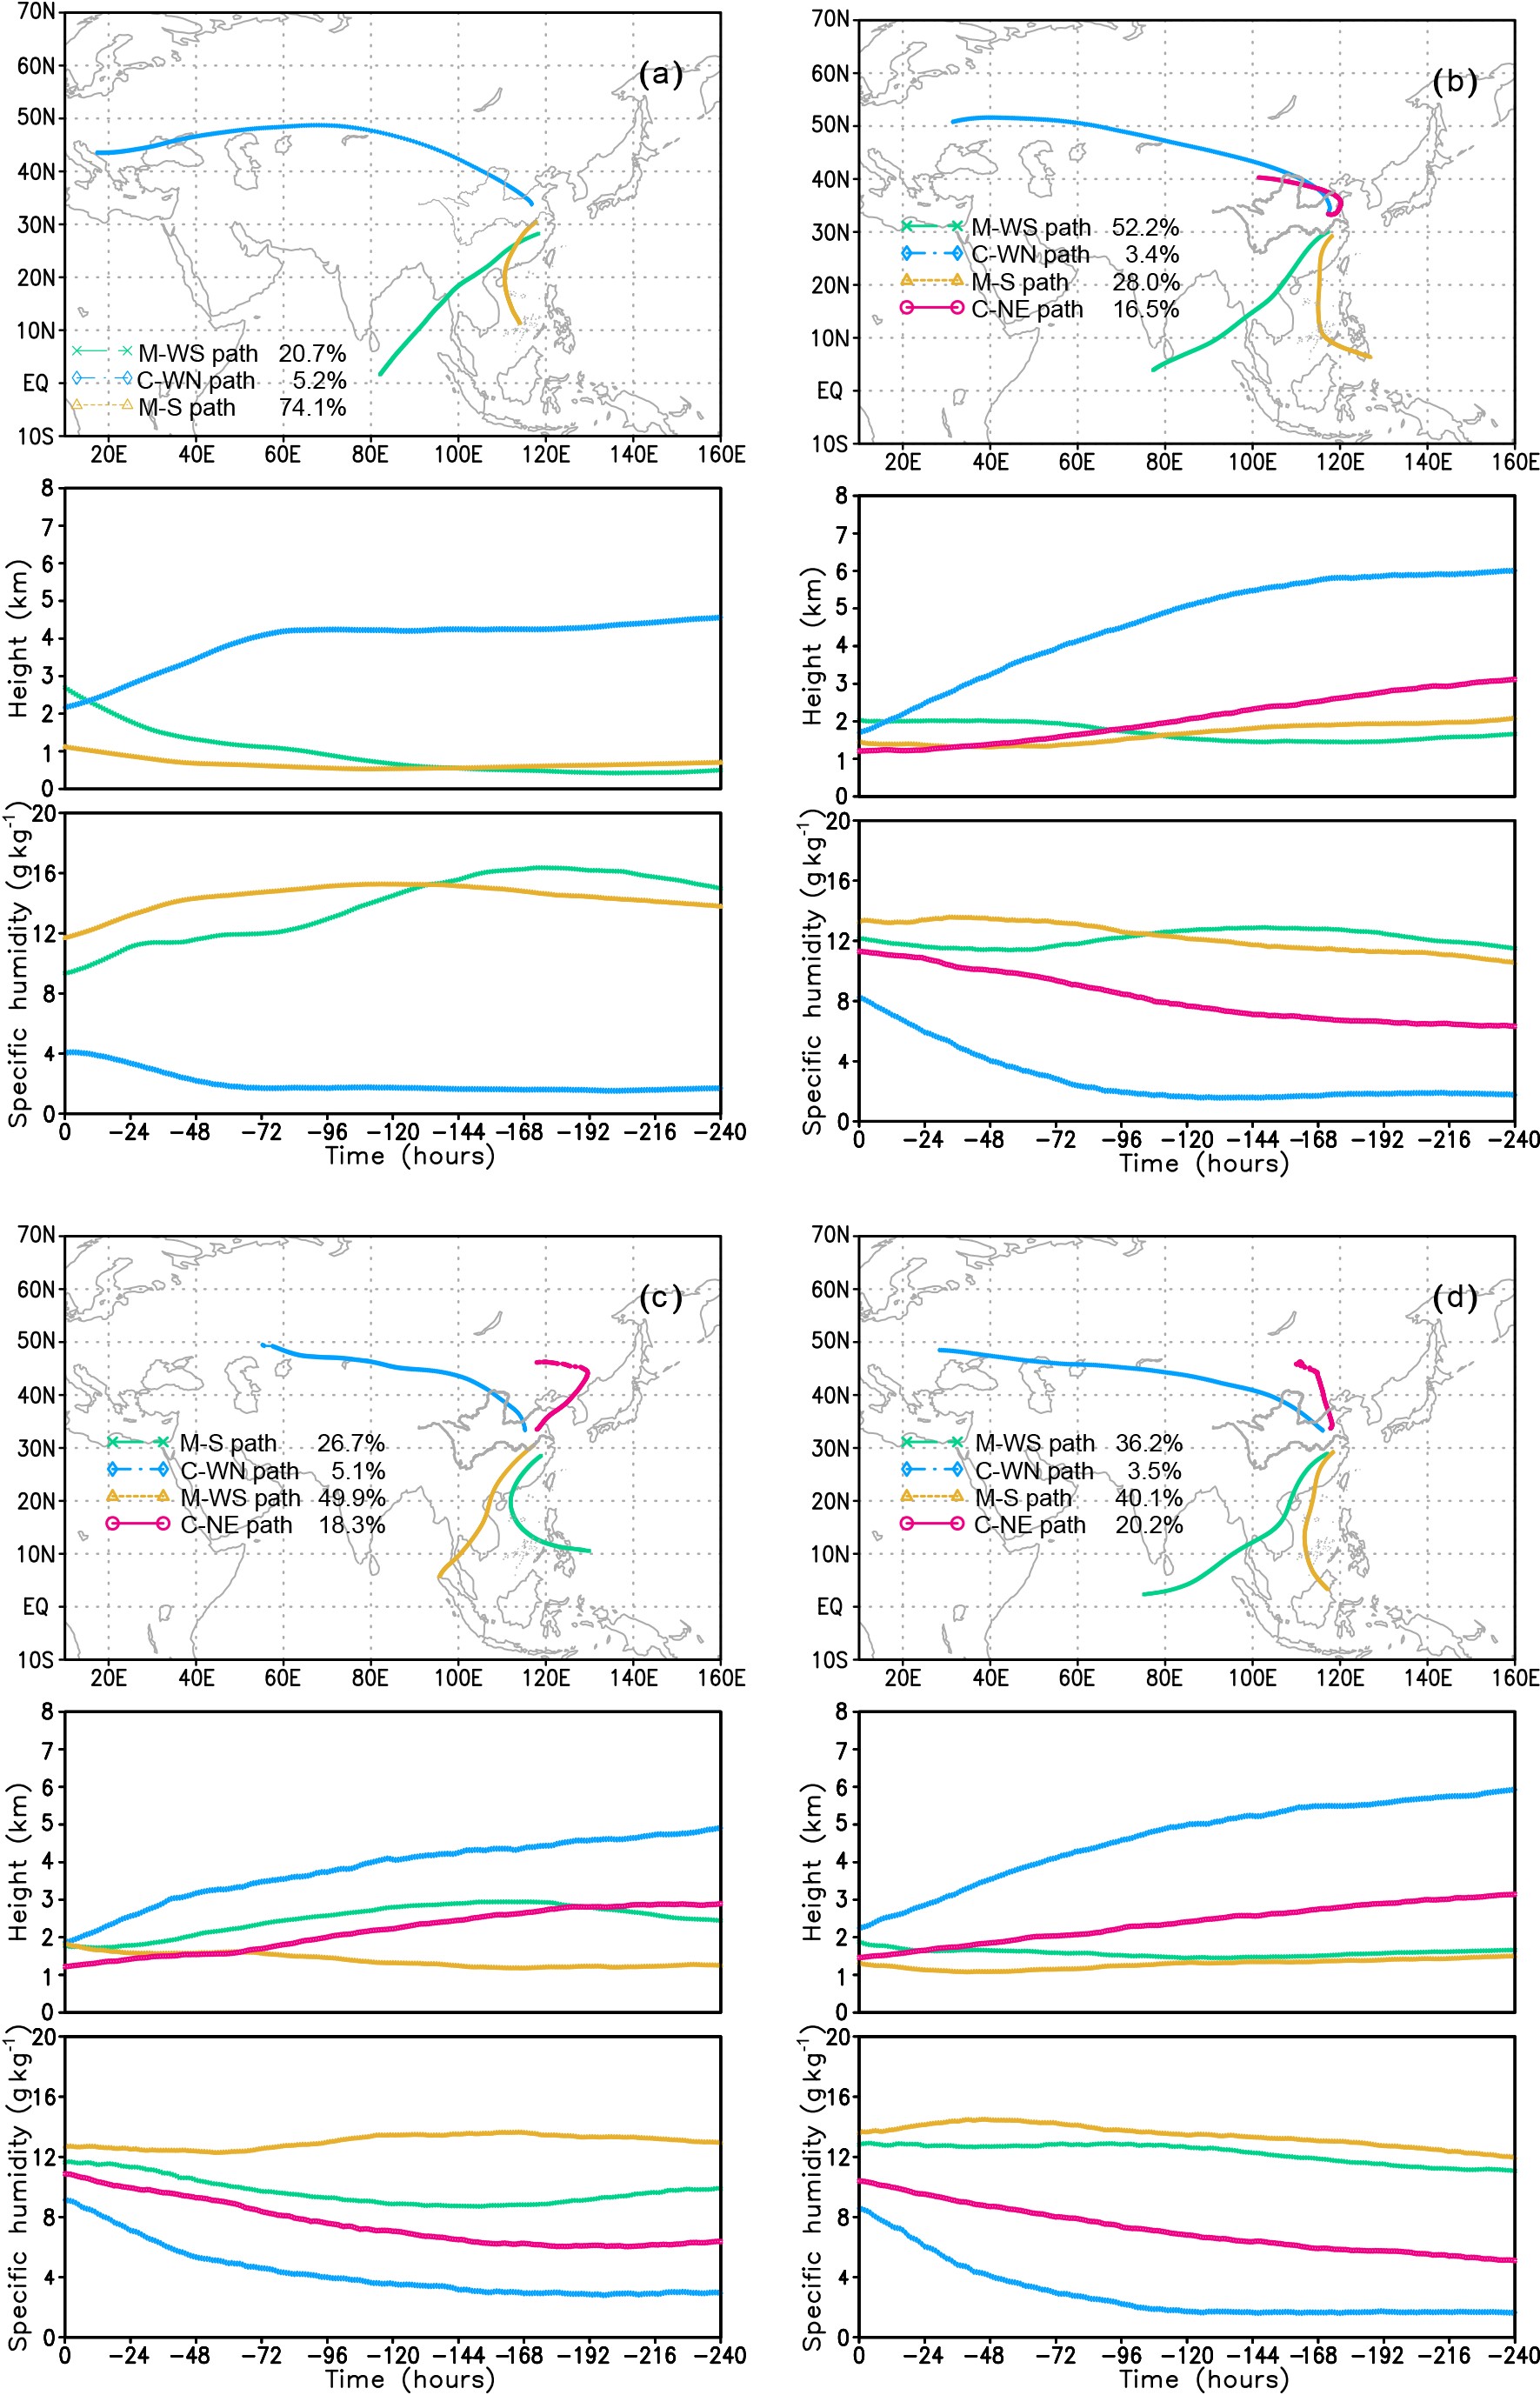
Figure 9 illustrates the 240 h backward horizontal trajectory composites associated with the four PHREs in 2020. There are three clustered trajectories in case 1 (type-A) arriving at the YHRV (Fig. 9a): one traced northwest to the Mediterranean and western Europe (C-WN path), which is controlled by long-wave systems in the westerlies (Fig. 6a and Fig. 7a); one from the tropical Indian Ocean (M-WS path); and the other one traceable to the South China Sea (M-S path), along the western periphery of the WPSH. The contribution of the M-S path to the total moisture transportation is more than 70%, much larger than that of M-WS path. The altitude of the C-WN path from the European continent with lower moisture content is much higher than the other two paths from the south with higher moisture content (Fig. 9a). However, the three paths meet at the YHRV region between 1 and 3 km altitude.
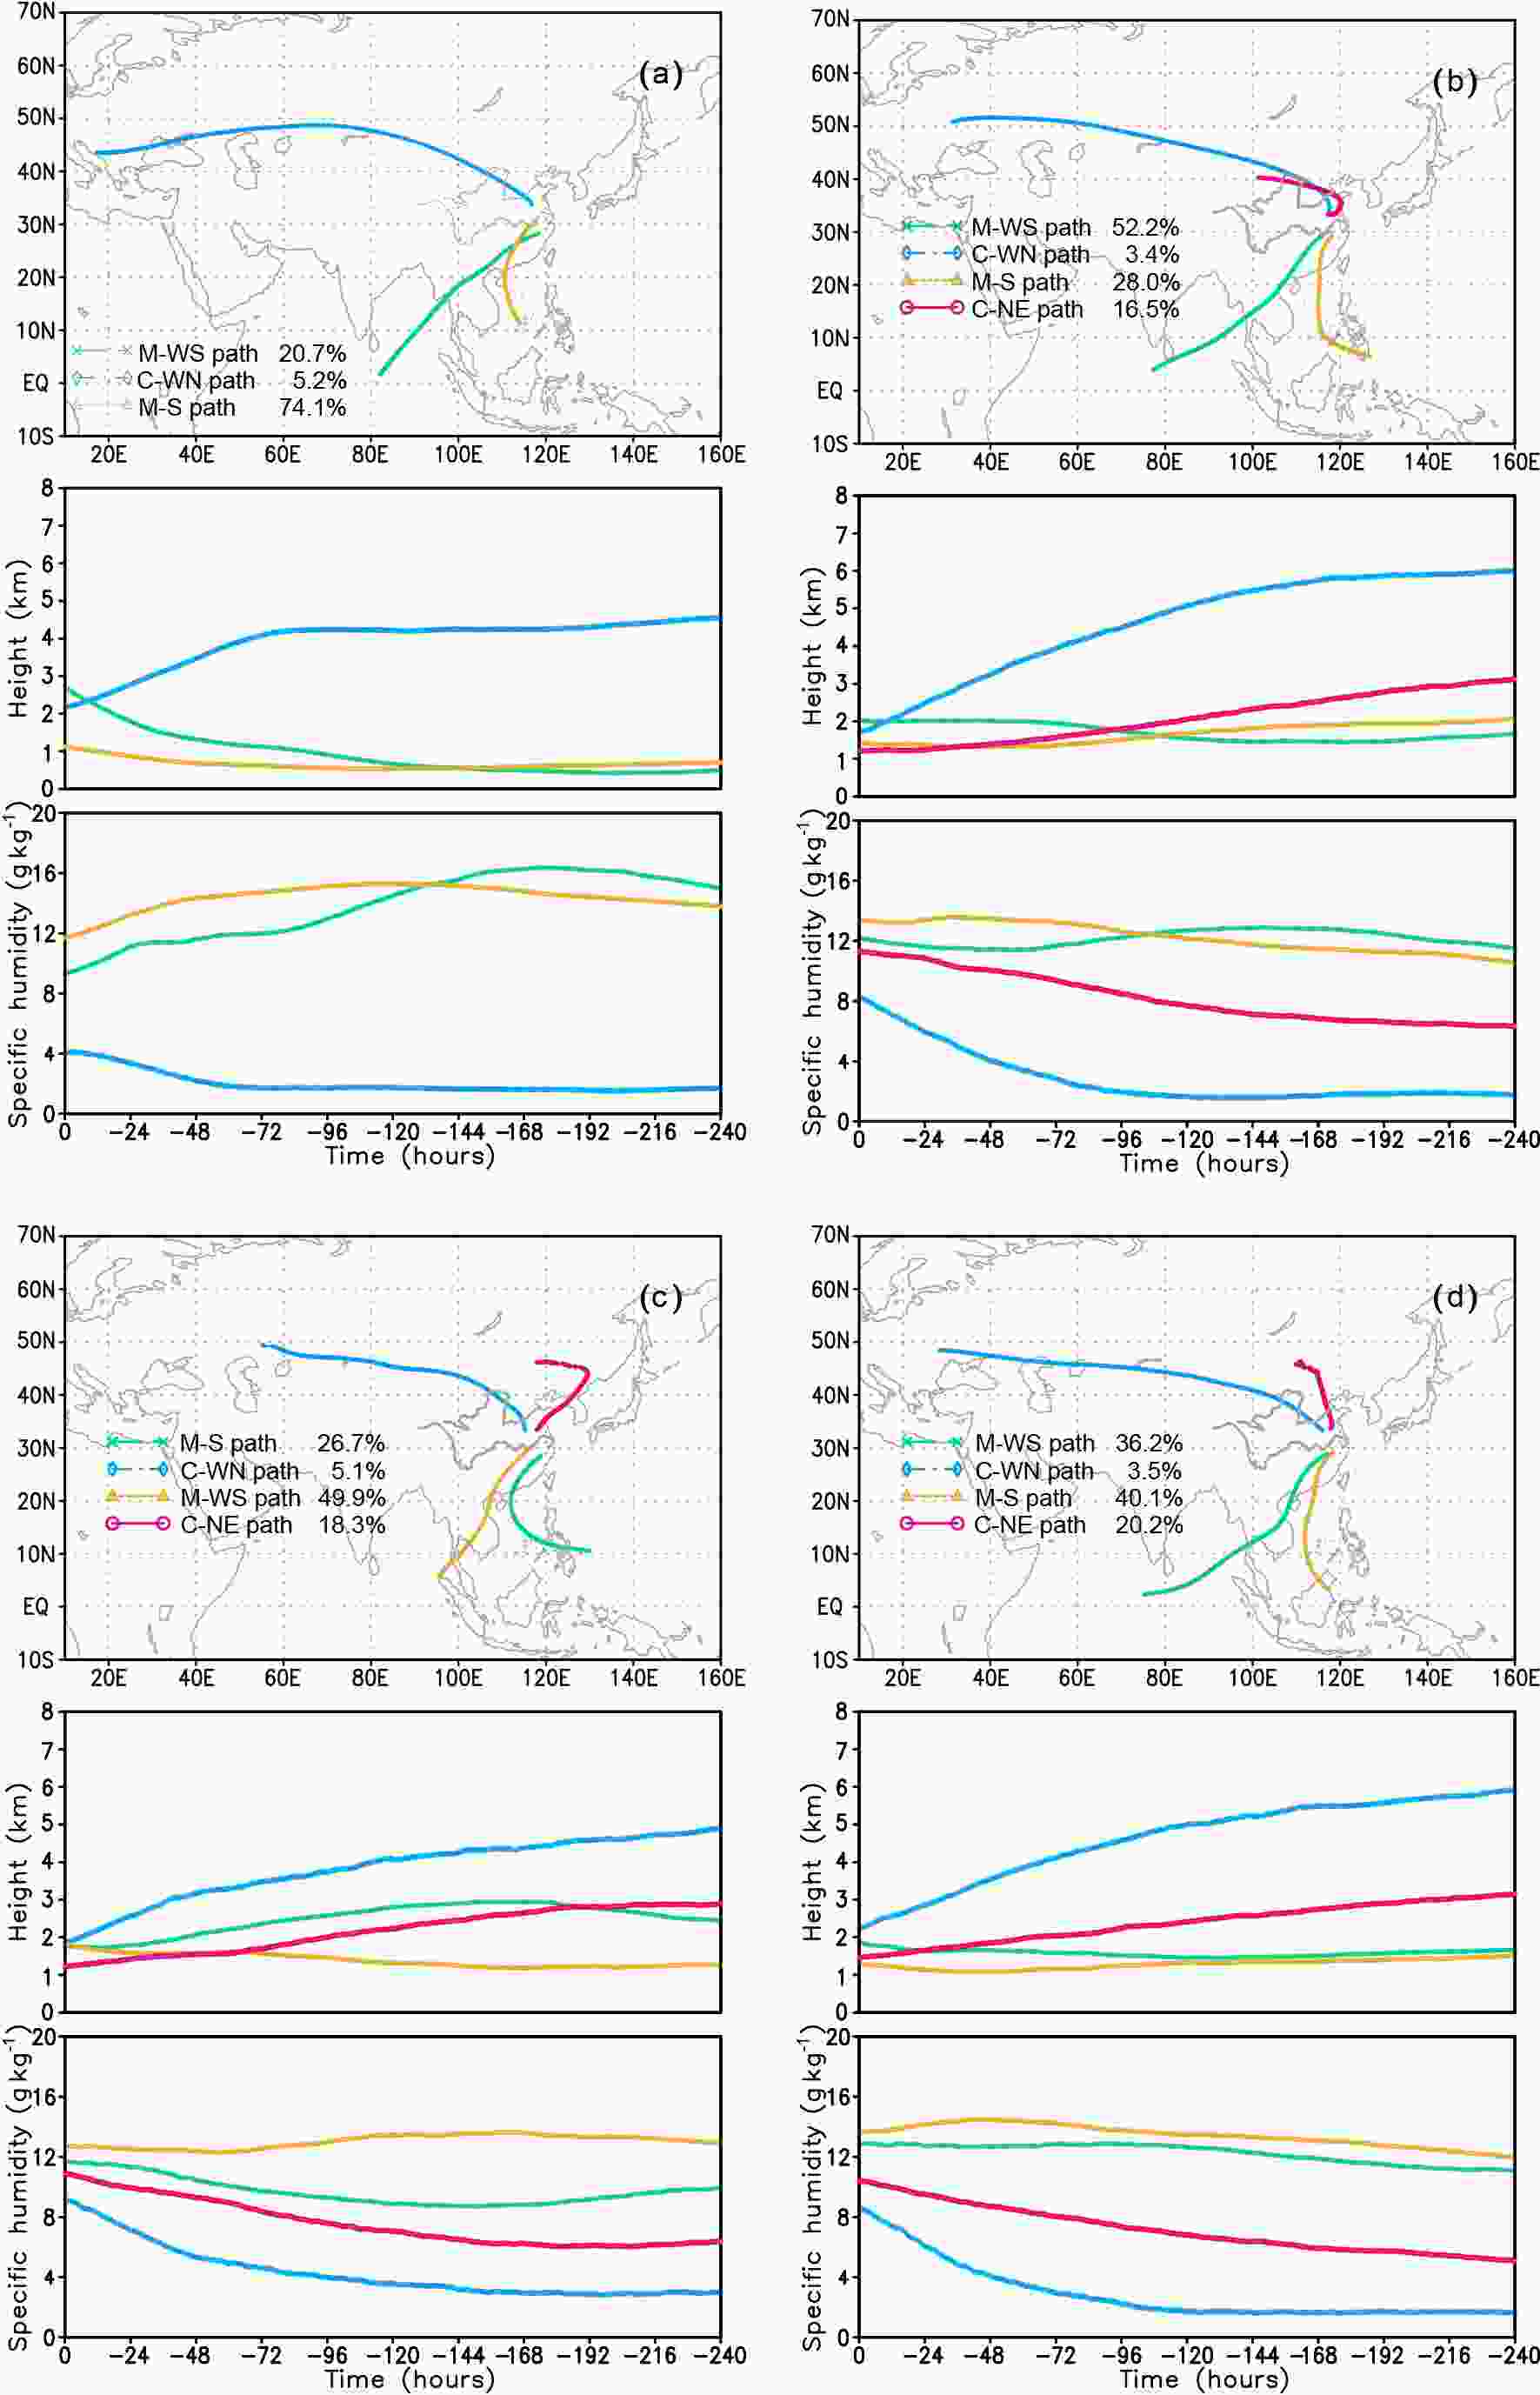
Figure 9. Composite trajectory distributions of PHREs in 2020, (a) 2–6 June (type-A), (b) 12–23 June (type-B), (c) 15–20 July (type-B), and (d) 2–10 July (type-C).
The other three cases have two cold air paths: the one from Europe is consistent with case 1, whereas the other one is mainly from Inner Mongolia (C-NE path). The C-NE path originates about 700 hPa and descends near 1.5 km near the Bohai Bay at −120 h. Meanwhile, the increase of moisture corresponds to the position of the C-NE path over the Bohai Sea from −120 h to −48 h at an altitude of less than 2 km. It is suggested that large evaporative fluxes from the ocean surface contribute to the moisture content along the C-NE path as it approaches the region of the PHREs. The C-NE path provides 16.5%, 18.3%, and 20.2% of the moisture supply contribution to the three events, respectively.
There are two water vapor paths (M-WS path and M-S path) from the south during the four events. In cases 2 and 3, the M-WS path provides the greatest contribution to the total moisture supply, whereas the M-S path provides the largest contribution in cases 1 and 4. Sun et al. (2016) found that there are generally three paths for the PHREs in the YHRV region, but the southeasterly path from the western Pacific does not appear in the four events of 2020, possibly due to the abnormal westward position of the WPSH during the mei-yu season of 2020 (Fig. 6).
The above-mentioned cold air and moisture paths during the PHREs indicate that cold air intrusion is controlled by the synoptic systems in the mid–high latitudes under the influence of Rossby waves. One branch of cold air originates over western Europe and takes a northwest path; the other one is from the Mongolian Plateau and takes a northeast path. Moreover, the moisture content of the latter path is supplemented when the air parcels travel southward over the Bohai Sea and the Yellow Sea before arriving at the YHRV. Water vapor paths are mainly controlled by subtropical systems, such as the East Asia monsoon circulation system, which presented a significant quasi-biweekly oscillation during the mei-yu season of 2020 (Ding et al., 2021).
-
The PHREs over the YHRV during the summers of 1981–2020 were classified. A total of 51 PHREs were obtained and 39 PHREs were classified into three types. Through analysis of the large-scale circulation, Rossby wave energy dispersion, and cold air and water vapor transport paths, this study examined the main characteristics of the synoptic systems and their development mechanisms for the three types of PHRE over the YHRV. The major characteristics of the three types of PHRE and individual events in 2020 are as follows.
During type-A events, the abnormal streamfunction in the mid–high latitudes in the mid–upper troposphere is zonal, which corresponds to the distribution and intensity of troughs and ridges. The anomalous cyclonic disturbance corresponding to the perturbation over the southern part of the YHRV is primarily maintained and intensified by the Rossby wave energy dispersed from two directions. Rossby wave energy originating from the northeast Atlantic propagates toward the YHRV along the southeastward waveguide via the westerly jet across Eurasia in the upper troposphere, then converges with the northward propagation of Rossby wave packets from the western Pacific in the mid–lower troposphere. The anomalies of the WPSH, the SAH, and the Mascarene high are favorable for moisture transport to the YHRV.
During type-B events, the zonal propagation of Rossby wave packets in the mid–upper troposphere is stronger than in type A events, which induces eastward propagation of stronger positive and negative anomaly centers of geopotential height. The northward propagation of Rossby wave packets from the western Pacific in the mid–lower troposphere in type-B events is also stronger than that in type A events, which gives rise to the disturbances on the mei-yu front over the YHRV and the Sea of Japan. Compared with the characteristics of type-A events, a westward–northward WPSH and an eastward–northward SAH causes the southwesterly warm, humid air flowing northward to converge with the cold air in the northern part of the YHRV.
Type-C events show the typical circulation pattern of the mei-yu season characterized as “two ridges and one trough” in the high latitudes of the Eurasian continent. The north–south location of the SAH and the WPSH is between type-A and type-B events, but the anomalous intensity of the WPSH and the trough of YHRV region are weaker than those of type-A and type-B events. The wave-activity flux transport along the northern branch of the zonal-jet waveguide of type-C events is much stronger than that of type-A and type-B events, and the meridional waveguide in the mid–lower layers is weaker than that of type-A and type-B events. The stronger wave-activity flux transport results in the meridional development of “two ridges and one trough” in the high latitudes of the Eurasian continent.
The composite synoptic circulation of case 1 in 2020 is basically consistent with that of the composite characteristics of type-A events. The two type-B PHREs (case 3 and case 2) in 2020 show the major meridional large-scale circulation of type-B events in the mid–upper troposphere. However, the west ridge in cases 3 and 2 was located in the Ural Mountains and to the west of the Ural Mountains, respectively. The composite mid–high latitude circulation of case 4 in 2020 was “two ridges and one trough” in the mid–upper troposphere, but it was weaker than the composite circulation of all type-C events. The location of the SAH in the three PHREs in 2020 moves eastward as in the composite of the three types, and the position of the WPSH of the four events is obviously westward and northward.
For the PHREs over YHRV, there are three main moisture transport paths: the southwesterly trajectory from the tropical Indian Ocean to the south of the Indian peninsula, the southerly trajectory from Indonesia and the South China Sea, and the southeasterly trajectory from the western Pacific (Sun et al., 2016). Moreover, there are only two water vapor paths from the south during the four PHREs in 2020, which is possibly caused by the obviously westward extension of the WPSH. In general, the PHREs have two cold air paths: the northwesterly trajectory from the Mediterranean to the European Plain and the northeast trajectory from the Mongolian Plateau. Only case 1 in 2020 has one cold air path from the Mediterranean to Eurasia.
The main characteristics of the wave-activity fluxes and streamfunction anomalies of PHREs events could partly explain the variation of circulation. These features also could be used to predict the development of troughs and ridges in the middle-latitudes, which are the key systems for inducing the formation of PHREs. However, the location and intensity of the ridges and troughs in mid–high latitudes over Eurasia modulate the path and intensity of cold air, and the subtropical high affects the warm and moist air mass from the low latitudes.
Therefore, future studies should focus on the following questions. What is the mechanism of the persistent stability of large-scale ridges and troughs in the mid–high latitudes? How do the tropical systems modulate the location and intensity of the WPSH? As the heavy rainfall is produced by mesoscale convective systems, what are the activity characteristics of mesoscale systems over the YHRV under the background of persistent and stable circulation?
Acknowledgements. We sincerely thank Cholaw BUEH and Zuowei XIE for the insightful suggestions for the analysis of wave-activity energy propagation. The daily precipitation data at 2 420 stations used in the present study were provided by the National Meteorological Center, China Meteorological Administration. This research was supported by the Strategic Priority Research Program of the Chinese Academy of Sciences (Grant No. XDA23090101) and National Natural Science Foundation of China (Grant No. 41975056).
Open Access This article is distributed under the terms of the Creative Commons Attribution 4.0 International License (
http://creativecommons.org/licenses/by/4.0/ ), which permits unrestricted use, distribution, and reproduction in any medium, provided you give appropriate credit to the original author(s) and the source, provide a link to the Creative Commons license, and indicate if changes were made.
| NO | Start date | End date | Duration (days) | |
| Type A Events | 1 | 28 Jun 1989 | 4 Jul 1989 | 7 |
| 2 | 2 Jul 1992 | 8 Jul 1992 | 7 | |
| 3 | 12 Jun 1994 | 21 Jun 1994 | 10 | |
| 4 | 7 Jul 1997 | 12 Jul 1997 | 6 | |
| 5 | 12 Jun 1998 | 27 Jun 1998 | 16 | |
| 6 | 8 Jun 2000 | 12 Jun 2000 | 5 | |
| 7 | 14 Jun 2002 | 18 Jun 2002 | 5 | |
| 8 | 18 Jun 2005 | 22 Jun 2005 | 5 | |
| 9 | 4 Jun 2006 | 8 Jun 2006 | 5 | |
| 10 | 17 Jun2010 | 25 Jun2010 | 9 | |
| 11 | 18 Jun 2014 | 24 Jun 2014 | 7 | |
| 12 | 11 Jun 2016 | 18 Jun 2016 | 8 | |
| 13 | 3 Jul 2019 | 10 Jul 2019 | 8 | |
| 14 | 2 Jun 2020 | 6 Jun 2020 | 5 | |
| Type B Events | 1 | 18 Jul 1982 | 22 Jul 1982 | 5 |
| 2 | 23 Jun1983 | 27 Jun 1983 | 5 | |
| 3 | 18 Jul 1983 | 23 Jul 1983 | 6 | |
| 4 | 2 Jul 1987 | 6 Jul 1987 | 5 | |
| 5 | 12 Jun 1991 | 16 Jun 1991 | 5 | |
| 6 | 29 Jun 1991 | 12 Jul 1991 | 14 | |
| 7 | 28 Jun 1996 | 6 Jul 1996 | 9 | |
| 8 | 14 Jul 1996 | 18 Jul 1996 | 5 | |
| 9 | 19 Jun2000 | 28 Jun2000 | 10 | |
| 10 | 19 Jun2002 | 23 Jun2002 | 5 | |
| 11 | 30 Jun 2003 | 4 Jul 2003 | 5 | |
| 12 | 6 Jul 2005 | 10 Jul 2005 | 5 | |
| 13 | 29 Jul 2006 | 3 Jul 2006 | 5 | |
| 14 | 5 Jul 2007 | 9 Jul 2007 | 5 | |
| 15 | 1 Jul 2016 | 6 Jul 2016 | 6 | |
| 16 | 12 Jun 2020 | 23 Jun 2020 | 12 | |
| 17 | 15 Jul 2020 | 20 Jul 2020 | 6 | |
| Type C Events | 1 | 27 Jun 1981 | 1 Jul 1981 | 5 |
| 2 | 4 Jul 1983 | 10 Jul 1983 | 7 | |
| 3 | 18 Jun 1988 | 22 Jun 1988 | 5 | |
| 4 | 30 May 1995 | 3 Jun 1995 | 5 | |
| 5 | 20 Jul 1998 | 26 Jul 1998 | 7 | |
| 6 | 24 Jun 1999 | 1 Jul 1999 | 8 | |
| 7 | 7 Jun 2015 | 11 Jun 2015 | 5 | |
| 8 | 2 Jul 2020 | 10 Jul 2020 | 9 |


 AAS Website
 AAS WeChat