


 DownLoad:


-
In a mature tropical cyclone (TC), strong convection and associated diabatic heating rates in the mid-tropospheric eyewall produce high cyclonic potential vorticity (PV) in the lower troposphere, which can be transported upward by the eyewall updraft. However, subsidence in the eye region suppresses convection, inhibits latent heat release, and upsets PV generation. As a result, a strong TC is often characterized by a high PV tower in the eyewall, with relatively low PV in the eye region. This off-centered PV ring structure is barotropically unstable; a phenomenon previously studied in a nondivergent barotropic model by Schubert et al. (1999). They showed that in an initially axisymmetric, barotropically unstable vortex, a small perturbation (deviation from the azimuthal mean) could grow exponentially with its growth rate depending on both the basic-state (azimuthally mean) vortex structure and the wavelength of the perturbation itself. Such oscillations propagate azimuthally around the vortex directed to the right of the radial basic-state PV gradients. Since the underlying dynamics of PV waves in a circular vortex are analogous to the planetary Rossby waves, they are termed vortex Rossby waves (VRWs; MacDonald, 1968; Guinn and Schubert, 1993; Montgomery and Kallenbach, 1997; Wang, 2002). After the VRWs reach a finite amplitude, the nonlinear wave-wave and wave-flow interactions may result in the wave phase-locking, wave breaking, mesovortex merger, and axisymmetrization processes. In this paper, we extend the work of Schubert et al. (1999) to the divergent condition to examine the significance of divergence on both the linear and nonlinear development of VRWs.
Kossin and Schubert (2001) adopted a thinner high-PV annulus than that used in Schubert et al. (1999) to better mimic intense or intensifying TCs in the real world, such as Hurricanes Gilbert (1988) and Guillermo (1997). They found that a thinner and larger PV annulus can quickly experience the development of an unstable mode and breakdown of the PV annulus and later roll up into mesovortices that may merge and end up with a steady vortex crystal, which gives the related streamlines a polygonal appearance. On the contrary, a smaller or radially broader PV annulus tends to relax into a monopole with the maximum PV residing at the vortex center, accompanied by a significant central pressure drop and a decrease of the maximum wind speed. They also suggested that such a PV redistribution process can occur without moist dynamics. Polygonal eyewalls and mesovortices have been observed in real TCs (Lewis and Hawkins, 1982; Muramatsu, 1986; Reasor et al., 2000; Kossin and Schubert, 2004).
Other than unforced two-dimensional simulations where initial PV annuli are presumed, Hendricks et al. (2014) further explored TC eyewall evolution forced by continuous diabatic heating. Using a shallow-water-equation model where deep convective heating is parameterized as a mass sink, they showed that the linear evolution of vortices in a forced, divergent condition is qualitatively similar to the unforced, nondivergent case studied by Schubert et al. (1999). However, the TC intensity variability is also significantly affected by the radial structure, temporal evolution, and the radial location of diabatic heating.
Most studies on the barotropic instability of TC eyewalls have focused on the internal dynamics without considering any environmental effects. One of the interactions between TCs and the environment is the so-called beta effect that results from PV conservation and the differential advection of planetary vorticity by the TC flow (Holland, 1983; Chan and Williams, 1987; Fiorino and Elsberry, 1989; Wang and Holland, 1996a, b). On the beta-plane, a pair of mesoscale, northeast-southwest-oriented, counter-rotating gyres (beta gyres), centered hundreds of kilometers away from the vortex center, would present themselves with southeasterly ventilation flow in between. These activities would have the net effect of translating the entire vortex northwestward in the Northern Hemisphere (the beta drift). Previous theoretical and numerical studies on the TC inner-core dynamics are performed on an f-plane with the beta effect ignored. Ignoring the beta effect on the eyewall evolution is justified by the relatively small radial scale of motion in the compact TC inner-core region. However, some real TCs have large circulations with eye sizes ~100 km (such as Typhoon Carmen in 1960, Typhoon Winnie in 1997, etc.) at a scale by which the beta effect on the inner-core structure may indeed be relevant. Besides, careful consideration of any asymmetric forcing is desirable in the regime of nonlinear dynamics, under which even small perturbations can cause irreversible changes. This study intends to evaluate whether the beta effect exerts a significant impact on the development of TC eyewalls. To this end, barotropically unstable vortices are numerically simulated on both the f-plane and beta-plane to examine the beta effect on the eyewall evolution.
The remainder of this paper is organized as follows. In section 2, we derive the two necessary conditions of barotropic instability in the context of the two-dimensional asymmetric balance (AB) framework. Description of experiments and initialization of the shallow-water-equation model are illustrated in section 3. Section 4 presents the eyewall evolution of vortices with different basic-state PV structures on the f-plane. We will show that both the linear eyewall evolution and the subsequent nonlinear behaviors caused by wave-wave interactions in the shallow-water-equation model are similar to those in the nondivergent barotropic model. The beta effect on eyewall instability is examined by comparing the vortex evolution in the f-plane and beta-plane experiments, the details of which are discussed in section 5. Finally, a brief summary is given.
-
Here we choose the asymmetric balance (AB) shallow-water-equation model that allows divergence (Shapiro and Montgomery, 1993) to be included to address the wave instability in a two-dimensional shallow-water system. The linearized perturbation geopotential tendency equation deduced from the AB shallow-water equations in the cylindrical coordinates can be written as
where r, λ,
$\bar{{v}}$ denote radius, azimuthal angle, and tangential wind of the basic vortex, respectively;${\phi }{{'}}$ is the perturbation geopotential;$\bar{\xi}{=}{f}{+2}\bar{{v}}\text{/}{r}$ is the inertial parameter; f is the Coriolis parameter;$\bar{{q}}$ (r) =$ \bar{\eta} $ /$\overline{{H}}$ is the basic-state PV;$ \bar{\eta} $ = f + d(r$\bar{{v}}$ )/(rdr) is the basic-state absolute vertical vorticity;$\overline{{H}}$ is the basic-state geopotential height;$ {\kappa}^{\text{2}} $ =$ \bar{\eta}\bar{\xi}\text{} $ /$ \bar{\phi} $ is the square of the inverse of local Rossby number; and$ \bar{\phi} $ (r) is the basic-state geopotential. Assume that the perturbation geopotential satisfies a wave-type solution${\phi}{{'}}$ =${\Phi(}{r}{)}\exp{[}{i}{(}{n \lambda }{–} { \omega t}\text{)]}$ ($\Phi$ is the wave amplitude; i is the imaginary number; n is the azimuthal wavenumber; ω is the time-frequency; t is time). Substitute it into Eq. (1), and one can getwhere
$\sigma={ \omega }$ – n$\bar{v}$ /r is the Doppler-shifted frequency. Considering the complex forms of ω and$\Phi$ as ω =${{ \omega }}_{{r}}$ + i$ {\omega }_{i} $ ,$\Phi$ =${\Phi}_{r}$ + i${\Phi}_{i}$ and multiplying by${\Phi}^{\text{*}}$ , the complex conjugate of$\Phi$ , Eq. (2) becomesGiven that the perturbation would vanish when the radial distance approaches infinity, then the term on the right-hand side of Eq. (3) should disappear when we integrate Eq. (3) from r = 0 to r =
$ \text{∞} $ ,Subtracting the imaginary part of Eq. (4) yields
In the unstable condition,
${{ \omega }}_{i}\ne 0$ , then we haveThis means that (
$\bar{\xi }$ /$\bar{{q}}$ )(d$\bar{{q}}$ /dr) must change its sign in the range [0,$ \text{∞} $ ) to allow for dynamic instability. In the case that the vortex is symmetrically stable ($\bar{\xi}\bar{{q}}$ > 0, Montgomery and Shapiro, 1995, hereafter MS95), the condition can be simplified to the conditional constraint upon$ {{r}}_{{k}} $ at which d$ \overline{q} $ /dr = 0 (${{r}}_{{k}}\in$ [0,$ \text{∞}) $ ). This formulation is consistent with the necessary condition for barotropic instability when deduced based on a nondivergent barotropic model (Zhong et al., 2010). It is also a special form of the generalized Charney-Stern theorem from the three-dimensional AB equation (MS95). Since the radial gradient of the basic-state PV is positive (negative) inside (outside) the maximum PV ring, the Charney-Stern theorem can guarantee the formation of a pair of counter-propagating VRWs relative to the basic vortex flow (MS95).Another necessary condition, the Fjortoft theorem, can be obtained by subtracting the real part of Eq. (4), which gives
Utilizing Eq. (6), Eq. (7) can be reduced to
Since the left-hand side of Eq. (8) is always positive,
$\bar{{v}}$ /r and d$\bar{{q}}$ /dr should be anticorrelated on average (when$\bar{\xi}\bar{{q}}$ > 0) to make the term on the right-hand side positive. Under the premise of the necessary condition, as dictated by the Charney-Stern theorem, that allows for the generation of counter-propagating VRWs, the Fjortoft theorem can ensure phase-locking between the pair of waves and lead to an enhanced perturbation amplitude (Hoskins, 1985). Note that the linear analysis above is only applicable to the early stage of exponential growth, which can profoundly impact the subsequent nonlinear evolution of TC eyewalls. Although the criteria only disclose the nature of waves in terms of global stability and can hardly indicate the most unstable modes, we will show how excitations of the most unstable modes depend on the basic-state PV structures through numerical simulations. -
The shallow-water-equation model used in this study includes the following equations in the Cartesian coordinates:
where u, v, V denote the zonal, meridional wind components, and wind vector, respectively; f = 2
${ \Omega }$ sin$ \varphi $ with$ \varphi $ being the latitude. The model domain has 3203 × 2403 grid points with a grid spacing of 3 km. Results within an area of 601 × 601 grid points centered at the vortex center are saved for analysis. Rigid lateral boundary conditions are used at the north and south boundaries, and cyclic conditions are used at the east and west boundaries. The combined scheme of Euler forward- and Matsuno time differencing is adopted for the model time integration with a time step of 9 s, while the simulated data are saved at 15-minute intervals. Note that our attention is given to the internal TC dynamics and the beta effect. Thus, we assume a quiescent environment.Observations suggest that intensifying TCs generally have very thin, high-PV annuli accompanied by nearly irrotational flow at the center (Schubert et al., 1999; Kossin and Eastin, 2001; Kossin and Schubert, 2001). To meet the two necessary conditions for barotropic instability presented in section 2, the model is initialized with an axisymmetric annulus of elevated PV (i.e., a PV ring), which has a radial distribution given as
where
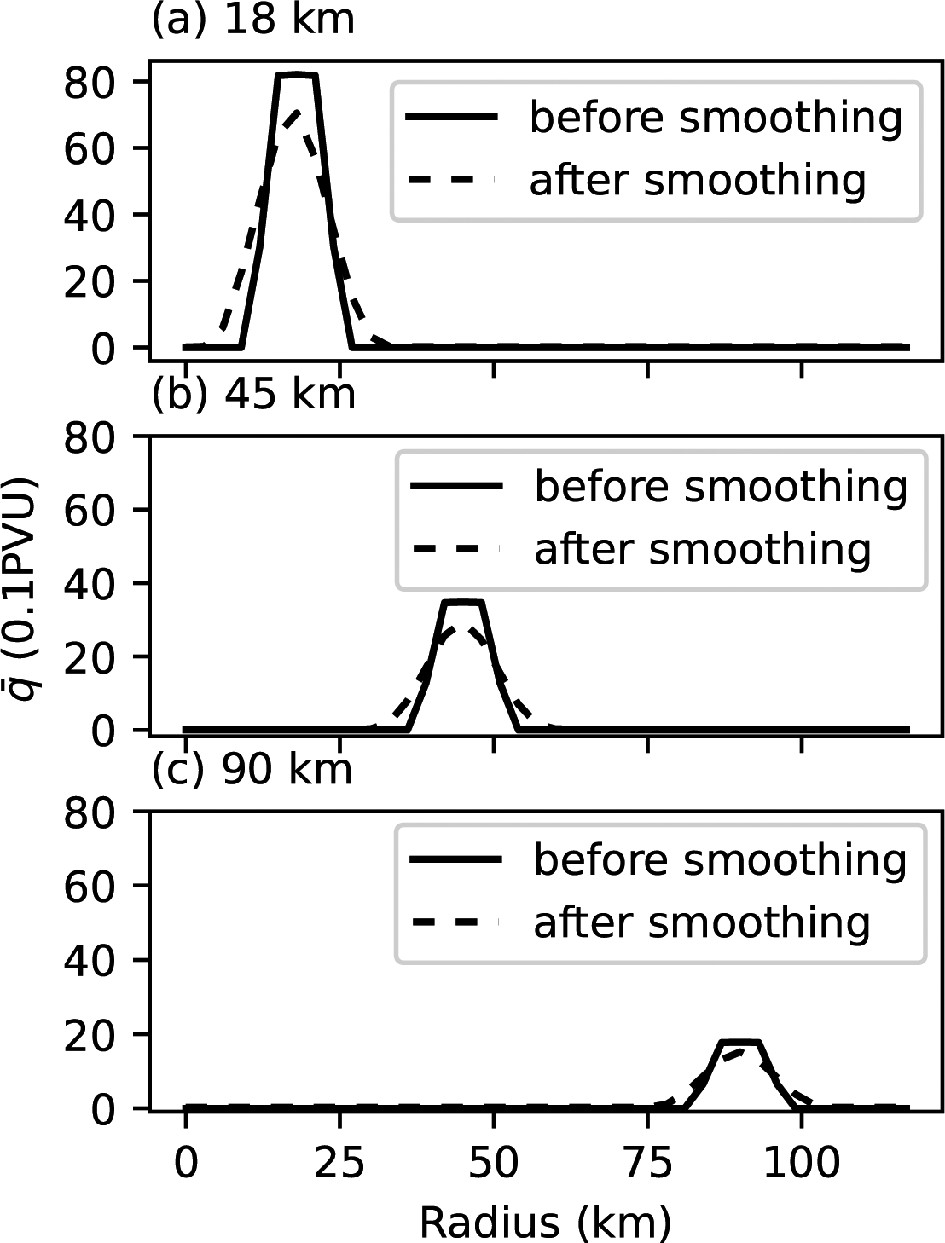
${{q}}_{\text{r0}}$ is the maximum PV of the PV ring; rr is the radial distance to the TC center; ro is the radius at which the annulus is centered; l is the width of the annulus; the Coriolis parameter f is set at the latitude of 15°N; and$\overline{H}$ is the basic-state geopotential height. This radial profile indicates a nearly zero PV in the eye region with an increase in PV with increasing radius until a threshold radius given by ro – l/2, then remains nearly constant before decreasing outward from another threshold radius given by ro + l/2. Since PV and the inertial parameter are always positive in this case, such a structure satisfies the Charney-Stern theorem.Table 1 lists the parameters used for the PV distributions in the different experiments in this study. Because the model describes inviscid, unforced motion, PV is rearranged without any new PV generation in all experiments. Hence, it is of interest to see the redistribution of the same amount of PV under varying basic-state conditions. The total integrated PV over the model domain is to be nearly equal, by design, in all experiments; therefore, the maximum amplitudes of PV rings located at larger radii are smaller. All the model vortices have elevated PV rings of 6 km in width but have different central radii of 18 km, 45 km, and 90 km to mimic real TCs of different eyewall sizes. Although more experiments can be done by further varying the widths, amplitudes, and ring sharpnesses, we will focus on a small parameter space to address the key scientific questions mentioned in section 1. Several three-point smoothing operations are performed to reduce the computational modes related to the sharp PV gradients at both the inner and outer edges of PV rings. As a result, the maximum amplitudes of PV rings in all experiments are reduced slightly, and the uniform PV distributions of eyewall are deconstructed due to the limited spatial resolution of 3 km (Fig. 1). Nevertheless, the general characteristics of the radial PV distributions are conserved, and the constraint of Charney-Stern theorem is still met since the PV structure with respect to the off-centered maximum is kept unchanged. Referring to the segmentation function concerning the basic-state relative vorticity in Schubert et al. (1999),
$ {\xi}_{\text{1}} $ +$ {\text{}\xi}_{\text{2}} $ and$ {\xi}_{\text{2}} $ represent the relative vorticity in the axisymmetric eye (0$ \leqslant $ r$\leqslant{{r}}_{\text{1}}$ ) and eyewall (${{r}}_{\text{1}}\leqslant$ r$\leqslant{{r}}_{\text{2}}$ ) regions, respectively. Two parameters γ = ($ {\xi}_{\text{1}} $ +$ {\xi}_{\text{2}} $ )/$ {\xi}_{\text{ave}} $ ($ {\xi}_{\text{ave}} $ is the average relative vorticity over the region 0$ \leqslant $ r$\leqslant{{r}}_{\text{2}}$ ) and δ =${{r}}_{1}$ /${{r}}_{2}$ are used to measure the contrast of relative vorticity between the central region and the enhanced ring and the degree of hollowness, respectively. In the shallow-water case, we replace relative vorticity with PV. Since the initial PV in the eye region has been set to zero, all the vortices have γ = 0 but differ in terms of δ. Here the expression of δ is given as${{r}}_{\text{i}}$ /${{r}}_{\text{e}}$ , where${{r}}_{\text{i}}$ is the radius of maximum basic-state PV gradient (positive) and${{r}}_{\text{e}}$ is the radius of the minimum basic-state PV gradient (negative). The smoothed PV profile is used to calculate this parameter shown in Table 1.Expt. Maximum PV before
smoothing (${{q} }_{\text{r0} }$, PVU)Maximum PV after
smoothing (PVU)Annulus width
(l, km)ro (km) $\delta $ Coriolis parameter
(in the northern hemisphere)F18 8.21 7.20 6.0 18 0.40 f(15°), $ \beta{= 0} $ F45 3.48 2.86 6.0 45 0.73 f(15°), $ \beta{= 0} $ F90 1.78 1.69 6.0 90 0.88 f(15°), $ \beta{= 0} $ B18 8.21 7.20 6.0 18 0.40 f(15°), $ \beta $(15°) B45 3.48 2.86 6.0 45 0.73 f(15°), $ \beta $(15°) B90 1.78 1.69 6.0 90 0.88 f(15°), $ \beta $(15°) B90-60 1.78 1.69 6.0 90 0.88 f(15°), $ \beta $(60°) B90-75 1.78 1.69 6.0 90 0.88 f(15°), $ \beta $(75°) Table 1. Description of the eight experiments in this study. The second and third columns give information on the maximum potential vorticity (PV) before and after smoothing; the fourth, fifth, and sixth columns present the widths of the PV rings, central radii of the location, and degree of hollowness, respectively. The last column shows the Coriolis parameters used in simulations. The first three experiments are conducted on the f-plane, while the last five are on the beta-plane.
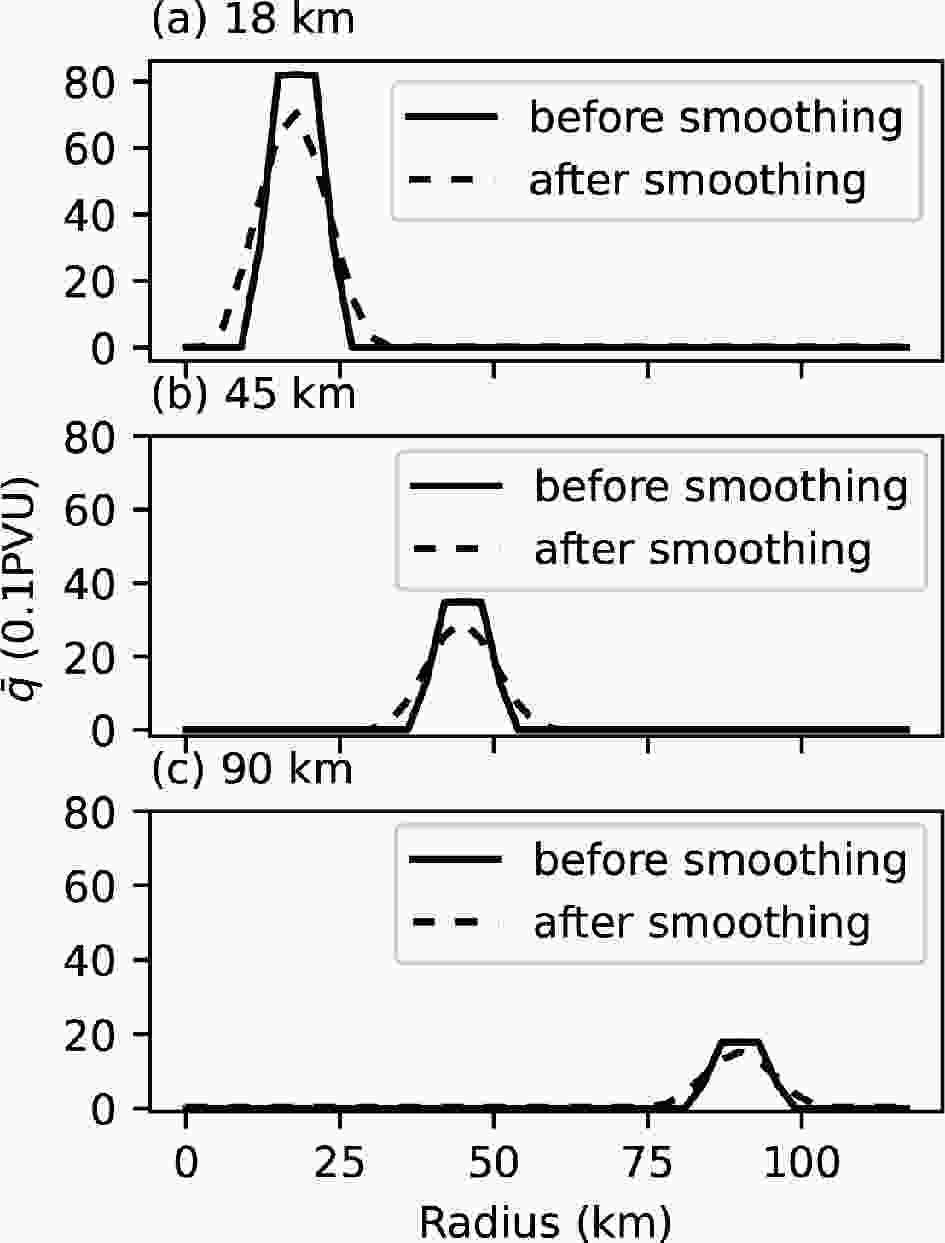
Figure 1. Radial distributions of the initial axisymmetric PV annuli (units: 0.1 PVU) given in Eq. (13) before smoothing (solid) and after smoothing (dashed) for three cases with an ro of 18 km (a), 45 km (b), and 90 km (c), respectively.
It is difficult to determine whether the basic-state flow fulfills the constraint of the Fjortoft theorem because the term on the right-hand side of Eq. (8) includes unknown parameters related to the perturbation. However, the integral of the part that only includes the basic-state parameters, given by
can help determine the sign of the entire integral on the right-hand side of Eq. (8). Negative values (–3400 for 18 km; –1073 for 45 km; –308 for 90 km) for Eq. (14) suggest that all the experiments are likely to satisfy the requirement of the Fjortoft theorem.
Given the basic-state PV distribution, the basic-state wind field is obtained by solving Eq. (12) iteratively, together with the geopotential height obtained from the nonlinear balance equation, which yields the relationship between the geopotential and streamfunction fields as given below
where ψ is the streamfunction. Equation (15) is numerically solved using a simple over-relaxation method based on the basic-state wind field (streamfunction) to obtain the initial geopotential height in Eq. (12). Ten iterations are deemed sufficient to obtain convergent numerical solutions.
Three f-plane experiments are performed to serve as a basis for comparison with results from other experiments that include the beta effect (Table 1). Note that we initialize the model with a vortex structure that can enable the barotropic instability, which may develop freely with even small model numerical truncation errors. The opposite signed sharp radial PV gradients at radii of ro ± l/2 permit the emergence of a pair of azimuthally counter-propagating Rossby edge-waves (Schubert et al., 1999). In contrast, the uniform distribution of PV within the interior and beyond the exterior boundary of the annulus is unfavorable for wave generation in our simulations.
-
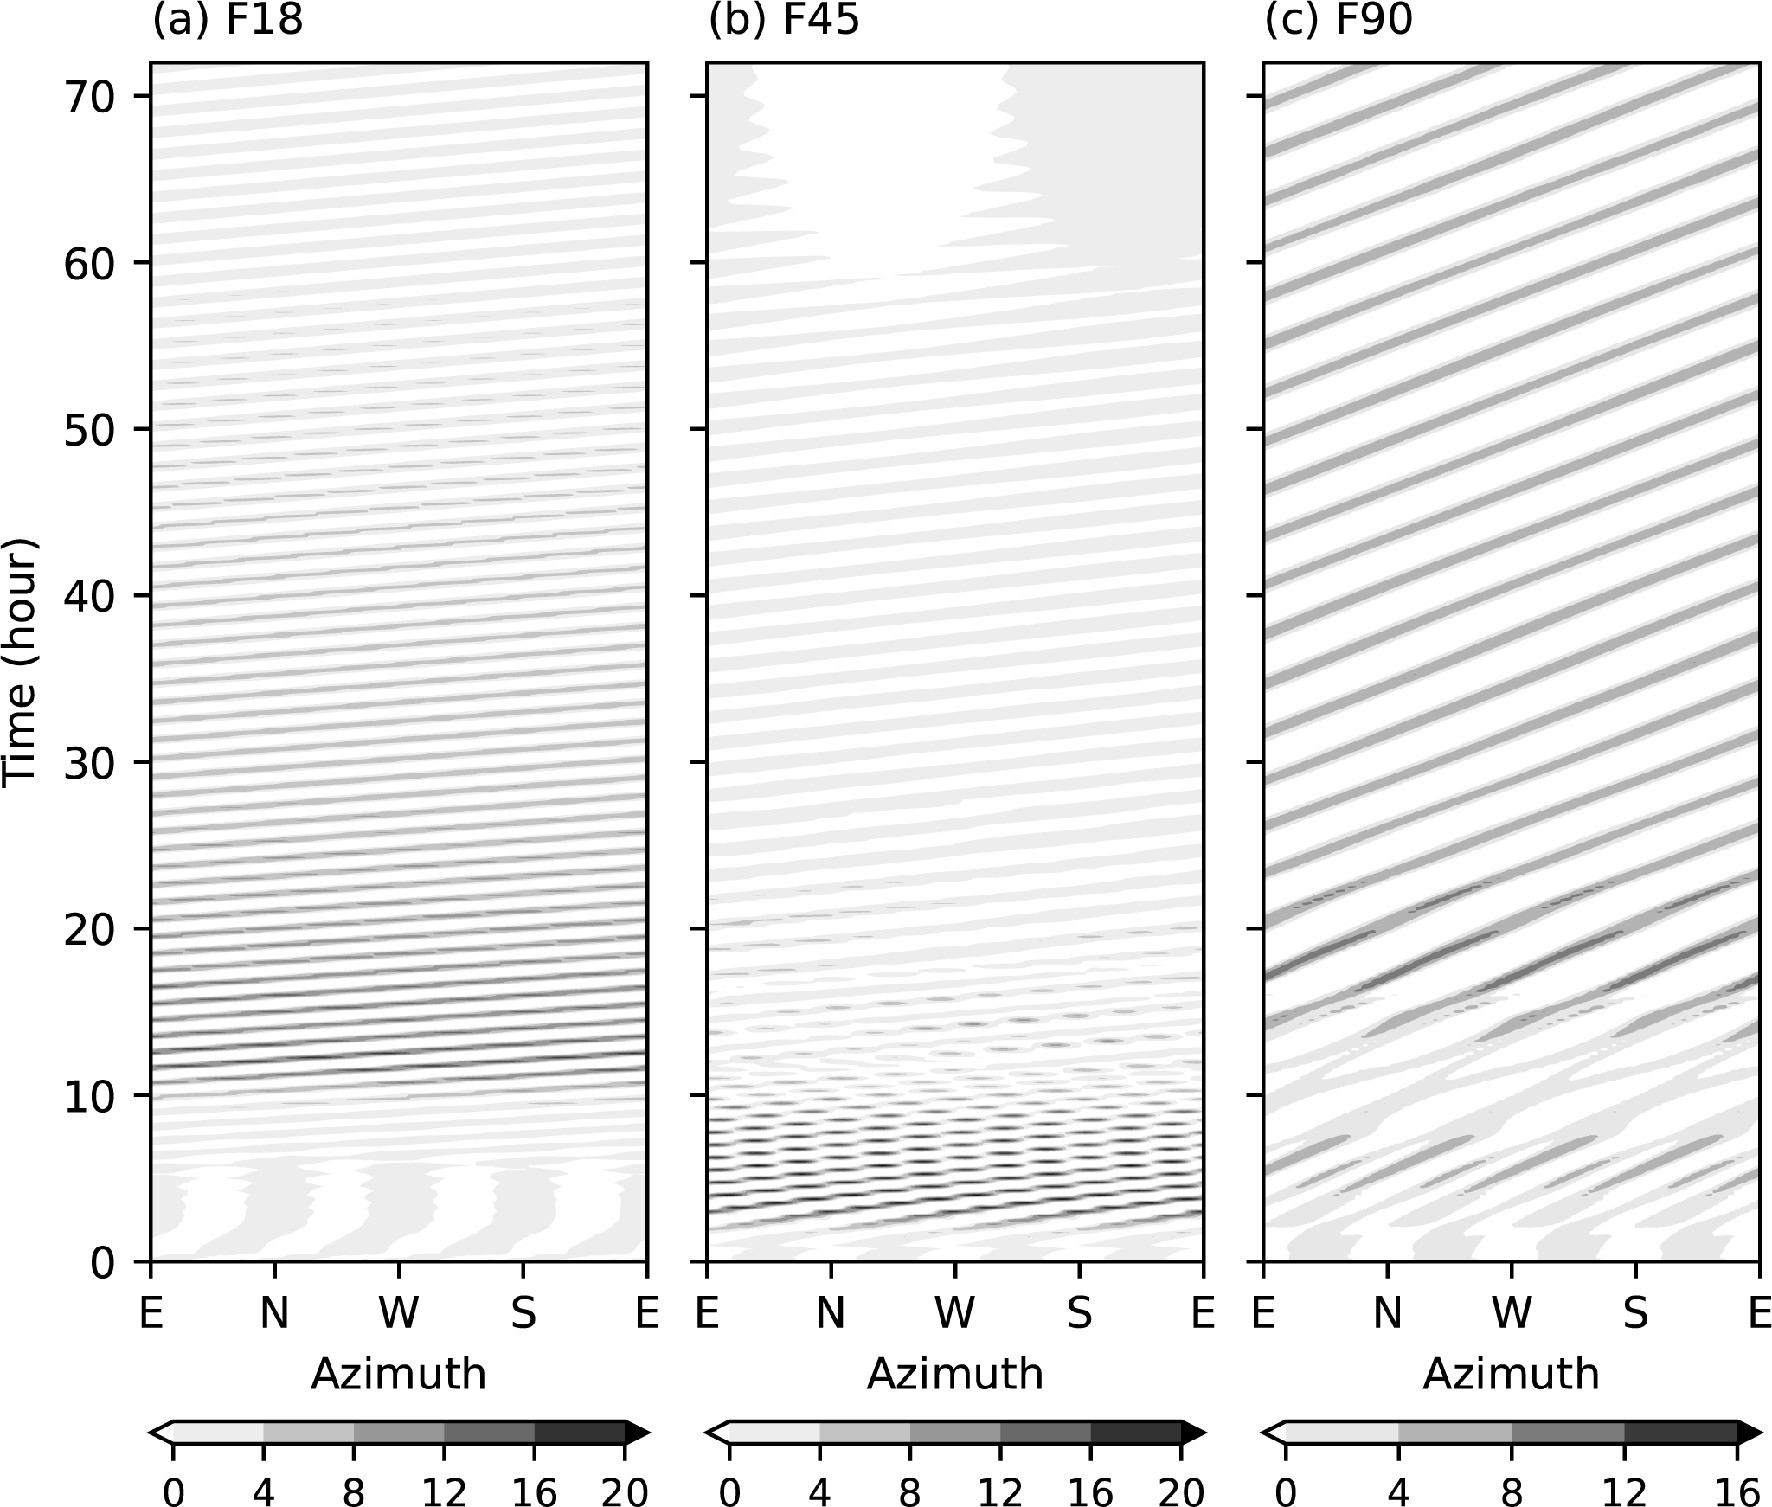
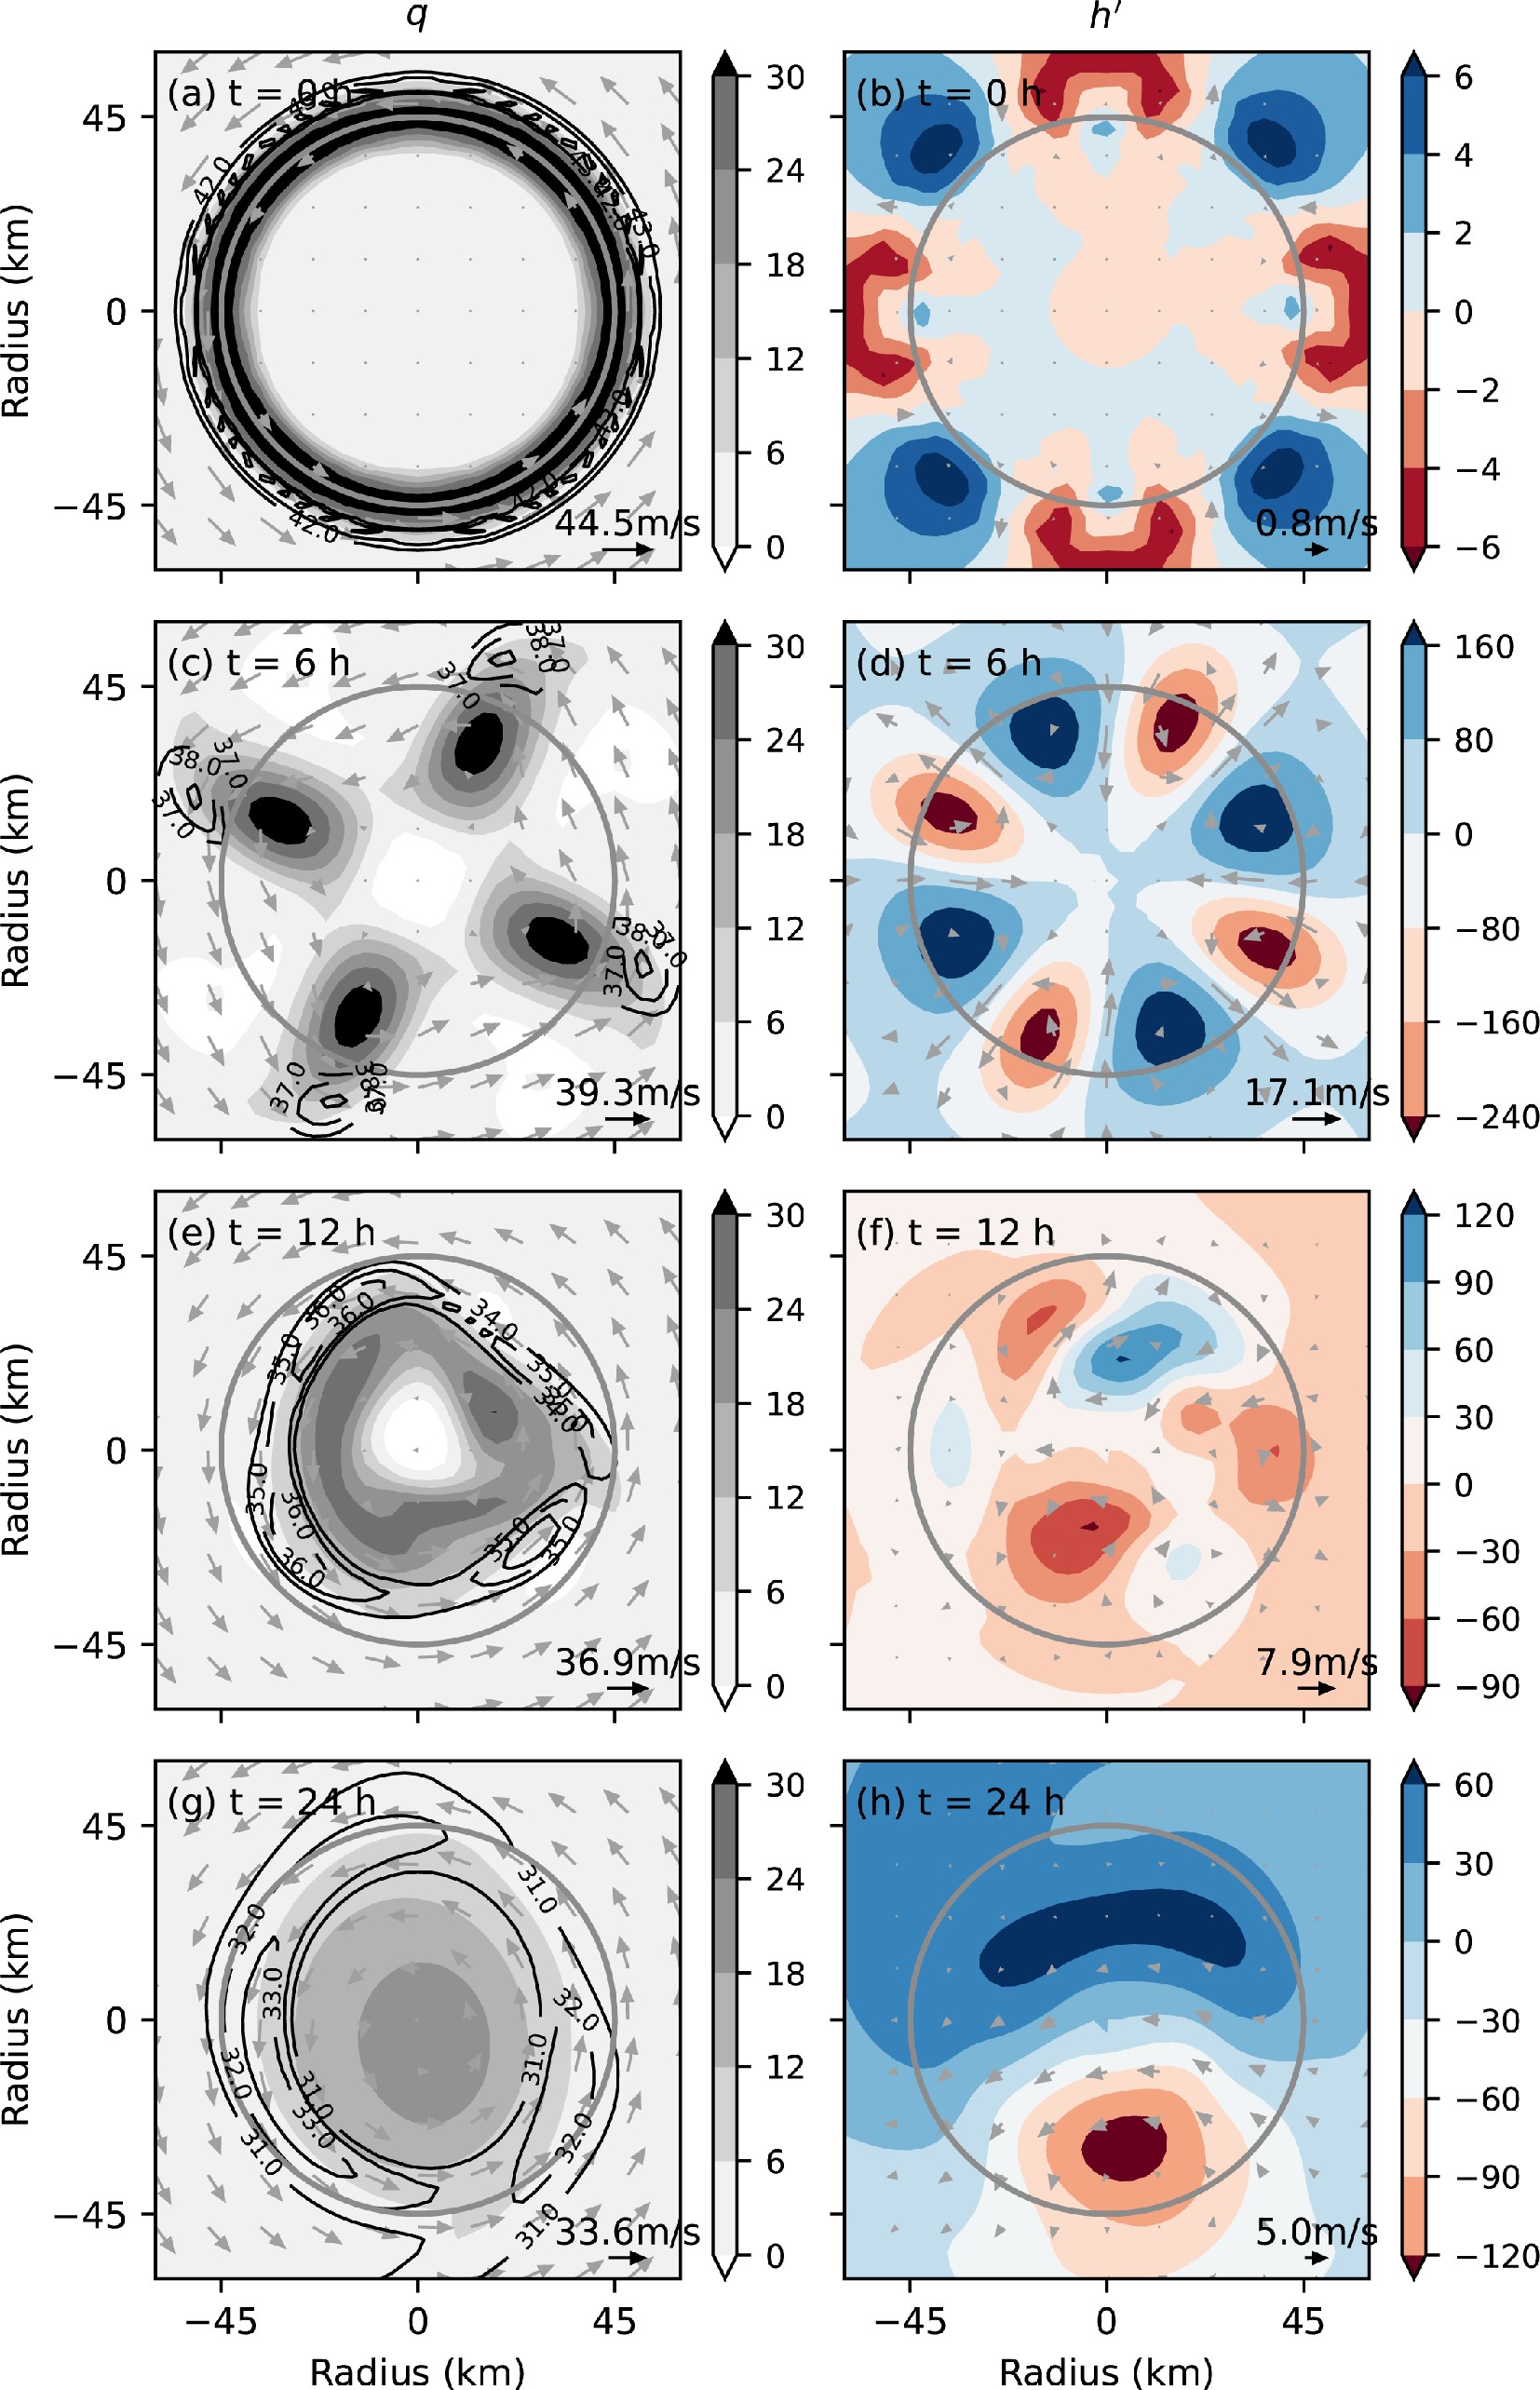
The evolution of three kinds of vortices with different basic-state PV rings and associated wind structures on the f-plane are examined first to explore the effects of barotropic instability under the weak-divergent condition. The azimuthal Hovmöller diagrams of the perturbation PV at the radii where the most significant disturbances appear illustrate the overall development of asymmetries in each experiment (Fig. 2). The vortex in F18 first displays a short-period, nearly stationary, and weak wavenumber-4 (WN-4) asymmetry (Figs. 2a and 3b), which might be a consequence of the model’s intrinsic limitation of finite grid spacing since similar fluctuations have been detected in other experiments as well (Figs. 4b and 5b). After the initial slow development, barotropic instability becomes evident with the wave gradually intensifying to form a WN-2 structure (see the elliptical PV structure in Fig. 3e and the WN-2 geopotential height anomaly in Fig. 3f). However, due to the radial expansion of the nonzero PV area during the first few hours (Figs. 3a and 3c, from t = 0 h to t = 6 h), the radial position of the growing VRW deviates from the initial location of maximum PV. In this case, when the VRW becomes significant, the maximum amplitude of the wave lies at a radius of about 30 km rather than at a radius of 18 km, justifying the azimuthal Hovmöller diagram in Fig. 2a to be drawn at a radius of 30 km. Although an elliptically-shaped eyewall (corresponding to a WN-2 perturbation) survives till the end of the simulation, the perturbation gradually weakens and is anticipated to dissipate.

Figure 2. Azimuthal Hovmöller diagrams of perturbation PV (grey shading; units: 0.1 PVU) in F18 at the radius of 30 km (a), F45 at the radius of 45 km (b), and F90 at the radius of 90 km (c), respectively.
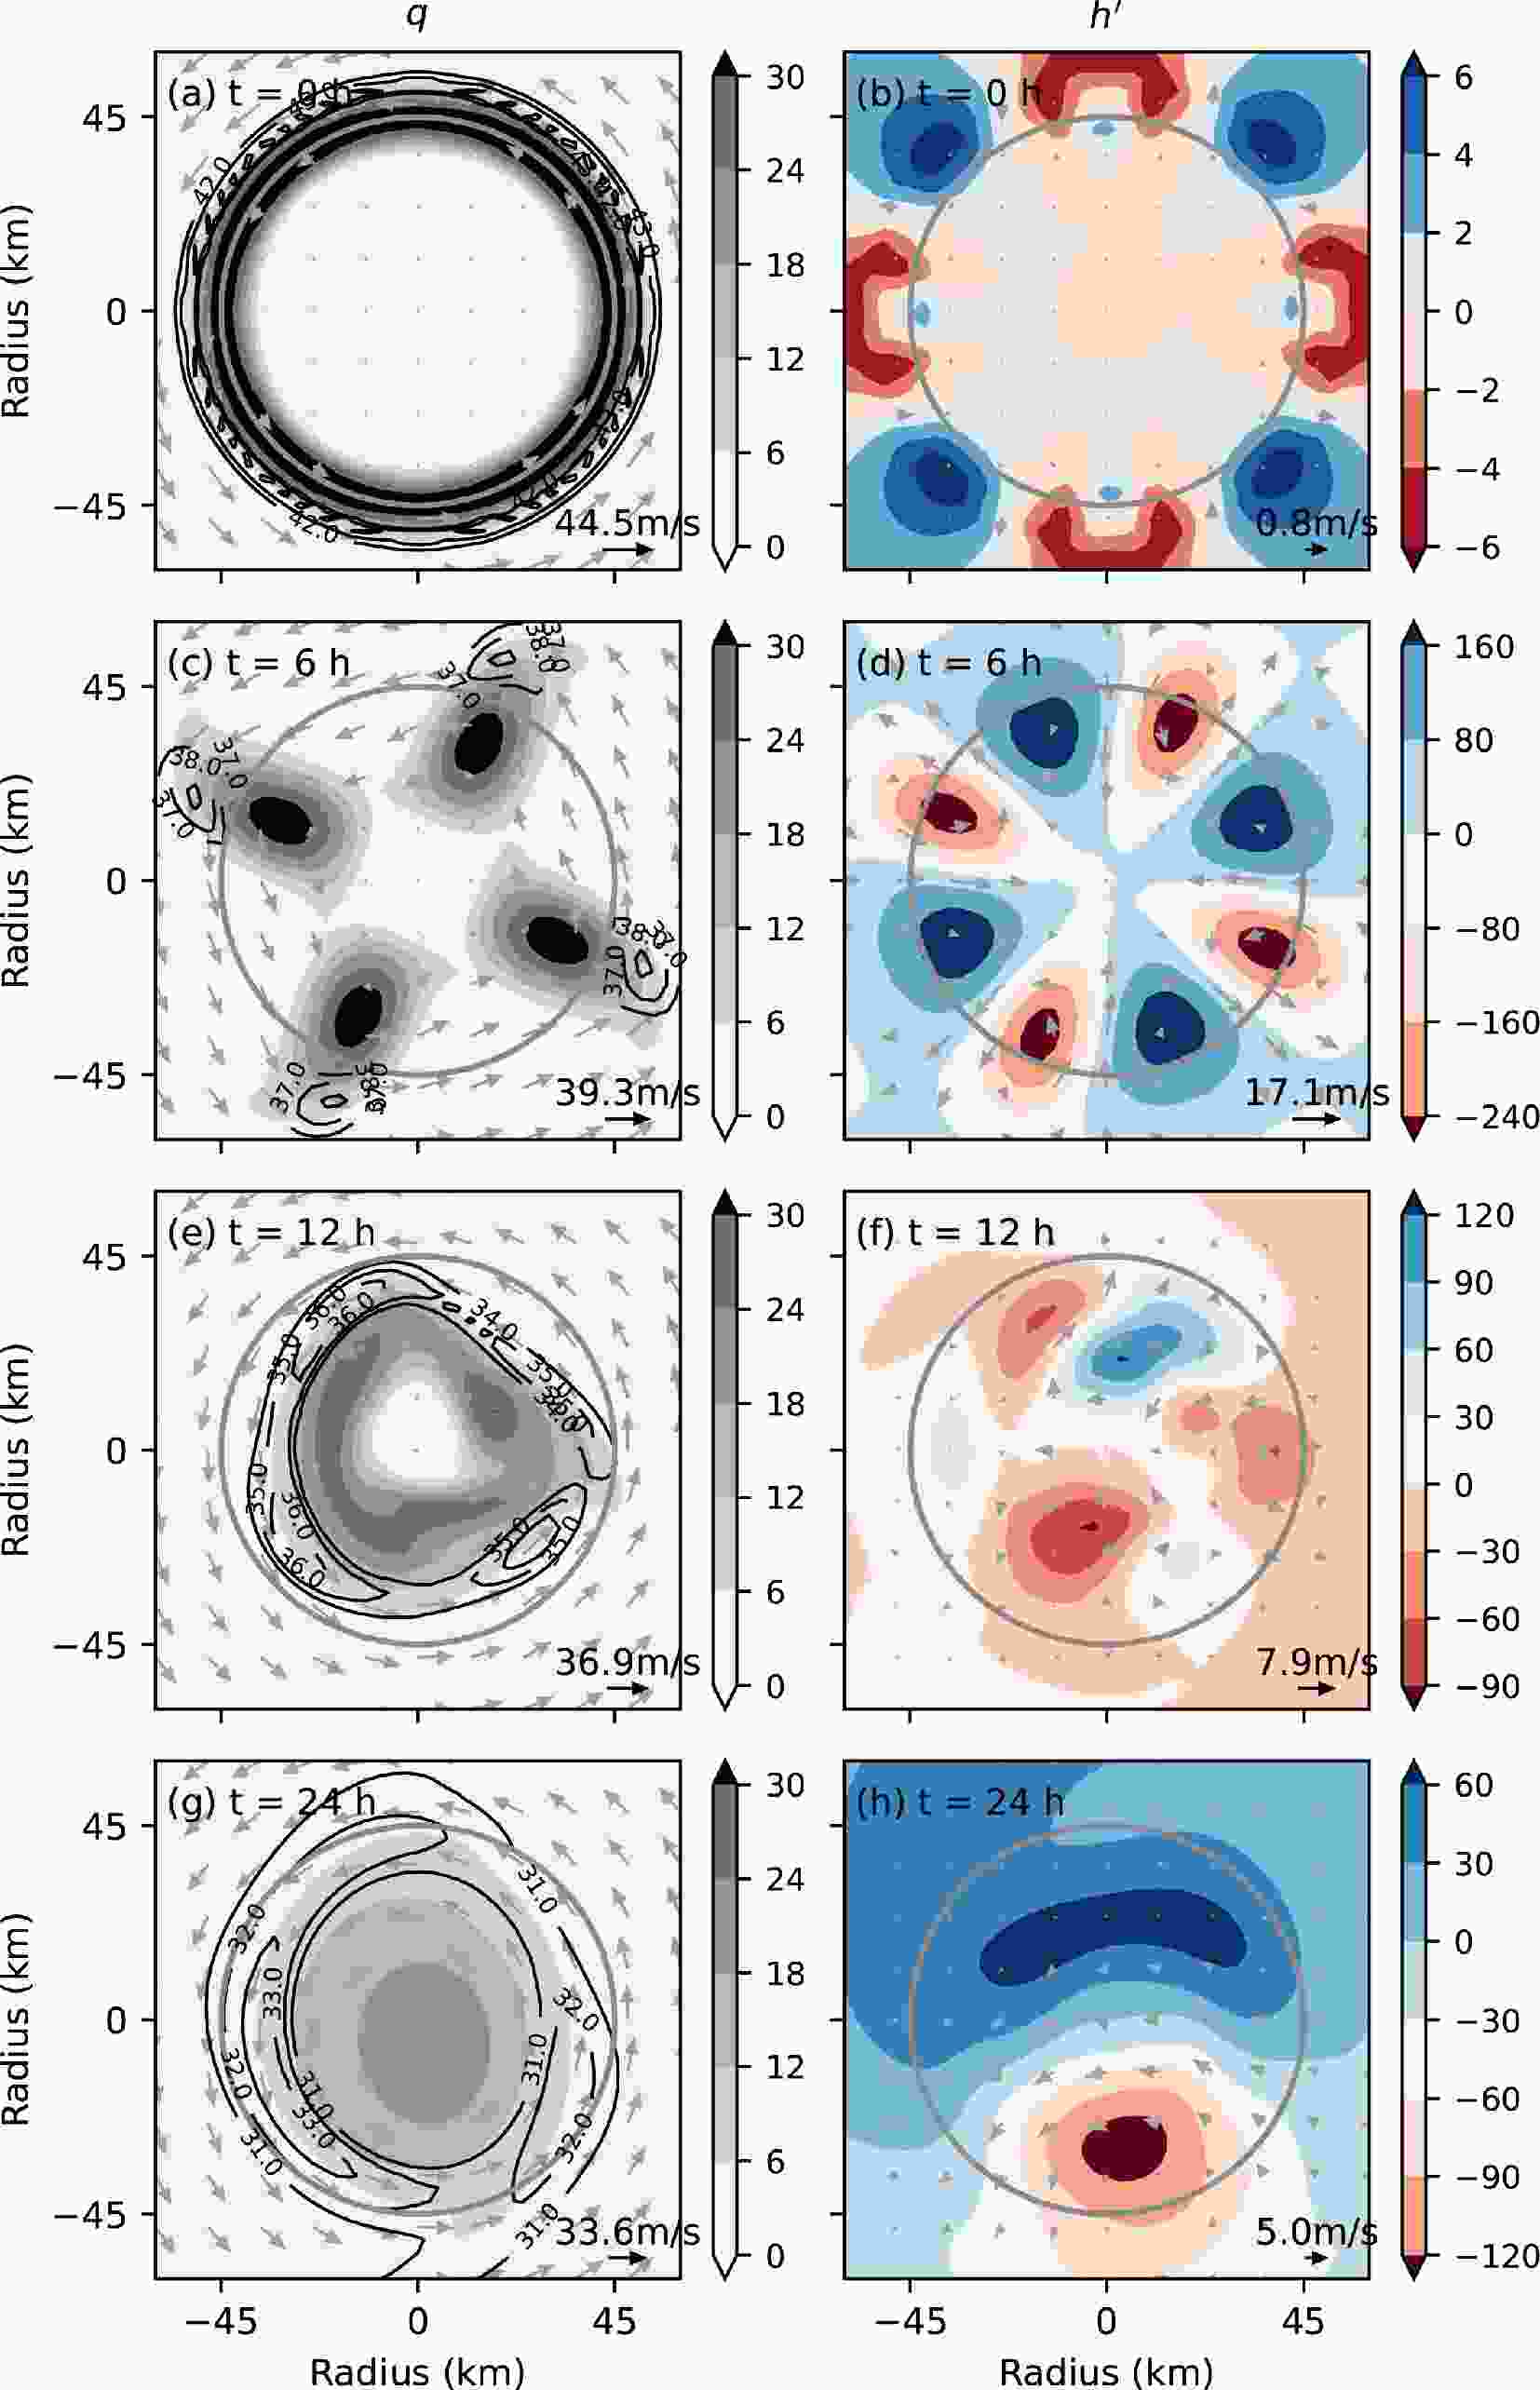
Figure 4. Same as Fig. 3 but over the domain of 60 × 60 (units: km) in F45. The grey circle in each panel is drawn at a radius of 45 km.

Figure 3. PV (left column; grey shading; units: 0.1 PVU) and perturbation geopotential height (right column; color shading; units: gpm) distributions over the domain of 45 × 45 (units: km), at 0 h, 6 h, 12 h, and 24 h in F18. Black contours, grey arrows in the left column are the total wind speeds and wind vectors, respectively. Grey arrows in the right column are the perturbation wind vectors. In each panel, the solid grey circle is drawn at a radius of 30 km, and the black velocity vector in lower right indicates the max wind. Note that contour levels are different in the right column for better graphic exhibition.
Compared with F18, the predominant disturbance in F45 has greater growth and decay rates. In F45, a WN-4 asymmetry develops and experiences a rapid amplification during the first 2–4 h (Fig. 2b), then the asymmetry breaks down into four PV mesovortices (Fig. 4c). Later, a transition from the WN-4 perturbation to a lower-wavenumber perturbation occurs through the merger process (since t = 10 h, see Fig. 2b). From then on, all disturbances remain insignificant, and ultimately, the initially hollow PV ring relaxes into a monopole, which is dynamically stable (Fig. 4g). Along with the axisymmetrization process, the central geopotential height drops from 1345 gpm at the beginning to 1263 gpm at the end of the simulation, implying an intensification of the vortex. It is consistent with the results of Kossin and Schubert (2001), who proposed that a large fall in central pressure is likely to occur after the merger of mesovortices in a two-dimensional nondivergent vortex.
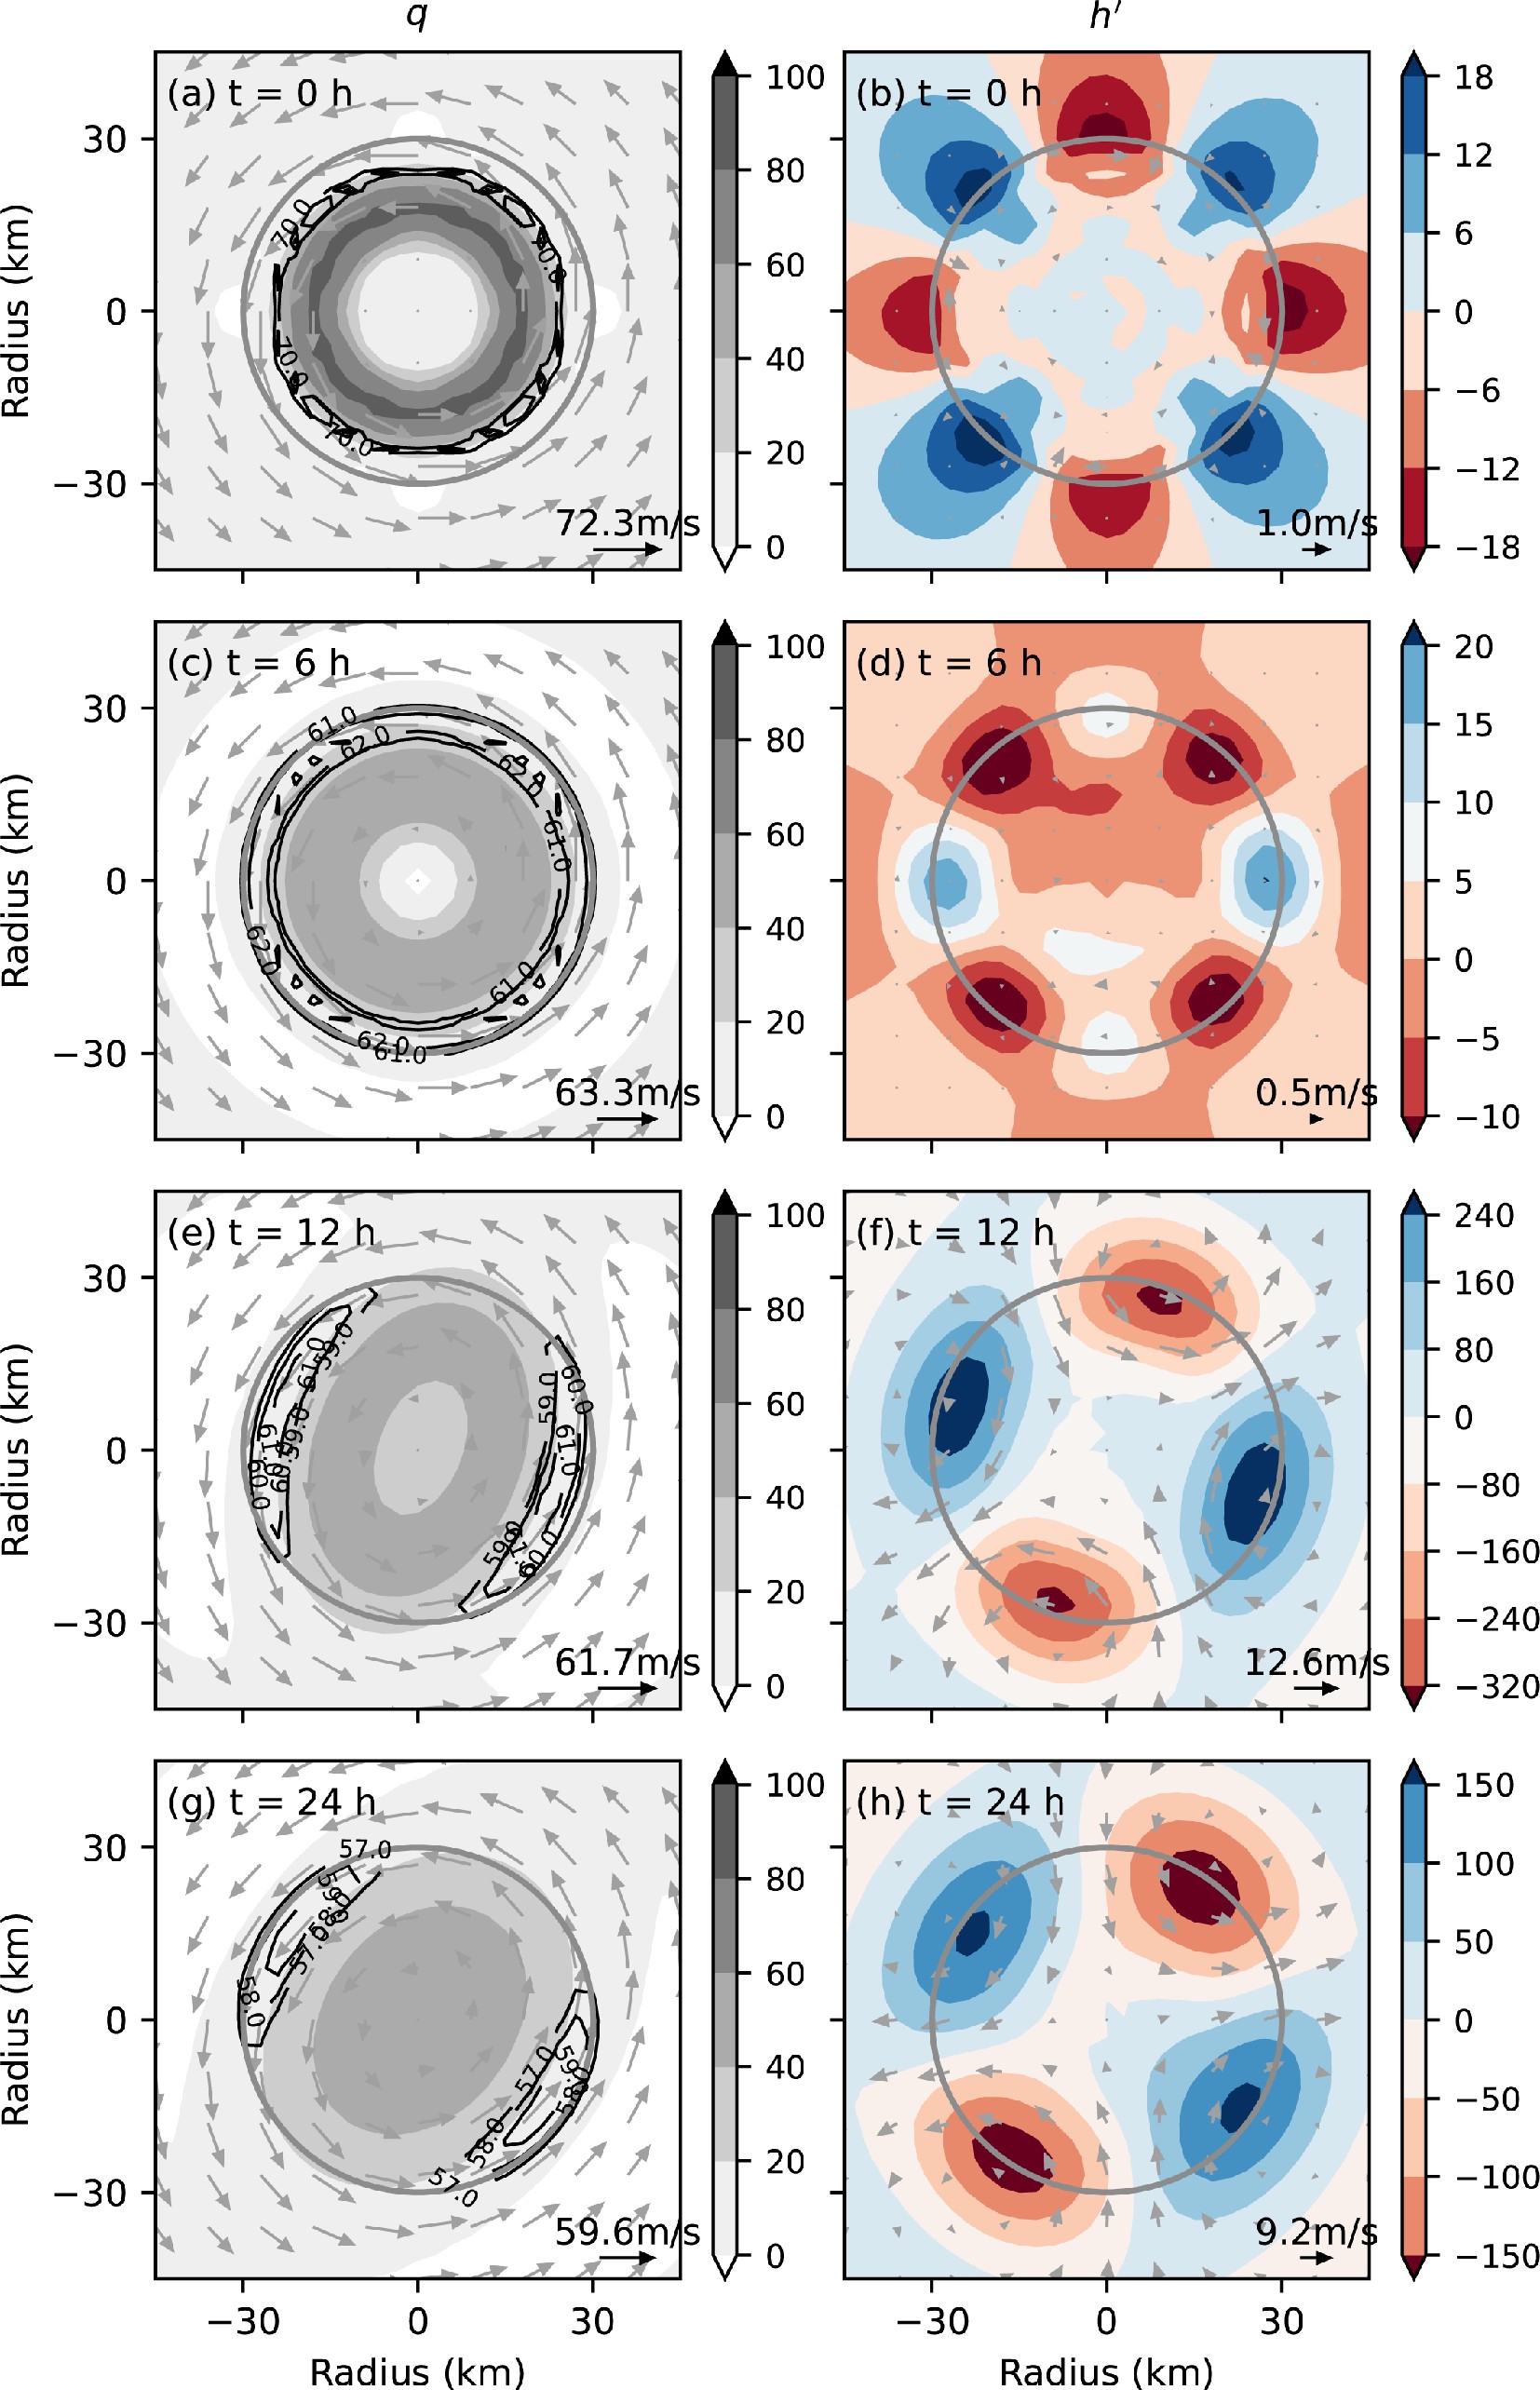
Unlike previous experiments, two waves of different wavenumbers dominate in F90 simultaneously. The initial PV ring promises both WN-4 and WN-8 VRWs to grow exponentially. Their superposition enhances half of the anomalies while the other half is suppressed (Fig. 5d), leading to an asymmetric structure of inflow/outflow. The strengthened anticyclonic perturbations are located downstream (relative to the TC cyclonic circulation) relative to the strengthened cyclonic perturbations, while they are located upstream relative to the suppressed cyclonic perturbations. The outflow associated with the downstream weaker cyclonic perturbations, imposed on the enhanced anticyclonic perturbations, would be opposed and offset by the stronger inflow associated with the upstream enhanced cyclonic perturbations. The net effect is an inward advection of enhanced anticyclonic perturbations. A similar analysis can be applied to the other mesovortices.

Figure 5. Same as Fig. 3 but over the domain of 120 × 120 (units: km) at 0 h, 3 h, 7 h, and 15 h in F90. The grey circle in each panel is drawn at a radius of 90 km.
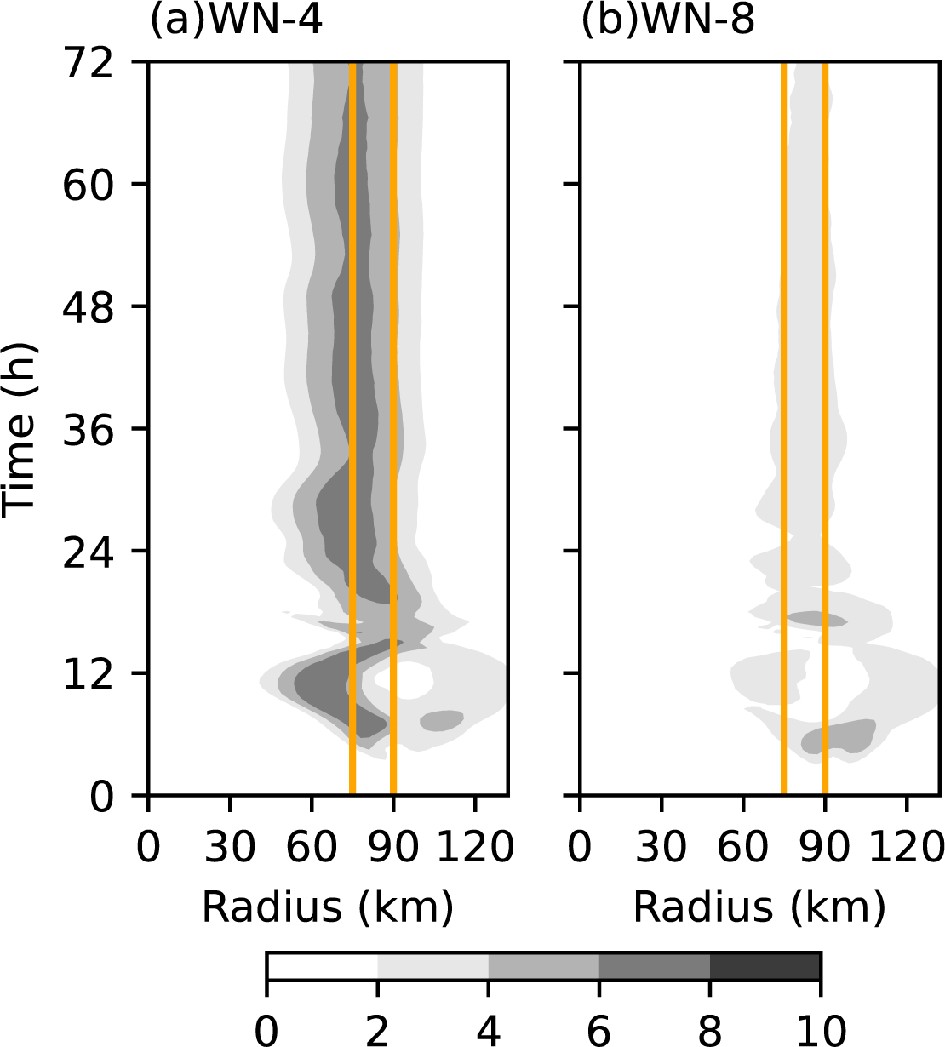
Consequently, those strengthened perturbations (both cyclonic and anticyclonic) would be advected inward, whereas those suppressed perturbations would be advected outward (Fig. 5f). Therefore, due to the vortex-vortex interaction, the eight pairs of cyclonic/anticyclonic anomalies split into two groups, with an inward-moving group of enhanced amplitudes and the other outward-moving group of reduced amplitudes. When the two groups of disturbances propagate into a proper position, the outer group would be translated inward by the inflow between the strengthened cyclonic and anticyclonic perturbations in the inner group, initiating the merger between the two groups as shown at the time of 15 h (Figs. 5g and 5h). The time-radius Hovmöller diagrams of the WN-4 and WN-8 components (Fig. 6) demonstrate the evolution of the two unstable modes and the wave-wave interaction discussed above. Exponential growths of WN-4 and WN-8 waves occur simultaneously at 3 h (Figs. 6a and 6b), followed by the radial separation of the enhanced and suppressed WN-4 perturbations (Fig. 6a). The merger of the oppositely moving groups at 15 h leads to the re-intensification of the WN-4 perturbation, which can maintain itself for hours. After the radial movement and the merger process among mesovortices, the WN-4 perturbation keeps its maximum amplitude at a radius of 75 km instead of the initial radius of 90 km after 18 h (Fig. 6a). Though the WN-8 VRW also persists for a long time, its intensity is much weaker than the WN-4 VRW. Vortex development in F90 implies that a certain PV structure can enable VRWs with multiple wavenumbers emanating from barotropic instability, and the wave-wave interactions can cause complex nonlinear behaviors of mesovortices.

Figure 6. Time-radius Homvöller diagrams of the maximum PV amplitudes (grey shading; units: 0.1 PVU) of WN-4 (a) and WN-8 (b) waves in F90. Yellow lines denote the radius of 75 km and 90 km, respectively.
Results from numerical experiments based on the shallow-water-equation model demonstrate that the basic-state PV structure has vital influences on the excitation of barotropic instability and the subsequent nonlinear evolution. A less hollow vortex undergoes exponential growth at a smaller wavenumber with a relatively slower growth rate and gradually decays, ultimately resulting in a PV monopole. On the contrary, a hollower vortex exhibits a greater growth rate at a larger wavenumber and can maintain its coherent asymmetric structure for hours and days, which was also documented by Kossin and Schubert (2001) under a nondivergent framework. These results are in good agreement with those of Schubert et al. (1999), who employed a nondivergent barotropic model to study eyewall evolution driven by barotropic instability, suggesting that weak divergence has very limited effects on the linear instability of barotropic vortices. Note that although the shallow-water-equation system allows for the existence of inertia-gravity waves, disturbances in all experiments exhibit the typical features of VRWs that are dominated by the quasi-balanced dynamics, namely, the positive vorticity anomaly is in phase with the negative geopotential height perturbation (Figs. 3, 4, and 5).
-
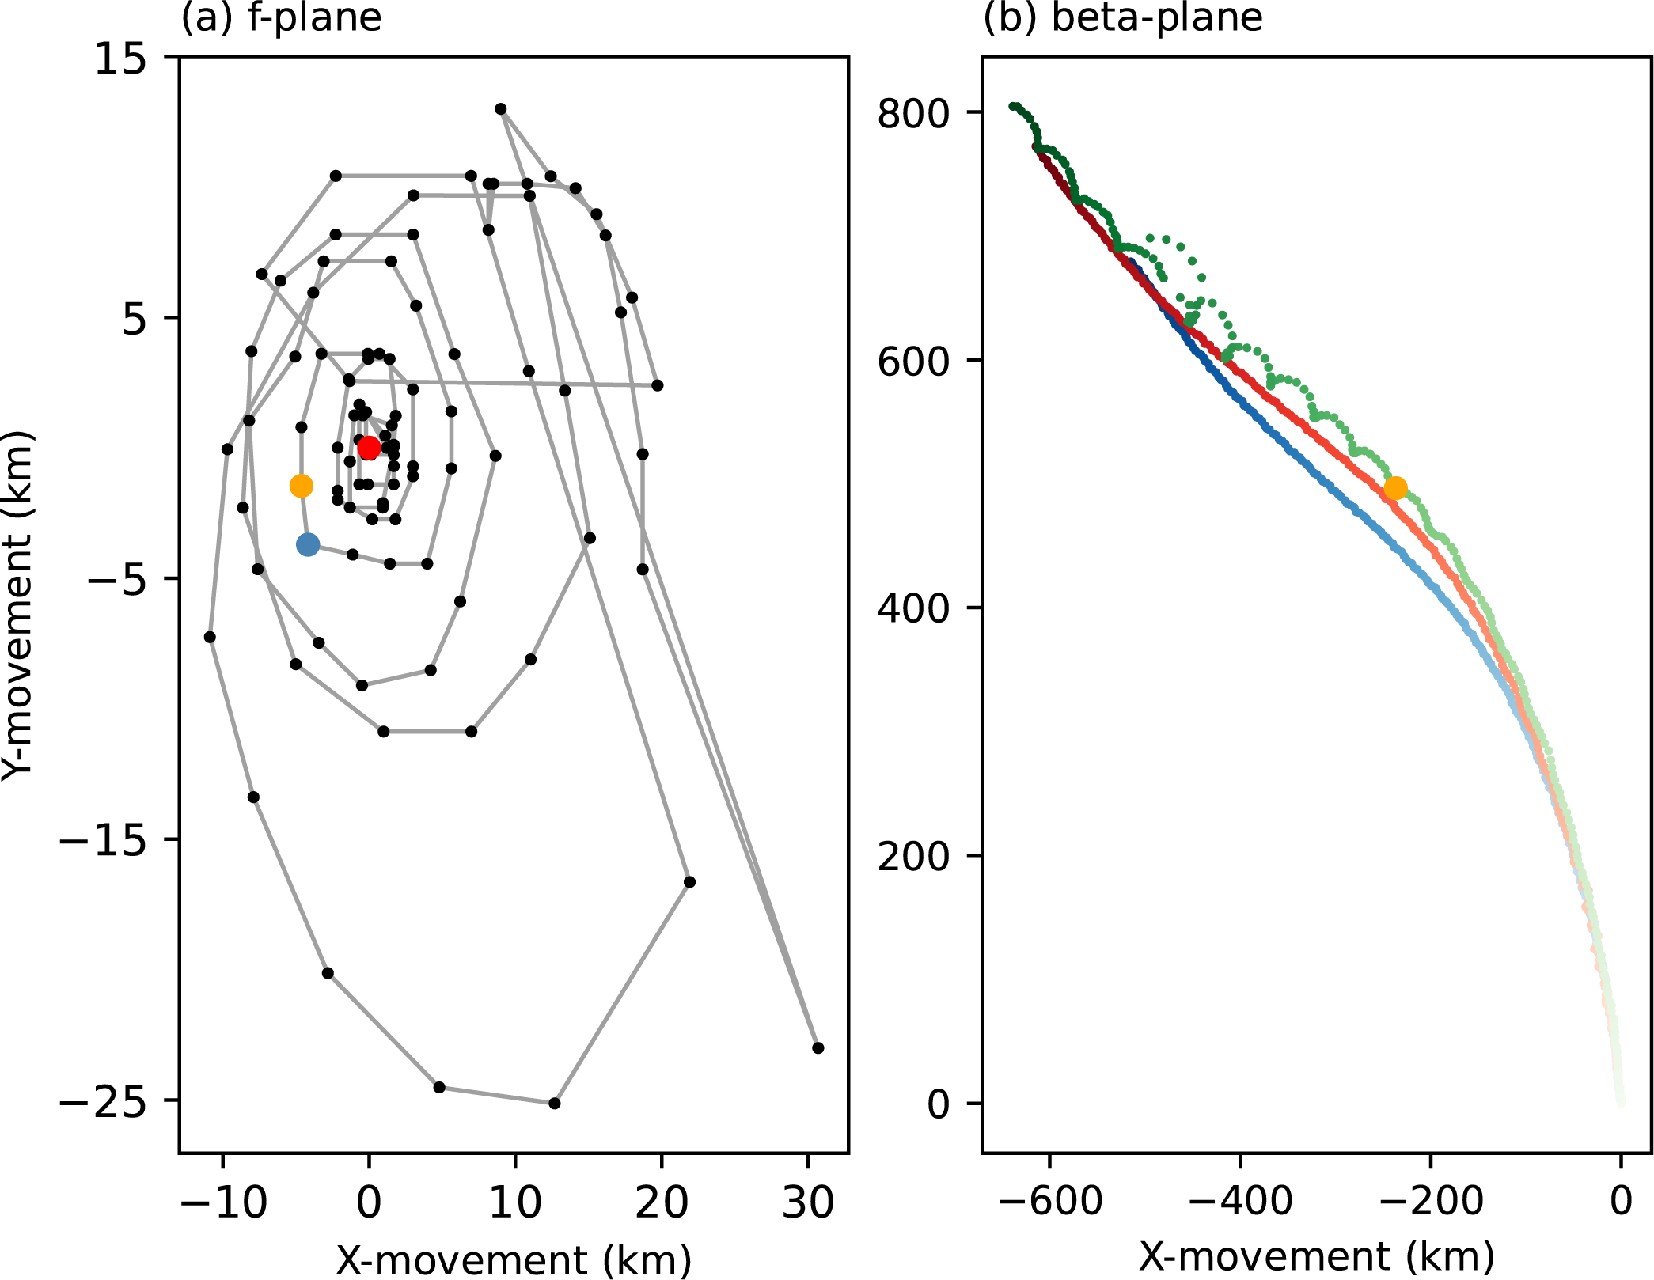
In a barotropic TC-like vortex developing in a quiescent environment on a beta-plane, a nearly stationary (relative to the vortex) WN-1 perturbation (i.e., the beta gyres) over a large area will be present. Namely, a positive geopotential height anomaly with anticyclonic circulation appears to the east of the storm center, and a negative geopotential height anomaly with cyclonic circulation appears to the west, with southeasterly ventilation flow in between, which will advect the whole vortex northwestward. The translational speed and direction are sensitive to the wind structure at a radial range of 300 km to 1000 km from the vortex center (Fiorino and Elsberry, 1989). Overall, the northwestward displacements are quite similar among experiments B18, B45, and B90 except for the wobble of the TC vortex (a substantial oscillation of the vortex center) from the time around 60 h in B90 (Fig. 7b), which is, in fact, a manifestation of algebraic instability (Smith and Rosenbluth, 1990; Nolan and Montgomery, 2000; Nolan et al., 2001). The F90 vortex also experiences a TC wobble from 90 h of the simulation (Fig. 7a), whereas the vorticies in F18 and F45 hardly move during the simulation period (not shown).
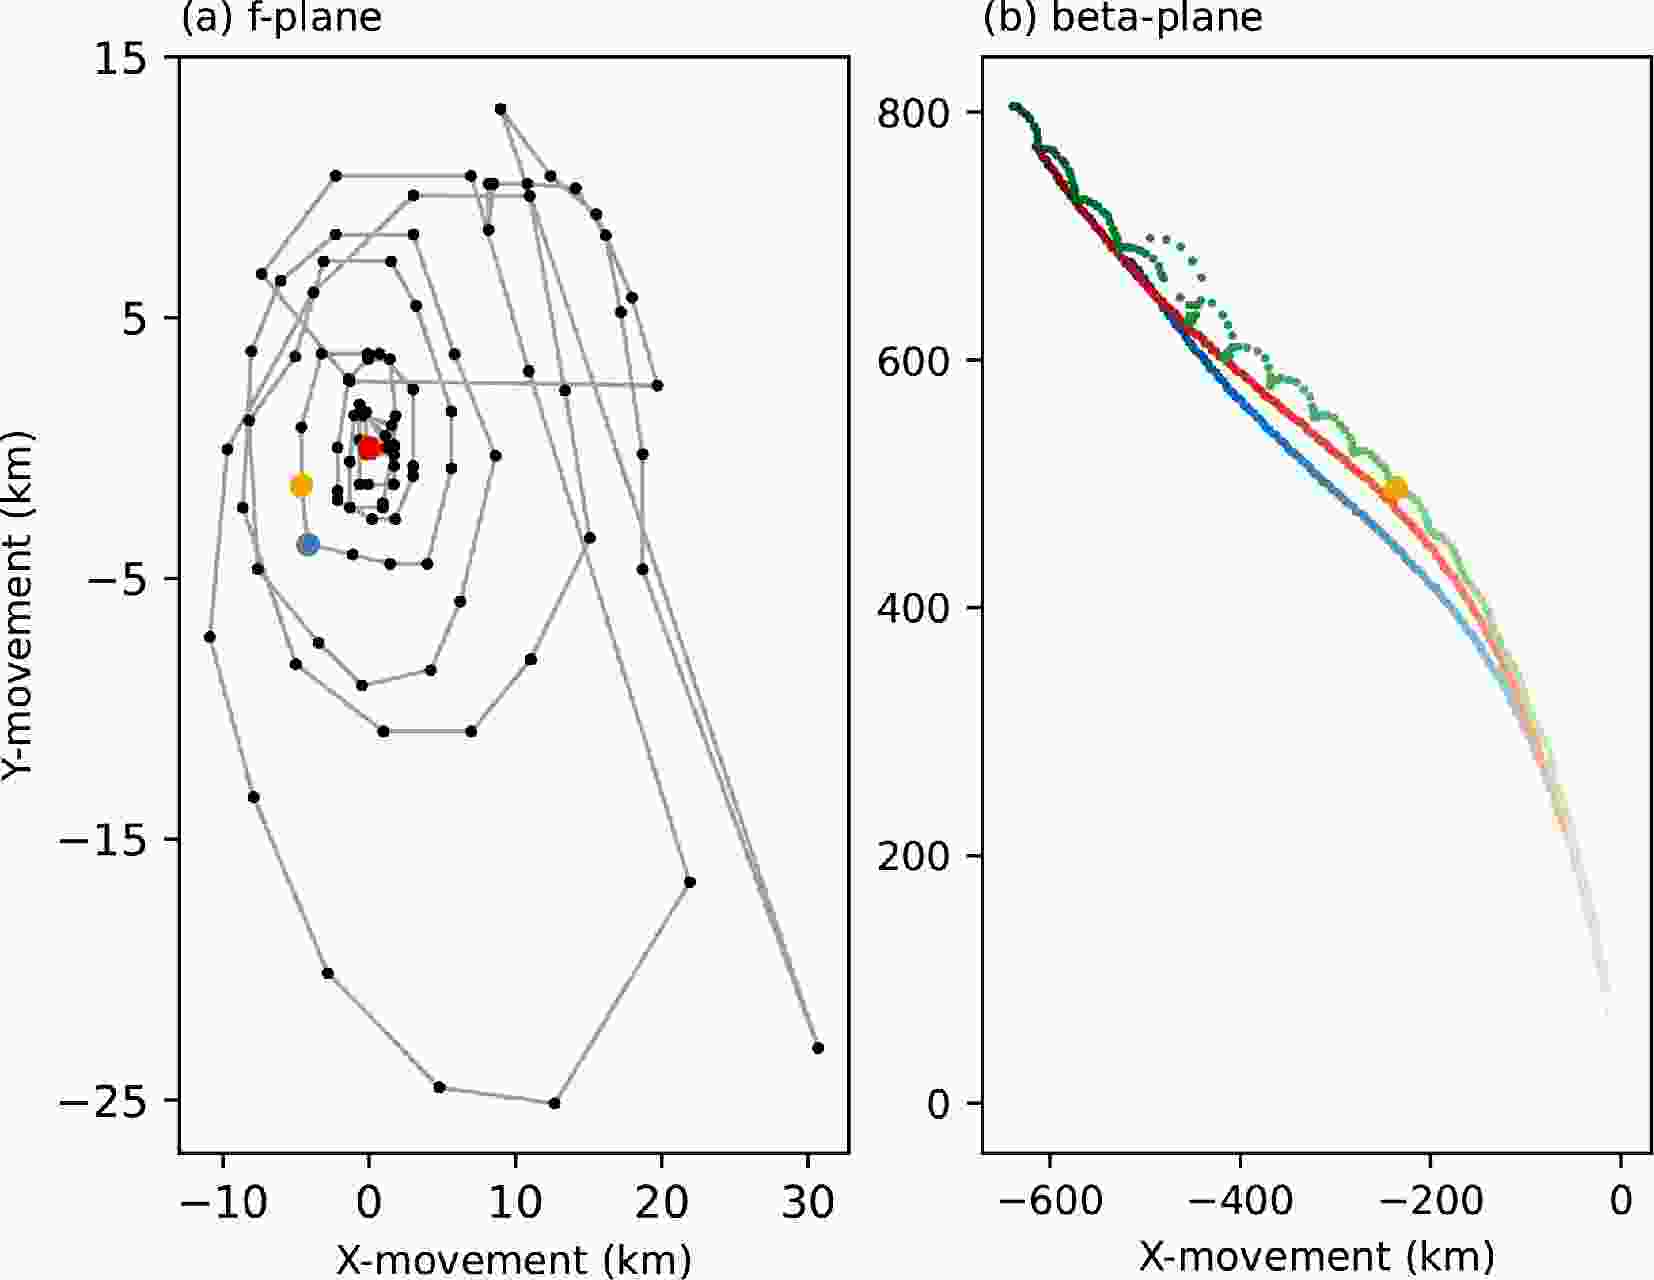
Figure 7. Trajectories of vortex centers over the simulation time of 120 h. The vortex center is identified as the origin according to which the vortex has the largest azimuthally averaged winds. The left panel (a) displays the track of the vortex center in F90, in which black dots are the locations of the vortex center with a time interval of 30 min; grey curves indicate displacements of the vortex center during the time intervals; and the red dot [at the position of (0 km, 0 km)], yellow dot, and blue dot denote the vortex center positions at the times of 60 h, 90 h, and 91 h, respectively, indicating the appearance of significant wobble occurring at 90 h of simulation. The right panel (b) shows three trajectories for the vortices in B18 (blue dots), B45 (red dots), and B90 (green dots). Dots from faint to dark imply the time from the beginning to the end of simulations with an interval of 30 min. The yellow dot denotes the position of the vortex center at 60 h when the vortex begins to wobble substantially in B90.
-
With the occurrence of the beta gyres and associated beta drift, there are little changes in the evolution of unstable VRWs (presented as elliptic or polygonal eyewalls) and basic flows on the beta-plane in B18 and B45 compared to their counterparts on the f-plane in F18 and F45 (Figs. 8a and 8b). In contrast, the development of the inner-core structure of the vortex in B90 is influenced by the beta effect. Although four enduring mesovortices in both F90 and B90 have undergone merger processes and eventually evolved into monopoles, there is a large discrepancy between the timing of the breakdown of asymmetric structures in the two experiments. The intensification of the basic circulation, which results from the axisymmetrization of asymmetric motion, takes place around 70 h in B90 but does not appear until 100 h in F90. Besides, a decrease of perturbation energy of the unstable modes (WN-4 and WN-8 waves) begins from the time of 60 h in B90 but about 30 hours later in F90 (Fig. 8c), which are consistent with the times when the vortices start to wobble substantially in the two experiments (Fig. 7).
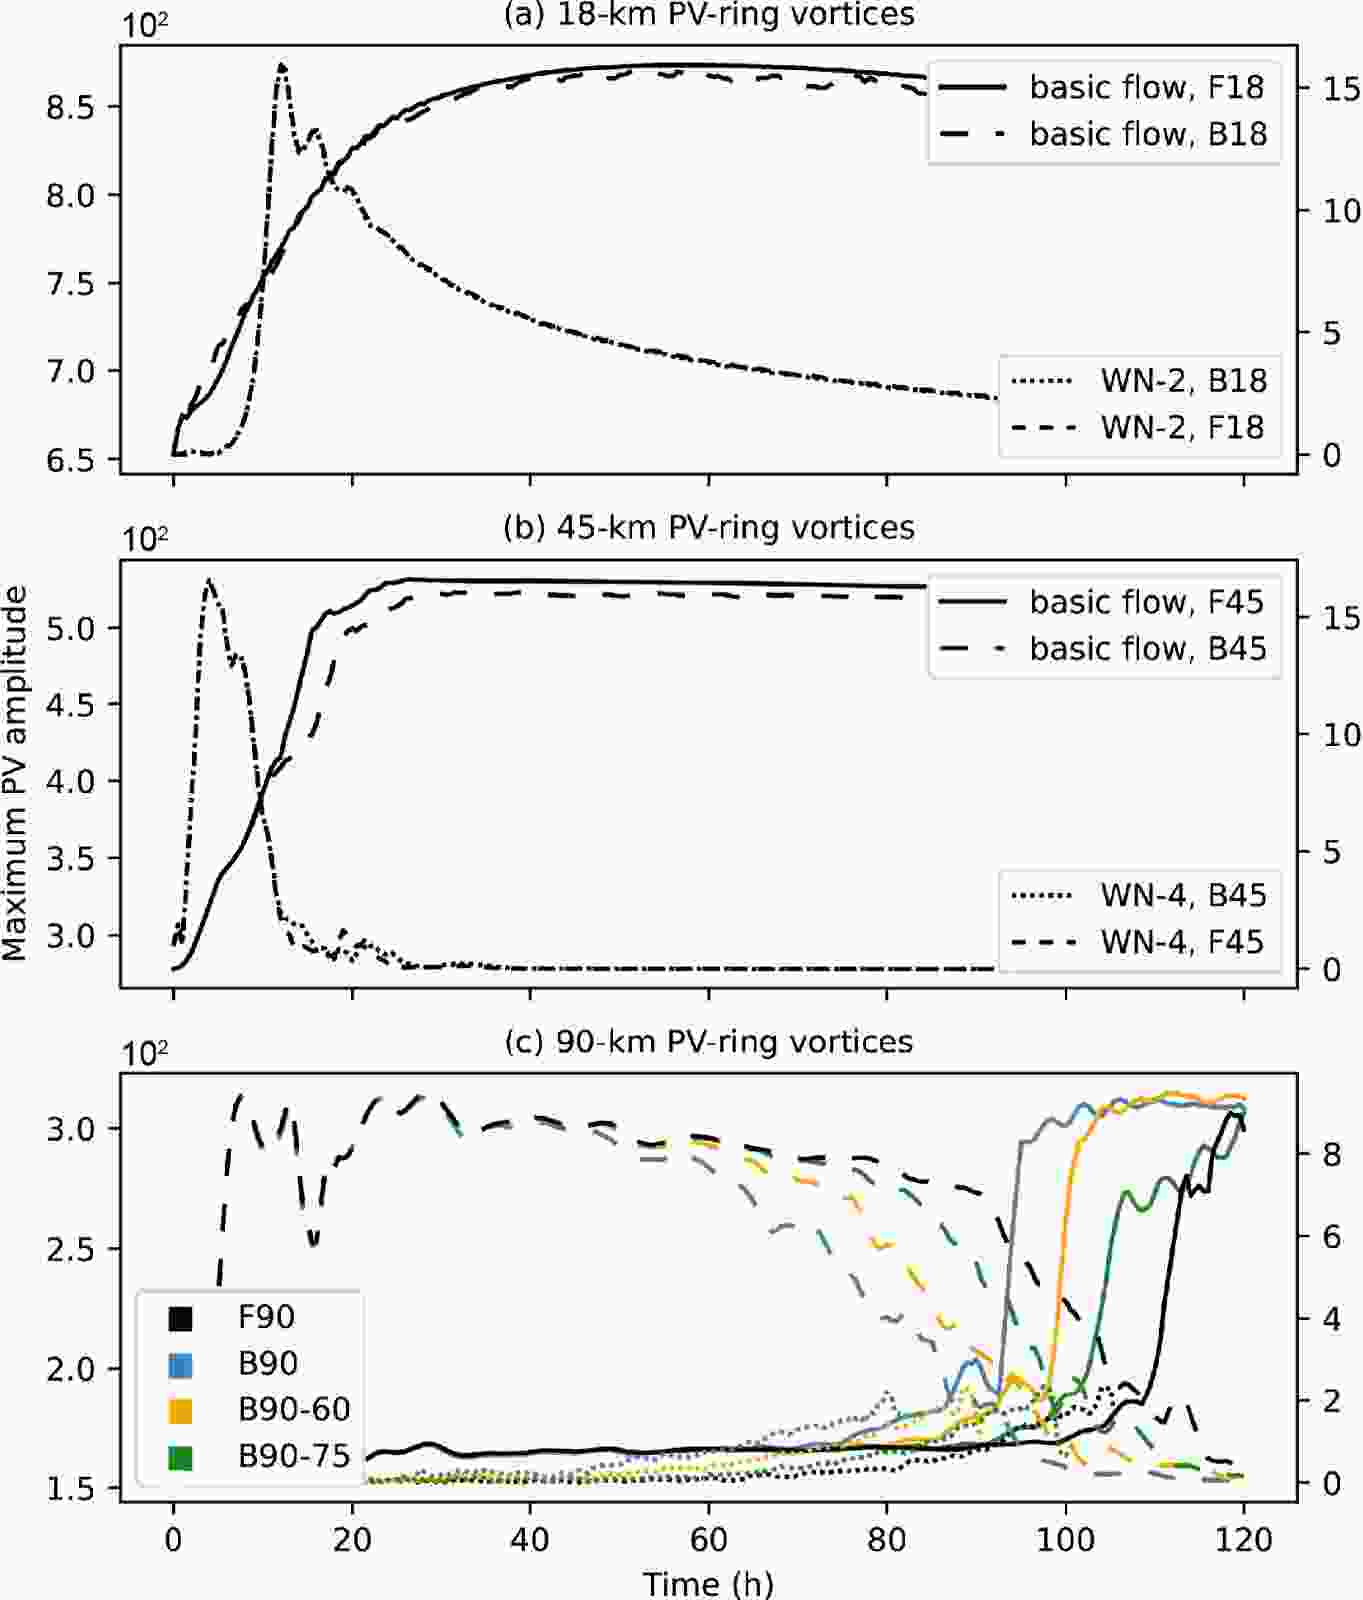
Figure 8. Temporal evolution of the maximum PV amplitudes (units: 0.1 PVU) of the unstable modes and the basic circulation in each experiment. The maximum PV amplitude of the basic flow in each experiment corresponds to the left axis and is summed over the circular region within the radius of 120 km to cover the high-PV annulus. The maximum PV amplitudes of the unstable modes at the radius of the maximum intensity of perturbations (top panel: 30 km; middle panel: 45 km; bottom panel: 75 km) in each experiment correspond to the right axis. In the bottom panel, solid curves denote the maximum PV amplitudes of the basic flow, dashed curves denote the sum of maximum PV amplitudes of WN-4 and WN-8 waves at a radius of 75 km, and dotted curves denote the maximum PV amplitudes of WN-1 disturbances that are associated with the algebraic instability at a radius of 75 km. Since the modal mode in the asymptotic solution of algebraic instability is exactly proportional to the basic-state vorticity gradient, we draw the evolution of maximum PV amplitudes of the WN-1 disturbances at a radius of 75 km where the basic-state PV gradient is maximized in the 90-km PV-ring experiments. The magnitude at the upper-left corner in each panel corresponds to the left y-axis.
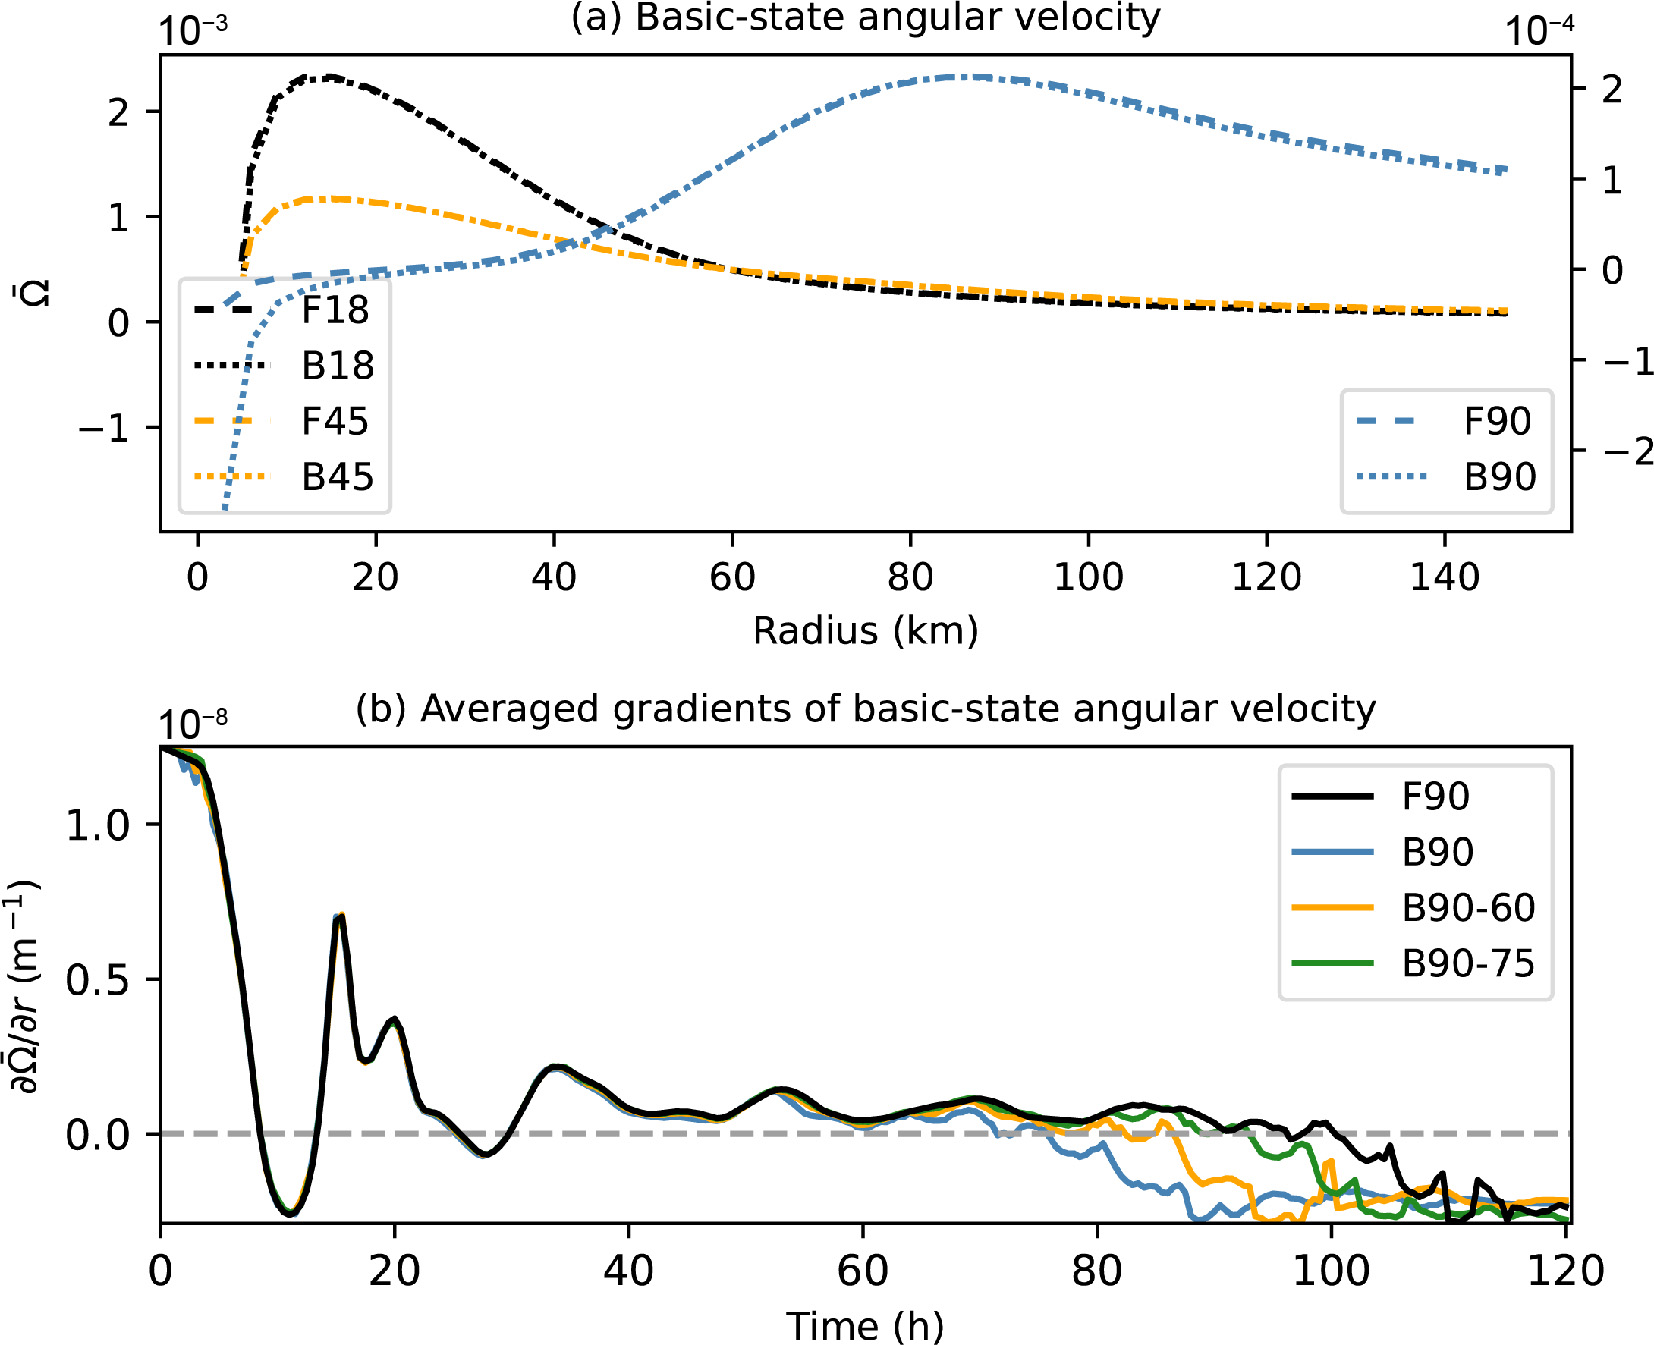
The wobble of the vortex center is part of the asymptotic solution for a WN-1 disturbance on a circular vortex with the existence of a local maximum in the basic-state angular velocity off the vortex center (Nolan and Montgomery, 2000). Nevertheless, due to the active interaction between the eye and the eyewall in experiments of 18-km and 45-km PV-ring vortices, there is continuous transport of large angular momentum to the central area, resulting in the maximum angular velocity near the vortex center (Fig. 9a). This may explain the absence of algebraic instability in these experiments. In contrast, the asymmetries in F90 and B90 can maintain their intensity and structure for a long time without pronounced mixing of angular momentum within the vortices, thus a local maximum of angular velocity outside the eyewall may exist (Fig. 9a). According to Nolan and Montgomery (2000), who first applied the concept of algebraic instability in plasma physics (Smith and Rosenbluth, 1990) to two-dimensional inviscid TC-like vortices, the asymptotic solution consists of three components: (1) a pseudo-mode, which accounts for the wobble displacement of the vortex center; (2) a growing mode (modal mode) with a secular growth rate that is proportional to
$ {{t}}^{\text{1/2}} $ , whose perturbation vorticity is exactly proportional to the basic-state radial vorticity gradient up to the radius of the angular velocity maximum; (3) the residual part, comprised of a collection of sheared VRWs, without the support of which the growing mode is unable to develop. Figure 8c presents the temporal evolution of maximum PV amplitudes of the WN-1 disturbances associated with algebraic instability until the axisymmetrization takes place in experiments of F90 and B90①. The amplification of the WN-1 perturbations in F90 and B90 is accompanied by the emergence of significant trochoidal movements of the vortices and the weakening of the two unstable modes. Note that there are only slight changes in the strength of the basic circulation until a great surge occurs at 70 h in B90 and 100 h in F90. This suggests that the unstable modes, not the basic flow, are the energy source for the algebraic instability.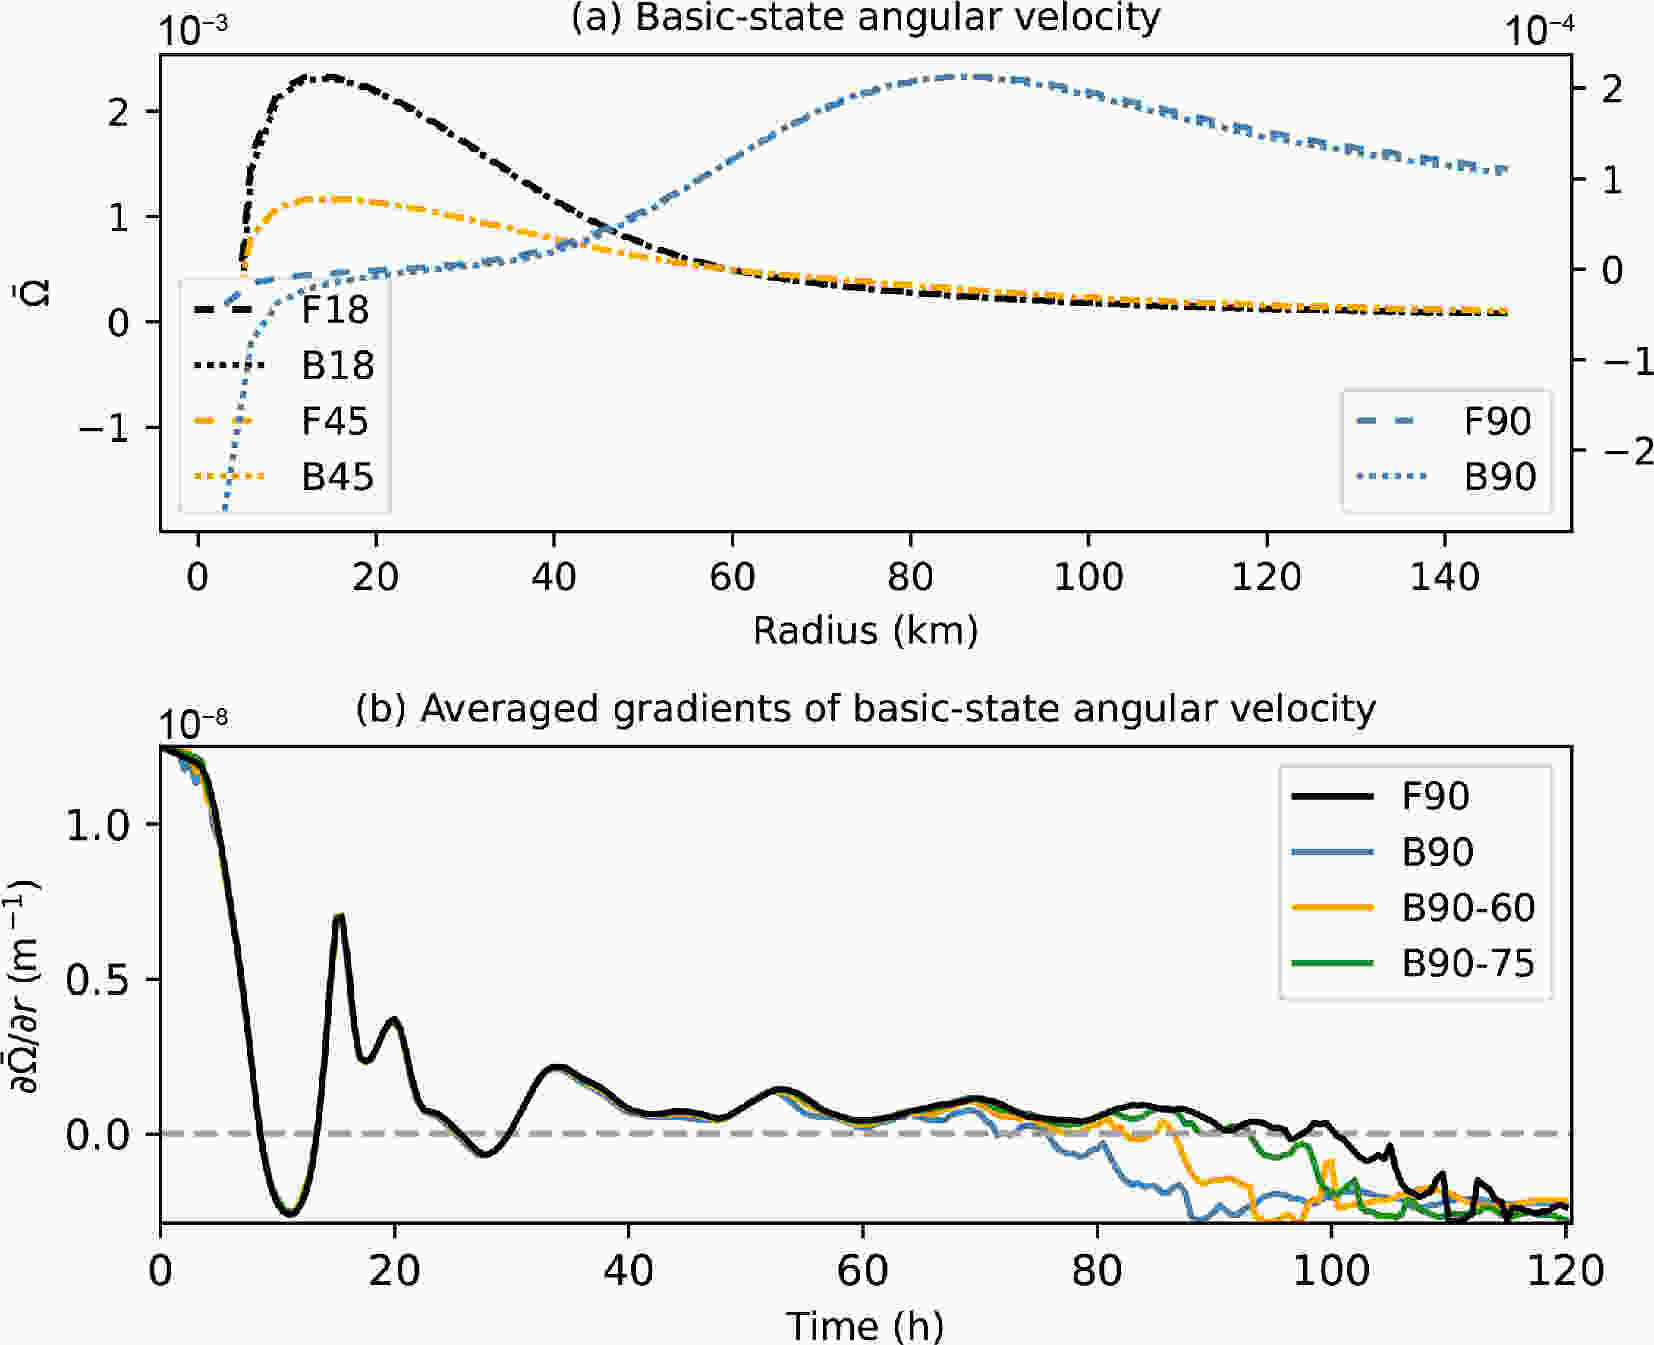
Figure 9. Radial profiles of the angular velocity in the experiments of 18-km PV-ring vortices, 45-km PV-ring vortices, F90 and B90 at 60 h when the vortex starts to wobble substantially in B90 (a), and the temporal evolution of the averaged gradient of basic-state angular velocity over the annular area between the radii of 75 km and 90 km (b). In the top panel, black and yellow lines correspond to the left axis, while blue lines correspond to the right axis. The magnitude at the upper left (right) corner corresponds to the left (right) y-axis in each panel, respectively.
The evolution of the algebraic instability is interfered with by the sheared VRWs. The energy transfer efficiency to the modal mode in a two-dimensional inviscid axisymmetric vortex can be computed by the formula given below (Nolan and Montgomery, 2000)
where
$ E{'} $ is the perturbation energy;${{\overline \Omega }}$ is the basic-state angular velocity;${{u}}'_{\text{mod}}$ and${{v}}_{\text{mod}}'$ are the radial and azimuthal velocities of the modal part, respectively;${{u}}'_{\text{resid}}$ and${{v}}'_{\text{resid}}$ are the radial and azimuthal velocities of the residual part, respectively. Based on Eq. (16), the growth rate of the modal mode is affected by the radial gradient of the basic-state angular velocity in the area where algebraic instability emerges. Figure 9b shows the evolution of the averaged radial gradient of the basic-state angular velocity over the annular region between the radii of 75 km and 90 km, which coincides with the location of the largest amplitudes of the unstable VRWs in 90-km PV-ring vortices. The radial shear of${\overline{ \Omega }}$ is nearly identical for the first 60 hours in F90 and B90, before it gradually sharpens and becomes negative in B90, but this gradual sharpening occurs 30 hours later in F90. Simultaneously, there is a tremendous drop in the energy of the unstable modes from 60 h in B90 and from 90 h in F90 (Fig. 8c), which justifies the role of the radial shear of rotation in wave-wave interactions.The ability to sustain convection (high-PV structure) depends on the relative contributions of strain and vorticity. In a strain-dominated area, PV perturbations are short-lived and end up as elongated and deformed filaments of anomalous vorticity (Rozoff et al., 2006; Wang, 2008). In the 90-km PV-ring vortices, PV disturbances (VRWs) sheared by the radially decreasing angular velocity feed their energy to the modal mode of algebraic instability (starting from 60 h in B90, from 90 h in F90). This interaction could enhance the PV mixing between the eye and eyewall regions (Nolan and Montgomery, 2000), leading to the intensification of the azimuthal mean circulation (starting from 70 h in B90 and 100 h in F90) and eventually leading to the formation of PV monopoles. As shown above, although the destruction of the coherent structure of mesovortices also occurs in F90 where f is constant across the domain, when the beta effect is involved, such a breakdown appears much earlier, as in B90.
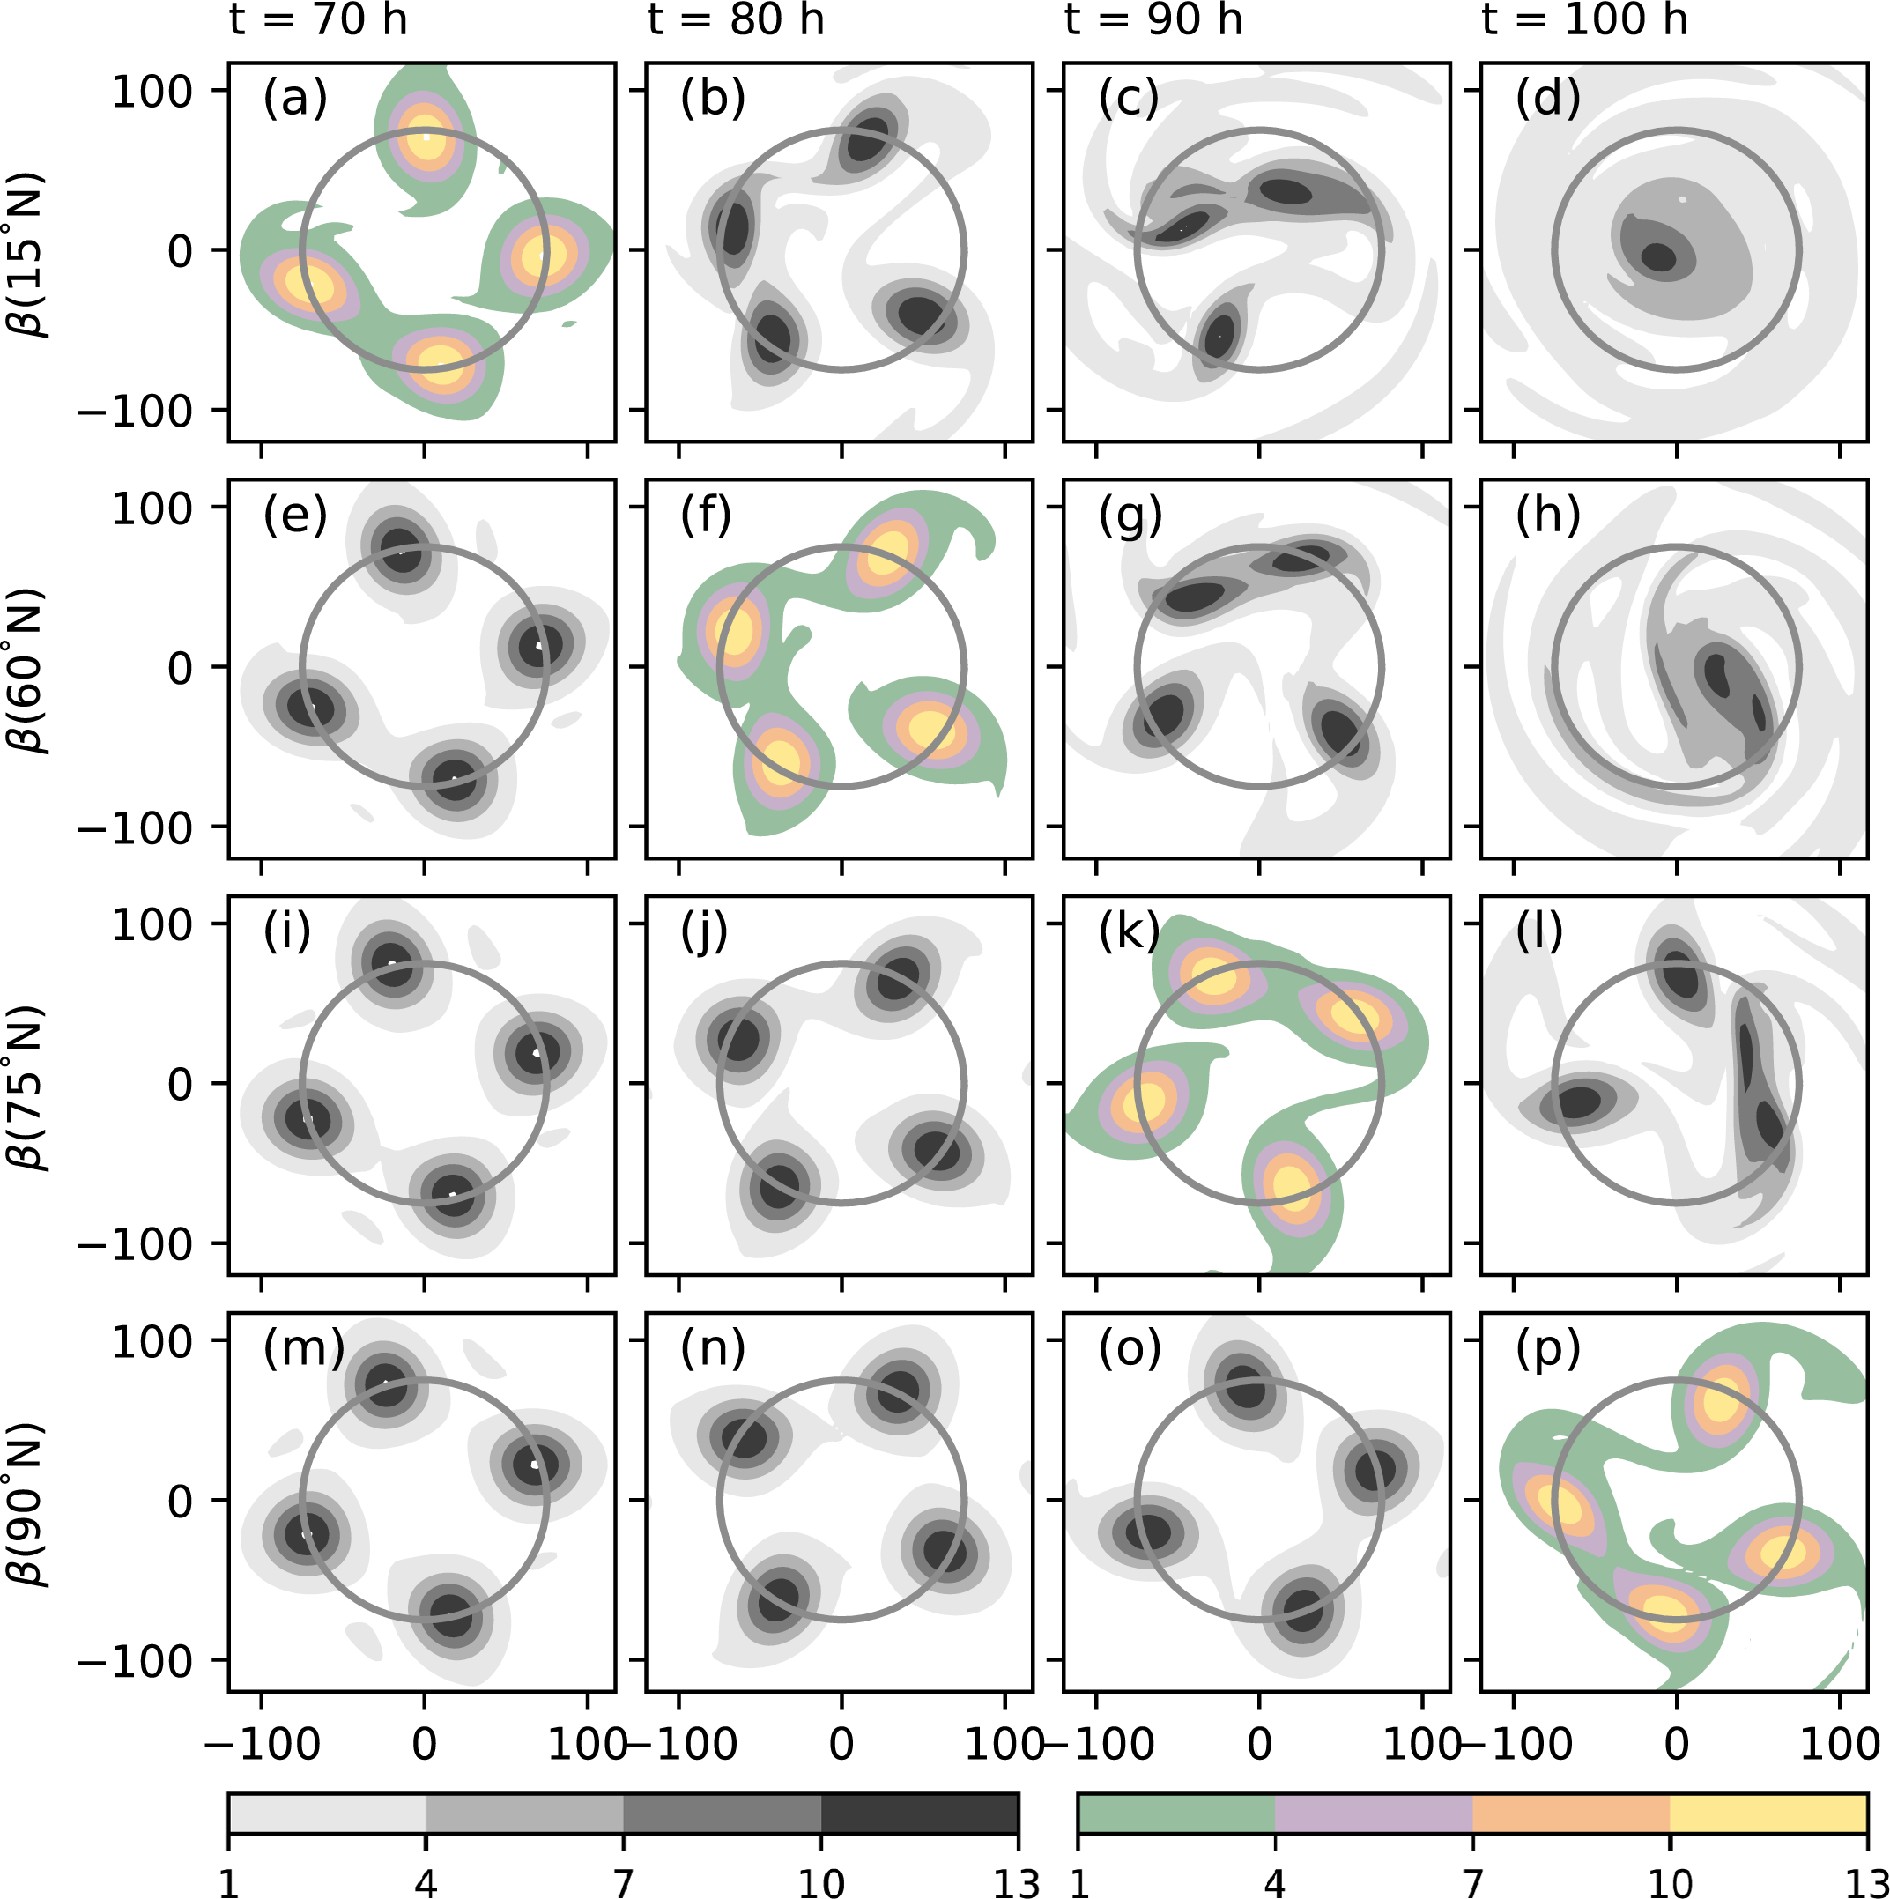
To further address the role of the beta effect in the nonlinear interaction between perturbations, two additional experiments on the beta-plane are performed. Both are centered at 15°N, but use different beta parameters,
$ \beta$ at 60°N (B90-60) and$\beta $ at 75°N (B90-75). The same central latitude is adopted to ensure that the vortex evolutions are influenced only by the meridional change of the Coriolis parameter rather than the Coriolis parameter itself. Vortices modeled with larger beta parameters (lower latitudes) are less likely to sustain coherent asymmetric structures. The azimuthally averaged radial shear of rotation in the region where VRWs exist becomes negative in each experiment but at different times (Fig. 9c). The radial profile of angular velocity within the annular region, between the radii of 75 km and 90 km in B90, experiences an earlier alteration from oscillating around a positive value to gradual decreasing. Such changes in experiments with smaller beta parameters occur in later hours. Subsequently, the mesovortices begin to merge at 70 h of simulation in B90, while the merger occurs approximately 10 and 20 hours later in B90-60 and B90-75, respectively. The quasi-steady structure in F90 maintains itself until about 100 h, when a final monopole state is nearly achieved in B90 (Fig. 10). The evolution of the azimuthal mean tangential circulation of a TC moving on a beta-plane has been previously studied by Smith et al. (1995). They proposed that the beta drift of an initially symmetric, cyclonic vortex in the Northern hemisphere would experience a weakening of its azimuthal mean tangential wind at most radii, with the tangential wind decreasing along the radius more rapidly than the decay rate of 1/(radius), which is mainly attributed to the radial flux of planetary vorticity and the meridional change of Coriolis parameter. Compared to those in the f-plane experiments, TC circulations in the beta-plane experiments are subject to an extra, instantaneous flux of planetary vorticity due to the northwestward displacement of the vortex, which would spin down the azimuthal mean tangential winds, especially in the larger radii. The greater spin-down rate of vortex circulation at larger radii will result in a negative gradient of basic-state angular velocity, and thus an earlier development of the algebraic instability, making the coherent structure of mesovortices less sustainable. The larger the beta parameter is, the faster the destruction will occur.
Figure 10. Temporal evolution of PV distributions (shading; units: 0.1 PVU) in experiments of B90 (top row), B90-60 (second row), B90-75 (third row), and F90 (bottom row) at 70 h, 80 h, 90 h, and 100 h over the domain 120 × 120 (units: km2). Colored panels indicate the start of vortex axisymmetrization in each experiment. The grey circle in each panel is drawn at a radius of 75 km where the maximum amplitude of perturbations occurs.
The above results demonstrate that the asymmetric forcing arising from the beta effect can perturb nonlinear TC evolutions. The beta effect may destabilize the coherent mesovortices resulting from the barotropic instability of a TC-like vortex with a large hollow PV structure. Subsequent vortex structural changes include sharpening the radial gradient of the basic-state angular velocity, which would deform VRWs and transfer energy from the sheared VRWs to the modal mode of algebraic instability. Differential rotation and inner-core PV mixing by the algebraic instability can invoke mesovortex merger and vortex axisymmetrization. However, it must be clarified that the impact of the beta effect on the eyewall evolution is confined only to large-size TCs and is limited in less hollow TC-like vortices in which the resultant asymmetries are often axisymmetrized to form the monopole structure in a relatively short time scale, such as in 18-km and 45-km PV-ring vortices.
-
This study has examined the roles of barotropic instability and the beta effect on the evolution of TC-like vortices with different PV-ring structures using a shallow-water-equation model. Two necessary conditions of barotropic instability are deduced based on the two-dimensional AB shallow-water equations following Montgomery and Shapiro (1995). Three kinds of barotropically unstable PV rings with different degrees of hollowness are simulated, first on the f-plane, all of which exhibit polygonal shapes at different stages. More intense annuli with lower degrees of hollowness develop lower-wavenumber asymmetries with smaller growth rates. At the same time, hollower PV rings are more likely to feature higher-wavenumber disturbances experiencing transient growth and decay, consistent with those found by Schubert et al. (1999) in a nondivergent barotropic model. This implies that the weak divergence in a shallow-water-equation model would generally not alter the unstable nature of nondivergent motion although some differences may exist in detail. The total asymmetry excited by the barotropic instability can be decomposed into VRWs of different wavenumbers with various amplitudes, and nonlinear wave-wave interactions could substantially complicate the eyewall evolution.
Although the beta effect is often neglected in studies that concern the internal dynamics of the inner-core region of a TC because of the comparatively small scale of the inner-core circulation, we have successfully demonstrated that the beta effect may undermine the stability of the coherent mesovortices in the eyewall of an extremely hollow, large-size PV ring. In this case, the asymmetric mesovortices can maintain themselves for an extended period in a nondivergent barotropic frame with a constant Coriolis parameter (Kossin and Schubert, 2001). However, observed mesovortices in the eyewalls of real TCs often have a much shorter lifetime, i.e., several to ten hours. In this study, we have shown that the beta effect could lead to an earlier breakdown of coherent mesovortices by modifying the radial shear of rotation and initiating energy transfer among the waves and also between the waves and the basic vortex flow. Therefore, the quasi-steady mesovortices may undergo much earlier merger and axisymmetrization processes on a beta-plane, which suggests that the beta effect may be one of the forcings that shorten the lifetime of mesovortices in real strong TCs.
Acknowledgements. This study was supported in part by the National Natural Science Foundation of China under Grant No. 41730960 and in part by NSF grant AGS-1834300.
| Expt. | Maximum PV before smoothing (${{q} }_{\text{r0} }$, PVU) | Maximum PV after smoothing (PVU) | Annulus width (l, km) | ro (km) | $\delta $ | Coriolis parameter (in the northern hemisphere) |
| F18 | 8.21 | 7.20 | 6.0 | 18 | 0.40 | f(15°), $ \beta{= 0} $ |
| F45 | 3.48 | 2.86 | 6.0 | 45 | 0.73 | f(15°), $ \beta{= 0} $ |
| F90 | 1.78 | 1.69 | 6.0 | 90 | 0.88 | f(15°), $ \beta{= 0} $ |
| B18 | 8.21 | 7.20 | 6.0 | 18 | 0.40 | f(15°), $ \beta $(15°) |
| B45 | 3.48 | 2.86 | 6.0 | 45 | 0.73 | f(15°), $ \beta $(15°) |
| B90 | 1.78 | 1.69 | 6.0 | 90 | 0.88 | f(15°), $ \beta $(15°) |
| B90-60 | 1.78 | 1.69 | 6.0 | 90 | 0.88 | f(15°), $ \beta $(60°) |
| B90-75 | 1.78 | 1.69 | 6.0 | 90 | 0.88 | f(15°), $ \beta $(75°) |


 AAS Website
 AAS WeChat