


 DownLoad:


-
Black carbon (BC), one of the agents to cause degraded air quality, is also considered to be an important short-lived climate forcer inducing global warming (Ramanathan and Carmichael, 2008; Shindell et al., 2012; AMAP, 2021; IPCC, 2021). BC mainly originates from incomplete combustion of fossil fuels and biomass burning (Bond et al., 2013). Because of its important role on absorption of visible solar radiation, when deposited onto snow and ice surface, BC can darken the snow and ice surface and trigger a positive feedback of albedo reduction (Warren and Wiscombe, 1980; Hansen and Nazarenko, 2004; Flanner et al., 2007; Skiles et al., 2018; Kang et al., 2020, 2022; Wang et al., 2020). Subsequently, BC is believed to threaten the survival of glaciers and affects glacial-hydrology across the Himalayas-Tibetan Plateau and its surroundings (Xu et al., 2009; Yao et al., 2012a; Kang et al., 2019; Zhang et al., 2020a, 2021; Azam et al., 2021; Nie et al., 2021). Estimation indicated that BC from glaciers and snow cover was responsible for approximately 20%−50% of albedo reduction (Zhang et al., 2017a, 2021; Li et al., 2018), which can accelerate glacier melting correspondingly in the Himalayas-Tibetan Plateau and its surroundings (Ménégoz et al., 2014; Schmale et al., 2017; Zhang et al., 2017a; Li et al., 2021). It, therefore, will pose a large uncertainty on the regional hydrological changes (Azam et al., 2021). BC and other light-absorbing impurities (e.g., mineral dust) can also explain the amplification of snow albedo reduction in Alps and Greenland (Dumont et al., 2014; Di Mauro et al., 2015; Skiles et al., 2018).
BC size is an important parameter which can affect BC’s absorption of solar radiation in snow (Schwarz et al., 2013; He et al., 2018a). Previous studies showed that BC size (volume-equivalent diameter, VED) was larger in snow than in the atmosphere because of the influence of removal process of BC from the atmosphere (Moteki et al., 2012; Schwarz et al., 2013; Zhang et al., 2017b). Simulations indicated that albedo reduction by BC in snow decreased by a factor of 2−3 with increasing BC effective radii increasing from 0.05 to 0.25 μm (He et al., 2018a). In addition, BC tended to collapse from a fractal to a denser morphology during aging process (He et al., 2015; Gustafsson and Ramanathan, 2016), which could change mass absorption cross section (MAC) of BC in snow (Schwarz et al., 2013).
A large fraction of BC was estimated emitting from anthropogenic activities (Bond et al., 2013; Schmale et al., 2017), which made BC mitigation for climate change a scientific issue with widespread public attentions (AMAP, 2015; Li et al., 2016). However, in the Chinese Altai Mountains of Central Asia, attention has been paid to the effects of BC on snow albedo reduction and snow melt (Zhong et al., 2019, 2021; Zhang et al., 2020a), and thus the changes of snow cover could affect the freshwater availability for people and society development in this region (Aizen et al., 1995). Spatial and vertical distributions of BC in the snow cover across northwestern China (part of Central Asia) have been investigated, with BC concentrations ranging from 5 ng g−1 for clean snow to 450 ng g−1 for dirty snow near industrial cities (Pu et al., 2017; Wang et al., 2020). However, the importance of BC size distributions in surface and sub-surface snow are still unclear until now.
In this study, we will address the features of refractory BC (rBC) size distributions in snow cover in Chinese Altai Mountains of Northern Xinjiang, Central Asia, focusing on their distributions in surface and sub-surface snow. Based on the modeling, we will also quantify its anthropogenic or natural contributions to BC deposition in snow cover. This study will assess the BC size in present-day climate and how it might possibly impact climate in Central Asia.
-
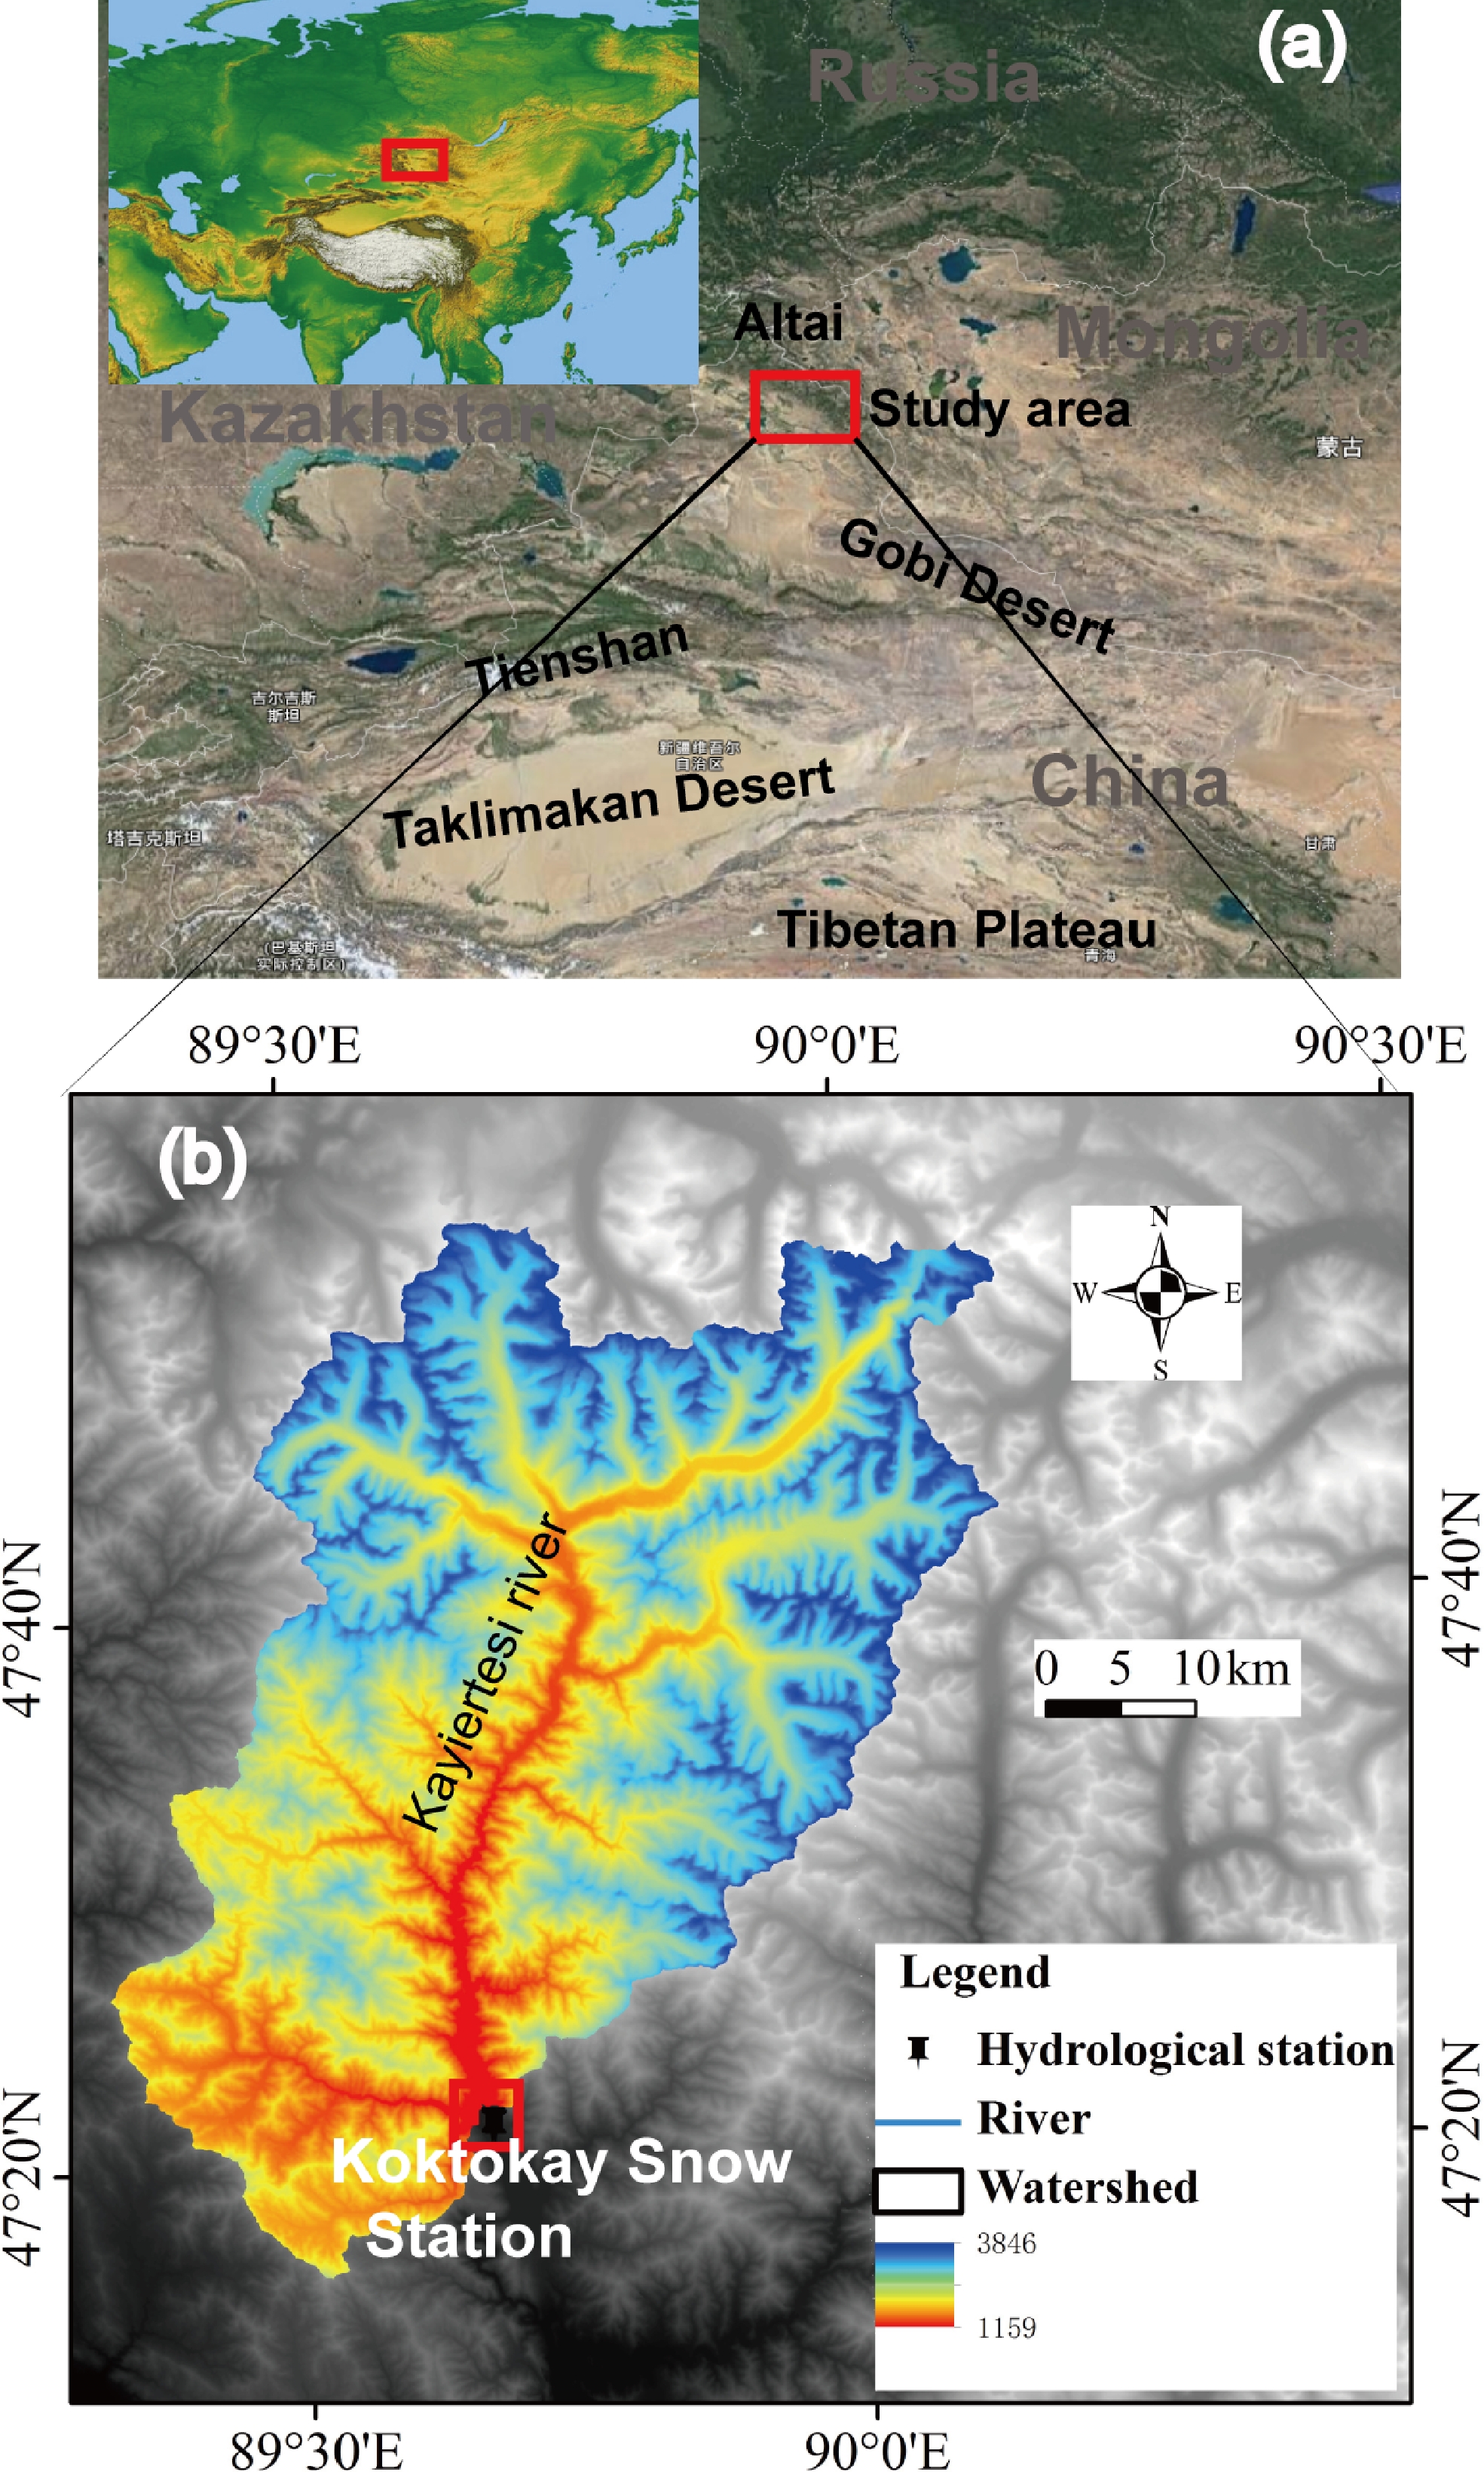
The Altai Mountains is complex mountain system of Central Asia. It extends approximately 2000 km in a southeast-northwest direction, which stretches from the Gobi Desert to the West Siberian Plain through several countries (including China, Mongolia, Russia, and Kazakhstan). Our study area (Koktokay Snow Station) is located in the upper Kayiertesi river basin of Chinese Altai Mountains, in the Northern Xinjiang Province (Fig. 1). The climate of the region is predominated by the westerlies, representing the severely continental climate (Yao et al., 2012a). The winter season is influenced by the great Asiatic anticyclone or high-pressure area. Snow accumulation usually starts in November due to the westerlies conveying large precipitation and melts from March to April in spring (Zhong et al., 2021). In general, the annual temperature varied from 0.7ºC to 4.8ºC, and the precipitation fluctuated from 75 to 309 mm (Yao et al., 2012b).

Figure 1. The location map of (a) the study area in Chinese Altai Mountains and (b) snow sampling at Koktokay Snow Cover Station (Modified from Zhang et al., 2019)
From November 2016 to April 2017, we collected a total of 82 snow samples in Chinese Altai Mountains of Central Asia for rBC analysis. The snow sampling site was at Koktokay Snow Station (with original name Kuwei Snow Station) (47°21'9.1"N, 89°39'43.22"E, Fig. 1) located in the upper Kayiertesi river basin, which was set up by the Northwest Institute of Eco-Environment and Resources, Chinese Academy of Sciences. These collected samples included 47 surface snow samples (with snowpack depth of 0−5 cm) and 35 sub-surface snow samples (with snowpack depth of 5−10 cm). In order to prevent possible contaminations, we used polycarbonate square bottle (30 ml, Nalgene) directly to collect snow following “dirty hands, clean hands” protocol as we did in the previous studies (Zhang et al., 2017b). After sampling, these bottles were kept in frozen during storage or transportation until melted at room temperature and analyzed for rBC in a class 100 clean room. Meanwhile, the snow depth was also observed by using ultrasonic snow depth sensor (Campbell RS50A).
-
In this study, rBC concentrations and size distributions in snow cover were analyzed by Single Particle Soot Photometer with BC size range of 70−500 nm (SP2, Droplet Measurement Technology, Boulder, USA) following the method described by previous studies (Schwarz et al., 2008, 2012, 2013; Moteki et al., 2010; Lim et al., 2014; Zhang et al., 2017b). In brief, SP2 uses a laser-induced incandescence method to directly measure the mass of individual BC particle, without considering the particle morphology or light scattering coating materials (Moteki and Kondo, 2010). Then the BC particle mass can be translated to volume-equivalent diameter by assuming a 1.8 g cm−3 void-free density. Meanwhile, SP2 can measure rBC particles in snow and precipitation samples with the help of nebulizer (CETAC U5000AT in this study) (Lim et al., 2014). In this study, the individual rBC particles pass through an intra-cavity laser (1064 nm) by the SP2. The detection limit of rBC particle was 0.3 fg per particle, with rBC size range of 70–500 nm by SP2. The nebulizer efficiency in this study, is approximately 15%–20% by measuring the Polystyrene Sphere Latex standard samples (Standard Aquadag, Acheson Inc., USA; 10 ng mL−1) before and after the snow sample analysis. We have to note that this technique leads to a lower estimate of BC concentrations in snow samples (compared to that measured by Thermal/Optical method) due to that rBC particles can agglomerate in snow and are hence not detectable by the SP2. More details for SP2 analysis can be referred to Zhang et al. (2017b) and Lim et al. (2014). A detailed discussion on differences of BC concentrations measured by different methods has been revealed in our previous study (Kang et al., 2020).
-
A 4-day backward air mass trajectories analysis was performed based on the Lagrangian analysis tool LAGRANTO and used wind filed at 0.25° × 0.25° resolution, provided by the operational analysis of European Centre for Medium-Range Weather Forecasts (ECMWF) (Wernli and Davies, 1997; Sprenger and Wernli, 2015), to discuss the potential sources of BC in snow as to previous studies (Zhang et al., 2017b, 2020a). Here natural sourced BC includes emissions from wildfires only based on the FINN v1.5 global fire emission inventory, while anthropogenic BC includes BC emissions from fossil fuel combustion and domestic biomass burning. Briefly, backward air mass trajectories were launched every 6 h between 1 November 2017 to 30 April 2018 for the study area. For calculating BC emissions from natural contributions, we used the FINN v1.5 global fire emission inventory in this study to be speciated with the GEOS-chem mechanism (Wiedinmyer et al., 2011). Further details on the trajectory calculation can be found in Zhang et al. (2017b).
-
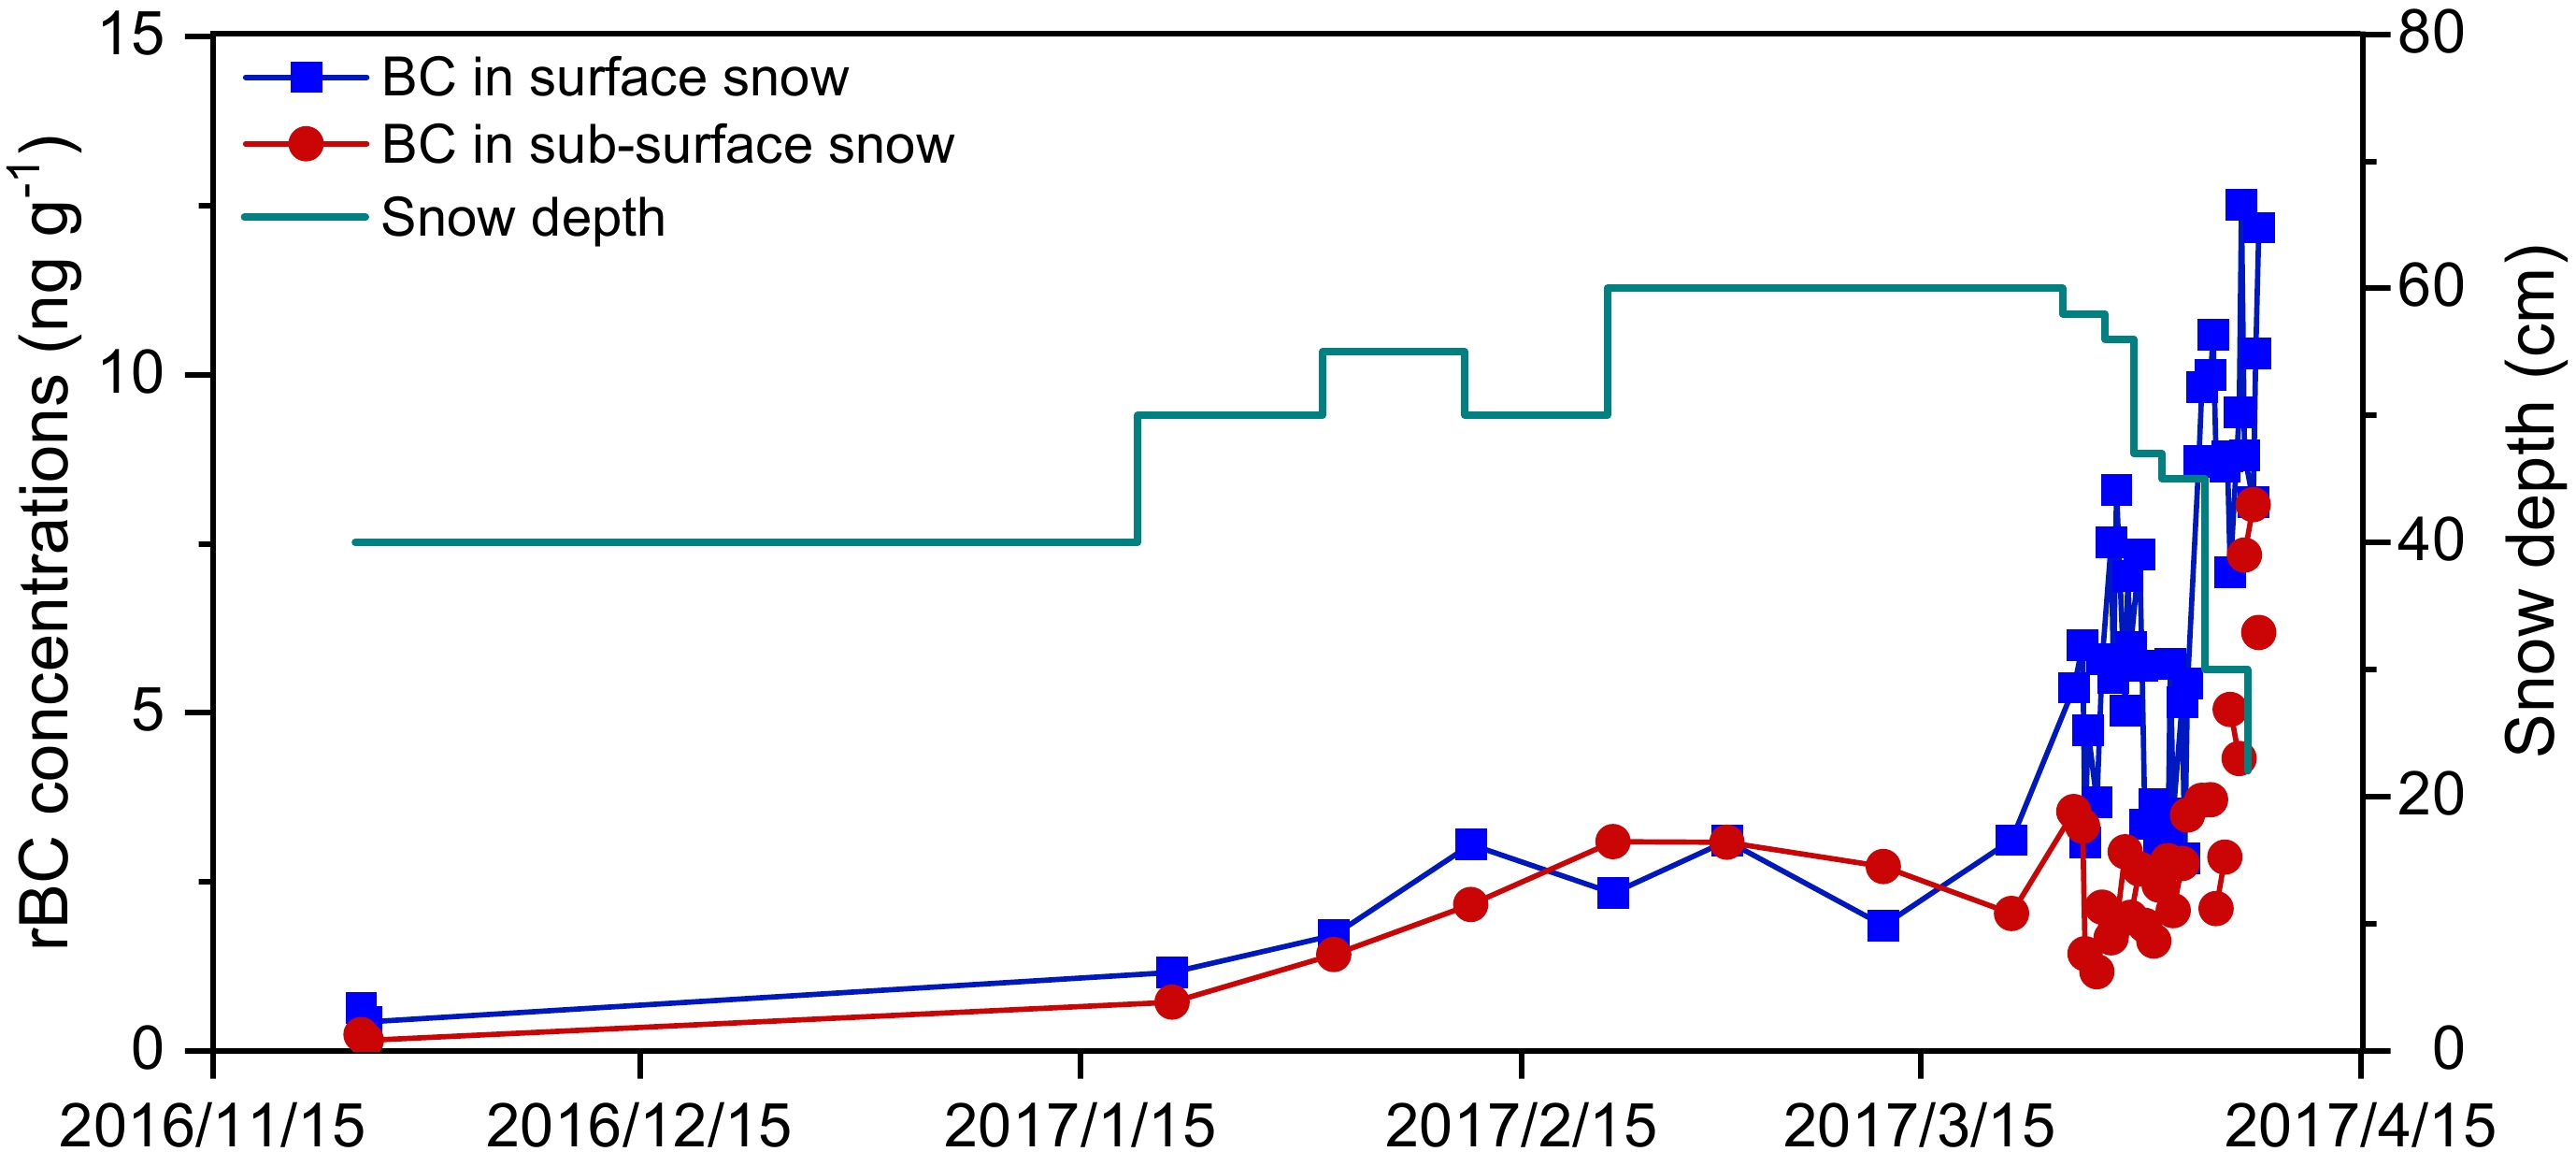
Temporal variations of rBC showed a general increasing trend during the study period from November 2016 to April 2017 (Fig. 2). The average rBC concentrations were 5.77±3.07 and 2.82±1.71 ng g−1 for the surface snow and sub-surface snow with a range of 0.43−12.52 and 0.15−8.08 ng g−1 during studied period, respectively. The average rBC concentrations were 1.55±0.92 and 1.30±1.06 ng g−1 in winter (November 2016 to February 2017) for surface snow and sub-surface snow, respectively; while in spring (March 2017−April 2017), rBC data for surface snow and sub-surface snow were 6.39±2.77 and 3.14±1.65 ng g−1, respectively [Table S1 in the electronic supplementary material (ESM)]. The higher values of rBC in surface snow indicated rBC tended to be accumulated at the surface because of its hydrophobicity, with the average amplification factor (defined as ratios of surface-to-subsurface snow BC concentrations) of about 2. The maximum rBC concentrations occurred in the late melting season (early April 2017), which provided further evidence that the strong melting could enrich rBC particles at the surface snow. This trend was different from the BC records measured by using Thermal/Optical Carbon Analyzer, which showed the maximum values to occur on 27 March 2017 (Zhong et al., 2021). The rBC measured by SP2 in this study only represented partial BC particles with size between 70–500 nm. However, BC with size larger than 2.2 μm constrained by the quartz fiber filters (with pore size of 2.2 μm) was measured by Thermal/Optical method (DRI) (Zhang et al., 2017a; Zhong et al., 2021). In general, BC concentrations measured by Thermal/Optical method can result in 2−3 orders of magnitude higher than that of BC measured by SP2 (Zhang et al., 2017b; Kang et al., 2020; Wang et al., 2020). For instance, the BC concentrations by Thermal/Optical method in snow cover and glacier of Altai region ranged from 111−4733 ng g−1 and 196−7720 ng g−1, respectively (Zhang et al., 2020a; Zhong et al., 2021). Besides, the estimated BC in snow (the estimated true mass of BC per mass of snow derived by separating the spectrally resolved total light absorption) revealed approximately 22−174 ng g−1 in the Altai region, with snow samples filtered by 0.4 μm Nuclepore filter (Wang et al., 2013; Pu et al., 2017). While for the ice cores BC concentrations measured by SP2, the rBC concentrations only ranged from 0.41 to 7.84 ng g−1 (Wang et al., 2021). In summary, great care is needed when BC concentrations are compared among different studies if BC measured by different methods.
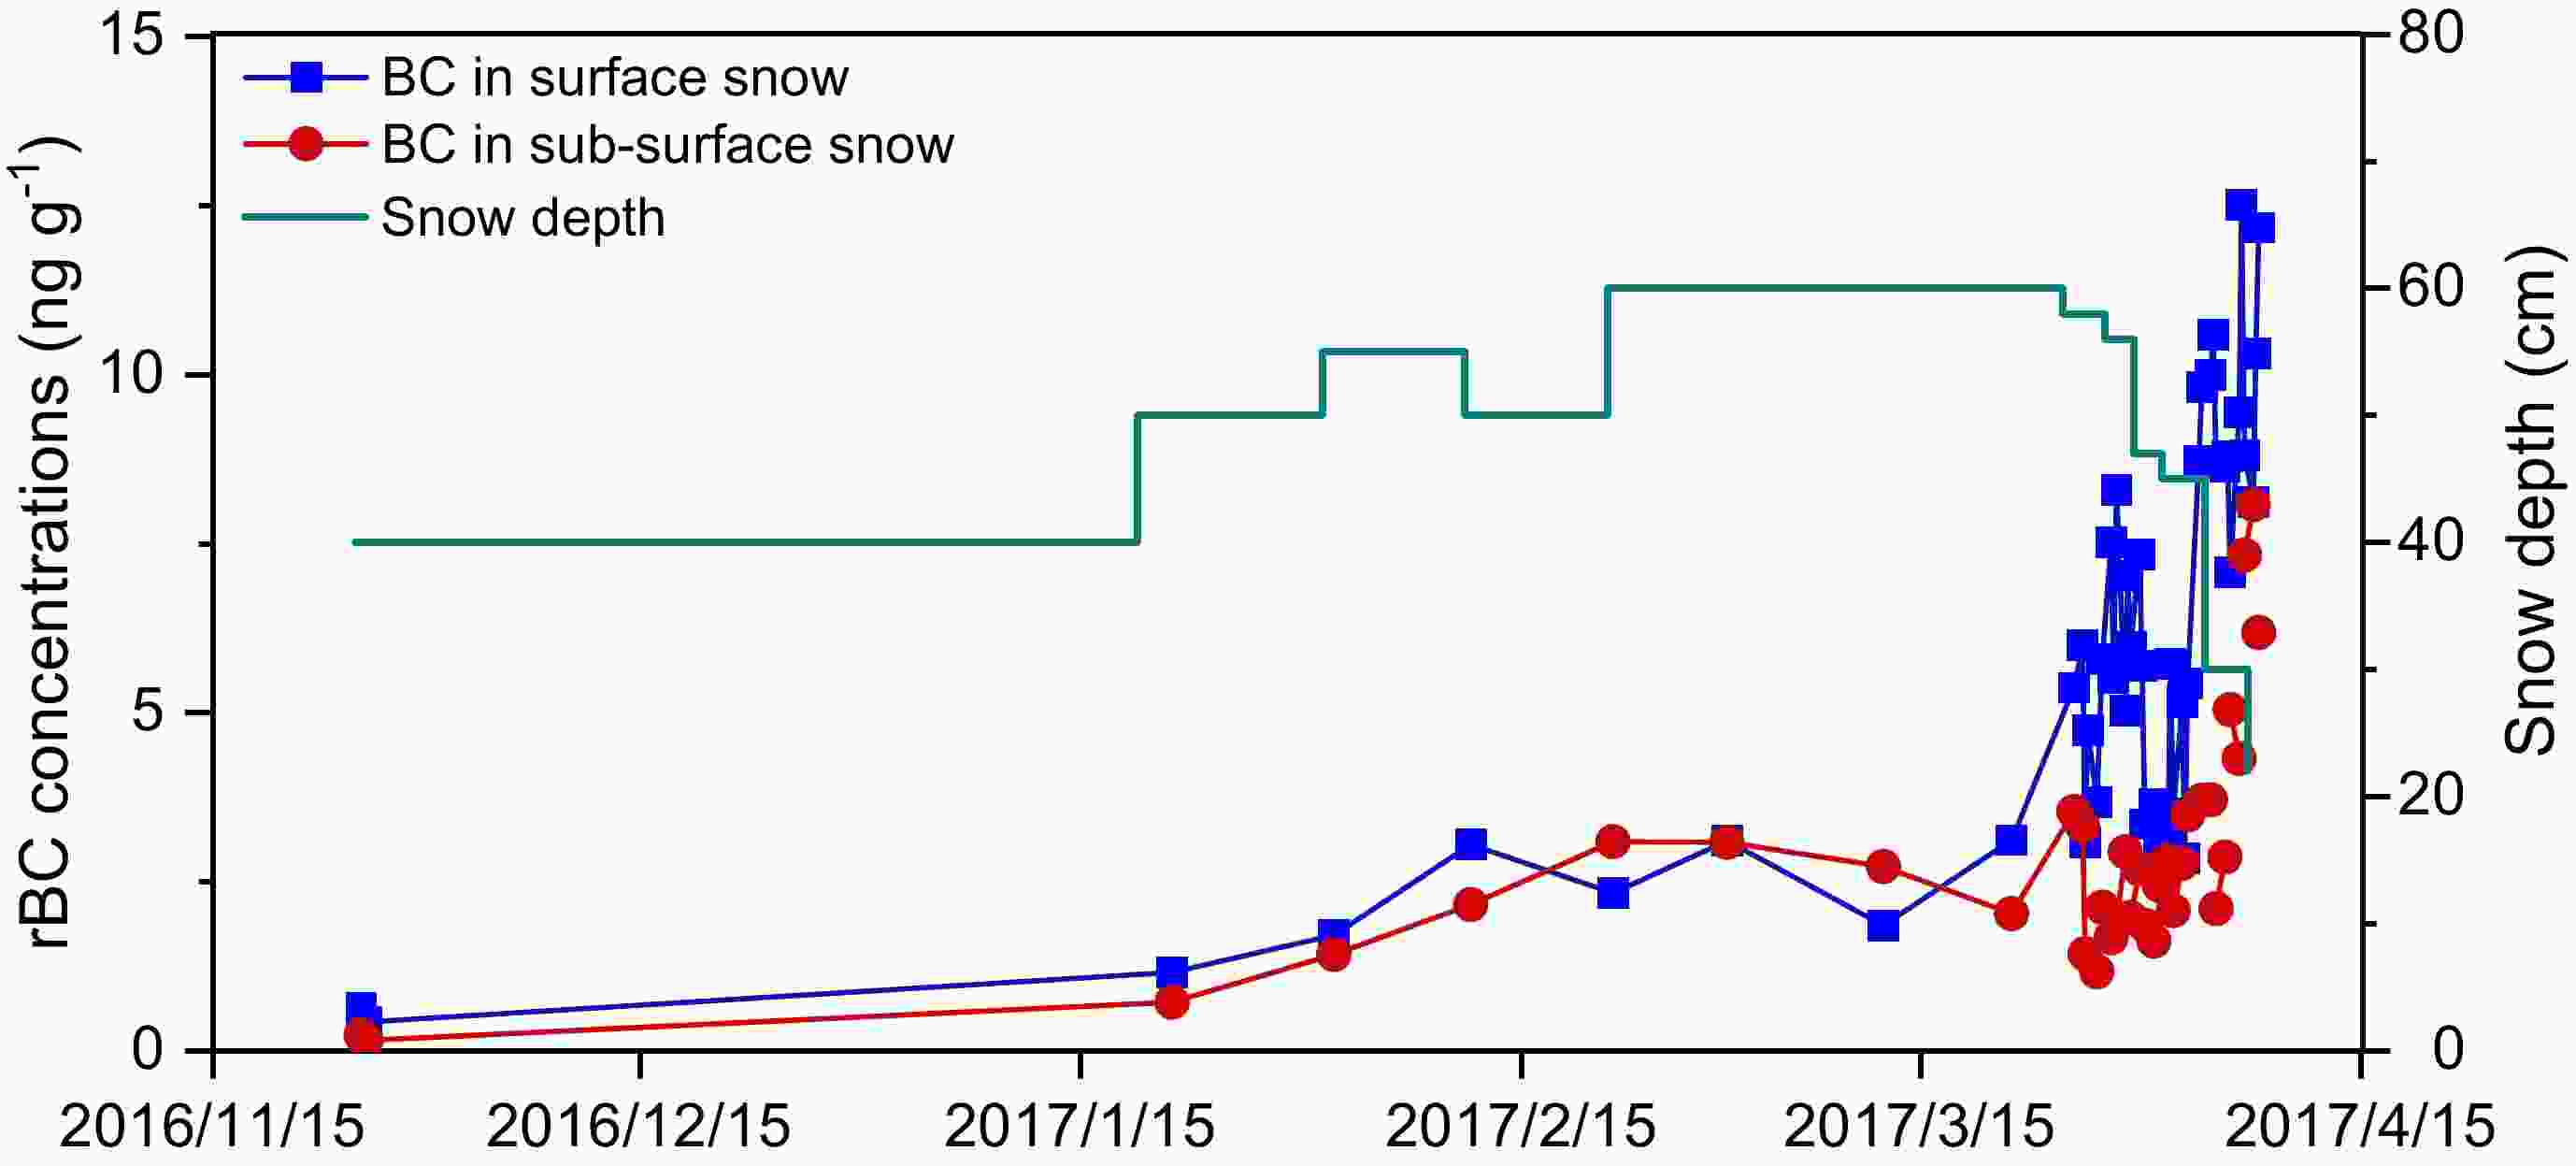
Figure 2. Refractory BC concentrations in surface and sub-surface snow of Central Asia and the snow depth variations during November 2016 to April 2017 at Koktokay Snow Station of Chinese Altai regions in Central Asia. Snow depth data cited from (Zhong et al., 2021).
-
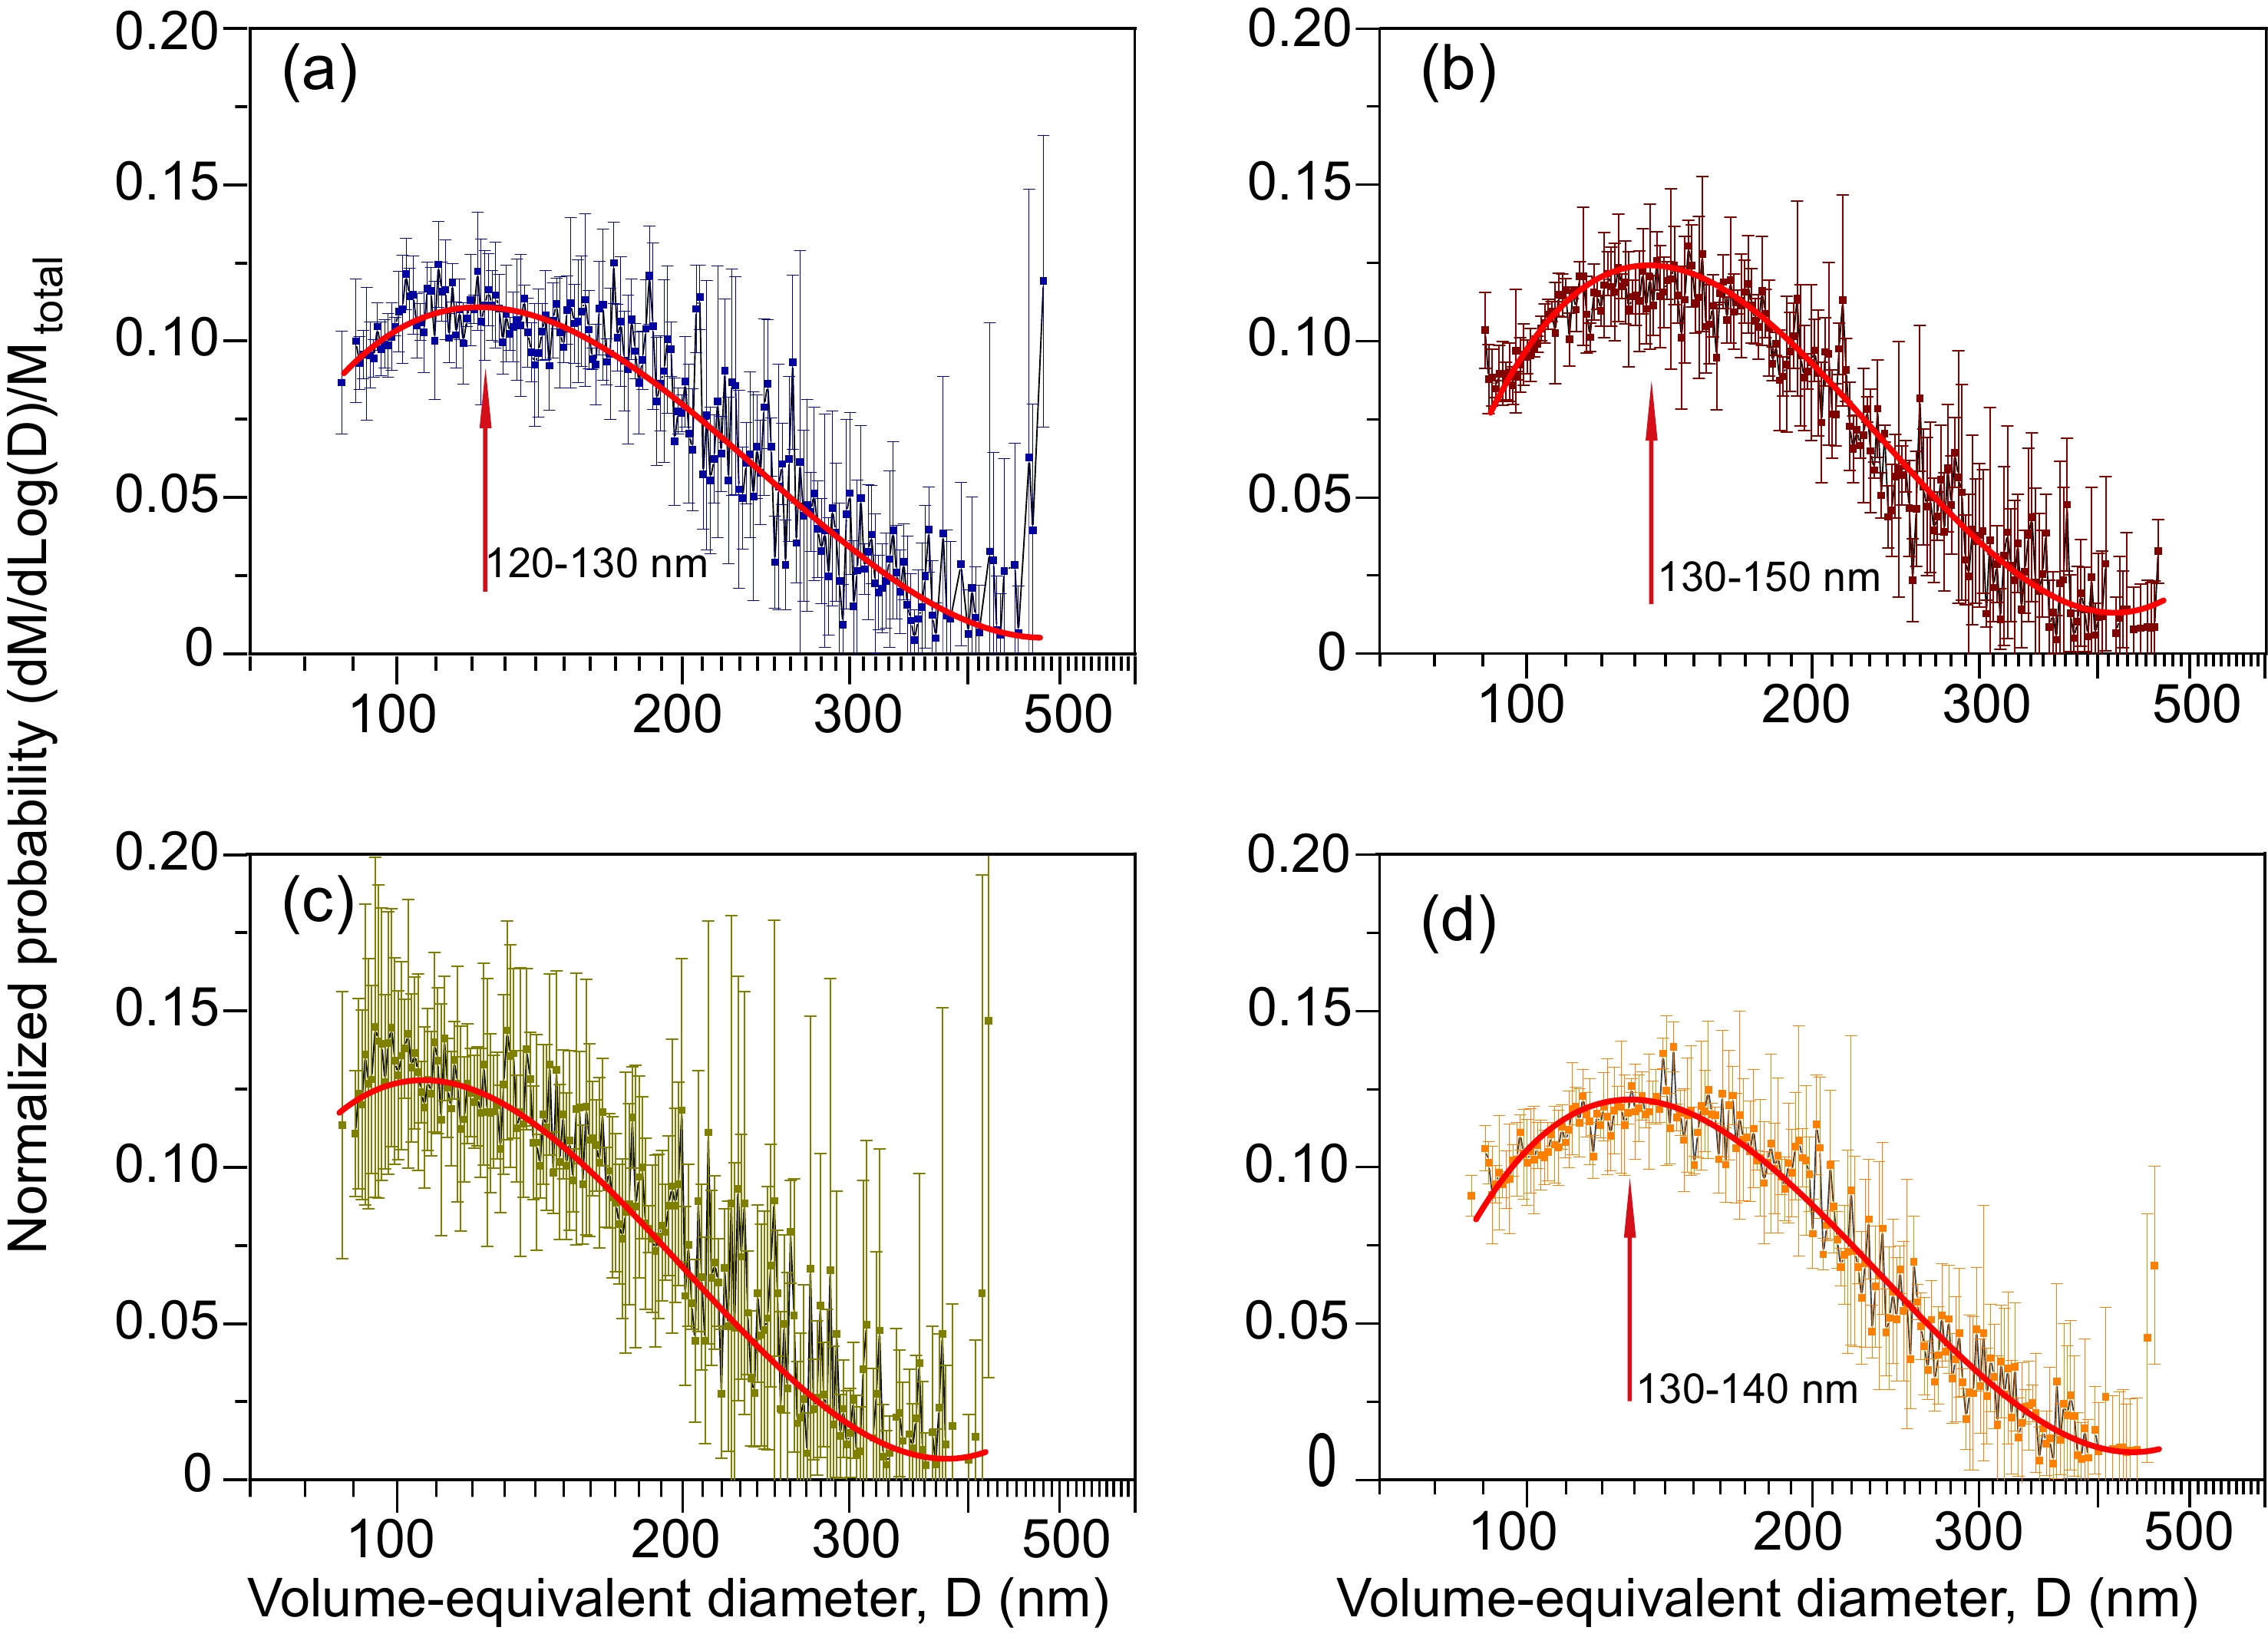
The rBC mass size distributions from Altai snow samples can typically closely fitted to a pure lognormal function with a mass median diameter of about 120−150 nm VED (Fig. 3). For the surface snow, BC mass size distributions in winter season were quite similar to that in spring season when the snow began to melt. However, due to the accumulation of BC in surface snow in spring, the normalized probability in spring became relatively concentrated in the mass median VED of 120−150 nm VED (Figs. 3a and 3b). For the sub-surface snow, a large difference of BC mass size distributions was found in winter season, with no significant mass median VED (Fig. 3c). In spring, the distributions of BC size in sub-surface snow (Fig. 3d) exhibited the variations that were typical in the surface snow with rBC size mass median VED of about 130−140 nm. The results showed the BC median size was small enough, and a large fraction of BC particles from the total accumulation mode mass could not be measured by SP2, as became evidence from the log-normal fit. Besides, because of the measured limitation of BC size by SP2 in this study (70−500 nm), we cannot discuss the BC size with VED larger than 500 nm.

Figure 3. Refractory BC mass size distributions from surface and sub-surface snow during winter and spring at Koktokay Snow Cover Station, respectively. (a) BC size for surface snow in winter, (b) BC size for surface snow in spring, (c) BC size for sub-surface snow in winter, and BC size for sub-surface snow in spring(d). (Error bars present the standard deviation.)
-
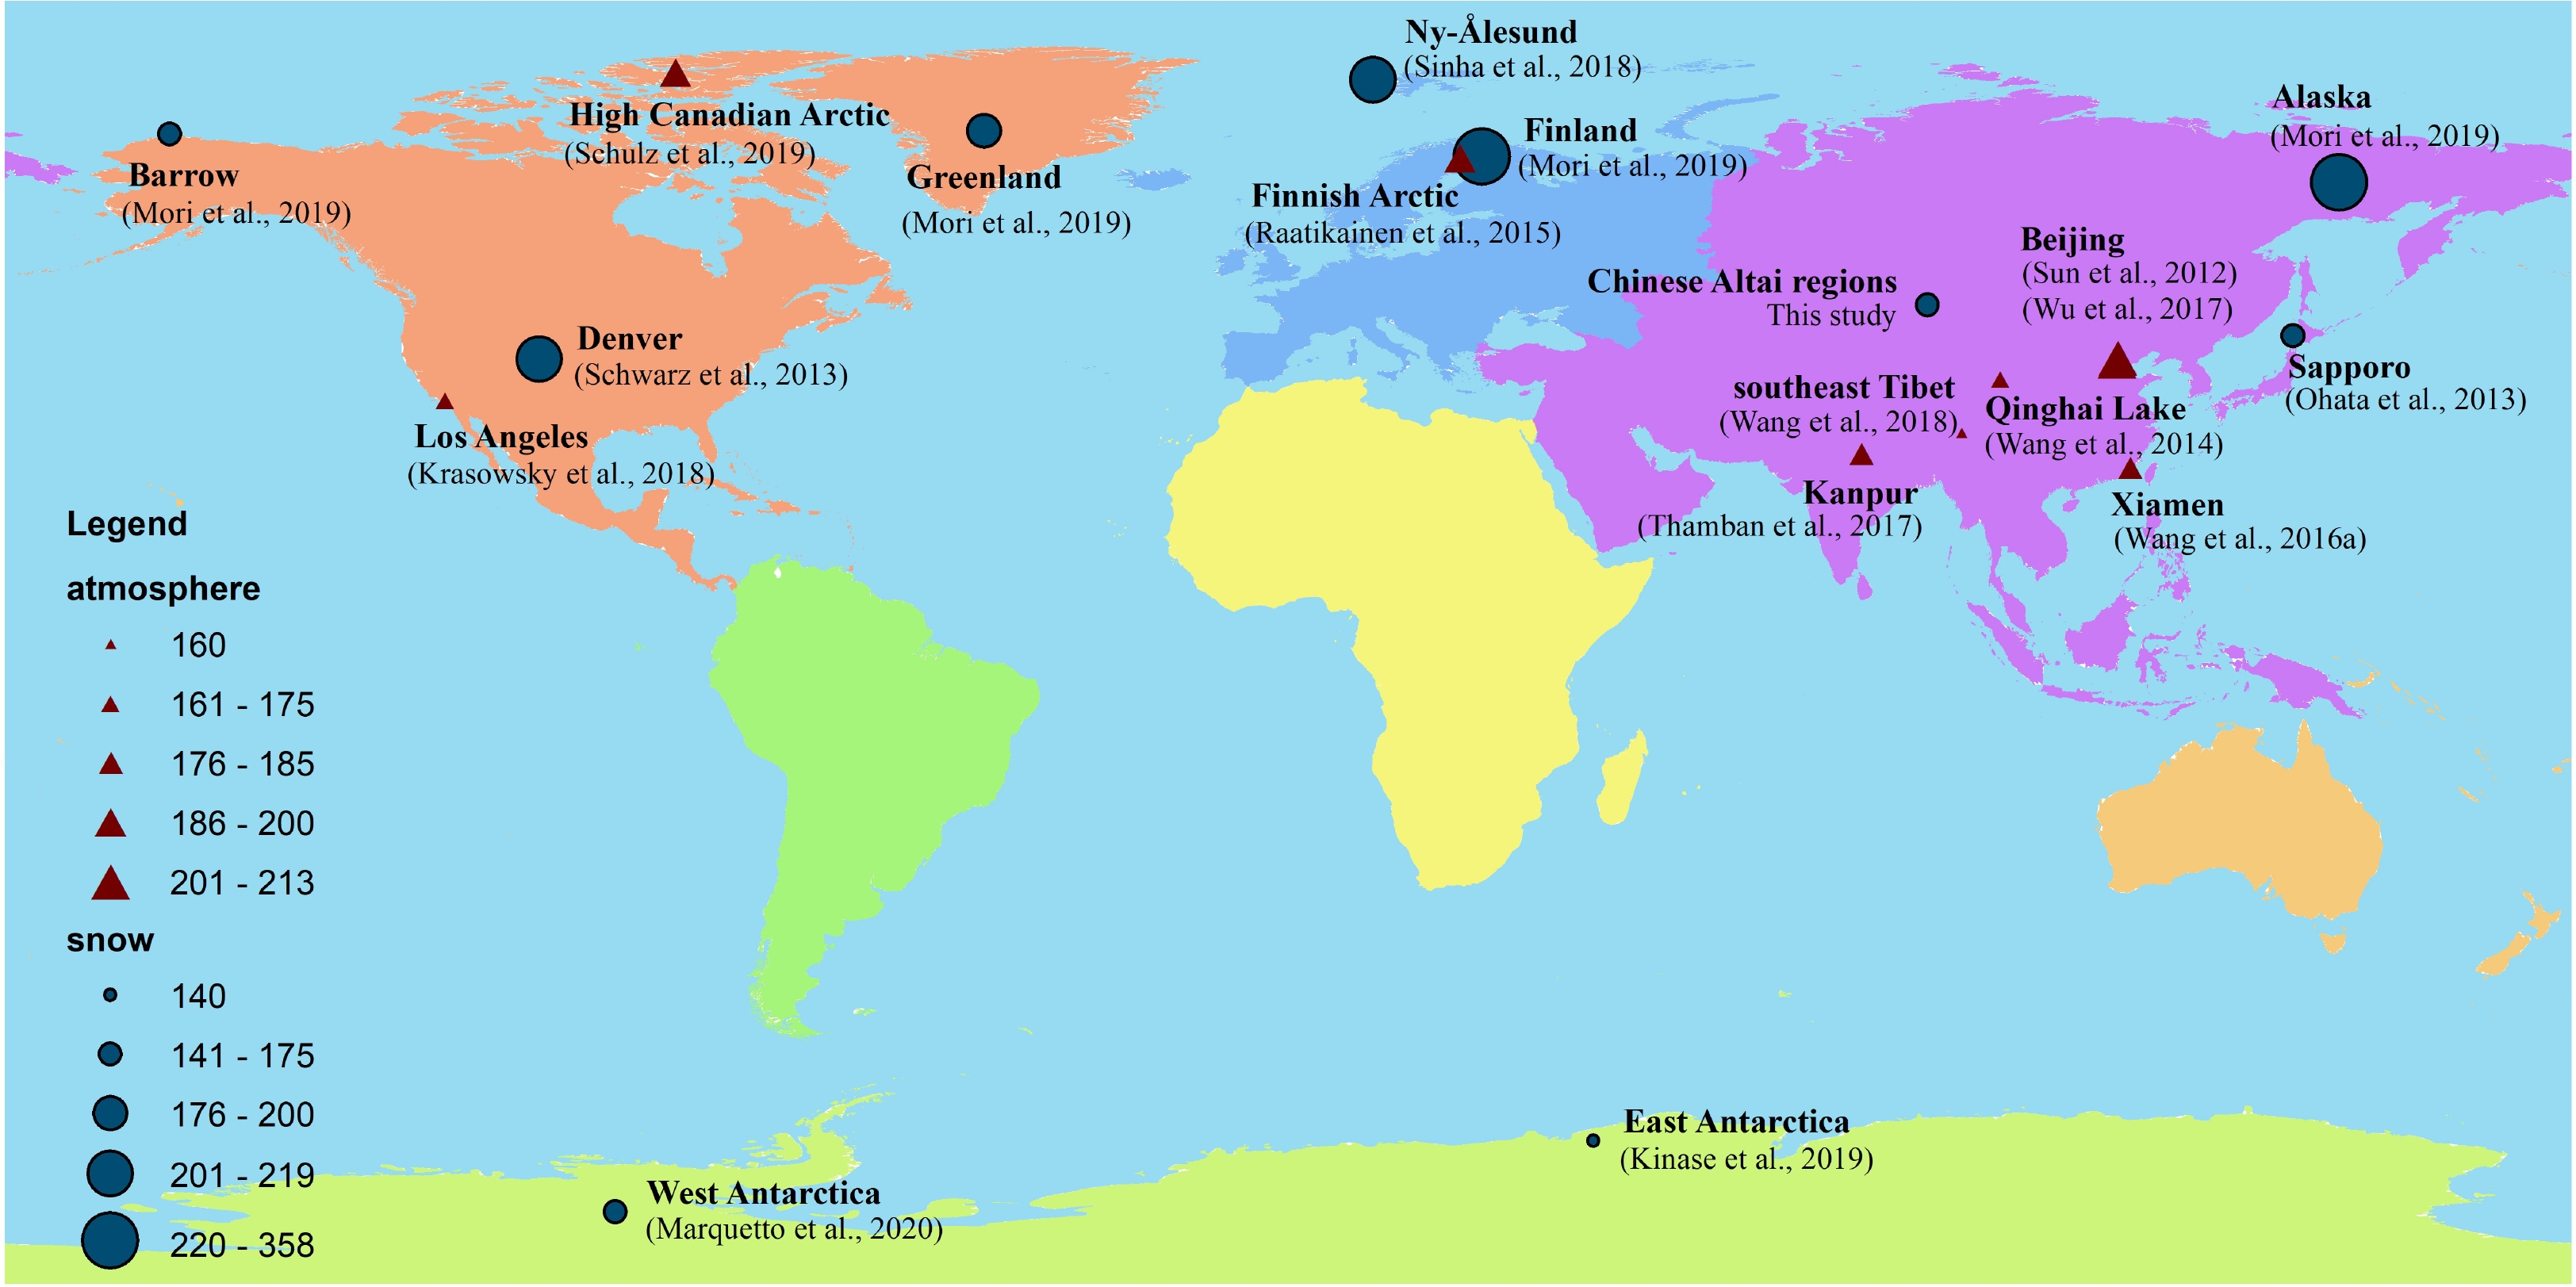
In order to understand BC mass size distributions in atmosphere and snow globally, we have collected the published literatures on related studies of BC size in atmosphere and snow (Table 1 and Table S2 in the ESM). It was indicated that atmospheric BC size distributions and median mass diameter was identified with large differences (Fig. 4). In general, for the ambient atmospheric BC observation in the Los Angeles basin (the typical urban area), the BC mass median size was about 100 nm (Fig. 4 and Table S2). The peak diameter of BC in the mass size distributions was 170 nm for 30 m away from the highway in Los Angeles with heavy fossil fuel emissions of BC due to the traffic; on the other hand, for the sites far from the highway, the peak of the BC size distribution was about 77−90 nm (Krasowsky et al., 2018). In the urban region of Xiamen city in South China, atmospheric BC particles was mono-modal with a mass median diameter of ~175 nm during non-polluted times, and ~195 nm during polluted conditions due to stronger biomass burning activities during pollution episodes (Wang et al., 2016a). In Shenzhen city (Southern China), distributions of BC size were characterized by the peak diameter ranging from 210−222 nm (Huang et al., 2011). In Beijing city, BC showed a mono-mode peaking with median diameter of 207 nm (Sun et al., 2012). Meanwhile, during winter haze episodes in urban Beijing city, peak diameter of BC size distributions was about 213 nm (Wu et al., 2017). The mass size distribution mode for BC mass size at Kanpur in the Indo-Gangetic Plain showed the peak at about 180 nm (Thamban et al., 2017).
Study area Snow types BC size measurement method (BC size range) Mass median size(nm) References Arctic regions Ny-Ålesund, Svalbard Fresh snow/falling snow SP2 (70−4170 nm) 240 Sinha et al., 2018 Greenland Snowpack/ surface snow SP2 (70−4170 nm) 200 Mori et al., 2019 Alaska Snowpack/ surface snow SP2 (70−4170 nm) 320 Mori et al., 2019 Barrow, Alaska Surface snow SP2 (70−500 nm) 160 Unpublished data Antarctica West Antarctica Snow/firn core SP2 (70−2000 nm) 162±40 Marquetto et al., 2020 McMurdo Dry Valleys,
West AntarcticaSnowpit SP2 (70−800 nm) 300−400 Khan et al., 2018 Eastern Antarctica Surface snow SP2 (70−4170 nm) 140 Kinase et al., 2020 Middle latitudes Chinese Altai regions Surface/sub-surface snow SP2 (70−500 nm) 120−150 This study Northern Tibetan Plateau Surface snow SP2 (70−500 nm) 180−200 Zhang et al., 2017b Dudh Koshi River basin of Nepal, Himalayas Seasonal snow SP2 (70−5000 nm) 2500 (fresh snow)4000 (aged snow) Khan et al., 2020 Sapporo, Japan Surface snow SP2 (70−850 nm) 175 Ohata et al., 2013 Denver, USA Fresh snow/falling snow SP2 (70−2450 nm) 240 Schwarz et al., 2013 Note: SP2—Single Particle Soot Photometer. Table 1. A summary of BC mass size distributions in snow from different regions.

Figure 4. Distributions of BC mass size distributions from snow and aerosol based on the published literatures. (Data can be referred to Table 1 and Table S2 in the ESM.)
However, in the northern Tibetan Plateau (Qinghai Lake) of remote areas, BC was observed with mass median diameter of ~175 nm (Wang et al., 2014). In southeast Tibet, the average BC median mass diameter was the largest (184 nm) when the polluted air masses originated from central Bangladesh, while smaller BC sizes were found when the polluted air masses came from north India (173 nm) or the central Tibetan Plateau (177 nm) (Wang et al., 2018). At Jungfraujoch in the Swiss Alps (3580 m a.s.l.), BC distributions of each season peaked at very similar median diameters between roughly 130 to 150 nm (Motos et al., 2020). In western Siberia without heavy anthropogenic emissions, BC median diameter varied from 140 to 220 nm with significant impact of smokes from forest fires to the studied site (Kozlov et al., 2017). In the Finnish Arctic during winter 2011−12, BC mass size was log-normally distributed with median diameter of 194 nm (Raatikainen et al., 2015). Over the High Canadian Arctic (>70ºN), BC mass-mean diameter ranged from above 200 nm in the lower polar dome dominated by low-level transport to < 190 nm at higher levels, indicating BC aerosol was affected by wet removal mechanisms preferential to larger particle diameters when lifting processes were involved during transport (Schulz et al., 2019). The significant differences of BC in ambient atmosphere indicated that impacts of BC sources, transport, and atmospheric chemicals processes.
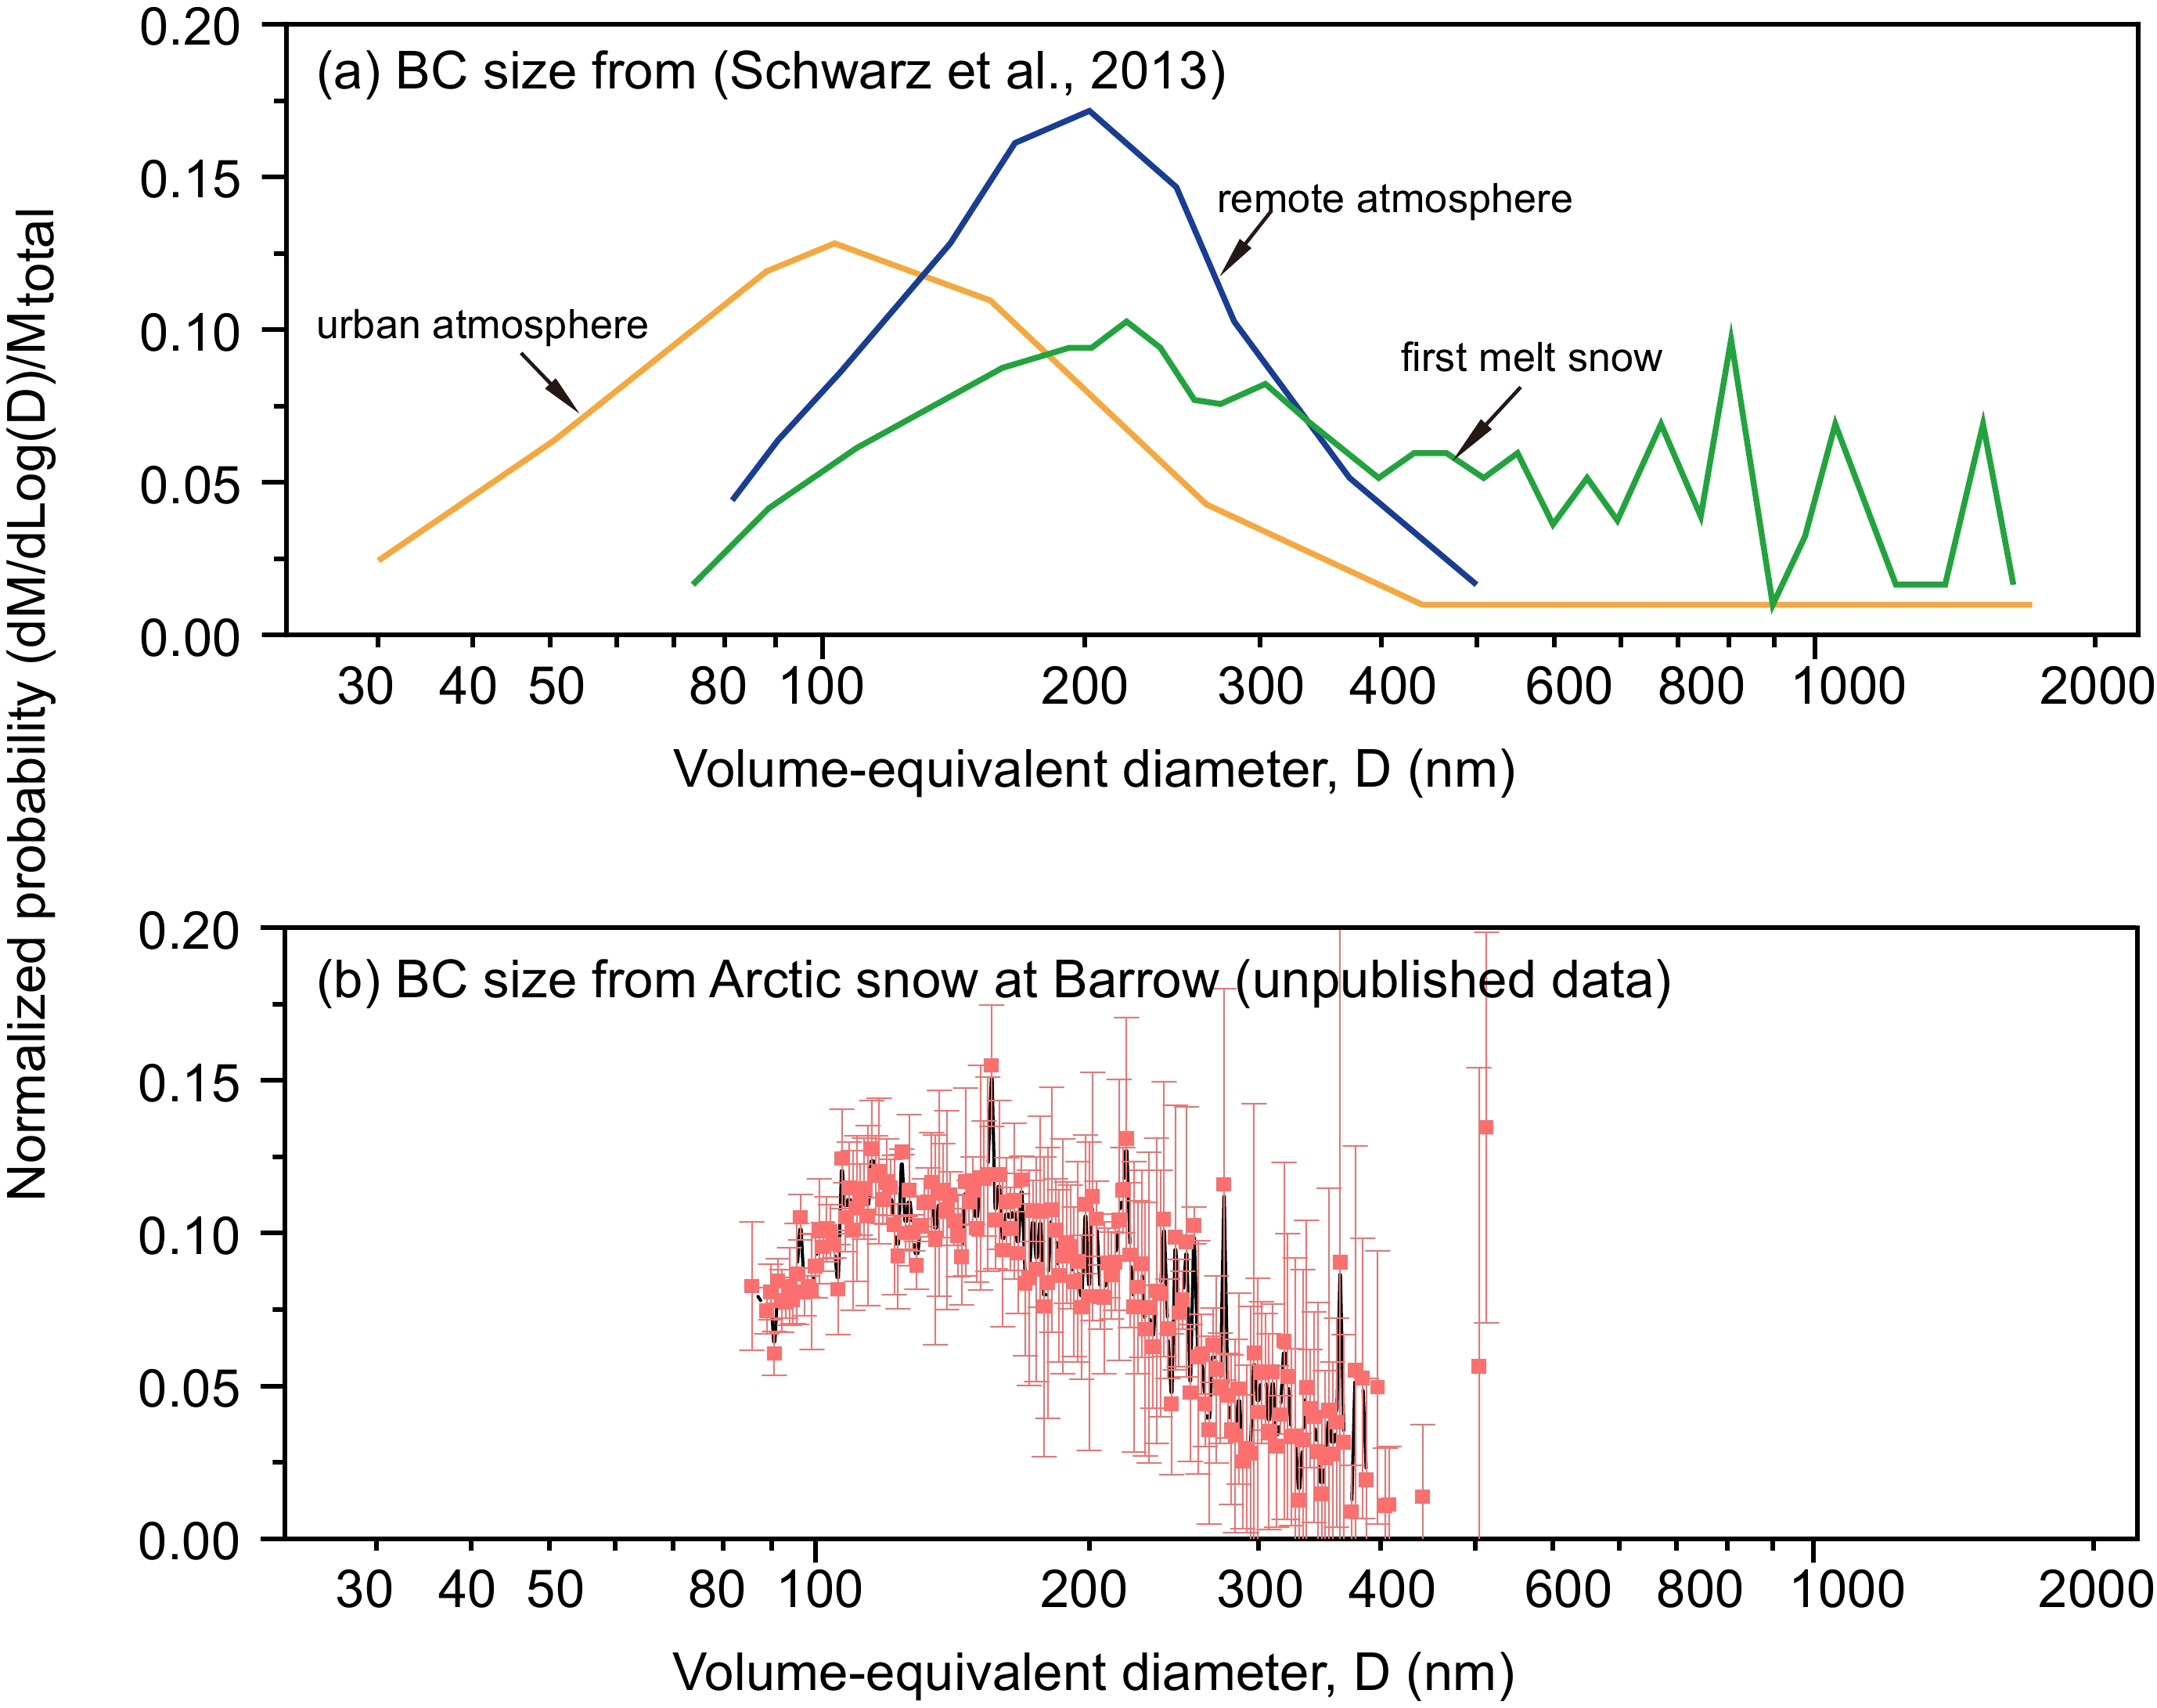
When deposited onto snow, atmospheric BC particles can experience dry and wet deposition processes, and their size distributions in snow may be changed. As shown in Figure 4 and Table 1, BC size distributions in snow also exhibited large differences depending on region and remoteness. In specific, for the snowfall in Colorado, BC median size was about 219 nm, and a significant shoulder of BC mass size distributions particular with BC particles size lager than 300 nm (Schwarz et al., 2013) (Fig. 5a). In Beijing city, BC particle size in snow increased from 180−210 nm from 19 to 21 November in 2015, suggesting BC was more aged on 21 November (Zhao et al., 2021). In Qilian Mountains of Northern Tibetan Plateau, mass median diameter of BC from surface snow of Laohugou glacier No.12 was detected to be 180−220 nm (Zhang et al., 2017b). In the Dudh Koshi River basin of Nepal, Himalayan regions, rBC size distribution in seasonal snow showed a slight shift to a larger mode of particle sizes from the fresh snow (2.5 μm to the aged snow samples (~4 μm) (Khan et al., 2020). In the central Asia of this study, the median mass diameter of BC in snow was about 120−150 nm. In Sapporo (Japan), BC in surface snow had a median mass diameter of about 175 nm (Ohata et al., 2013). Mass size distributions for BC in snow across Alaska and Finland were observed to be about 320 nm and 358 nm, respectively (Mori et al., 2019). In particular, in Anchorage and Fairbanks, wood burning in winter was an important source of BC (Ward et al., 2012; Chen et al., 2021), which would shift the BC to a larger median mass diameter, compared to those from fossil fuel combustions (Schwarz et al., 2008; Kondo et al., 2011). Meanwhile, for Alaska Arctic snow at Barrow in late spring (Fig. 5b), the size distribution of BC in snow presented a mass median diameter at about 160 nm (unpublished data from our group), smaller than that from study by (Mori et al., 2019). BC size distribution in snowpack of Ny-Ålesund, Svalbard, was at about 218 nm (Sinha et al., 2018). In Greenland regions, median mass diameter of surface snow was at 200 nm (Mori et al., 2019). In West Antarctica, BC mass size distributions in Antarctic snow presented a multimodal distribution with mass median diameter at 162 nm (Marquetto et al., 2020). While in East Antarctica, BC mass size distributions in snow samples (~140 nm) were generally smaller than those in Arctic snow (Kinase et al., 2020). From BC in snowpit at McMurdo Dry Valleys of Antarctica, mass median diameter of BC size was estimated to be in the 300–400 nm range, which was higher than typical ambient air BC (Khan et al., 2018). BC mass size distributions in snowpack was impacted by the size distribution of BC in the atmosphere. Furthermore, these ambient BC particles underwent size-dependent nucleation and wet removal of BC during the transport from major continental sources to deposit onto snow, altering the original size distributions (Ohata et al., 2016).
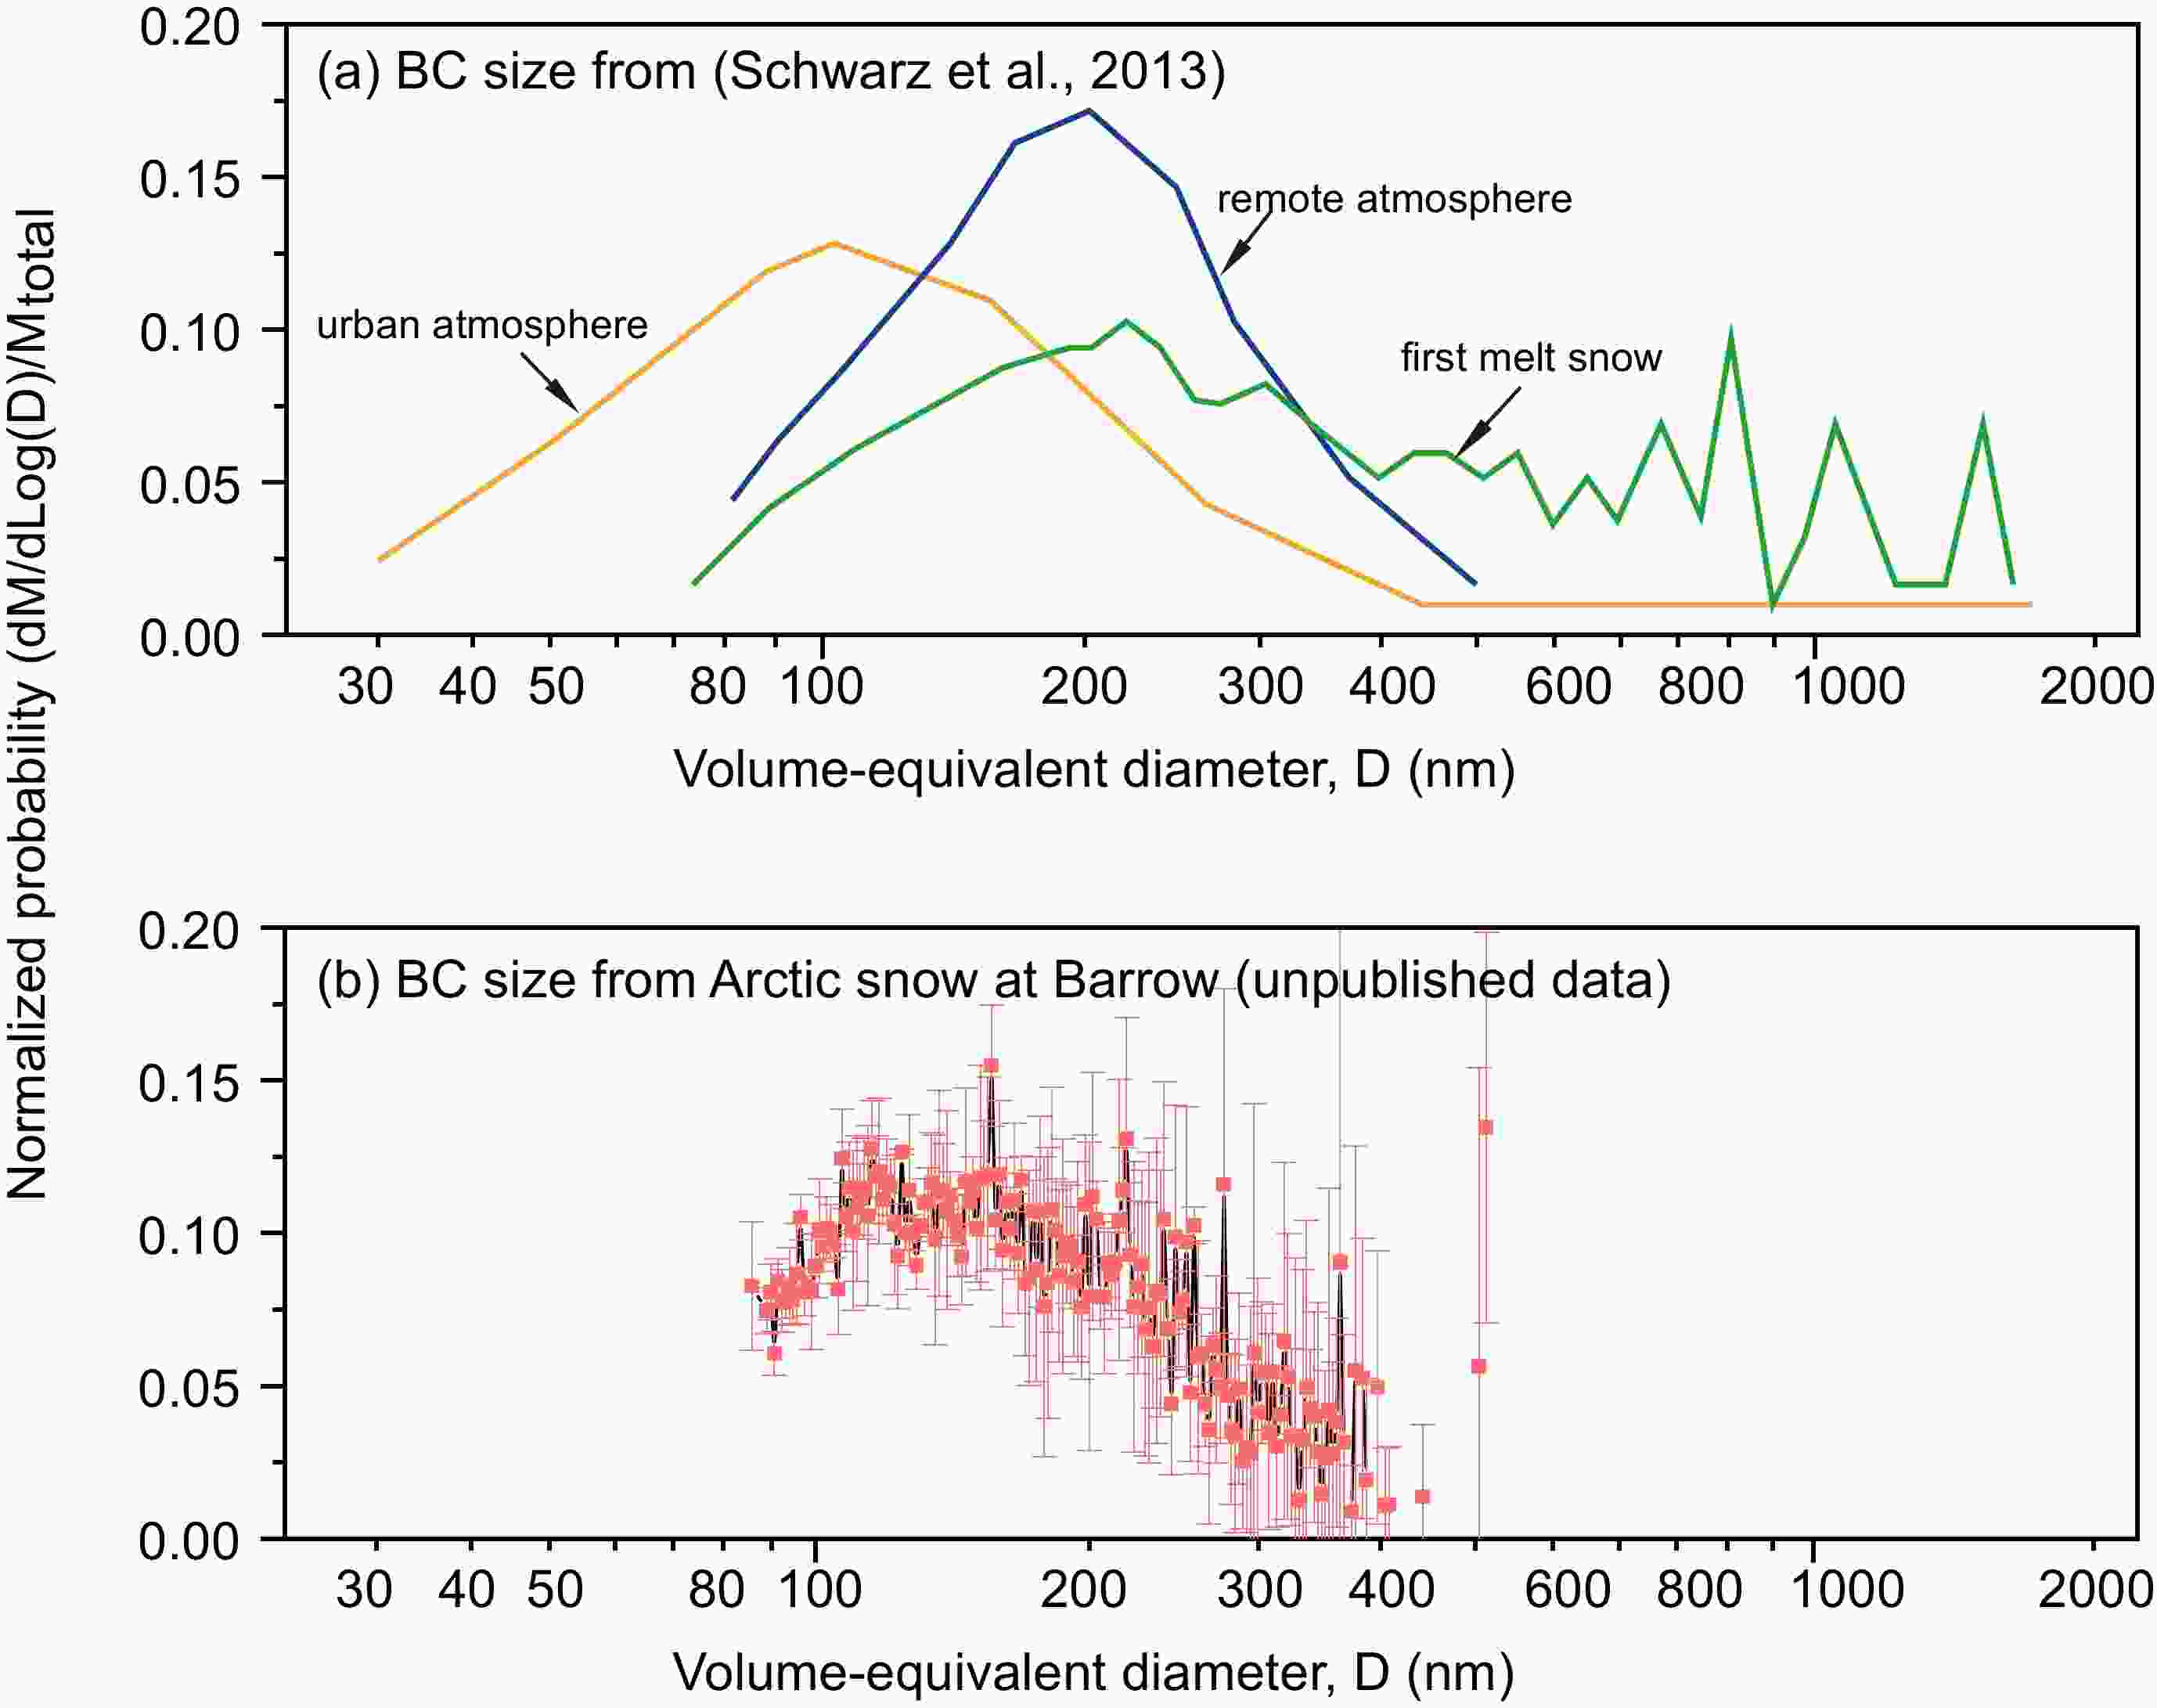
Figure 5. The normalized BC mass size distributions in the atmosphere and snow. (a) The normalized BC mass size distributions from the urban and remote atmosphere, and snow samples from Colorado snowfalls within 60 km of Denver, Colorade, in both semi-rural and rural areas were cited from (Schwarz et al., 2013). (b) The normalized BC mass size distributions from Arctic snow at Barrow. The Arctic snow samples were collected by Yulan ZHANG in 2017 (Zhang et al., 2020b).
We have to note that, because lack of direct measurement of atmospheric BC size in our study area, it was limited to discuss the BC size distribution from atmosphere to snow. Meanwhile, the difference of BC mixing state in the frozen state (snow) and melting water were not analyzed due to the detection limitation. The impact of snow melting on the changes of BC mixing state were not estimated until now. With the development of frozen transmission electron microscopy, it is possible to analyze the BC distributions in snow, which may provide more accurate information on the size distribution of BC in snow in future.
-
The emission types (biomass burning or fossil fuel combustions), aging, transport pathways, removal process from the atmosphere of BC aerosol can substantially affect the BC size distributions in snow (Bond et al., 2013). Previous studies revealed that the BC median mass diameter for particles from biomass burning plume (~210 nm) was larger than that from urban fossil fuel burning (~170 nm) (Schwarz et al., 2008; Kondo et al., 2011; Wang et al., 2016b). Usually, the less distinct finer mode of BC aerosols can be attributed to the fresh emissions from combustion sources, while the coarse mode had an unclear origin (Berner et al., 1996). BC aerosols in urban regions were a complex of comparable contributions from both fresh emissions and regional transport under atmospheric circulation (Wang et al., 2016a). The BC aerosol in remote areas with rapid mixing and aging processes, the median mass size was usually smaller than the ambient urban BC aerosols (Table S2). For example, in Arctic regions, BC median size was about 200 nm for aerosols (Raatikainen et al., 2015; Schulz et al., 2019); however, the BC size for the snow can reach to about 320 nm (Mori et al., 2019). Meanwhile, we have to note that BC mass median size for snow or atmosphere differed globally, which may be dominated by different BC sources (biomass burning vs fossil fuel combustions).
Because of the hydrophobicity of BC particles, scavenging fractions of BC due to percolation of snow meltwater were estimated at 10%–30% at Barrow and Greenland (Doherty et al., 2013). In southeast Tibetan Plateau, the amplification factors of BC for surface to sub-surface snow range from 1.55 to 8.39, with scavenging efficiencies of 20% (Niu et al., 2017). In Our study, the average amplification factor is about 2, indicating the relatively accumulating BC in the surface snow. Especially, melt amplification of BC appeared generally to be confined to the top few centimeters of the snowpack, as shown by the relatively high concentration in surface snow compared to that in sub-surface snow in this study (Fig. 2). Snow metamorphism appeared to play a non-negligible role on BC content in snow (Bertò et al., 2021).
Besides, the BC particles in snow can be internal mixing with other insoluble particles (Doherty et al., 2013). Such internal mixing can enhance the albedo effects by up to 30% for spherical grains relative to external mixing (He et al., 2018a). In the Tibetan Plateau, BC–snow internal mixing enhances the mean albedo effects over the plateau by 30%–60% relative to external mixing (He et al., 2018b). BC size effects for application to climate models indicated large differences ~24% and ~40% in BC-snow albedo forcing simulations (He et al., 2018c). Meanwhile, Schwarz et al. (2013) found that there existed a corresponding reduction in BC absorption in snow of 40% by Mie theory, indicating BC size in snow was the dominant source of uncertainty in BC’s absorption properties for calculations of BC’s snow albedo climate forcing. These studies further emphasized that we have to consider the impact of BC size in snow when simulating its climate effect in future.
-
The study region was controlled by westerlies, profoundly impacted by the Central Asia dust aerosols (Chen et al., 2021). Footprint analysis of backward air trajectories indicated that air masses arriving at the study site mainly originated from northern Xinjiang, Central Asia, and even west Siberia during the studied periods (Fig. 6a). Fire dots (colored dots in the Fig. 6a) concentrated in the northern Xinjiang and Central Asia, and very few were discernible in the eastern part of Xinjiang and northwestern Gansu province. Meanwhile, the results indicated that local wildfires (<50 km) contributed only a small portion of the total BC (~10%) deposited on the snow cover at Altai region (Fig. 6b). However, long-distance transport (the blue, red and orange bars, with distance > 100 km) of BC from fires contributed about 15%–30% of BC deposition (Fig. 6b). Both local emissions and long-range transport of BC aerosols from fires played an important role of BC in snow. Nevertheless, the results further indicated that about 70%–85% of BC in this region during winter was mainly affected by anthropogenic emission, including fossil fuel and biofuel combustions from the traffic, heating, and industrial activity.
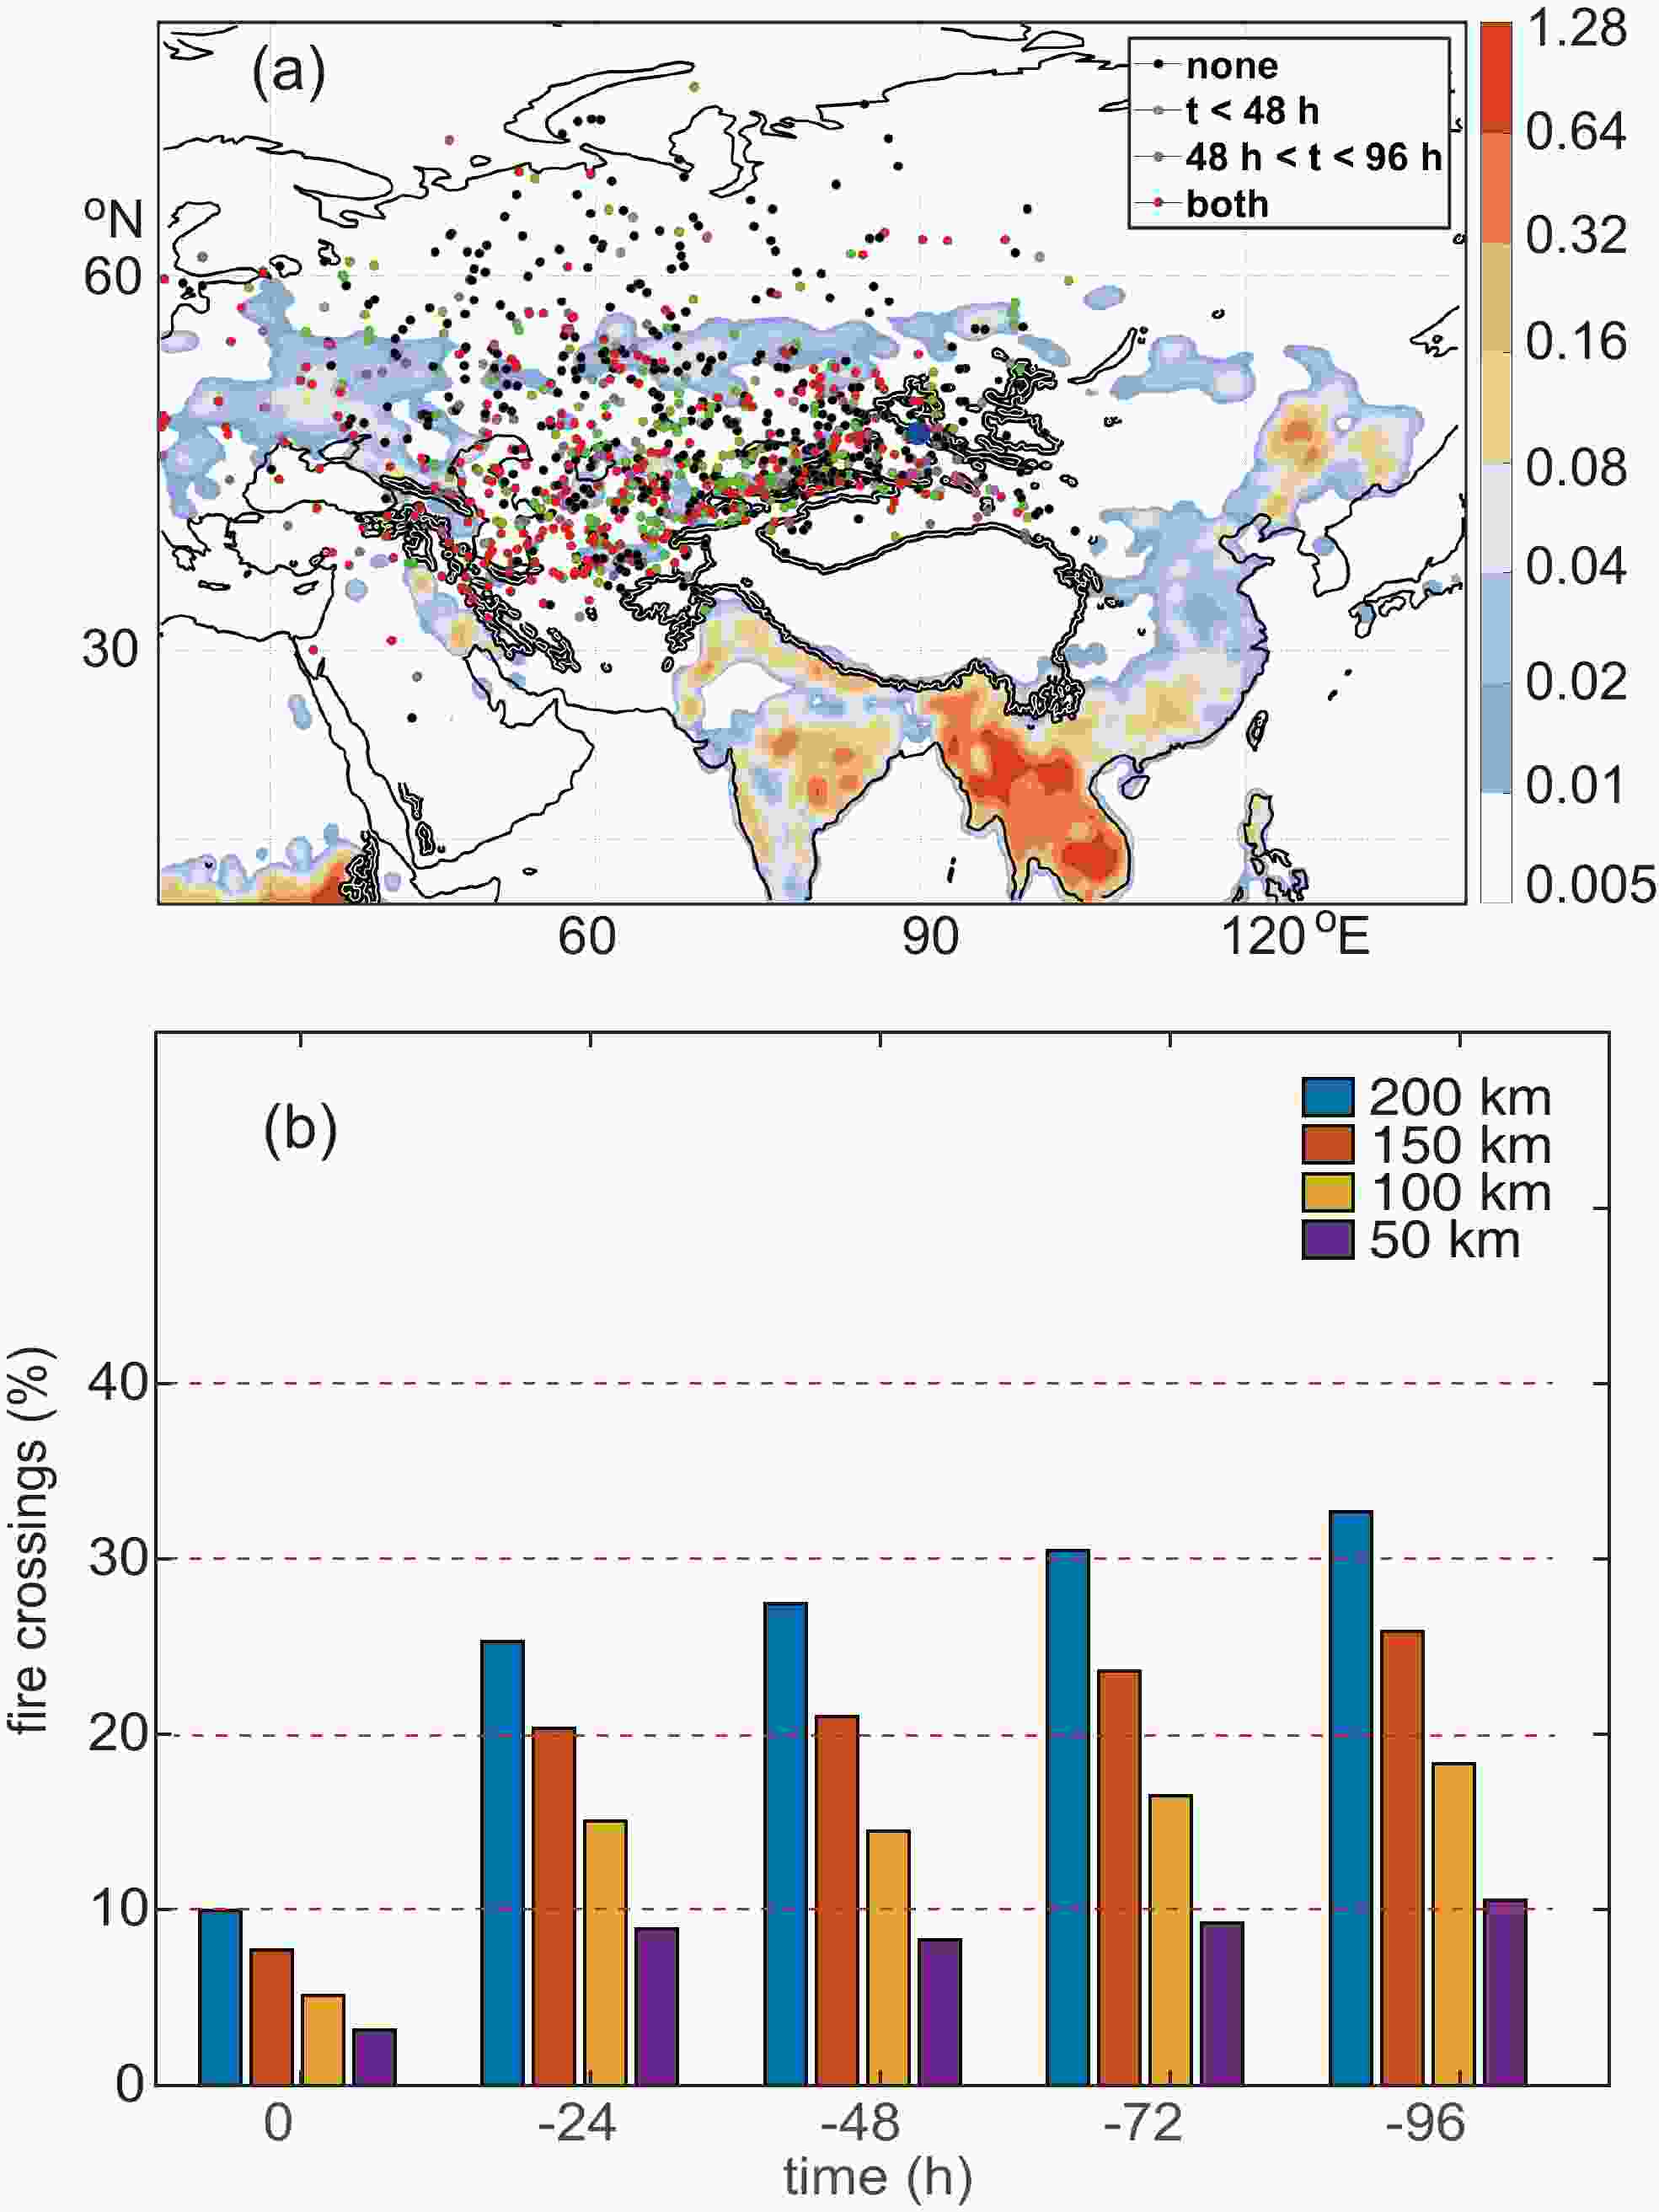
Figure 6. A four-days-back trajectory analysis (a) and contributions of BC emitted from natural fires (b) during the studied periods in Central Asia. Black dots are air parcels that did not pass near a fire, while the colored dots are air mass parcels that crossed fires. Green dots are fires that occurred between −48 h and 0 h before arriving at the site. Pink dots indicate air parcels that crossed over a fire between −96 h and −48 h, but not afterwards. Red dots indicate fires that occurred before and after −48 h. Contributions in (b) was retrieved from the FINN v1.5 global fire emission inventory.
Previous studies in this region indicated that residential emissions were the largest source of BC in snow in Northern Xinjiang based on the WRF-Chem simulations, with contributions from 53% to 85%; and industrial activity was the second largest source of BC (Zhong et al., 2019). The positive matrix factorization model indicated biomass burning (especially the biofuel for heating in winter and early spring) was normally prevalent in Northern China (including Xinjiang) (Pu et al., 2017). For BC from Muz Taw glacier in Sawir Mountains further evidenced that more than 80% of BC deposited was attributed to anthropogenic emissions (Zhang et al., 2020a). Backward trajectories analysis illustrated that the local pollution dominated BC in snow across Tianshan Mountains; however, the Altai region was dominated by the Russian-Northern Kazakhstan-East Kazakhstan transport path with less contribution from local pollution (Chen et al., 2019). Combined our study, these results revealed that BC in snow of Northern Xinjiang was mostly contributed with the anthropogenic sources through atmospheric transport, with dominant sources of BC from anthropogenic activities.
-
Snow cover samples were collected and studied for rBC size in snow at Koktokay Snow Station in Chinese Altai Mountains of Northern Xinjiang during November 2016 to April 2017. The results indicated that rBC concentrations in snow showed a general increasing trend during the studied periods, with average of 5.77 and 2.82 ng g−1 for the surface snow and sub-surface snow, respectively. These data were 2−3 orders of magnitude lower than BC concentrations measured by Thermal/Optical methods in the same study region due to the detection limits of BC size by SP2 in this study. The distributions of BC size in surface snow were represented by a lognormal function with mass median size of 120−150 nm volume equivalent diameter. However, no specific mass median size of BC for sub-surface snow in winter could be identified. Meanwhile, large differences of BC size between atmosphere and snow were also discussed on a global scale, and we found that BC origins, BC mixing status, and post-deposition due to melting may affect the BC size distributions. Backward trajectories provided evidence that anthropogenic emissions of BC aerosols dominated BC in snow of Chinese Altai Mountains, with contribution of about 70%−85%. Climate effects of BC size distributions associated with snow grains are still unknown and need to be investigated in future studies.
Acknowledgements. This study was supported by the second Tibetan Plateau Scientific Expedition and Research Program (2019QZKK0605), the National Science Foundation of China (42271132), Longyuan Youth Innovative Program of Gansu Province, and the Fundamental Research Funds for the Central Universities (lzujbky-2021-74). The data supporting can be obtained from supplementary information.
Electronic supplementary material: Supplementary material is available in the online version of this article at
https://doi.org/10.1007/s00376-022-2141-z .
| Study area | Snow types | BC size measurement method (BC size range) | Mass median size(nm) | References | |
| Arctic regions | Ny-Ålesund, Svalbard | Fresh snow/falling snow | SP2 (70−4170 nm) | 240 | Sinha et al., 2018 |
| Greenland | Snowpack/ surface snow | SP2 (70−4170 nm) | 200 | Mori et al., 2019 | |
| Alaska | Snowpack/ surface snow | SP2 (70−4170 nm) | 320 | Mori et al., 2019 | |
| Barrow, Alaska | Surface snow | SP2 (70−500 nm) | 160 | Unpublished data | |
| Antarctica | West Antarctica | Snow/firn core | SP2 (70−2000 nm) | 162±40 | Marquetto et al., 2020 |
| McMurdo Dry Valleys, West Antarctica | Snowpit | SP2 (70−800 nm) | 300−400 | Khan et al., 2018 | |
| Eastern Antarctica | Surface snow | SP2 (70−4170 nm) | 140 | Kinase et al., 2020 | |
| Middle latitudes | Chinese Altai regions | Surface/sub-surface snow | SP2 (70−500 nm) | 120−150 | This study |
| Northern Tibetan Plateau | Surface snow | SP2 (70−500 nm) | 180−200 | Zhang et al., 2017b | |
| Dudh Koshi River basin of Nepal, Himalayas | Seasonal snow | SP2 (70−5000 nm) | 2500 (fresh snow)4000 (aged snow) | Khan et al., 2020 | |
| Sapporo, Japan | Surface snow | SP2 (70−850 nm) | 175 | Ohata et al., 2013 | |
| Denver, USA | Fresh snow/falling snow | SP2 (70−2450 nm) | 240 | Schwarz et al., 2013 | |
| Note: SP2—Single Particle Soot Photometer. | |||||
 AAS Website
 AAS WeChat