


 DownLoad:


HTML
-
Precipitation extremes have attracted much attention in recent years because of their profound impacts on society, economies, ecosystems, and human safety (IPCC, 2012; Donat et al., 2016; Qin and Xie, 2016; Swain et al., 2016; Bao et al., 2017; Prein et al., 2017; Wang et al., 2017b; Dong et al., 2019). Therefore, it is crucial to understand the temporal and spatial characteristics of precipitation extremes, as well as their possible changes in the future, and their connections with surface air temperature (SAT) and atmospheric circulation. However, this remains a great challenge due to the large uncertainties in precipitation extremes.
Under climate change, changes in precipitation extremes, as well as the mean precipitation, are expected owing to the dependence of the holding capacity of atmospheric moisture on temperature according to the Clausius–Clapeyron (CC) relationship (O’Gorman, 2015; Wang et al., 2017a). Both the intensity and frequency of heavy precipitation have been shown to have increased with historical warming based on observations (Fischer and Knutti, 2016; Diffenbaugh et al., 2017). In the future, precipitation extremes will intensify with climate warming according to climate models, but the rates remain unknown. Wang et al. (2017a) determined the peak relationship of precipitation extremes with the local temperature under the current climate over most areas throughout the world, where the precipitation extremes increased with low temperature but decreased with high temperature. In addition, the peak precipitation extremes will increase with global warming in the future. Compared with the restriction of future warming to 2°C, the restriction of warming to 1.5°C may reduce the frequency of heat extremes but the effects on precipitation extremes are less clear in Australia (King et al., 2017).
Numerous studies have considered the changes in precipitation extremes under climate change based on observations, climate modeling, and physical theory. Physical analyses have determined how climate change impacts precipitation extremes and how the changes in precipitation extremes depend on changes in the upward wind velocity, the derivation of saturation specific humidity, and the air temperature when extreme events occur (O’Gorman and Schneider, 2009; Pfahl et al., 2017). Precipitation extremes are often related to organized convection, so the changes in precipitation extremes under global warming may vary when the changes in convective organization become more important (Pendergrass et al., 2016). Tan et al. (2016) detected oscillations in the precipitation extremes over Canada and their connections with climate anomalies using wavelet analysis, and found that the impacts of large-scale climate on precipitation extremes varied among different seasons and regions. In addition, the modeled precipitation extremes were found to be sensitive to the resolution of the climate model, where a higher resolution may strengthen the deep convection of the Gulf Stream (Scher et al., 2017). Azad and Sorteberg (2017) investigated the connections between the precipitation extremes in Norway and the atmospheric moisture fluxes. The increasing rates of future precipitation extremes are projected to be significantly faster than that of the water vapor at the near surface (Bao et al., 2017).
Precipitation extremes vary in different regions, even in the opposite manner (Donat et al., 2013). Precipitation extremes in the Asia monsoon area are more strongly sensitive to climate warming relative to those in other regions (Zhang et al., 2018; Wang et al., 2020). Many studies have focused on the precipitation extremes in China based on observations (Zhai et al., 2005; Zhang et al., 2017a; Lü et al., 2017; Wei et al., 2017) and by global and regional climate modeling (Li et al., 2016b; Qin and Xie, 2016; Chen and Sun, 2017; Zhang and Zhou, 2020). Wang et al. (2012) provided an overview of the data, simulations, and projections for the precipitation extremes in China. During the historical periods, increases of heavy precipitation extremes and decreases of consecutive dry days were found over northwestern China, an arid and semiarid area (Wang et al., 2013; Lin et al., 2017; Li et al., 2019a). Heavy precipitation extremes in China were also found to increase in the future (Xu et al., 2018). Under different global warming rates, precipitation extremes presented different increasing rates at regional and global scales (Chen et al., 2020). Precipitation extremes are impacted by both human and nature (Chen and Sun, 2017; Dong et al., 2020). The effects of human activities on precipitation extremes are enhanced under warming climate, with the strongest sensitivity over the Tibetan Plateau (TP) (Chen and Sun, 2017). Precipitation extremes in China are also affected by the western North Pacific subtropical high via tropical cyclones (Zhang et al., 2017a) and associated with the eastern tropical Pacific Ocean (Qin and Xie, 2017). Lee et al. (2017) investigated the relationship between the precipitation extremes over Asia and the boreal summer intraseasonal oscillation, which is an important factor that affects the occurrence of precipitation extremes. Due to the coarse resolution of CMIP5 models, regional climate models (RCMs) are often used to study the mean climate, as well as climate extremes, and present good performance at local to regional scales (Gao et al., 2017; Gao, 2020; Gu et al., 2020). Because of their higher resolutions and detailed physical processes, RCMs usually present good performance in simulating precipitation extremes (Wang et al., 2012). Precipitation extremes were simulated with the RegCM4 RCM from the Abdus Salam International Center for Theoretical Physics (ICTP) (Giorgi et al., 2012), and it was found that more wet extremes will occur in most areas of China, while less dry extremes will occur in Northwest China (Qin and Xie, 2016).
It is well known that the water vapor capacity increases about 7% when temperature increases by one degree (Trenberth et al., 2003). Precipitation extremes are impacted by atmospheric temperature and moisture (thermodynamic effect) as well as upward velocity (dynamic effect) (Zhang et al., 2017b). O’Gorman and Schneider (2009) derived a physical scaling of changes in precipitation extremes by changes in saturated specific humidity, upward vertical velocity, and air temperature, and the importance of these factors is different in different regions. In general, dynamic changes have greater spatiotemporal complexity than thermodynamic changes, which makes it harder to investigate the dynamical impacts on precipitation extremes (Norris et al., 2019). Dynamical processes constitute the main factor that impacts summer precipitation in East Asia under global warming of more than 2°C, while thermodynamic processes are more important with low global warming (Li et al., 2019b).
In this study, we attempt to quantify the rates of change in precipitation extremes over four geographical subregions in China (Zheng, 2008) according to the changes in SAT in the mid-future (referred to as MF: 2039–58) and far-future (referred to as FF: 2079–98) compared with the current period (referred to as RF: 1982–2001). We also physically quantify the precipitation extremes based on the surface specific humidity and the vertical wind based on the atmospheric water vapor equation. The models or modeling results employed in this study comprise 17 climate models that participated in CMIP5 (Taylor et al., 2012) for the historical period and future period under the middle emissions scenario (RCP4.5), and six RegCM4 downscaled results with different GCM forcing and different setups. These datasets for the historical period, along with observations, are used to investigate the connections between the precipitation extremes in the dry and wet regions of China and the SST in the eastern tropical Pacific Ocean (Qin and Xie, 2017). The ensemble empirical mode decomposition (EEMD) method is employed to investigate the interannual and intrinsic secular trends in the precipitation extremes (Wu and Huang, 2009). This method can separate the oscillations on multiple time scales from the secular trend, which does not require the shape assumption empirically (Sun et al., 2016; Chen et al., 2017), and has been widely used in many studies, such as precipitation and temperature (Wu et al., 2011; Ji et al., 2014; Kim et al., 2018; Zhang et al., 2019), sea-level rise and sea surface temperature (Chen et al., 2017; Yan et al., 2020), and so on. Furthermore, the physical quantification of the precipitation extremes is investigated based on the surface specific humidity and the vertical wind.
The remainder of this paper is organized as follows. In section 2, we describe the model, experimental setup, data, and methods used in this study. In section 3, we present the main results, including an overview of the precipitation extremes in China in the current and future periods, the relationships between precipitation extremes and SAT, and the physical quantification of precipitation extremes. Finally, we discuss our findings and draw conclusions in section 4.
-
In the present study, we employ two sets of observed precipitation extremes. The first one is based on 753 meteorological stations, with the locations shown by the purple dots in Fig. 1, from 1982 to 2002 (OBS), obtained from the China Meteorological Administration and regridded to 0.5° × 0.5° by linear interpolation with distance weighting (Xie et al., 2007b). The second is derived from gauge-based daily precipitation data acquired at a resolution of 0.5° × 0.5° during 1982–2002 (XPP) (Xie et al., 2007a). We use the historical (1982–2001) and future (2008–98) daily precipitation datasets produced by 17 CMIP5 GCMs from multiple institutes (Table 1). Due to the suitable performance of the RegCM4 RCM in simulating the mean precipitation and extreme precipitation (Qin and Xie, 2016; Zou et al., 2016a, b), two CMIP5 models (HadGEM2-ES, and IPSL-CM5A-LR) are dynamically downscaled with different convection schemes and different land surface components for the historical period (1982–2001) and future period from 2008 to 2059, and six RCM combinations are obtained in total. The monthly SAT based on each of the 17 CMIP5 models and six RegCM4 runs is employed to study the connections with the precipitation extremes in the subregions of China by the corresponding model.

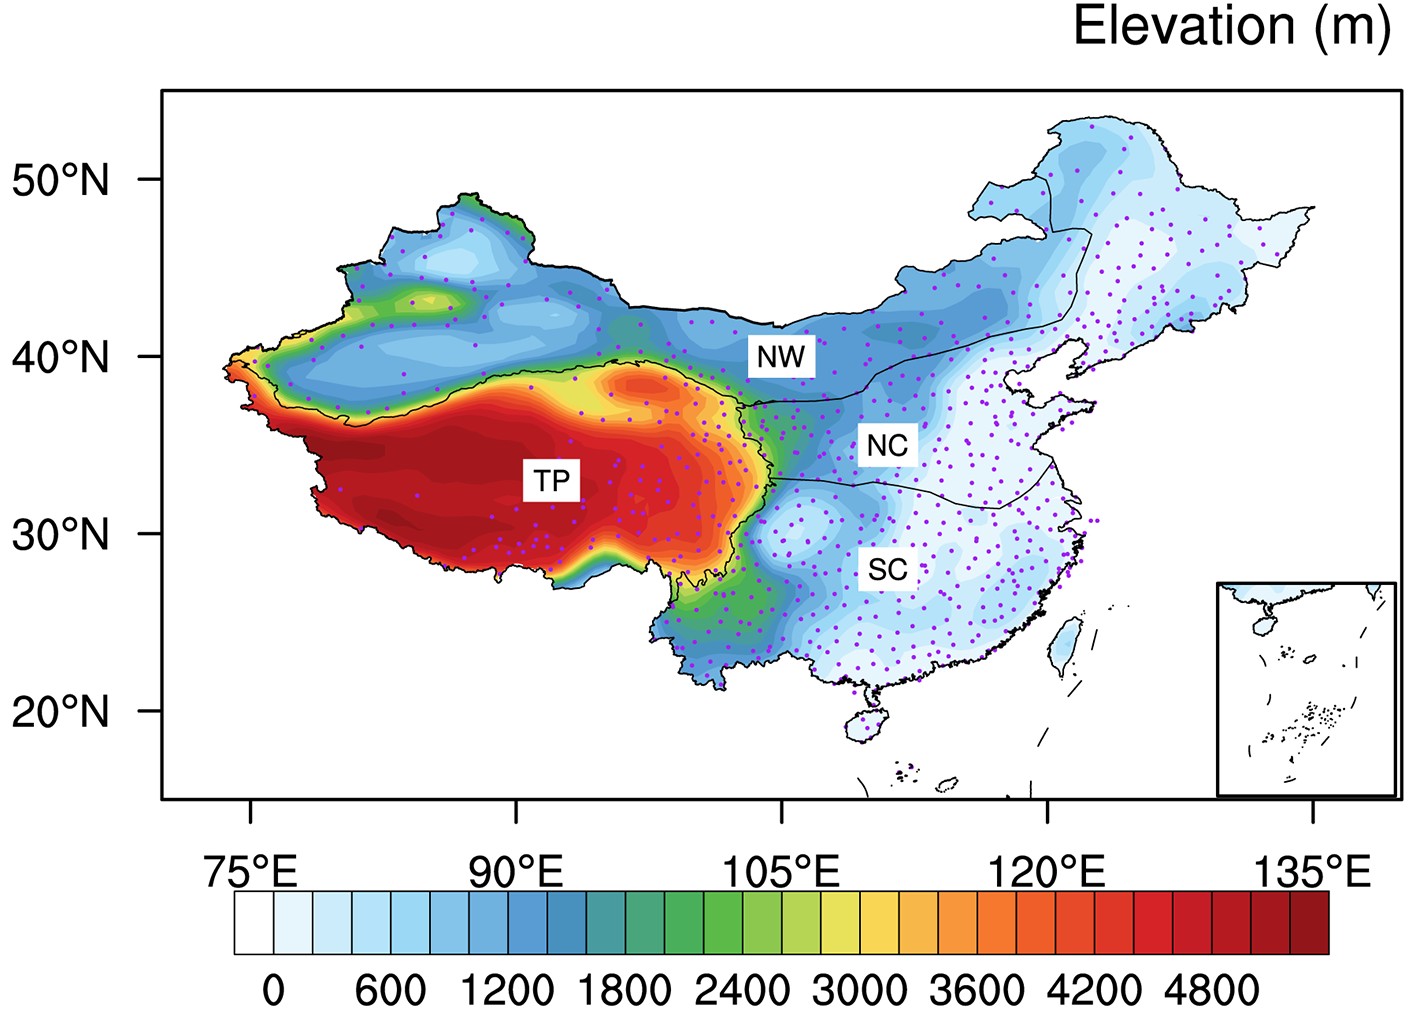
Figure 1. Elevation of China and the four geographical subregions based on elevation and types of climate including precipitation and SAT: northwestern China (NW); northern China (NC); southern China (SC); and the Tibetan Plateau (TP). The purple dots are the 753 meteorological stations in China.
Model Institution Grid (lon. × lat.) ACCESS1.0 Commonwealth Scientific and Industrial Research Organization and Bureau of Meteorology, Australia 192 × 145 BCC-CSM1.1 Beijing Climate Center, China Meteorological Administration, China 128 × 64 BNU-ESM Beijing Normal University, China 128 × 64 CanESM2 Canadian Centre for Climate Modelling and Analysis, Canada 128 × 64 CCSM4 National Center for Atmospheric Research, USA 288 × 192 CESM1-BGC National Science Foundation (NSF), U.S. Department of Energy (DOE), and National Center for Atmospheric Research, USA 288 × 192 CNRM-CM5 Centre National de Recherches Meteorologiques, Meteo-France, France 256 × 128 CSIRO-Mk3.6.0 Australian Commonwealth Scientific and Industrial Research Organization, Australia 192 × 96 FGOALS-g2 LASG, Institute of Atmospheric Physics, Chinese Academy of Sciences, China 128 × 60 FGOALS-s2 LASG, Institute of Atmospheric Physics, Chinese Academy of Sciences, China 128 × 108 GFDL-ESM2M Geophysical Fluid Dynamics Laboratory, USA 144 × 90 HadGEM2-ES Met Office Hadley Centre, UK 192 × 145 IPSL-CM5A-LR L’Institut Pierre-Simon Laplace, France 96 × 96 MIROC-ESM-CHEM National Institute for Environmental Studies, The University of Tokyo, Japan 128 × 64 MPI-ESM-LR Max Planck Institute for Meteorology, Germany 192 × 96 MRI-CGCM3 Meteorological Research Institute, Japan 320 × 160 NorESM1-M Norwegian Climate Centre, Norway 144 × 96 Table 1. The 17 CMIP5 models used in this study.
To make them comparable, the datasets for the daily precipitation and temperature, surface specific humidity, and atmospheric vertical wind speed are interpolated to 1° × 1° using the linear interpolation method with distance weighting.
-
The RCM employed in this study is RegCM-4.3.4 (referred to as RegCM4) (Giorgi et al., 2012) from the ICTP, which is three-dimensional, hydrostatic, and compressible with a dynamical core based on the fifth generation Penn State/NCAR Mesoscale Model (Grell et al., 1994). We generate the initial and boundary conditions for RegCM4 using two CMIP5 models: HadGEM2-ES and IPSL-CM5A-LR, which can generally reproduce the climate in China (Zhu et al., 2019; Xin et al., 2020). RegCM4 is integrated for the historical period from 1 January 1981 to 31 December 2001, and for the future period from 1 January 2008 to 31 December 2059, over East Asia with the whole of China included. The study domain is centered at (36°N, 102°E) with a spatial resolution of 60 km and a total of 120 (longitude) × 90 (latitude) grid points. We use 23 vertical layers and the top of the model is at 50 hPa. The ensemble mean of the RCM runs with different land surface schemes and different convection schemes is adopted to reduce the uncertainties of the results due to different setups. Six different setups of the RCM are adopted and integrated for the historical period (RF: 1982–2001) and mid-future period (MF: 2039–58). That is, the combinations of the land surface component and convection scheme in RegCM4 comprise the Community Land Model (Steiner et al., 2009) with the convection scheme from the Massachusetts Institute of Technology (Emanuel and Živkovic-Rothman, 1999), the Grell convection scheme with Fritsch and Chappel closure (GrellFC) (Grell, 1993), or the Biosphere–Atmosphere Transfer Scheme with the GrellFC convection scheme (Table 2).
No. Land surface component Cumulus convection scheme Atmospheric forcing 1 BATs1e (Dickinson et al., 1993) GrellFC (Grell, 1993) HadGEM2-ES 2 CLM3.5 (Steiner et al., 2009) GrellFC HadGEM2-ES 3 CLM3.5 Emanuel (Emanuel and Živkovic-Rothman, 1999) HadGEM2-ES 4 BATs1e GrellFC IPSL-CM5A-LR 5 CLM3.5 GrellFC IPSL-CM5A-LR 6 CLM3.5 Emanuel IPSL-CM5A-LR Table 2. Experimental setup of the RCM (RegCM) for the reference period (RF: 1982–2001) and mid-future period (MF: 2039–58).
-
The precipitation extreme indices are obtained from the Expert Team on Climate Change Detection and Indices (ETCCDI) (Karl and Easterling, 1999; Zhang et al., 2011), which have been used widely in studies of climatic extremes (Sillmann et al., 2013; King et al., 2014; Westra et al., 2014; Herold et al., 2017). The four extreme indices used in this study are the percentile-based index (R95p: total precipitation on those days with daily precipitation above the 95th percentile), absolute index (Rx5day: maximum 5-day consecutive precipitation), simple daily intensity index (SDII), and the number of days when the amount of precipitation is greater than or equal to 20 mm (R20 mm). Table 3 gives detailed descriptions of these indices.
ID Index name Index definition Units R95p Very heavy precipitation Sum of daily precipitation above 95th percentile mm Rx5day Maximum 5-day precipitation Maximum 5-day precipitation total mm SDII Simple daily intensity index Mean precipitation on those days with precipitation ≥ 1 mm mm d–1 R20mm Number of days with heavy precipitation Number of days with precipitation ≥ 20 mm d Table 3. Precipitation extreme indices obtained from ETCCDI and used in this study.
-
The main method used to investigate the interannual and intrinsic secular trends in this study is the EEMD method (Wu and Huang, 2009), which was developed based on the empirical mode decomposition (EMD) method (Huang et al., 1998) and has been employed widely in climatic studies (Franzke, 2012; Ji et al., 2014; Liu et al., 2014; Sun et al., 2016), sea level analyses (Chen et al., 2017), and other investigations. To ensure that this study is self-contained, we briefly describe the EMD/EEMD methods. The EMD method decomposes a time series
$ x\left(t\right) $ into intrinsic mode functions (IMFs)$ {C}_{j}\left(t\right) $ and the residual$ R\left(t\right) $ as follows:The IMFs for a time series can be estimated as follows: (1) identify all the minima (maxima) for the given time series and connect all the minima (maxima) with a cubic spline defined as the lower (upper) envelope; (2) subtract the mean of the lower and upper envelopes from the given time series to obtain the updated time series; (3) for the updated time series, repeat steps (1) and (2) until the lower envelope and upper envelope are symmetric about zero, and the final updated time series is defined as an IMF; and (4) the residual R(t) is defined as the original time series subtracted by the IMF, and for the residual, loop steps (1)–(3) until the time series of the new residual is monotonic or has only one extreme point.
EMD is unstable for time series of data with noise, so EEMD was developed based on EMD by adding white noise to the time series in order to obtain stable IMFs. The time series with added white noise is decomposed by EMD and this process is repeated with different white noise series. The ensemble means of the IMFs based on all the decompositions are used as the final IMFs. In this study, the sum of all the IMFs of the time series obtained by EEMD is defined as the interannual variability and the residual is treated as the secular trend (Chen et al., 2017).
-
The Theil–Sen method is used to estimate the linear trends of time series by choosing the median slopes of all sample pairs (Sen, 1968). That is, for time series
$ \left\{{x}_{i}\right\} $ , i=1, …, N, the Theil–Sen slope is expressed aswhere
$ {x}_{i} $ and$ {x}_{j} $ are samples at time$ i $ and$ j $ , respectively.The trend significance is tested by the Mann–Kendall method, which is given as
where the signal function is defined as
-
Based on the water vapor equation,
where
$ q $ is the specific humidity of the atmosphere,$ C $ is the condensation rate, and$ {K}_{q} $ is the turbulent diffusion coefficient, the changes in precipitation can be estimated bysince
$ \Delta \omega \Delta q $ is usually much smaller than$ \Delta \omega q $ and$ \omega \Delta q $ (Huang et al., 2013). Here,$ \Delta \omega q $ is the dynamical contribution to changes in precipitation and$ \omega \Delta q $ is the contribution due to thermodynamics. Furthermore, the relative changes in precipitation are approximated as follows:In this study, extreme precipitation indices are calculated based on daily precipitation time series and physically quantified by monthly vertical wind speed at 500 hPa and surface specific humidity.
2.1. Data
2.2. RCM and experimental setup
2.3. Precipitation extreme indices
2.4. Methods
2.4.1. EEMD method


2.4.2. Linear trend and its statistical significance


2.4.3. Method for physically quantifying precipitation extremes


-
Before trying to understand the future changes in precipitation extremes, it is necessary to assess the performance of the CMIP5 models and RCM runs in simulating extreme precipitation. Due to the large spatial variation of China, the country is divided into four geographical subregions (Fig. 1): northwestern China (NW), northern China (NC), southern China (SC), and the Tibetan Plateau (TP), based on the elevations and climate types, including precipitation and SAT (Zheng, 2008). Figure 2 shows the spatial distribution of the extreme precipitation indices (R95p, Rx5day, SDII, and R20mm) for the historical period by OBS, XPP, the CMIP5 models, and RCM runs. In general, the CMIP5 models and RCM runs can capture the spatial variations in the precipitation extremes, which vary from the northwest of China (the arid and semiarid area) to the southeast of China (the humid area) (Li and Wang, 2018; Luo et al., 2020), as well as those based on observations: OBS and XPP. Compared with the extreme indices based on the RCM runs, the CMIP5-based extreme indices are more correlated with those based on OBS and XPP. The simulated precipitation extremes in the SC region exhibit moderate negative biases with both the CMIP models and RCM runs compared with the observations.
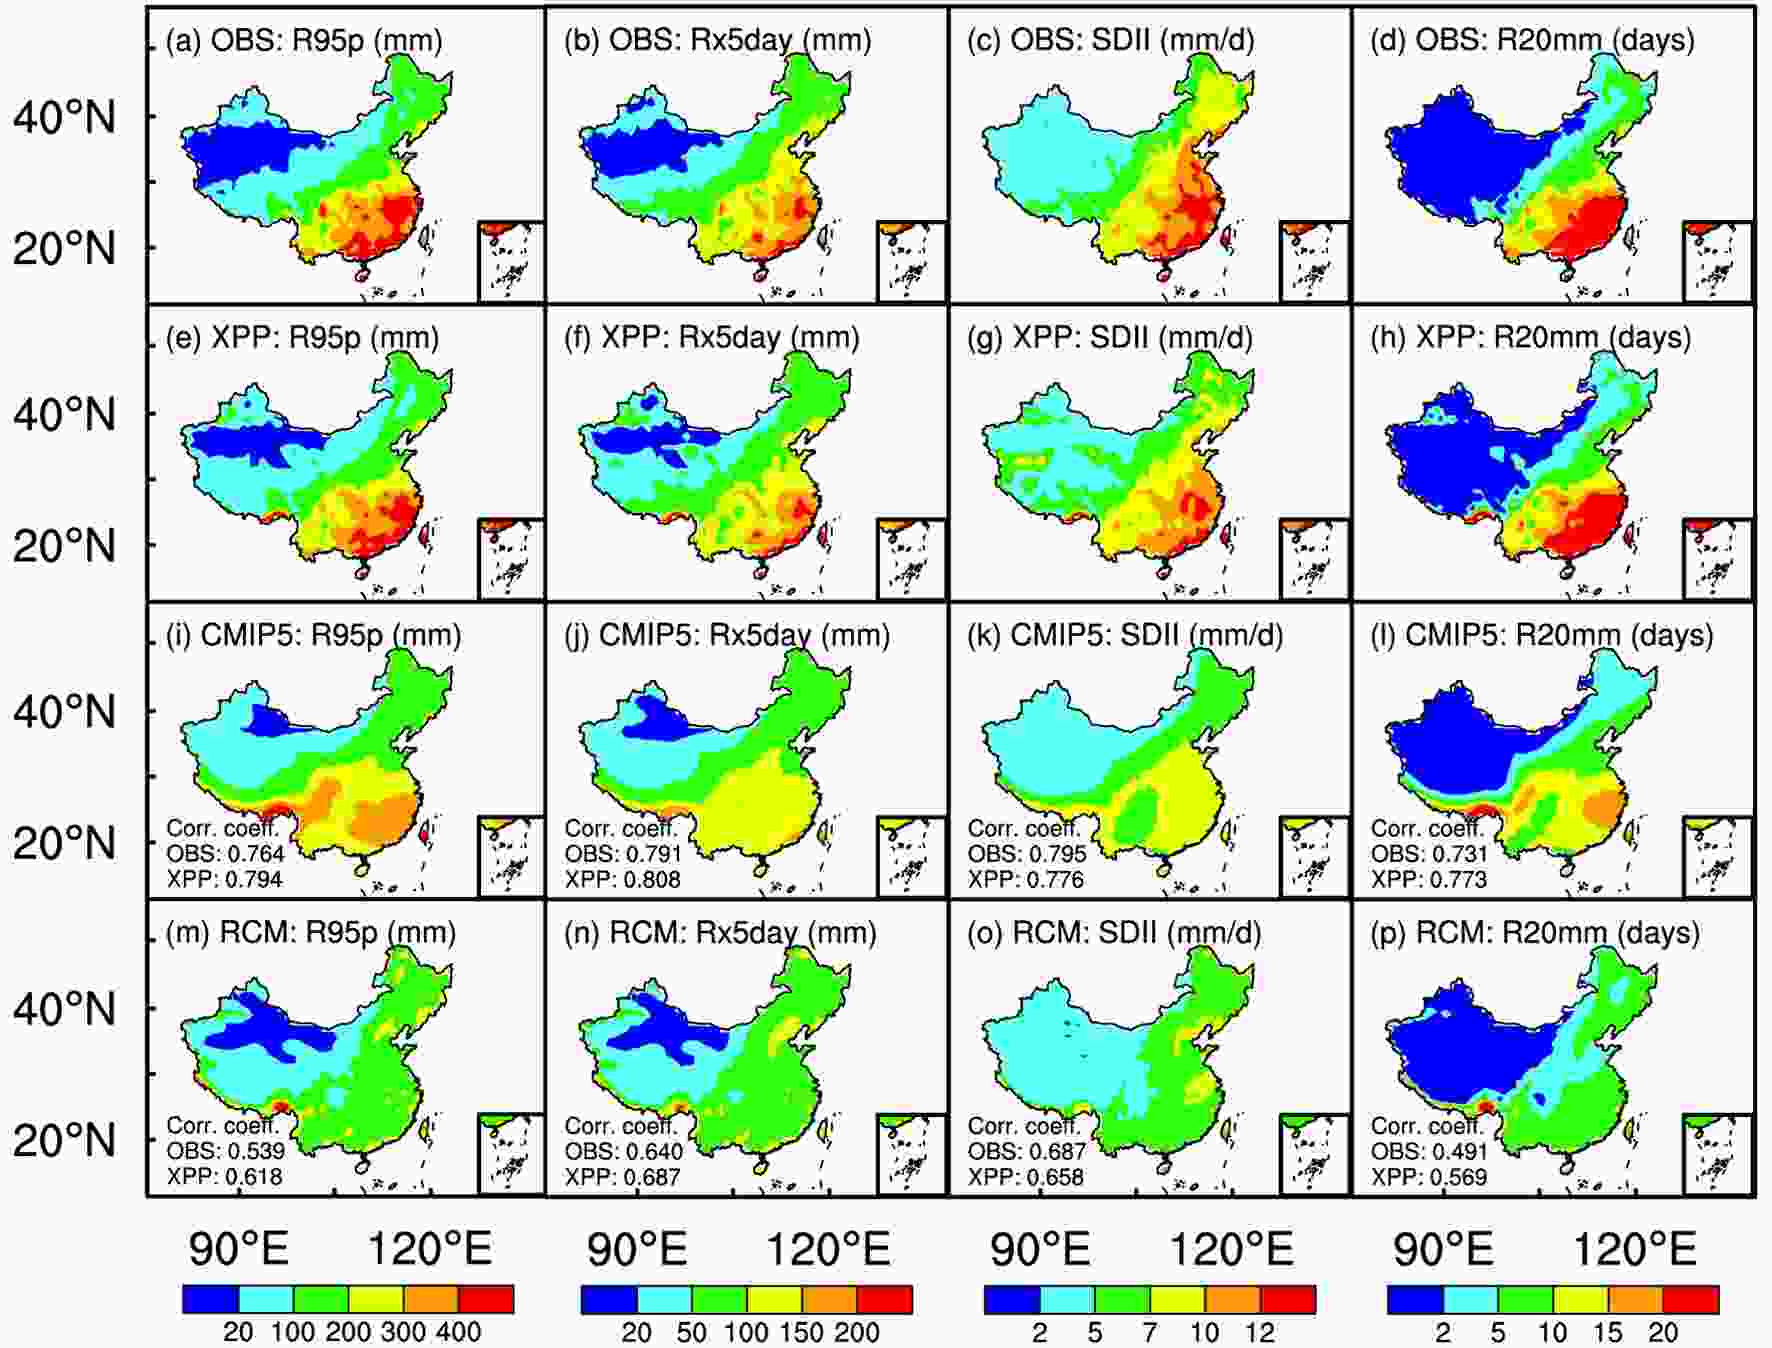
Figure 2. Climatology of precipitation extremes (R95p, Rx5day, SDII, and R20mm) during the RF period (1982–2001) based on (a–d) OBS, (e–h) XPP, (i–l) the CMIP5 ensemble mean, and (m–p) the RCM ensemble mean. The correlations of extreme indices of the CMIP5 models and RCM runs with OBS and XPP are also given.
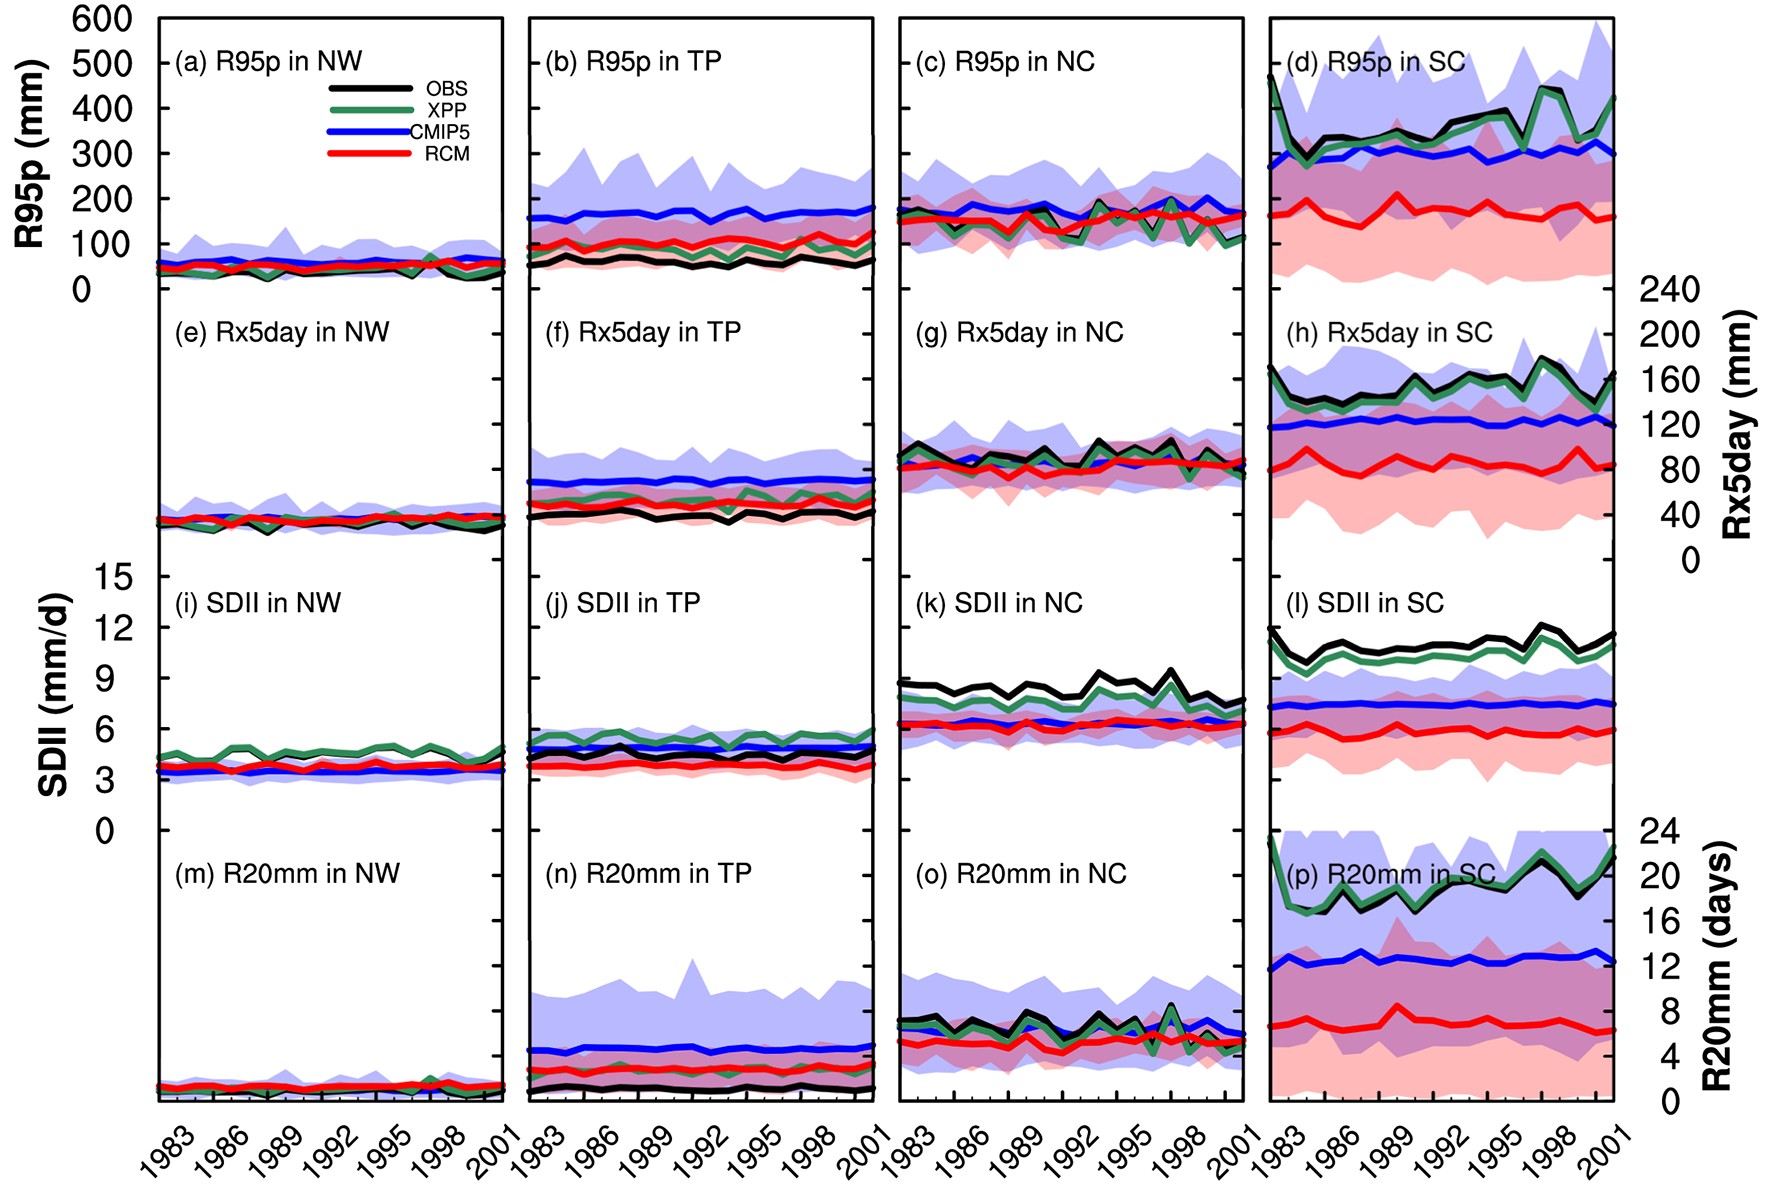
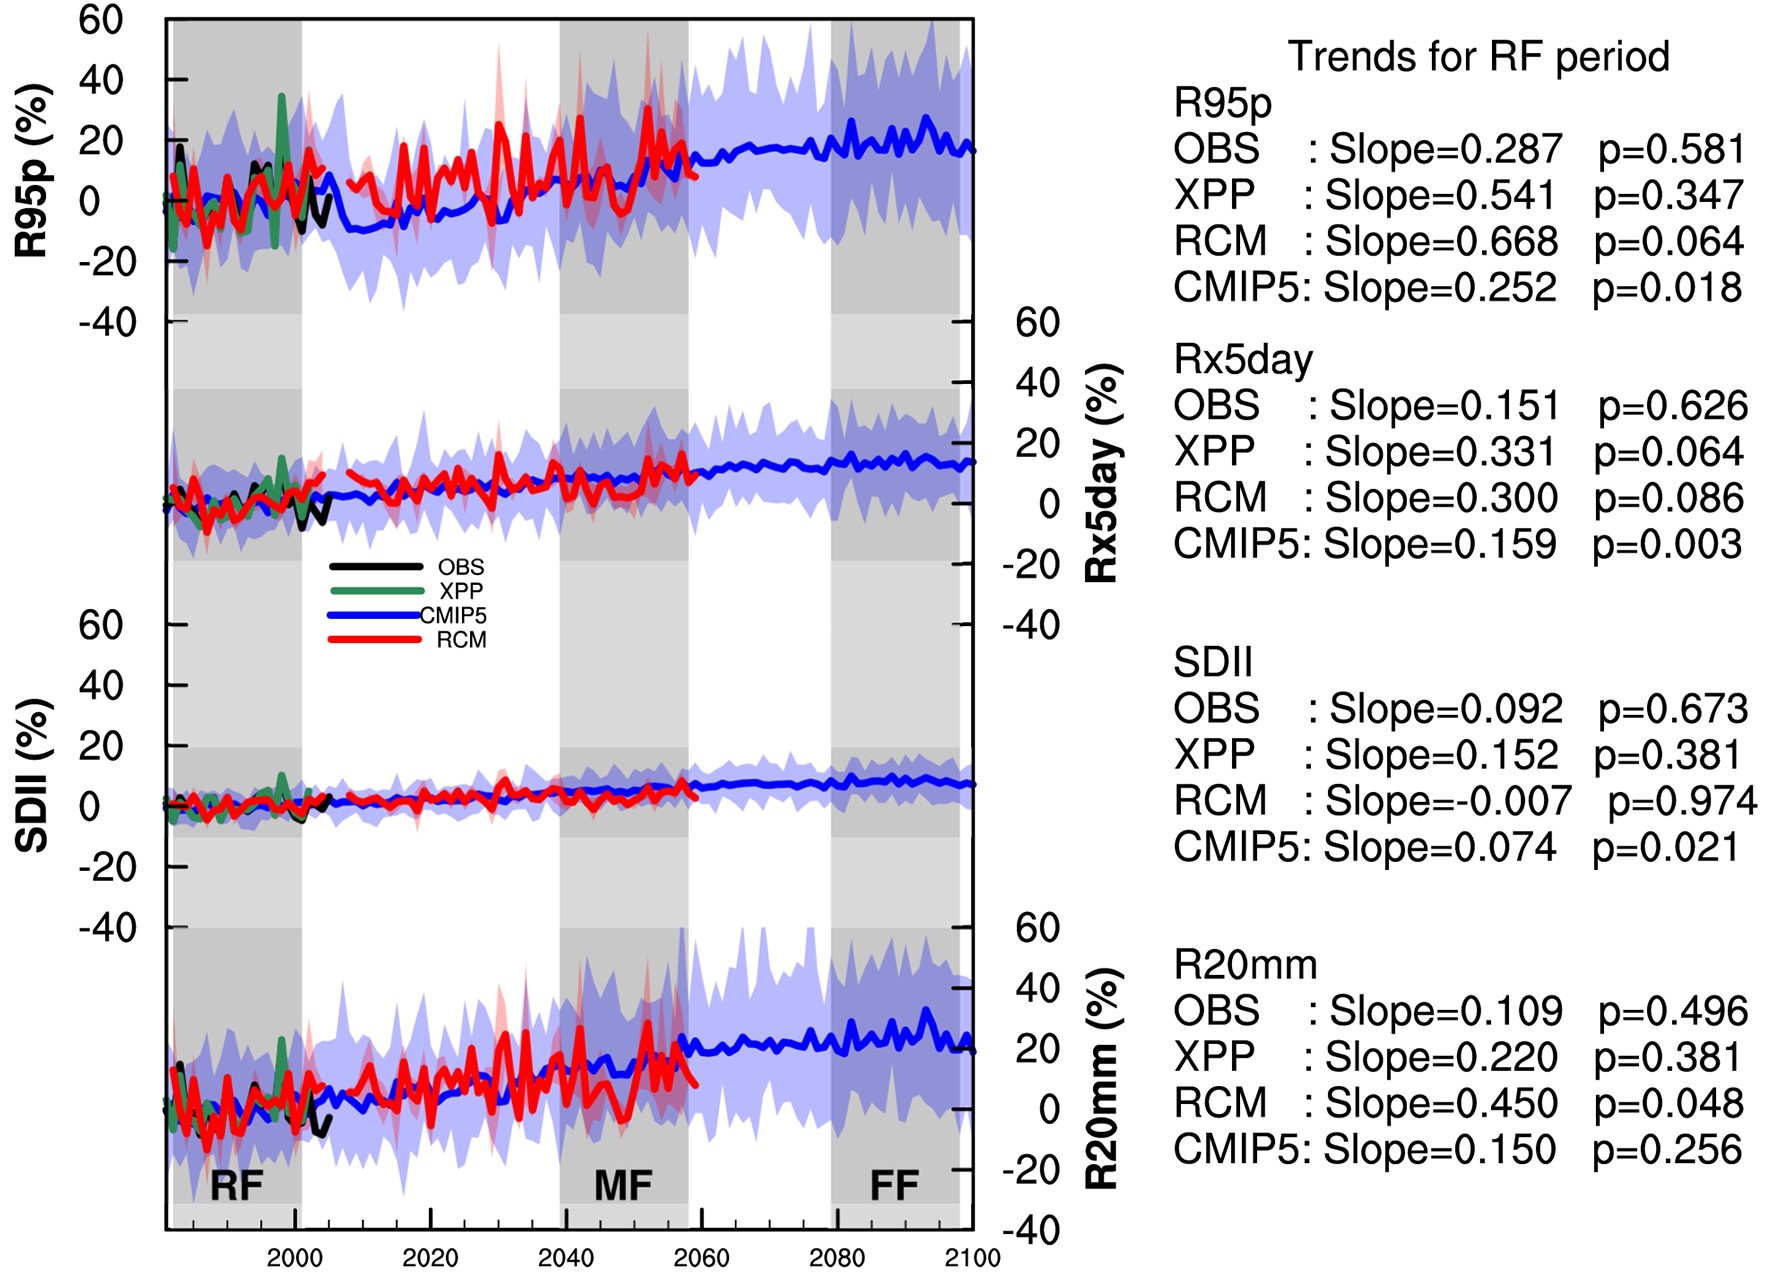
According to the time series of precipitation extremes over the four subregions of China in the RF period (Fig. 3), there are more positive biases in R95p, Rx5day, and R20mm in the TP region when using the CMIP5 ensemble mean compared with the RCM simulations (Figs. 3b, f and n). In the humid SC region, the current precipitation extremes obtained by the RCM runs show larger negative biases than those using the CMIP5 models, which might be due to the inferior performance of the RCM runs, which simulate less summer (June–July–August, JJA) precipitation in the SC region, probably due to underestimating the specific humidity and total water vapor (Qin and Xie, 2016; Zou and Zhou, 2016). In the NW and NC regions, the CMIP models and RCM runs obtain a similar performance when simulating the precipitation extremes. We employ the Mann–Kendall nonparametric significance test to determine whether the linear trend in the Theil–Sen robust estimate is monotonic. Overall, most of the changes in the historical extreme indices over the whole of China exhibit increasing trends from 1982 to 2001 based on OBS, XPP, the RCM ensemble mean, and the CMIP5 ensemble mean (Fig. 4). These results are consistent with recent studies in which it was found that historical precipitation extremes in China increase with SAT, and the increasing rates are spatially non-uniform, which are sensitive to many forcings including topography (Wang et al., 2013; Liu et al., 2015; Xiao et al., 2016; Guo et al., 2020; Zhao et al., 2020). The slopes of the linear trends for R95p from 1982 to 2001 are 0.287 for OBS, 0.541 for XPP, 0.668 for the RCM runs, and 0.252 for the CMIP5 models, which is closer to OBS than that based on the RCM runs. Rx5day for the RF period exhibits a statistically significant increase at the p < 0.1 level, with linear slopes of 0.331 for XPP, 0.300 for the RCM runs, and 0.159 for the CMIP5 models, respectively.
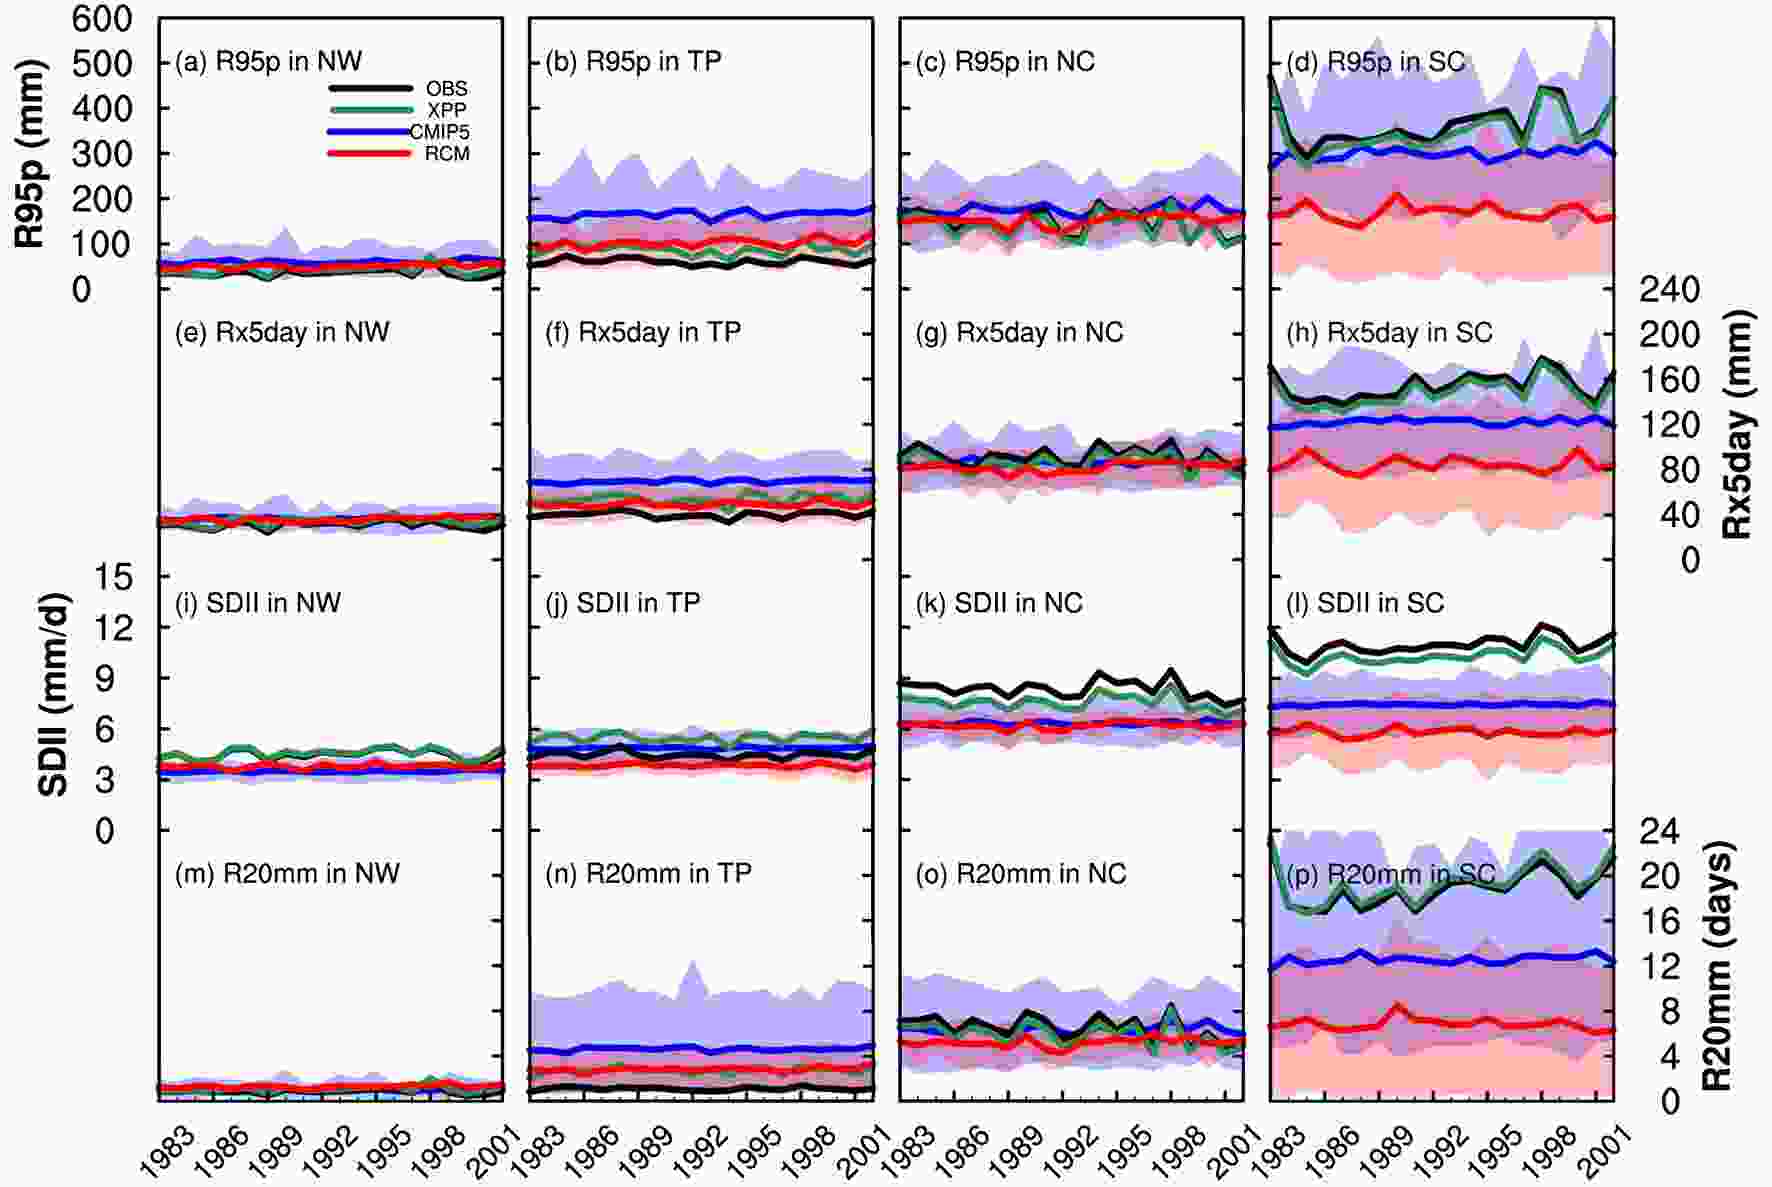
Figure 3. Annual precipitation extremes for (a–d) R95p, (e–h) Rx5day, (i–l) SDII, and (m–p) R20mm over the four subregions in China during the RF period (1982–2001) based on OBS, XPP, the CMIP5 ensemble mean, and the RCM ensemble mean. The shaded colors are the ranges of precipitation extremes simulated by the CMIP5 models and RCM runs.
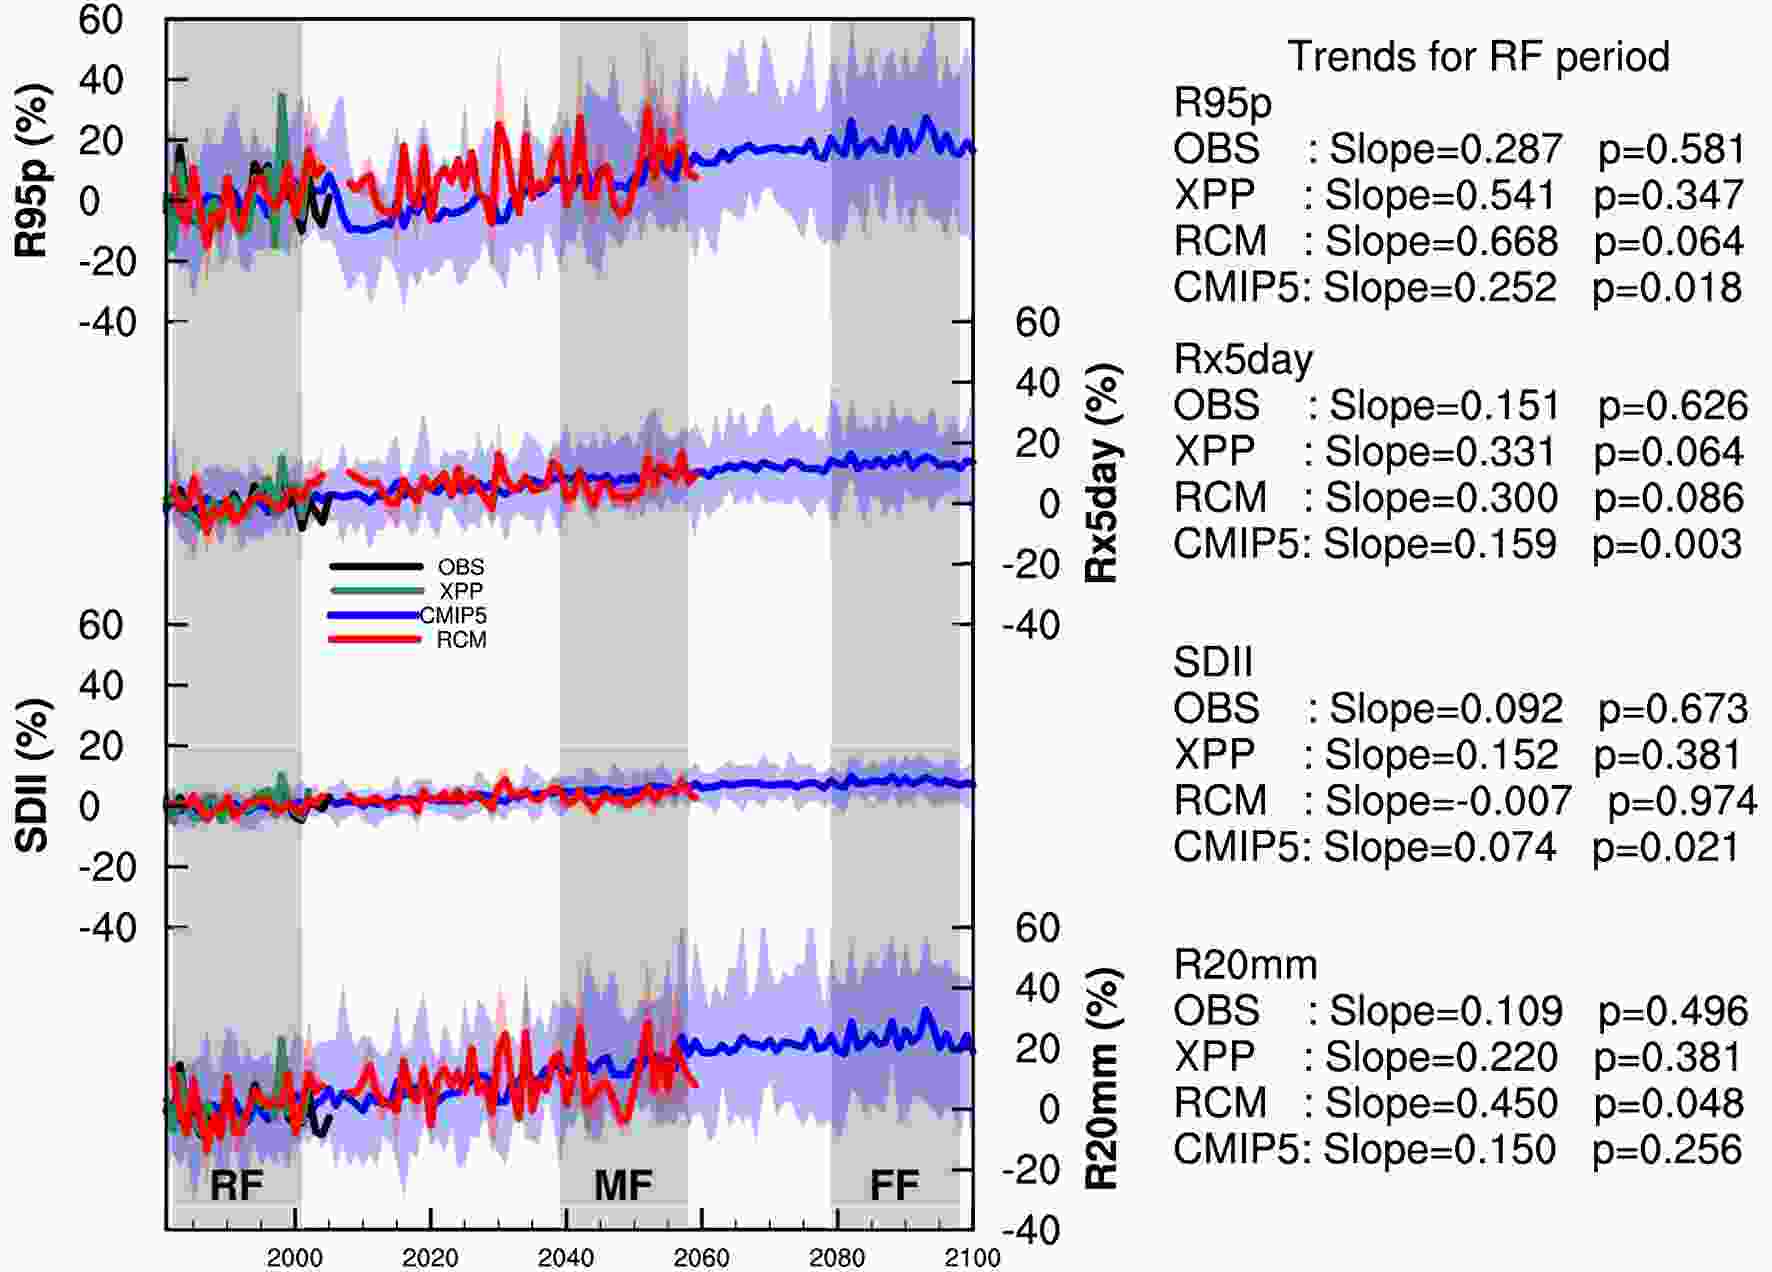
Figure 4. Time series of the changes in the precipitation extremes (R95p, Rx5day, SDII, and R20mm) in China during 1982–2098 based on OBS, XPP, the CMIP5 ensemble mean, and the RCM ensemble mean compared with the RF period mean. The linear trends in the extreme indices during the RF period (1982–2001) are also shown with the slopes where p is the p-value obtained by the Mann–Kendall nonparametric trend test. The shaded colors are the ranges of precipitation extremes by the CMIP5 models and RCM runs.
-
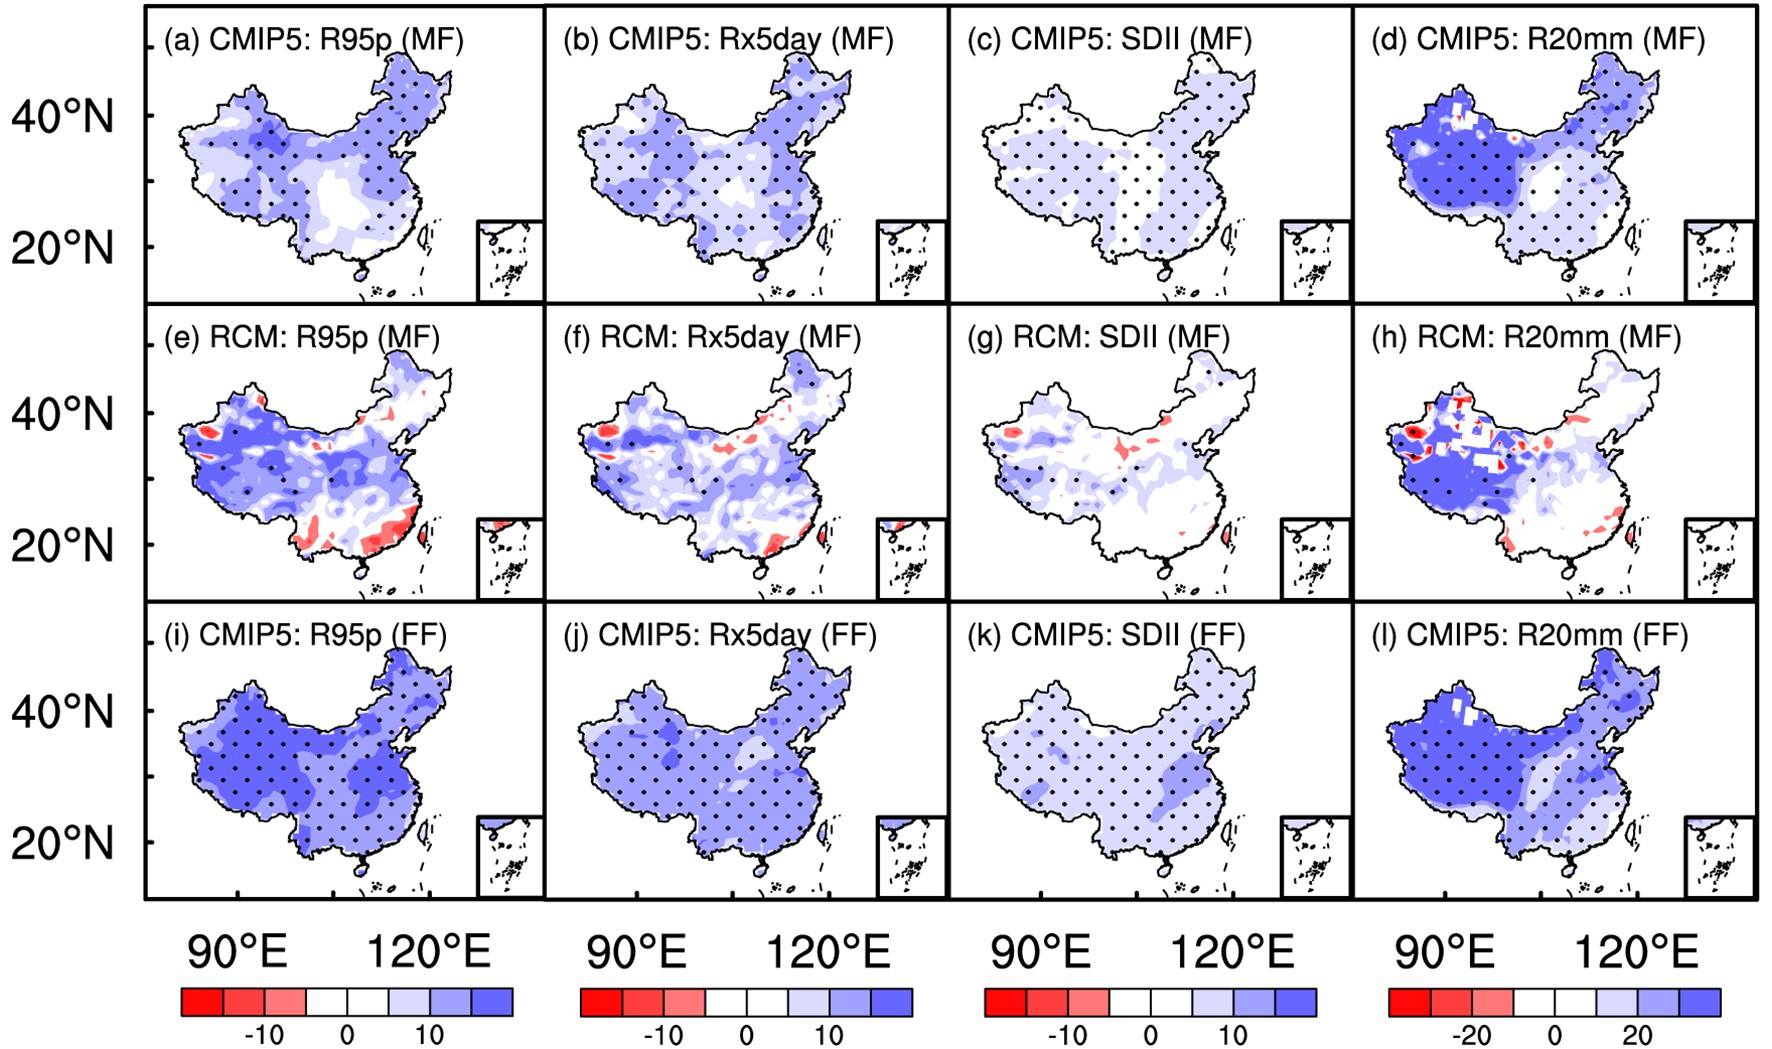
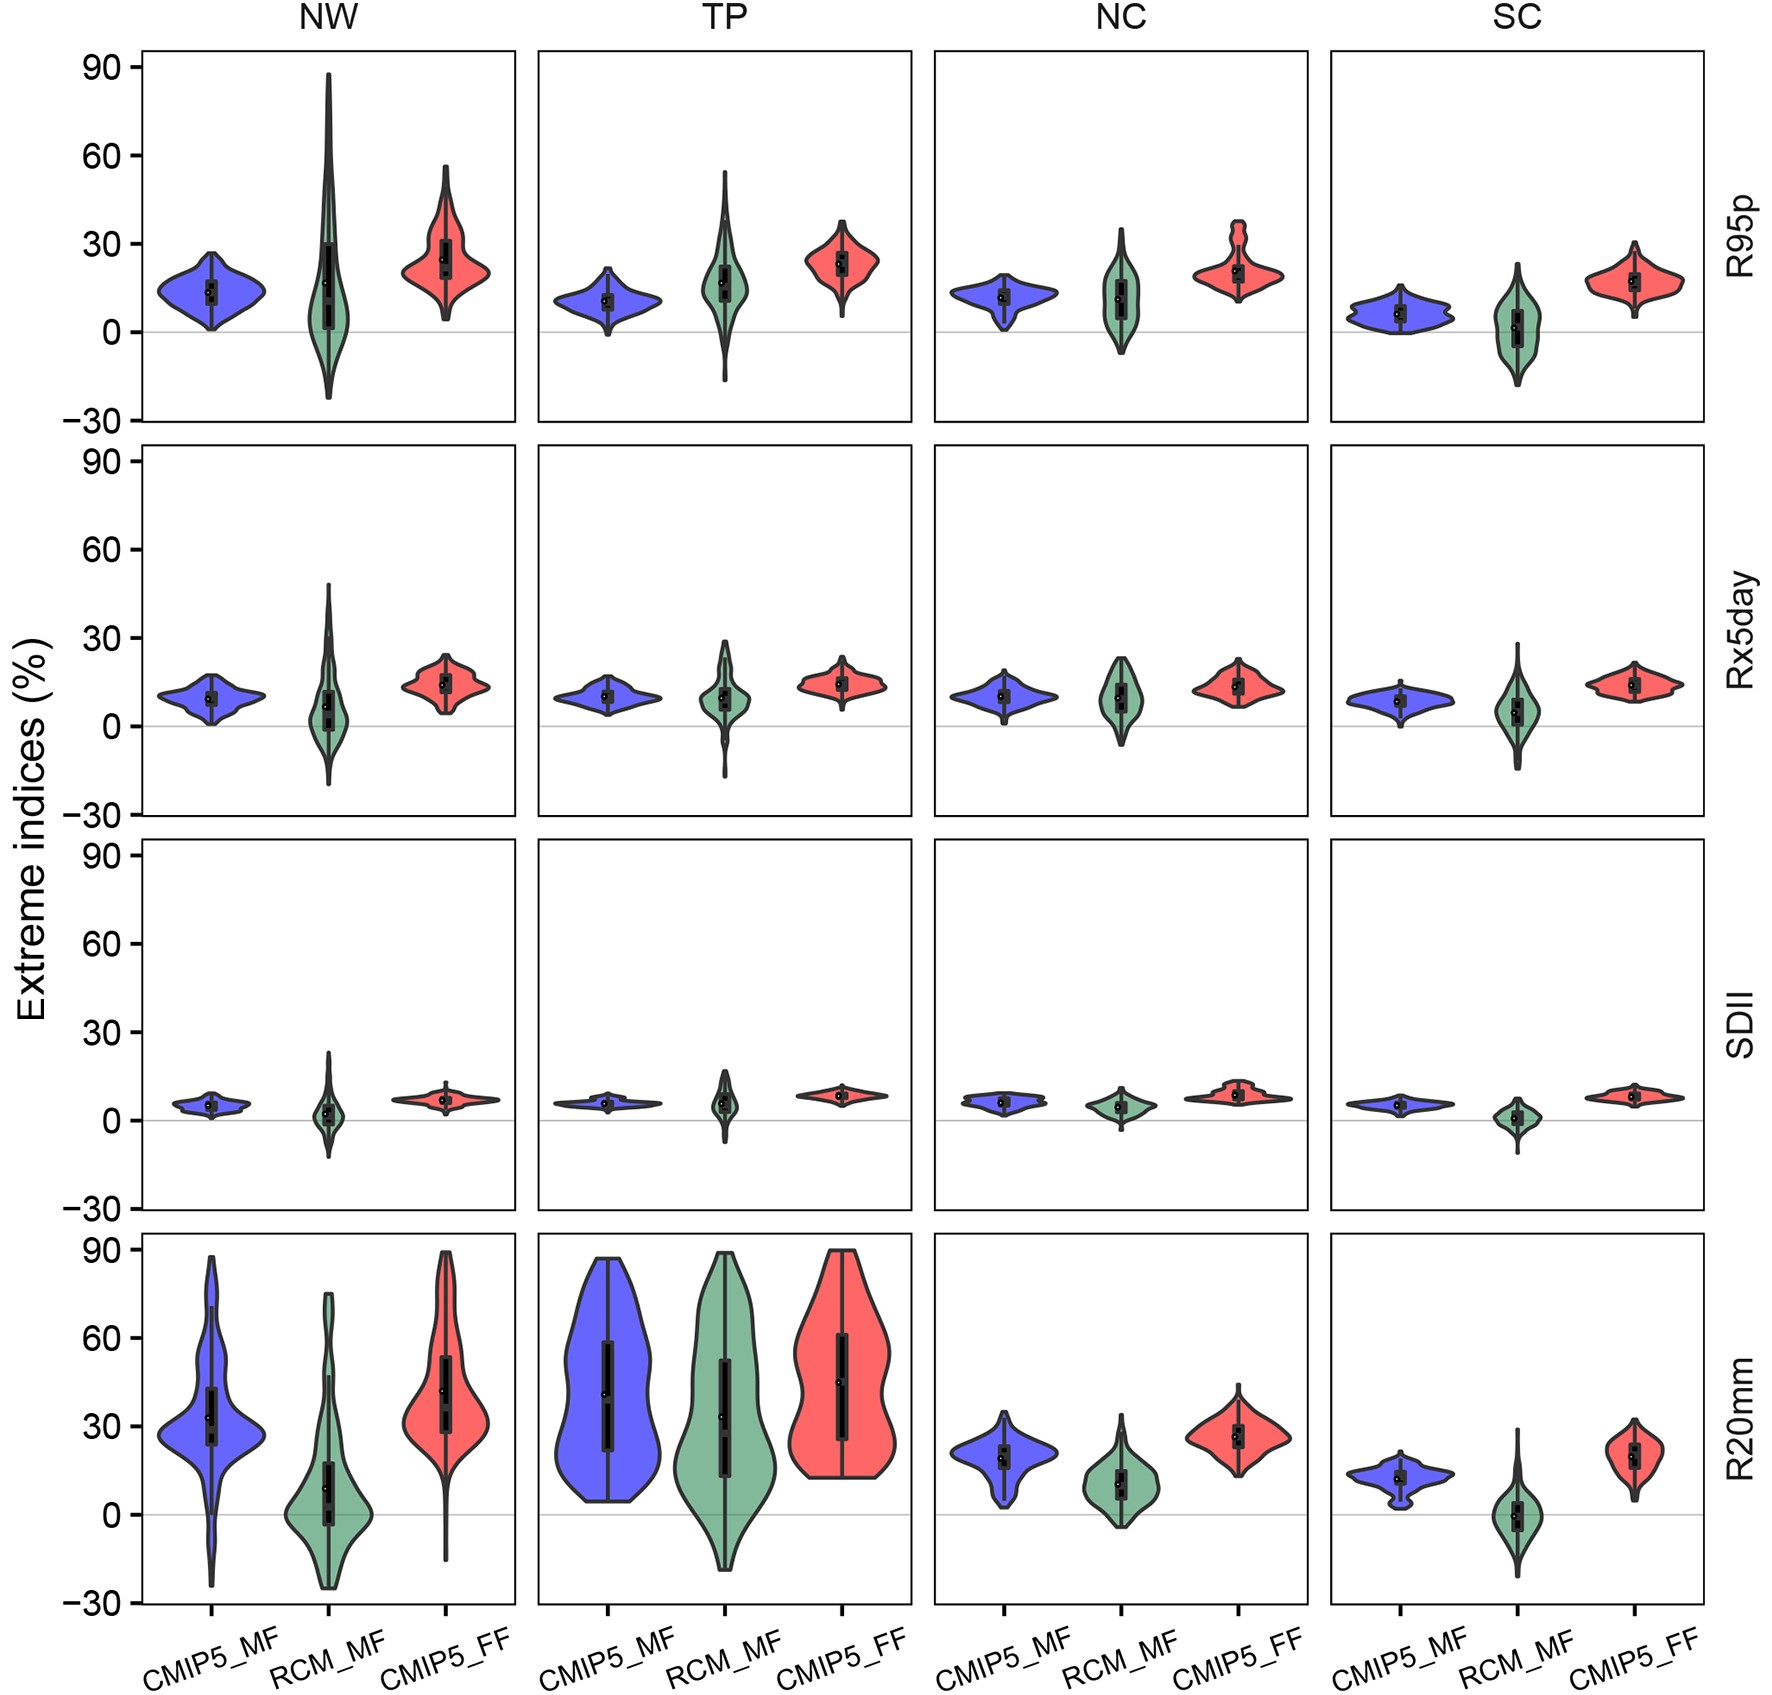
Figure 4 also shows the changes in the precipitation extremes (R95p, Rx5day, SDII, and R20mm) in China for future periods based on OBS, XPP, the CMIP5 models, and RCM runs compared with the climatic precipitation extremes in the historical period (1982–2001). Compared with the precipitation extremes in the RF period, the four extreme indices in China are predicted to increase in the future according to both the CMIP models and RCM runs (Fig. 4). In general, the very high extreme precipitation indices (R95p and Rx5day) over the whole of China are predicted to increase from 2008 to 2098 using the CMIP5 models, and from 2008 to 2059 using the RCM runs. Figure 5 illustrates the changes in the extreme indices based on the RCM ensemble mean and CMIP5 ensemble mean in the MF and FF periods compared with the current period. For the MF period, the CMIP5 ensemble mean predicts increases in the extremes in most areas of China. The spatial patterns of the changes in the extreme indices for the MF period based on the RCM ensemble mean are quite heterogeneous and show a worse performance in the SC region than those by the CMIP5 ensemble owing to the underestimated specific humidity and water vapor fluxes (Qin and Xie, 2016; Zou and Zhou, 2016). The extreme indices by the RCM runs are predicted to increase in many areas of China, while they decrease mainly in the southeast of China, but both of the differences are not significant at the 95% confidence level in most areas. For the FF period, the precipitation extremes by the CMIP5 models are also predicted to increase significantly, but generally with a greater intensity, such as an increase of more than 10% for R95p in the whole of China and for Rx5day in the majority of China. These results agree well previous work showing that Rx5day in China increases strongly under the middle (RCP4.5) and high (RCP8.5) future emission scenarios during 2080–99 (Xu et al., 2018). Figure 6 is a violin plot of the changes in precipitation extremes over the four subregions in China, which shows the probability density of the precipitation extremes as well as their summary statistics: 25% quantile, median, and 75% quantile. Predicted increases in the precipitation extremes are found in the four subregions based on the CMIP5 ensemble mean for the MF and FF periods. R20mm over the NW and TP regions is found to have a large spatial variation (Fig. 6 and Table 4). This might be due to the aridity of the NW region with little precipitation and the coldness of the TP region with high altitude, where R20mm is usually less than five days per year (Qin and Xie, 2016). The relative changes in R95p for the MF period relative to the current period are 13.55% over the NW region, 9.95% over the TP region, 11.68% over the NC region, and 6.14% over the SC region. For the FF period, the relative changes in R95p are larger than those for the MF period, which are 20.80% over the NW region, 21.97% over the TP region, 21.81% over the NC region, and 16.67% over the SC region, which agrees with previous findings that a warmer climate usually increases precipitation extremes (Zhang et al., 2018). The RCM also predicts increases in the precipitation extremes in the NW, TP and NC regions for the MF period, but variable trends in the different extreme indices over the SC region, where the RCM has shown poor performance in simulating precipitation (Qin and Xie, 2016).
Changes
(% for indices; °C for SAT)Standard deviation
(% for indices; °C for SAT)Rate of changes in indices with SAT
(%°C−1)Regions NW TP NC SC NW TP NC SC NW TP NC SC MF_RCM SAT 2.30 2.41 2.29 2.10 0.04 0.00 0.08 0.39 − − − − R95p 5.37 19.92 10.29 1.08 0.99 10.65 1.99 0.58 2.33 8.26 4.49 0.52 Rx5day 2.54 10.74 9.55 1.89 2.86 1.20 0.54 5.68 1.10 4.46 4.17 0.90 SDII 1.48 5.98 4.47 0.70 3.01 0.24 0.13 0.00 0.64 2.48 1.95 0.33 R20mm 1.94 32.09 10.23 1.36 1.76 25.23 3.06 4.56 0.84 13.31 4.46 0.65 MF_CMIP5 SAT 2.18 2.19 2.04 1.78 0.45 0.46 0.39 0.30 − − − − R95p 13.55 9.95 11.68 6.14 7.13 5.66 7.38 6.48 6.21 4.54 5.73 3.45 Rx5day 9.99 9.90 10.25 8.16 4.25 3.89 4.66 5.84 4.58 4.51 5.03 4.59 SDII 5.30 5.78 6.42 5.14 2.18 1.23 2.60 2.33 2.43 2.64 3.15 2.89 R20mm 28.73 24.88 19.27 11.88 13.84 14.35 10.64 6.19 13.17 11.34 9.45 6.68 FF_CMIP5 SAT 2.87 2.83 2.66 2.38 0.75 0.66 0.68 0.64 − − − − R95p 20.80 21.97 21.81 16.67 10.89 8.44 9.96 10.29 7.24 7.75 8.19 6.99 Rx5day 13.69 13.95 13.67 13.63 5.03 4.49 5.27 5.94 4.77 4.92 5.13 5.72 SDII 6.90 8.27 9.09 7.94 2.02 1.86 3.31 3.67 2.40 2.92 3.41 3.33 R20mm 34.89 40.46 27.56 18.71 16.10 32.09 14.06 8.38 12.15 14.28 10.35 7.85 Table 4. Rates of change in the precipitation extremes over the four regions of China during the MF and FF periods corresponding to future changes in the SAT. The rates of changes in precipitation extremes with SAT larger than 7%°C−1 are shown in bold font.
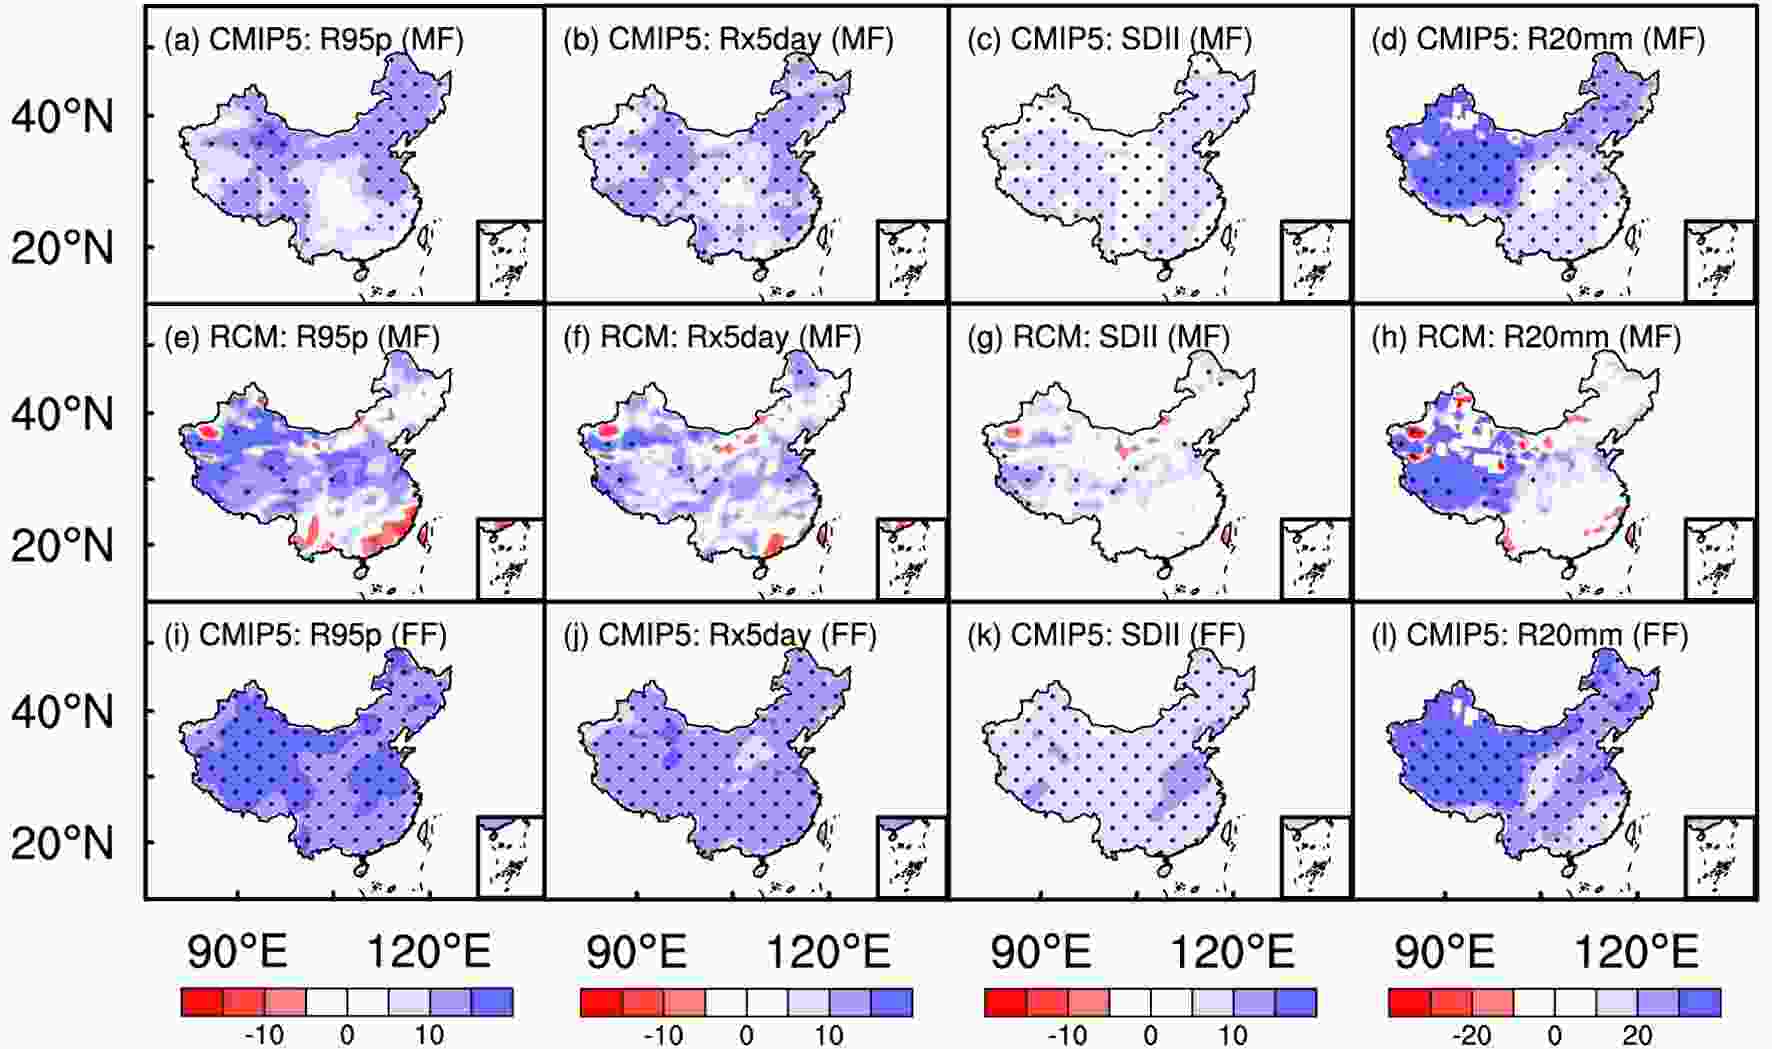
Figure 5. Changes in the precipitation extremes (R95p, Rx5day, SDII, and R20mm) in the mid-future period (MF: 2039–58) and far-future period (FF: 2079–98) compared with the current period (RF) based on the CMIP5 ensemble mean (a–d, i–l) and RCM ensemble mean (e–h). Stippling shows the differences are statistically significant at the 95% confident level.

Figure 6. Violin plots of the changes in the precipitation extremes over four subregions in China during the mid-future and far-future periods compared with the RF period based on the CMIP5 ensemble mean and RCM ensemble mean. The black outline filled with color is the probability density of each extreme index. The thin solid black boxes show the interquartile range and the white circle in the black box is the mean value. The upper whisker extends from the 75% quantile to the largest value, which is less/equal to 1.5 times the interquartile range or 1.5 times the interquartile range. The lower whisker is defined similarly to the upper.
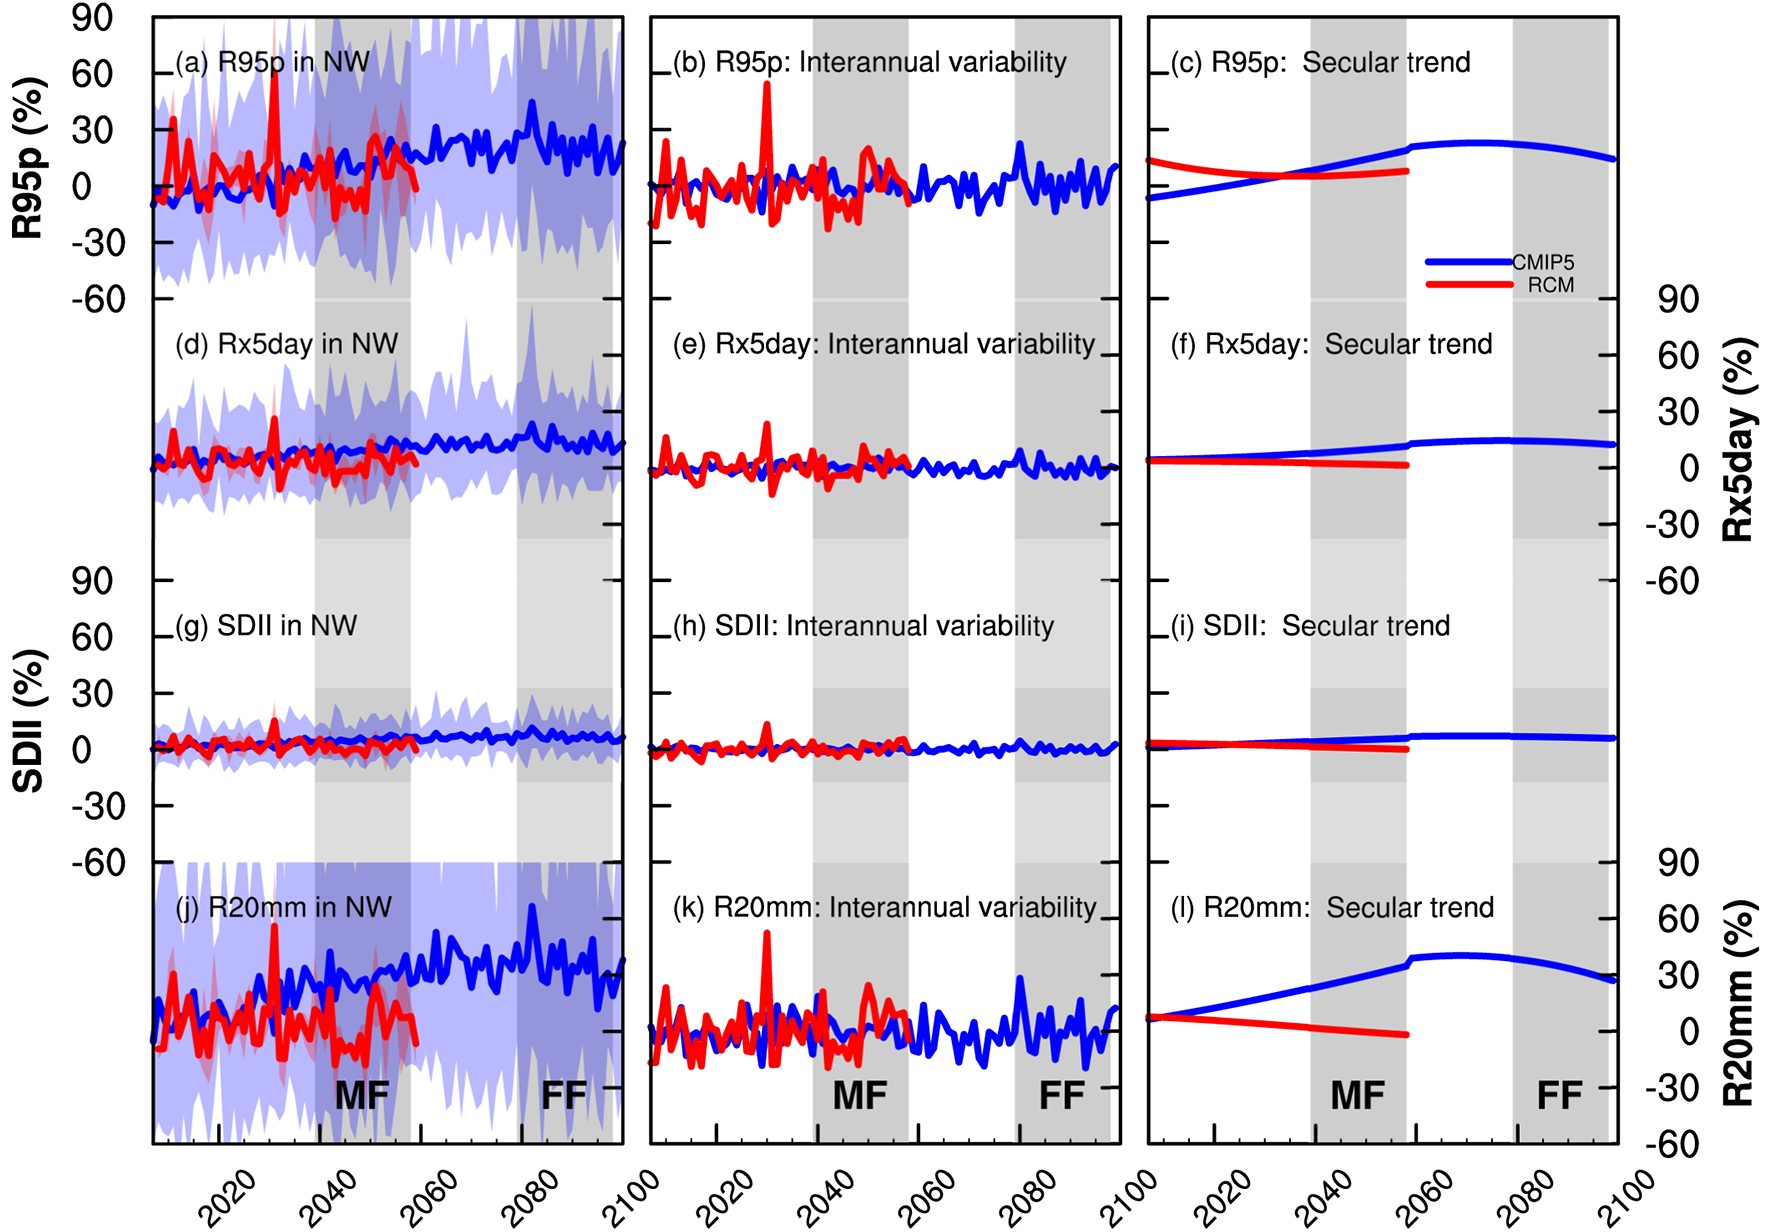
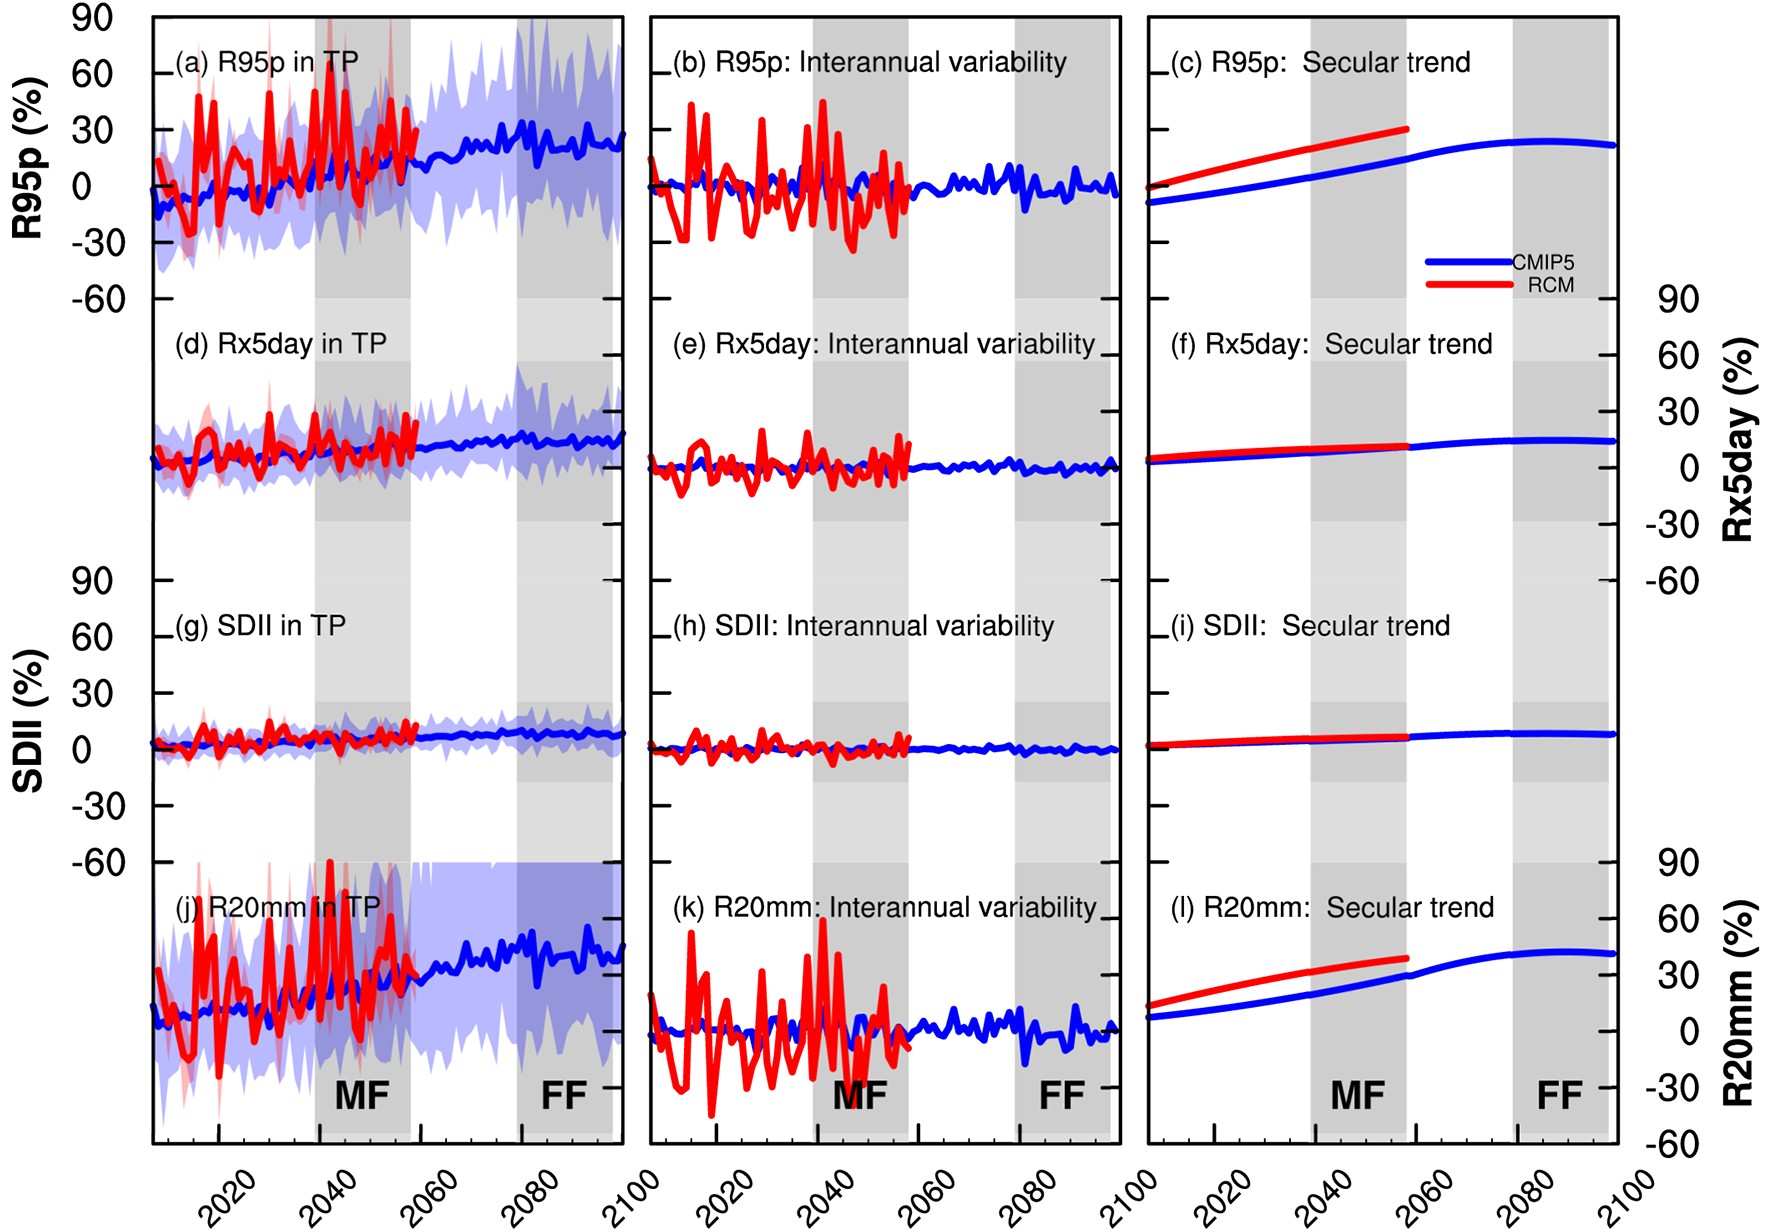
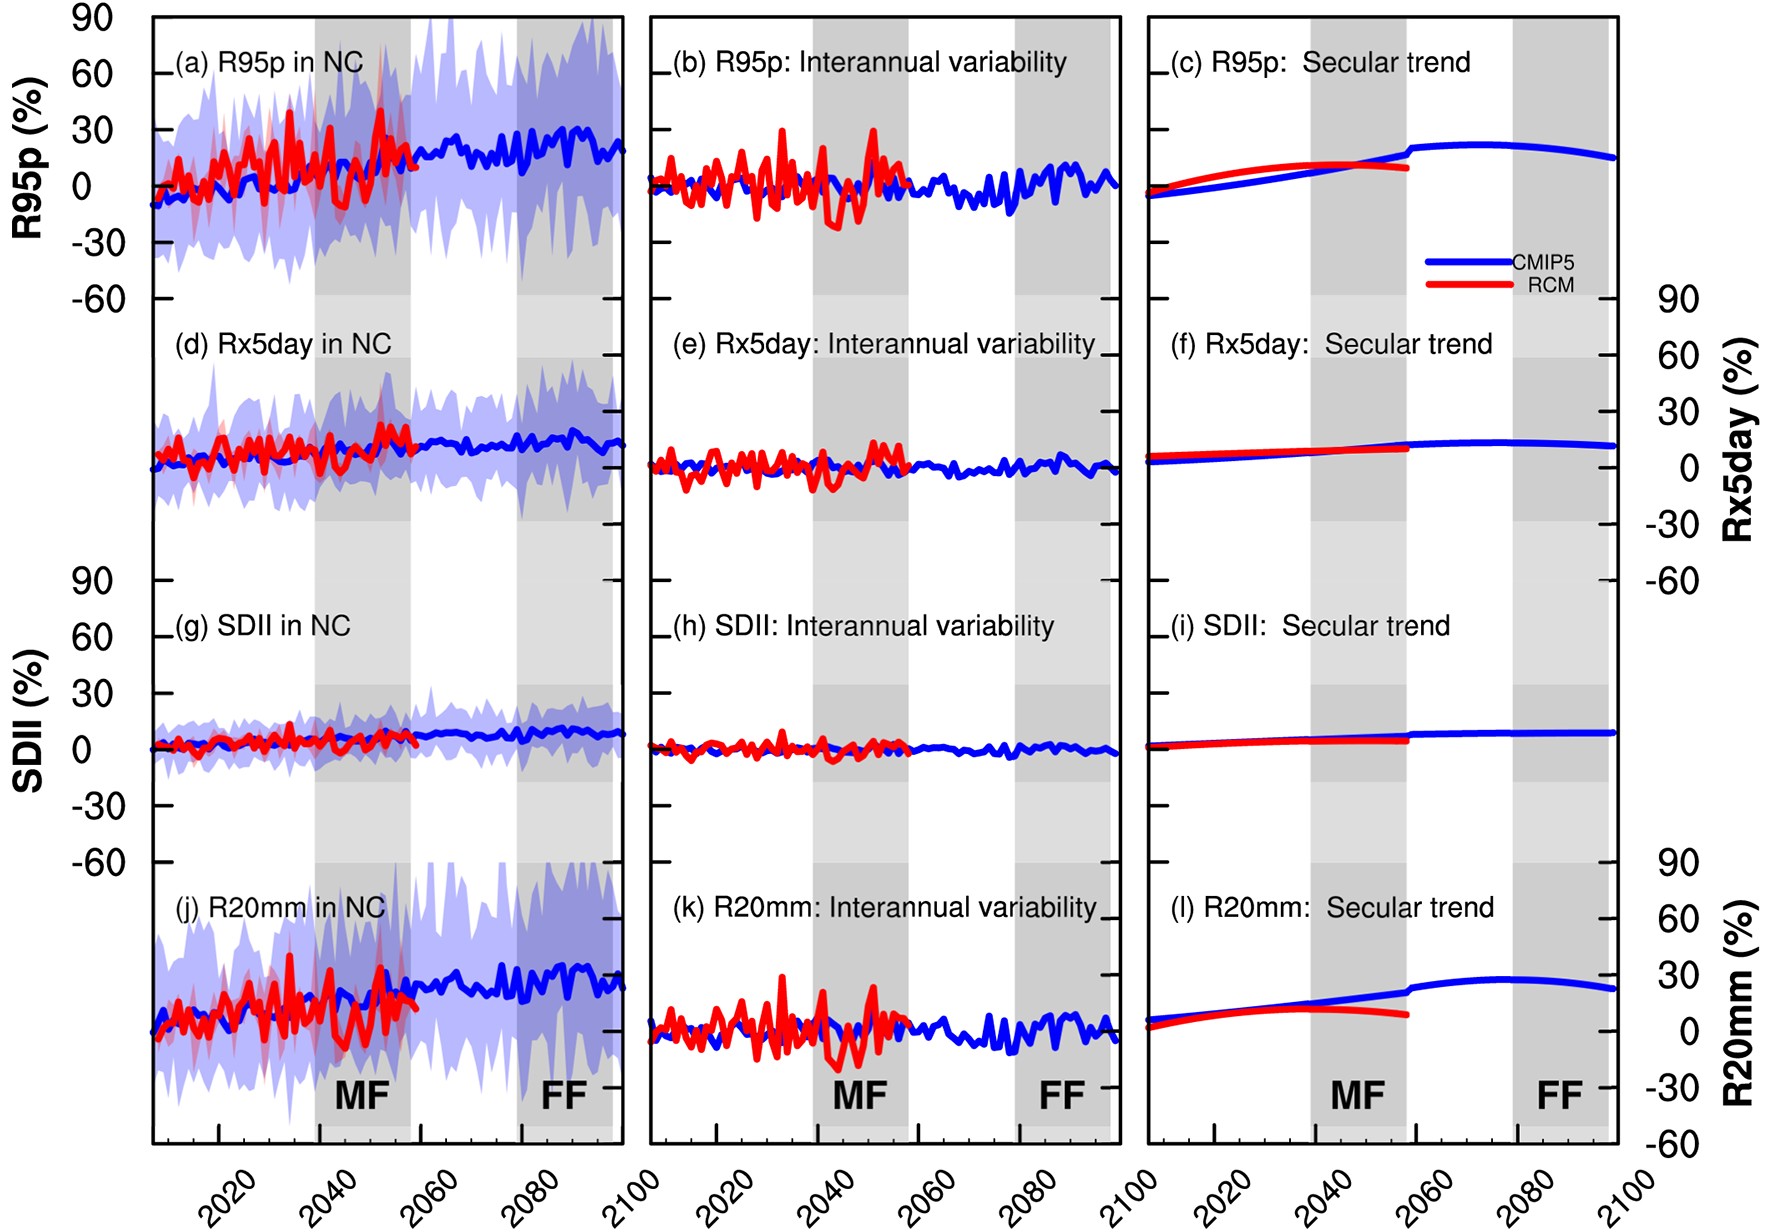
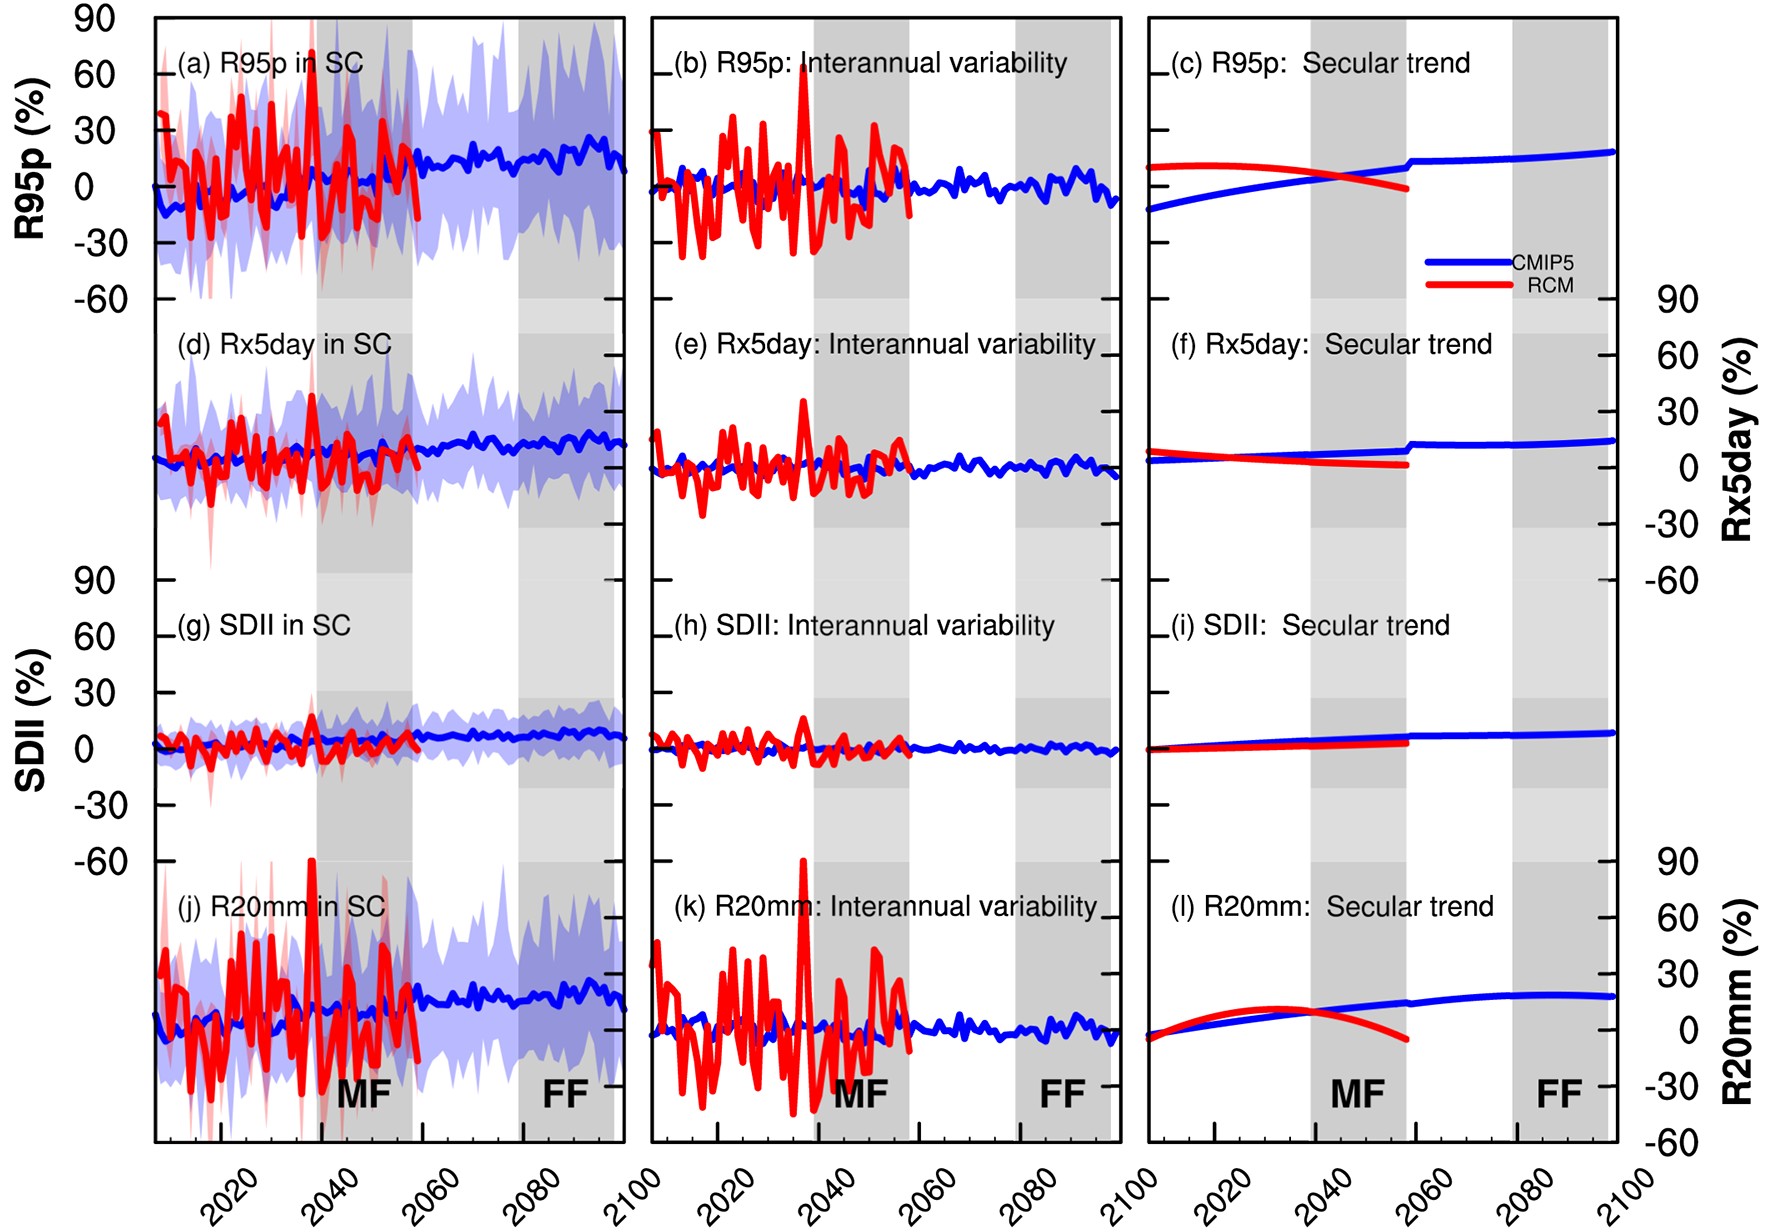
The EEMD method is applied to the time series of the precipitation extreme indices for each of the four subregions in order to predict the secular trends and interannual variability in the extreme indices in the future. The secular trends in the four extreme indices over the four subregions of China by the CMIP5 models are predicted to increase from 2008 to 2058 (Figs. 7–10), especially for very heavy precipitation (R95p) and the number of days with heavy precipitation (R20 mm), which show obvious increasing rates over the NW region (Figs. 7c and i), TP region (Figs. 8c and i), NC region (Figs. 9c and i), and SC region (Figs. 10c and i). Similar secular trends in the four studied extremes by the RCM runs are found over the TP region (Fig. 8) and NC region (Fig. 9). Slight decreasing trends in R95p and R20 mm by the RCM runs are found over the NW region (Fig. 7), which is an arid and semi-arid area, with R20 mm less than 2 days and R95p less than 20 mm (Fig. 2), and thus might bring large variation of relative changes in extremes. Over the TP region, which is a high altitude area, R95p and R20 mm are predicted to increase moderately from 2008 to 2058 by both the CMIP5 models and RCM runs. Similar results are also obtained for the secular trends in the precipitation extremes over the NC and SC regions (Figs. 9 and 10). Generally, precipitation extremes over the four subregions from 2008 to 2058 by the RCM runs show higher interannual variability relative to those by the CMIP5 models, which might be caused by the higher spatial and temporal resolution as well as more detailed biogeophysical description in the RCM (Qin and Xie, 2016). For the FF period from 2059 to 2098, the increasing or decreasing secular trends in the four extreme indices by the CMIP5 models are not more obvious than those for the MF period. In general, the precipitation extremes in China are predicted to increase for the MF and FF periods relative to the RF period, although the amplitudes of the rates of increase decrease somewhat from 2059 to 2098 in the NW and NC regions. Under global warming, larger quantities of atmospheric moisture arrive in China due to enhancing monsoon airflow (Li et al., 2019b). Qu et al. (2014) mentioned that increasing evaporation and water vapor under global warming have enhanced precipitation in East Asia. Thus, increases of heavy precipitation extremes might be mainly due to increases of water vapor and evaporation under global warming, since heavy precipitation extremes are highly correlated to mean precipitation (Qin and Xie, 2016).
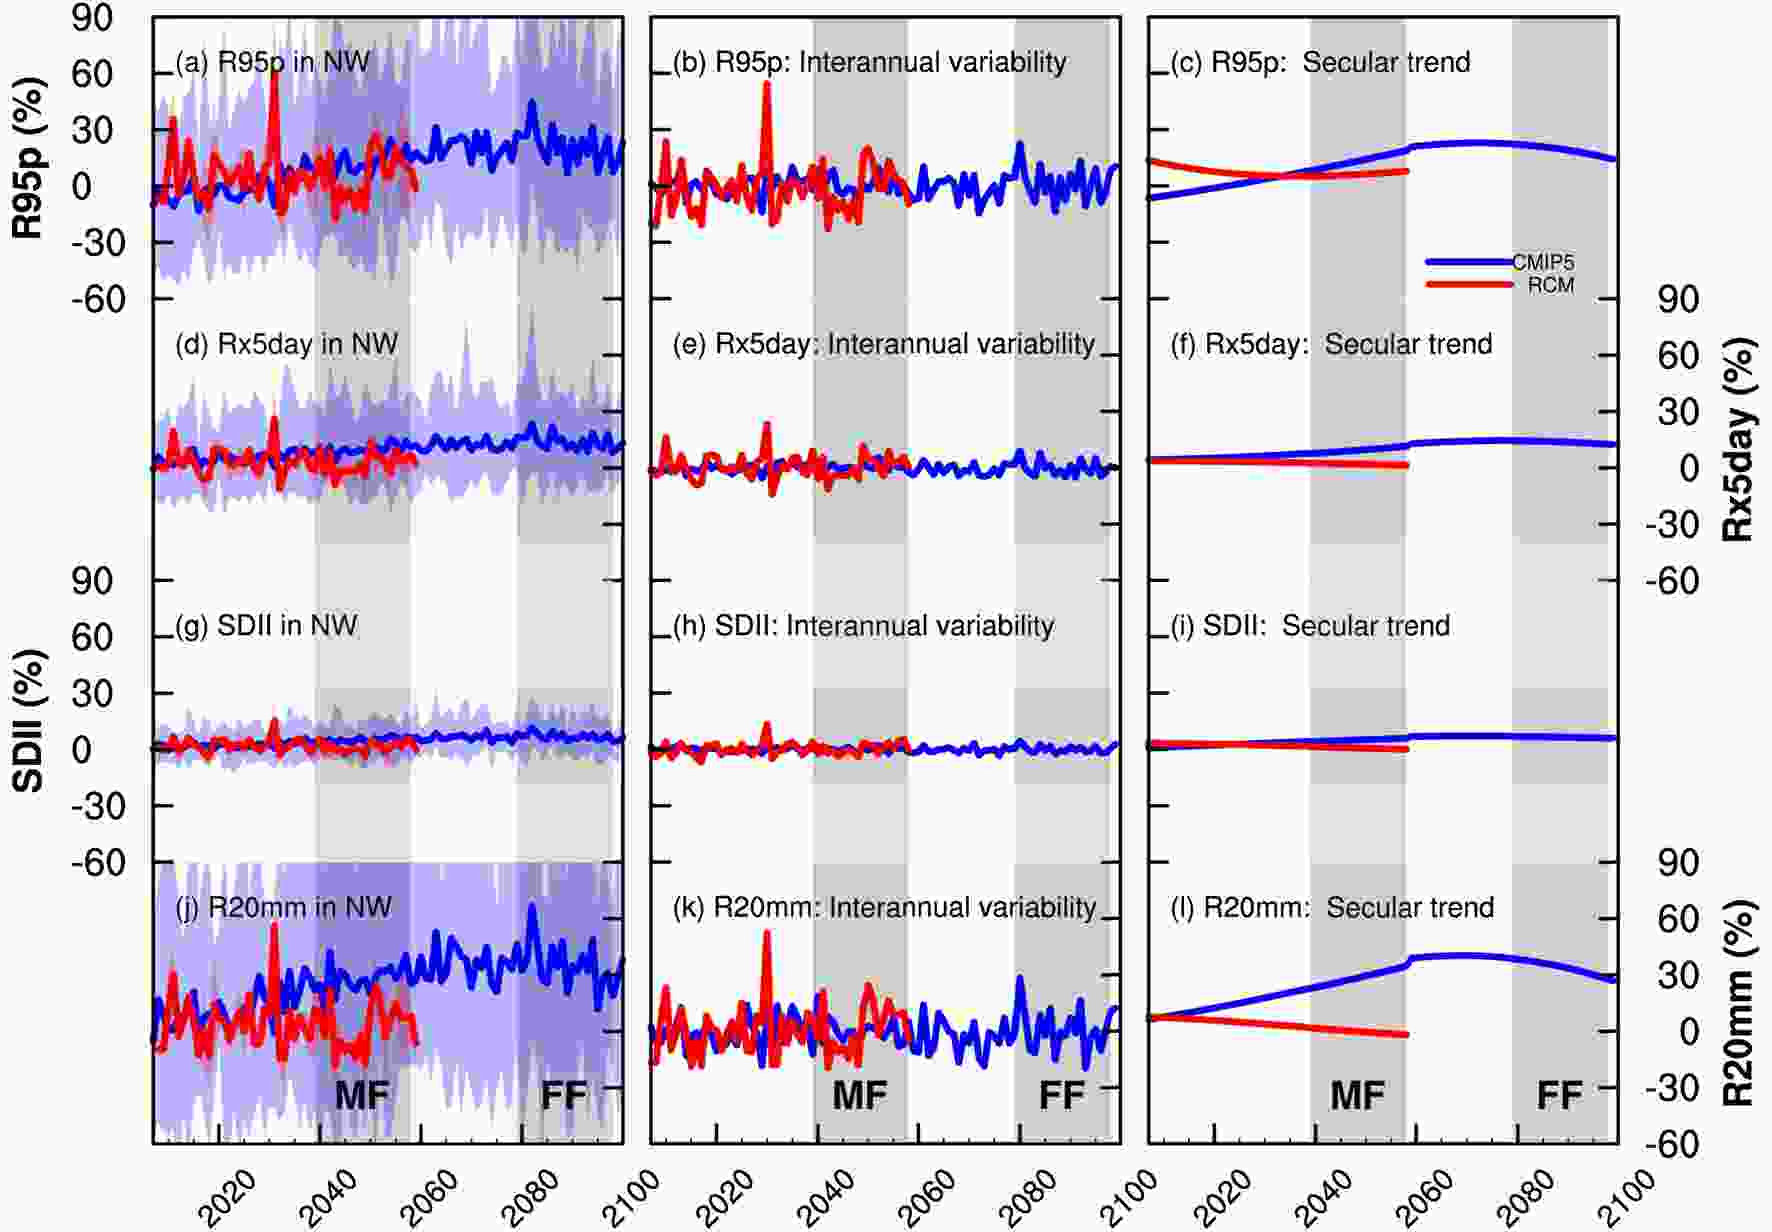
Figure 7. Time series of the changes in the precipitation extremes (R95p, Rx5day, SDII, and R20mm) over northwest China (NW) based on the CMIP5 ensemble mean and RCM ensemble mean compared with the current period (RF, 1982–2001) mean. Panels (b), (e), (h) and (k) show the interannual variability in the extreme indices, defined as the sum of all the IMFs obtained from EEMD. Panels (c), (f), (i) and (l) show the secular trends in extremes, defined as the residual obtained from EEMD. The shaded colors are the ranges of precipitation extremes simulated by the CMIP5 models and RCM runs.
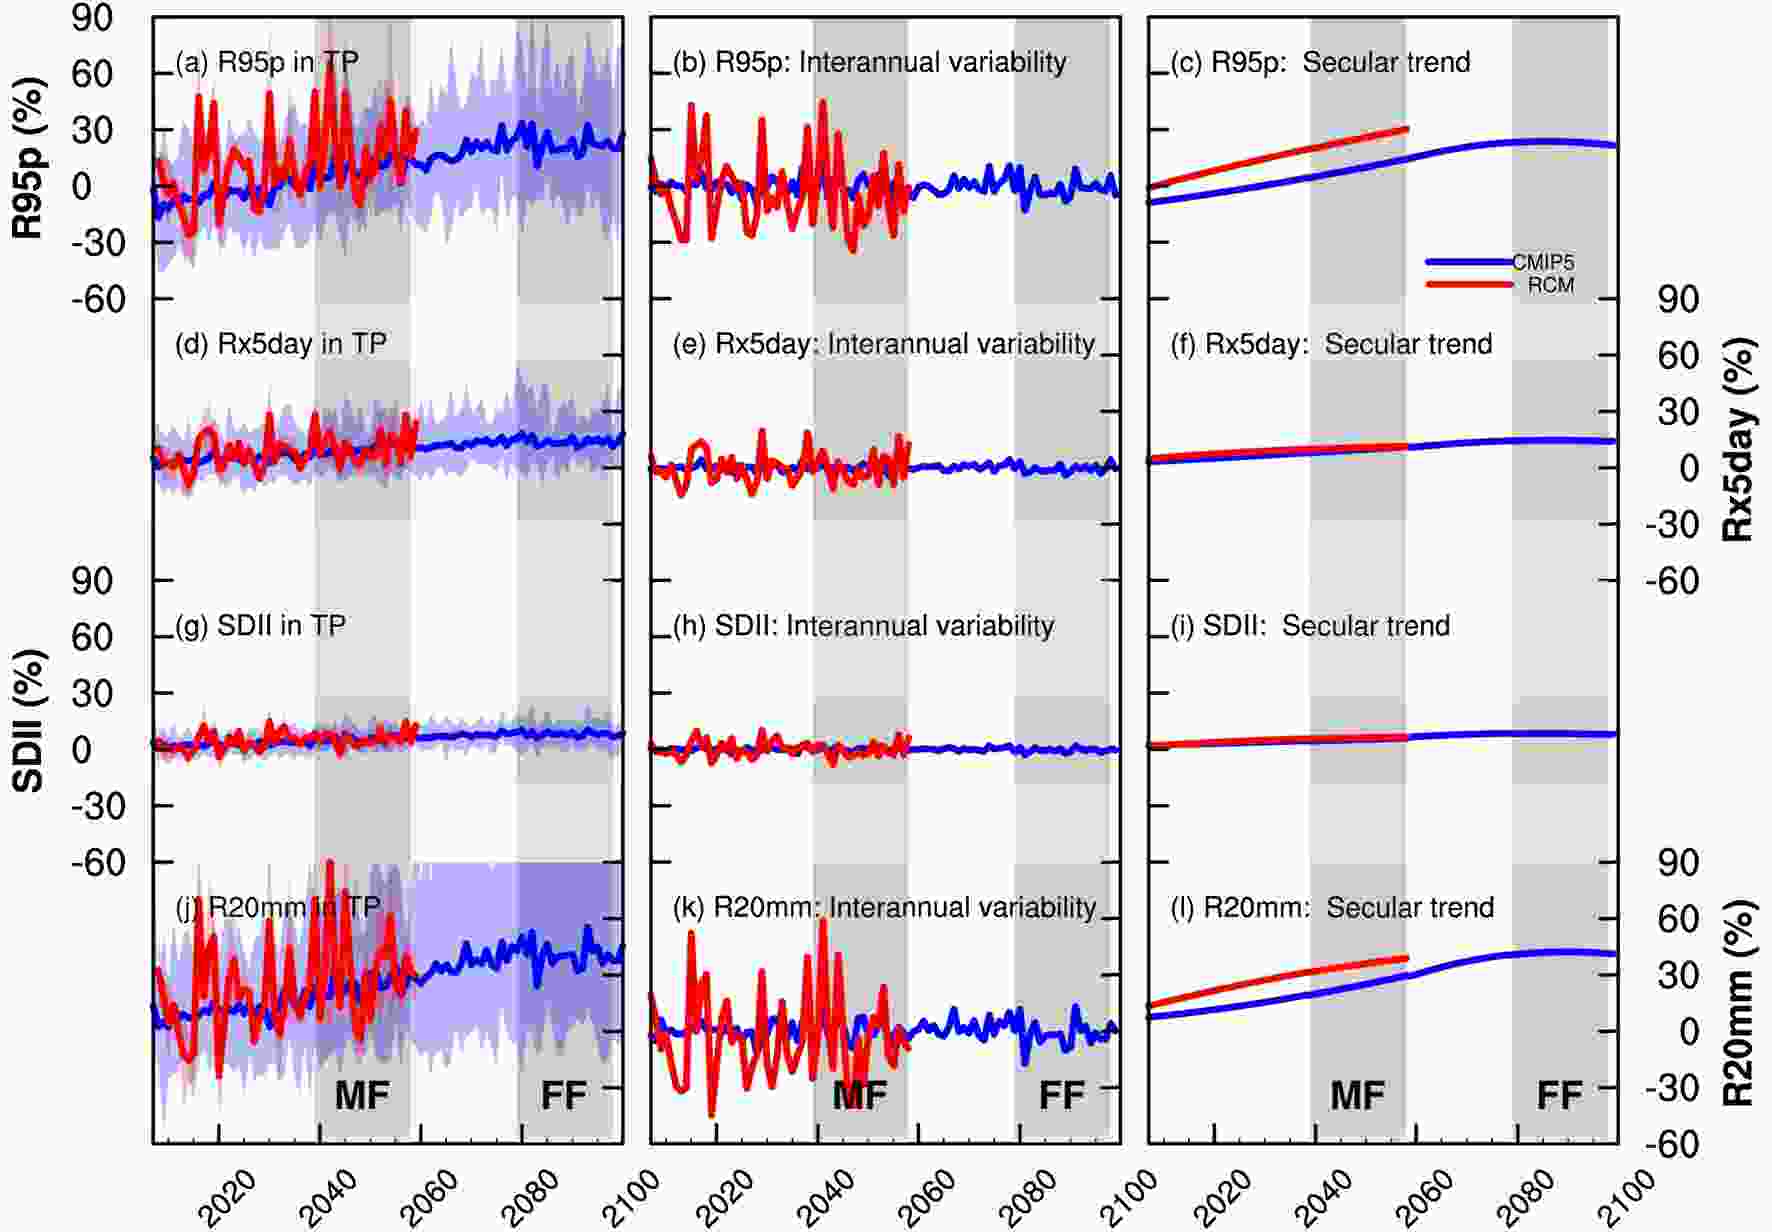
Figure 8. As in Fig. 7 but for changes in the precipitation extremes over the TP.
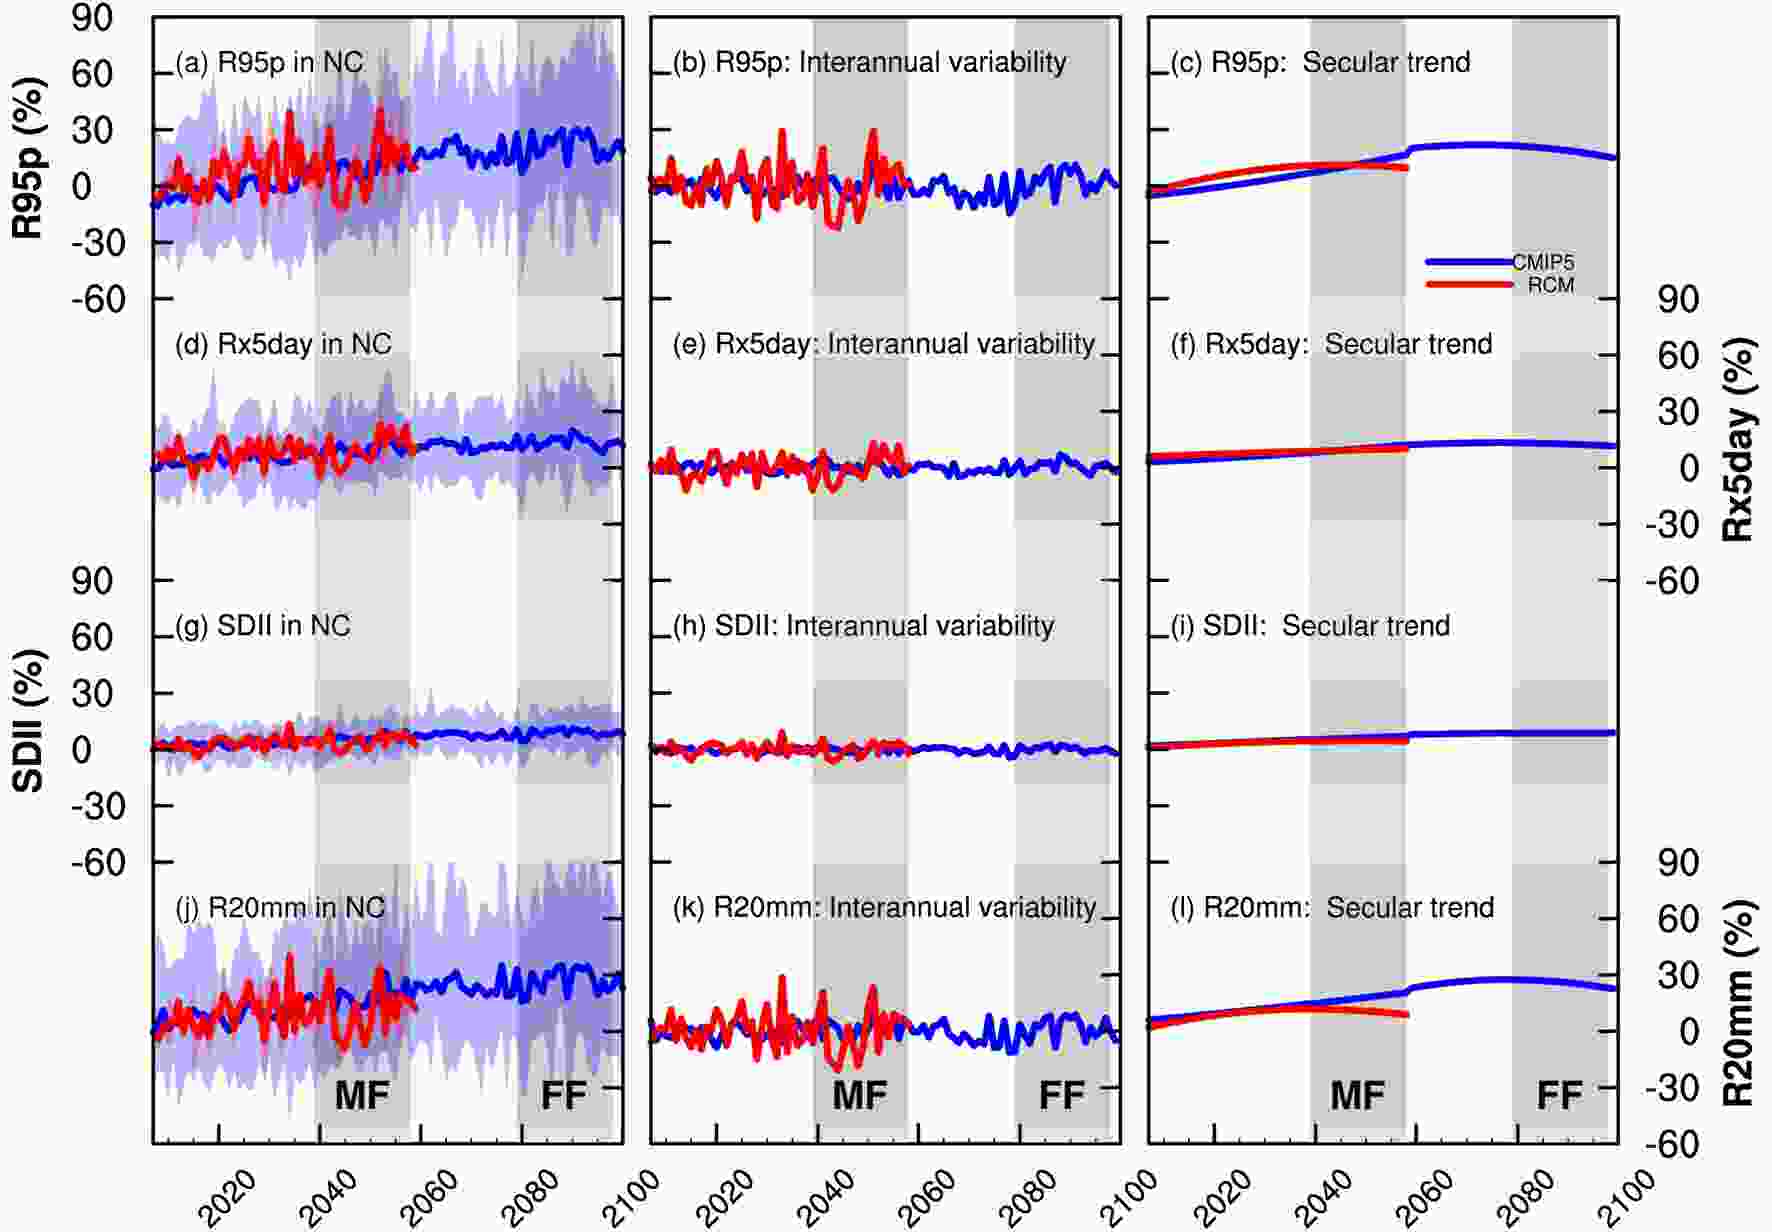
Figure 9. As in Fig. 7 but for changes in the precipitation extremes over the NC region.
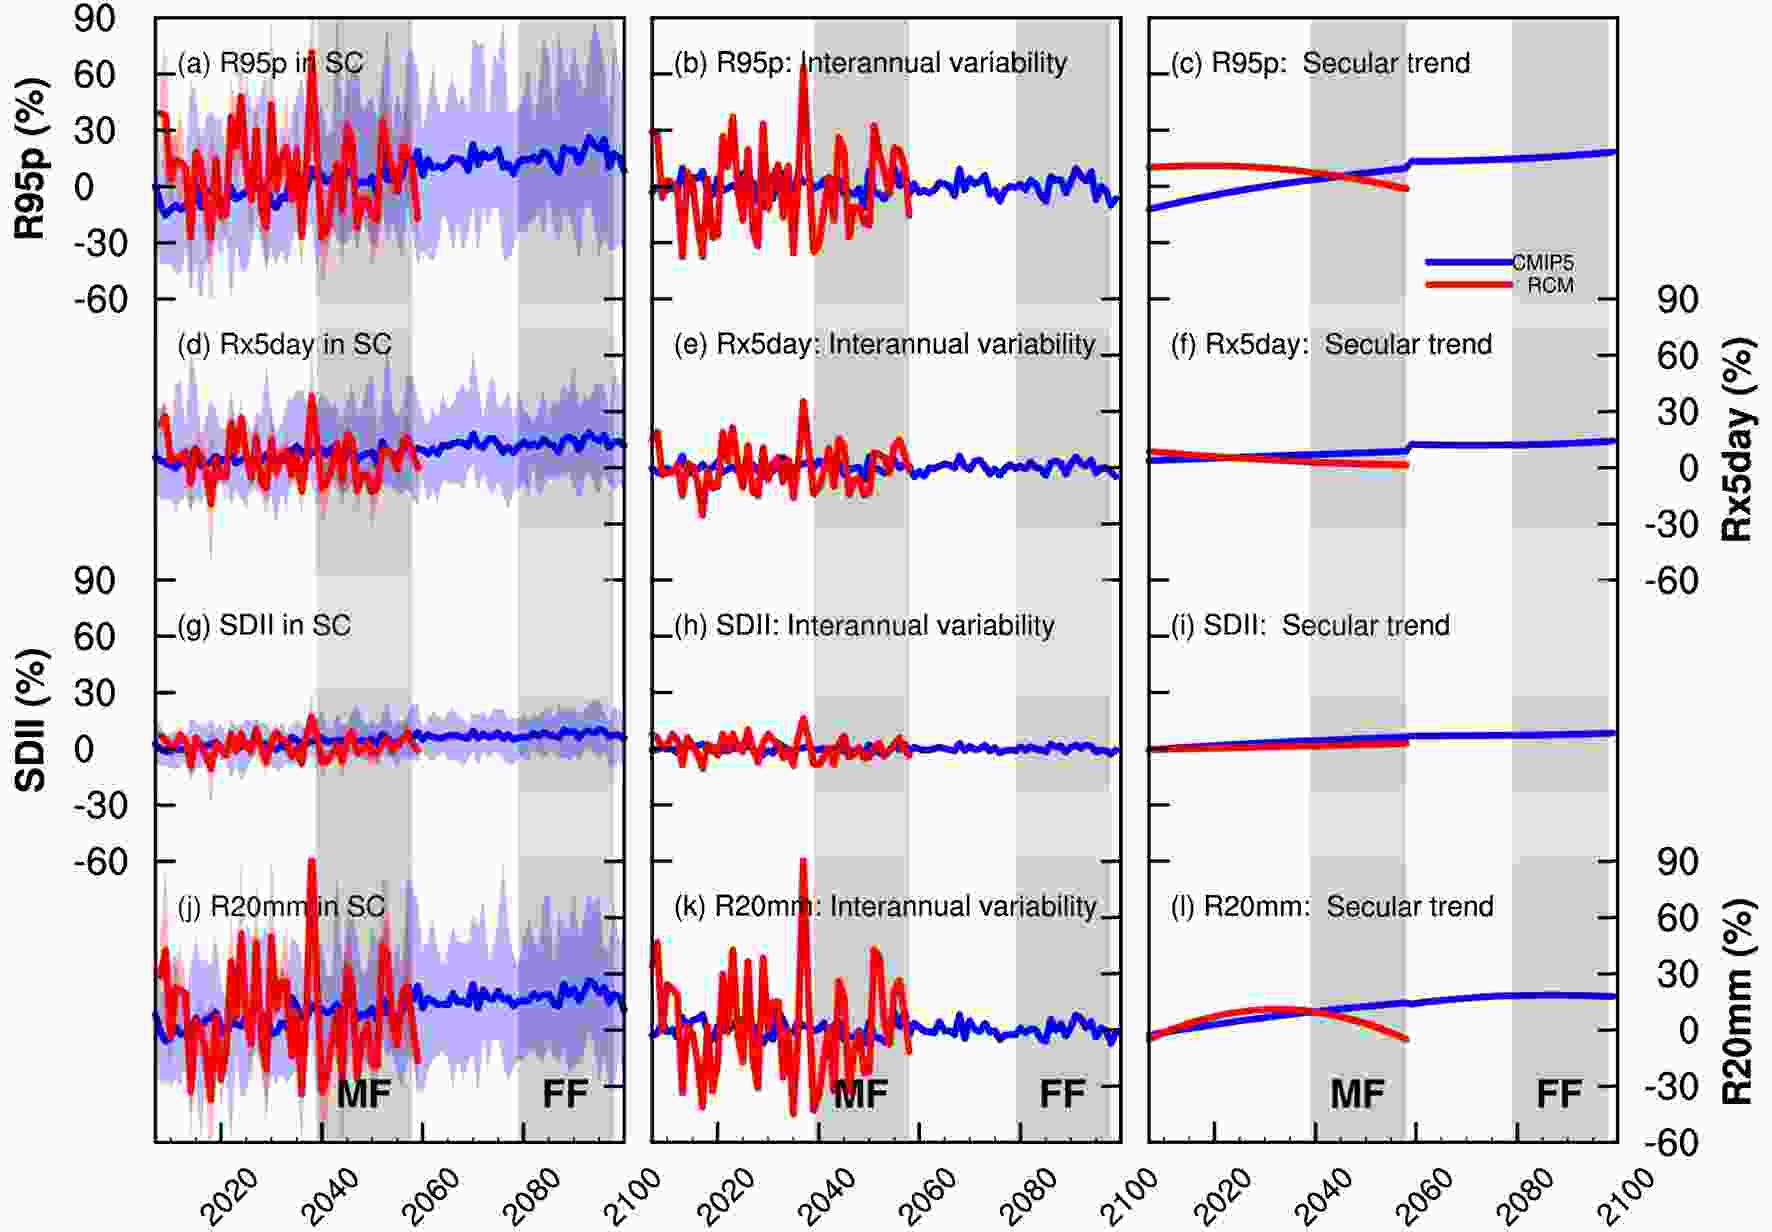
Figure 10. As in Fig. 7 but for changes in the precipitation extremes over the SC region.
-
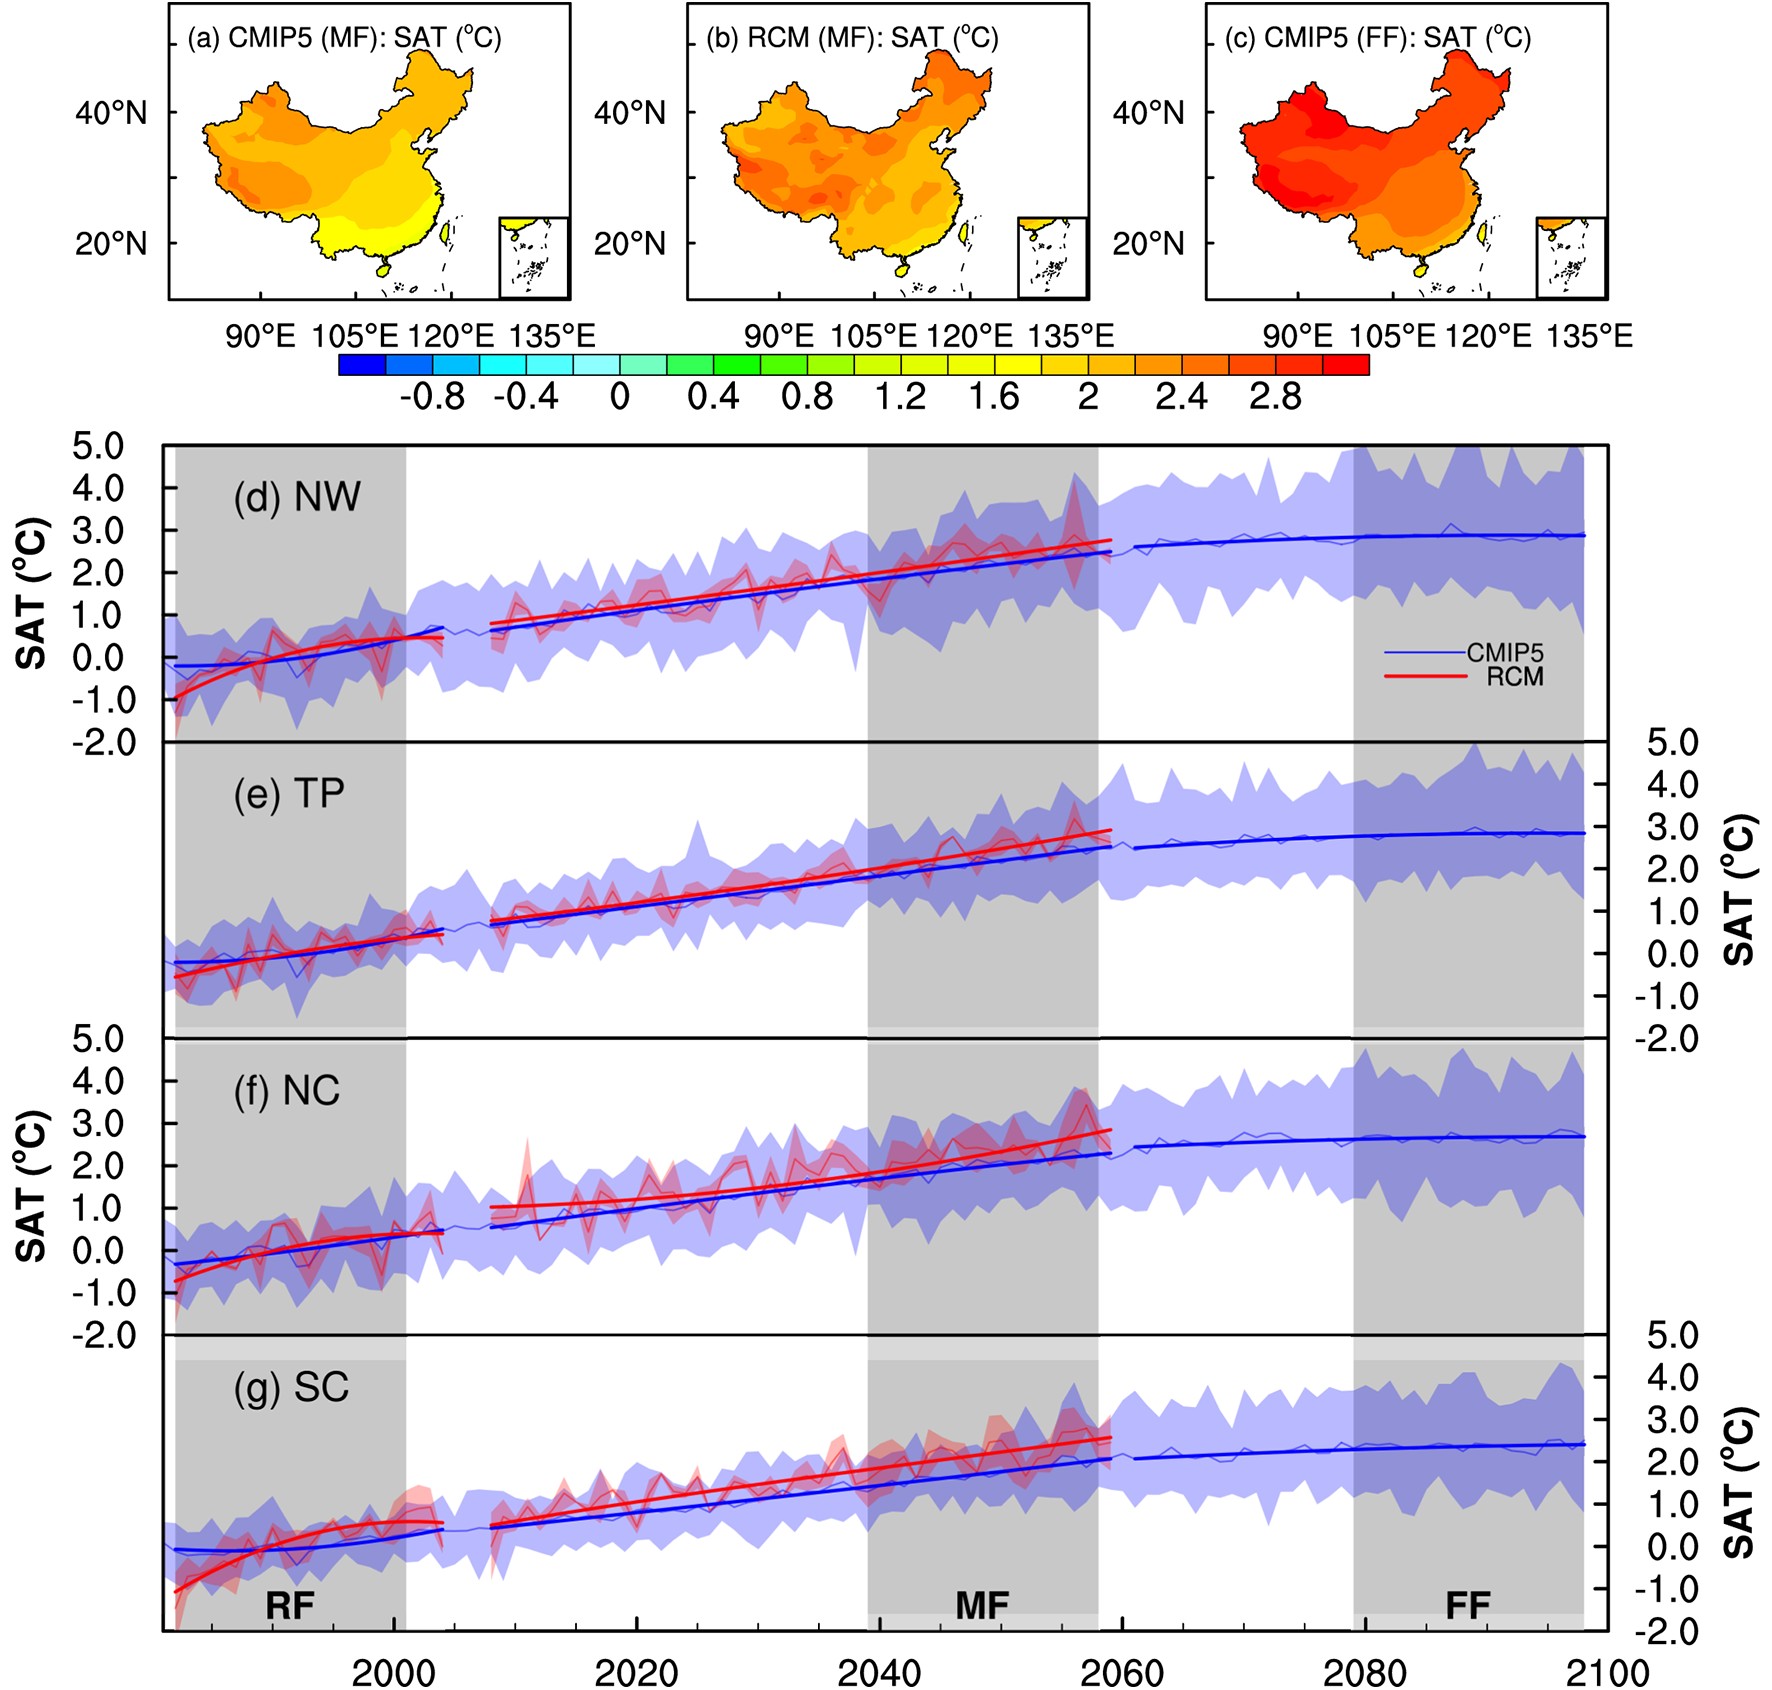
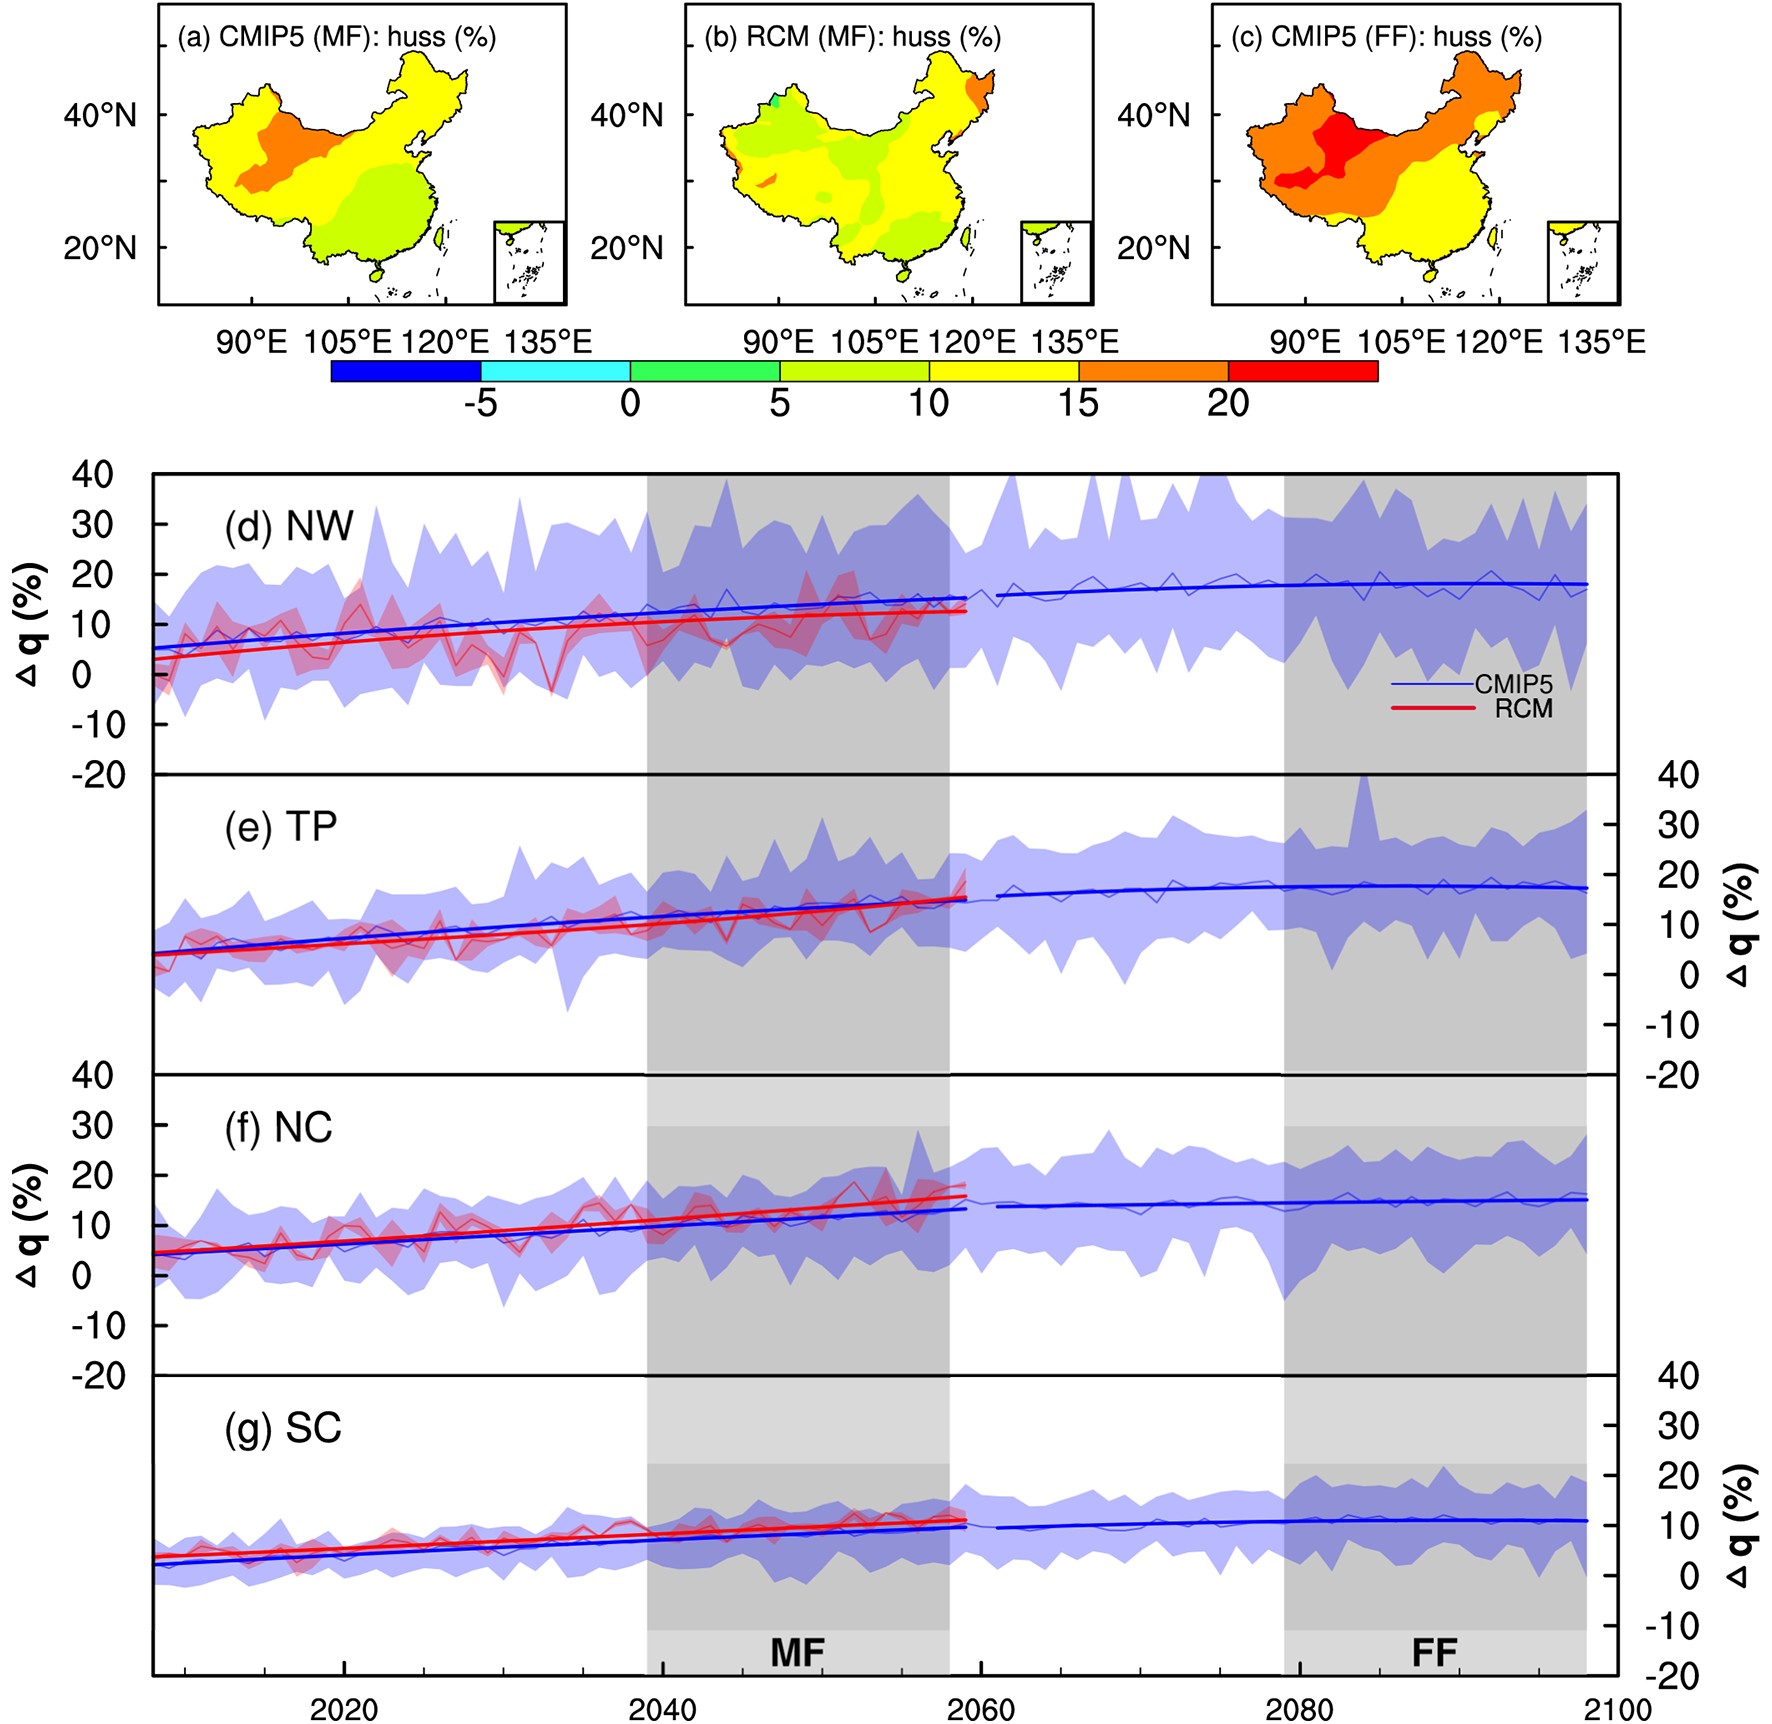
With a warming climate, the atmospheric water holding capacity will increase with temperature at a rate of around 7%°C−1, according to CC scaling (Trenberth et al., 2003), which will affect the occurrence and intensity of precipitation. Thus, we attempt to quantify the rates of change in the precipitation extremes in the MF and FF period with the changes in SAT. Figure 11 shows the changes in the spatial pattern and time series for annual SAT in the MF and FF periods compared with the RF period based on the CMIP5 ensemble mean and RCM ensemble mean. During the MF and FF periods, SAT is predicted to increase in the whole of China, where in the FF period the increase exceeds 2°C, which is more than that in the MF period (Figs. 11a–c). From 2008 to 2059, the secular trends in SAT are predicted to increase in the NW, TP, NC, and SC regions by the CMIP5 model ensemble, where the amplitude varies from 0.5°C to 3°C. From 2060 to 2098, the secular trends in the changes in SAT are also predicted to increase compared with the RF period, but the slopes are lower compared with those from 2008 to 2058. The SAT based on the RCM ensemble mean during the MF period is predicted to increase by 2.30°C in NW, 2.41°C in TP, 2.29°C in NC, and 2.10°C in SC. The changes in the CMIP5 ensemble mean temperature simulated during the MF period vary from 1.78°C to 2.19°C in the four regions, and those in the FF period vary from 2.38°C to 2.87°C (Table 4).
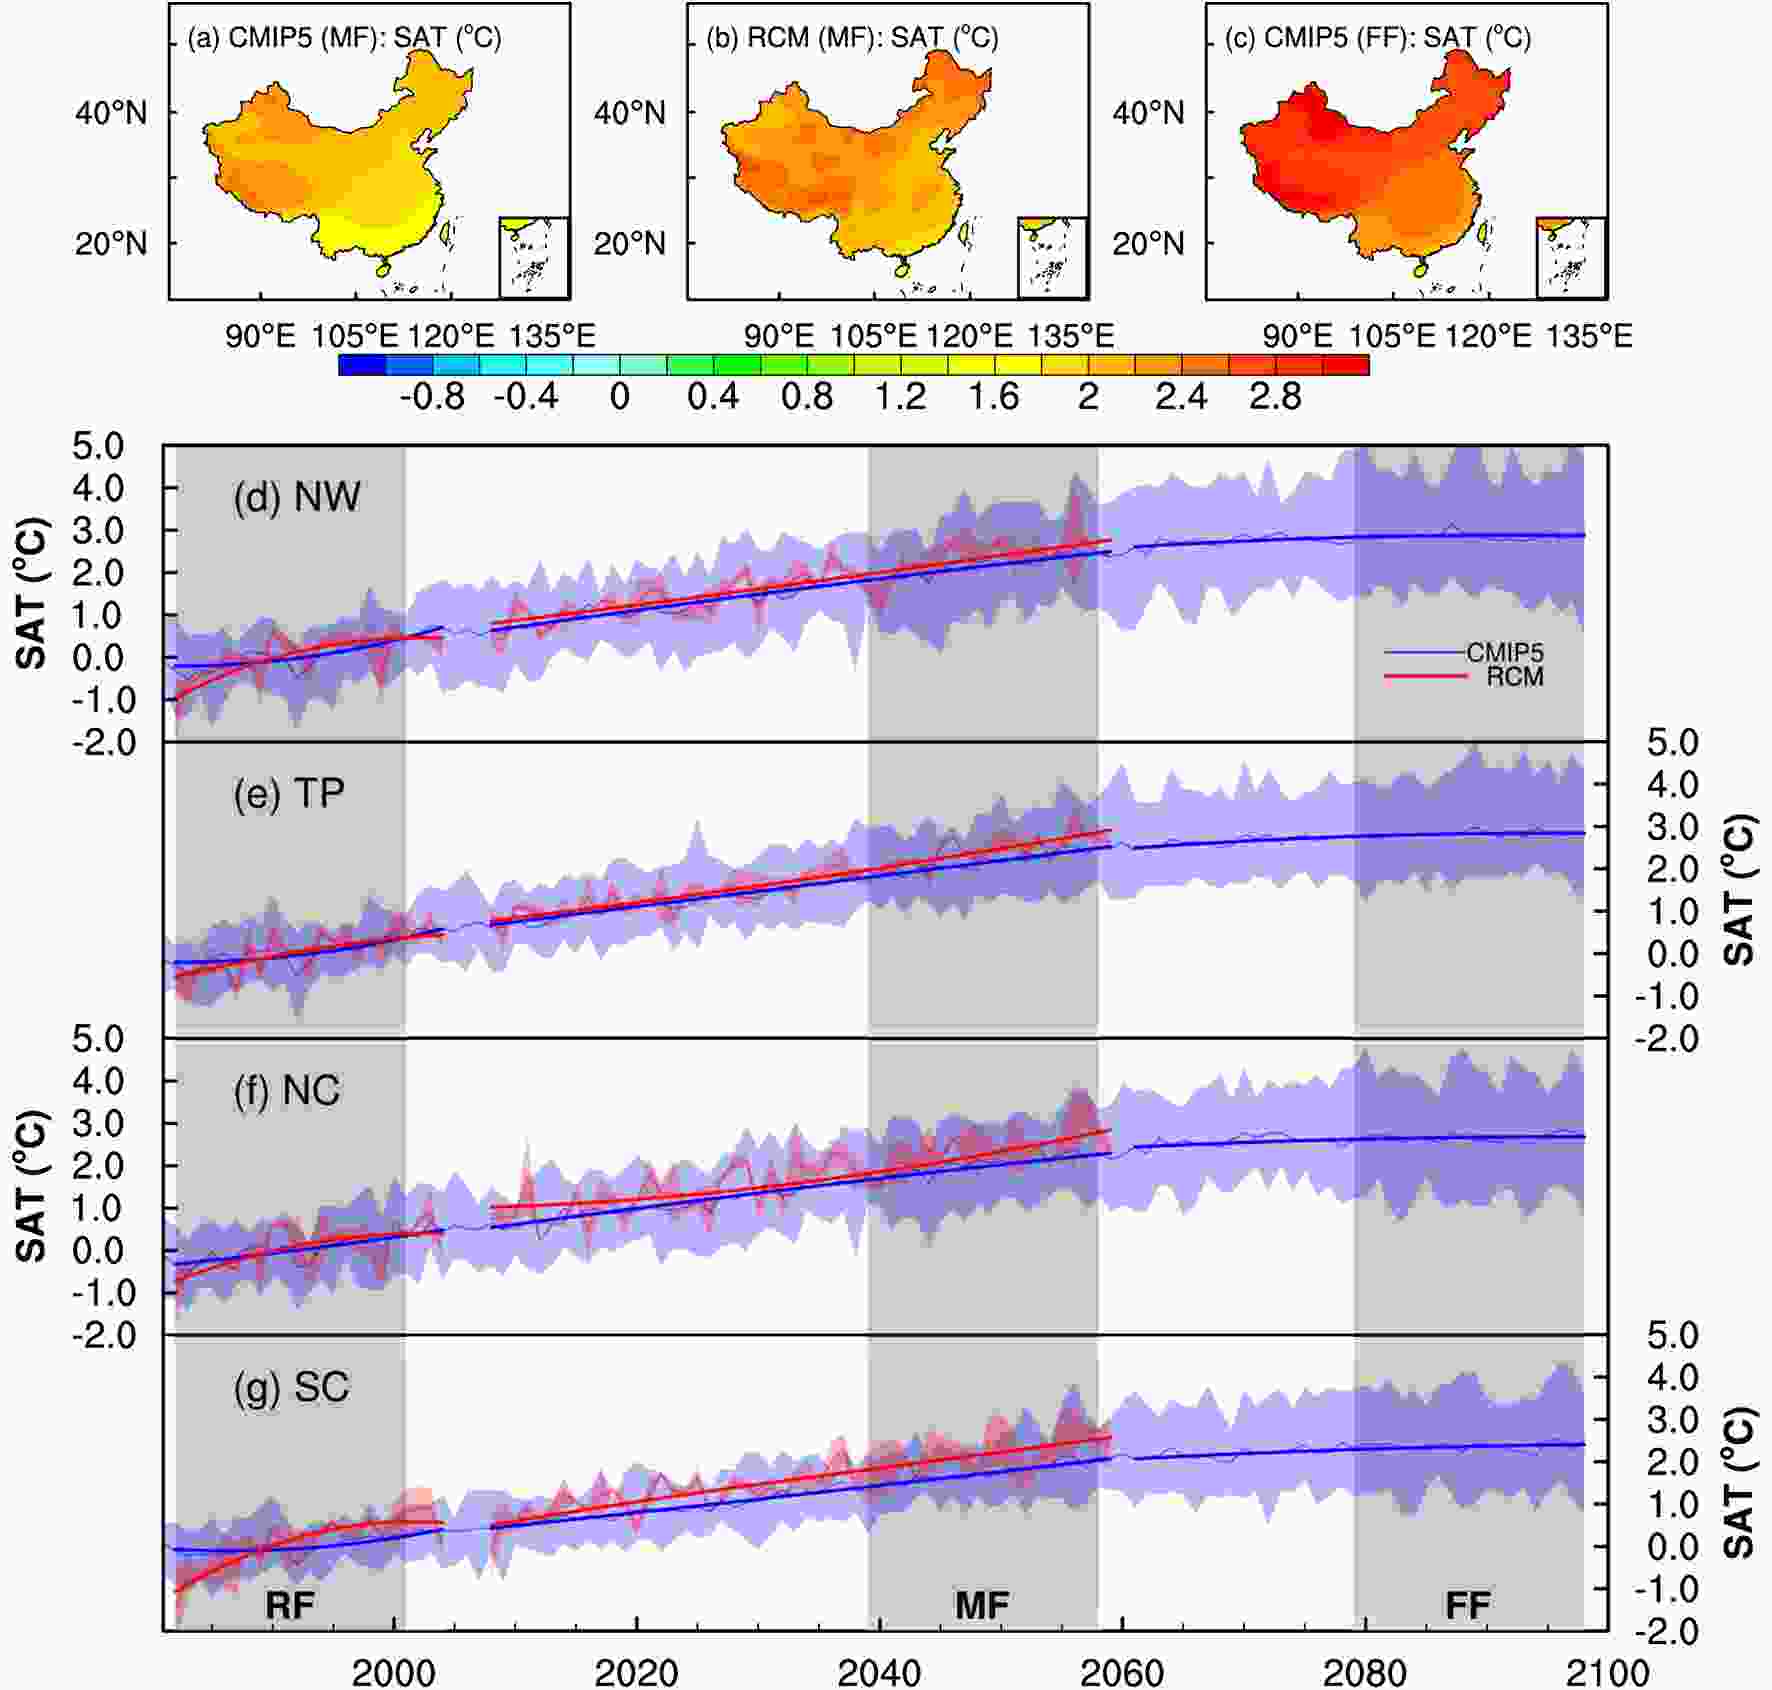
Figure 11. Spatial pattern (a–c) and time series (d–g) of the changes in the annual SAT in the mid-future period (MF: 2039–58) and far-future period (FF: 2079–98) compared with the current period (RF) based on the CMIP5 ensemble mean and RCM ensemble mean. The solid curves are the secular trends in SAT, defined as the residual obtained from EEMD. The shaded colors are the ranges of precipitation extremes simulated by the CMIP5 models and RCM runs.
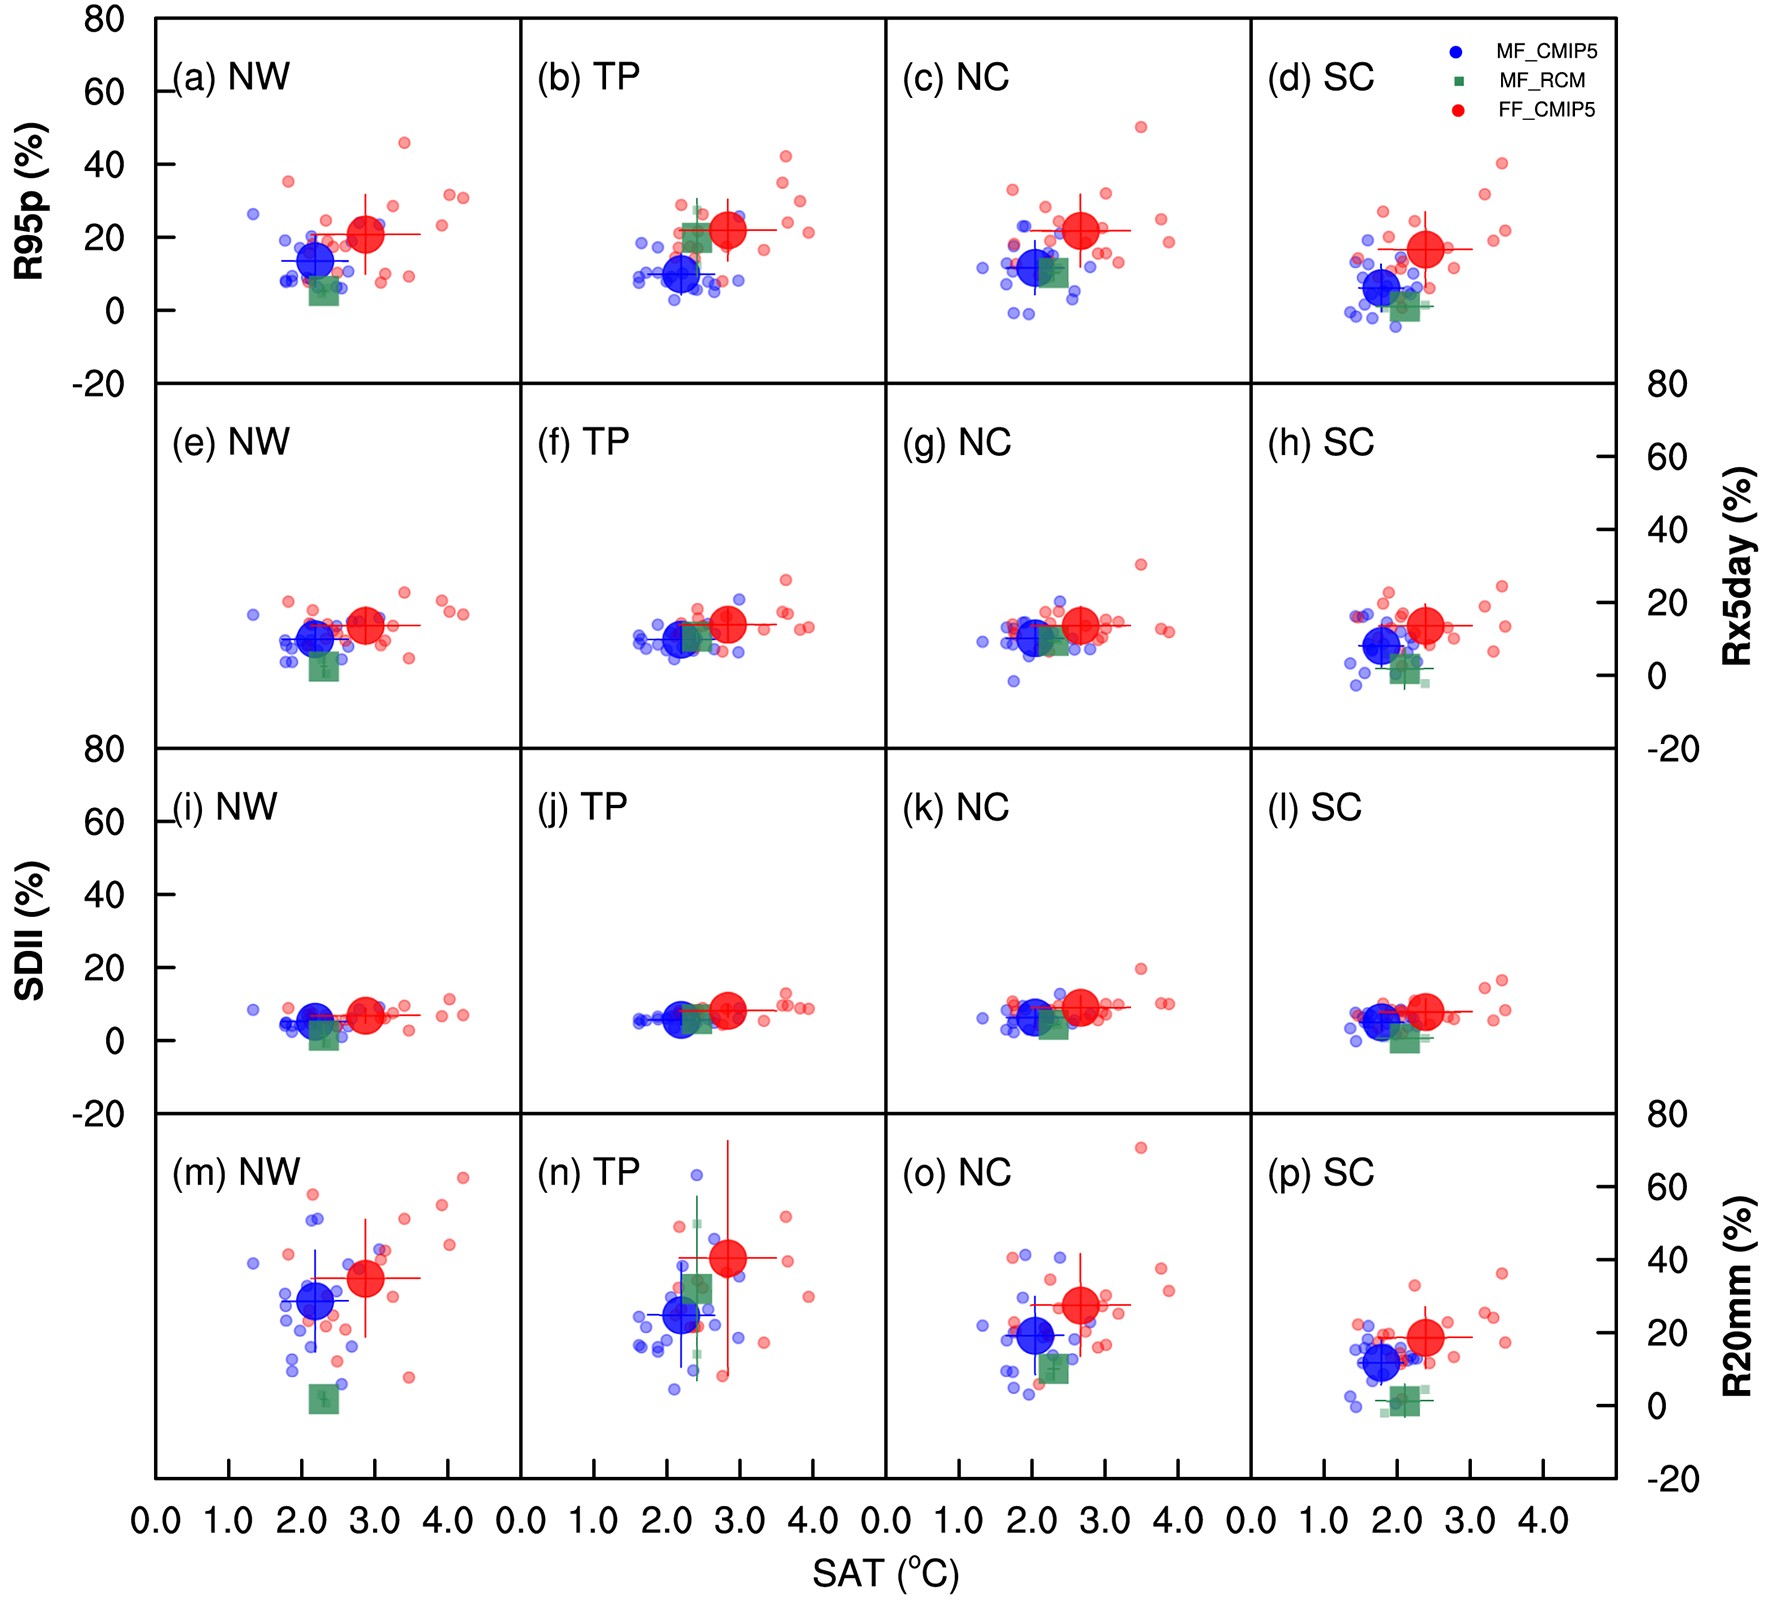
After the overall future changes in SAT in China compared with the RF period, we present the rates of changes in future precipitation extremes in the subregions of China with the changes in SAT. As the CMIP5 ensemble mean temperature increases in the MF and FF periods, all of the precipitation extremes used in this study also increase in all four regions of China, where the amplitudes of the increases in the FF period are greater than those in the MF period, in a similar manner to the temperature in these regions (Fig. 12 and Table 4). In the NW arid and semiarid area, the rate of change in R20mm with the changes in SAT during the MF period is 13.17%°C−1 based on CMIP5, but reduces to 12.15%°C−1 during the FF period. In the TP region with high altitude, the changes in R20mm are predicted to increase with SAT from 11.34%°C−1 during the MF period to 14.28%°C−1 during the FF period, which means more heavy precipitation might happen at the end of 21st century. Due to the complex land cover and landscapes of the TP, the impacts of global warming are more complicated by inducing permafrost thawing, glacial melt, increasing lake levels and river discharge, and so on (Lei et al., 2019; Gu et al., 2020). The coarse resolutions of the CMIP5 models in describing complex topography and land surfaces might cause a larger intermodel spread of precipitation extremes and SAT over the TP than those over the other subregions (Figs. 12m–p). During the MF period, the TP is the only region where changes in R20mm by the RCM runs are larger than those by the CMIP5 models, which might be due to the high resolution and detailed physical processes of the RCM enabling better capture of the complex landscapes and processes during global warming (Gu et al., 2020). Changes in R20mm over the NC and SC regions are also found to increase with SAT but at a lower rate. The rates of increase in R95p with SAT during the MF period range from 3.45%°C−1 in the SC region to 6.21%°C−1 in the NW region, and during the FF period range from 6.99%°C−1 in the SC region to 8.19%°C−1 in the NC region. The increases in the rates of the four extreme indices with SAT during the MF period based on the RCM ensemble mean have lower magnitudes in all four subregions compared with those based on the CMIP5 ensemble mean, except for the rates of R95p and R20mm with temperature over the TP. The increases in the rates of R95p with SAT during the FF period have larger amplitudes compared with those in the MF period, and thus the heavy precipitation (R95p) will be strengthened in the far future, which is consistent with previous findings that the probabilities of R95p occurrence at the end of 21st century increase with global warming, and more so with higher emission scenarios (Chen et al., 2020). During the MF and FF periods, the increases in the rates of Rx5day and SDII with SAT have similar magnitudes (around 5%°C−1 and 3%°C−1, respectively) in the four regions, and thus short-term heavy rainfall might not be sensitive to the SAT, as previously mentioned (Wang et al., 2017b). Compared with other monsoon regions, precipitation extremes in the East Asian monsoon region present greater sensitivity to global warming (Zhang et al., 2018). Under global warming, more atmospheric water is expected because of the increasing holding capacity of atmospheric moisture according to the CC relationship. On the other hand, global warming strengthens the land–sea thermal contrast and then enhances the southward wind over the SC region, which will bring more atmospheric moisture again through large-scale atmospheric circulation (Li et al., 2019b). Increased evapotranspiration due to global warming further enhances atmospheric moisture (Fig. 13), which might affect extreme precipitation.
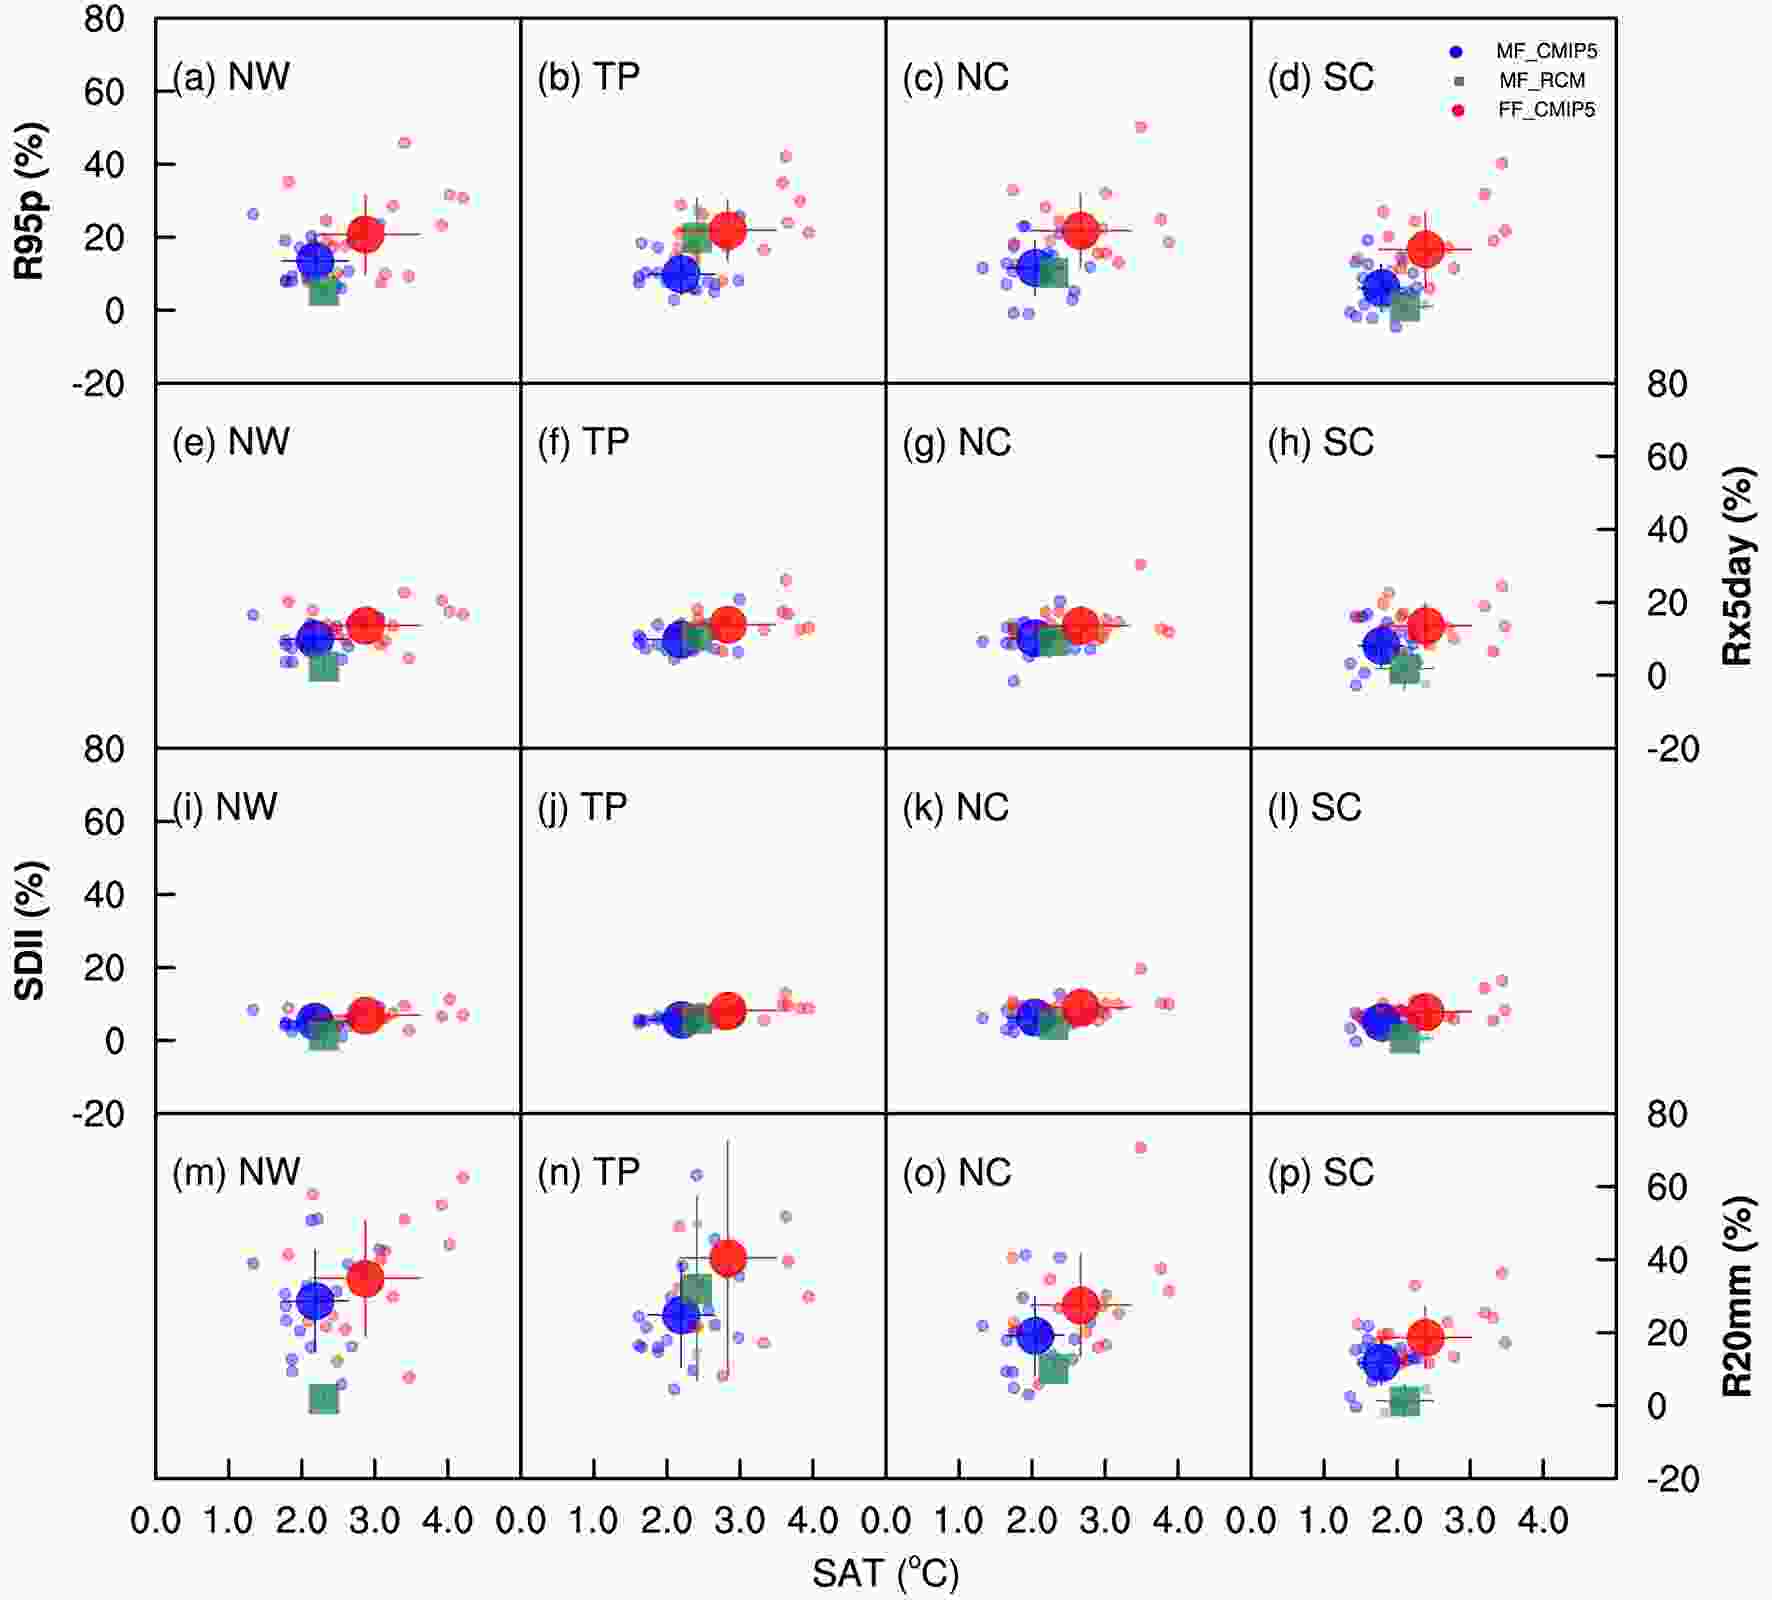
Figure 12. Scatterplots of changes in the precipitation extremes and SAT over the four regions in China during the mid-future period (2039–58) and far-future period (2079–98) compared with the current period. The small dots are the results obtained by each CMIP5 model and RCM run, and the thin lines are the standard deviations of the precipitation extremes and SAT.
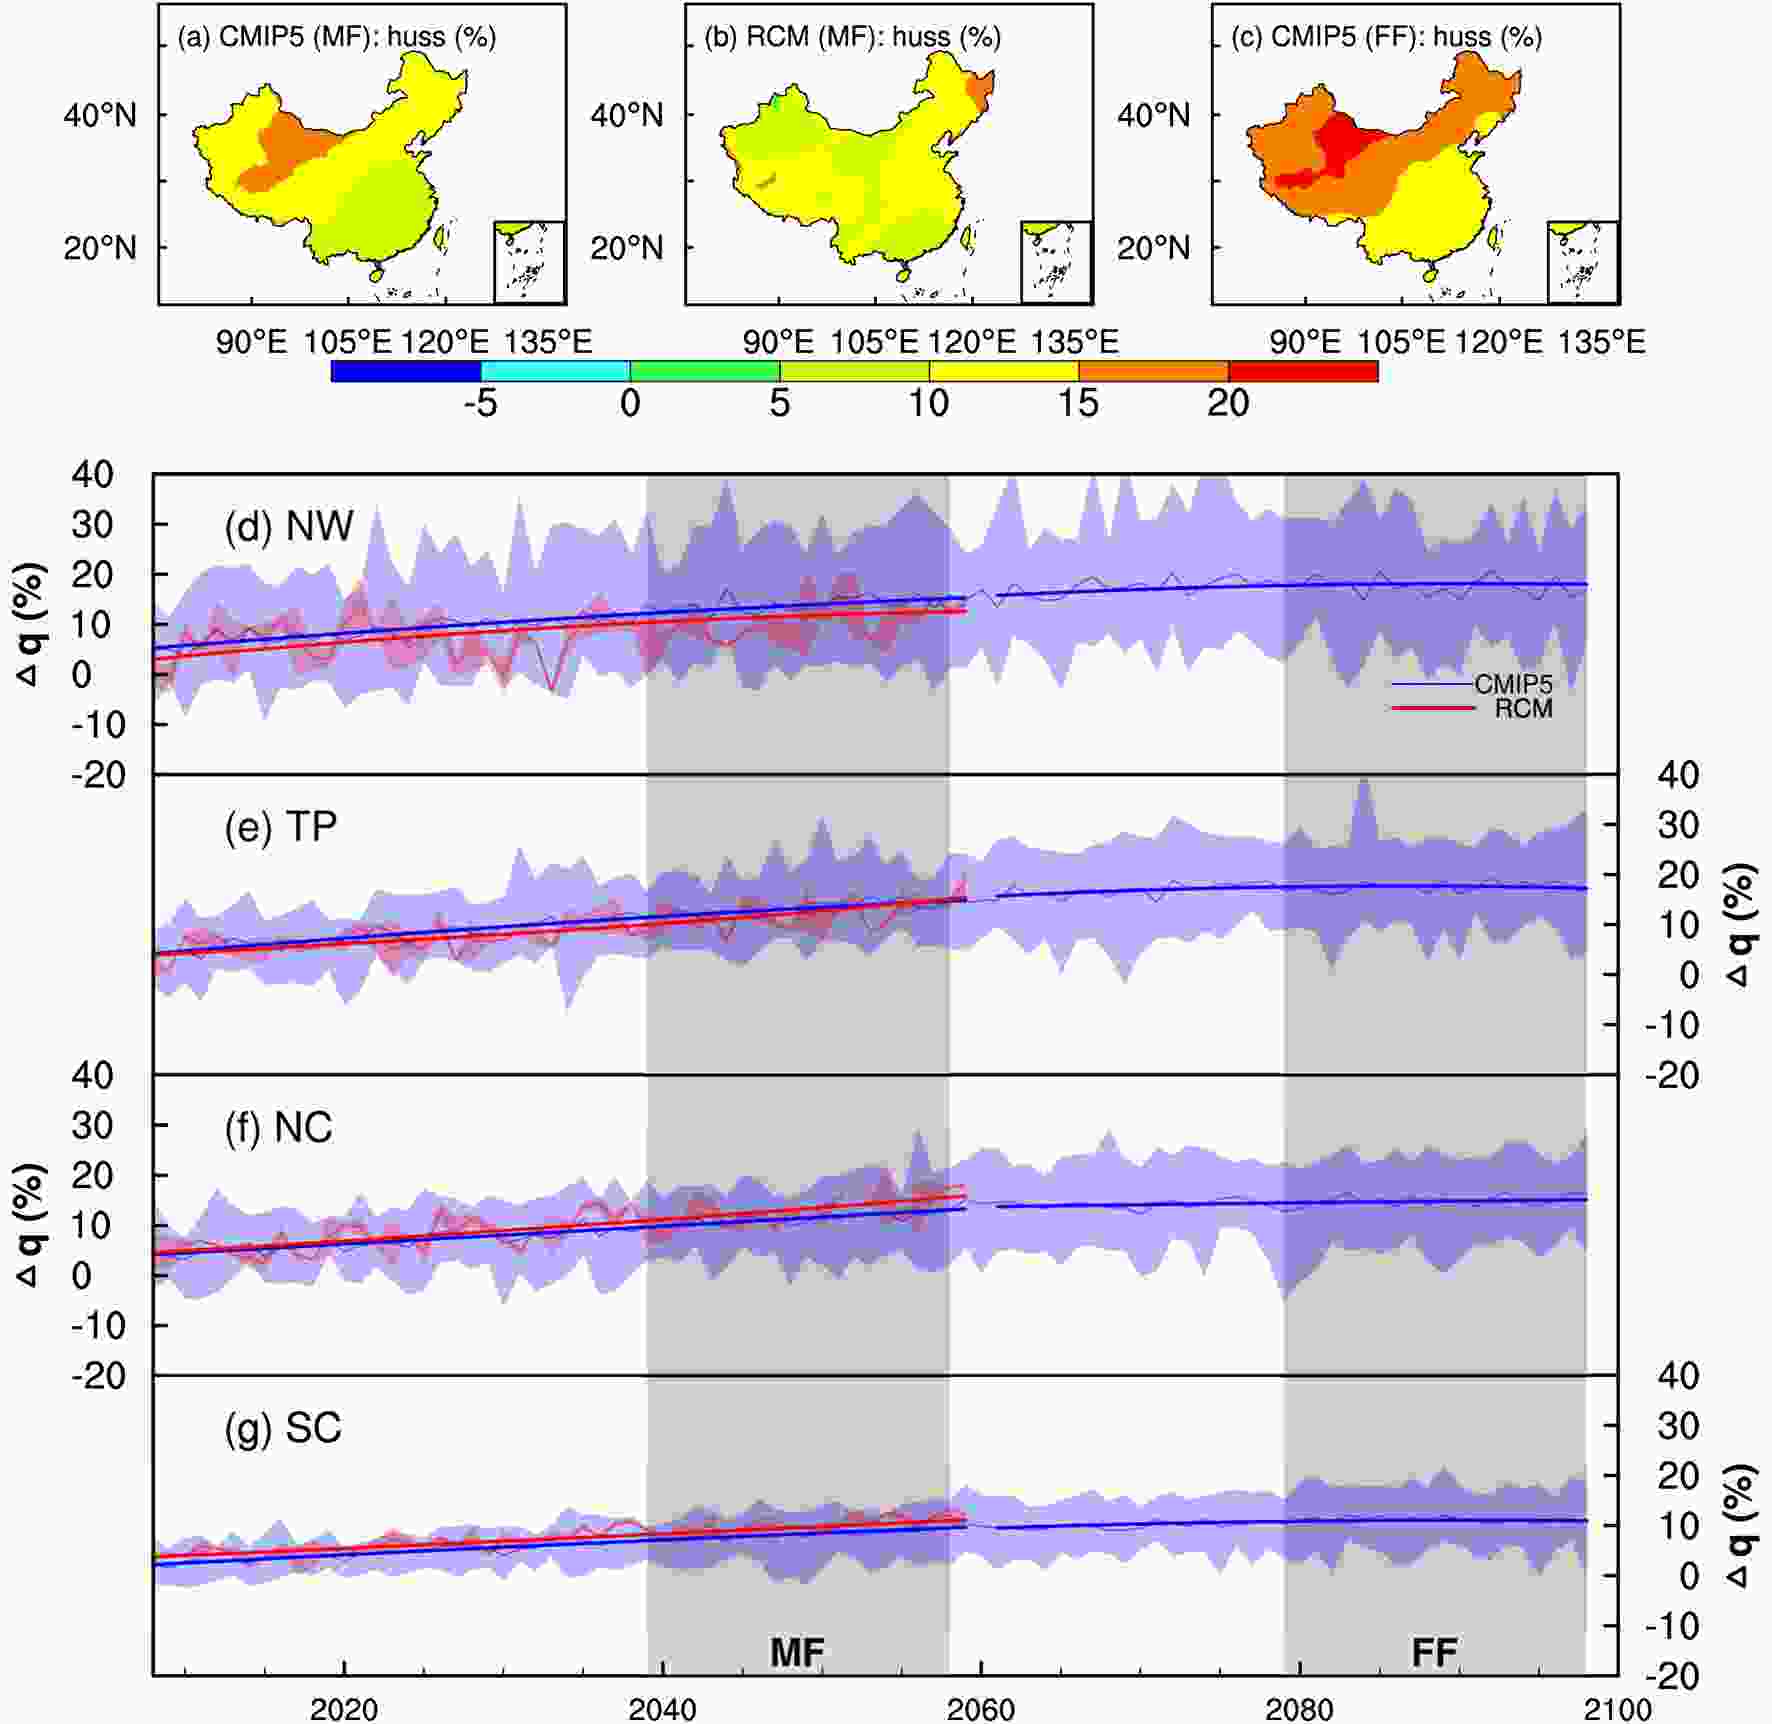
Figure 13. As in Fig. 11 but for surface specific humidity (
$ q $ ). -
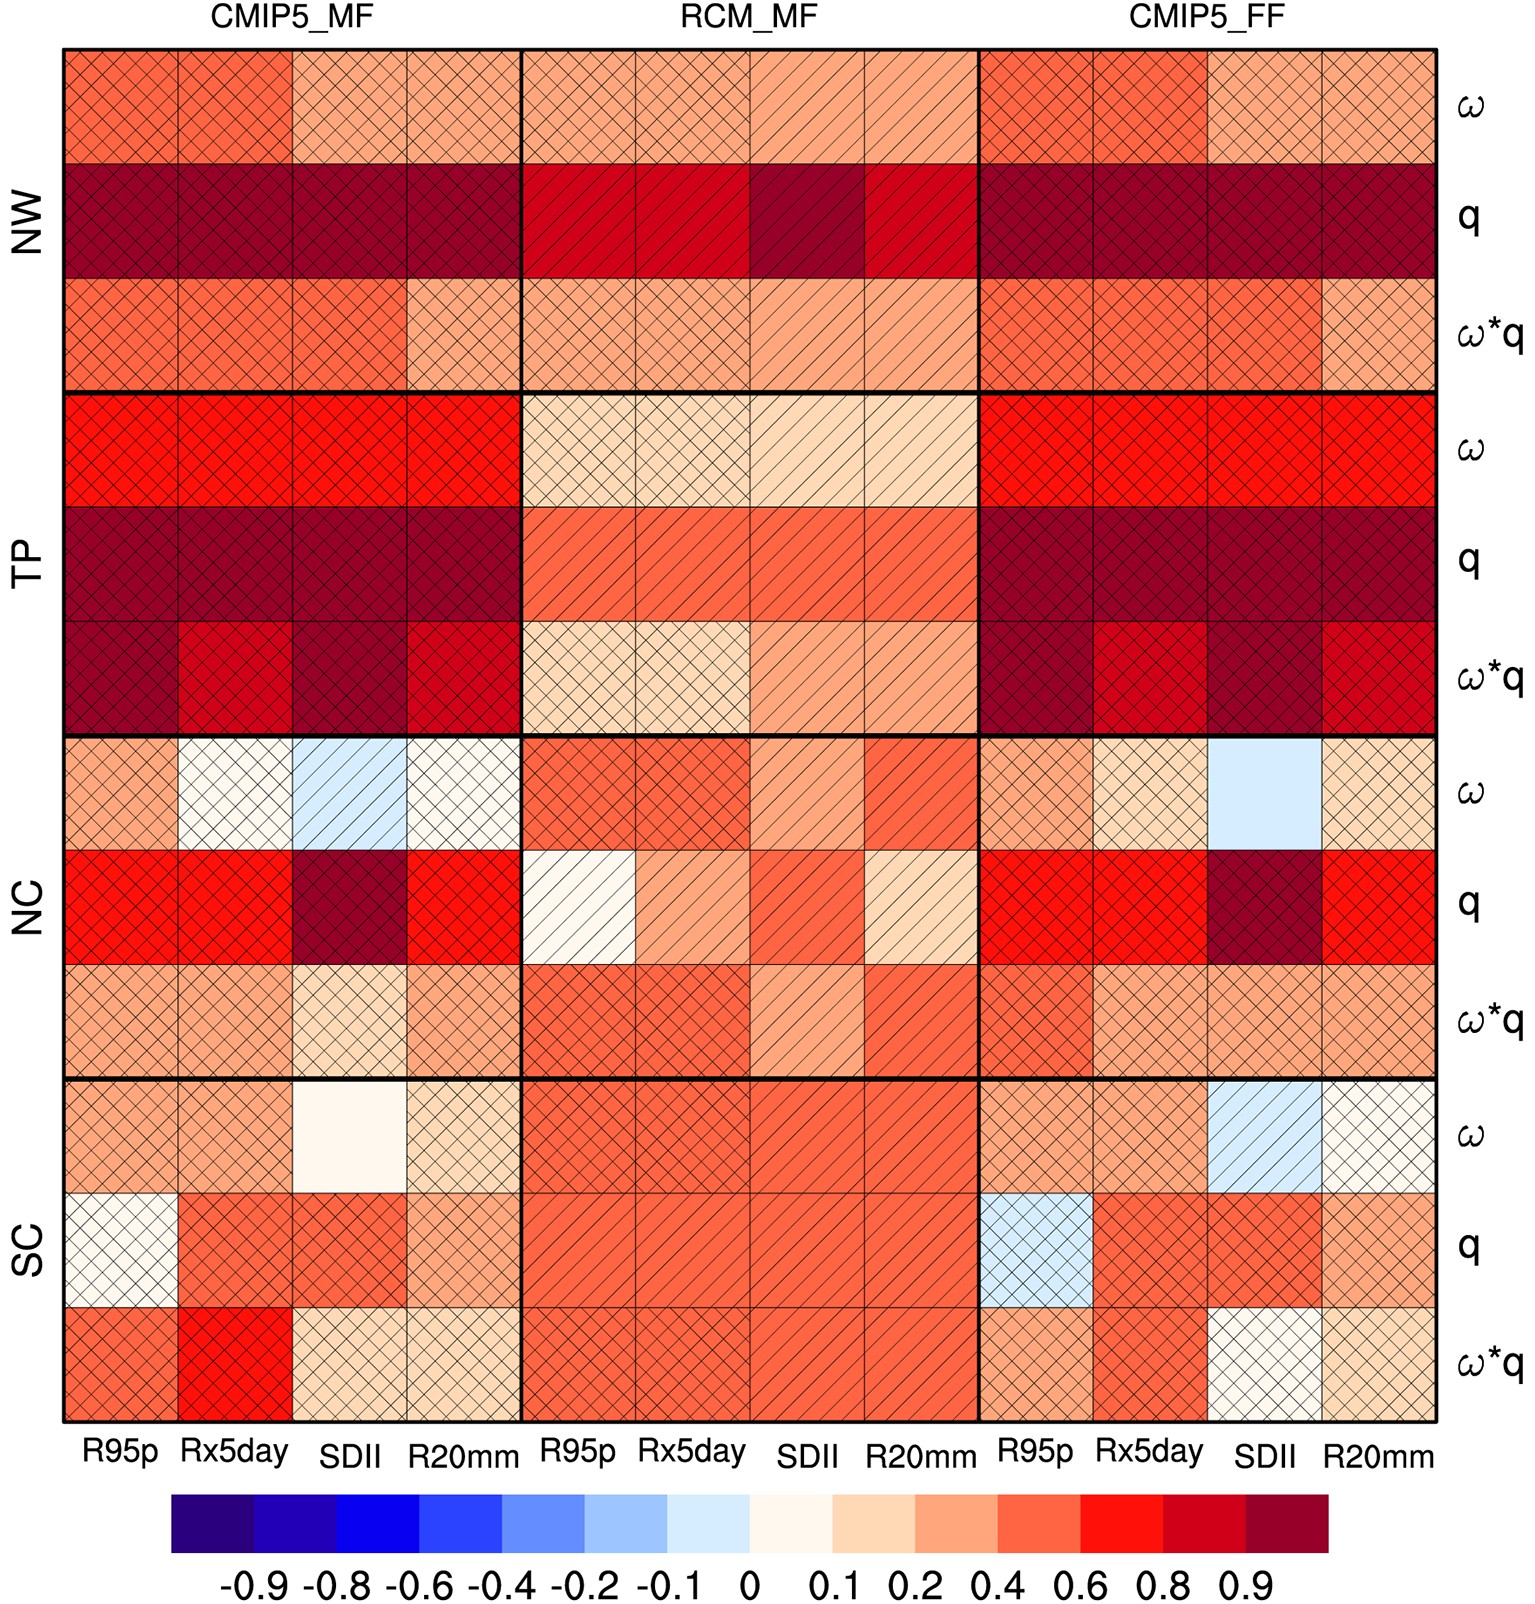
The RCM ensemble mean and CMIP5 ensemble mean both predict increases in the precipitation extremes in China, which may be impacted by atmospheric moisture or other thermodynamic and dynamic variables, such as the lapse rates of the temperature and atmospheric vertical wind (O’Gorman and Schneider, 2009; Sugiyama et al., 2010; Pfahl et al., 2017). Based on the water vapor equation, we derive the relative changes in precipitation approximated by the relative changes in vertical wind and surface specific humidity as shown by Eq. (9). Since precipitation extremes are usually calculated based on daily precipitation and highly correlated with mean precipitation (Qin and Xie, 2016), the physical quantification of the precipitation extremes is also investigated based on the surface specific humidity and the vertical wind. Specific humidity and vertical velocity are firstly determined based on the multi-model ensemble mean at each grid point over the four subregions and then the corresponding correlations between them are calculated. In the middle and far future, surface specific humidity is found to moderately increase over China and all of the four subregions, both from the RCM and CMIP5 ensemble (Fig. 13). Figure 14 shows the spatial correlations between the changes in the precipitation extreme indices over the four subregions of China during the MF and FF periods and the changes in the atmospheric vertical wind speed at 500 hPa in the summer (JJA), the JJA surface specific humidity, and their multiplication [DWQ =
$ \Delta (\omega q $ )/($ \left|\omega \right|q $ )], since the heavy precipitation extremes in China usually occur in JJA. The changes in vertical wind and surface specific humidity are calculated using the monthly data in JJA over each of the four subregions, as well as their multiplication shown in Eq. (8). All variables are firstly determined with respect to the multi-model ensemble mean at each grid point over the four subregions and then the corresponding correlations between them are calculated. The changes in the precipitation extremes during the MF and FF periods according to the CMIP5 ensemble mean are highly correlated with changes in the surface specific humidity, where the correlation coefficients are more than 0.9 in the NW and TP regions. Over these two subregions, which are vast territories with a sparse population and relatively less anthropogenic impacts, precipitation extremes increase obviously in the future, as well as specific humidity (Figs. 5 and 13). The NW region is an arid to semiarid region, with relatively less precipitation and higher temperatures. The atmospheric moisture is sensitive to global warming, which might greatly enhance the thermal gradient and evapotranspiration (Li et al., 2016a, 2019a). The correlation coefficient between changes in precipitation extremes and those of specific humidity by the CMIP5 ensemble mean is more than 0.6 in the NC region, but there is a negative correlation between R95p and the specific humidity in SC during the FF period. There are also positive correlations between the precipitation extremes and vertical wind speed at 500 hPa during the MF and FF periods, where the correlation coefficients are more than 0.1 over the NW region and more than 0.6 over the TP. The TP is the largest plateau in the world with a 4000-m average elevation and serving as an atmospheric heat source (sink) in winter (summer) (Liu et al., 2020). These features might cause precipitation over the TP to be more correlated to vertical atmospheric motion. However, over the NC and SC regions, the correlations between the precipitation extremes and vertical wind speed are lower and have different signs for the different extreme indices during the MF and FF periods, including negative correlations with Rx5day during the MF and FF periods. The correlations between the changes in the precipitation extremes and the changes in$ \mathrm{\omega }\mathrm{q} $ are all positive and significant at the p < 0.1 level (filled with hatching at 45° in the figure), and more than half of the CMIP5 models obtain correlation coefficients with the same signs as those based on the CMIP5 ensemble mean (filled with hatching at 135° in the figure) during the MF and FF periods. The correlations between the extremes and$ \mathrm{\omega }\mathrm{q} $ range from 0.1 to 0.4 for the NW region, and they are more than 0.8 in the TP region based on the CMIP5 ensemble. Due to large spatiotemporal variations of vertical velocity (Norris et al., 2019), changes in precipitation extremes are more correlated with changes in specific humidity relative to those in vertical velocity (Fig. 14), in spite of the fact that precipitation is scaled as specific humidity multiplied by vertical velocity from the water vapor equation as shown in this study.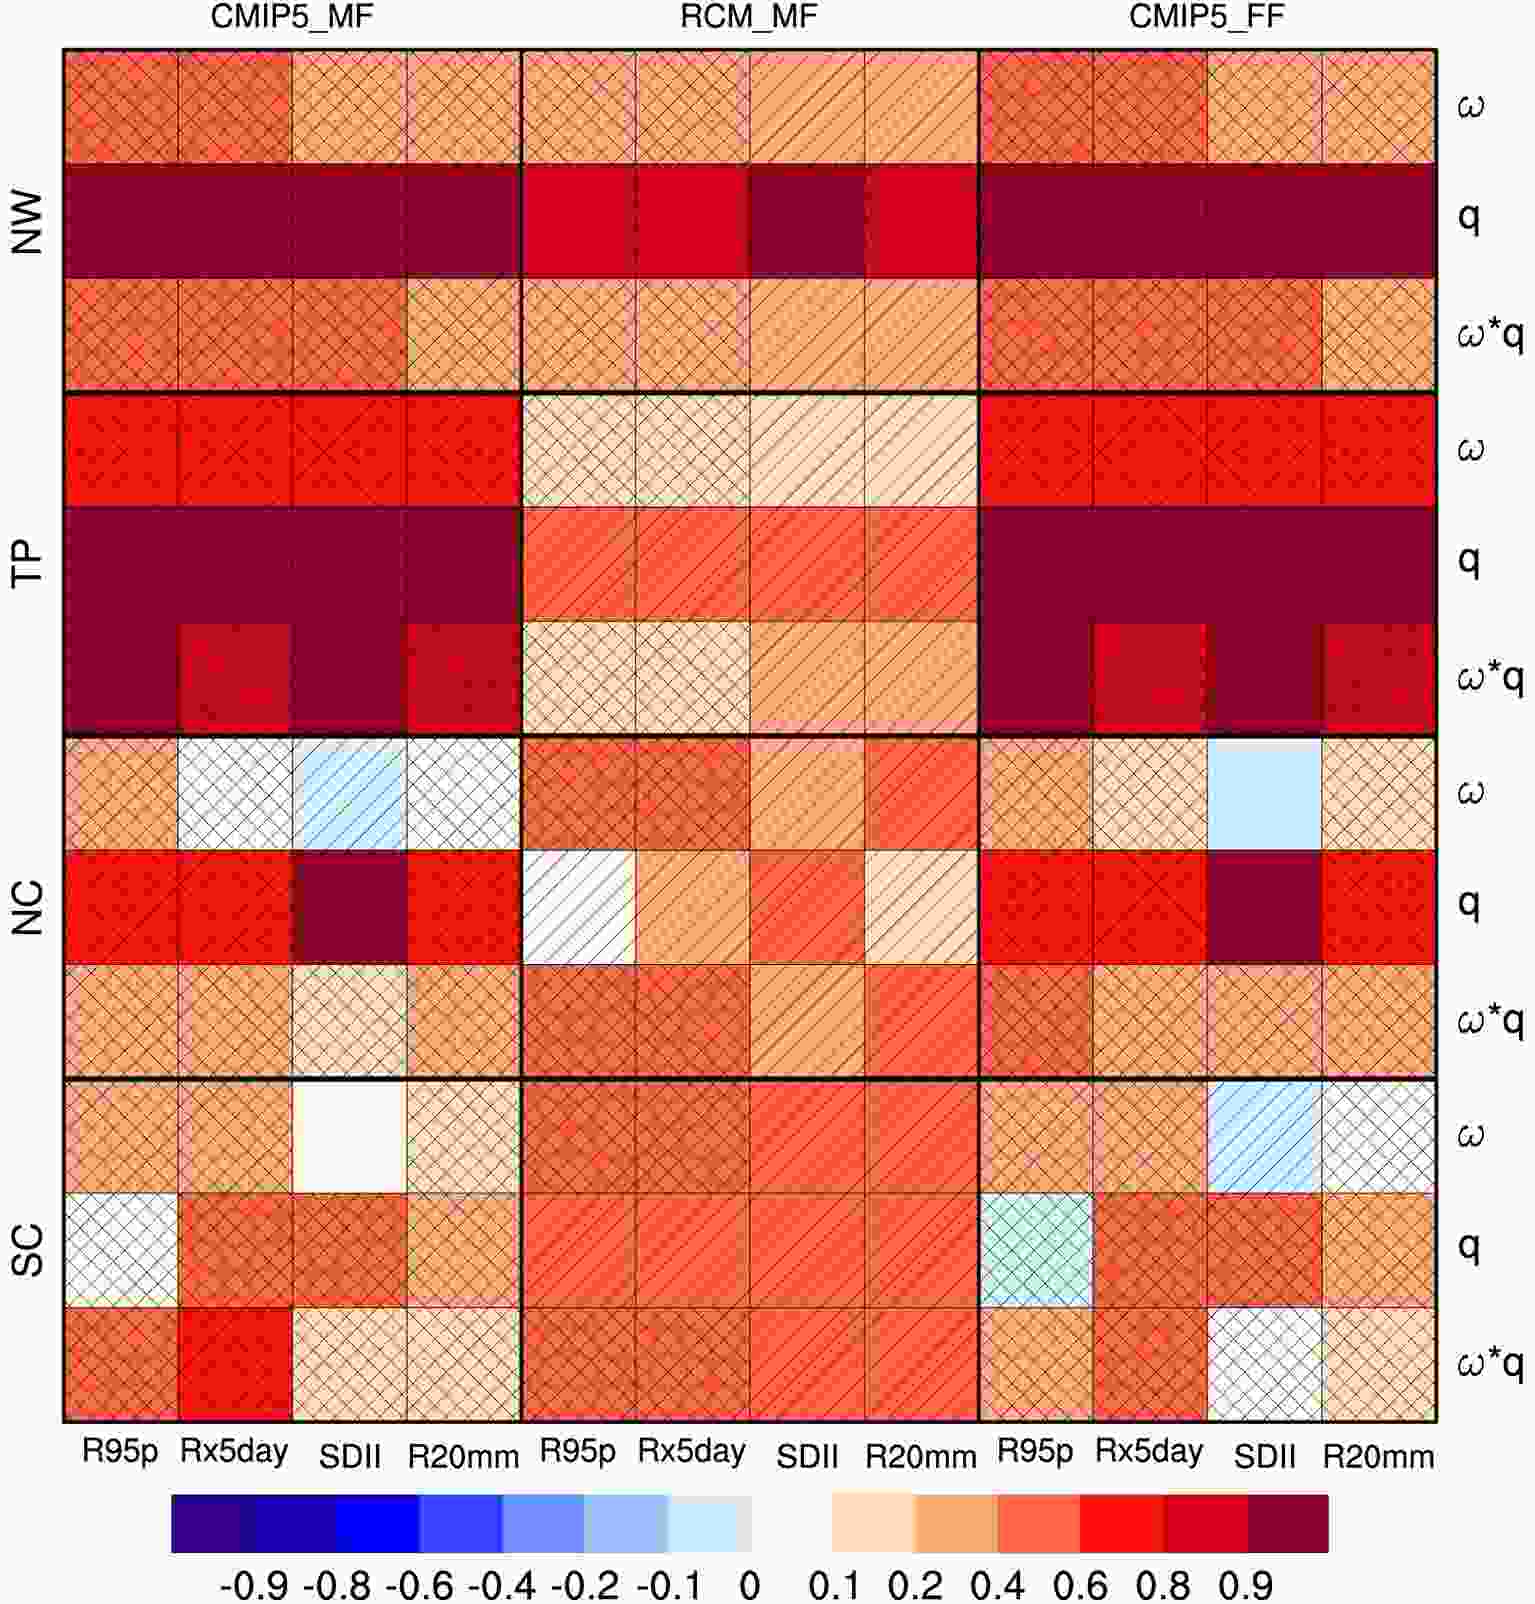
Figure 14. Correlations between the changes in the MF and FF precipitation extremes (R95p, Rx5day, SDII, and R20mm) with the changes in the vertical wind
$ \omega $ at 500 hPa, surface specific humidity$ q $ , and their multiplication$ \omega q $ . Cells filled with hatching at 45° show that the correlations are significant at the p < 0.1 level, and cells filled with hatching at 135° show that the correlations for more than half the models had the same signal as those obtained based on the ensemble mean.
3.1. Current precipitation extremes in China
3.2. Future precipitation extremes in China
3.3. Relationship between precipitation extremes and SAT
3.4. Quantification of precipitation extremes based on the water vapor equation


-
In this study, we quantify the rates of changes in precipitation extremes over four geographical subregions in China according to the changes in SAT in the mid-future (2039–58) and far future (2079–98) compared with the current period (1982–2001). Additionally, the physical quantification of the precipitation extremes is investigated based on the surface specific humidity and the vertical wind. The models or modeling results comprise 17 CMIP5 climate models under the RCP4.5 scenario and six RCM results downscaled by RegCM4 with different GCM forcings and different setups.
First, we provide an overview of the performance of the 17 CMIP5 models and RCM in simulating precipitation extremes during the current period in China. In general, the CMIP5 models and RCM runs can capture the spatial variations in the precipitation extremes, which change from the northwest of China (the arid and semiarid area) to the southeast of China (the humid area) according to the observations. The RCM runs perform better in simulating precipitation extremes than the CMIP5 models, which might be due to the high resolution and detailed physical processes of the RCM and its ability to capture the complex landscapes of the TP region. In the humid SC region, the precipitation extremes simulated by the RCM runs show larger negative biases than those by the CMIP5 models owing to the poor performance of the RCM in simulating less specific humidity and total water vapor, and thus less summer (JJA) precipitation. Most of the changes in the historical precipitation extreme indices in the four subregions of China exhibit increasing Theil–Sen linear trends from 1982 to 2001.
Compared with the precipitation extremes during the RF period, the precipitation extremes in China are predicted to increase in the mid-future and far future by the CMIP models and RCM runs. The EEMD secular trends in the four extreme indices over the subregions of China simulated by the CMIP5 models are predicted to increase from 2008 to 2058, especially for very heavy precipitation (R95p) and the number of days with heavy precipitation (R20mm). From 2059 to 2098, the secular trends in the four extreme indices simulated by the CMIP5 models are found to not be more obvious than those for the MF period. Additionally, each of the IMFs from EEMD is used to analyze in detail the changes in period or standard deviation of the extremes on interannual time scales in future studies.
Changes in future precipitation extremes are impacted by the warming climate through the holding capacity of atmospheric moisture and atmospheric circulation (O’Gorman, 2015; Wang et al., 2017a). All of the four precipitation extremes over the four subregions of China are found to increase in the MF and FF periods relative to the RF period under the warming climate, where the amplitudes of the increases in the FF period are greater than those in the MF period. The rates of increase in R95p during the MF period with SAT range from 3.45%°C−1 in SC region to 6.21%°C−1 in the NW region, and those during the FF period show larger amplitudes, where they range from 6.99%°C−1 in SC to 8.19% in NC. For the MF and FF periods, the increasing rates of Rx5day and SDII with SAT have similar magnitudes of around 5%°C−1 and 3%°C−1 in the four regions, and thus short-term heavy rainfall might not be sensitive to the SAT.
Finally, the atmospheric water holding capacity will increase with temperature according to CC scaling, which will impact the occurrence and intensity of precipitation extremes. It might be possible to physically quantify the precipitation extremes based on the surface specific humidity and the vertical wind. Changes in precipitation extremes in China during the MF and FF periods are correlated positively with changes in ωq and are significant at the p < 0.1 level. The simulated results obtained based on the CMIP5 ensemble mean are located near diagonal lines during both the MF and FF periods over most of the four subregions of China, thereby indicating that the measurements of changes in DWQ are close to those of precipitation extremes. The quantification of precipitation extremes described by Eq. (9) adopt the JJA vertical wind and surface specific humidity rather than these variables during the occurrence of precipitation extremes. Additionally, controlling factors of precipitation extremes are complex, especially at regional scales. In this study, we simply investigate precipitation extremes over China and four subregions at relatively large scales rather than local scales. Furthermore, RegCM4 with its hydrostatical dynamical core is adopted, which might present coarse vertical moisture transport. This might bring some drawbacks and will be improved in the future.
Acknowledgements. This study was supported by the National Key Research and Development Program of China (Grant No. 2019YFA0606903), the National Natural Science Foundation of China (Grant No. 42075162), and the Strategic Priority Research Program of Chinese Academy of Sciences (Grant No. XDA23090102). The observed daily precipitation data were provided by the China Meteorological Administration (
http://www.cma.gov.cn ) and the gauge-based precipitation data come from Xie et al. (2007a). The daily precipitation and surface air temperature data used by the CMIP5 models were downloaded fromhttps://esgf-node.llnl.gov/search/cmip5 .
 AAS Website
 AAS WeChat