


 DownLoad:


HTML
-
According to the initiation location of lightning, cloud-to-ground (CG) lightning flashes are divided into downward and upward flashes. Downward flashes are dominant in summer thunderstorms, and they are typically initiated between the negative charge region and the positive charge region. However, upward flashes only account for a small part of the total number of lightning events, which generally originate from high structures under certain favorable thunderstorm conditions, such as Japanese winter thunderstorms (Takagi et al., 2006; Wang et al., 2008; Michishita et al., 2019; Miki et al., 2019) or summer thunderstorms with relatively low convective activity (Jiang et al., 2014a; Pineda et al., 2018, 2019). Upward flashes can be independently initiated from high structures or triggered by surrounding lightning discharges that induce transient electric field enhancement (Wang et al., 2008; Warner et al., 2013; Yuan et al., 2017). With the increase in tall buildings, communication towers and wind power generators worldwide, studies on upward lightning have aroused increasing interest from many researchers.
McEachron (1939) first reported upward flashes initiated from the top of the Empire State Building in New York. Since then, many researchers worldwide have performed a series of studies on upward flashes, such as statistical research on the electrical parameters of upward flashes, classification of upward flashes, initiation and propagation characteristics of upward flashes, and triggering mechanisms of upward flashes (Flache et al., 2008; Diendorfer et al., 2009; Warner et al., 2012; Saba et al., 2016; Pu et al., 2017; Becerra et al., 2018; Schumann et al., 2019; Wu et al., 2019). These studies have achieved good results. However, relevant research on the discharge effects of upward flashes remains in its infancy. In this research, three effects of upward lightning discharges are considered: charge concentration reduction in clouds, maximum electric field decrease in clouds, and space electrostatic energy consumption. As a kind of discharge between clouds and the ground, upward lightning is in fact equivalent to transferring the in-cloud charge to the ground, thus releasing the in-cloud charge on the whole. Observations have illustrated that the charge neutralized by an upward flash ranges from a few coulombs to tens of coulombs (Biagi et al., 2009; Jiang et al., 2013; Zhang et al., 2017). However, it remains unclear how upward lightning discharges affect the charge distribution in thunderclouds and how to reconfigure the charge in thunderclouds. Many observations have confirmed that, in certain cases, the preceding lightning may trigger the subsequent lightning (Wang et al., 2008; Lu et al., 2009), which implies that the electric field in the whole space does not necessarily decrease during or after discharges and may instead rise in certain areas. It is difficult to obtain the electric field change in the whole space before and after lightning discharge with existing observation methods, and we can only evaluate the ground electric field change at the moment of lightning discharge through atmospheric electric field mills and slow and fast antennas (Weidman and Krider, 1980; Marshall et al., 2009; Qie et al., 2011). Therefore, evaluation of the effect of discharge on the space electric field remains a problem worth studying. In addition, from the perspective of observation, evaluation of the electrostatic energy consumed by upward lightning discharge can at present only be achieved via ground electric field observations combined with source charge modeling (Uman, 1987; Qie et al., 2013). This approach requires many assumptions and may only provide a rough estimate. Therefore, efficient and accurate assessment of the electrostatic energy consumed during upward lightning discharge is also an important direction in lightning physics.
In summary, previous studies remain insufficient on either the effect of upward lightning discharge on space charge, electric field and potential or the evaluation of the electrostatic energy consumed by upward lightning discharge. Observations may obtain the characteristics of real lightning and the charge structure on the sounding trajectory, but due to the limitations of observation conditions and methods, it is impossible to obtain comprehensive thundercloud electrical parameters and various data types related to lightning before and after its occurrence, and it is difficult to conduct sensitivity experiments. Therefore, in order to effectively evaluate the effects of upward lightning discharge on charge, electric field and subsequent discharge, it is necessary to supplement the corresponding modeling approach.
Researchers have conducted extensive lightning numerical simulation studies, and have attained great progress in the establishment of models and development of discharge parameterization schemes (Mansell et al., 2002; Tan et al., 2006, 2019; Iudin et al., 2017; Xie et al., 2018; Attanasio et al., 2019; Da Silva et al., 2019; Tran and Rakov, 2019). Some have focused on the study of a certain physical process of lightning, such as the M component, fast positive breakdown, upward leader initiation and connection process. These are small-scale physical models that cannot simulate complete lightning discharge. Others have mainly discussed the relationship between lightning discharge features and thunderstorm electrical parameters. These belong to the thunderstorm model, and most thunderstorm numerical models can simulate intracloud (IC) and CG flashes (in this paper, CG flashes specifically refer to downward flashes) (Mansell et al., 2002; Tan et al., 2014; Guo et al., 2016). However, upward flashes are initiated from small-scale electric field distortions, which results in high model resolution requirements, and existing thunderstorm models, in particular 3D models, do not satisfy the above initiation conditions. Tan et al. (2016) realized the simulation of upward flashes for the first time with a 2D thunderstorm model, and Tan et al. (2019) evaluated the relationship between the development of upward flashes and thundercloud electrical parameters by improving the upward lightning discharge scheme. Against this background, the thunderstorm model improved by Tan et al. (2019) is adopted in this study to simulate upward flashes. Using these upward lightning cases, the effects of upward lightning discharges on the charge structure, space electric field and electrostatic energy are discussed in detail. The differences between the discharge effects of upward and IC flashes are analyzed. In addition, the neutralization of the induced charge on the channels and the recovery of thundercloud electrical parameters are also investigated.
-
In this paper, a 2D thunderstorm model containing an improved upward lightning discharge scheme is adopted to conduct a theoretical discussion of the discharge effects of upward lightning. Note that the thundercloud microphysical and electrification processes mainly provide the background charge for lightning initiation, which is not the focus of this paper. The following section mostly introduces the lightning discharge scheme.
-
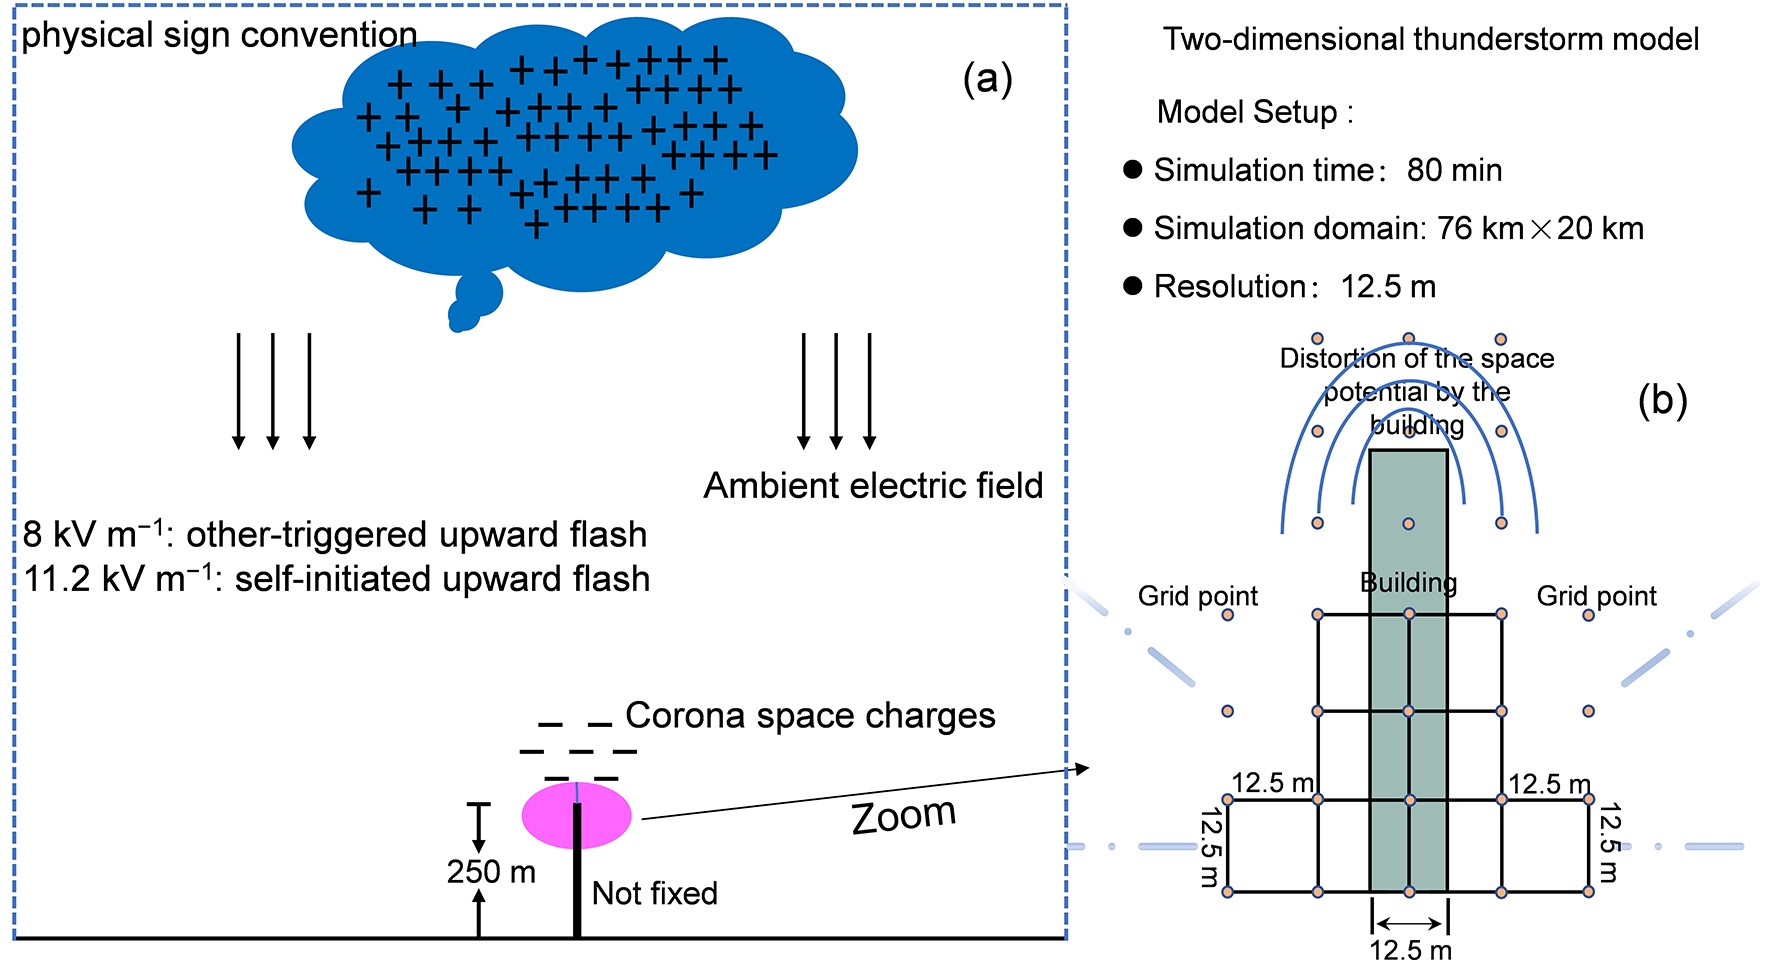
In the thunderstorm model, the size of the entire simulation domain is 76 km × 20 km, the simulation duration is 80 min, the spatial resolution of the cloud module is 250 m, the temporal resolution is 2 s, and the spatial resolution of the discharge module is 12.5 m (the time concept is not considered during leader development). The discharge module consists of IC, CG, and upward lightning discharge schemes, where IC and CG lightning discharge schemes have been previously introduced in detail by Tan (2006) and Tan et al. (2014). Therefore, we briefly describe the upward lightning discharge scheme [details have been provided in Tan et al. (2019)], including upward lightning initiation, propagation, termination, induced charge calculation, and upward lightning definition.
-
Upward flashes commonly originate from high structures and propagate into charged clouds (Rakov and Uman, 2003; Warner, 2012). Researchers have found that the ambient electric field distortion caused by high structures is the main reason for upward lightning initiation (Diendorfer et al., 2009; Guimarães et al., 2014). Hence, we establish a 250-m grounded structure in the model.
Bazelyan et al. (2008, 2015) reported that the corona space charge produced from the tip of high structures exerts a shielding effect on the ambient electric field. It is difficult for an upward leader to initiate from high structures under the action of a slowly rising thunderstorm electric field. When the ambient electric field is rapidly enhanced by an approaching downward leader, an upward leader may be initiated easily. Based on this consideration, the initiation threshold for self-initiated upward lightning and other-triggered upward lightning should be differently selected (note that, in the model, upward lightning immediately occurring after the preceding lightning is defined as other-triggered upward lightning). Referring to the settings adopted in Tan et al. (2019), we choose ambient electric fields of 11.2 and 8 kV m−1 in our model as the initiation thresholds of self-initiated and other-triggered upward lightning, respectively, instead of simulating the distortion process at the tip of the building. Due to the influence of the model dimension and resolution, the threshold adopted in our model may be slightly different from that determined via electric field observations (Zhou et al., 2012; Becerra et al., 2018), but this threshold is appropriate for our current model.
The initiation process of upward lightning and relevant thresholds are shown in Fig. 1a, and the physical sign convention is adopted for the direction of the electric field. Figure 1b illustrates the electric potential distortion at the tip of the building, and the distorted electric potential rapidly decreases as it moves away from the tip of the building.
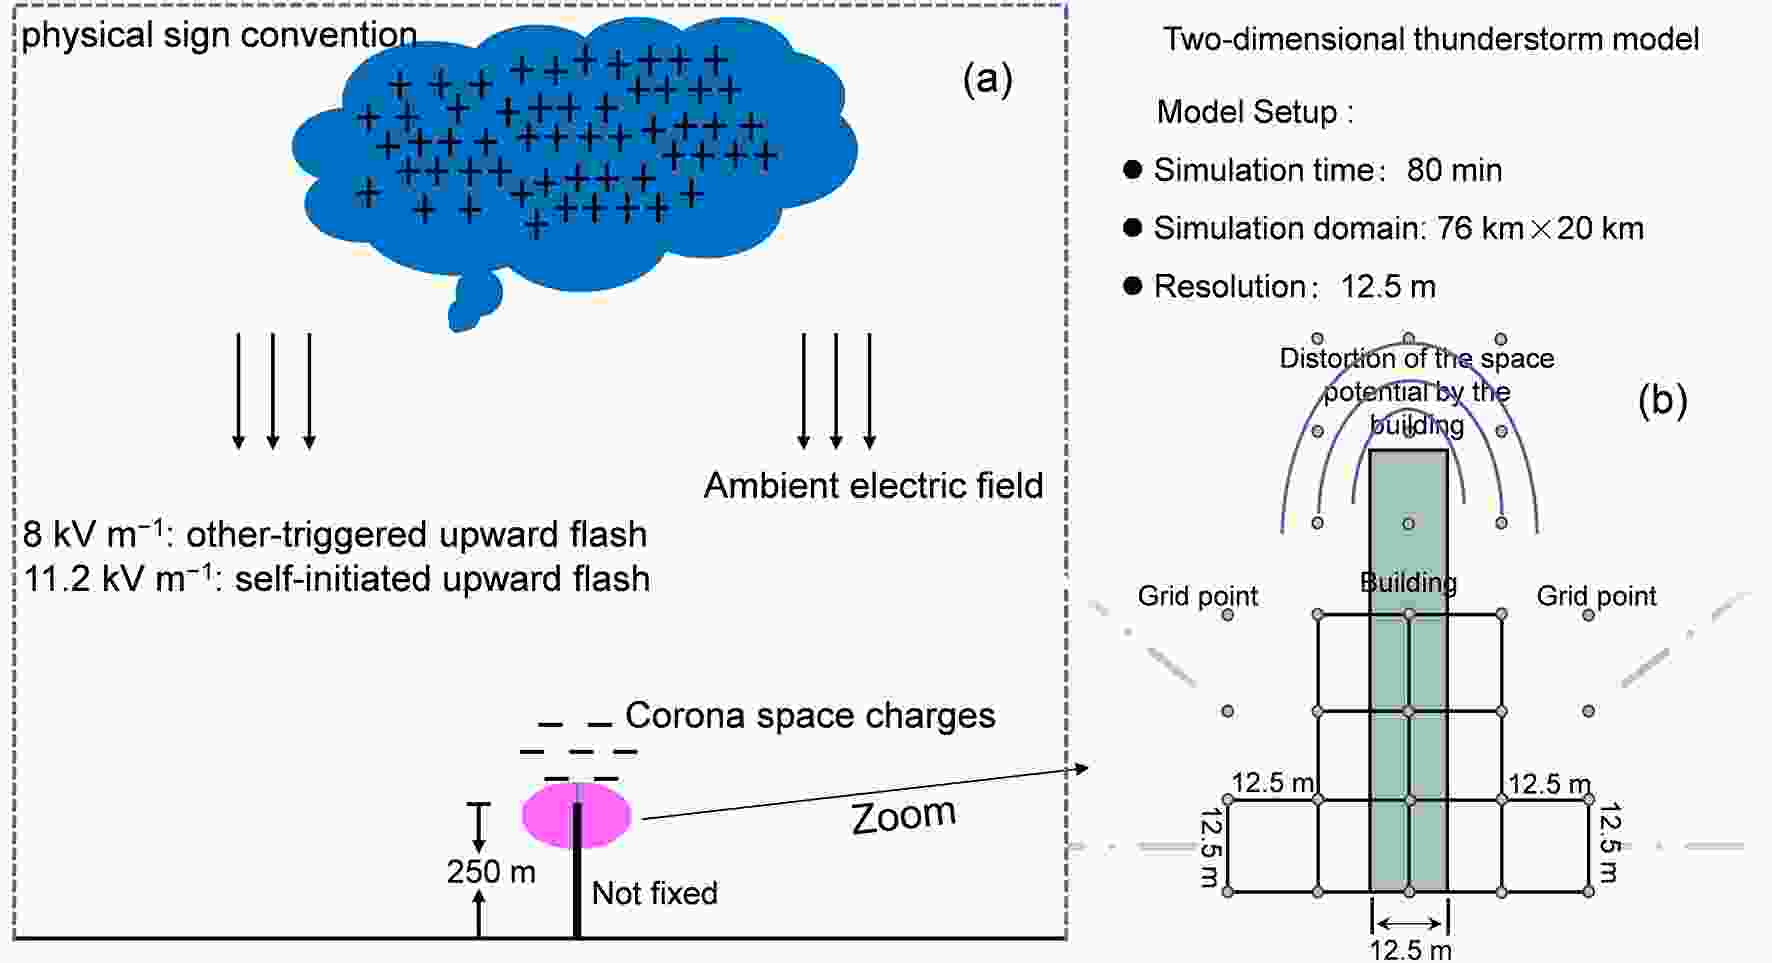
Figure 1. Schematic diagram of upward lightning initiation and distortion of the space potential at the tip of the building.
Polarity asymmetry between positive and negative leaders has been presented by researchers (Williams, 2006; Williams and Heckman, 2012; Montanyà et al., 2015; Qie et al., 2017; Yuan et al., 2019), but our model is a stochastic discharge model. In contrast to physical models, it is difficult for our model to distinguish these two types of leaders due to its physical nature. Moreover, upward lightning propagates unidirectionally, whose leader channels are usually of a single polarity. The simulated results obtained by selecting different thresholds for positive and negative leaders are almost the same as those obtained with the same thresholds. Therefore, we refer to Iudin et al. (2017) and Tan et al. (2019), and do not distinguish between positive and negative leaders in the upward lightning discharge scheme.
-
In recent years, with the improvement of observation methods, mainly the increasing frame speed and sensitivity of high-speed cameras, a large amount of upward lightning originating from the tips of buildings has been observed. Jiang et al. (2014b) reported several upward flashes observed from a 325-m-tall meteorology tower in Beijing, and the results reveal that upward flashes exhibit a branched structure, such as one-way propagation or multibranch extension, which is similar to IC and CG flashes. According to the treatment methods of lightning propagation applied in Mansell et al. (2002) and Tan et al. (2014), upward lightning also adopts the stochastic step-by-step propagation scheme. Therefore, we choose 150 kV m−1 as the propagation threshold of upward flashes in the model (this value is effective and largely determined by our model spatial resolution). If the absolute values of the potential gradient between leader channels (whether positive or negative leaders) and ambient points exceed the above threshold, positive leader channels or negative leader channels are extended one step forward. When multiple adjacent points meet the propagation threshold, a new channel point is stochastically chosen from among all possible extensions, and the outermost leader channels tend to propagate along the direction of the maximum electric field (Mansell et al., 2002). Note that only one new channel segment is added at a time (a positive leader channel segment or a negative leader channel segment).
In our parameterization scheme, the concept suggested by Kasemir (1960) was adopted to solve leader channels; namely, the leader channels are regarded as good conductors, and the charge is induced on the leader channels by the ambient electric field. The equivalent charge transfer on the channels is obtained by the change in the induced charge, and the charge relaxation process is considered by setting a nonzero internal electric field [for example, the value of 500 V m−1 adopted in Tan et al. (2019)], which is much smaller than the thunderstorm electric field. The induced charge on leader channels does not need to be solved when leader channels propagate, because the influence of the charge on space potential is contained by satisfying the fixed boundary condition imposed by the channel potential (Mansell et al., 2002). After each new extension, the electric potential of the entire simulation domain except the leader channels (which is treated as a fixed boundary) is updated by solving Poisson’s equation:
where ϕ is the potential at grid points except the leader channels, ρ is the charge density, and ε is the electric permittivity. Since the simulated leader channels do not contain microscopic processes of lightning development, certain details cannot be discussed, such as streamer-to-leader transition, and negative differential resistance behavior. However, our scheme exhibits a certain rationality regarding the interpretation of the macroscopic properties of lightning channels and the overall effects of lightning discharge.
In our model, upward lightning is terminated under two conditions. One condition is that leaders propagate to the simulation domain boundary; the other condition states that no leader channel points meet the propagation condition of upward lightning.
The simulation results revealed that certain upward leaders aborted after several steps to dozens of steps and failed to propagate into the charged cloud. Considering that the purpose of this study is to discuss the effects of upward lightning discharge on thundercloud electrical parameters, these upward leaders were not chosen as research objects. Only those upward leaders that entered thunderclouds were defined as upward lightning and selected as the dataset of this study. It is worth noting that, due to the limitation of the current scheme, channel decay was not considered, and the simulated upward lightning flashes did not contain the subsequent return stroke. The discharge effects of upward lightning discussed in this study were limited to the discharge effects of upward lightning without a return stroke.
-
When upward leaders propagate, the induced charge on the leader channel points does not need to be considered. When upward lightning terminates, the induced charge on the leader channel points needs to be calculated by solving Poisson’s equation. Because the ion attachment process is not explicitly handled in our model, the free ion charge term is not considered. The charges released by the upward leader channels are instantaneously distributed to different types of hydrometeor particles. Charges received by each hydrometeor category are proportional to its total surface area, as presented by Ziegler and MacGorman (1994):
where δρk is the charge density deposited on the hydrometeor category k, σk is the total surface area of hydrometeor category k, and δρ is the charge density at a grid point on the leader channel. These charges are assumed to be transported to other regions through thundercloud microphysical processes (e.g., turbulent exchange, advection transport, and gravity sedimentation) and continue to influence the subsequent lightning discharge. If the leader extends outside the thundercloud to a region without hydrometeors, the induced charge is not traced by the model. This may influence the subsequent charge distribution and lightning discharge, but compared to the uncertainty caused by the model resolution and cloud microphysical processes, the influence of a small amount of induced charge may be ignored.
It should be noted that charge neutralization and redistribution are complicated issues, and the relevant details remain unclear. Different possibilities may have their own rationalities. Our scheme is a parameterized treatment of generally observed phenomena, and many physical processes are simplified. Therefore, the simulation results only provide a reasonable estimate of the discharge effects of upward lightning, and particular uncertainties remain, such as the polarity asymmetry between positive and negative leaders, channel decay, and the ion attachment process. The treatment of these processes is also a target for future parameterization improvement.
-
In order to obtain universal conclusions regarding the discharge effects of upward lightning, upward flashes under different types of thunderstorms should be simulated. Thus, two sounding profiles (temperature, pressure, humidity, and wind) are selected as the initial conditions of our model [similar to Tan et al. (2019)]; these two sounding profiles pertain to a mountain thunderstorm and a plain thunderstorm, respectively. The selection of these two sounding profiles as the initial background conditions for the simulations does not reproduce these two specific thunderstorms, but rather generates two new types of thunderstorms called ST A (with the general characteristics of a mountain thunderstorm) and ST B (with the general characteristics of a plain thunderstorm), which provide various charge backgrounds for the initiation of upward lightning. It should be noted that upward lightning initiation is very difficult. In this research, we adopt two methods (Tan et al., 2019) to facilitate the occurrence of upward flashes: (1) changing the location of the 250-m grounded structure: as long as the ambient electric field at an altitude of 250 m in the simulation domain exceeds the initial threshold, the structure will be placed there; (2) adjusting the intensity of the thunderstorm: the maximum temperature and relative humidity of the bubble disturbance center constantly change. Finally, 147 upward lightning cases are obtained, which are adopted as the dataset to study the discharge effects of upward lightning.
2.1. Upward lightning parameterization
2.1.1. Upward lightning initiation
2.1.2. Upward lightning propagation and termination
2.1.3. Induced charge deposition, neutralization and redistribution
2.2. Simulation of upward lightning
-
Coleman et al. (2003) observed that lightning discharge appears to deposit opposite-polarity charges in relatively localized regions of both the main negative charge and the upper positive charge, rather than simply neutralizing the space charge near the discharge channels. The charge density of the deposited charge is comparable to that of the preexisting charge, and these charges may affect the distribution of thunderstorm electrical parameters, and thus influence the development of subsequent lightning. Moreover, Tan et al. (2007) revealed the effects of IC lightning discharge on the space charge, electric field, potential, and space electrostatic energy by computer simulations. In contrast to the bidirectional leader development process of IC and CG lightning, upward lightning is a unidirectional leader discharge. However, how does the latter affect the space charge, potential, electric field and electrostatic energy? How long does it take to recover the damage caused by upward lightning to the space potential and electric field? In this section, the discharge effects of all upward lightning cases simulated by our model are discussed, and the effects of upward lightning discharge on thundercloud electrical environment parameters are also quantitatively evaluated.
-
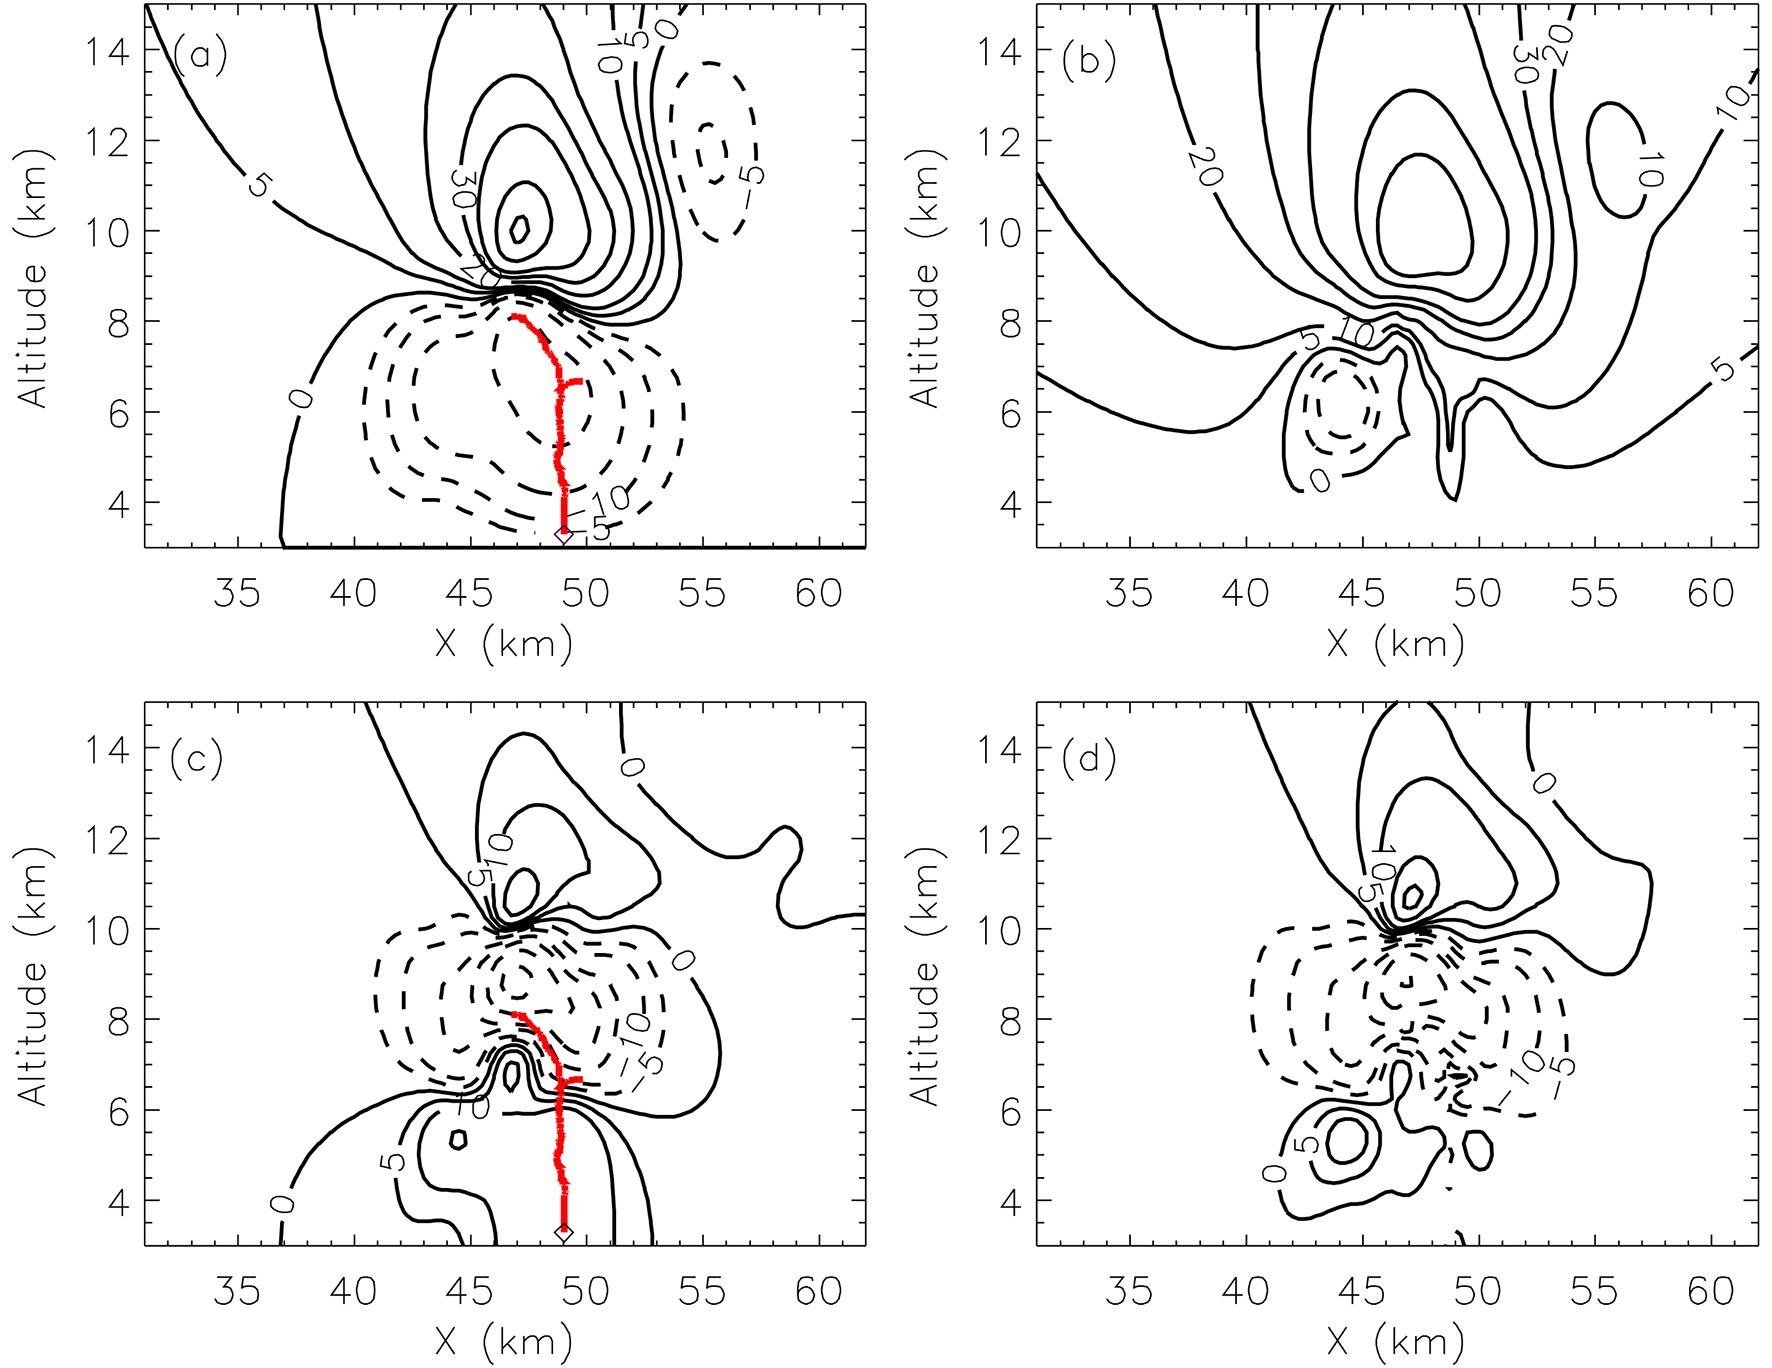
Figure 2 shows two upward flashes. The upward flash (UL 1 from ST A) shown in Fig. 2a is an upward negative flash corresponding to the dipole charge structure. Figures 2a and b show the distribution of the space charge before and after UL 1, respectively. The upward flash (UL 2 from ST B) shown in Fig. 2c is an upward positive flash corresponding to the tripole charge structure. Figures 2c and d show the distribution of the space charge before and after UL 2, respectively. After the upward lightning discharge, a large number of induced charges are deposited in the upward leader channels. As shown in Fig. 2, UL 1 and UL 2 both enter the bottom charge region. UL 1 propagates into the main negative charge region, and after leader channels are terminated, a large number of positive charges were deposited in the original discharge channels. The maximum charge density in the bottom charge region before the discharge is −1.12 nC m−3, while the maximum positive and negative charge densities in the bottom charge region after discharge are 1.36 and −1.09 nC m−3, respectively. The results reveal that after UL 1 discharges, the induced charge on the lightning channels is of the same order of magnitude as the space charge in the discharge region. According to the treatment of the induced charge in the model, the charge is not immediately neutralized by the surrounding space charge, but with the subsequent turbulent exchange, advection transport, gravity sedimentation and electrification, the charge gradually mixes with the surrounding space charge, and then prepares for the subsequent discharge. UL 2 propagates into the bottom positive charge region, and the maximum charge density in the bottom charge region before the discharge is 1.53 nC m−3, while the maximum positive and negative charge densities in the bottom charge region after discharge are 1.45 and −1.72 nC m−3, respectively. Similar to the analysis of UL 1, the upward lightning discharge does not immediately reduce the charge density in the whole space but implants a considerable amount of induced charges into the leader channel, thus forming a more complex charge structure, which may be one of the reasons for the occurrence of the associated lightning. The above simulation results in this study are consistent with those observed by Coleman et al. (2003).
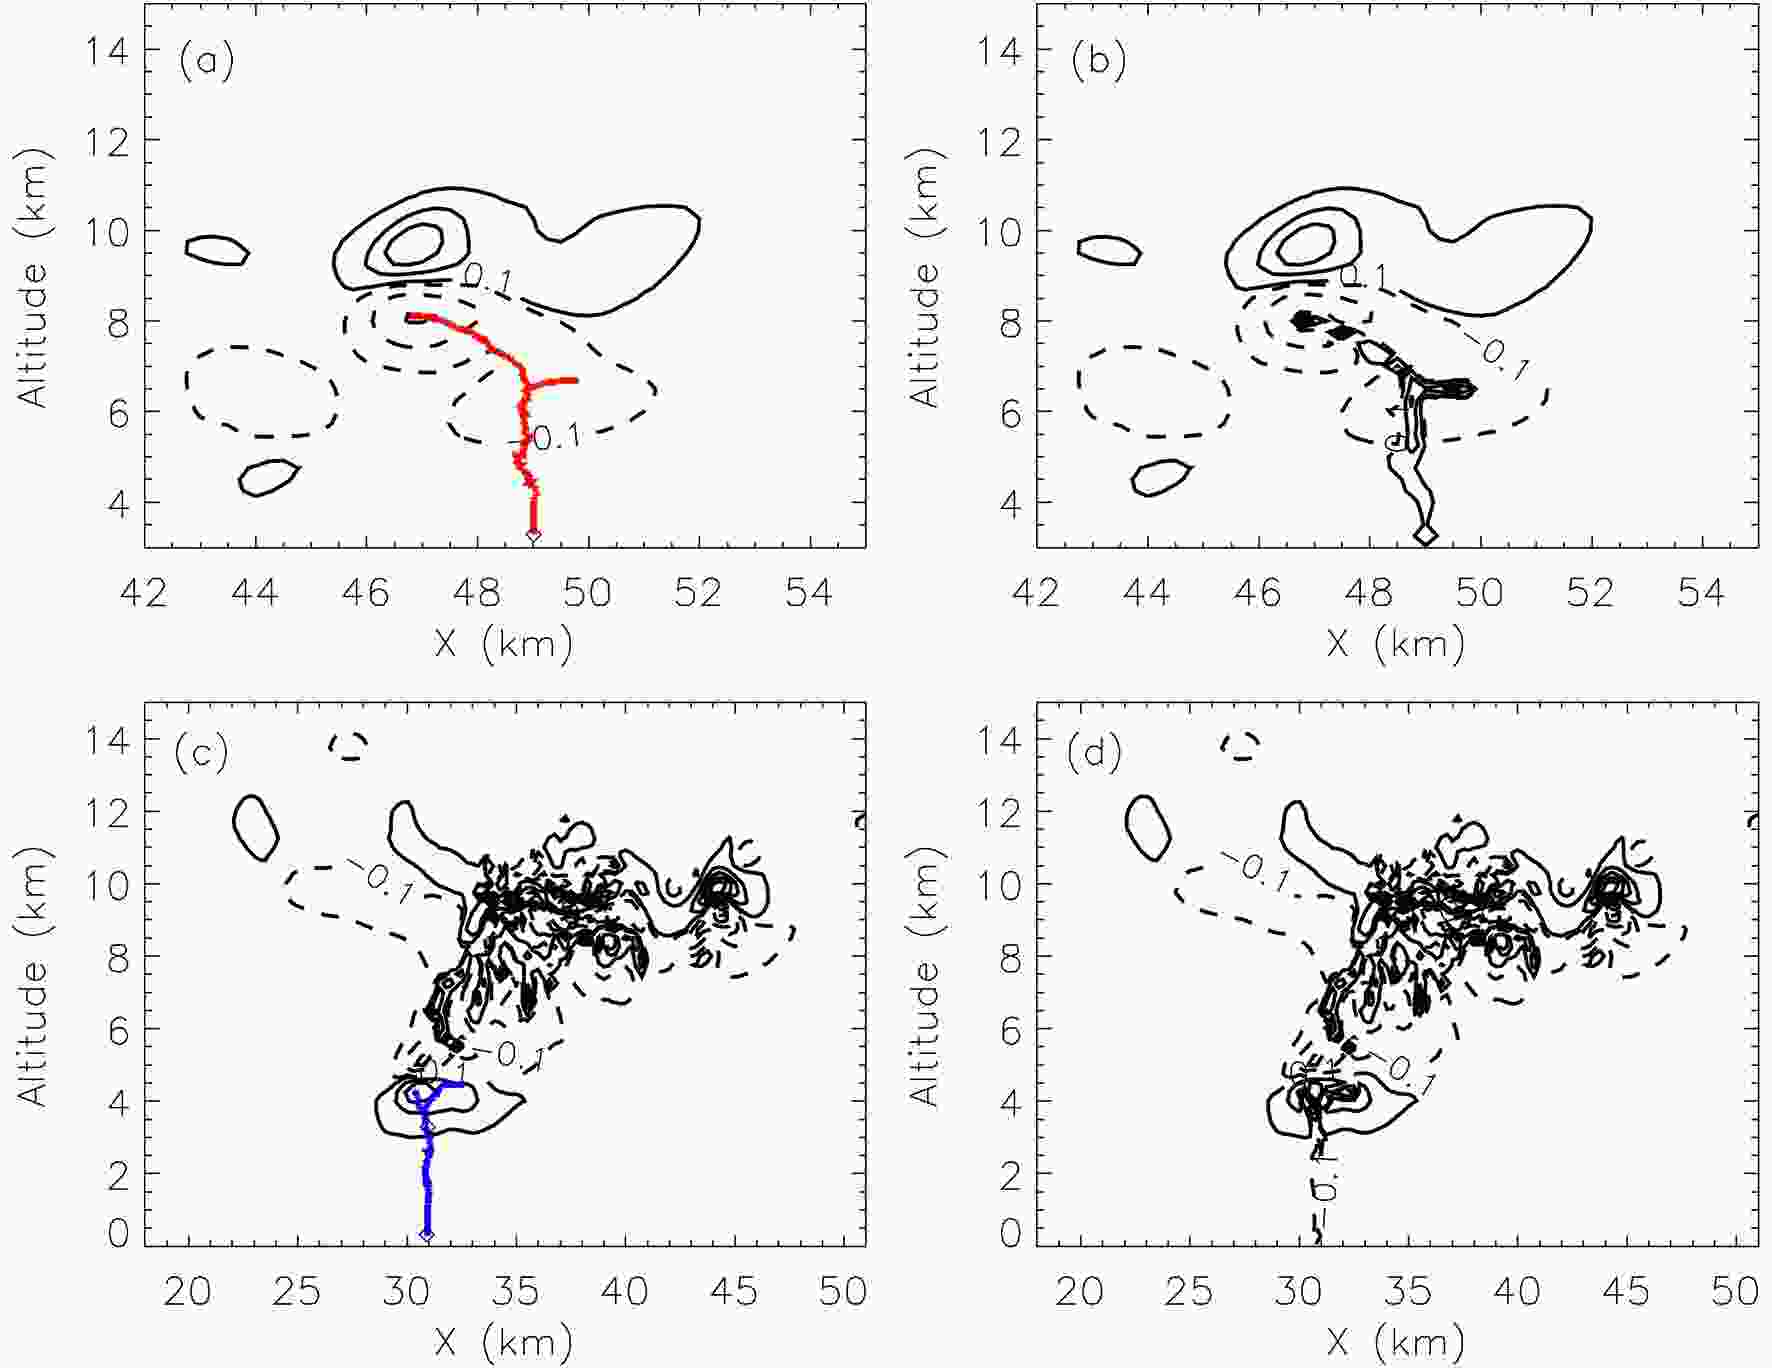
Figure 2. Lightning channels and charge distribution. (a) Upward lightning channel structure for UL 1 (from ST A) and pre-discharge charge distribution. (b) Post-discharge charge distribution. (c) Upward lightning channel structure for UL 2 (from ST B) and pre-discharge charge distribution. (d) Post-discharge charge distribution. The purple diamonds represent the initiation points of the upward lightning flashes. The red channels represent the upward positive leaders, and the blue channels represent the upward negative leaders. The black solid lines are for positive charge and the dashed lines are for negative charge, with the contour values starting at ±0.1 nC m−3 with intervals of 0.5 nC m−3 [the charge distributions are all from a coarse resolution (250 m) model].
The leader channel length, induced charge estimate, and ratio of the induced charge on the discharge channels to the total opposite-polarity charge in the discharge region (Ric) are given in Table 1. Assuming that the charge density distribution on all sides of the cloud is consistent, the estimated value of the total induced charge generated by the upward lightning discharge is equal to the product of the total charge in the discharge region, the horizontal range of the thundercloud (which is an artificially defined variable and approximately equal to πr/2) and Ric, where the horizontal radius (r) of the thundercloud is taken from the 3D thunderstorm simulation results. The cloud radius r of ST A and ST B is 10 and 15 km, respectively, which is the same as those used in Tan et al. (2007), which facilitates a comparison of the discharge effect of upward lightning in this study to the discharge effect of IC lightning in Tan et al. (2007).
Charge structure Charge regions affected byupward flashes Channel length (km) Induced charge (C) Ric UL 1 Dipole Main negative 8.85 28.8 26.7% UL 2 Tri-pole Lower positive 8.85 −34.4 17.1% Ric: Ratio of the total induced charge on the leader channels to the original charge on the discharge channels. Table 1. Upward leader channel length, induced charge and Ric.
UL 1 is simulated in ST A, where the upward positive leader propagates into the main negative charge region, the channel length of the upward positive leader is 8.85 km, the induced charge is 28.8 C, and Ric is 26.7%. UL 2 is simulated in ST B, where the upward negative leader extends into the bottom positive charge region, the channel length of the upward negative leader is 8.85 km, the induced charge is −34.4 C, and Ric is 17.1%. Comparing these two cases, the results indicate that the channel length of these two cases is the same, and the induced charge of UL 1 is less than that of UL 2, but the Ric of UL 1 is larger than that of UL 2. The main reason is that the thunderstorm corresponding to UL 2 develops vigorously and the thundercloud size is larger than that corresponding to UL 1. The total cloud charge of UL 2 is much more than that of UL 1. Although the induced charge in UL 2 is considerable, it still only accounts for a small proportion of the total cloud charge.
Table 2 provides the statistical characteristics of the simulated 147 upward lightning flashes in ST A and ST B. Among them, 101 upward flashes are from the ST A, and 46 upward flashes are from the ST B. The average channel length of the simulated upward flashes in ST A is 6.26 km, which is obviously smaller than the average length (8.38 km) of the upward lightning flashes obtained in ST B. The main reason is that ST B develops more vigorously, and the average cloud-base height is larger. When upward lightning is initiated in ST B, the range and magnitude of the corresponding bottom charge are usually larger, and the resulting upward leaders fully extend after entering the bottom charge region. The induced charge in the upward positive flashes simulated in ST A ranges from −0.67 to −18.5 C, which is lower than the induced charge in the upward positive flashes simulated in the ST B. Because the upward positive flashes simulated in our model usually propagate into the bottom positive charge region, as mentioned above, the range and magnitude of the bottom charge region in ST B are usually larger, and the intensity of the bottom potential well (potential extremum region) is also stronger, which is conducive to the propagation of upward leaders and neutralization of charge. The induced charge in the upward negative flashes simulated in ST A ranges from 8.03 to 118.8 C, and the average value is slightly larger than that simulated in ST B. The reason is that most of the upward negative flashes simulated in ST A occur under the dipole charge structure, which extend into the main negative charge region. The upward negative flashes simulated in ST B usually occur under the multi-layer charge structure, which propagate into the bottom negative charge region. The range and amount of the charge in the bottom negative charge region are far smaller than those in the main negative charge region. The upward positive leaders in the main negative charge region develop more vigorously and neutralize more charges. The Ric in ST A ranges from 8% to 47.3%, while that in ST B ranges from 5.9% to 17.8%. The average induced charge in all upward flashes simulated in ST A is 18.3 C, and the average value of Ric is 15.8%. In ST B, the average induced charge in all upward flashes is 20.4 C, and the average value of Ric is 12.3%. By analyzing all upward lightning cases simulated by our model, the results reveal that the absolute value of the total induced charge ranges from 0.67 to 118.8 C, the average value of which is 19.0 C, and the Ric ranges from 5.9% to 47.3%, the average value of which is 14.7%. The above results are lower than those of IC lightning in Tan et al. (2007) and consistent with the induced charge obtained by observations in Berger (1977) and Michishita et al. (2019), which also proves that our simulations are reasonable.
Thunderstorm case Frequency of upward flashes Average channel height (km) Induced charge of upward positive flashes (C) Induced charge of upward negative flashes (C) Ric ST A 101 6.26 −0.67 to −18.5 8.03–118.8 8%–47.3% ST B 46 8.38 −15.92 to −76.39 7.75–21.84 5.9%–17.8% Table 2. The Ric and induced charge of all upward lightning.
-
It is generally believed that the energy released during lightning discharge comes from the electrostatic energy stored in the form of the electrostatic field in thunderstorms. How much, though, does an upward flash influence the space potential, electric field and electrostatic energy in thunderclouds? So far, there has been no relevant research. In this section, the effects of an upward flash on the space potential, electric field and electrostatic energy are quantitatively discussed.
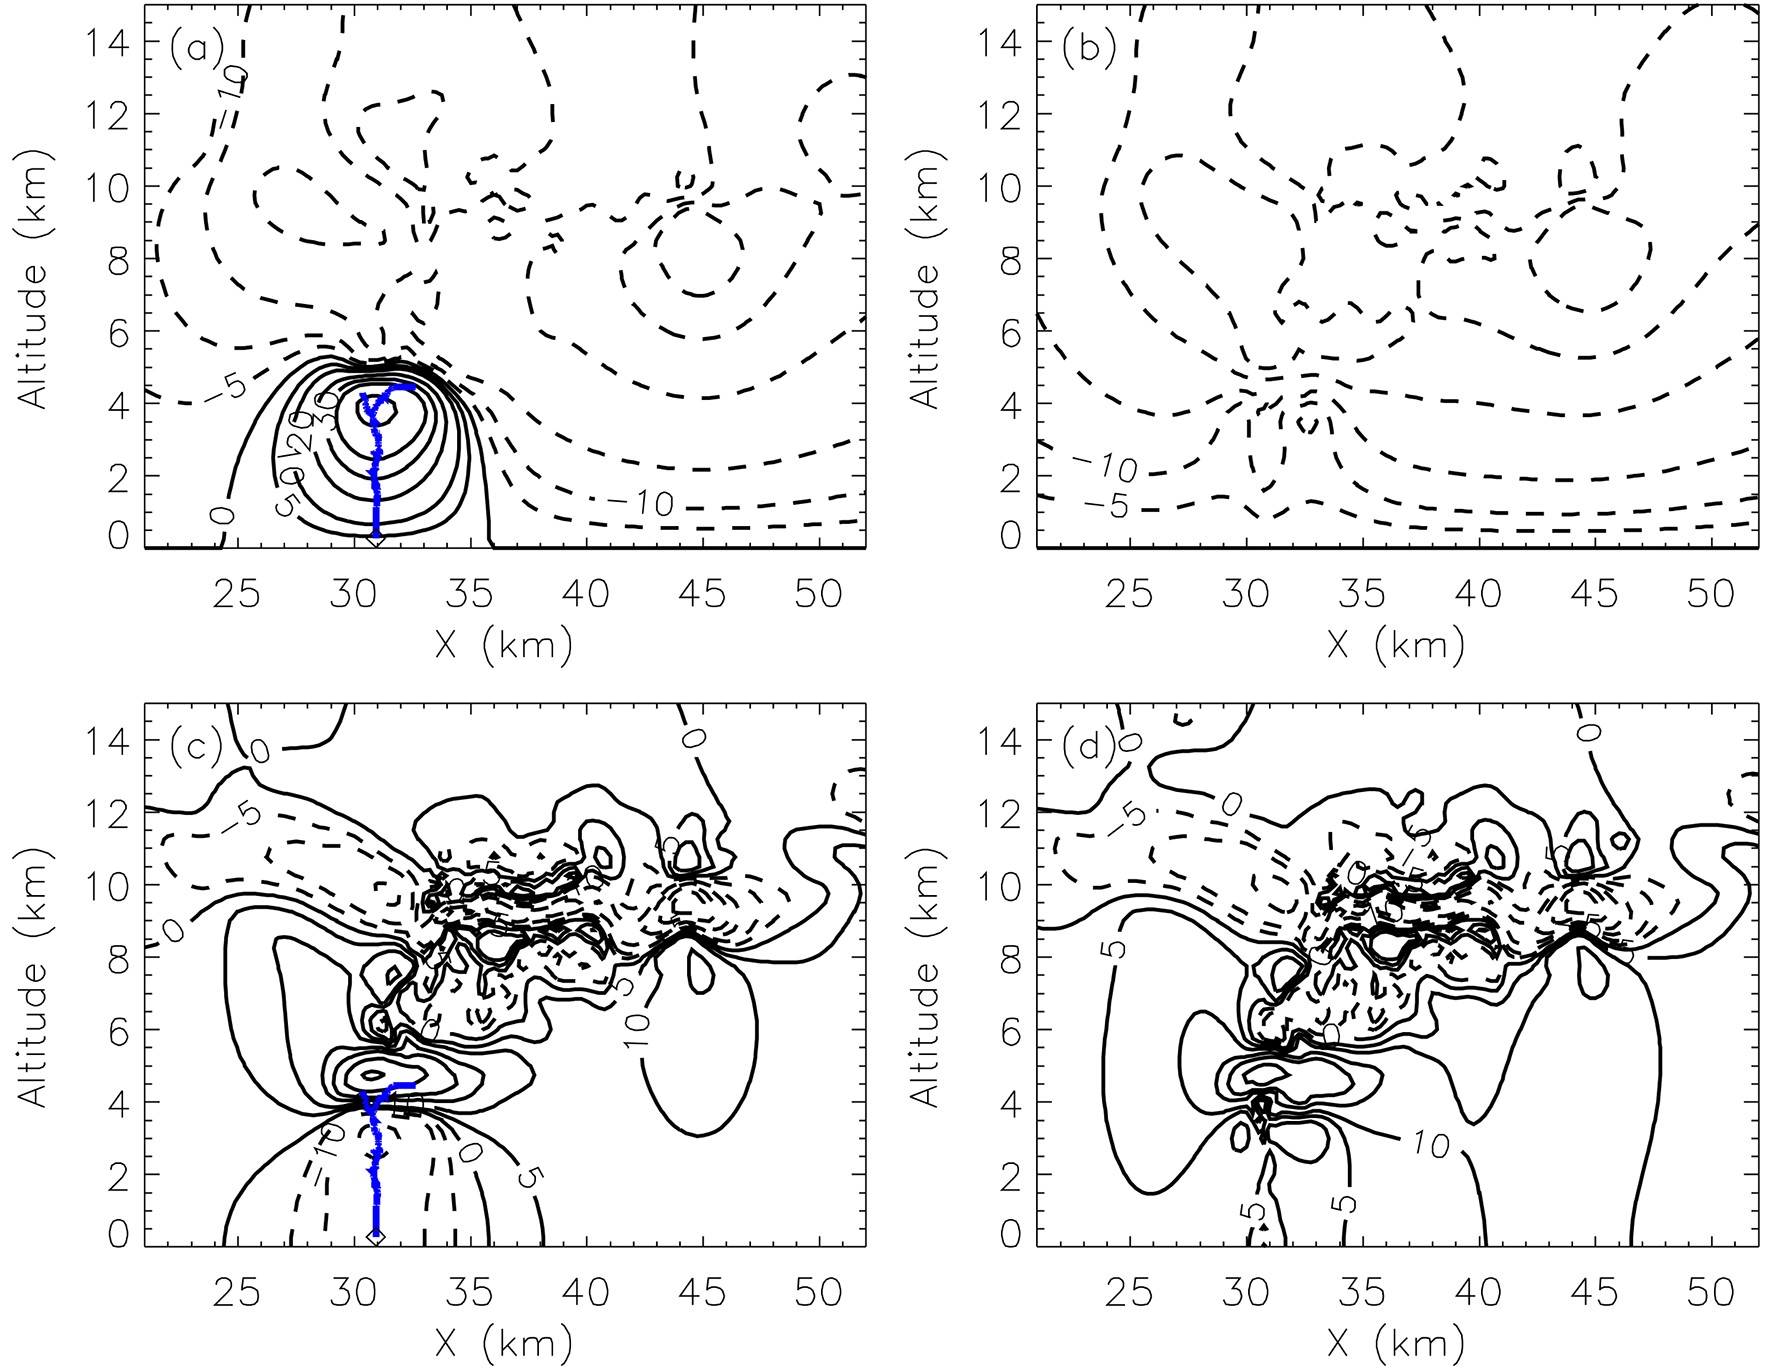
Figure 3 shows the distributions of the space potential and vertical electric field before and after UL 1. Comparing Figures 3a and b, it is found that a negative potential well exists in the bottom space before the upward lightning discharge, and the potential extremum at the center of the potential well is −55.2 MV. After UL 1 enters the negative potential center, the original negative potential well is destroyed, a new potential well with a smaller range is formed at the original position, and the potential at the center of the new potential well changes to −17 MV. Comparing Figures 3c and d, it is found that the vertical electric field distribution is positive, negative and positive from top to bottom before the discharge, and the maximum electric field is located at the junction of the positive and negative charge regions. The maximum electric field in the discharge region is −47.5 kV m−1. After the discharge, the positive electric field area in the bottom space is greatly reduced, and the electric field extremum changes to 14.1 kV m−1.
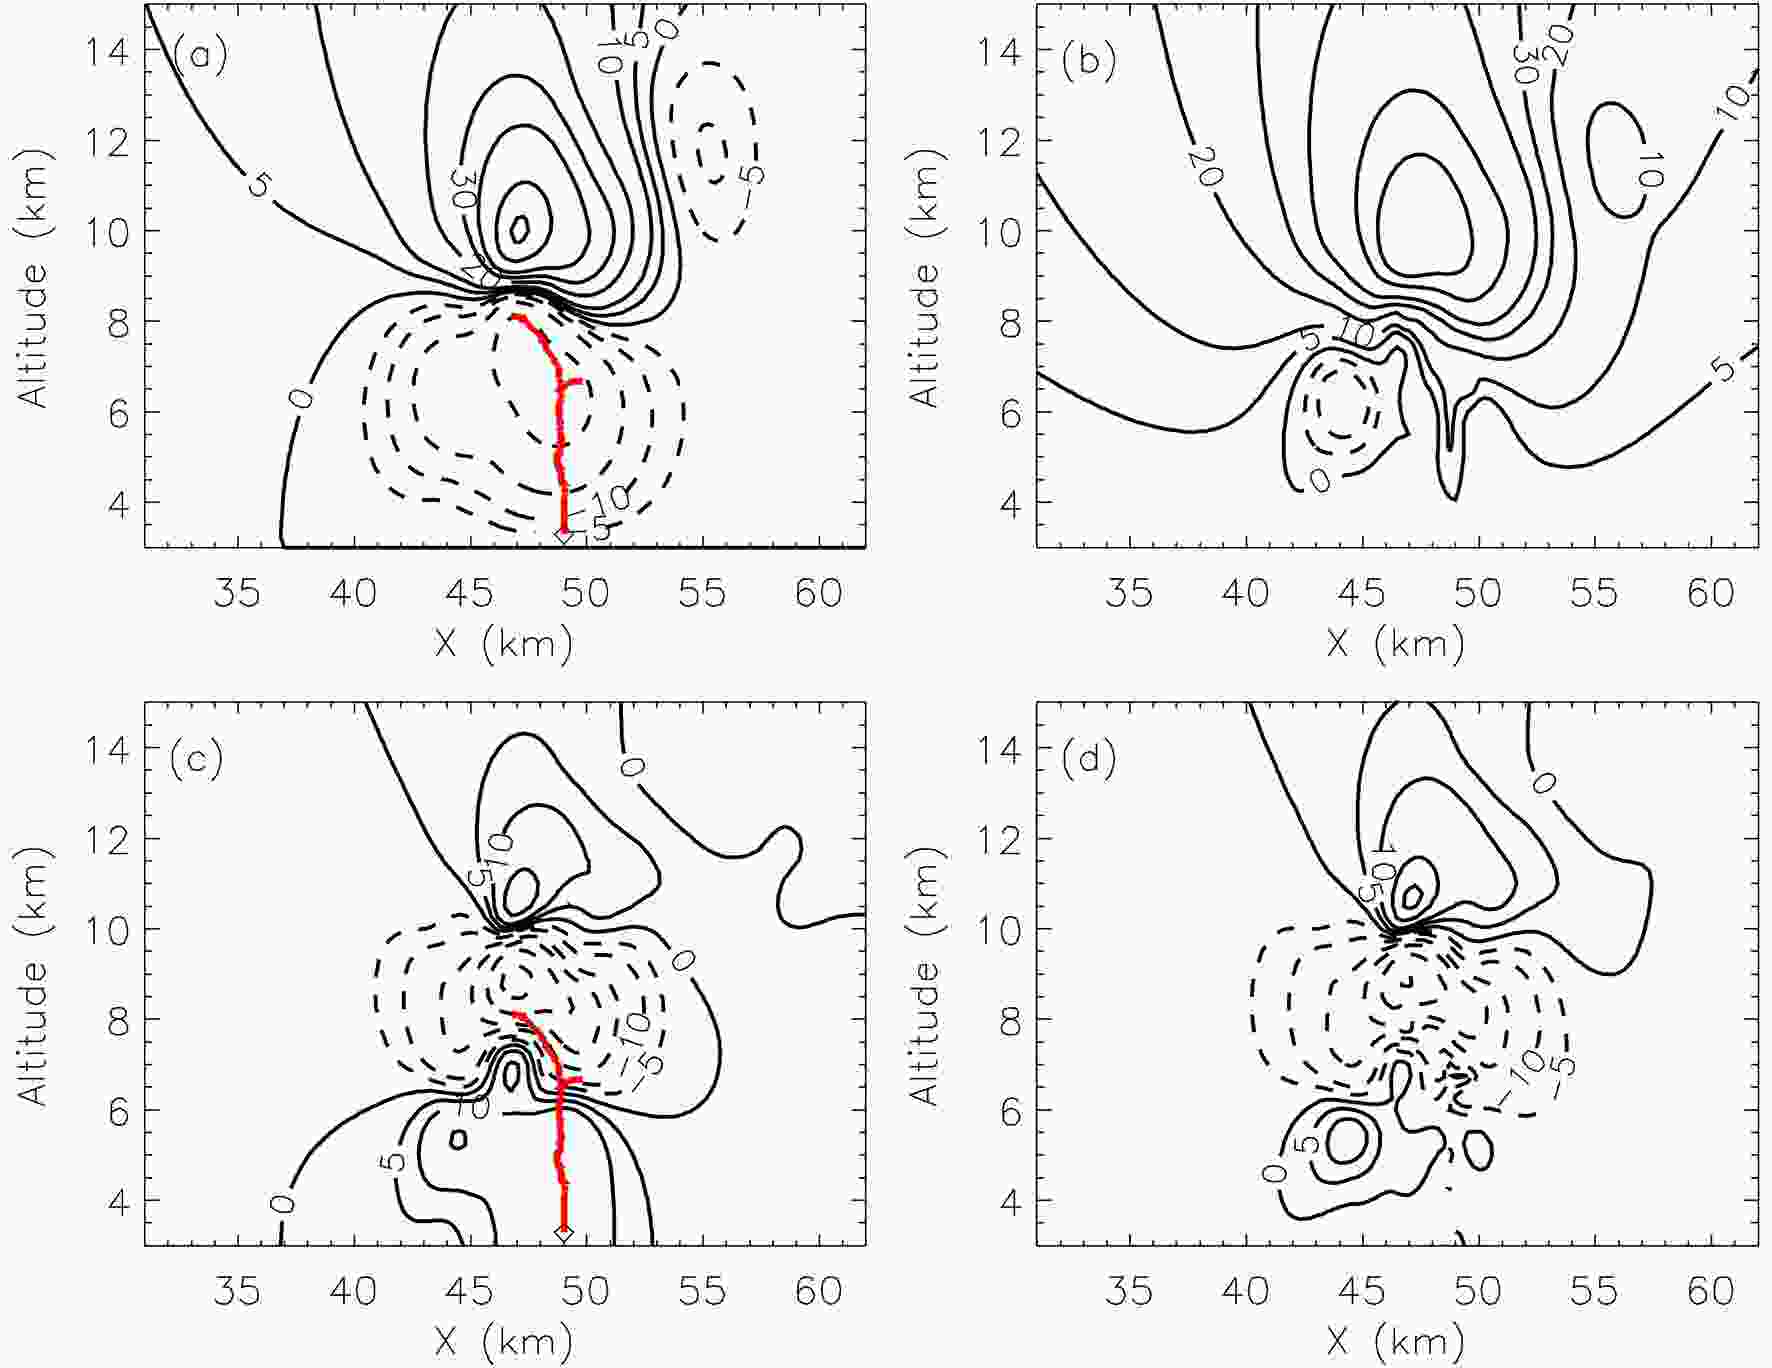
Figure 3. Upward lightning channels and space potential and vertical electric field of UL 1. (a) Upward lightning channel structure and pre-discharge space potential. (b) Post-discharge space potential. (c) Upward lightning channel structure and pre-discharge space electric field. (d) Post-discharge space electric field. In (a, b) the black solid lines represent positive potential and the dashed lines represent negative potential, with the contour values starting at 0 MV. In (c, d) the black solid lines are for positive electric field (physics sign convention) and the dashed lines are for negative electric field, with contour values starting at ±0 kV m−1. The details are the same as those in Fig. 2.
Figure 4 shows the distributions of the space potential and vertical electric field before and after UL 2. Similar to UL 1, a positive potential well exists in the bottom space before the discharge, and the potential extremum at the center of the potential well is 65.9 MV. After the discharge, the original positive potential well is destroyed, a new negative potential well is formed at the original position, and the potential at the center of the new potential well changes to −17.7 MV. Moreover, the vertical electric field extremum in the bottom space before the discharge is −22.4 kV m−1. After the discharge, the direction of the vertical electric field in the discharge area changes from downward to upward, and the electric field extremum changes to 11.4 kV m−1. UL 1 and UL 2 both enter the bottom charge region, thereby destroying the bottom potential wells and even causing the disappearance of the bottom potential wells. Similarly, the space distribution ranges of the bottom electric fields decrease significantly after the discharges, and even the polarity of the electric field reverses.
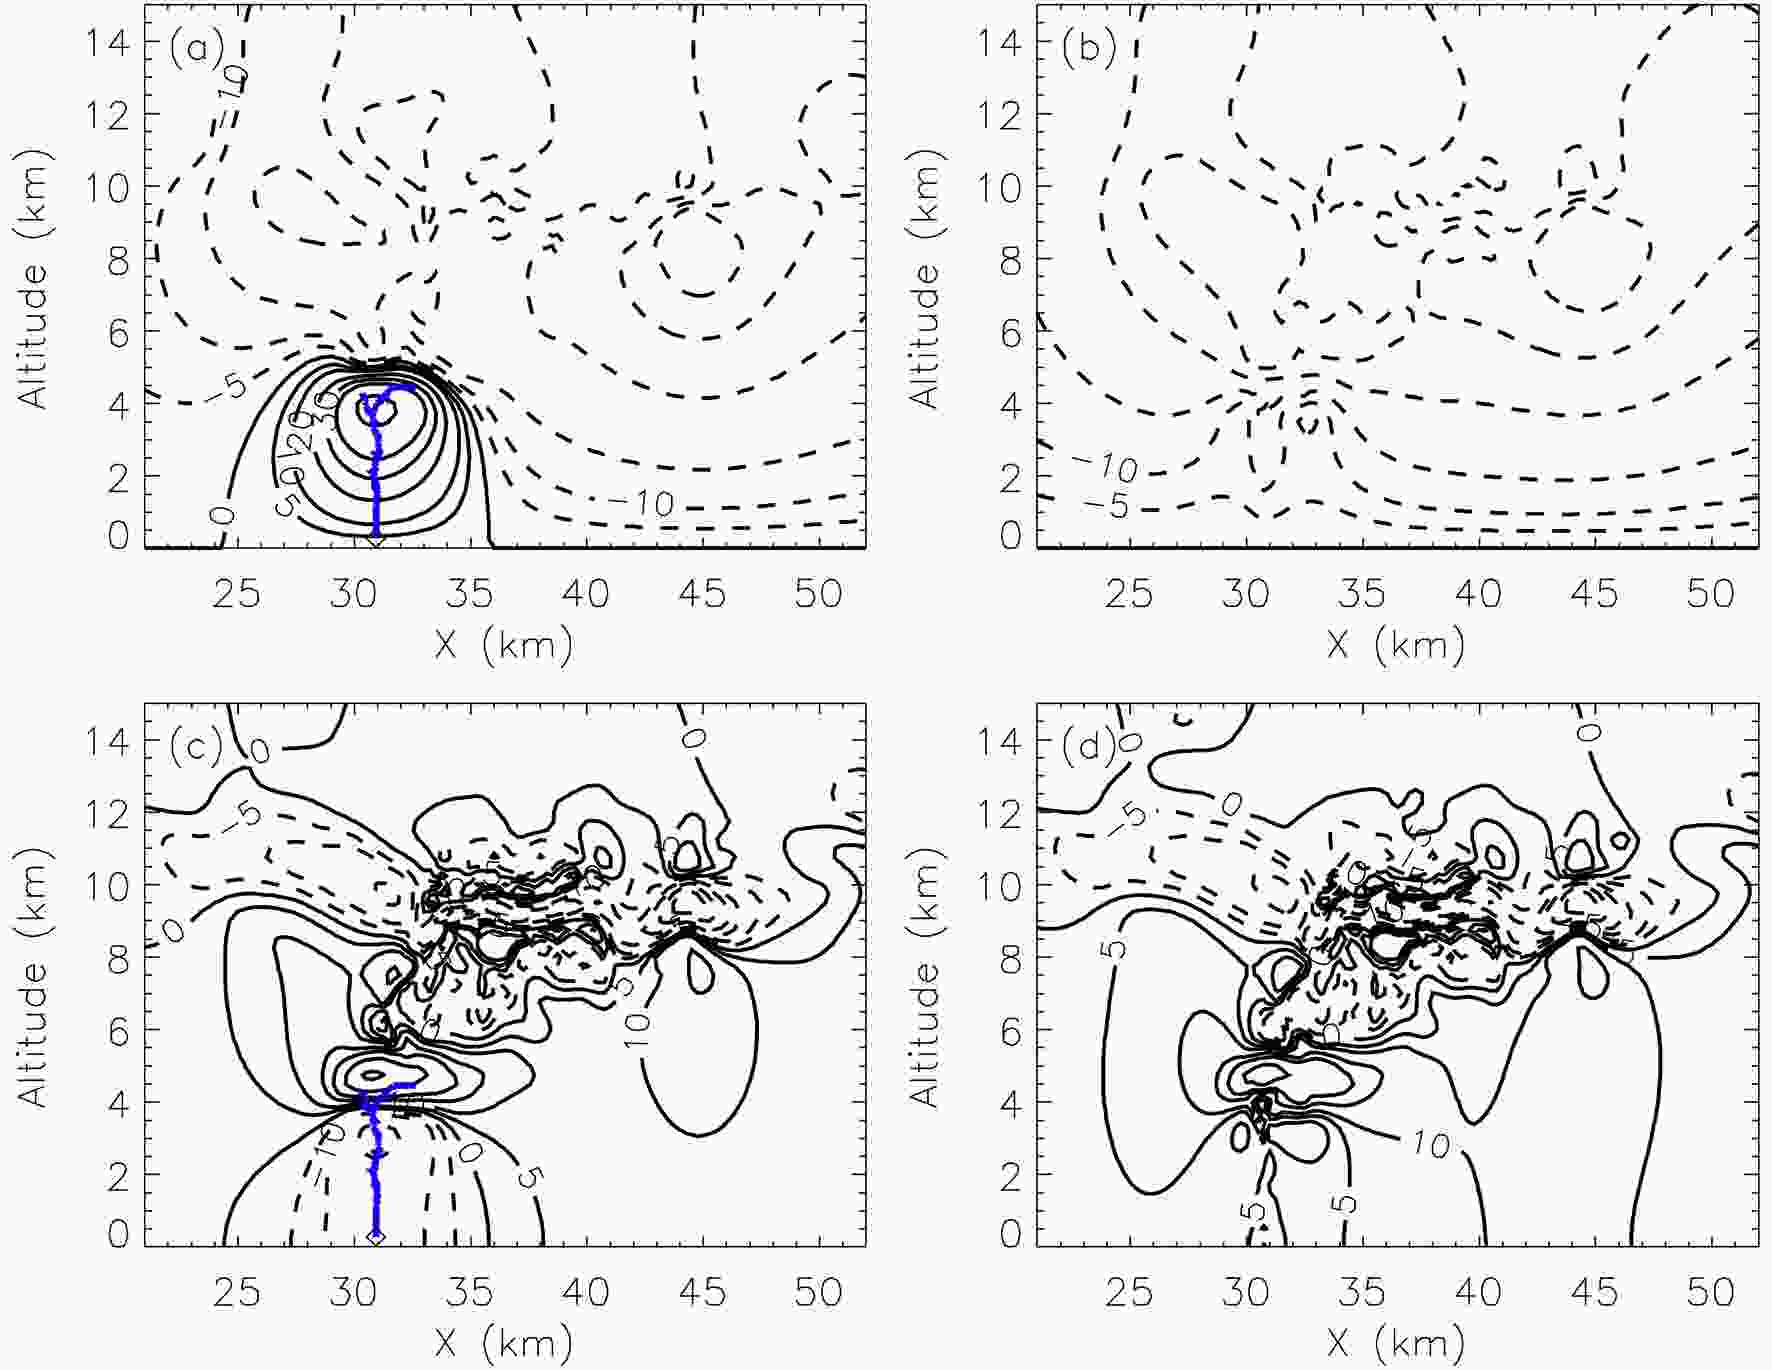
Figure 4. Upward lightning channels and space potential and vertical electric field of UL 2. (a) Upward lightning channel structure and pre-discharge space potential. (b) Post-discharge space potential. (c) Upward lightning channel structure and pre-discharge space electric field. (d) Post-discharge space electric field. The details are the same as those in Fig. 3.
Selecting UL 1 and UL 2 as examples, the maximum variations of the space potential (ΔU) and vertical electric field (ΔE) before and after the discharges are listed in Table 3, where ΔU and ΔE are equal to the value after discharge minus the value before discharge. The ΔU and ΔE caused by UL 1 are 70.2 MV and −26.4 kV m−1, respectively. The ΔU and ΔE caused by UL 2 are −107.4 MV and 29 kV m−1, respectively. In regard to UL 1 and UL 2, the changes of the potential and electric field in the discharge area caused by these two upward flashes are comparable. Compared to the effects of IC lightning reported by Tan et al. (2007), the effects of one upward flash on the space potential and electric field are much smaller [the ΔU and ΔE caused by IC lightning discharge are −215 MV and 139 kV m−1 respectively; these data are from Table 4 in Tan et al. (2007)].
$\Delta $E (kV m−1) $\Delta $U (MV) Pre-discharge eex−z (J m−1) Post-discharge eex−z (J m−1) $\Delta $ee (J) UL 1 −26.4 70.2 2.23×10⁵ 1.93×10⁵ 4.82×10⁸ UL 2 29.0 −107.4 1.55×10⁶ 1.41×10⁶ 3.46×10⁹ Table 3. Pre-discharge and post-discharge maximum changes in the space potential and vertical electric field and the electrostatic energy variation of the two upward lightning cases.
As mentioned above, the space charge around the channel is not immediately neutralized after the upward lightning discharges. Instead, a large amount of induced charge accumulates in the leader channels, and is slowly neutralized by the surrounding space charge through the subsequent turbulent exchange, advection transport, gravity sedimentation, etc. However, the space potential and electric field in the discharge region are immediately destroyed after the upward lightning discharge, and the polarity of the potential and electric field in this region are even reversed. Regardless of the effects of discharge on the charge, potential or electric field, none of these considerations enable a good evaluation of the overall effect of upward lightning discharges. Therefore, the concept of electrostatic energy is introduced here. The density of the electrostatic energy at each point in space (ee) is given as follows:
where ε is the electric permittivity, and E is the electric field at grid points. First, the total electrostatic energy of the simulated surface (eex-z) is calculated, and then the total electrostatic energy in space is calculated by multiplying eex-z and the horizontal range of the cloud. The total electrostatic energy consumed by an upward lightning discharge (Δee) is equal to the total electrostatic energy in space before a discharge minus the total electrostatic energy in space after a discharge.
As indicated in Table 3, the Δee of UL 1 is 4.82×10⁸ J, and that of UL 2 is 3.46×10⁹ J. The average electrostatic energy consumed by upward lightning in ST A is 5.96×10⁸ J, while the average electrostatic energy consumed by upward lightning in ST B is 2.16×10⁹ J, and the average value of all upward lightning is 1.06×10⁹ J. These values are one order lower than the average electrostatic energy consumed by IC lightning. The main reason is that IC lightning belongs to the bidirectional leader discharge, which simultaneously propagates in two charge regions. Therefore, in general, the longer the IC lightning channels are and the larger the action area is, then the greater the amount of neutralized charge there is, and the more significant the influence on the space potential, electric field and electrostatic energy. In addition, IC lightning discharge usually deposits a large number of positive charges in the main negative charge region, which may cause the upward positive leader to pass through the main negative charge region into the upper positive charge region along positive charge deposition channels. This issue will be discussed in further work.
-
The effects of upward lightning discharges are not to neutralize the surrounding space charge immediately, but to deposit the induced charge on the discharge channel and gradually neutralize the surrounding space charge with the subsequent process. In this section, UL 1 is taken as an example to discuss the slow neutralization process of charge on the discharge channel.
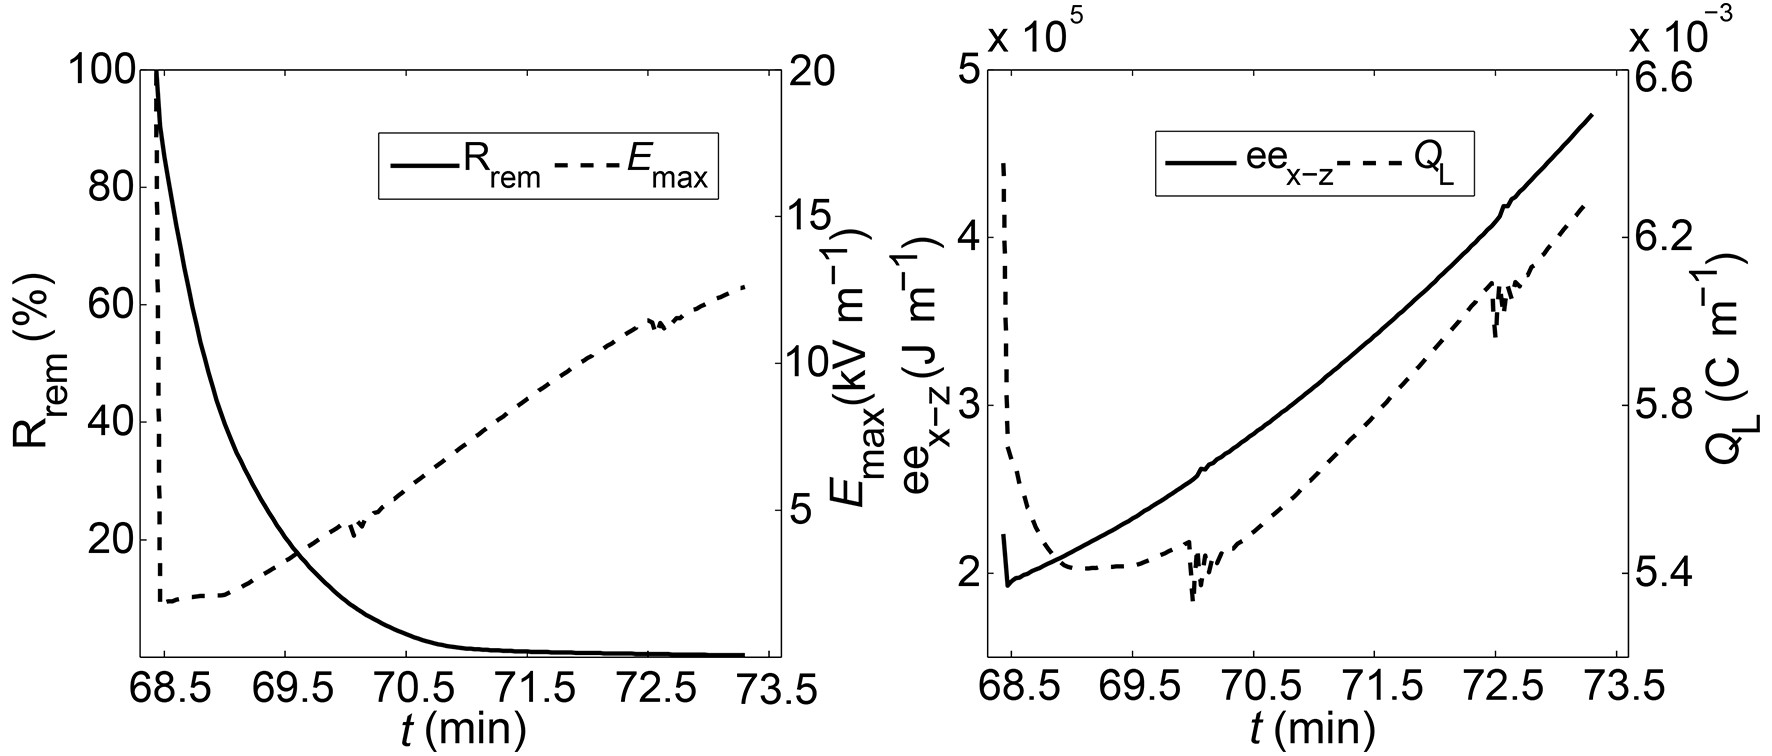
In order to better describe this process, Rrem (defined as the ratio of the residual charge on the channels to the total induced charge on the channels after the discharge), Emax (the maximum vertical electric field in the discharge region), eex−z, and QL (the absolute value of the total charge in the bottom charge region) are introduced. Their changes over time are shown in Fig. 5. After the UL 1 discharge (UL 1 occurs at 68.4 min, which corresponds to the thunderstorm dissipation stage), Emax and eex-z decrease rapidly, and this process lasts tens to hundreds of milliseconds, which is consistent with the duration of a single upward lightning discharge. The subsequent slow rise process corresponds to the reconstruction of the electric field in the cloud, which depends on the turbulent exchange, advection transport, gravity sedimentation and electrification in the cloud. There are obvious differences in this process among different regions, thunderstorms and thunderstorm stages.
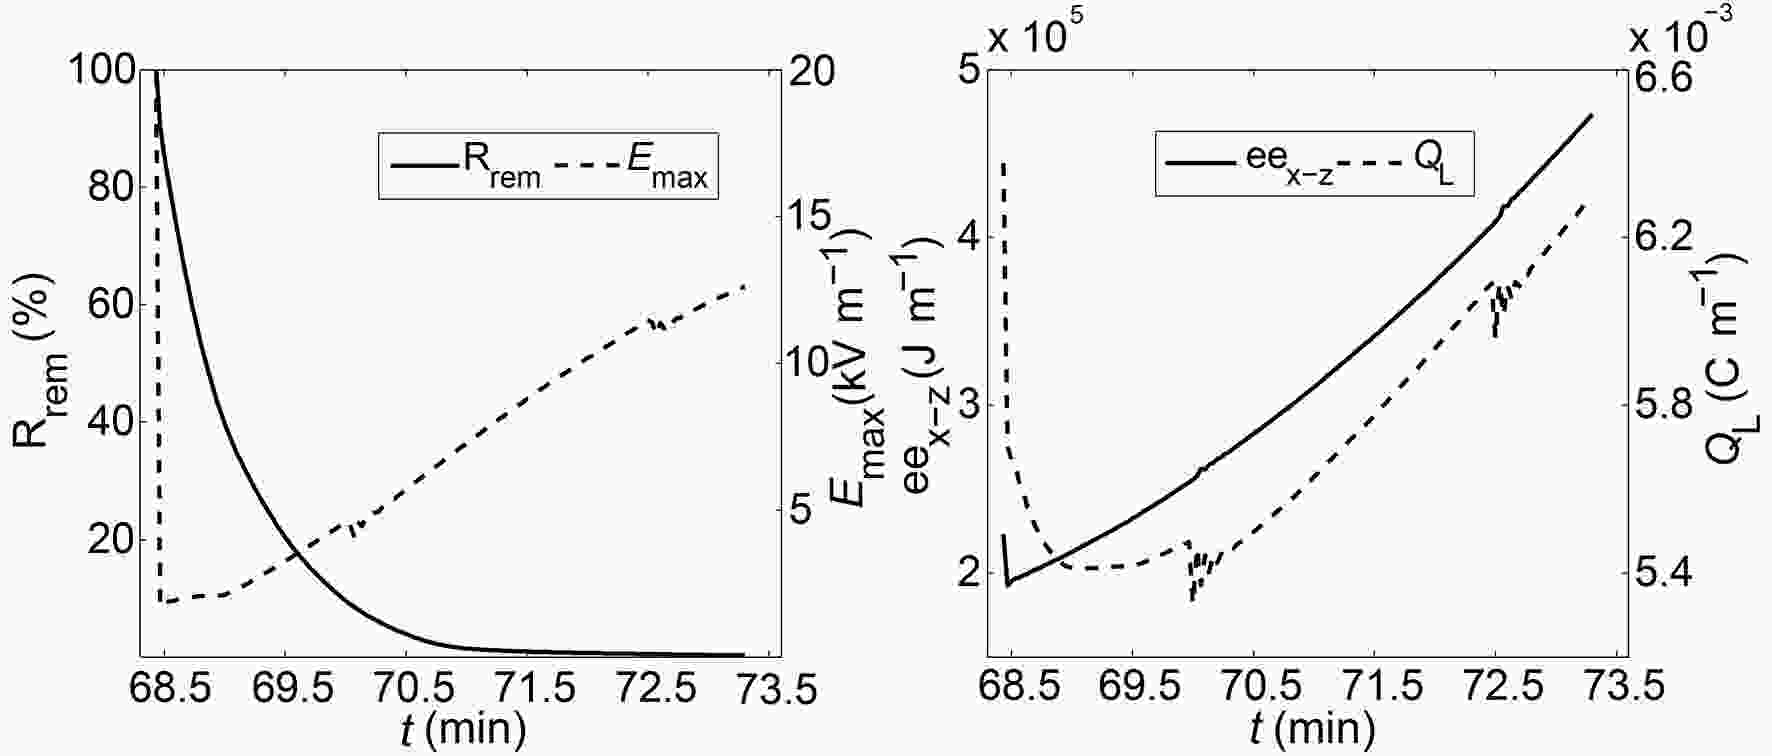
Figure 5. The curves of Rrem, Emax, eex-z and QL between two upward lightning flashes from ST A. (a) The black solid line represents Rrem and the dotted line represents Emax. (b) The black solid line represents eex-z and the dotted line represents QL (absolute value); t is simulation time.
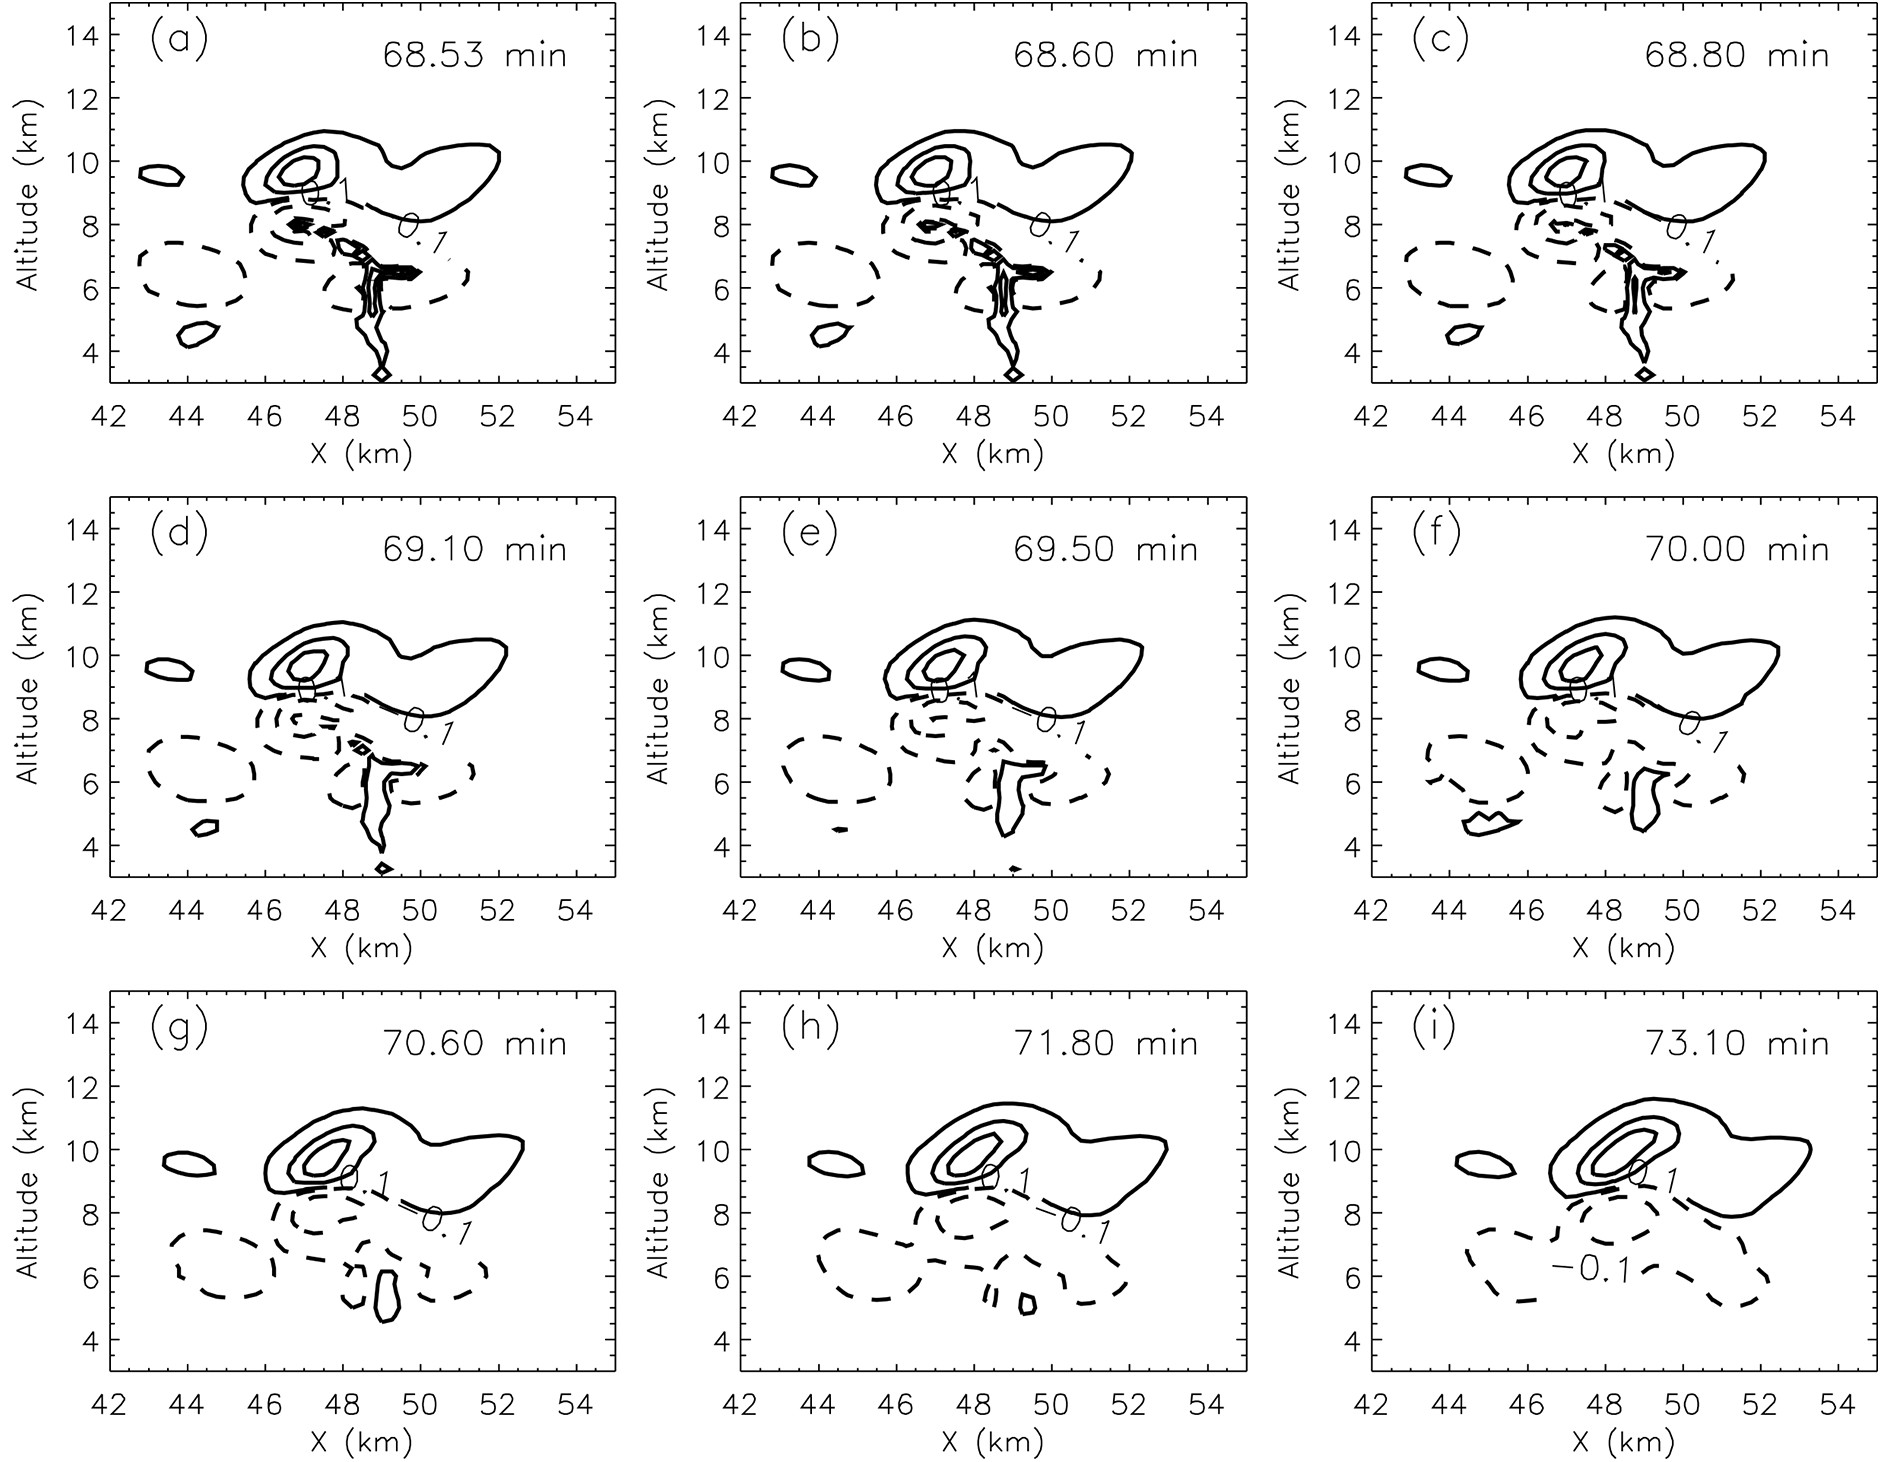
Rrem reflects the degree of neutralization between the induced charge and the space charge around the discharge channels. The lower the Rrem, the more sufficient the induced charge neutralization and the smaller the residual effect of the previous lightning discharge. The time taken to reduce Rrem to 30% is defined as the relaxation time of charge neutralization (τ), and the τ of UL 1 is 48 s. This process is very slow compared to the time of a single upward lightning discharge, which also conforms to the previous analysis. The charge density in the discharge region does not decrease immediately, but with the turbulent exchange, advection transport, gravity sedimentation and electrification, these charges gradually neutralize with the surrounding space charges. It is revealed by the change of QL, as shown in Fig. 5. QL exhibits a large drop after the discharge of UL 1, but in contrast to the rapid rise after Emax and eex−z decline, the decline process of QL lasts 36 s. First, the charge deposited in the discharge channel rapidly neutralizes the surrounding space charge, and then the neutralization process decelerates. Finally, due to the gravity sedimentation and electrification, QL increases gradually, and a new space charge distribution is formed. UL 2 occurs at 46.8 min, which corresponds to the thunderstorm mature stage. The τ of UL 2 is 40 s, which is shorter than that of UL 1. This occurs because the UL 2 discharge is simulated in the plain thunderstorm (ST B) and occurs in the thunderstorm mature stage. The electrification and activity of plain thunderstorms are much higher than those of mountain thunderstorms (UL 1 is simulated in ST A, which belongs to a mountain thunderstorm), and the neutralization process of the induced charges of opposite polarity in the channels for UL 2 is faster. Figure 6 shows the post-discharge space charge distributions at nine different times for UL 1, which reflects the neutralization process of the induced charges and surrounding space charges and the redistribution of the space charges. Combining the changes of Rrem and QL, as shown in Fig. 5, it is found that the neutralization process of the induced charges and surrounding space charges exhibits a sharp deceleration. Rrem decreases from 100% to 65%, which takes 14 s; Rrem decreases from 65% to 30%, which takes 34 s; while Rrem decreases from 30% to 5%, which takes 50 s. Subsequently, it takes nearly 3 min for the positive charge deposited in the discharge channel to be completely neutralized, as shown in Fig. 6. The reason why the positive charge on the discharge channel has decreased and no subsequent increase process occurs is that UL1 occurs at the thunderstorm dissipation stage, and the electrification process can be neglected. Therefore, the induced positive charge deposited in the negative charge area continues to decrease until it is completely neutralized. As shown in Fig. 5, eex−z reaches 4.73×10⁵ J m−1 before the subsequent lightning (the subsequent lightning occurs at 73.3 min), which is twice the electrostatic energy before UL1. This occurs because the subsequent advection transport, gravity sedimentation etc. result in the gradual concentration of the original scattered charges. Although the total charge does not increase, the charge distribution becomes more concentrated and the average charge density increases, which enhances the space electric field and increases the electrostatic energy. Comparing the charge structures shown in Figs. 2a and 6, the charge distribution shown in Fig. 2a as a whole indicates a dipole charge structure. The charge distributions from 68.53 to 71.80 min shown in Fig. 6 exhibit multiple-layer and complex charge structures, and the charge distributions at 73.10 min return to the dipole structure. Coleman et al. (2003) presented that recurring lightning charge deposition increases the complexity of storm charge structures. The induced charge neutralization process shown in Fig. 6 partly verifies the above conclusion. Moreover, the complexity of the charge distribution gradually decreases with the induced charge neutralization process and eventually returns to the classical dipole or tripole charge structure.
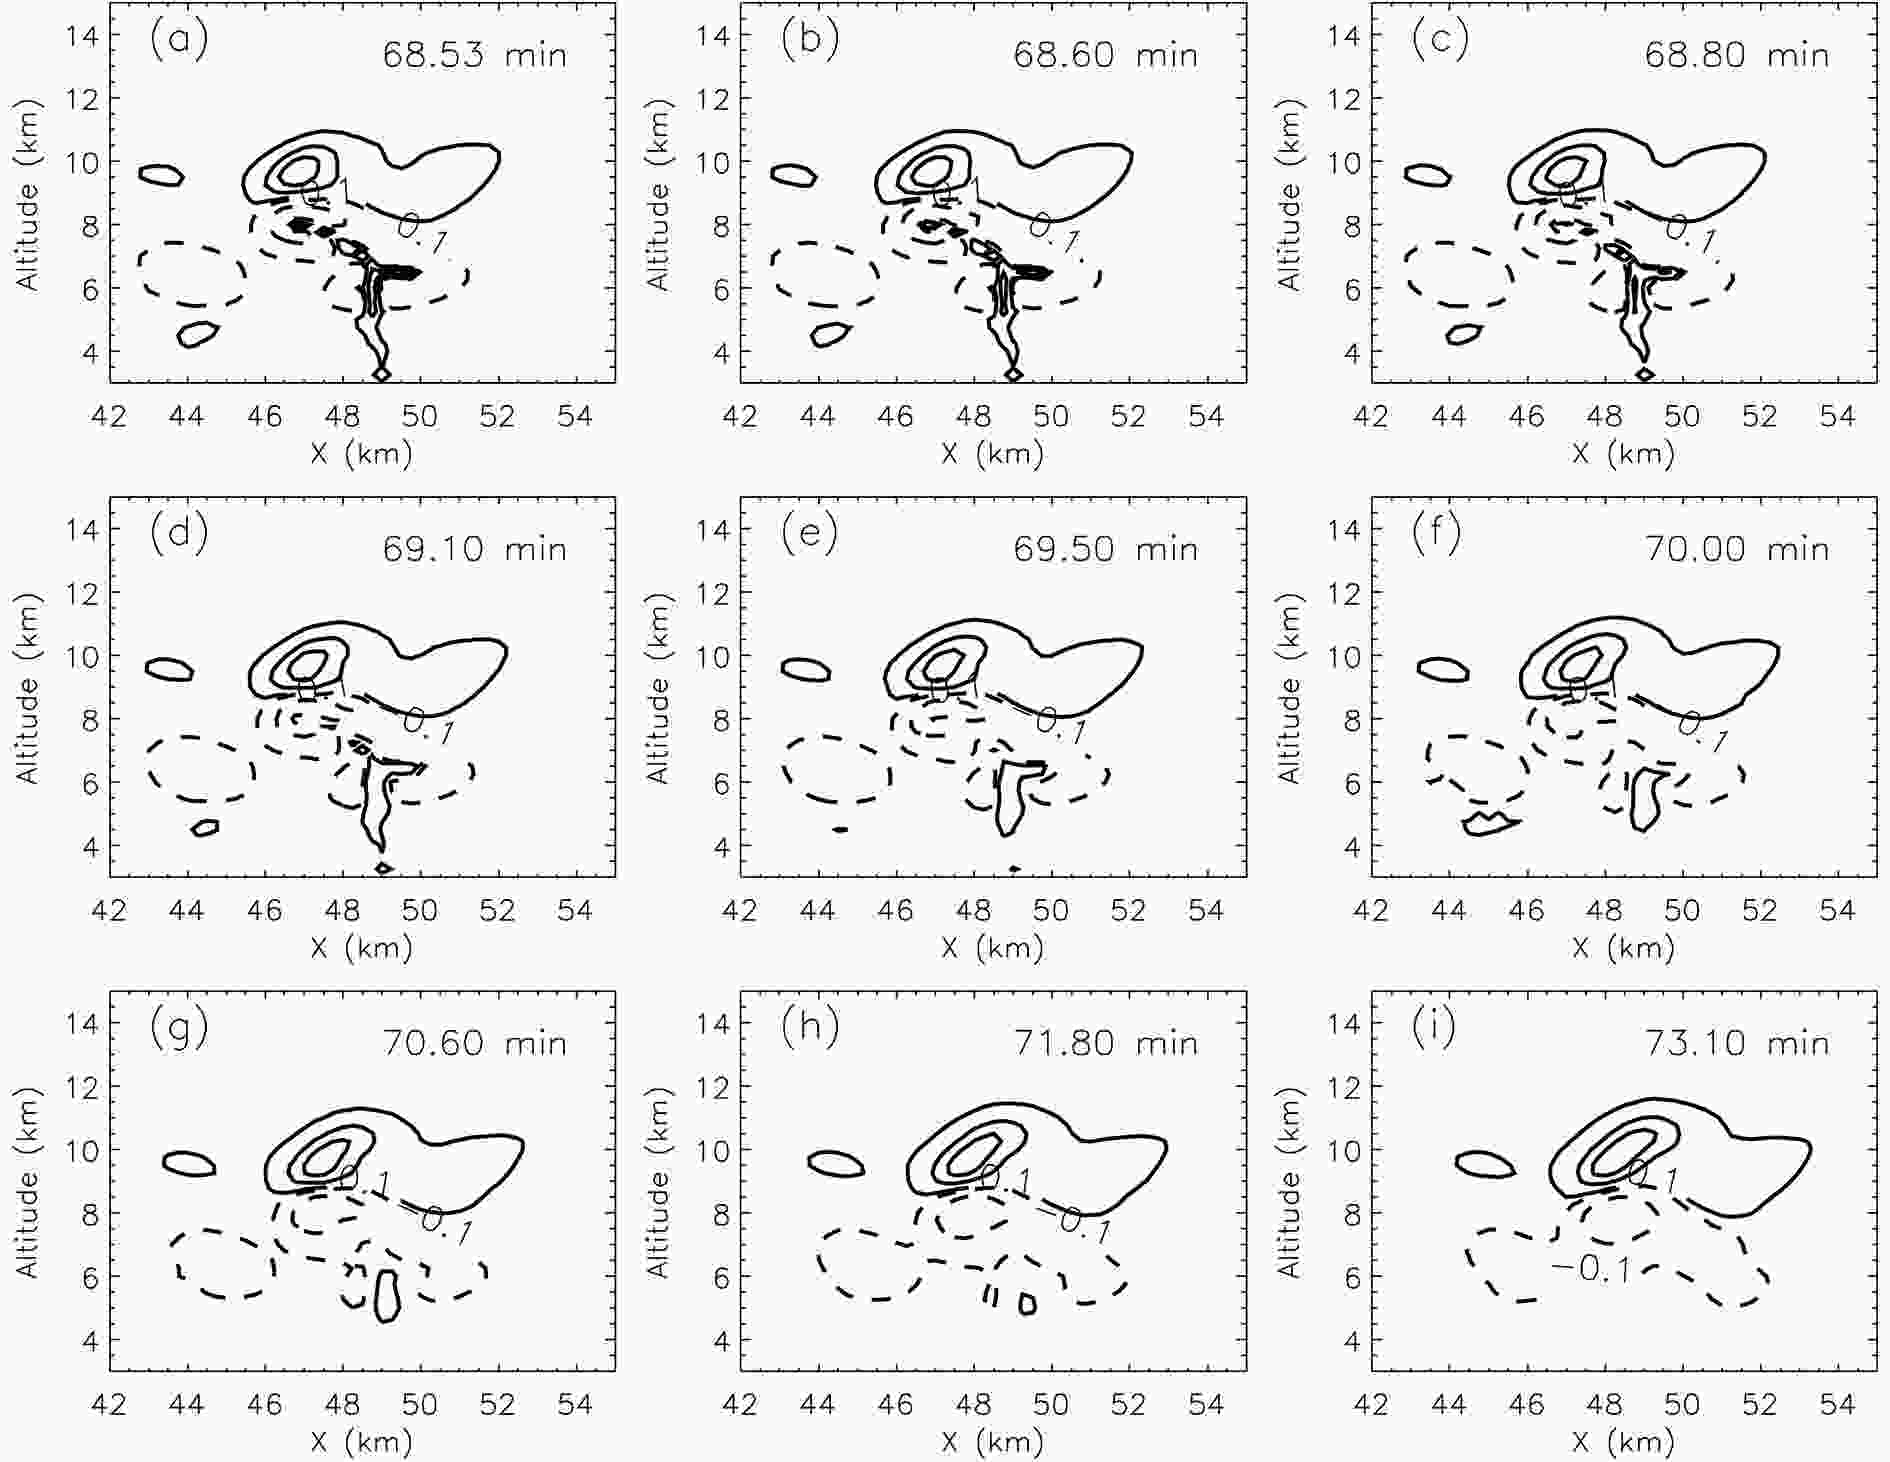
Figure 6. Post-discharge space charge distributions at nine different times for UL 1. The details are the same as those in Fig. 2.
In summary, after a lightning discharge, the impact of upward lightning discharge does not immediately disappear. The induced charges deposited in the discharge channel will gradually neutralize with the surrounding space charges. This process usually lasts tens of seconds or even several minutes, thus forming a new charge distribution and imposing a lasting effect on the subsequent lightning discharge.
3.1. Induced charge on leader channels and space charge redistribution
3.2. Variations of space potential, electric field and electrostatic energy before and after discharge
3.3. Induced charge neutralization and background charge reconstruction
-
In this paper, the discharge effects of upward flashes simulated with a thunderstorm model are discussed. The effects of upward lightning discharge on the space charge, potential, electric field, and electrostatic energy are quantitatively evaluated, and some qualitative conclusions are drawn by analyzing all upward lightning cases. The difference between the discharge effects of upward and IC flashes is analyzed. In addition, the slow neutralization process of the induced charge and surrounding space charge after upward lightning discharges is also studied. The main conclusions are as follows:
The maximum charge density in the bottom charge region before the UL 1 discharge is −1.12 nC m−3, while the maximum positive and negative charge densities in the bottom charge region after the discharge are 1.36 and −1.09 nC m−3, respectively. The maximum charge density in the bottom charge region before the UL 2 discharge is 1.53 nC m−3, while the maximum positive and negative charge densities in the bottom charge region after discharge are 1.45 and −1.72 nC m−3, respectively. Upward lightning discharges do not immediately decrease the charge density in the whole discharge space but implants a considerable amount of induced charge into the leader channel. The estimates of the total induced charge on the upward leader channels range from 0.67 to 118.8 C, and the average value is 19.0 C. The Ric ranges from 5.9% to 47.3%, and the average value is 14.7%.
After the upward lightning discharge, the space potential and electric field in the discharge region change immediately and dramatically, and even the polarity of the space potential and electric field reverse. Taking the two lightning flashes analyzed in this paper as an example, the ΔU and ΔE caused by UL 1 are 70.2 MV and −26.4 kV m−1, respectively, and the ΔU and ΔE caused by UL 2 are −107.4 MV and 29 kV m−1, respectively. The average electrostatic energy consumed by upward lightning discharge is 1.06×10⁹ J. The above effects (including the total induced charge) are all smaller than the discharge effects of IC lightning obtained in Tan et al. (2007). Neutralization of the induced charge is a slow process, which depends on the turbulence exchange, gravity sedimentation, advection transport, electrification, etc. The relaxation times of UL 1 and UL 2 are 48 and 40 s, respectively. During this time, the induced charge on the leader channel decreases to 30% of the original channel charge. This time scale is much longer than that of a single discharge, which indicates that although lightning discharge has ended, it still persistently impacts the reconstruction of the space charge structure, potential and electric field. In addition, lightning charge deposition increases the complexity of the space charge structure, and the complexity gradually decreases with the neutralization process.
All upward lightning cases simulated with the thunderstorm model are all from ST A and ST B, and whether the discharge effects of upward flashes discussed in this paper are universal requires further verification. This also necessitates us to simulate more types of thunderstorms in future studies. In the third section, the relevant analysis on the neutralization of the channel induced charge and the reconstruction of the background charge remains superficial, lacking an in-depth analysis combined with microphysics and electrification processes. Free ion neutralization and ion attachment processes are not considered in our model, which may cause the overestimation of the relaxation time of charge neutralization. An important goal of the next stage is to deepen the understanding of thunderstorm microphysics and electrification and to thoroughly analyze the microphysical mechanism of charge neutralization and reconstruction after lightning discharge.
The research results in this paper are obtained with a 2D model, which only reflects features in the simulation plane. The induced charge and consumed electrostatic energy given in our study are both 3D estimates under the isotropy assumption, and they may be slightly different from real 3D simulation results. The change of space charge structure caused by a single lightning discharge based on a 3D model is much smaller than that based on our model; space charge structures in a 3D model are more complex and the lightning frequency is higher than those in our model, which is more conducive to the discussion of charge neutralization, recovery, and effects on subsequent lightning discharges. Moreover, the 2D model underestimates the intensity of thunderstorm microphysical processes to a certain extent, including turbulence exchange, gravity sedimentation, advection transport, etc. This decelerates the neutralization process between the leader channel charge and the surrounding space charge, thereby overestimating the relaxation time. It is clear that 2D simulations are inevitably idealized and only exhibit lightning characteristics on a profile. However, a significant advantage of 2D models is the option of using fine resolution, which is important to accurately describe the lightning initiation, discharge effect, and lightning morphology. While the computational load of 3D fine-resolution simulations is very high, no such model has yet been developed. Our team has achieved some progress in 3D parallel computing, and we believe a relevant model will be established in the near future.
Comparing IC lightning discharge to CG lightning discharge, the former usually transports charge between the main negative charge region and the upper positive charge region, which does not involve charge exchange between clouds and the ground. CG lightning discharge transfers charge between clouds and the ground. It remains unclear whether this difference causes a major discrepancy in subsequent discharges. Moreover, downward flashes usually transfer charge from the main negative charge region to the ground, while upward flashes mainly neutralize the charge in the bottom charge region. Whether it will also make a difference in the type of subsequent lightning is another open question. These issues are all worthy of further research.
Acknowledgements. This research was supported by the National Key Research and Development Program of China (Grant No. 2017YFC1501504), the National Natural Science Foundation of China (Grant Nos. 41875003, 41805002), and the Open Research Program of the State Key Laboratory of Severe Weather (Grant No. 2019LASW-A03).
 AAS Website
 AAS WeChat