


 DownLoad:


HTML
-
The Orbiting Carbon Observatory-2 (OCO-2) satellite provides quantification of global sources and sinks of atmospheric carbon dioxide (CO2) based on high spatial and temporal sampling of reflected solar radiation (Crisp et al., 2004). The OCO-2 mission helps to solve the carbon budgets on sub-continental or regional spatial scales by delivering space-based column-averaged CO2 dry air mole fraction (XCO2) observations over land and ocean, which cannot be solved solely based on networks of in-situ CO2 sensors (Gurney et al., 2002; Chevallier et al., 2007; Baker et al., 2010). However, the utility of remotely sensed CO2 concentrations from space has stringent requirements on the precision [in the range of 1−10 ppm (0.3%–3.0%) and without significant biases] (Rayner and O'Brien, 2001), which became the key consideration for developing new instruments and algorithms.
In the early stage of space-borne CO2 observation, CO2 measurements were retrieved using a thermal-infrared (IR) algorithm from instruments such as the High Resolution Infrared Sounder 2 (HIRS-2) aboard the NOAA 10 satellite, the Atmospheric Infrared Sounder (AIRS) on the Aqua satellite, and the Infrared Atmospheric Sounding Interferometer (IASI) on the Meteorological Operational Satellite (METOP) (Crevoisier et al., 2004, 2009; Engelen and McNally, 2005). These measurements contribute to the estimation of global CO2 sources and sinks, but lack sensitivity to near-surface CO2 due to the usage of thermal-IR data (Chevallier et al., 2005a, b). Shortwave infrared (SWIR) observations made by the Scanning Imaging Absorption Spectrometer for Atmospheric Chartography (SCIAMACHY) instrument on the Environmental Satellite (ENVISAT), on the other hand, can retrieve CO2 measurements with high near-surface sensitivity (Burrows et al., 1995; Bovensmann et al., 1999). However, it is also noted that there are systematic errors in SCIAMACHY-observed CO2 due to aerosols (Houweling et al., 2005). Therefore, recent instruments have used combined spectral bands to improve the overall performance. For example, the Fourier transform spectrometer (FTS) operating on the Greenhouse-gases Observing Satellite (GOSAT) has three SWIR bands and one thermal-IR band; it also uses a cloud and aerosol imager to constrain scattering interferences (Kuze et al., 2009; Yoshida et al., 2011).
The original OCO instrument was designed to measure the SWIR absorption bands of CO2 at 1.61 and 2.06 μm, as well as the O2A-band at 0.765 μm. After the launch failure in 2009, a re-flight mission was initiated using the same instrument design, which became known as the OCO-2. The algorithm developed for the retrieval of XCO2 from OCO, OCO-2 and new OCO-3 observations has been continuously refined, making it one of the most advanced and widely used algorithms for CO2 study (Connor et al., 2008; O'Dell et al., 2012; Taylor et al., 2016). The algorithm can adapt to analyze observations from other instruments, including SCIAMACHY, GOSAT, and the ground-based FTS (Bösch et al., 2006). Therefore, further optimization and evaluation of the algorithm can benefit the refinement of current retrievals, and also help provide more information for testing and validation.
Collecting approximately 1 million soundings on a daily basis, reliable cloud screening algorithms are essential for both computational efficiency and quality assurance. Currently, the level 2 retrieval algorithm of OCO-2 utilizes a combination of results from two independent cloud screening methods—the A-Band Preprocessor (ABP) method and the Iterative Maximum A Posteriori (IMAP) Differential Optical Absorption Spectroscopy (DOAS) Preprocessor (IDP) method (Mandrake et al., 2013).
The ABP algorithm, developed by Colorado State University, is used for rapid screening of OCO-2 data for cloud or aerosol contamination. The ABP algorithm uses solar radiance spectral data in the 0.76 μm O2A band and ECMWF model. It employs a fast Bayesian retrieval to estimate surface pressure and surface albedo, and minimizes the residual of a simulated and measured spectrum to get a goodness-of-fit (χ2) statistic. The simulated spectra are calculated assuming clear-sky conditions with only molecular Rayleigh scattering present. The χ2 of the residuals between the measured and simulated spectra is calculated as a cost function using Gauss–Newton iteration and five parameters: surface pressure, the offset to an assumed temperature profile, surface albedos at the band beginning and end points, and a wavelength (dispersion) multiplier (O’Dell and Taylor, 2014). Scenes that violate the condition, i.e., having clouds or aerosols, will generally yield large spectral residuals and thus can be identified easily.
The IDP algorithm, on the other hand, uses solar spectra to retrieve the vertical column density (VCD) of the gas molecules (CO2 and H2O) in the 1.61 μm (weak) and 2.06 μm (strong) CO2 bands (Frankenberg et al., 2005). The ratio of the VCD between the weak band and the strong band should approach unity in the absence of clouds or aerosols, which in reality is centered around 0.99 due to imperfect spectroscopy (Mandrake et al., 2013). Scenes that apparently diverge from unity are affected by clouds or aerosols, which have the ability to significantly alter the distribution of the light paths, thus biasing the retrieved column properties, surface reflectance and other parameters by up to a few percent (Rayner and O'Brien, 2001).
As preprocessors, both methods aim to efficiently identify scenes, or soundings, containing significant amounts of clouds and/or aerosols. However, some contaminated scenes might pass the filter due to the loosely set thresholds (Taylor et al., 2016). Cloud or aerosol contamination can lead to failure in accurately retrieving XCO2 and, consequently, influence the identification of regional sources and sinks (Miller et al., 2007; Connor et al., 2016; Wunch et al., 2017). If the measured radiances are significantly impacted by scattering due to clouds and aerosols, XCO2 retrievals are unlikely to converge; even if the impacts are rather modest, i.e., with a total optical depth (TOD) ≤ 0.3, they can still introduce biases in the XCO2 retrievals (Butz et al., 2011; O'Dell et al., 2012; Guerlet et al., 2013). Previous studies suggest that both the ABP and IDP methods are reasonably effective at identifying high clouds (O'Dell et al., 2012; Taylor et al., 2012, 2016). In addition, the combination of the two methods could reduce the misidentification of low clouds by one third (O'Dell et al., 2012; Taylor et al., 2012, 2016). However, comparison with collocated profiles measured by the Cloud-Aerosol Lidar with Orthogonal Polarization (CALIOP) shows that more than 40% of the low clouds with TOD > 1 at 532 nm might pass both screeners (Taylor et al., 2016).
In this work, a method to tighten the cloud screening thresholds based on local conditions is used to provide more stringent schemes for OCO-2 cloud screening algorithms. The method aims to provide fast adaptation to regional conditions, reducing the inflation in the operational algorithms caused by loose thresholds setting and unified application over the globe. The same inputs as the ABP and IDP algorithms are utilized (listed in the data section) to provide an independent set of cloud detection results. One year of measurements in 2016 (from 1 December 2015 to 30 November 2016) collected over Europe are used for the study. OCO-2 cloud screening results are compared directly to the cloud mask from collocated Moderate Resolution Imaging Spectrometer (MODIS) products. The threshold parameters currently used by the OCO-2 algorithm are tuned until the overall passing rate is decreased from 20%–25% of all soundings to a close match of the clear-sky fraction observed by MODIS. By design, the narrowed range of thresholds increases the agreement with MODIS cloud screening results, thereby increasing the quality assurance of XCO2 retrievals, at a cost of a certain decrease in the number of soundings passing the screeners.
This paper is organized as follows. Section 2 provides a brief background on the cloud screening algorithm of OCO-2, and a list of datasets from different satellite sensors and ground-based sites used in this work. Section 3 describes the procedure for comparing collocated OCO-2 and MODIS measurements, optimizing the threshold parameters, and adapting to monthly variations. Section 4 presents the results and analysis of re-screened OCO-2 measurements, including comparison with the MODIS cloud mask, as well as XCO2 retrievals from Total Carbon Column Observing Network (TCCON) sites. The optimization scheme is also confirmed with one year of data in Japan. Section 5 concludes the paper.
-
Figure 1 shows a conceptual diagram of this work. The flowchart is detailed in the following sections. In summary, a one-year period of OCO-2 data from December 2015 to November 2016 is used in this study. The dataset is generally referred to as a 2016 dataset, as the December from the previous year is only included for a complete winter season. The data cover a selected area in Europe, consisting of land within 10°–50°W longitude and 30°–60°N latitude. The area was chosen for its relatively high density of TCCON sites, making it more convenient for collocated comparison. Observations over water are not considered in this work, since validation against measurements from TCCON sites would be difficult. We combined observations made in Nadir mode and Glint mode because they use the same thresholds over land. Focused analysis is made based on two monthly datasets, in January and July, which lead to configuration of trends between threshold parameters and cloud screening results, further discussed in section 3.
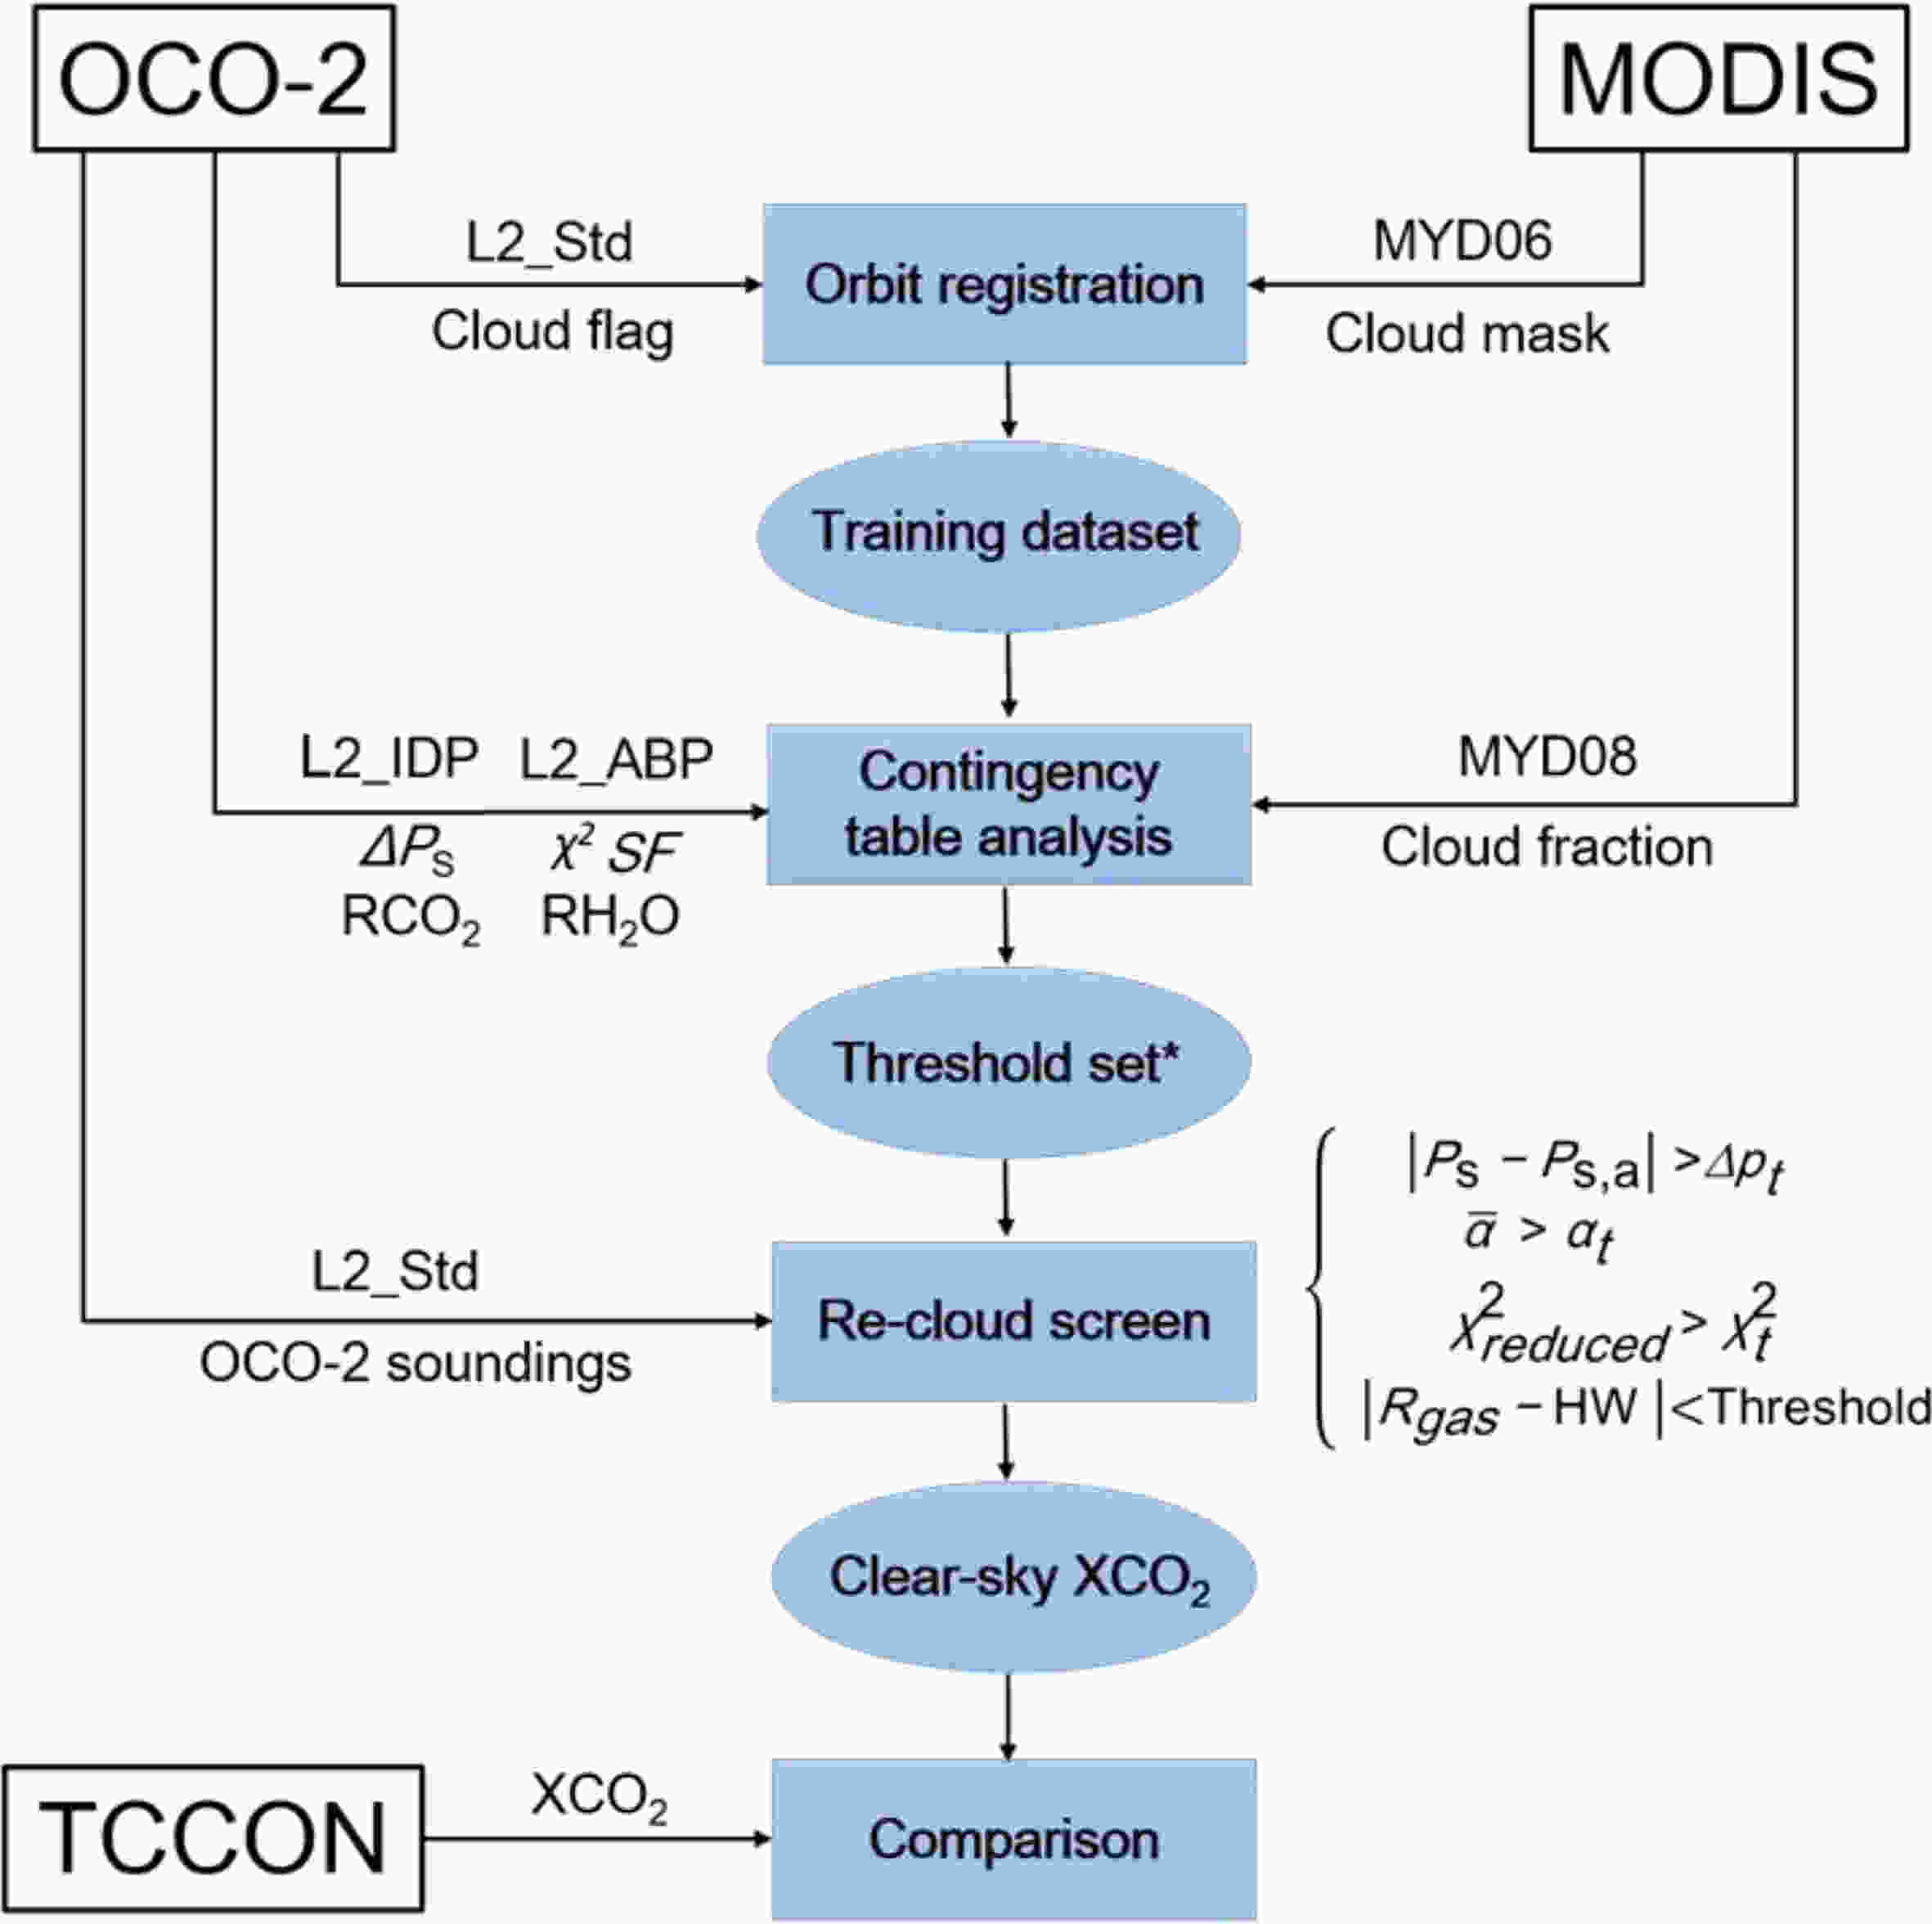
Figure 1. Conceptual diagram of the proposed optimization scheme of the OCO-2 cloud screening algorithm.
-
The OCO-2 satellite carries a single instrument incorporating three co-bore sighted, long-slit imaging grating spectrometers optimized for the O2A band at 0.765 μm and the CO2 bands at 1.61 and 2.06 μm (Crisp et al., 2004). Flying in a 705-km sun-synchronous polar orbit at a repeat cycle of 16 days, the footprint of OCO-2 has a resolution of about 1.3 km across-track and 2.3 km along-track. OCO-2 is a member of the A-Train constellation, which allows it to collect synergistic measurements with other members in close proximity.
The OCO-2 instrument functions on the daylight side of the orbit, operating in either Nadir, Glint or Target mode. In Nadir mode, the instrument provides the highest spatial resolution by looking straight down to Earth and collecting data along the ground track. In Glint mode, the instrument is pointed toward the bright glint spot where solar radiation is specularly reflected off the surface. The primary purpose of Glint mode is to provide higher SNR over the ocean, which could be 100 times higher than observations in Nadir mode at high latitudes. The Target mode is mainly used for calibration over specific ground sites, and therefore it is not discussed further in this work.
The OCO-2 products used here include Level 2 spatially ordered geolocated retrievals screened using the A-band Preprocessor (OCO2_L2_ABand), Level 2 spatially ordered geolocated retrievals screened using the IMAP-DOAS Preprocessor (OCO2_L2_IMAPDOAS), and Level 2 geolocated XCO2 retrievals results (OCO2_L2_Standard) (Gunson and Eldering, 2014a, b, c). All the products are from Version 8, retrospective processing (8r). The data from OCO-2 are available at
https://daac.gsfc.nasa.gov/ .A brief introduction is given below for the specific dataset utilized in the work.
-
From A-band products, primary screening parameters such as surface pressure, surface albedo, and reduced χ2 values near 0.765 μm are used for comparison with collocated MODIS products and optimization of threshold parameters. The surface pressure parameter gives the difference between the surface pressure estimated by the ECMWF and that retrieved from satellite observation. It is calculated as
where s indicates the surface and a indicates a model priori value. More specifically, the ECMWF estimate is a linear interpolation in time and space of modeled surface pressure with a 0.25° spatial and 3-h temporal resolution. Correction for an offset from path length dependence due to imperfect spectroscopy used in the retrieval algorithm is also taken into account. The surface albedo parameter is the average of retrieved surface albedos at 0.755 μm and 0.785 μm. The reduced χ2 value is a goodness-of-fit parameter of the fast retrievals. The results of filtering with these three parameters are summarized into a cloud flag product.
-
From this dataset, independently retrieved VCDs of CO2 and H2O in the strong CO2 band and weak CO2 band are used. The ratios of measured values in the weak and strong band are the primary parameters to categorize scenes as cloudy or clear.
-
The retrieved XCO2 and associated uncertainties are used for comparison with measurements at TCCON stations.
-
The MODIS instrument provides calibrated radiances in 36 spectral bands ranging in wavelength from 0.4 μm to 14.4 μm, which are used to infer many key properties of clouds and aerosols (Kaufman et al., 2002; Minnis et al., 2008). The instrument aboard the Aqua satellite, also a member of the A-Train, provides collocated measurements with OCO-2. The MODIS products used include MYD03, MYD06_L2, and MYD08. MYD03 provides latitude and longitude at a 1 km resolution for collocating with OCO-2. MYD06 provides the cloud mask and other cloud properties used for analysis. MYD08 provides the monthly averaged cloud fraction at a 0.5° × 0.5° resolution. It is noted that the comparisons in this study are in reference to MODIS as truth. This assumption could be affected by the uncertainty of MODIS cloud screening products, which is a function of instrument noise in the channels and the magnitude of the correction that is necessary due to surface spectral radiative properties, as well as atmospheric moisture and/or aerosol reflection contributions (Minnis et al., 2008). The data from MODIS are available at
https://ladsweb.modaps.eosdis.nasa.gov/ . -
TCCON is a network of ground-based FTSs recording near-IR direct solar spectra (Wunch et al., 2011, 2017). TCCON data are widely used as the most accurate and precise retrieval of column-averaged abundance of CO2, CH4, H2O and other trace gases, providing a validation resource for the OCO, SCIAMACHY, and GOSAT projects (Morino et al., 2011; Reuter et al., 2011; Thompson et al., 2012).
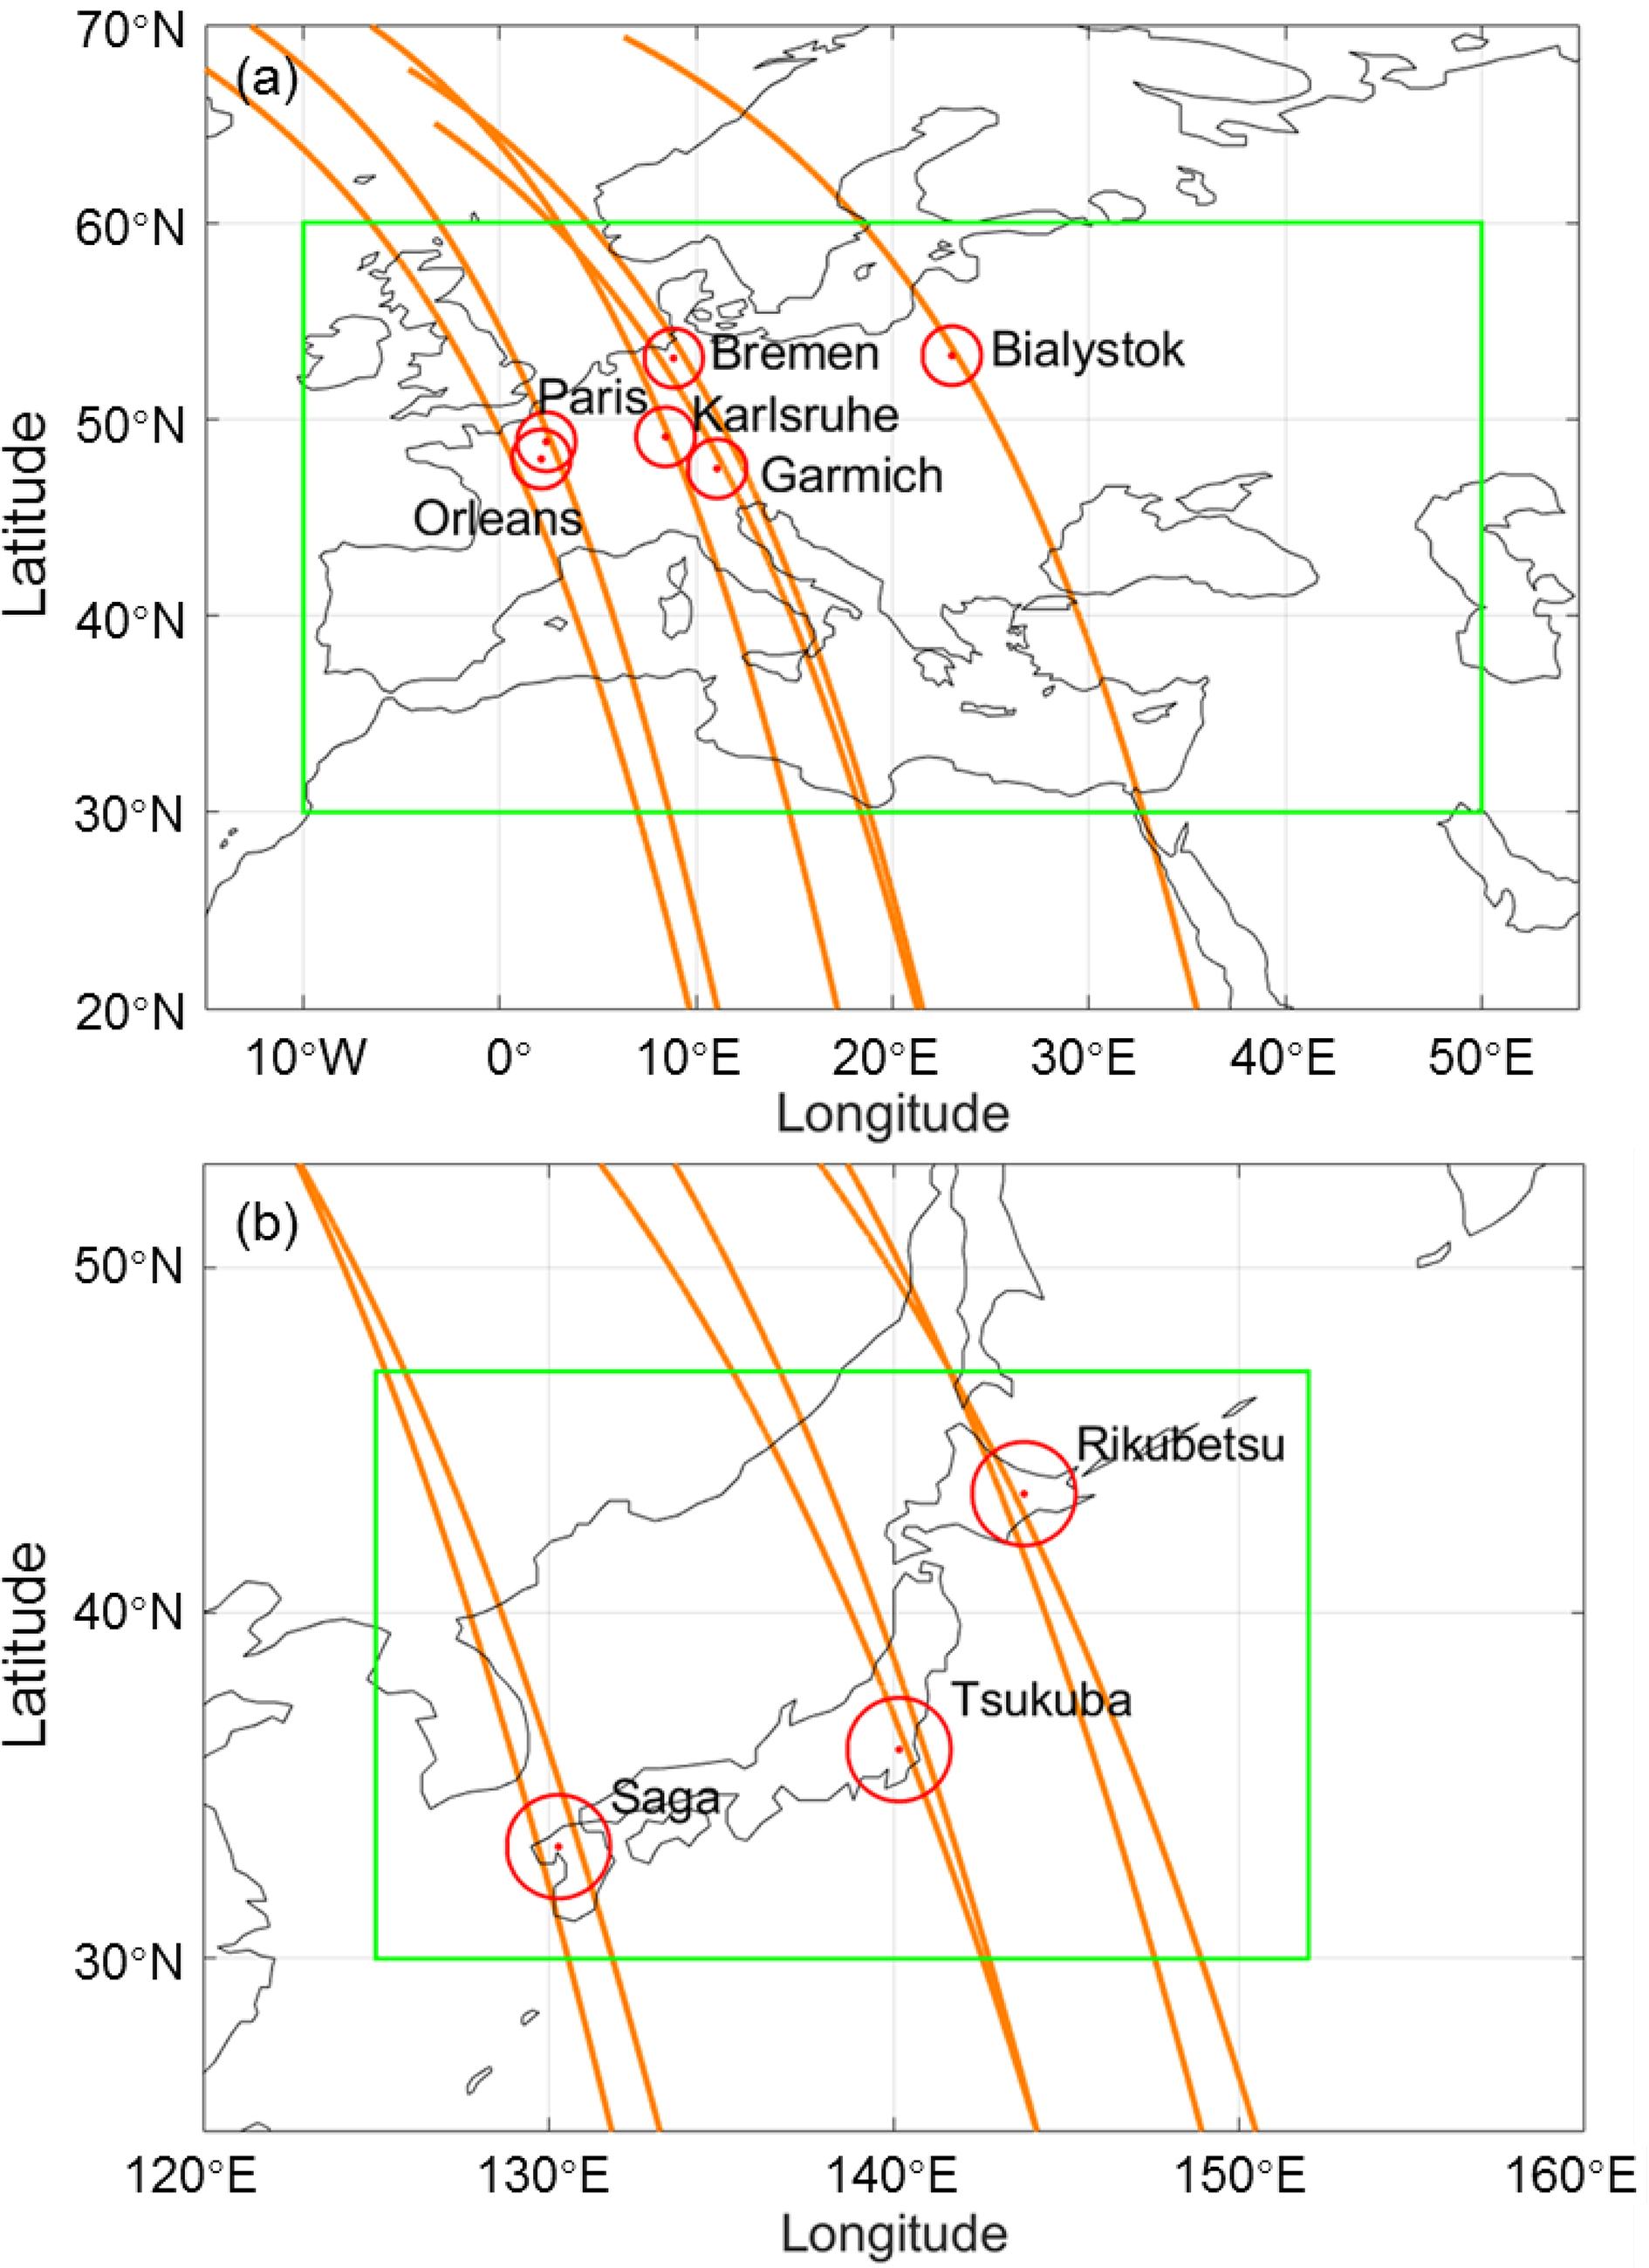
Data from six TCCON sites in Europe, including Bialystok (53.23°N, 23.025°E), Bremen (53.10°N, 8.85°E), Garmisch (47.48°N, 11.06°E), Karlsruhe (49.10°N, 8.44°E), Orleans (47.97°N, 2.113°E), and Paris (48.846°N, 2.356°E), are utilized in this work. In 2016, these sites collected 68 590 measurements in total, covering 324 days in the year. Most of these measurements were made in summer (June–July–August), while fewest measurements were made during winter (December–January–February), likely due to the high cloud fraction, surface snow cover, and limited sunlight hours.
To compare original and re-screened OCO-2 XCO2 retrievals with TCCON records, temporal and spatial averaging is necessary (Fig. 2). The average of OCO-2 XCO2 retrievals within a 200 km radius from the specific site was compared to the daily average of XCO2 measured by that TCCON site. The range is chosen to provide sufficient measurements for comparison, yet can be assumed to have relatively constant XCO2 within the range. A similar range was applied in Liang et al. (2017). In total, 143 comparison pairs were made, covering 111 days in the one-year period.
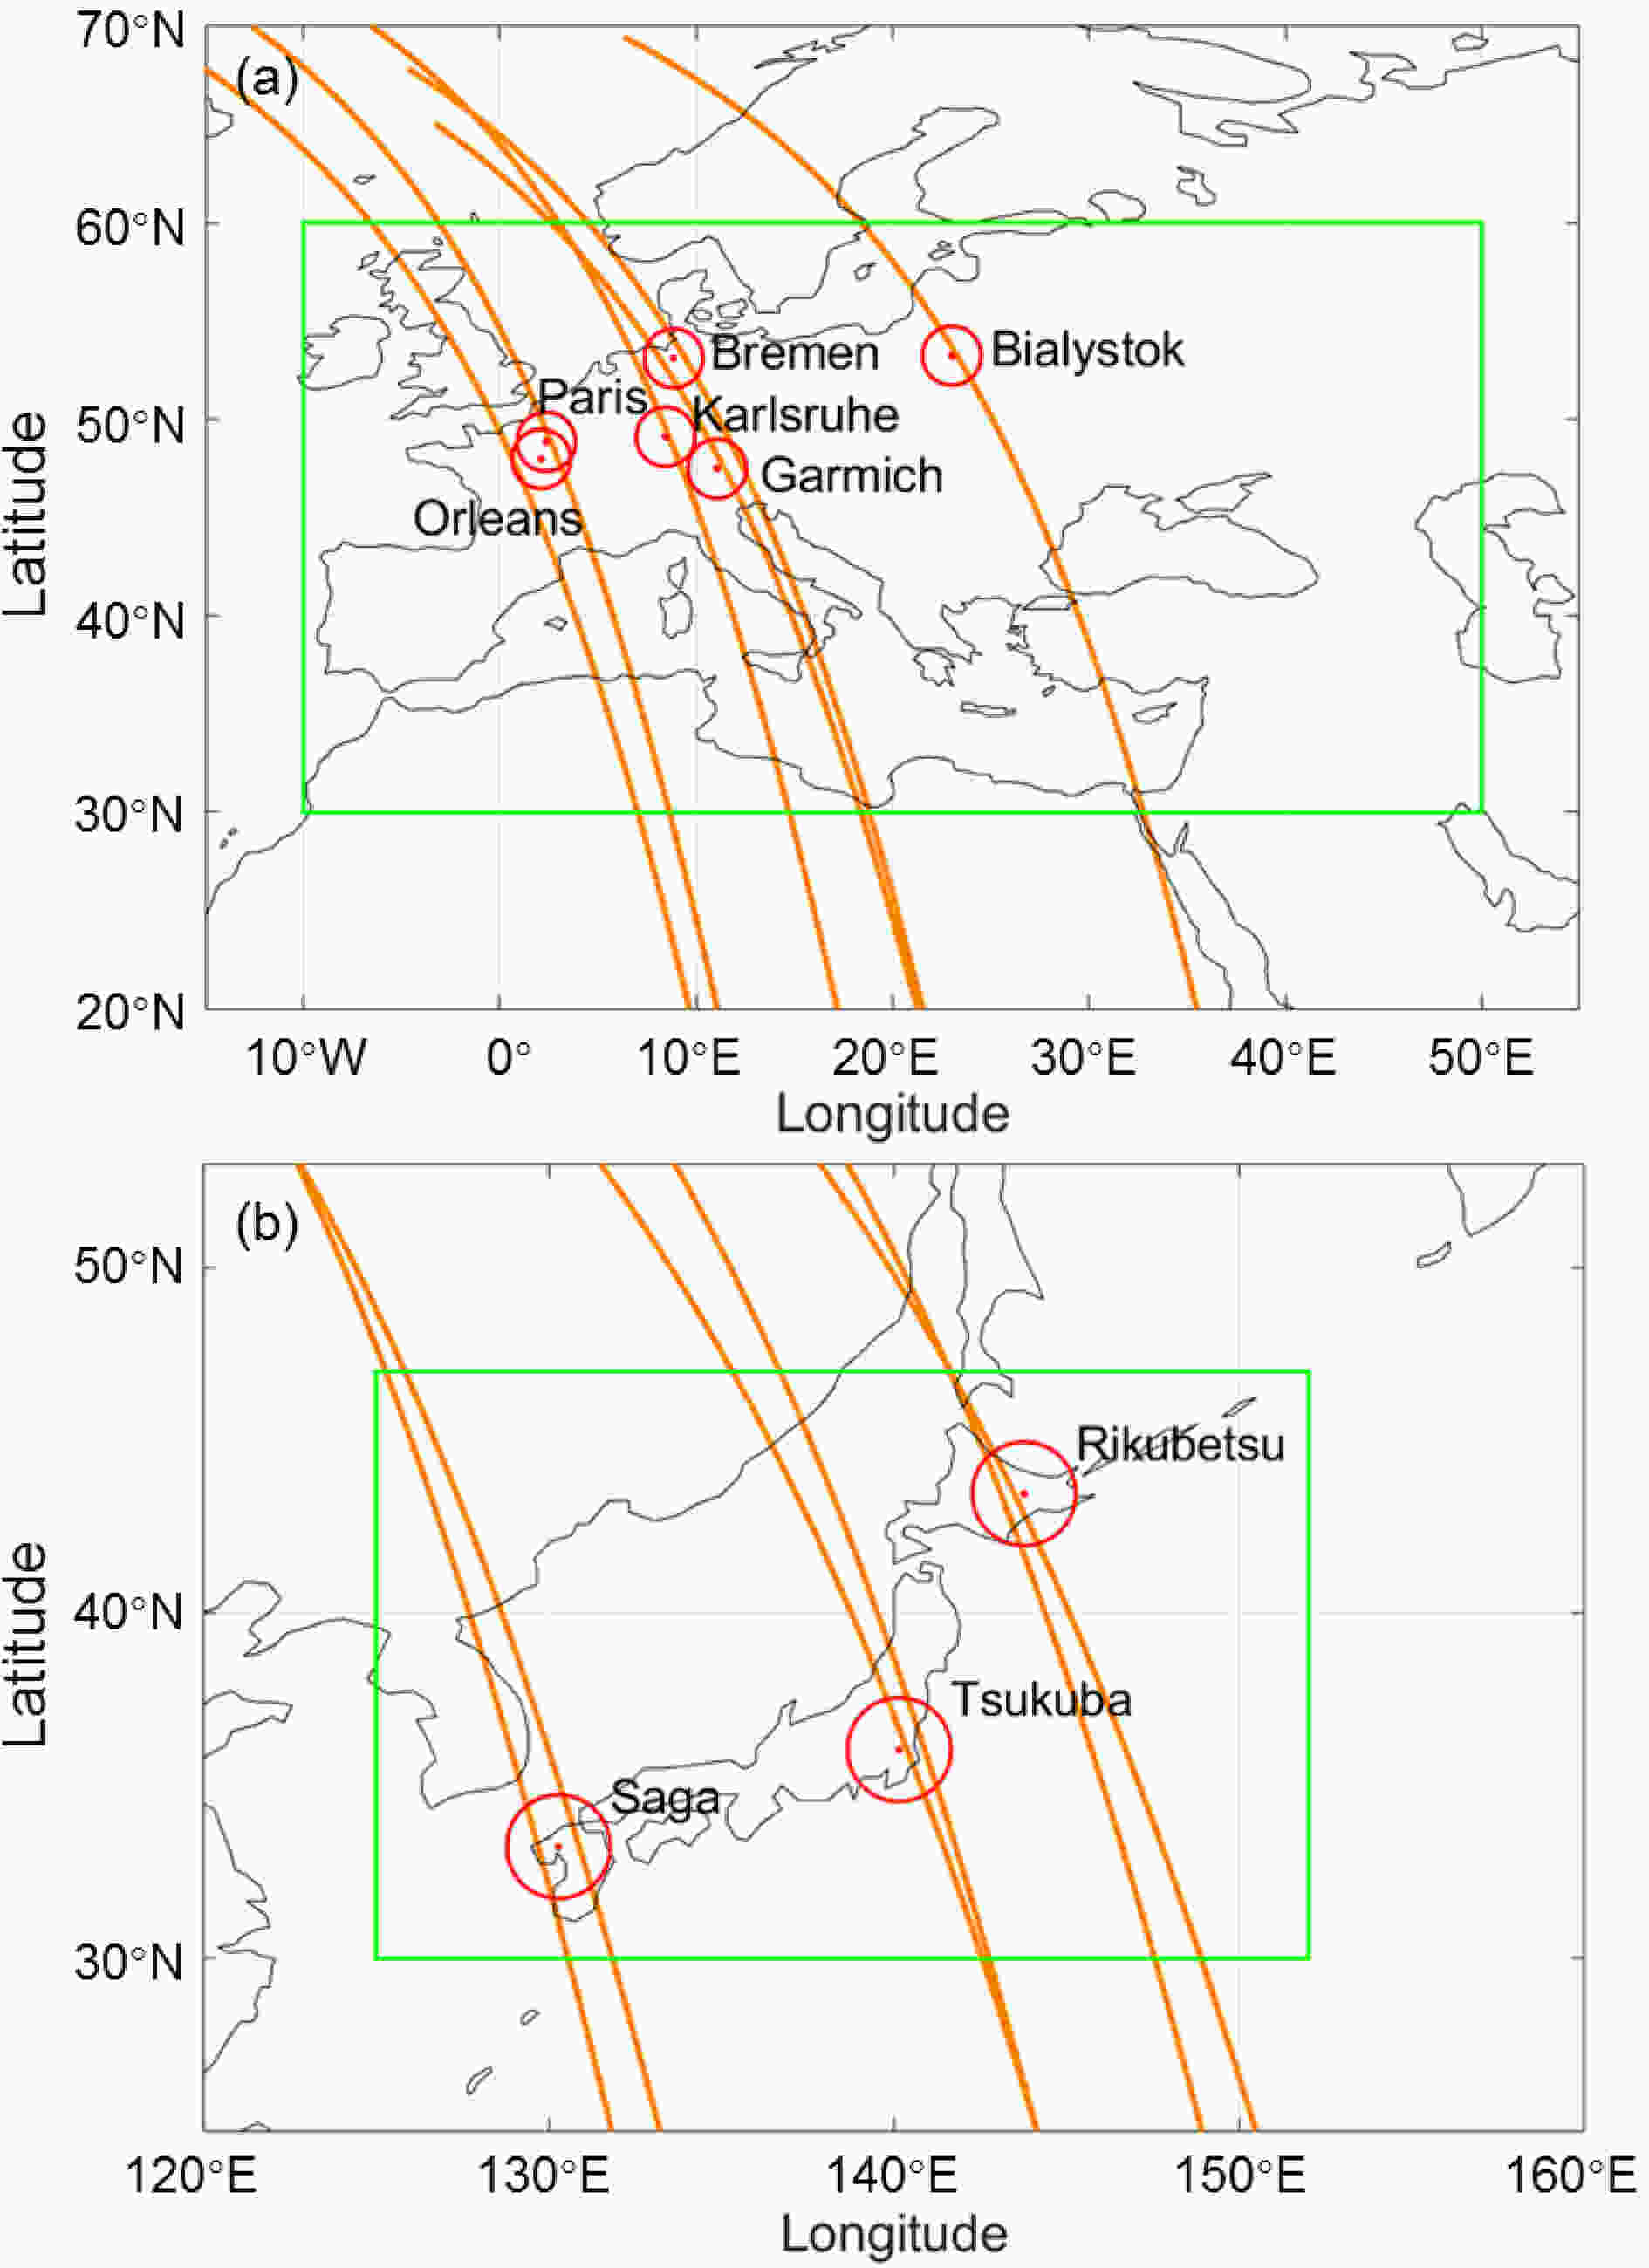
Figure 2. Selected area in Europe and Japan (land inside green box) for comparison between OCO-2 and the MODIS cloud mask, as well as collocating ranges (red circles) for OCO-2 and TCCON XCO2 retrievals. The orange lines show examples of OCO-2 orbits passing over nearby TCCON sites.
In addition, three sites in Japan—Rikubetsu (43.46°N, 143.77°E), Saga (33.24°N, 130.29°E), and Tsukuba (36.05°N, 140.12°E)—are used for validation of the optimized cloud screening scheme.
2.1. OCO-2
2.1.1. OCO2_L2_ABand
2.1.2. OCO2_L2_IMAPDOAS
2.1.3. OCO2_L2_Standard
2.2. MODIS
2.3. TCCON
-
The ABP and IDP methods of OCO-2 provide two sets of independent cloud screening. Details of the methods are stated in the algorithm theoretical basis documents (Frankenberg, 2014; O’Dell and Taylor, 2014). The principles of the two methods are similar: since the presence of clouds and aerosols causes scattering and modifies the optical path length, there should be apparent differences between modeled and measured results assuming clear-sky conditions (with no scattering, or molecular Rayleigh scattering only) (Frankenberg et al., 2005). Following this principle, the cloud screening criteria for each method are reiterated briefly here for the convenience of readers.
For the ABP method, three thresholds are set to test if the scene meets the clear-sky conditions: (1) the threshold for surface pressure as explained in section 2; (2) the threshold for the average of retrieved surface albedos at 0.755 μm and 0.785 μm; (3) the threshold for the reduced χ2 value. If either one of the tested parameters is above the threshold value, the scene is classified as cloudy. These thresholds could be set to different values for different operation modes, surface types and other observational conditions.
For the IDP method, thresholds for center and half-width (HW) values are set for the ratio calculated as the VCD of CO2 in the weak CO2 band divided by the VCD in the strong CO2 band. This ratio is denoted as RCO2 in the following section. Similarly, the ratio between the VCD of H2O in the two bands is denoted as RH2O.
-
To assign a MODIS reference state for each OCO-2 sounding, considering OCO-2 products are provided at a 1.3 km × 2.3 km resolution, and MODIS products at 1 km × 1 km, they need to be merged first for further analysis. Here, we adopt the procedure first described in Taylor et al. (2012) for comparing OCO-2 ABP and IDP cloud screening results to the MODIS cloud mask hybrid with cirrus reflectance. For each OCO-2 sounding, the reference state is determined by averaging MODIS pixels with a center latitude and longitude less than 2 km away from the center of that sounding. If none of the selected MODIS pixels for an OCO-2 sounding is marked as confident or probably cloudy, and all cirrus reflectance R ≤ 0.01, the scene is classified as clear. Otherwise, the scene is classified cloudy. For simplicity, flags indicating confident or probably cloudy are interpreted as cloudy.
-
A contingency table analysis provides compact summary statistics for comparing large predictive datasets. It is performed to compare the cloud screening results from the OCO-2 ABP and IDP methods and hybrid MODIS cloud mask following the terms and procedure given in Taylor et al. (2012), which provides compact summary statistics for comparing large predictive datasets. Like in Taylor’s work, the results from MODIS are referred to as truth in this study. Therefore, the comparison at each scene can be classified as one of four categories: true positive (TP) for both OCO-2 and MODIS indicates a clear scene; true negative (TN) for both indicates a cloudy scene; false positive (FP) for MODIS indicates clear but OCO-2 indicates cloudy; and false negative (FN) for MODIS indicates cloudy but OCO-2 indicates clear. The rate of each category is denoted as true positive rate (TPR), false negative rate (FNR), false positive rate (FPR), and true negative rate (TNR), respectively. According to the contingency table analysis, summary statistics for each category are calculated as follows:
where N is the total number of collocated soundings for each category, and also for clear scenes and cloud scenes.
Based on these summary statistics, three diagnostic variables are calculated as follows:
where Ntotal is the total number of all collocated soundings. By design, the throughput (THR) gives the fraction of scenes that pass the OCO-2 cloud screening algorithms, i.e., identified as clear. The agreement (AGR) gives the fraction of scenes that are correctly classified by the algorithms, either as clear or cloudy, relative to the collocated MODIS results. The positive predictive value (PPV) gives the fraction of clear scenes predicted by MODIS that are also predicted clear by the OCO-2 algorithms.
3.1. OCO-2 cloud screening method
3.2. Hybrid MODIS mask and collocation method
3.3. Contingency table analysis
-
To optimize the threshold parameters for cloud screening with results from the contingency table analysis, we analyzed the variation of summary statistics and diagnostic variables independently with the OCO-2 measurements and MODIS reference state in January and July 2016. The collocated cloud screening dataset in January is composed of 71 orbits, with 311 500 soundings passing over the selected region in Europe. The collocated dataset in July is composed of 72 orbits, and a total of 304 438 soundings.
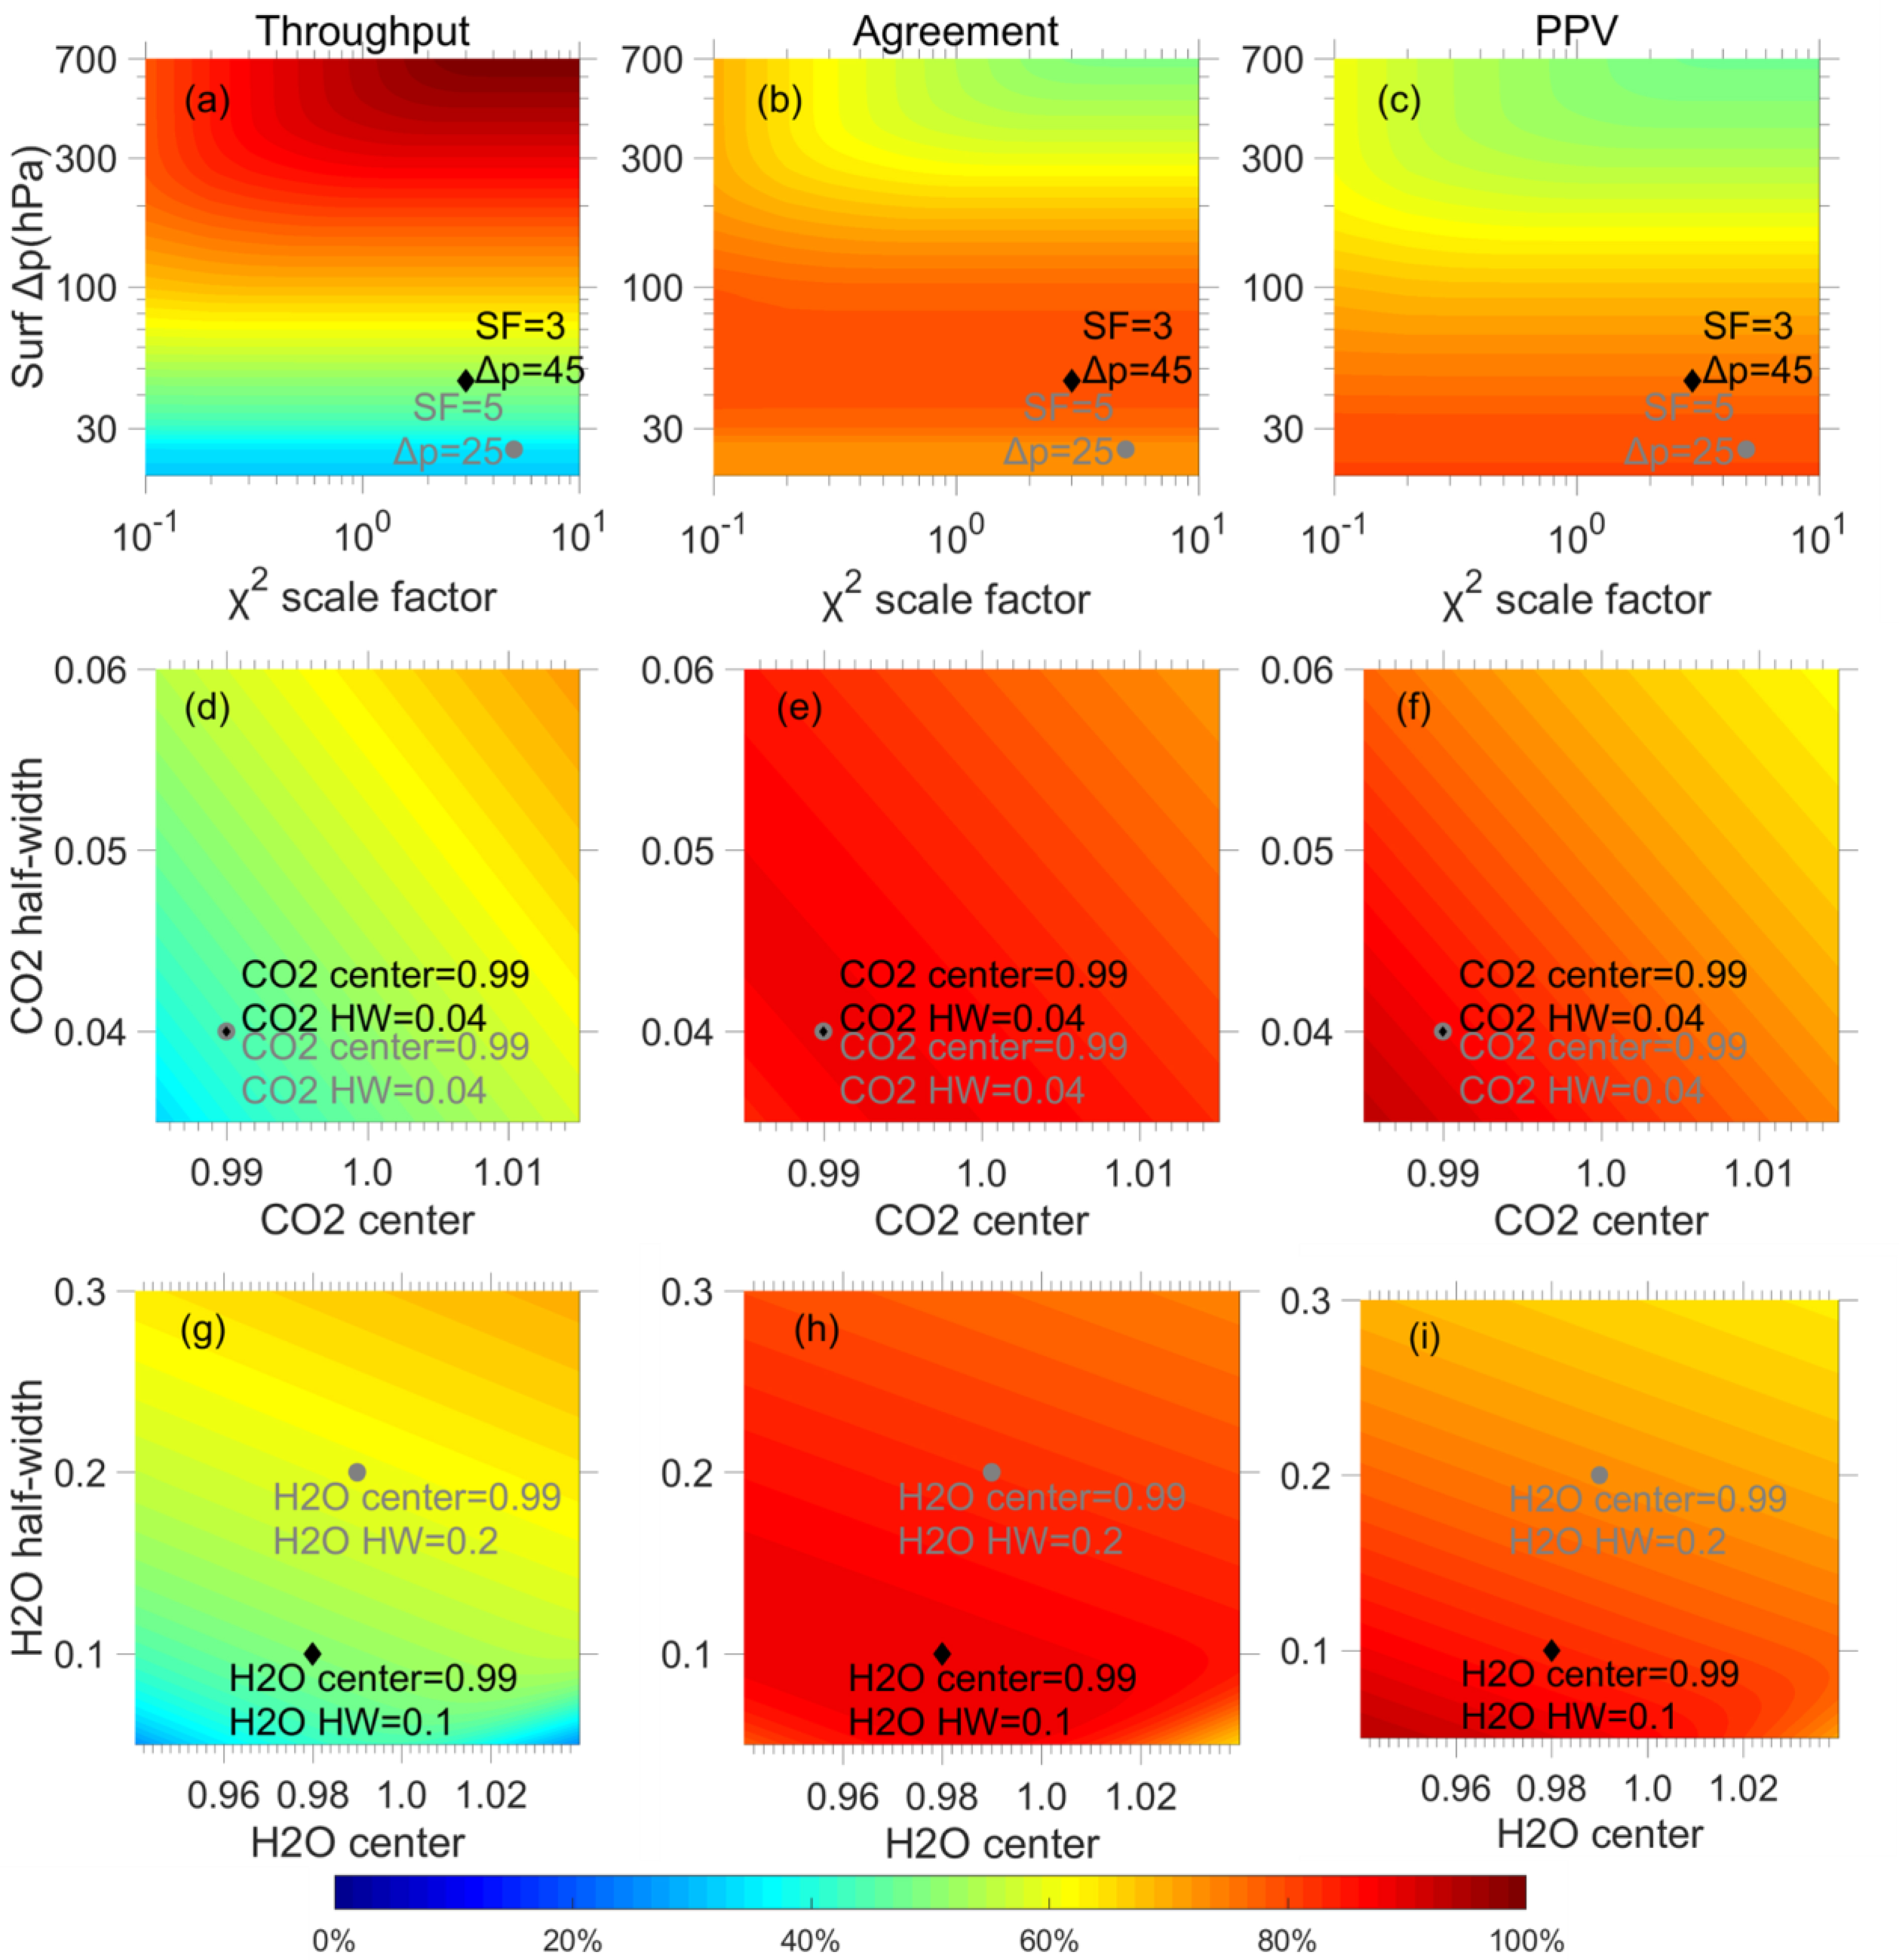
Figure 3 shows the changes of diagnostic values, throughput, agreement, and PPV, in response to altering cloud screening thresholds in a chosen range. Based on the July dataset, the trend of these changes gives a way to evaluate the influence of each threshold value, including the surface pressure difference and χ2 scale factor (SF) for the ABP method, and center value and HW of RCO2 and RH2O for the IDP method. Because the limit of χ2 is dynamically calculated for each sounding, a multiplicative SF is used to evaluate all soundings. For retrieved surface albedos, the threshold is adopted from the current OCO-2 parameter and therefore its influence is not examined in this study.

Figure 3. Changes of the throughput (left-hand column), agreement (middle column) and positive predictive value (PPV, right-hand column) for variations in the ABP surface pressure and scale factor thresholds (a–c) and the IDP RCO2 (d–f) and RH2O (g–i) thresholds based on OCO-2 and MODIS data in Europe in July 2016. The numbers in black indicate the tightened thresholds in this work, while the numbers in white indicate the original OCO-2 thresholds.
Based on the trend shown in Fig. 3, we first determined Δps and HW since the figure indicates they have a stronger influence over the changes of the outcome, and then we determined the other parameter for each pair (χ2 SF or center value, respectively), noting that the first determined parameter would be more crucial. The six major threshold parameters are adjusted back and forth, until the throughput of the combined results from the ABP and IDP methods are closely matched with the average monthly clear-sky fraction in the region from MYD08.
In general, a set of tight thresholds, i.e., lower limits of Δps, and χ2 SF, and a narrower HW range, as well as some shifts in the center value for acceptable RCO2 and RH2O, creates a more stringent cloud screening scheme, which leads to lower throughput, but a higher agreement and PPV. In other words, stringent thresholds, compared to loose ones, help to select scenes that are more “confidently clear”. The fewer scenes remaining have better agreement with the MODIS reference state and are supposed to have less influence from clouds or aerosol contamination, thus giving better quality assurance.
Similar trends are also observed in the contour plot created with the January dataset; although, compared to the July dataset, the limit for Δps in January is more than doubled to allow a reasonable throughput from the ABP method. This could be explained by the high snow cover in winter, which is known to increase errors in cloud screening and XCO2 retrievals.
A sensitivity test is performed to evaluate the rate of change of each diagnostic variable relative to different threshold values (Table 1). Five major threshold parameters are tested one at a time, while others stay the same. The χ2 SF is not tested, because significant change in the ABP results is not observed unless the SF is set to be extremely small.
Tested term* Selected value Test value Change (%) Result change (%) (for either ABP or IDP) THR AGR PPV Δps (hPa) 45 22.50 −50.00% −9.33% 3.70% 7.83% 33.75 −25.00% −3.08% 2.14% 3.12% 67.50 50.00% 4.59% −3.86% −4.61% 90.00 100.00% 8.40% −7.34% −8.17% RCO2 center 0.99 0.97 −2.02% −32.90% −22.84% 8.67% 0.98 −1.01% −11.09% −4.78% 5.46% 1.00 1.01% 7.73% −1.43% −7.07% 1.01 2.02% 14.33% −5.12% −13.73% RCO2 HW 0.04 0.030 −25.00% −11.09% −4.78% 5.46% 0.035 −12.50% −4.74% −1.22% 3.02% 0.045 12.50% 4.01% −0.29% −3.47% 0.050 25.00% 7.73% −1.43% −7.07% RH2O center 0.99 0.96 −2.04% −2.72% 0.25% 2.18% 0.97 −1.02% −1.27% 0.22% 1.08% 0.99 1.02% 1.10% −0.33% −1.04% 1.00 2.04% 2.12% −0.74% −2.06% RH2O HW 0.1 0.050 −50.00% −8.86% −0.96% 5.98% 0.075 −25.00% −3.60% 0.24% 2.83% 0.15 50.00% 5.11% −2.35% −5.20% 0.20 100.00% 9.19% −5.34% −9.66% *χ2 scale factor is not tested, because significant change in the ABP results is not observed unless the scale factor is set to be extremely small. Table 1. Sensitivity test for each threshold value.
-
Based on trends in the January and July contour plots, we set the values of seasonal thresholds according to the average monthly clear-sky fraction in the selected area (Table 2). The current thresholds used in OCO-2 algorithms are designed to have 25%–30% throughput globally, which means 5%–10% more than the clear-sky fraction observed by MODIS (Taylor et al., 2016). In contrast, the narrowed thresholds aim to have throughput close to the observed local clear-sky fraction in each month. The reduction of inflation over the MODIS clear-sky fraction helps to minimize the chance that some cloud- or aerosol-contaminated scenes also pass the screening. It is also worth noting that cloud coverage varies greatly throughout the year. The highest clear-sky fraction occurs in summer, which is 55.1%, while the lowest occurs in winter, which is 29.5%. The spring and fall have close values, which are 39.3% and 40.0%, respectively. Therefore, custom thresholds for each season is important to fit the regional conditions.
Clear-sky fraction Δps (hPa) χ2 SF RCO2 center RCO2 +/−HW RH2O center RH2O +/−HW OCO-2(in operation) − 20 5 0.99 0.04 0.99 0.2 spring 0.30 70 3 0.99 0.04 0.97 0.1 0.28 0.31 summer 0.34 45 2 0.99 0.04 0.98 0.1 0.41 0.43 fall 0.50 40 3 0.99 0.035 0.99 0.08 0.56 0.60 winter 0.50 100 3 0.99 0.04 0.98 0.08 0.39 0.31 Table 2. Settings of the ABP and IDP cloud screening thresholds used for the seasonal OCO-2 measurements discussed in section 2.1, including the differences between the retrieved and priori surface pressure (Δps), χ2 scale factor (SF), and center and half-width (HW) range for RCO2 and RH2O.
A summary of the statistical values for the re-screened dataset in each season is given in Table 3. For scenes with a clear reference state, the TPR ranges from 0.69 to 0.84, which is lowest in spring and highest in summer. For scenes with a cloudy reference state, the TNR ranges from 0.91 to 0.94. The results suggest that, compared to the global results in winter and spring given in Taylor et al. (2016), the correctly predicted clear scenes increased about 10%, and the correctly predicted cloudy scenes increased about 5%.
Reference clear Reference cloudy Total Season NTP TPR NFN FNR NFP FPR NTN TNR Spring 49588 0.69 22633 0.31 27483 0.076 332775 0.92 Summer 188747 0.84 34628 0.16 22193 0.081 253491 0.92 Fall 173842 0.78 49533 0.22 16127 0.058 259557 0.94 Winter 52054 0.72 20167 0.28 32380 0.090 327878 0.91 ABP Season NTP TPR NFN FNR NFP FPR NTN TNR Spring 52097 0.72 20375 0.28 54808 0.12 388478 0.88 Summer 220793 0.98 4182 0.019 85834 0.29 207364 0.71 Fall 219865 0.98 5110 0.023 80070 0.27 213128 0.73 Winter 57545 0.79 14927 0.21 80848 0.18 362438 0.82 IDP Season NTP TPR NFN FNR NFP FPR NTN TNR spring 56648 0.78 15573 0.22 64347 0.18 296080 0.82 summer 189336 0.85 34504 0.15 23668 0.086 252247 0.91 fall 174424 0.78 49416 0.22 16732 0.061 259183 0.94 winter 55735 0.77 16486 0.23 57270 0.16 303157 0.84 Table 3. Contingency tables for the comparison of the OCO-2 cloud screening results to MODIS cloud mask for each season in 2016 in Europe. Results are from the combination of the ABP and IDP methods.
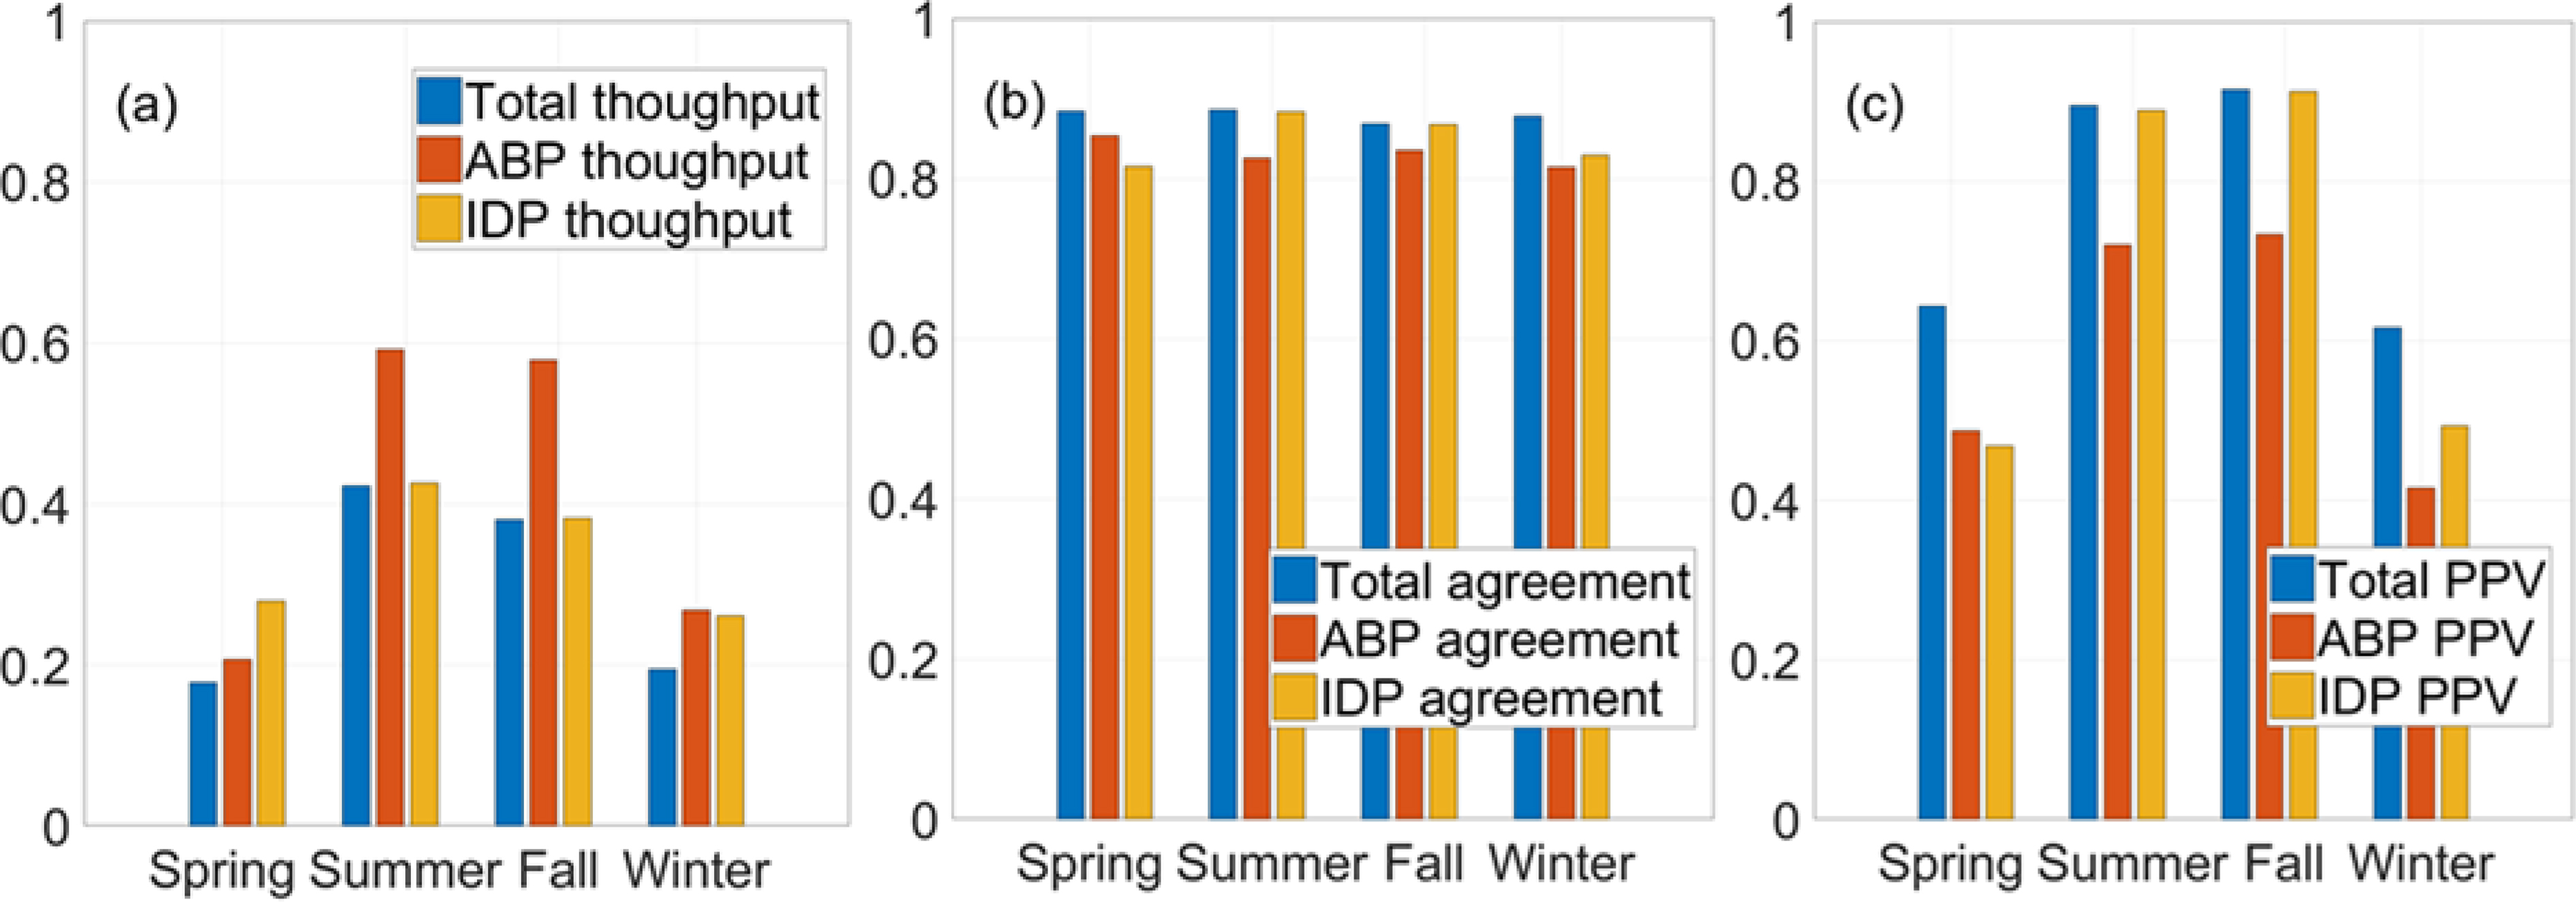
The seasonal throughput, agreement and PPV for the ABP method, the IDP method and combined outcomes are given in Fig. 4. The total throughput is 0.18 in spring, 0.42 in summer, 0.38 in fall, and 0.20 in winter. The numbers in spring and winter are close to the values from the Glint-land viewing scenario in Taylor’s work (~0.19), but lower than values from the Nadir-land (~0.26). The overall agreement with MODIS is 0.88 on average, and is relatively consistent throughout year. There is a constant improvement compared to the current OCO-2 results (~0.83). The overall PPV is 0.77, and the average PPV of spring and winter is 0.63, which is higher than the 0.58 from Taylor’s results.
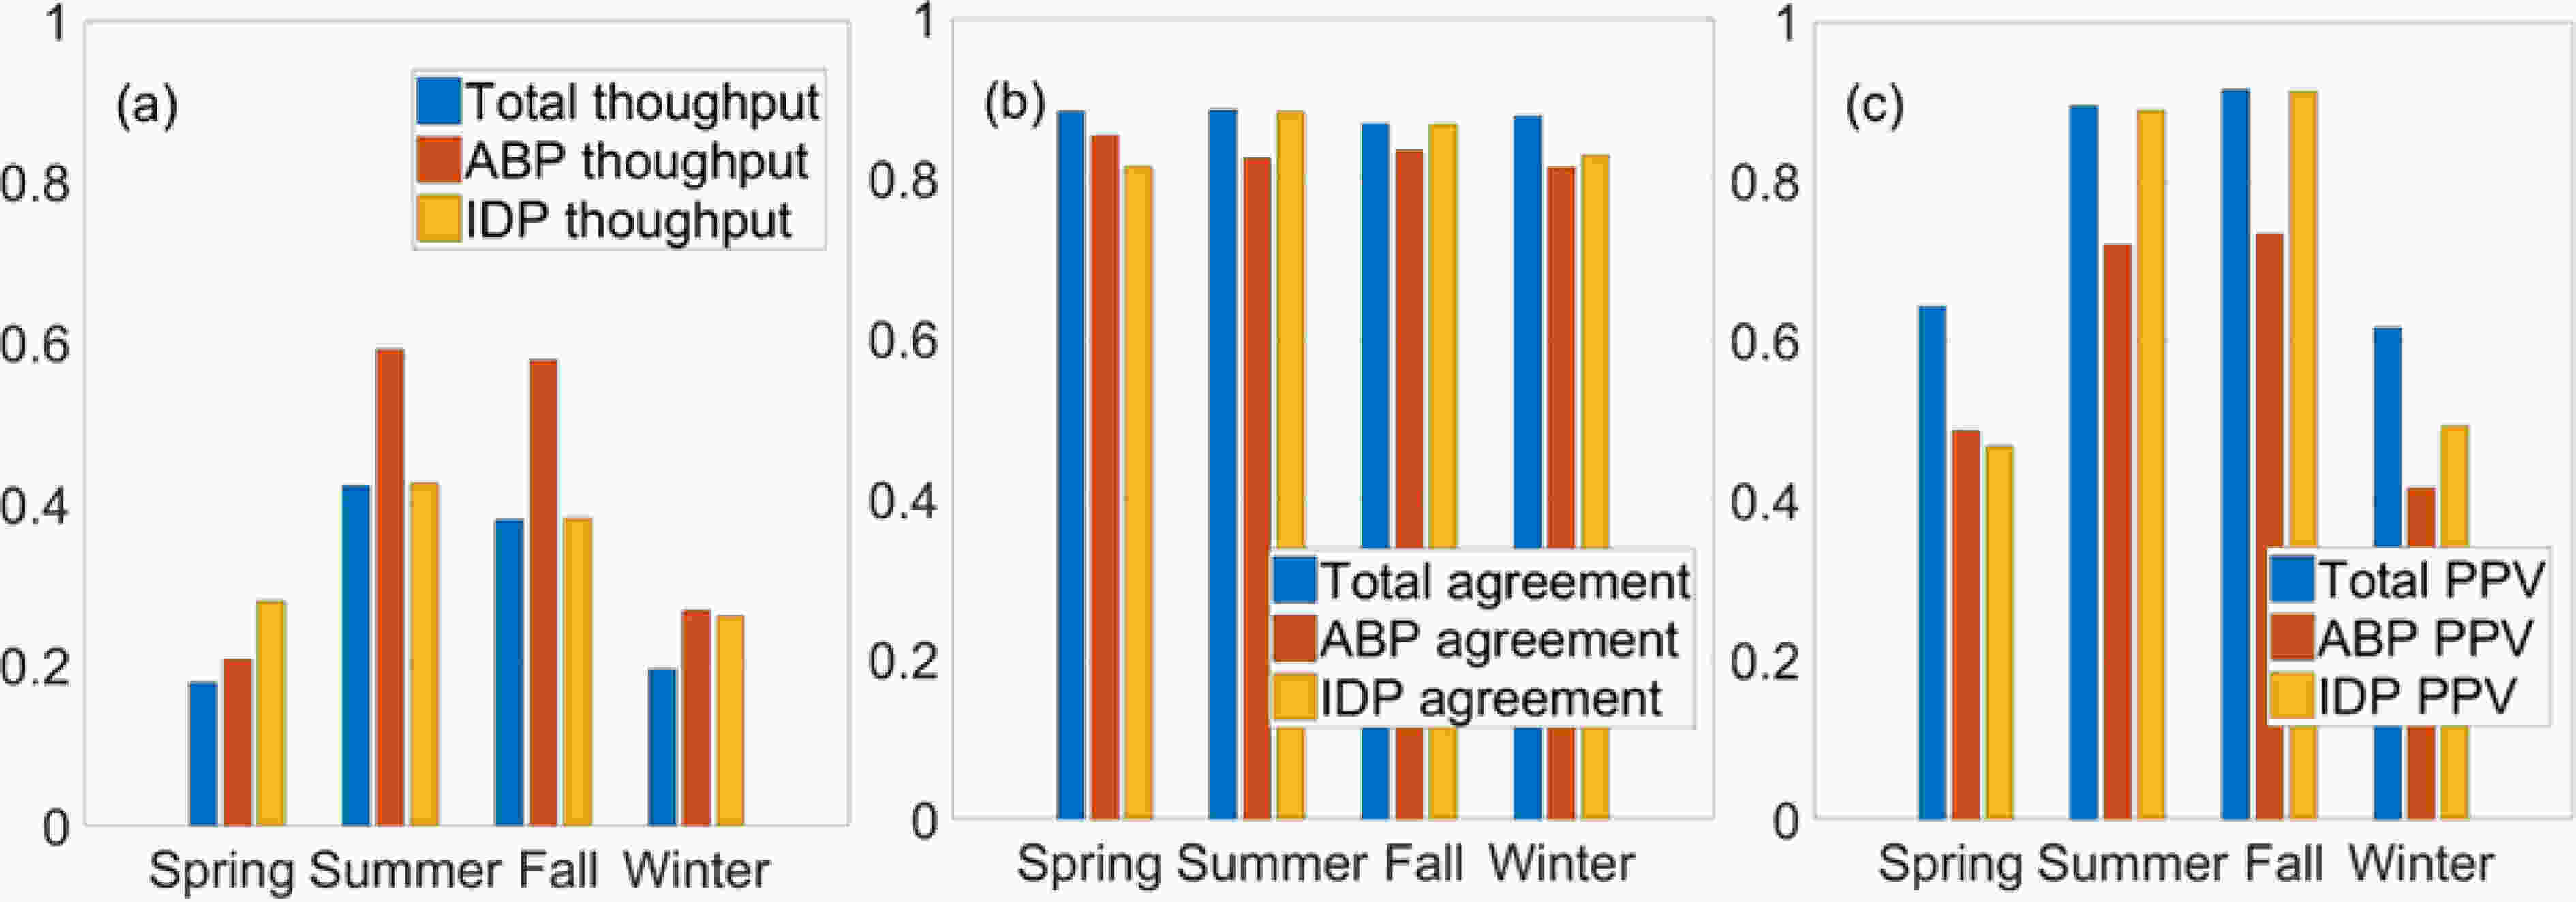
Figure 4. Seasonal throughput (a), agreement (b) and positive predictive value (PPV, c) for the ABP method, IDP method, and combined outcomes.
In general, the statistics in the summer and fall seasons are much better than in winter and spring. This indicates that the remaining data might still contain influence from snow-covered surfaces. A close examination of the results from the ABP and IDP methods shows that significant improvement of the ABP method is mainly in summer and fall, wherein the FNR can be reduced to about 0.02; on the other hand, improvement of the IDP method is mainly shown in the same seasons, with the FPR reduced to less than 0.1.
-
After determining the new thresholds and re-screening the OCO-2 measurements, the remaining retrievals were compared with collocated TCCON measurements, as discussed in section 2.3. Figure 5 shows scatterplots of the seasonal daily average XCO2 from OCO-2 versus collocated TCCON observations, in the order of time (winter, spring, summer and fall). It is rather obvious from the figure that the re-screened data [(e–h) on the right-hand side], compared to the original data [(a–d) on the left-hand side], show improvement, especially for measurements deviating from the one-to-one ratio line.
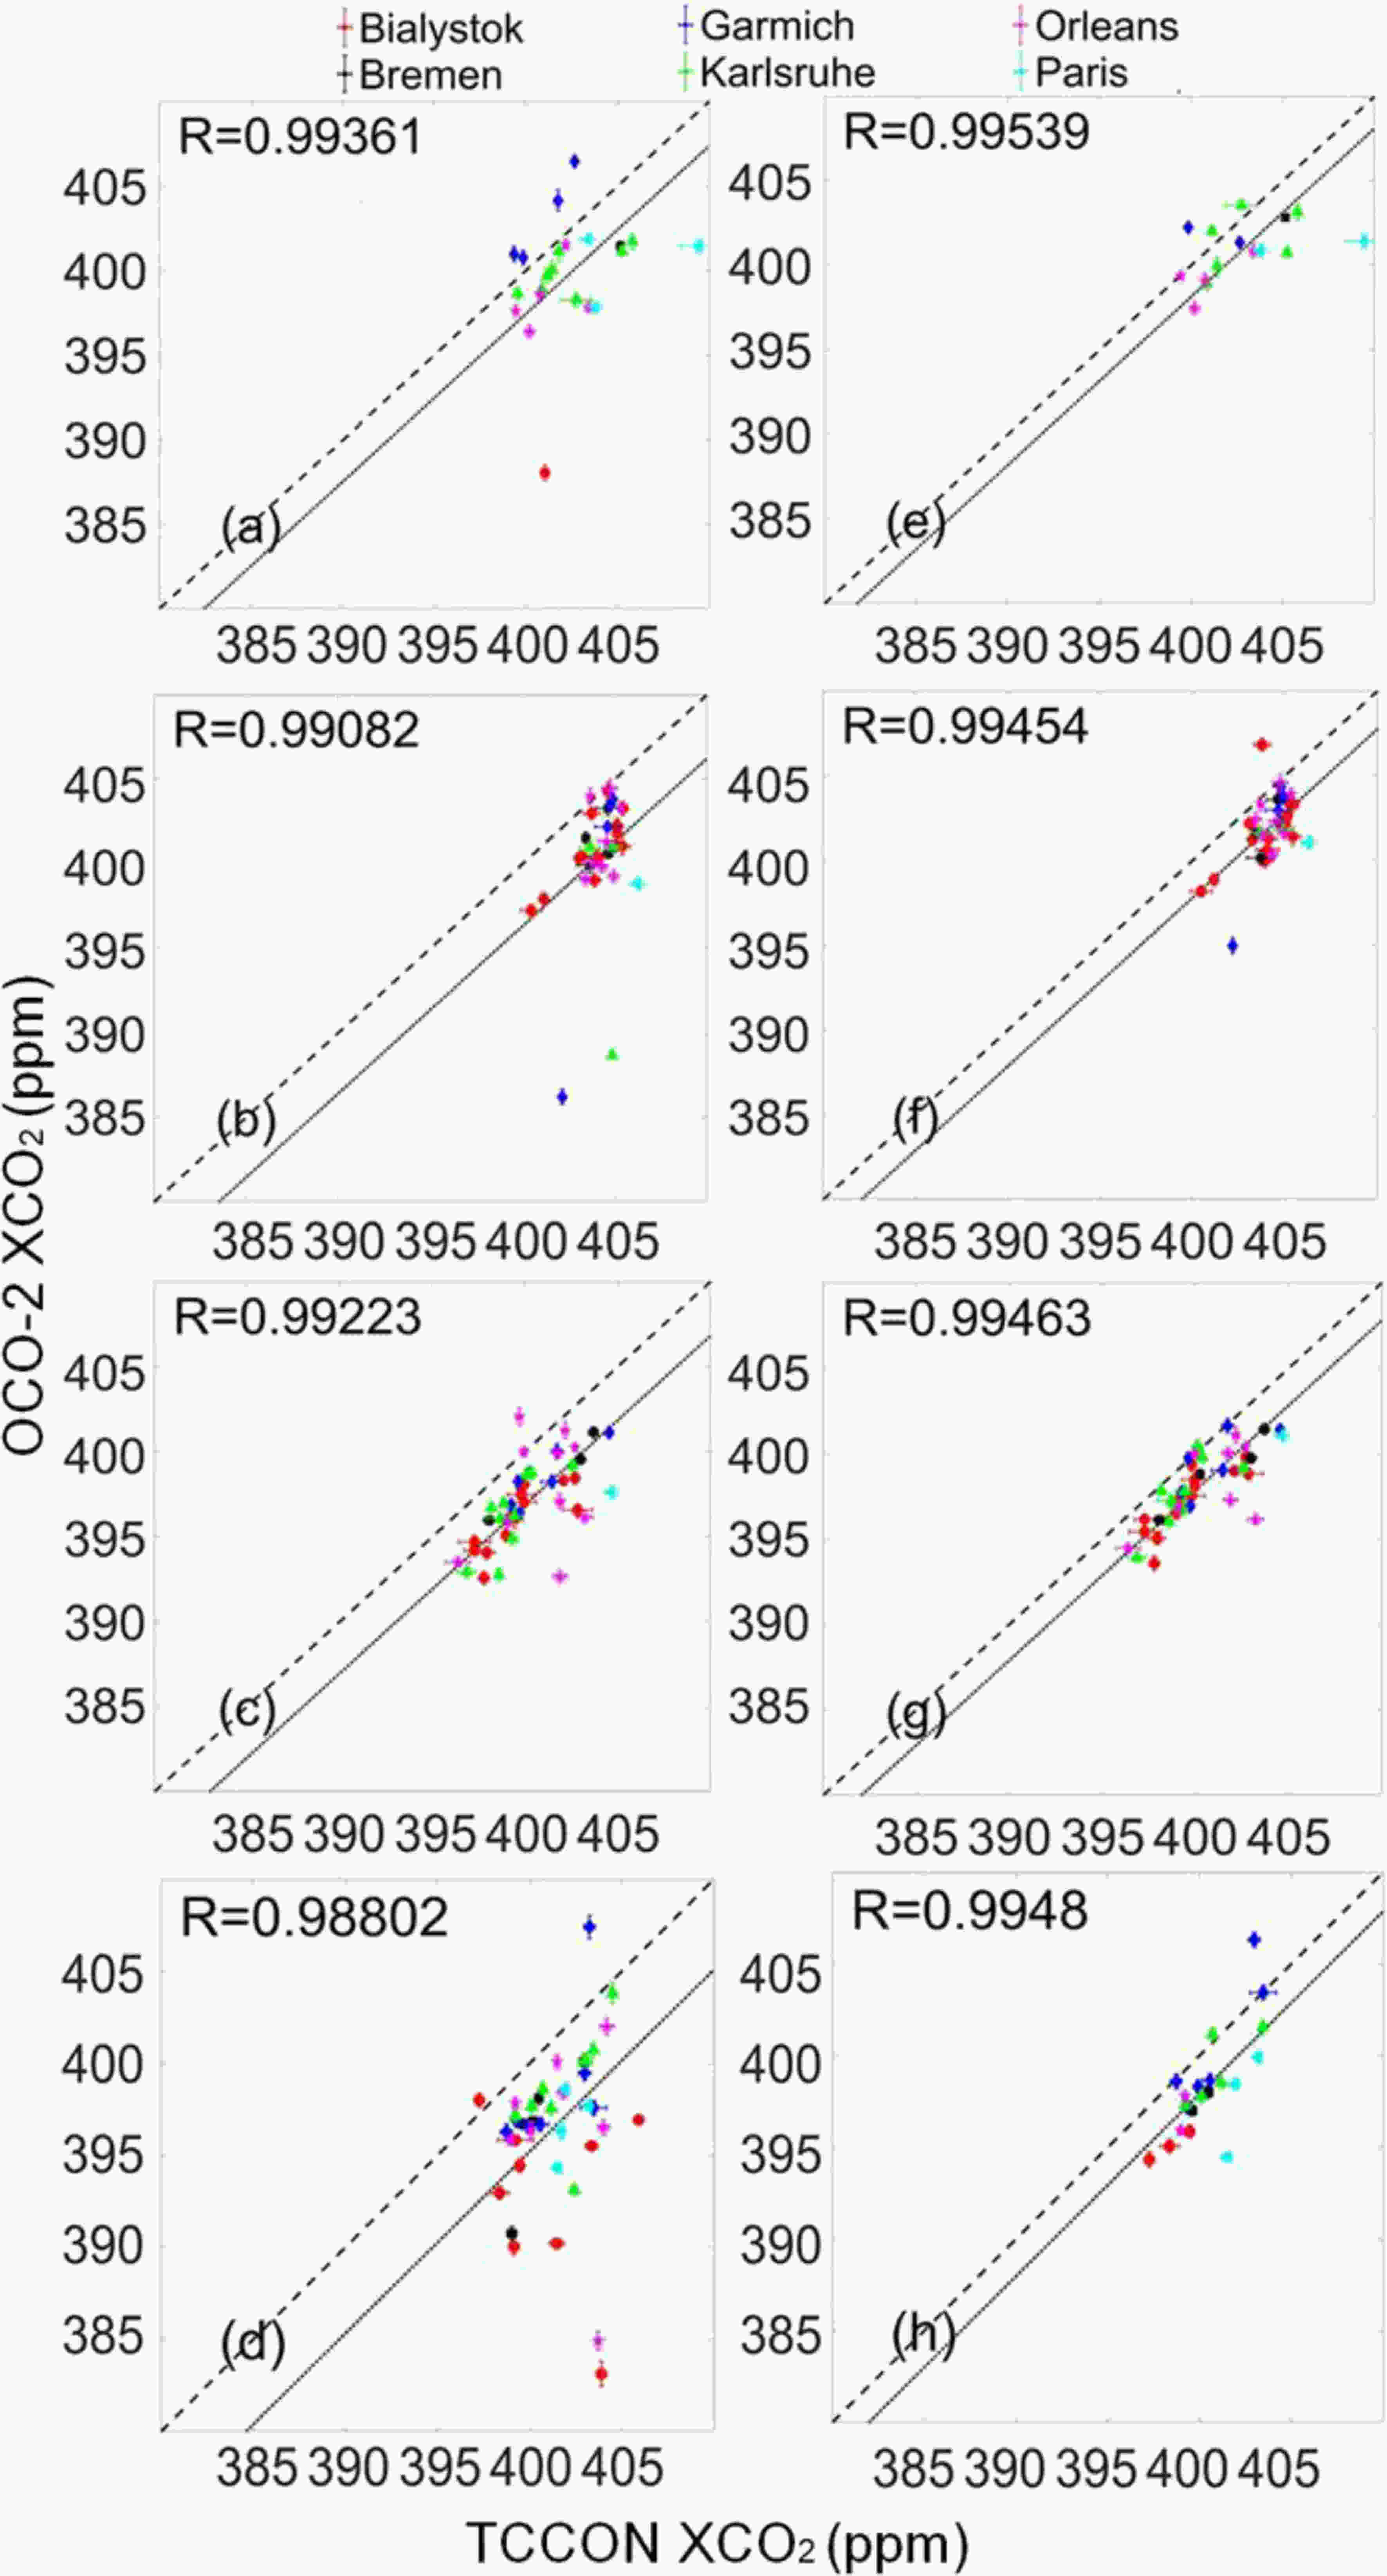
Figure 5. Scatterplots of seasonal daily average XCO2 from OCO-2 versus collocated TCCON observations. The dotted line is the one-to-one ratio line, while the solid line is the regression line.
For a total of 143 days, or 143 pairs of data, 31 pairs are removed after re-screening. For the remaining 112 pairs, 97 pairs have a smaller difference compared to the original dataset. Overall, the difference between the average XCO2 from the six TCCON sites and from the OCO-2 measurements passing nearby regions reduced 34.7%, decreasing from 3.23 ppm to 2.11 ppm. The average OCO-2 XCO2 before re-screening is 398.19 ppm, the average uncertainty is 3.85 ppm, and the standard deviation is 0.76 ppm. After rescreening, the average XCO2 increases slightly to 399.71 ppm, the average uncertainty decreases to 2.52 ppm, and the standard deviation decreases to 0.71 ppm.
Among the six sites, the Garmich site shows the greatest improvement: the difference of XCO2 between the TCCON and OCO-2 measurements decreases by 59.4%. The Karlsruhe site shows the second greatest improvement with a decrease of 42.6%. Next, the difference at the Orleans site decreases by 31.0%; the difference at the Bialystok site decreases by 28.7%; and the difference at the Paris site decreases by 24.7%. The Bremen site shows the least improvement with a decrease of 15.7%. There appears to be no relation between the position of these TCCON sites and the degree of improvement they have.
Based on the similarity of trends found in this work and Taylor’s work, we believe that the same optimizing scheme can be applied to worldwide locations. We applied the same procedure to OCO-2 measurements over the land area of Japan, and compared the re-screened data with three local TCCON sites (Table 4). However, there are far fewer data collected by these TCCON sites, resulting in fewer possible comparisons during the same period. Significant improvement of agreement between the TCCON and re-screened OCO-2 XCO2 is shown in summer and winter, though the latter has a very small sample size.
Season TCCON OCO-2 Data Re-screened Data XCO2 (ppm) Count XCO2 (ppm) Diff* (ppm) R Count XCO2 (ppm) Diff (ppm) R spring 407.15 1111 402.57 4.58 0.9887 869 403.32 3.83 0.9906 summer 398.63 1056 391.37 7.26 0.9817 821 399.03 −0.40 0.9919 fall 403.54 418 401.41 2.13 0.9947 46 400.41 3.13 0.9970 winter 403.92 86 399.87 4.05 0.9899 16 403.57 0.35 0.9996 *Diff refers to the difference between average TCCON measurements and OCO-2 measurements of XCO2. Table 4. Summary of the comparisons among TCCON, OCO-2, and re-screened OCO-2 measurements of XCO2 for the Japan area during 2016.
4.1. Tightening of the cloud screening algorithm thresholds
4.2. Seasonal variation
4.3. Comparison with TCCON in Europe and Japan
-
In this work, individual sets of threshold parameters were sufficiently tuned to seasonal data from Europe in 2016. Based on two months of collocated OCO-2 and MODIS data in January and July 2016, trends of diagnostic variables as a function of threshold parameters in the ABP and IDP cloud screening methods were studied, including the fraction of scenes that pass the OCO-2 cloud screening algorithms (throughput), the fraction of scenes that are correctly classified by the algorithms (agreement), and the fraction of clear scenes predicted by MODIS that are also predicted clear by the OCO-2 algorithms (PPV). By lowering the limit of throughput to the actual clear-sky fraction for each season, the possibility that contaminated scenes might pass the filter due to the loosely set thresholds was minimized. The agreement and PPV compared to a hybrid MODIS cloud mask improved steadily, at the cost of reducing total throughput.
The analysis of re-screened OCO-2 measurements confirms that stringent thresholds lead to steady improvement of agreement and PPV compared to the collocated MODIS cloud mask. In addition, comparisons with six European TCCON sites showed that the difference between the average XCO2 from TCCON sites and from OCO-2 measurements passing nearby regions decreased from 3.23 ± 2.25 ppm to 2.11 ± 1.76 ppm. In another case study, the same optimizing procedure was applied to the Japan area, and the agreement between the TCCON and OCO-2 results improved from 4.83 ± 5.25 ppm to 3.11 ± 4.82 ppm.
It is worth noting that certain assumptions in this work might lead to biases. First, we obtained the clear-sky fraction based on the cloud fraction estimated by MODIS, which does not account for the influence of aerosol, even though by the design of OCO-2 cloud screening, the days with high aerosol loadings should also be eliminated. However, the aerosol loading in Europe is generally low, so the impact from aerosols is expected to be small. Second, the rather low number of TCCON sites could lead to a representative bias. The low measuring frequency of MODIS and OCO-2 could lead to the same issue. Therefore, the results in this work focus only on the collocated measurements in time and space. For future work, the procedure described in this work could be generally applied to any other place with TCCON sites around the world. It would be very helpful to develop regional specialized cloud screening thresholds, and to provide better quality assurance for XCO2 retrievals.
Acknowledgements. This work was supported by the National Key Research Program of China (Grant No. 2016YFC0200900), the National Natural Science Foundation of China (NSFC) (Grant No. 41775023), the Excellent Young Scientists Program of the Zhejiang Provincial Natural Science Foundation of China (Grant No. LR19D050001), the Fundamental Research Funds for the Central Universities, and the State Key Laboratory of Modern Optical Instrumentation Innovation Program. The authors declare no conflicts of interest regarding the publication of this paper.
 AAS Website
 AAS WeChat