


 DownLoad:


-
Shandong Province, located in eastern China, is often affected by extratropical transitions (ET) of tropical cyclones (TCs), which occur when TCs transform into extratropical (or mid-latitude) cyclones (Evans and Hart, 2008; Zhu et al., 2018). Landfalling typhoons with ET always bring heavy rainfall and strong winds, which can cause major economic losses as well as the loss of human life. While typhoon systems have unique dynamics and microphysical properties, improving their descriptions and understanding their microphysical properties are crucial regarding the quantitative precipitation estimates (QPE) made by weather radar and numerical forecasts. Typhoons have been frequently observed in China, but until now there have only been limited studies on the vertical microphysical properties of landfalling typhoons with ET. Several studies have investigated the characteristics of raindrop size distributions (DSDs) based on disdrometers and polarimetric radars. Studies from surface-based disdrometer observations have found that convective precipitation associated with typhoons produced high concentrations of small and/or medium-sized drops (Chang et al., 2009; Chen et al., 2012). Even in the presence of large drops, the maximum drop diameter rarely exceeds 4 mm (Tokay et al., 2008). By combining two-dimensional video disdrometers and C-band polarimetric radar measurements, Wen et al. (2018) found that the convective precipitation of typhoons contained higher raindrop concentrations and lower raindrop diameters than that of ordinary maritime convection (Bringi et al., 2003).
At present, a wide variety of observational instruments have accumulated an abundance of valuable data suitable for the research of clouds and precipitation. However, limited by the capabilities of instrument detection, there is not a single instrument suitable for all types of cloud and precipitation observations. Joint observations using various remote sensing instruments can aid in the accurate understanding of cloud characteristics. For instance, Ka-band cloud radar and Ku-band Micro Rain Radar (MRR) can detect the vertical structure of typhoon clouds with more detailed physical characteristics, while disdrometer data can provide continuous precipitation raindrop spectrum evolution on the ground. Therefore, different instruments can help us better understand the microphysical features of the precipitation influenced by typhoons, which serve to better describe the internal structure of typhoon rainfall.
Since understanding cloud and rainfall processes caused by landfalling typhoons is crucial for improving parameterization in numerical weather prediction models (Droegemeier et al. 2000; Zhang et al., 2006) and radar QPE (Gorgucci et al., 1994), it is necessary to investigate the microphysical properties of landfalling typhoons utilizing different remote sensing instruments, in particular for ETs over East China. Yet there are high uncertainties associated with predicting the tracks of typhoons that undergo ET because the quality of numerical forecasts is not reliable for ET (Jones et al., 2003). Studies have revealed that cloud microphysical features may exert a strong influence on the rainfall rate and tracks of typhoons (Cheng et al., 2011). So an improved understanding of microphysical processes may represent a key factor for improving typhoon precipitation forecasts (Wang et al., 2016) by optimizing the microphysics parameterization in numerical simulations. Due to the lack of three-dimensional microphysical observation data of typhoons undergoing ET, there has been little research performed that addresses the microphysical characteristics of the ET process. In this paper, both the conventional surface observations and the spatial measurements of microphysical parameters are presented and analyzed. Different types of observation instruments have different advantages, and combined observations using a variety of instrument types can take full advantage of the differential strengths of various instruments to compensate for instrument defects, not only to observe different scales and different aspects of the typhoon but also to further understand the advantages and disadvantages of different instrument types. A typical example is Typhoon Yagi (201814), which took place in August 2018 and brought heavy rainfall to Shandong Province causing many domestic flight cancellations. The primary goal of this study is to investigate the microphysical characteristics of northward-moving Typhoon Yagi (201814) undergoing ET, which has been relatively less studied because most previous studies have been focused on the developing and mature stages of typhoons. To do so, we take advantage of a Micro Rain Radar (MRR) operating at 24 GHz and a cloud radar operating at 35 GHz over the city of Jinan, Shandong Province. Both radars, which are designed to operate only in the vertical mode, are closely collocated to achieve maximum overlap of the observation volumes.
The main objective of this work is to focus on an intercomparison of raindrop size distributions and rain integral parameters obtained using continuous observations from several types of detection instruments. The organization of this paper is as follows: Section 2 gives a general description of the Typhoon Yagi (201814) investigative process and the data acquisition involved in this study. Section 3 describes the methodology and quality control schemes used in this study. Section 4 discusses the vertical structures observed by the MRR, the Ka-band cloud radar, and China’s New Generation Weather Radar (CINRAD-SA, S-band); raindrop size distributions are also presented. Section 5 provides a summary and the main conclusions from this study.
-
Typhoon Yagi (201814) made landfall at 1535 UTC on 12 August 2018 at Wenling county in Zhejiang Province of China as a severe tropical storm (STS), with maximum wind speeds of up to 28 m s−1. It continued to move northwest at speeds of 20−30 km h−1. It passed through Zhejiang, Anhui, and Henan Provinces and advanced to the city of Heze, Shandong Province, at 2100 UTC on 13 August as a tropical depression. The typhoon weakened to a tropical depression at 0000 UTC on 14 August. The circulation associated with the depression moved northward at speeds of 15–20 km h−1 in Shandong Province. Generally, rainfall rates declined due to ground friction after the landfall. However, as Typhoon Yagi (201814) moved northward, it encountered a westerly trough, which brought strong winds and heavy rain to the region. This dynamic interaction resulted in up to 328 mm of rainfall on parts of Shandong Province. Half of Shandong Province received rainfall that exceeded 68.2 mm. Figure 1 shows the track after the landfall of Typhoon Yagi (201814). This study focuses on the area near the station indicated by the red triangle in Fig. 1.
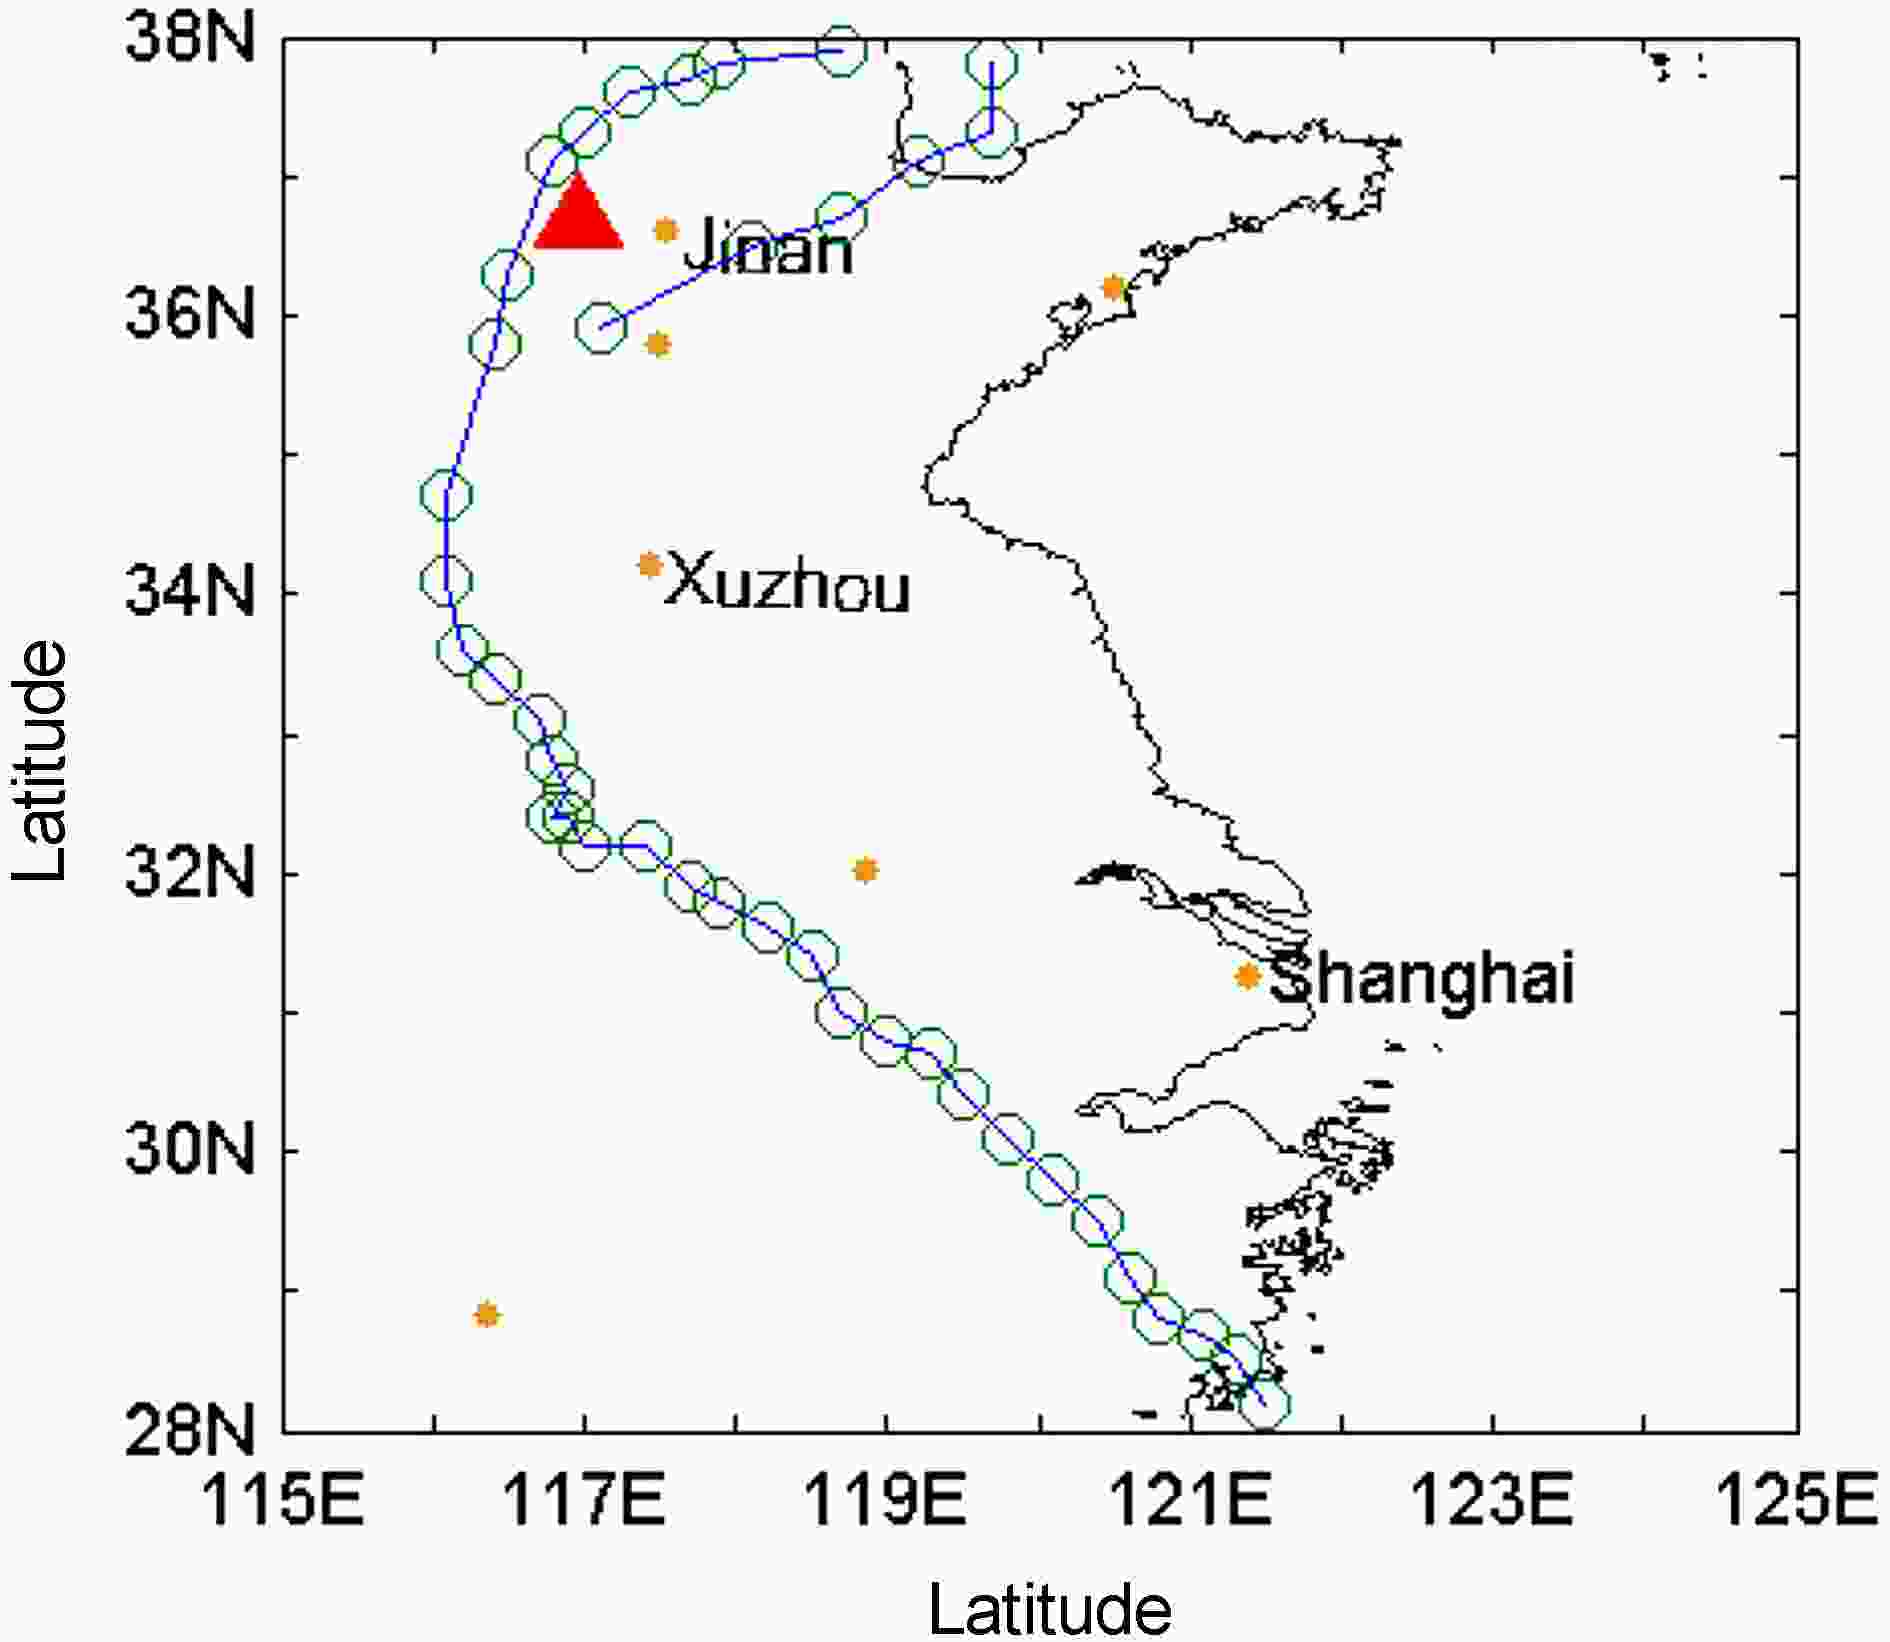
Figure 1. The track of Typhoon Yagi (201814), plotted every 6 hours. The red triangle represents the location of the MRR, cloud radar, and the Thies disdrometer. The focused area of this work is also in the red triangle region.
In this research, the corresponding rainfall parameters are observed by the MRR, cloud radar, and the Thies disdrometer at the Shandong Weather Modification Office (36°41'N, 116°59'E) in the city of Jinan, Shandong Province. The CINRAD-SA is located 20 km away from the other three instruments. The observations from the 24 GHz Micro Rain Radar, a Thies disdrometer, and a 35 GHz cloud radar are collocated, which facilitates studying the variability of DSDs during Typhoon Yagi (201814). The observed data from these four instruments are collected from 1639 UTC 13 August to 0409 UTC 14 August 2018, and the relevant instrument parameters are listed in Table 1.
Thies disdrometer MRR Cloud Radar CINRAD-SA Temporal resolution 1 min 1 min 5 s 6 min Vertical resolution surface 200 m 30 m 0.18, 0.54, 0.91, 1.25, 1.61, 2.26,
3.73, 5.57 and 7.58 kmMaximum height (above site) surface 6,000 m 15,810 m 7,582 m Number of range gates surface 20 m 527 m 9 Rain parameters Z, LWC, V, N(D), Nw, Dm Z(h), LWC(h), V(h),
N(D,h), Nw(h), Dm(h)Z(h), LWC(h), V(h) Z(h) Rain drop size bins 22 gates 64 gates No output No output Table 1. Instrument parameters
The MRR utilized here operates at 24.1 GHz (Peters et al., 2002), corresponding to a wavelength of 12.4 mm. The MRR observes rainfall parameters from the ground up to 6 km height for 30 levels at a resolution of 200 m and provides 1-min averaged raindrop number density measurements consisting of 64 bins from 0.246 mm to 5.03 mm in diameter, corresponding to a velocity range of 0.78 m s−1 to 9.34 m s−1. From the raw spectral power received by the MRR, the vertical profiles of the droplet number concentration N(D), radar reflectivity factor (Z), liquid water content (LWC), rain rate (R), and fall velocity (W) can be retrieved. Details of the retrieval methods can be found in Peters et al. (2005).
The Thies CLIMA laser precipitation monitor (LPM) is a laser-based, optical disdrometer that generates a parallel horizontal light beam of 785 nm in thickness covering an area of 45.6 cm2 (228 mm long, 20 mm wide). When the raindrops fall through the measurement area, the received signal is attenuated. The amplitude of the reduction is related to the drop sizes, and the duration of the reduction is related to the fall speed of the drops (Chen et al., 2016). Drops are classified into 22 size bins and 20 velocity bins that range over 0.125–8 mm in diameter and 0–10 m s−1, respectively. Additional specifications and operational details may be found in de Moraes Frasson et al. (2011) and the instrument manual (Thies Clima, 2007).
Ka-band millimeter-wave cloud radar can obtain continuous cloud and light precipitation measurements (Liu et al., 2017a, b; 2019), and its data analysis algorithms have been developed (Liu et al., 2014). The cloud radar utilized in this study is an all-solid-state Ka-band nephoscope with a wavelength of 8 mm, named “Auspicious Cloud”, and is built by China Xi’an Hua Teng Microwave Co., LTD. The cloud radar retrieves quantitative radar reflectivity, Doppler velocity, and spectrum width on vertical profiles up to 15.81 km above the radar via its headspace vertical detection to observe various cloud types, Cloud Top Height (CTH) and Cloud Base Height (CBH) also can be obtained. The cloud radar operates at a center frequency of 35 GHz with an antenna diameter of 1.6 m, and quasi-continuous wave and pulse compressions are adopted. More information can be found on the website at
http://htmw.cn/en/ .CINRAD-SA has similar performance specifications as the WSR-88D radar used in the USA NEXRAD. CINRAD-SA has a wavelength of approximately 10 cm, and its Doppler velocity field has a spatial resolution of 250 m and an azimuthal resolution of 1° (Chu et al., 2014). A comparison of the parameters of the four instruments is shown in Table 1. As shown in Table 1, the Thies disdrometer can retrieve rain parameters on the surface, the MRR and cloud radar can obtain profiles with different vertical resolutions, and radar reflectivity can be extracted from CINRAD-SA base data. Owing to the 11 elevations available when CINRAD-SA Volume Coverage Pattern 11 (VCP11) scan mode is selected, the radar reflectivity from 9 layers can be obtained above the site of the Thies disdrometer, the MRR, and cloud radar as these three instruments are co-located at the same site (Fig. 1). The vertical resolution of the CINRAD-SA is dependent on the distance of targets from the radar site. In this research, the CINRAD-SA is located 20 km away from the MRR and cloud radar. At a distance of 20–40 km, the beam-spreading effect from CINRAD-SA radar is minimal (Gage et al., 2000). The beamwidth of CINRAD-SA radar at the location of MRR is 169.3 m. To analyze the vertical structure of radar reflectivity changes with time, the observed radar reflectivity of CINRAD-SA radar was interpolated into grids with 360 radials and 460 range gates at each elevation scan, and the data of the nearest grid point to the location of MRR were extracted for vertical analysis.
1-Radiosonde data observed at 0000 UTC on 24 August was used to get profiles of temperature and relative humidity. The radiosonde station was located about 50 km away from the MRR and cloud radar.
Wind profiler radar located at Zhangqiu, which is about 50 km away from the MRR and cloud radar, can detect the wind direction and the horizontal and vertical speeds at various heights above the ground.
The MRR, Ka-band cloud radar, and CINRAD-SA Doppler weather radar were utilized to investigate the vertical structure of Typhoon Yagi (201814). Combining data from these three radars, we can obtain a comprehensive view of the precipitation system. The MRR wavelength is 1.2 cm, and small cloud droplets can barely be detected. In addition, the built-in signal analysis of the MRR always assumes the presence of liquid raindrops METEK (2009), so the retrieval of microphysical distributions and parameters of MRR above the 0 °C level is not available (Wang et al., 2017a). Due to the limitations of the observation height and the MRR algorithm, it is necessary to use the cloud radar to jointly observe the development and evolution of clouds before precipitation. The advantage of the 8-millimeter cloud radar is that it can detect non-precipitating cloud droplets and small rain droplets. The Thies disdrometer data are compared with the MRR data to examine the data quality and are used to analyze the DSD characteristics of the surface rainfall.
-
Referring to Chen et al. (2011), for the Thies disdrometer, Ndis(D) at a discrete instant is calculated using the following:
where ni,j is the number of drops placed in size bin i (i=1:22) and velocity bin j (j=1:20), A is the sampling area (45.6 cm2), Δt (s) is time resolution (60 s), Vi (m s −1) is the fall speed for velocity bin i and size bin j, and ΔDj (mm) is the corresponding diameter interval for size bin j.
The retrieval procedures for the MRR are discussed in detail in Peters et al. (2010) and METEK (2009).
NMRR(D) can be derived from the MRR spectral reflectivity density η(D) and single-particle back-scattering cross-sections
$ \sigma \left(D\right) $ :Where η(D) is related to the measured spectral reflectivity
$ \eta \left(f\right) $ :$ \partial $ f/$ \partial $ υ is Doppler relation,$ \partial $ υ/$ \partial D $ can be calculated by empirical relation (Gunn and Kinzer, 1949):Then the radar reflectivity factor Z in mm6 m−3 and rain rate R in mm h−1 can be obtained based on either Ndis(D) or NMRR(D).
Specifically, the nth-order moment of the drop size distributions is expressed as follows:
The mass-weighted mean diameter Dm (mm) is computed as the ratio of the fourth to the third moment of the size distribution:
and the generalized intercept parameter Nw (mm−1 m−3) that is defined by Bringi et al. (2003) as follows:
where ρw represents the water density (approximately 1.0 g cm−3) and W (g m−3) is the liquid water content for the corresponding size distribution. Here, Dm and Nw are calculated directly from N(D).
-
The reflectivity spectra of the MRR have been corrected for the noise floor and attenuation (METEK, 2009) in our work. Both the MRR and the Thies disdrometer can deduce particle velocity, which is composed of the wind speed and the particle fall velocity (referred to as the fall velocity hereafter). The measurement accuracy of velocity may be adversely affected by strong winds, splashing, and margin faller effects (Friedrich et al., 2013a, b). Therefore it is necessary to adopt quality control schemes to provide reliable measurements, especially within convective precipitation processed where strong winds and high rainfall rates are common. Data quality control applied in this study refers to the method of Friedrich (2013b).
Figure 2a shows the raw measurements of accumulated number concentrations on 13–14 August 2018 by the Thies disdrometer. First, it is noted that for disdrometers, the presence of strong winds may cause particles larger than 5 mm in diameter to have unrealistically slow fall velocities [< (1−2) m s−1] according to Friedrich et al. (2013b). However, the selected event in this study showed that winds had little influence on the Thies disdrometer as shown in Fig. 2b. Secondly, margin faller means that the actual fall velocity of small particles is greater than that predicted by the empirical formula (Atlas, 1973) when particles fall through the edges of the sample area. To avoid the effects of margin faller, the particles with diameters less than 8 mm and fall speeds greater than 80% of the empirical speed are removed. As shown in Fig. 2c, margin faller results in a large number of small rain particles. Thirdly, splashing causes particles to hit the instrument, break apart, and rebound back into the sample area, which leads to particles smaller than 2 mm with fall velocities ranging from 0.5 m s−1 to 9 m s−1. On account of splashing, the particles with diameter less than 2 mm and fall speeds smaller than 60% of the empirical speed are removed. As a result, large numbers of small particles with especially small speeds were considered outliers (Fig. 2d). The complete quality control scheme consists of the three steps mentioned above. After quality control has been implemented in the number of raindrops, the raindrop number concentration per unit volume could be calculated based on equation (1). Radar reflectivity factor, rainfall rate, mass-weighted mean diameter, and the generalized intercept parameter are also calculated using equations (5), (6), (8), (9) respectively.

Figure 2. Measurement of accumulated number of drops (Nd) on 13–14 August 2018 by Thies disdrometer. Empirical fall velocity of raindrops as indicated by the Thies disdrometer is denoted by the blue line. (a) Raw accumulated number of drops at velocity–diameter dimension. (b) Particles affected by strong winds indicated in the black circle were removed. (c) Particles affected by margin faller indicated in black oval (upper-left corner) were removed. (d) Particles affected by splashing indicated in black oblateness (left bottom) were removed.
-
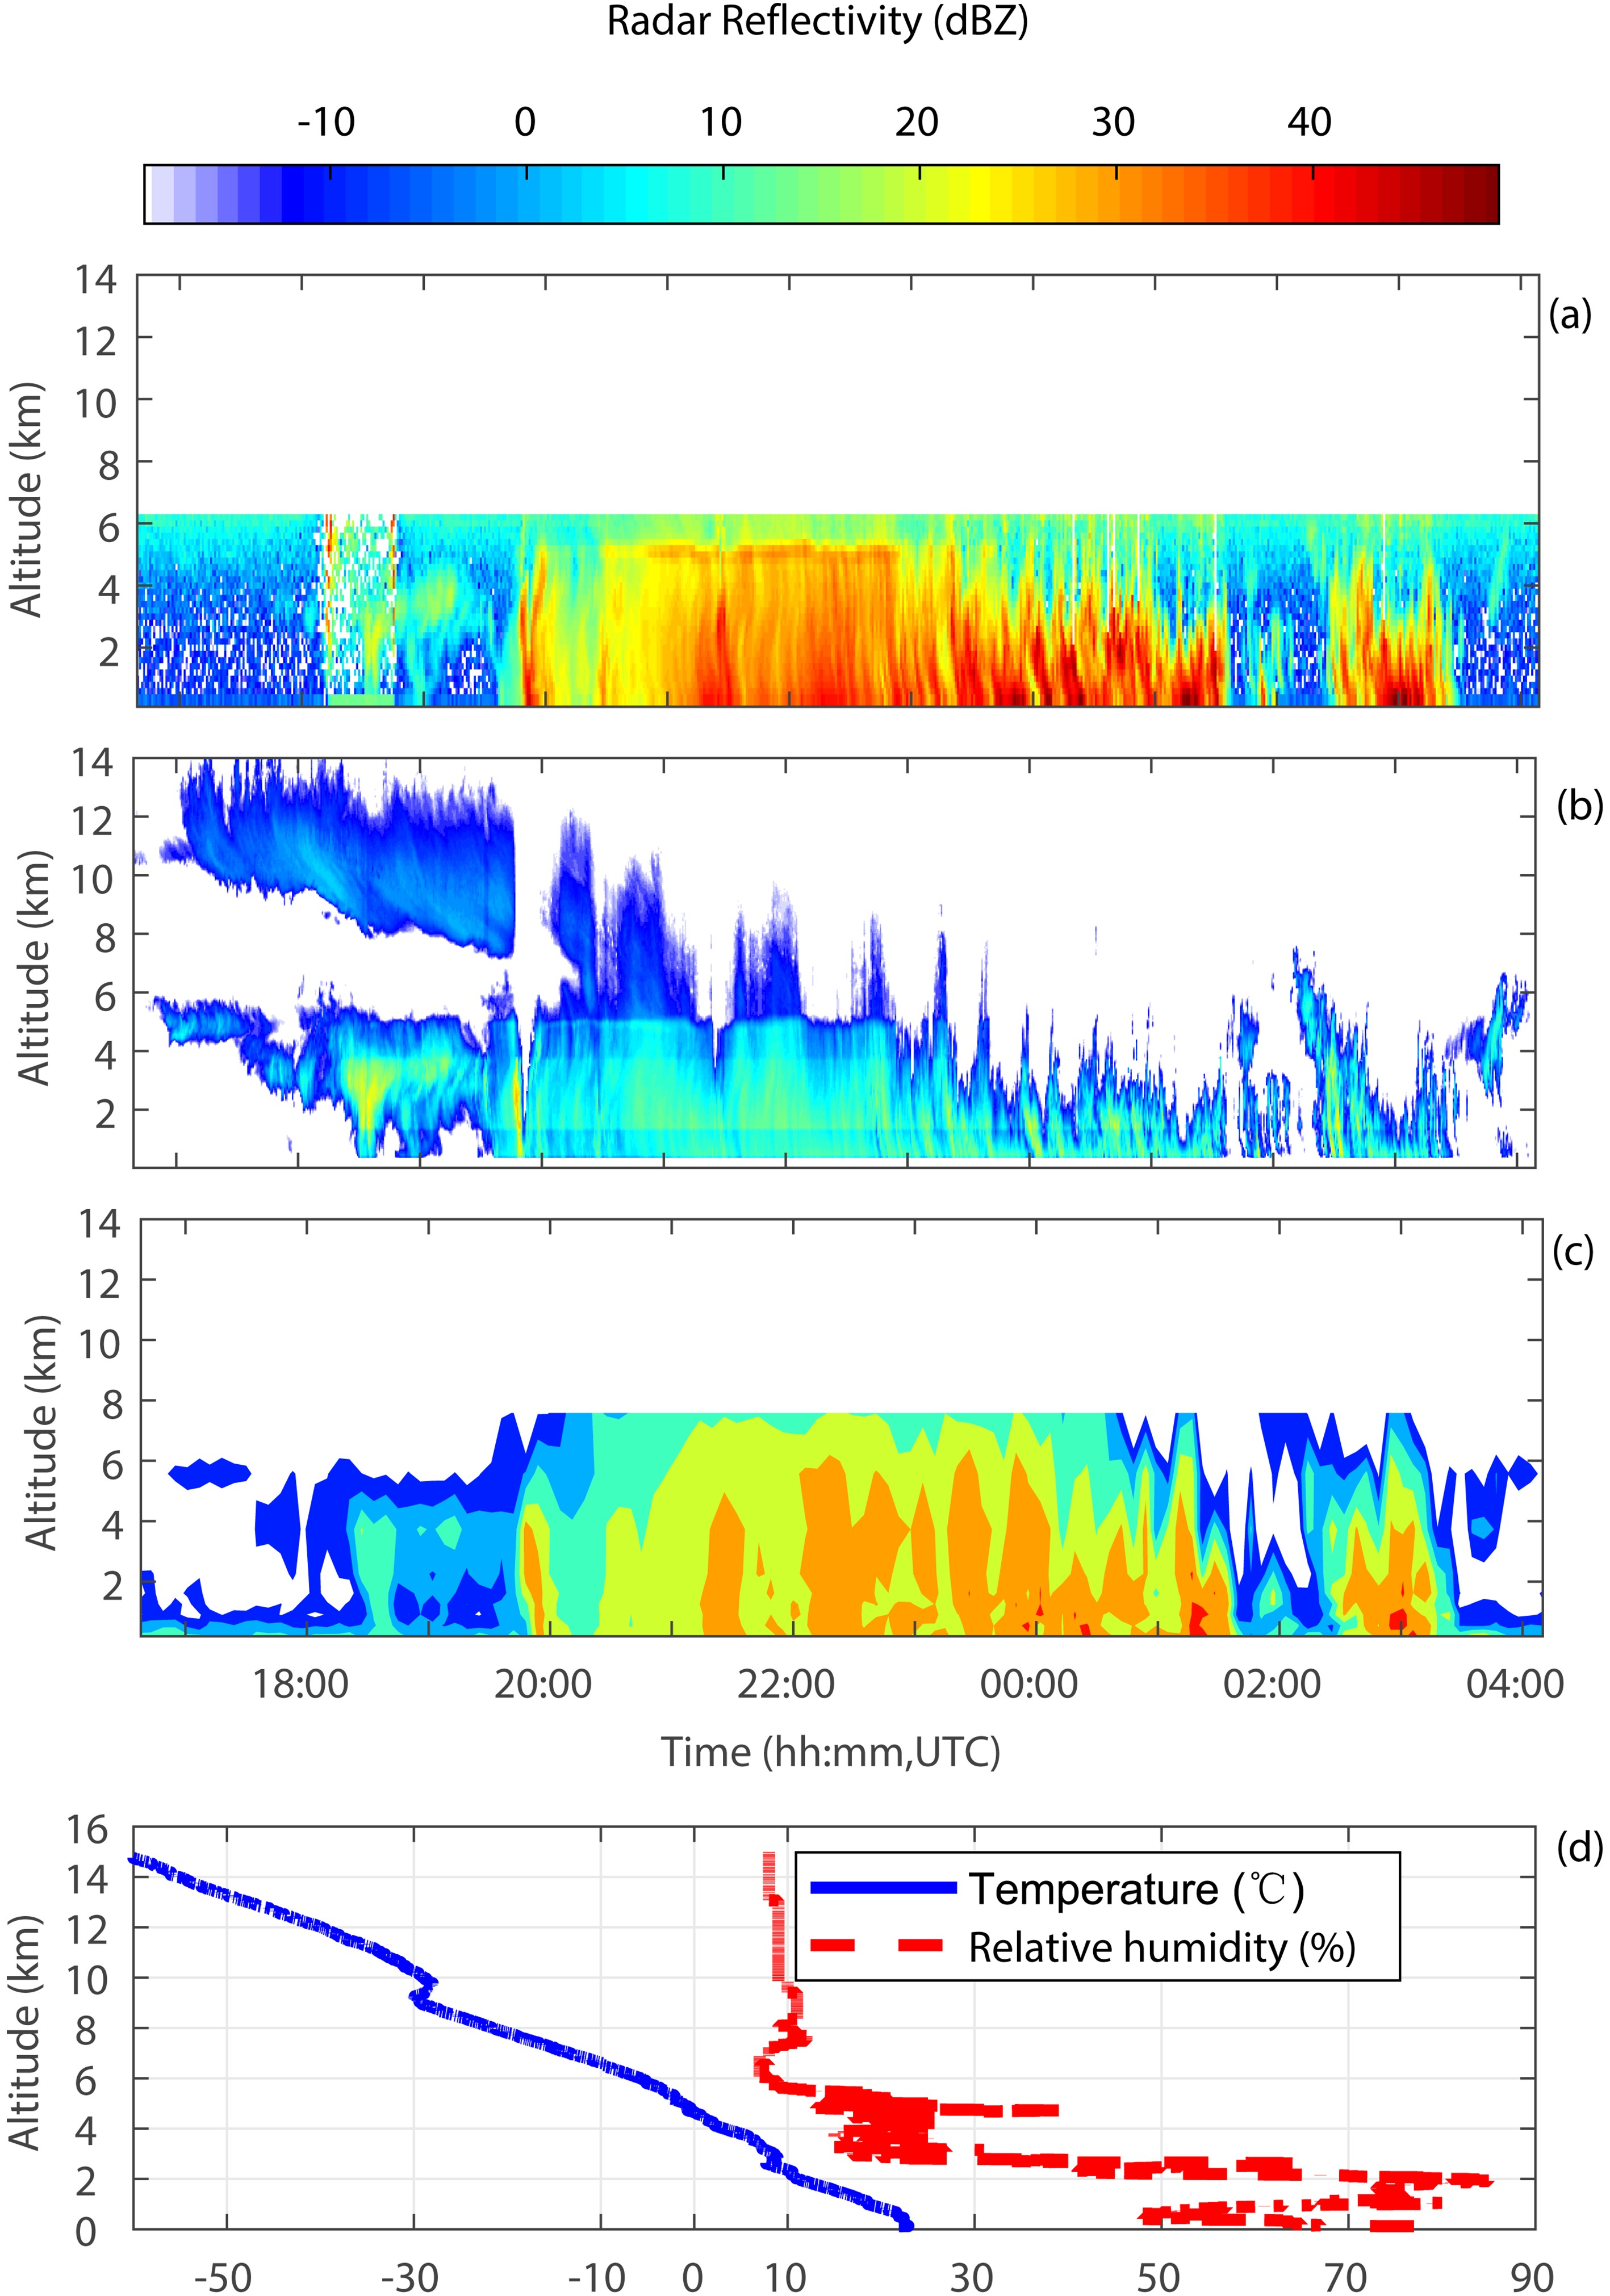
Radars with different wavelengths can explore the vertical structure characteristics that exhibit different physical scales of rainfall. This section shows the vertical structures when Typhoon Yagi (201814) was passing by Jinan, which include profiles of reflectivities and fall velocities observed by different instruments. Figure 3 shows the time-height radar reflectivity plot of the MRR, cloud radar, and CINRAD-SA Doppler weather radar, respectively, while Typhoon Yagi (201814) was passing Jinan.

Figure 3. Radar reflectivity presented in time vs. height coordinates during the passage of the rain period over the MRR (a), cloud radar (b), and CINRAD-SA (c) Doppler weather radars. The CINRAD-SA Doppler weather radar, located at Jinan (36°48'N, 116°47'E), is 20 km away from the MRR and cloud radars. Figure 3c shows a time-height cross-section from the CINRAD-SA over the location of the MRR and cloud radar. (d) Temperature and relative humidity profiles from a radiosonde station located about 50 km away from the MRR and cloud radar, observed at 0000 UTC 24 August. The height of the 0°C layer observed by radiosonde was 5.14 km.
The bright band can be identified by the radar reflectivity peak value below the 0°C isotherm. As shown in Fig. 3a, the maximum radar reflectivity values were found in a height range from 4.8 km to 5.2 km for several hours from 2030 UTC to 2330 UTC. During this period, light rain occurred steadily with the presence of a bright band that was identified as stratiform rain. After 2330 UTC, the bright band disappeared, and the Z values exhibited an evolution that was noticeably different in time than that before 2330 UTC.
Note that before the stratiform precipitation, at 1950 UTC, there were high values of radar reflectivity over the MRR and the weather radar from the ground up to 5 km height, while at the same time, there was significant attenuation for the cloud radar signals for heights above 2 km. There was also significant attenuation in the MRR (Fig. 3a) and cloud radar signals (Fig. 3b) that occurred from 0000 UTC to 0300 UTC at heights above the 5 km level, meanwhile CINRAD-SA radar can observe high reflectivity above 5 km with fewer attenuation impacts. It is worth noting that, from 1700 to 1900 UTC, the CINRAD-SA radar had a noticeable echo near the ground, while the cloud radar did not. The possible reason is that cloud radar and weather radar have different sampling spacing at this point. The calculation results show that the lowest detection volumes of the CINRAD-SA radar and cloud radar were 1.80×10⁸ m3 and 1.38 m3 respectively. The significant difference in the sampling area suggested that the weather radar might have detected low clouds nearby. The cloud radar can clearly observe the vertical evolution of clouds over the time before precipitation occurred on the ground (Fig. 3b). Before 1750 UTC, there are two layers of cloud, the height of the upper layer cloud top was 14 km, the height of the lower cloud top was 6 km, and the vertical distance between the two layers of cloud was 4 km. Coincident with the development of the precipitating cloud, the height of the upper cloud top gradually decreased, while the height of the lower cloud remained unchanged. The two layers of cloud approached each other in the vertical direction, when they merged, precipitation appeared on the ground. The vertical evolution of virga before precipitation, observed by the cloud radar, could be used to cover the MRR deficiency due to its weakness in observing clouds. Meanwhile, the CINRAD-SA has much coarser vertical resolution compared to both the MRR and cloud radar (Table 3), when the CINRAD-SA radar is at an elevation of 9.9 deg. and 14.6 deg., the observation altitude at the site of the micro rain radar is 3.73 km and 5.57 km, respectively. However, the altitude of the bright band is from 4.8 km to 5.2 km observed by the micro rain radar. CINRAD-SA radar just missed the height of the bright band, resulting in the absence of a bright band at a height of approximately 5 km (Fig. 3c). The CINRAD-SA radar is nearly insensitive to attenuation due to its large wavelength (~10 cm), while the MRR and cloud radar are sensitive to attenuation at moderate to high rainfall rates, which can be used in multi-wavelength radar observation.
Statistic Total Dataset Convective Stratiform Mixed Light Duration (min) 499 38 179 120 44 Cumulative precipitation (mm) 60.3331 22.5068 8.2181 20.2650 0.3138 Contribution (%) 100% 37.3% 13.62% 33.59% 0.52% Table 3. Classification of rainfall types used from the observations of the Thies disdrometers
The radar reflectivities observed by the MRR, cloud radar, and CINRAD-SA Doppler weather radar are clearly different (Fig. 3). According to the Probert-Jones equation for meteorological radar (Probert-Jones, 1962), discrepancies in radar reflectivity values measured with three radars can be attributed to differences in many parameters: radar characteristics, the distance to the target, and the nature of the meteorological target itself. For instance, on one hand, the attenuation and back-scattering capability of the same target to different wavelength radars are varied; in theory, the amount of power received varies inversely with the square of the wavelength. On the other hand, the reflected energy reaching the antenna varies inversely with the square of the distance to the target, which may be one of the sources of the observed differential reflectivities between CINRAD-SA radar and the MRR. The fall velocity of the hydrometeors increased in the melting layer, therefore, the observed fall velocity can be used to identify the height and thickness of the bright band (Wang et al., 2017a). Figure 4a and Figure 4b show the fall velocities of the droplets observed by the MRR and cloud radar, respectively, for this event. As the droplets fell, the fall velocity of droplets in the presence of the bright band increased from a height of approximately 5.1 km, which was the height of the top of the bright band, matching well with the 0°C level (5.14 km) observed by radiosonde at 0000 UTC 14 August. This increase in the fall velocity of droplets indicated that the snow aggregates started to melt near the top level of the melting layer (White et al., 2002; Kim et al., 2011; Kim and Lee, 2016). The fall velocity continued to increase below the reflectivity peak (Pfaff et al., 2014), before reaching a maximum value at a height of 4.7 km, which means the ice-phase hydrometeors melt into liquid water completely at the height of bright band bottom (Rico-Ramirez and Cluckie, 2007). Radars with different wavelengths have the abilities to detect the bright band (Cao et al., 2019), the height of melting layer observed by MRR, and cloud radar in the selected rainfall event (Fig 3a, 3b; Fig 4a, 4b) were insignificant. However, there were still differences in the magnitude of reflectivity from the two observations. The fall velocity at all observed 30 layers of the MRR has been compared with the cloud radar at the same altitude, the results show that the difference in fall velocity between the MRR and the cloud radar was smaller in the presence of the bright band compared to that in the absence of the bright band. Figure 4c is an example from a height of 600 meters and the probable reasons for this phenomenon are explored in section 4.2.1 below.
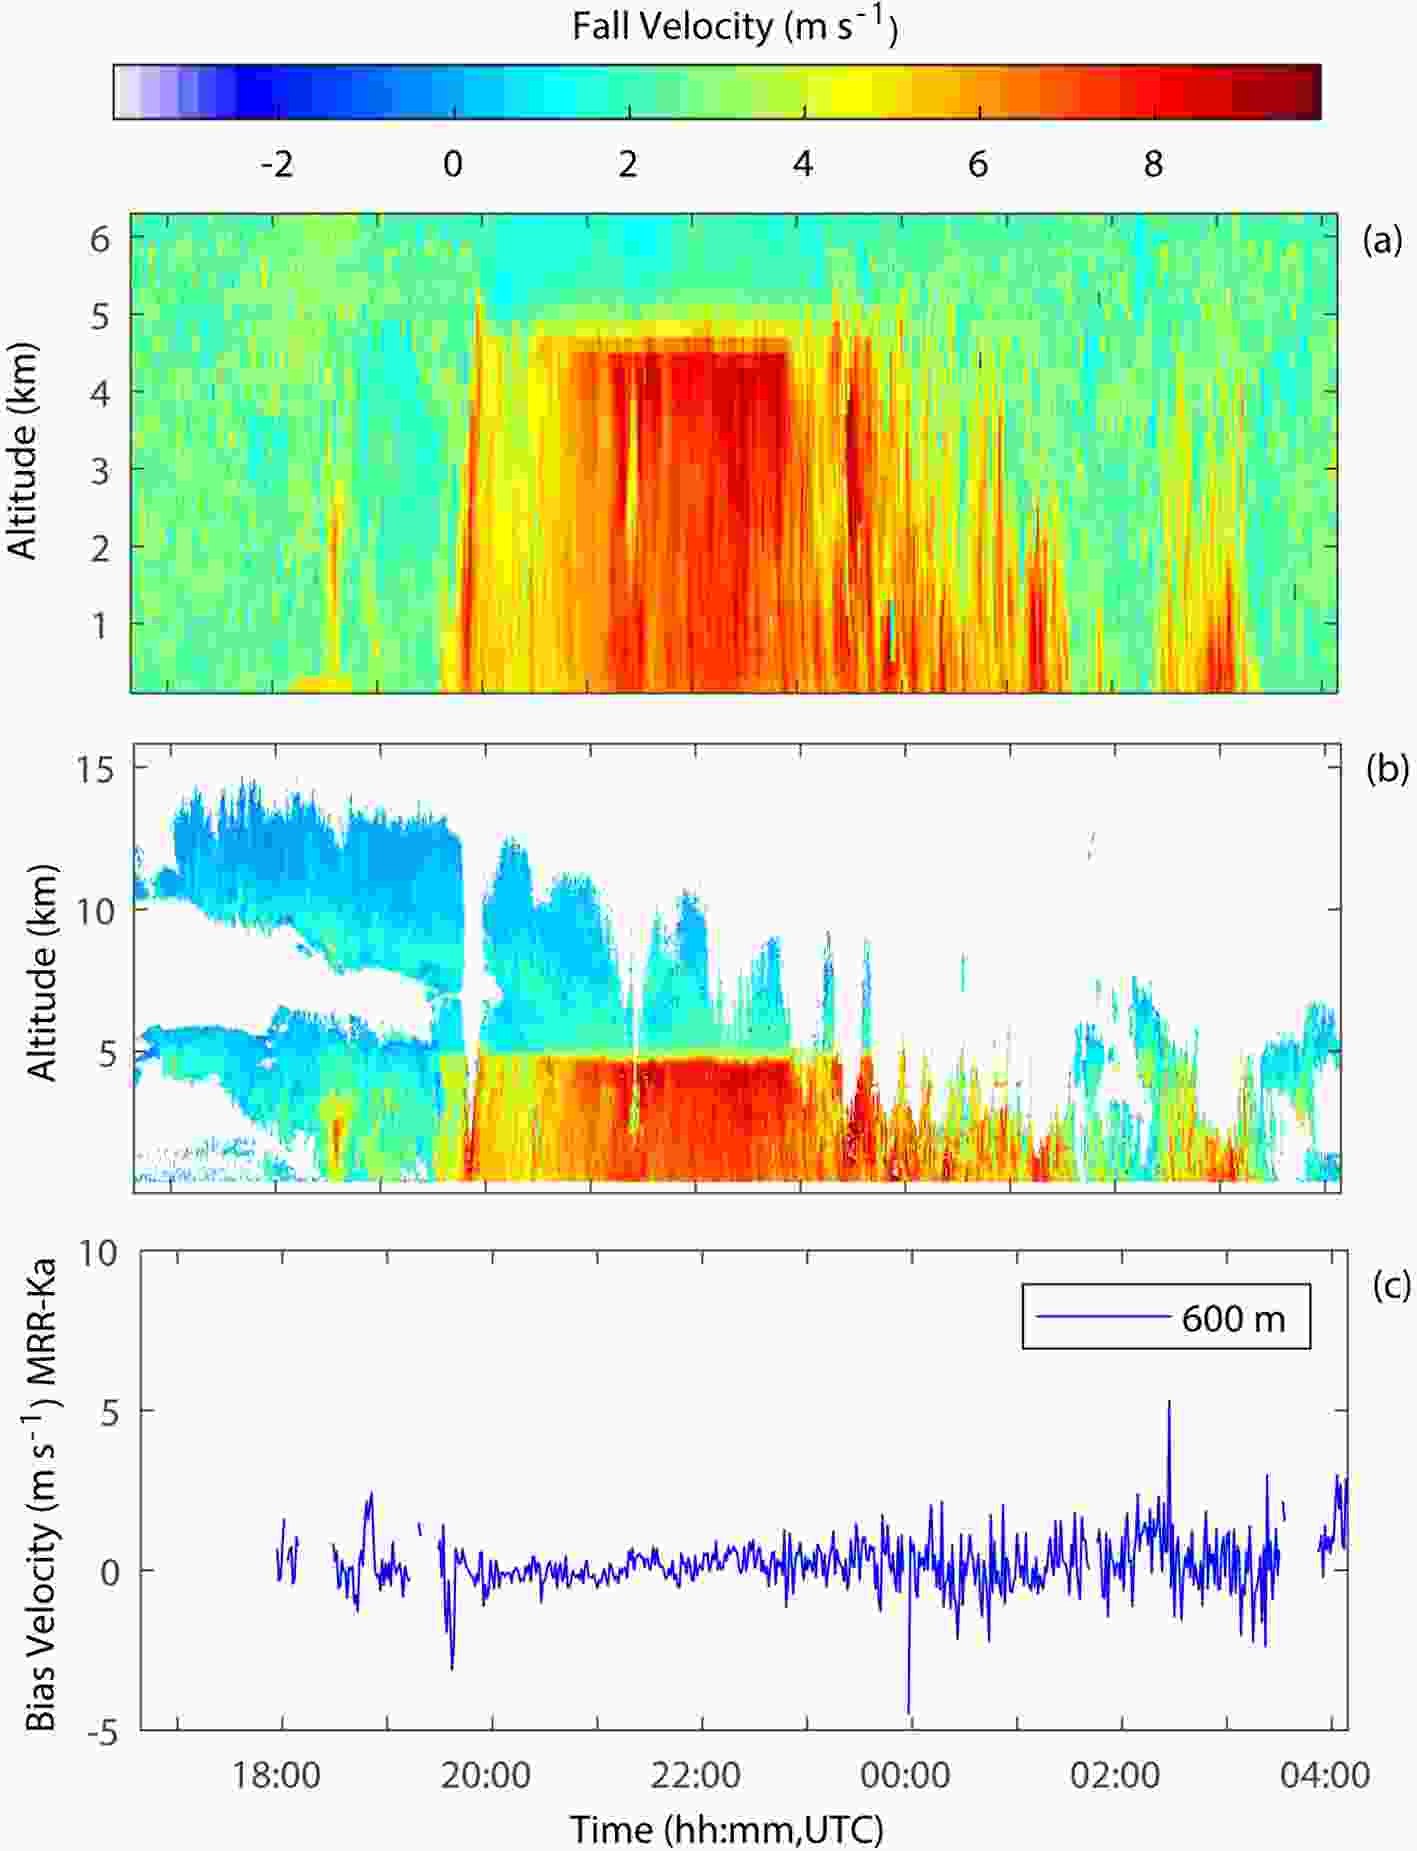
Figure 4. Fall velocities presented in time vs. height coordinates measured by the MRR (a) and cloud radar (b). Fall-velocity bias between the MRR and cloud radar at 600 m height (c).
-
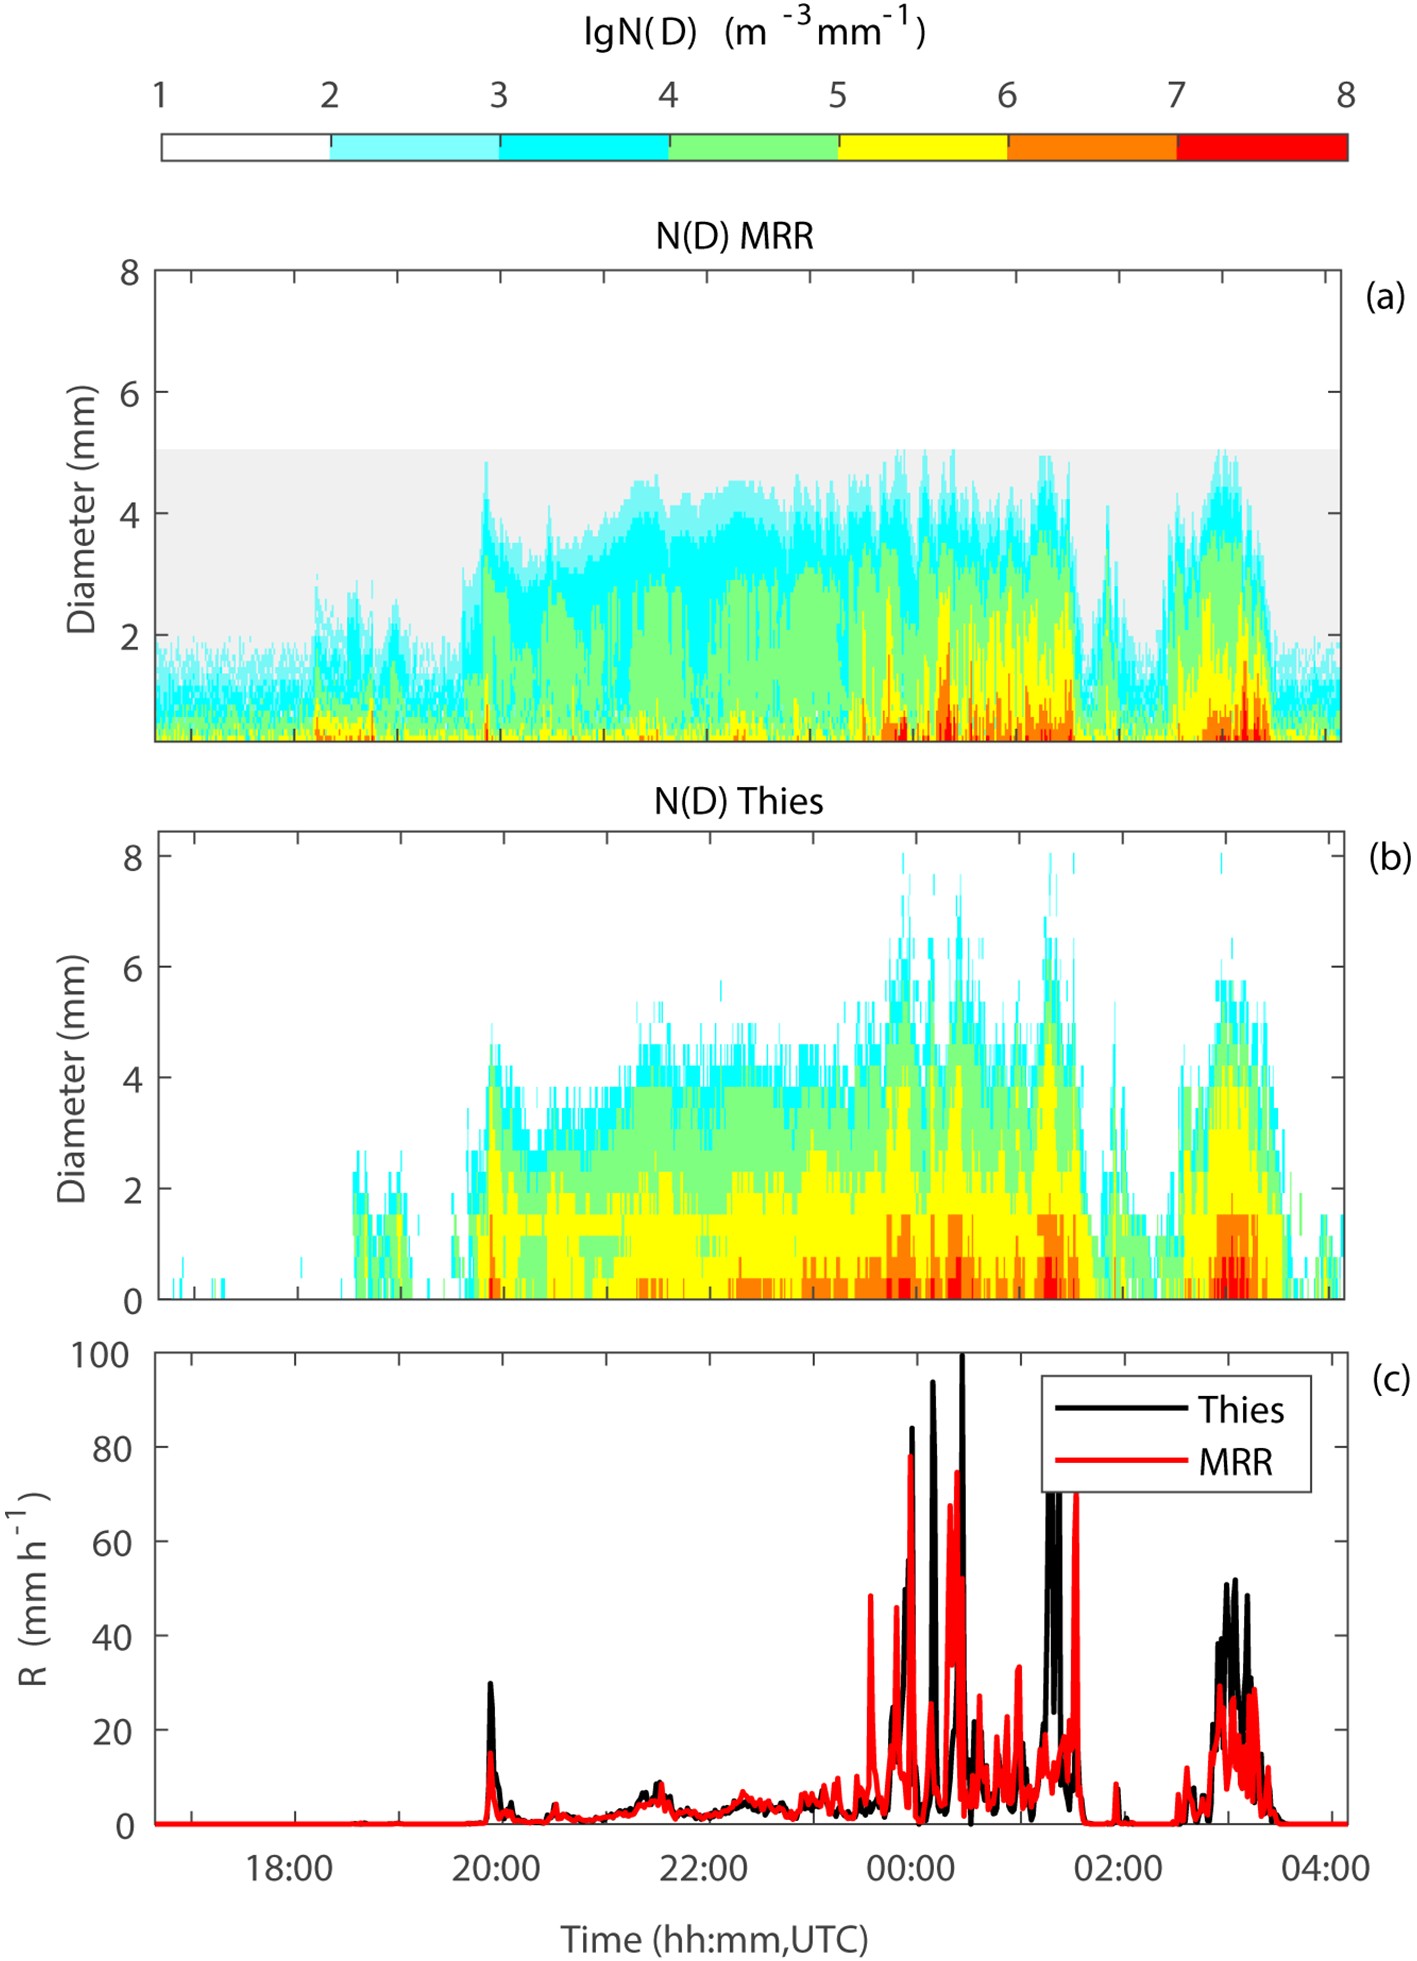
To investigate DSD variability during Typhoon Yagi (201814) while it was passing Jinan, the Thies disdrometer and the MRR were deployed there. These two instruments were located nearly 20 m from each other. The DSDs obtained from the MRR were considered to be at an altitude of 400 m and within an area of 153 m2. The cross-sectional area of the Thies disdrometer is 45.6 cm2. The time period analyzed spanned 1639 UTC 13 August to 0409 UTC 14 August 2018 and the temporal resolution of both the MRR and disdrometer is 1 min.
Figure 5 shows the DSDs and rainfall rates observed by the MRR and disdrometer. Specifically, the maximum value of the raindrop size observed by the MRR was 5 mm, which was smaller than what the disdrometer observed. In Fig. 5b, the maximum diameter observed by the disdrometer was 8 mm. In particular, when the rainfall rate increased to more than 40 mm h−1 (Fig. 5c), the maximum raindrop size observed by the MRR was almost unchanged. The reason for this deviation may be that the measured spectra of the MRR suffered from aliasing errors in the presence of strong vertical winds (Tridon et al., 2011). Therefore, the utility of the MRR in heavy rain has been questioned (Calheiros and Machado, 2014; Adirosi et al., 2016). It is worth noting that the resolution regarding droplet diameters of the Thies disdrometer is much lower than that of the MRR, so Fig. 5b has a poor graphic resolution. During the period when the bright band was present, steady precipitation occurred with smaller rainfall differences between the MRR and Thies disdrometer and smaller rainfall rates before 2350 UTC.

Figure 5. Drop size distributions at the surface observed by the MRR (a) and Thies disdrometer (b). The rainfall rate retrieved by the Thies disdrometer and MRR are shown in Fig. 5c.
For further analysis, the mass-weighted mean diameter (Dm) and normalized intercept (Nw) are analyzed. In the presence of the bright band, the consistencies of R, Dm, and Nw between the MRR and the Thies disdrometer were relatively high. With the bright band fading, the differences between the parameters retrieved by the MRR and Thies disdrometer became greater than before. As shown in Table 2, the mean R biases were 0.73 mm h−1 and –1.15 mm h−1 with the presence and absence of the bright band, respectively, while the standard deviations of the biases were 1.38 and 11.99, respectively. The Dm and Nw values showed similar characteristics. When the bright band was present, the mean biases and their standard deviations of Dm (lgNw) were 0.03 mm and 0.25 mm (0.12 mm−1 m−3 and 0.24 mm−1 m−3), respectively. When the bright band disappeared, the mean biases and their standard deviations of Dm were –0.62 mm and 0.70 mm, while those of lgNw were ‒0.76 mm−1 m−3 and 3.43 mm−1 m−3.
MRR-THIES Bright Band No Bright Band Rain rate R (mm h–1) Mean bias 0.73 –1.15 Standard deviation of the bias 1.38 11.99 Mass-weighted mean diameter Dm (mm) Mean bias 0.03 –0.62 Standard deviation of the bias 0.25 0.70 Normalized intercept NwlgNw (mm–1 m–3) Mean bias 0.12 –0.76 Standard deviation of the bias 0.24 3.43 Table 2. Deviation statistics of the rainfall rate, mass-weighted mean diameters, and normalized intercepts between the MRR and Thies disdrometer.
As shown in the above analysis, with the presence of a bright band, the precipitation parameters (e.g., R, Dm, and Nw) retrieved by the MRR and disdrometer exhibited smaller biases and standard deviations compared to the values observed in the absence of a bright band. To investigate the reason why this happened, several weather parameters observed by surface automatic weather stations were analyzed, and it was found that extreme wind speeds, which are quantified as the maximum values of instantaneous wind speed within 5 minutes, exhibited a consistent trend with the bias between these two instruments. After 2350 UTC, the extreme wind speeds increased sharply, and the differences increased dramatically along with the extreme wind speeds (Fig. 6a). It appears that the extreme wind speeds affect the retrieval of the rainfall parameters. Furthermore, the Doppler Velocity Standard Deviation (STD) observed by the cloud radar mainly reflects the difference of the fall velocity of precipitation particles and air turbulence, the STD profile (Fig. 6b), and the mean STD of observational layers (Fig. 6c) show that compared with the existence of the bright band, the value of STDs was greater in the absence of the bright band, which means there were more large precipitation particles and larger air turbulence. The Zhangqiu wind profile radar (Fig. 6d), which is about 50 km away from the site of the MRR and cloud radar, shows that the vertical speed was much larger during the latter part of the precipitation process. The above observations show that in the absence of a bright band during the selected typhoon event, both the turbulence and vertical wind were strong. However, the standard process of the MRR retrieval of the precipitation parameters is conducted under the assumption of zero vertical wind (Peters et al., 2005). Therefore, one of the main sources of error and limitations of the MRR is that the retrieval method does not account for the deviations caused by vertical air motions and turbulence (Prat and Barros, 2010; Wang et al., 2017b). Schafer et al. (2002) pointed out that wind shear and turbulence were greater in strong convection than in stratiform precipitation. Therefore, while there were strong vertical winds, the fall speeds of the raindrops detected by the MRR were modified by the vertical wind, especially in convective precipitation. Vertical wind velocities are rarely greater than 1 m s−1 in a stratiform precipitation process (Cifelli and Rutledge, 1994; Konwar et al., 2012; Wang et al., 2017a), and the errors caused by the relatively smaller vertical wind can be ignored. However, in convective precipitation, the shifting or aliasing of the reflectivity spectra caused by strong vertical winds can result in faulty rainfall parameters (Konwar et al., 2012), which cannot be ignored. Considering the influence of both attenuation and vertical winds, only the lowest layer of the MRR data was quantified for convective precipitation.
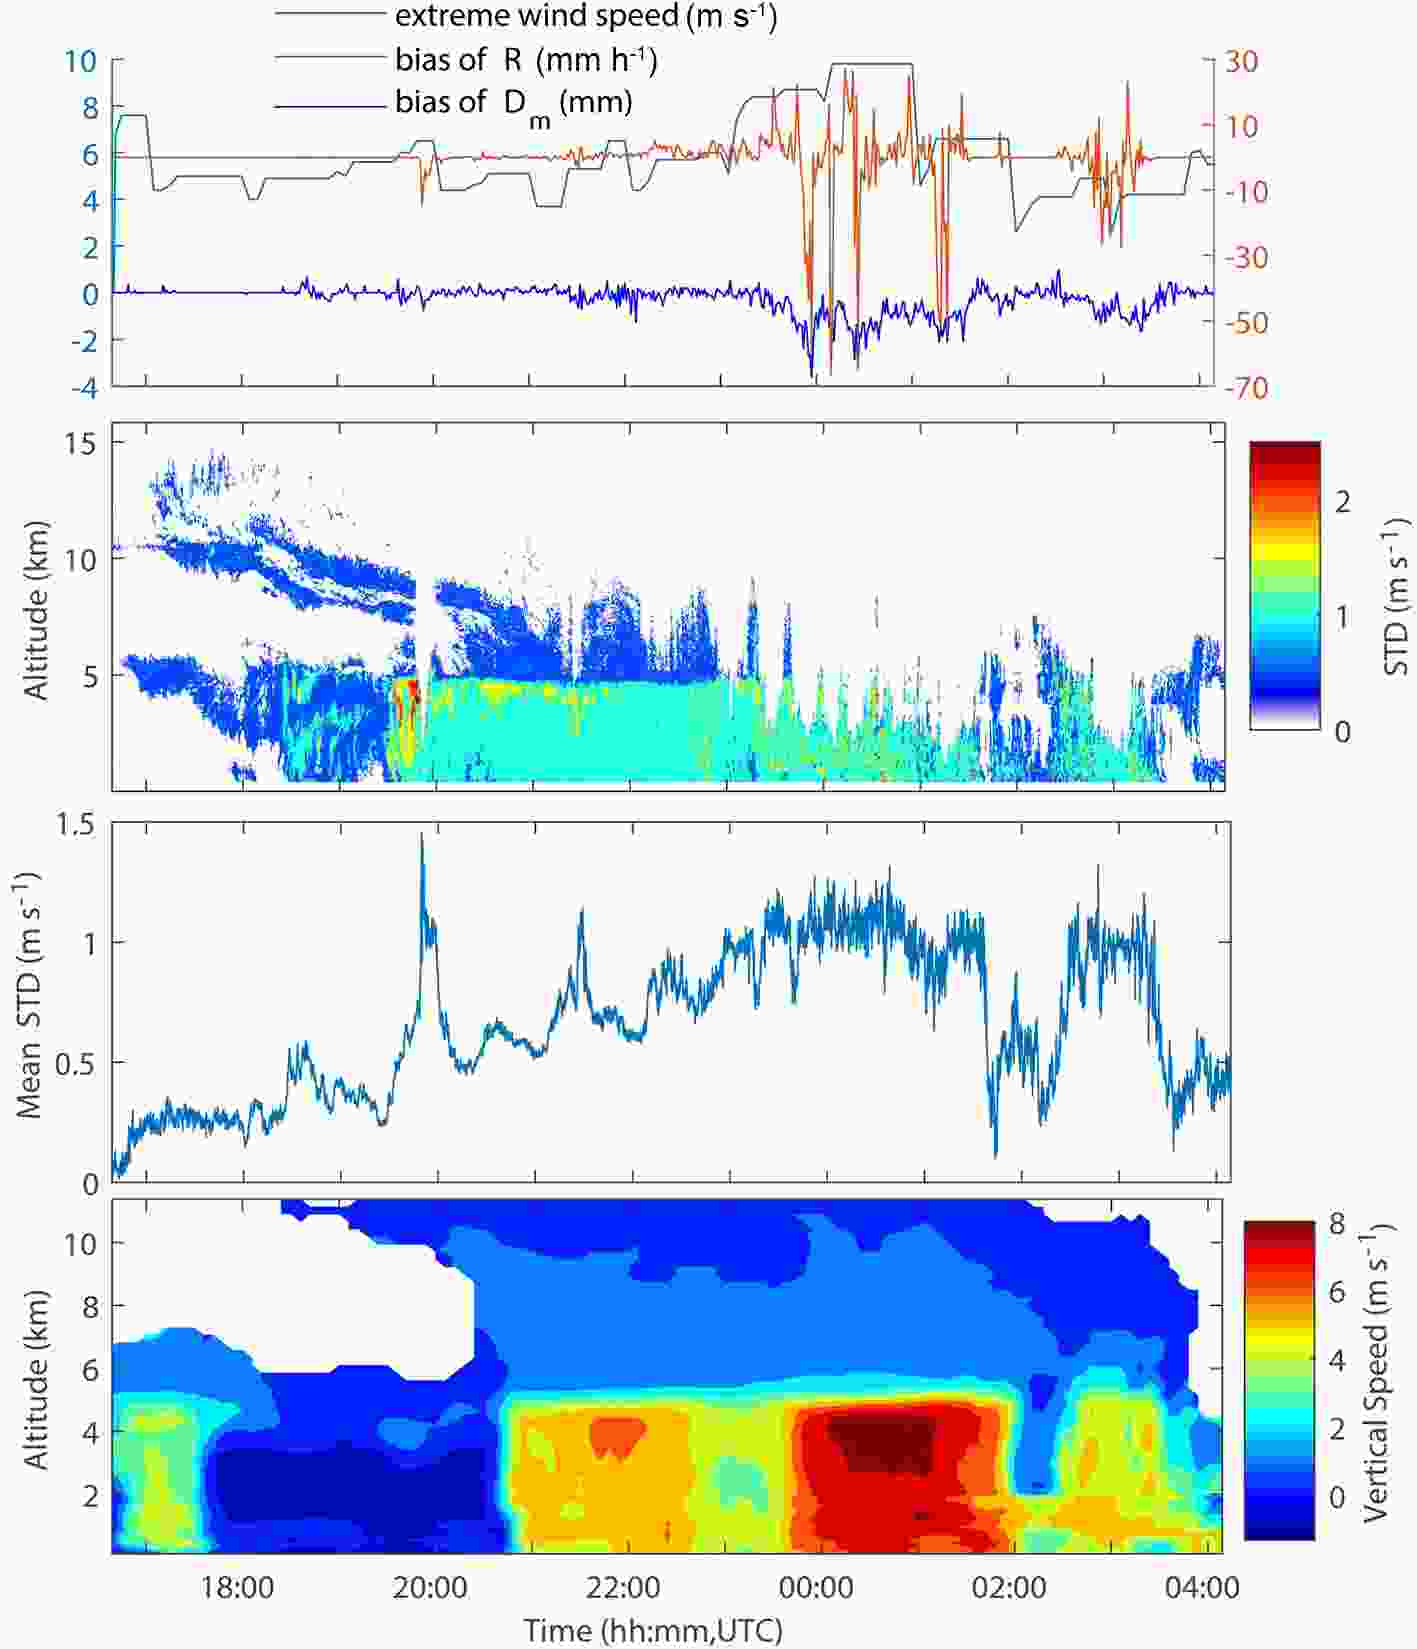
Figure 6. (a) The extreme wind speeds (blue circles), bias of rainfall rate (R) (green stars), and Dm biases of (blue stars) between the MRR and Thies disdrometer at the surface during Typhoon Yagi (201814) while passing over the location of these two instruments. (b) Doppler Velocity Standard Deviation (STD) presented in time vs. height coordinates measured by the cloud radar. (c) Mean STD for altitudes as a function of time. (d) Vertical wind speeds presented in time vs. height coordinates measured by Zhangqiu Wind Profile Radar which is about 50 km away from micro rain radar and cloud radar.
-
For this study, it is necessary to identify the rainfall types before the analyses of the DSD data (Tokay and Short, 1996; Testud et al., 2001). The classification of rainfall types is based on the method described by Bringi et al. (2003). In a sequential 10 min rainfall period, if the rainfall rates are greater than or equal to 5 mm h−1 and the standard deviations of the rainfall rates are greater than or equal to 1.5 mm h−1, then the samples are considered to be convective precipitation. Stratiform precipitation is considered as a sample with rainfall rates greater than 0.5 mm h−1 and a standard deviation smaller than 1.5 mm h−1. Here, certain characteristics were found with the rest of the samples. Mixed precipitation (rainfall rates are greater than 0.5 mm h−1 and less than 5 mm h−1, when standard deviations are greater than 1.5 mm h−1 in a sequential 10 min period) and light precipitation (rainfall rates are greater than 0 mm h−1 and less than 0.5 mm h−1, when standard deviations are less than 1.5 mm h−1 in a sequential 10 min period) are classified. A result of such a classification scheme is shown in Table 3, and a total of 499 minutes of rainfall samples was recorded. Although the number of samples with convective precipitation was smaller, they contributed the most to the cumulative rainfall amount. Moreover, stratiform precipitation, despite having the greatest number of samples, produced a relatively smaller contribution to the cumulative rainfall amount, second only to light precipitation.
To validate the classification results, vertical structures were used to examine the rainfall types. Figure 7 presents the vertical profiles of radar reflectivity from the MRR in which all four different rainfall types are represented. The classified convective, stratiform, mixed, and light rain samples observed by the Thies disdrometer are illustrated by the red, blue, celeste, and yellow bars, respectively (at the top of Fig. 7). The precipitation classifications used in this study matched well with the vertical structure of the MRR reflectivity factor. Stratiform precipitation is indicated by a clear bright band at a height of 5 km, while several samples of mixed precipitation were embedded within the bright band at approximately 2115 UTC 13 August 2018. The convective and mixed systems were observed for almost three hours after the period of the stratiform precipitation. The rain rate retrieved at 200 m height (the lowest MRR gate) ranged from 10 mm h−1 to 60 mm h−1 during the convective and mixed systems, while the rain rate in the stratiform area was below 8 mm h−1 (Fig. 5c).
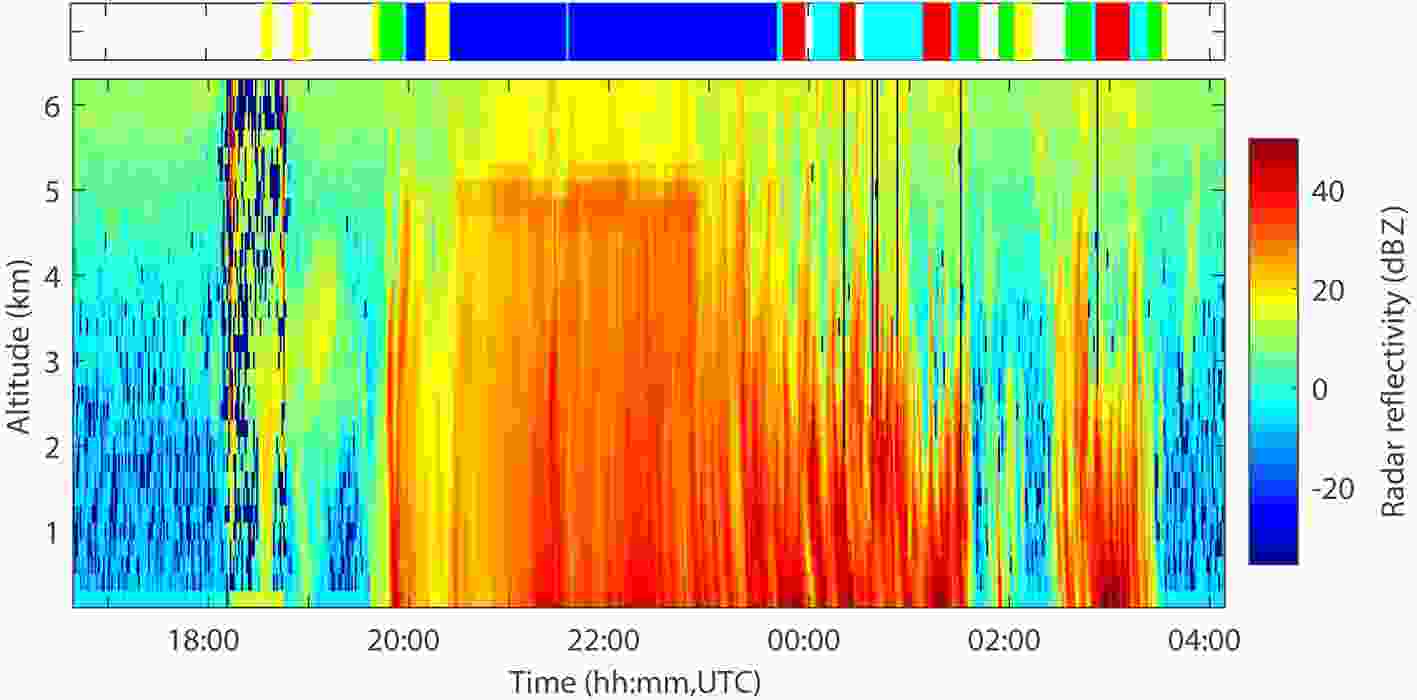
Figure 7. The vertical profile of radar reflectivity observed by the MRR from 1639 UTC 13 August to 0409 14 August 2018. The classified convective, stratiform, mixed, and light rain samples observed by the Thies disdrometer are illustrated by the red, blue, celeste, and yellow bars, respectively, shown at the top of the diagram.
The DSD characteristics of different rainfall types on the surface are shown in Fig. 8 using Dm and Nw. As shown in Fig. 8, the stratiform precipitation had higher concentrations of small drops (D < 1.5 mm), while the convective precipitation had higher droplet concentrations and larger raindrop sizes than the stratiform precipitation; however, the sample numbers of convective precipitation were fewer than those from stratiform precipitation. Therefore, the major contribution of large raindrops is the reason why the convective precipitation exhibited higher rainfall rates and higher reflectivity.

Figure 8. Scatter plot of lgNw versus Dm for the convective (red filled circles), stratiform (blue filled circles), mixed convective-stratiform (celeste filled circles), and light (yellow filled circles) precipitation types. Dm is in units of mm, and Nw is in units of mm−1m−3.
It was worth noting that there was a very clear separation between the convective and stratiform rain types in the lgNw−Dm domain in Fig. 8. The separation can be expressed as a straight line lgNw= –0.52Dm + 4.47 which was obtained by calculating the slope and intercept of the black line in Fig. 8, where Dm has units of mm and Nw has units of mm−1 m−3. Below/(above) the separator line, this area represents the lgNw−Dm domain of stratiform/(convective) precipitation, and light rain exhibited the smallest droplet sizes and number concentrations, A lgNw−Dm scatter plot of another rainfall type distributed in the stratiform and convective precipitation—different from straddling on the separator line (named the transitional type)—was the mixed type that corresponded to the most periods during which there was no bright band (denoted with celeste filled circles). The slope of the straight line in this case (the black line in Fig. 8) was smaller than the separator line given by Bringi et al. (2009, the blue line in Fig. 8), which may contribute to the different climatic regions or the environmental field during precipitation, and the dynamical cause for this mechanism is worthy of further study.
The DSD characteristics of Typhoon Yagi (201814) while passing Jinan were compared with the data in the research of Bringi et al. (2003), which are shown in Fig. 8 as a black rectangle (the area of continental-like precipitation) and red rectangles (the area of precipitation). It can be seen that Typhoon Yagi (201814) took approximately 30 hours to reach Jinan, based on data recorded by disdrometer, and the DSD characteristics were closer to continental-like, not maritime-like precipitation.
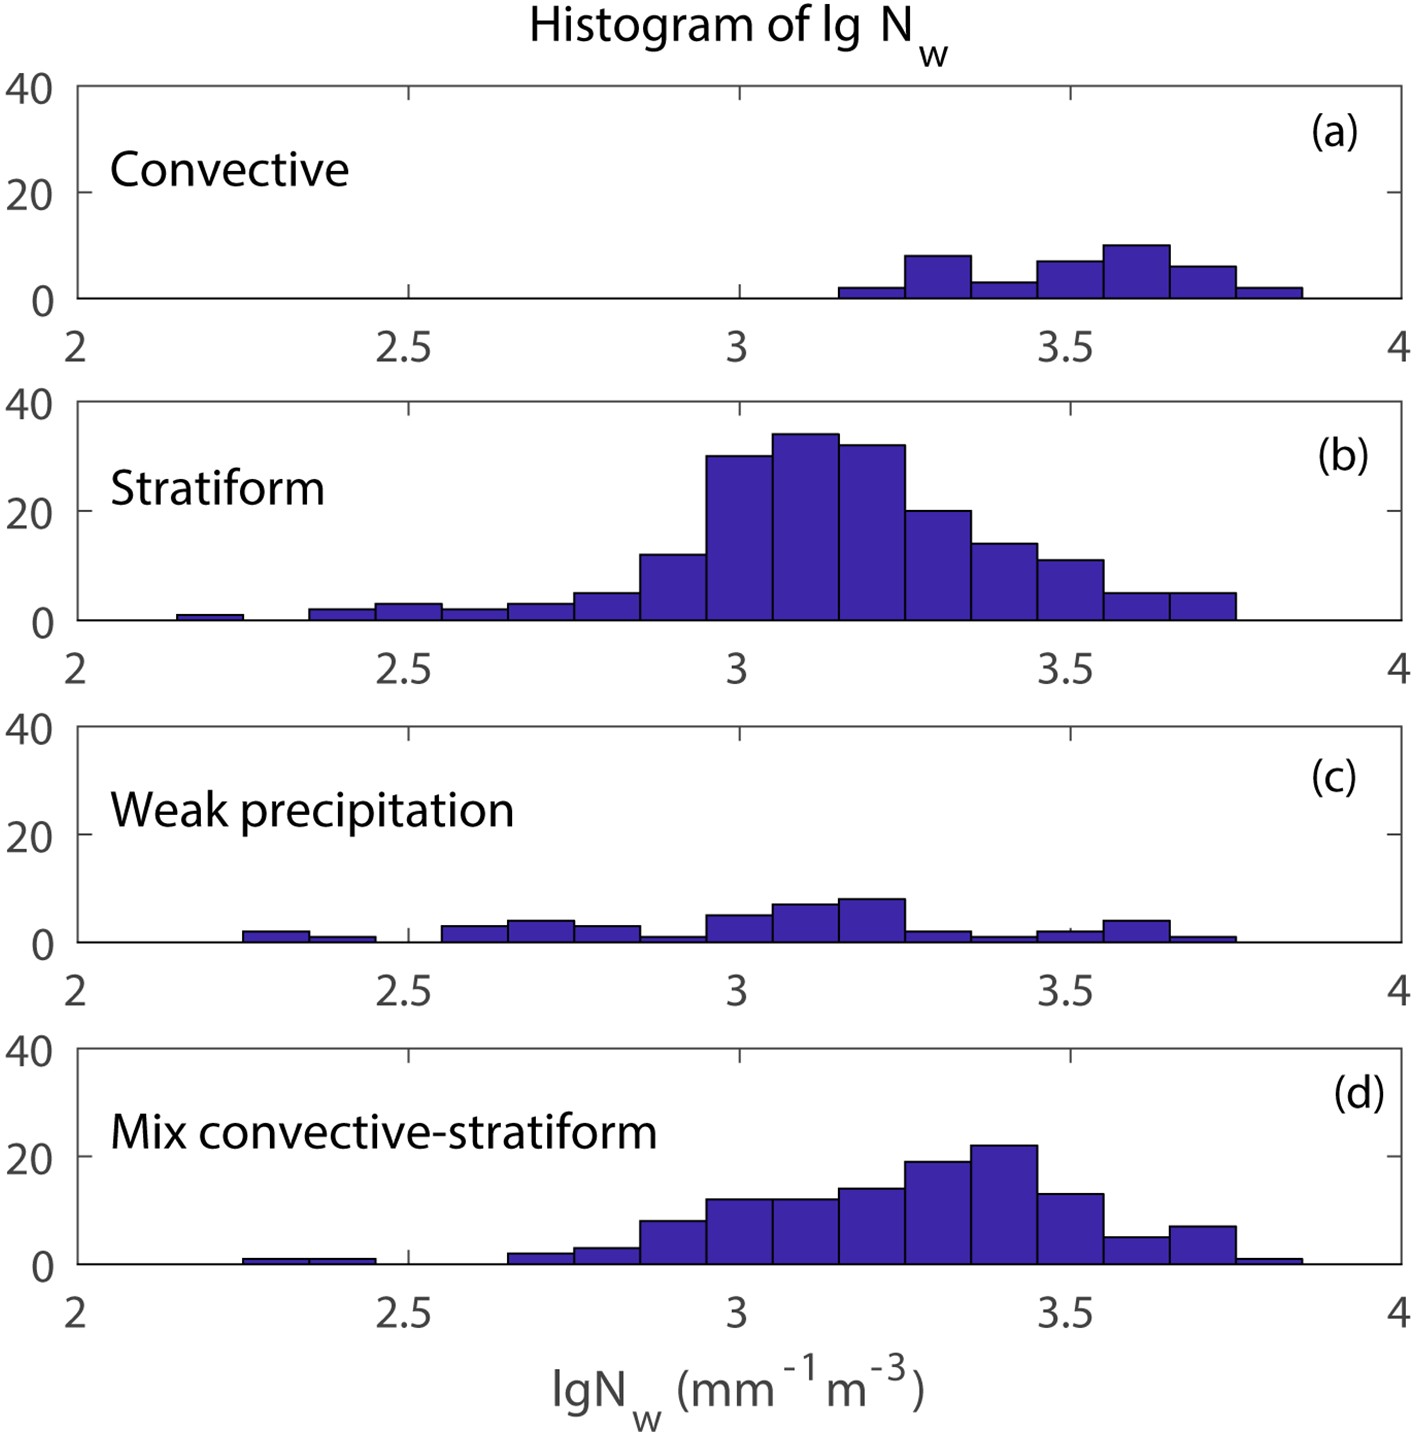
Figures 9 and 10 show the histograms of Dm and lgNw from the convective, stratiform, weak, and mixed rainfall types during this event, indicating that convective precipitation consists of higher droplet concentrations with a spectral bias towards larger drops, while the opposite is true for stratiform precipitation. For convective rain, the size of Dm was between 1.6 mm and 3.7 mm, and the lgNw value was at a maximum between 3.2 and 3.8. For stratiform rain, the value of Dm was almost always below 2.5 mm, while the maximum value of lgNw may reach 20 (Fig. 9). Compared with the other three rain types, light rain showed relatively smaller droplet sizes and lgNw values, which were 0.5 mm and less than 10, respectively. The mixed convection–stratiform rain type seemed to have the characteristics of both the convection and stratiform types and produced a long tail at the higher end of the Dm and the lower end of the lgNw. Generally, the Dm values for Typhoon Yagi (201814) that were observed in the extratropical stage rarely exceeded 4 mm, as shown in Fig. 9.
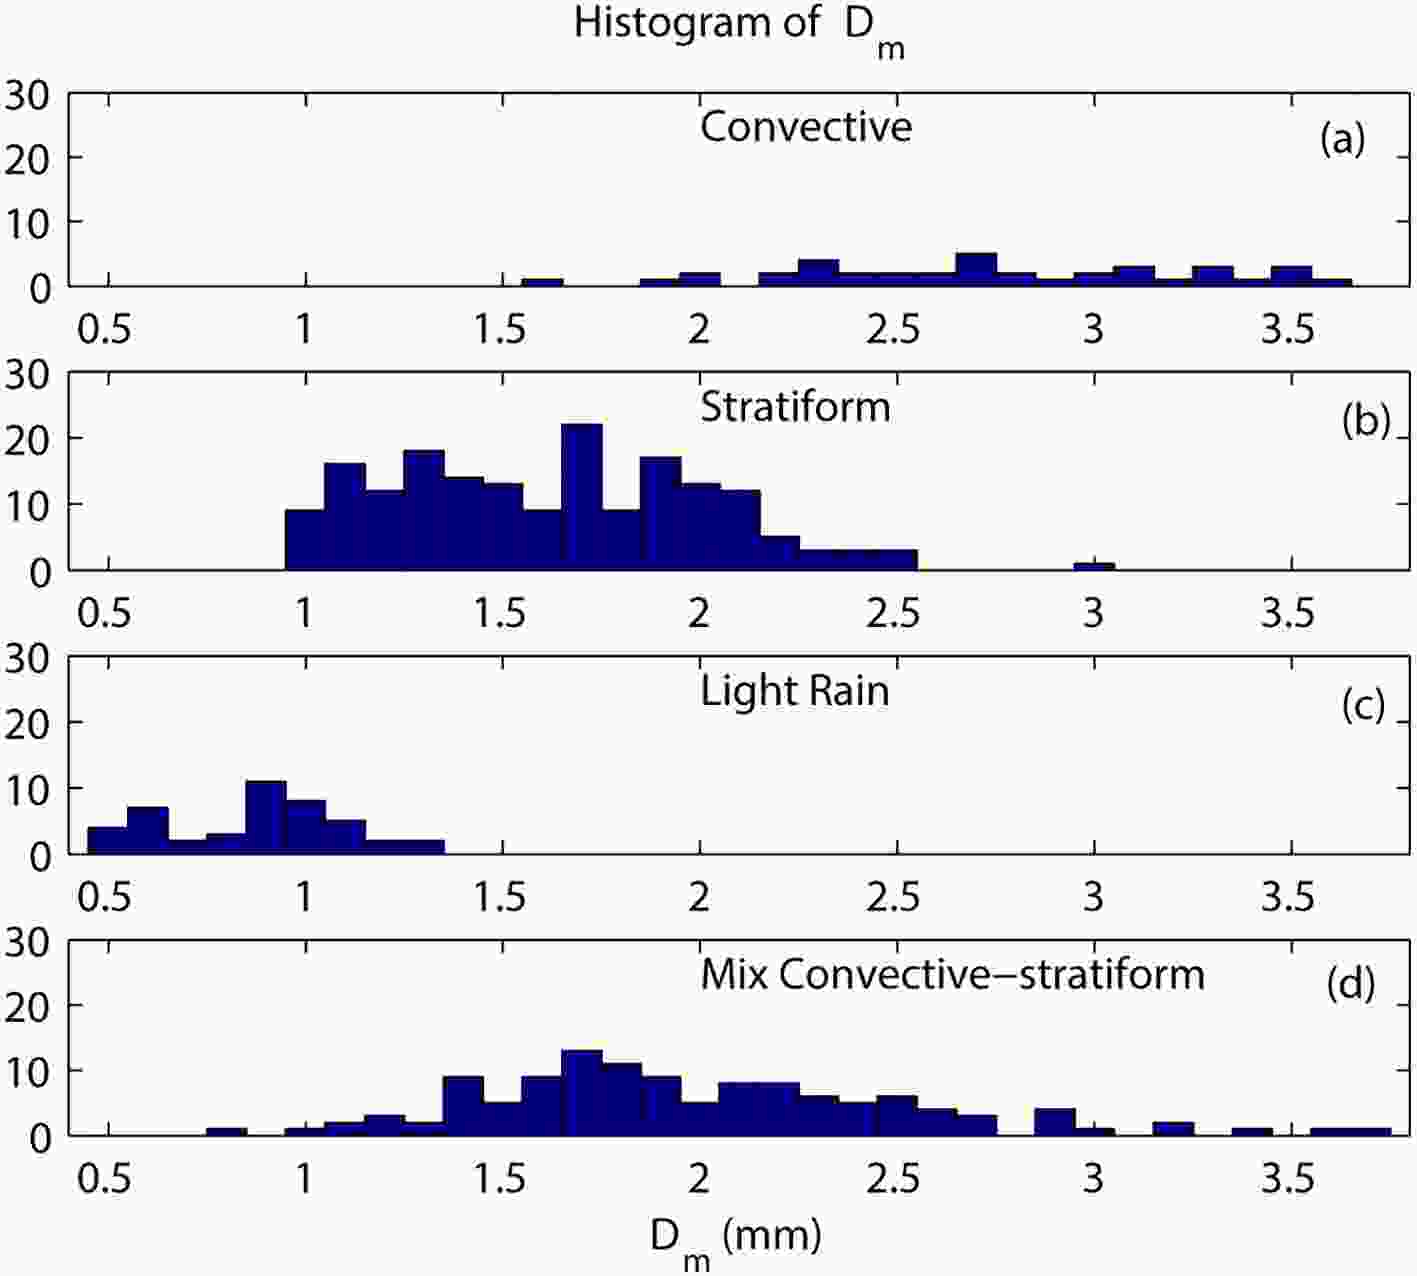
Figure 9. Histograms of Dm for the different rainfall types.

Figure 10. Histograms of lgNw for the different rainfall types.
-
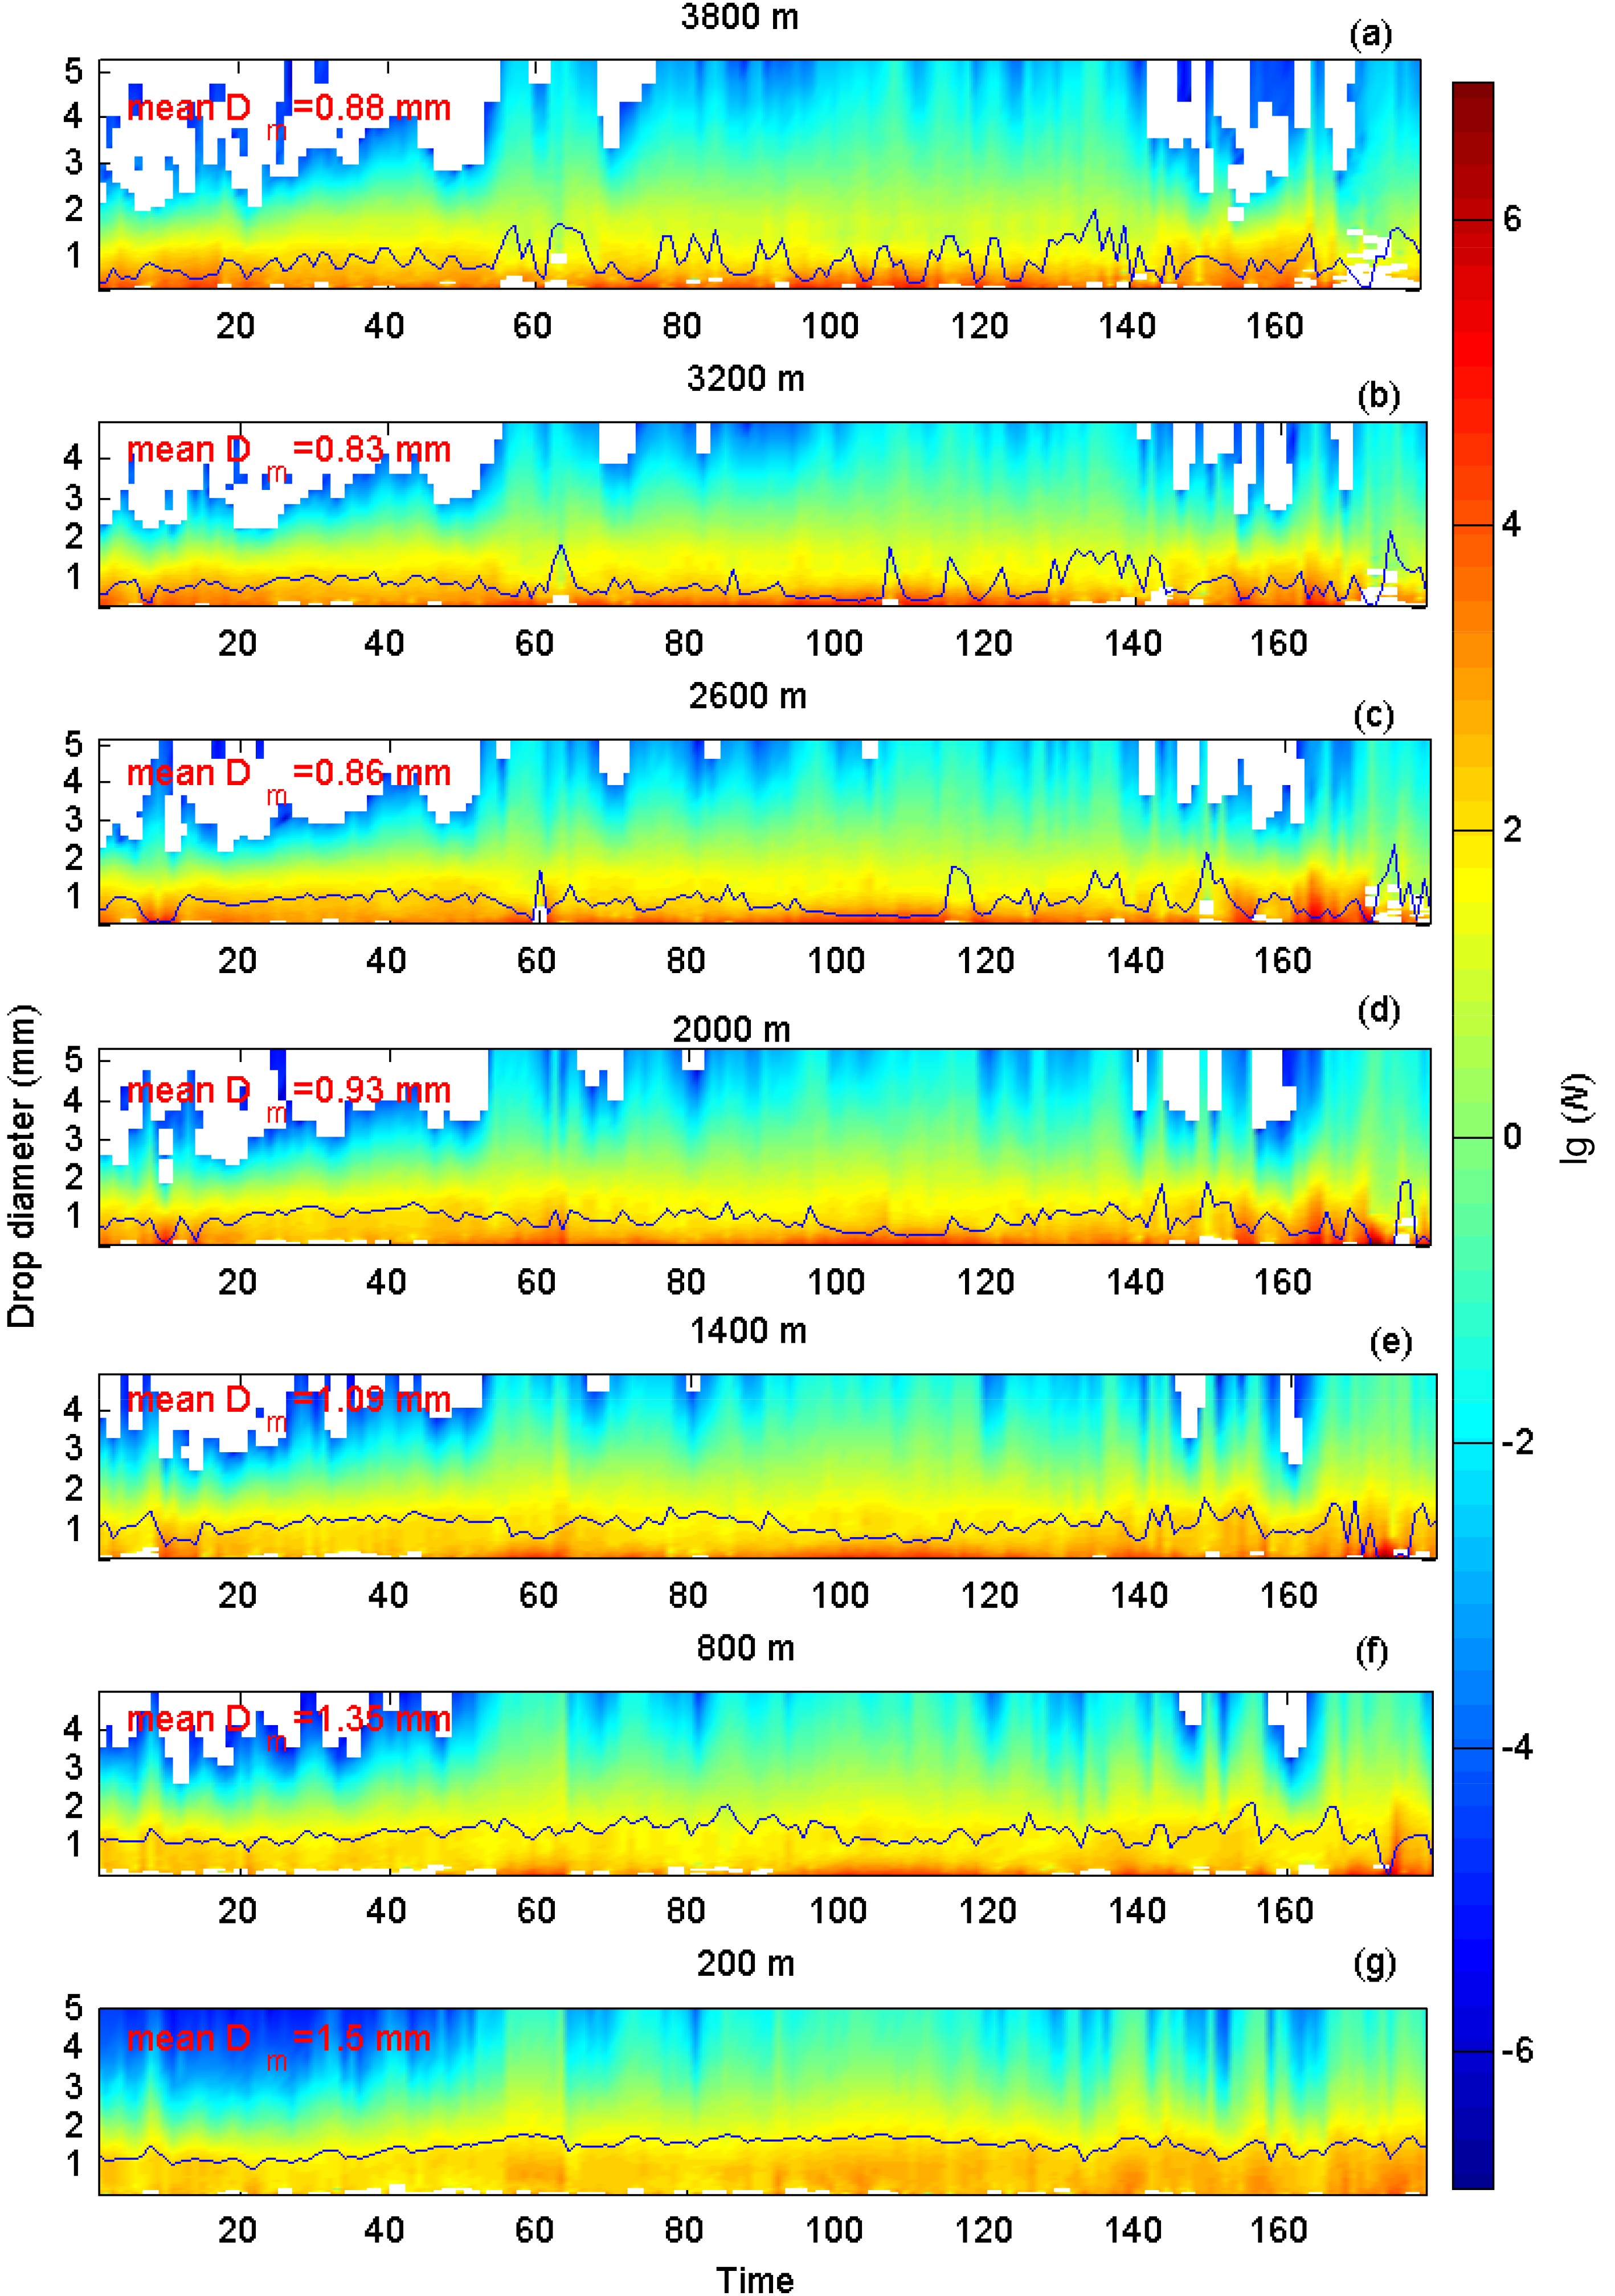
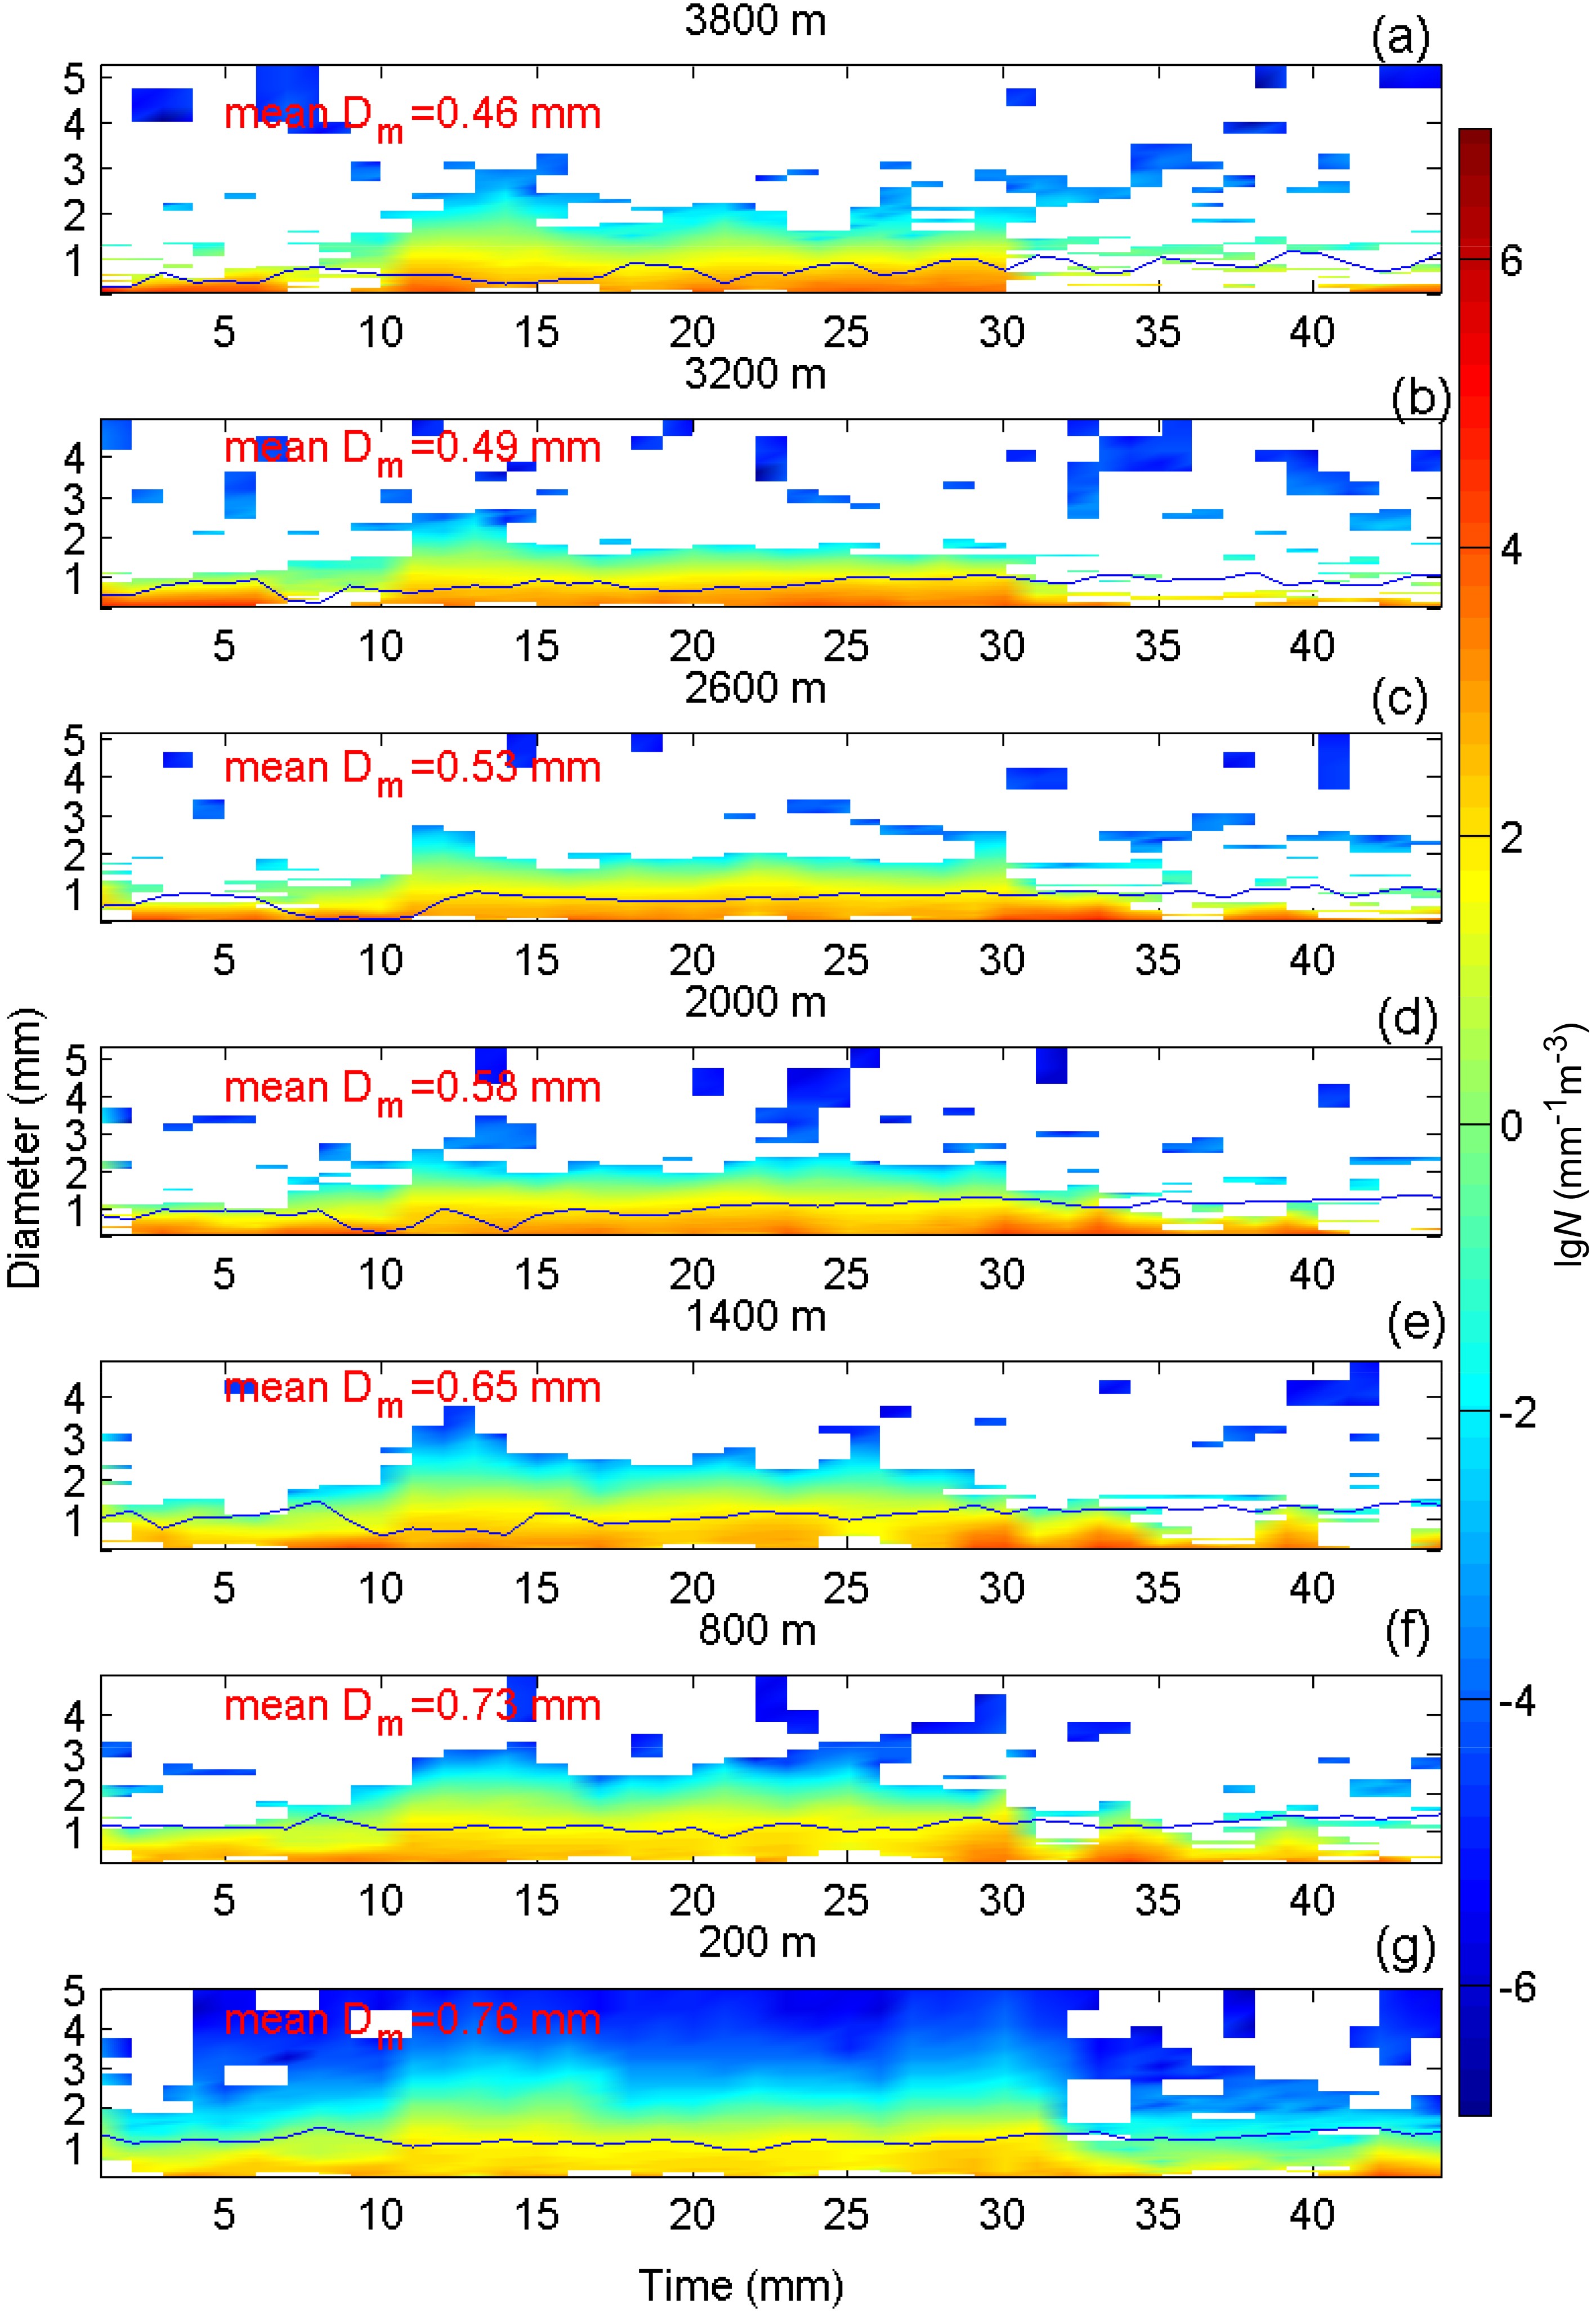
As analyzed in section 4.2.1, vertical air motions and turbulence are the main error source of the MRR. Furthermore, the vertical DSDs of convective precipitation, based on observational and statistical analysis, indicated that the vertical wind considerably impacted raindrop diameter when the rain rate of the convective precipitation became greater than 20 mm h−1 (Wang et al., 2020). Numerical simulations also reveal that the greater the vertical wind was, the more significant the rainfall rate error was (Chen et al., 2010; Wang et al., 2017b). To avoid the influence of vertical winds on the MRR, the stratiform and light rain below the bright band were selected to analyze the vertical DSD variations. Figs. 11 and 12 show that the DSD varied with time at different heights during the stratiform and light rain periods, respectively. As shown in Figs. 11 and 12, with a height decrease from 3,800 m to 200 m, the small particle number concentrations decreased gradually, while the large particle number concentrations and the average raindrop sizes increased significantly. The average Dm for the stratiform precipitation increased from 0.88 mm to 1.59 mm, while the average Dm for the light rain increased from 0.46 mm to 0.76 mm, almost doubling in size. In general, when the droplets fell from the bottom of the bright band to the ground, the raindrop size increased. The decrease in the number of small particles indicated that evaporation might exist, while the increase in the number of large particles below the 0°C layer indicated the presence of the collision-coalescence processes. It can be concluded that the main microphysical processes for particles in the falling path of the stratiform and light rain were the collision-coalescence of small particles.
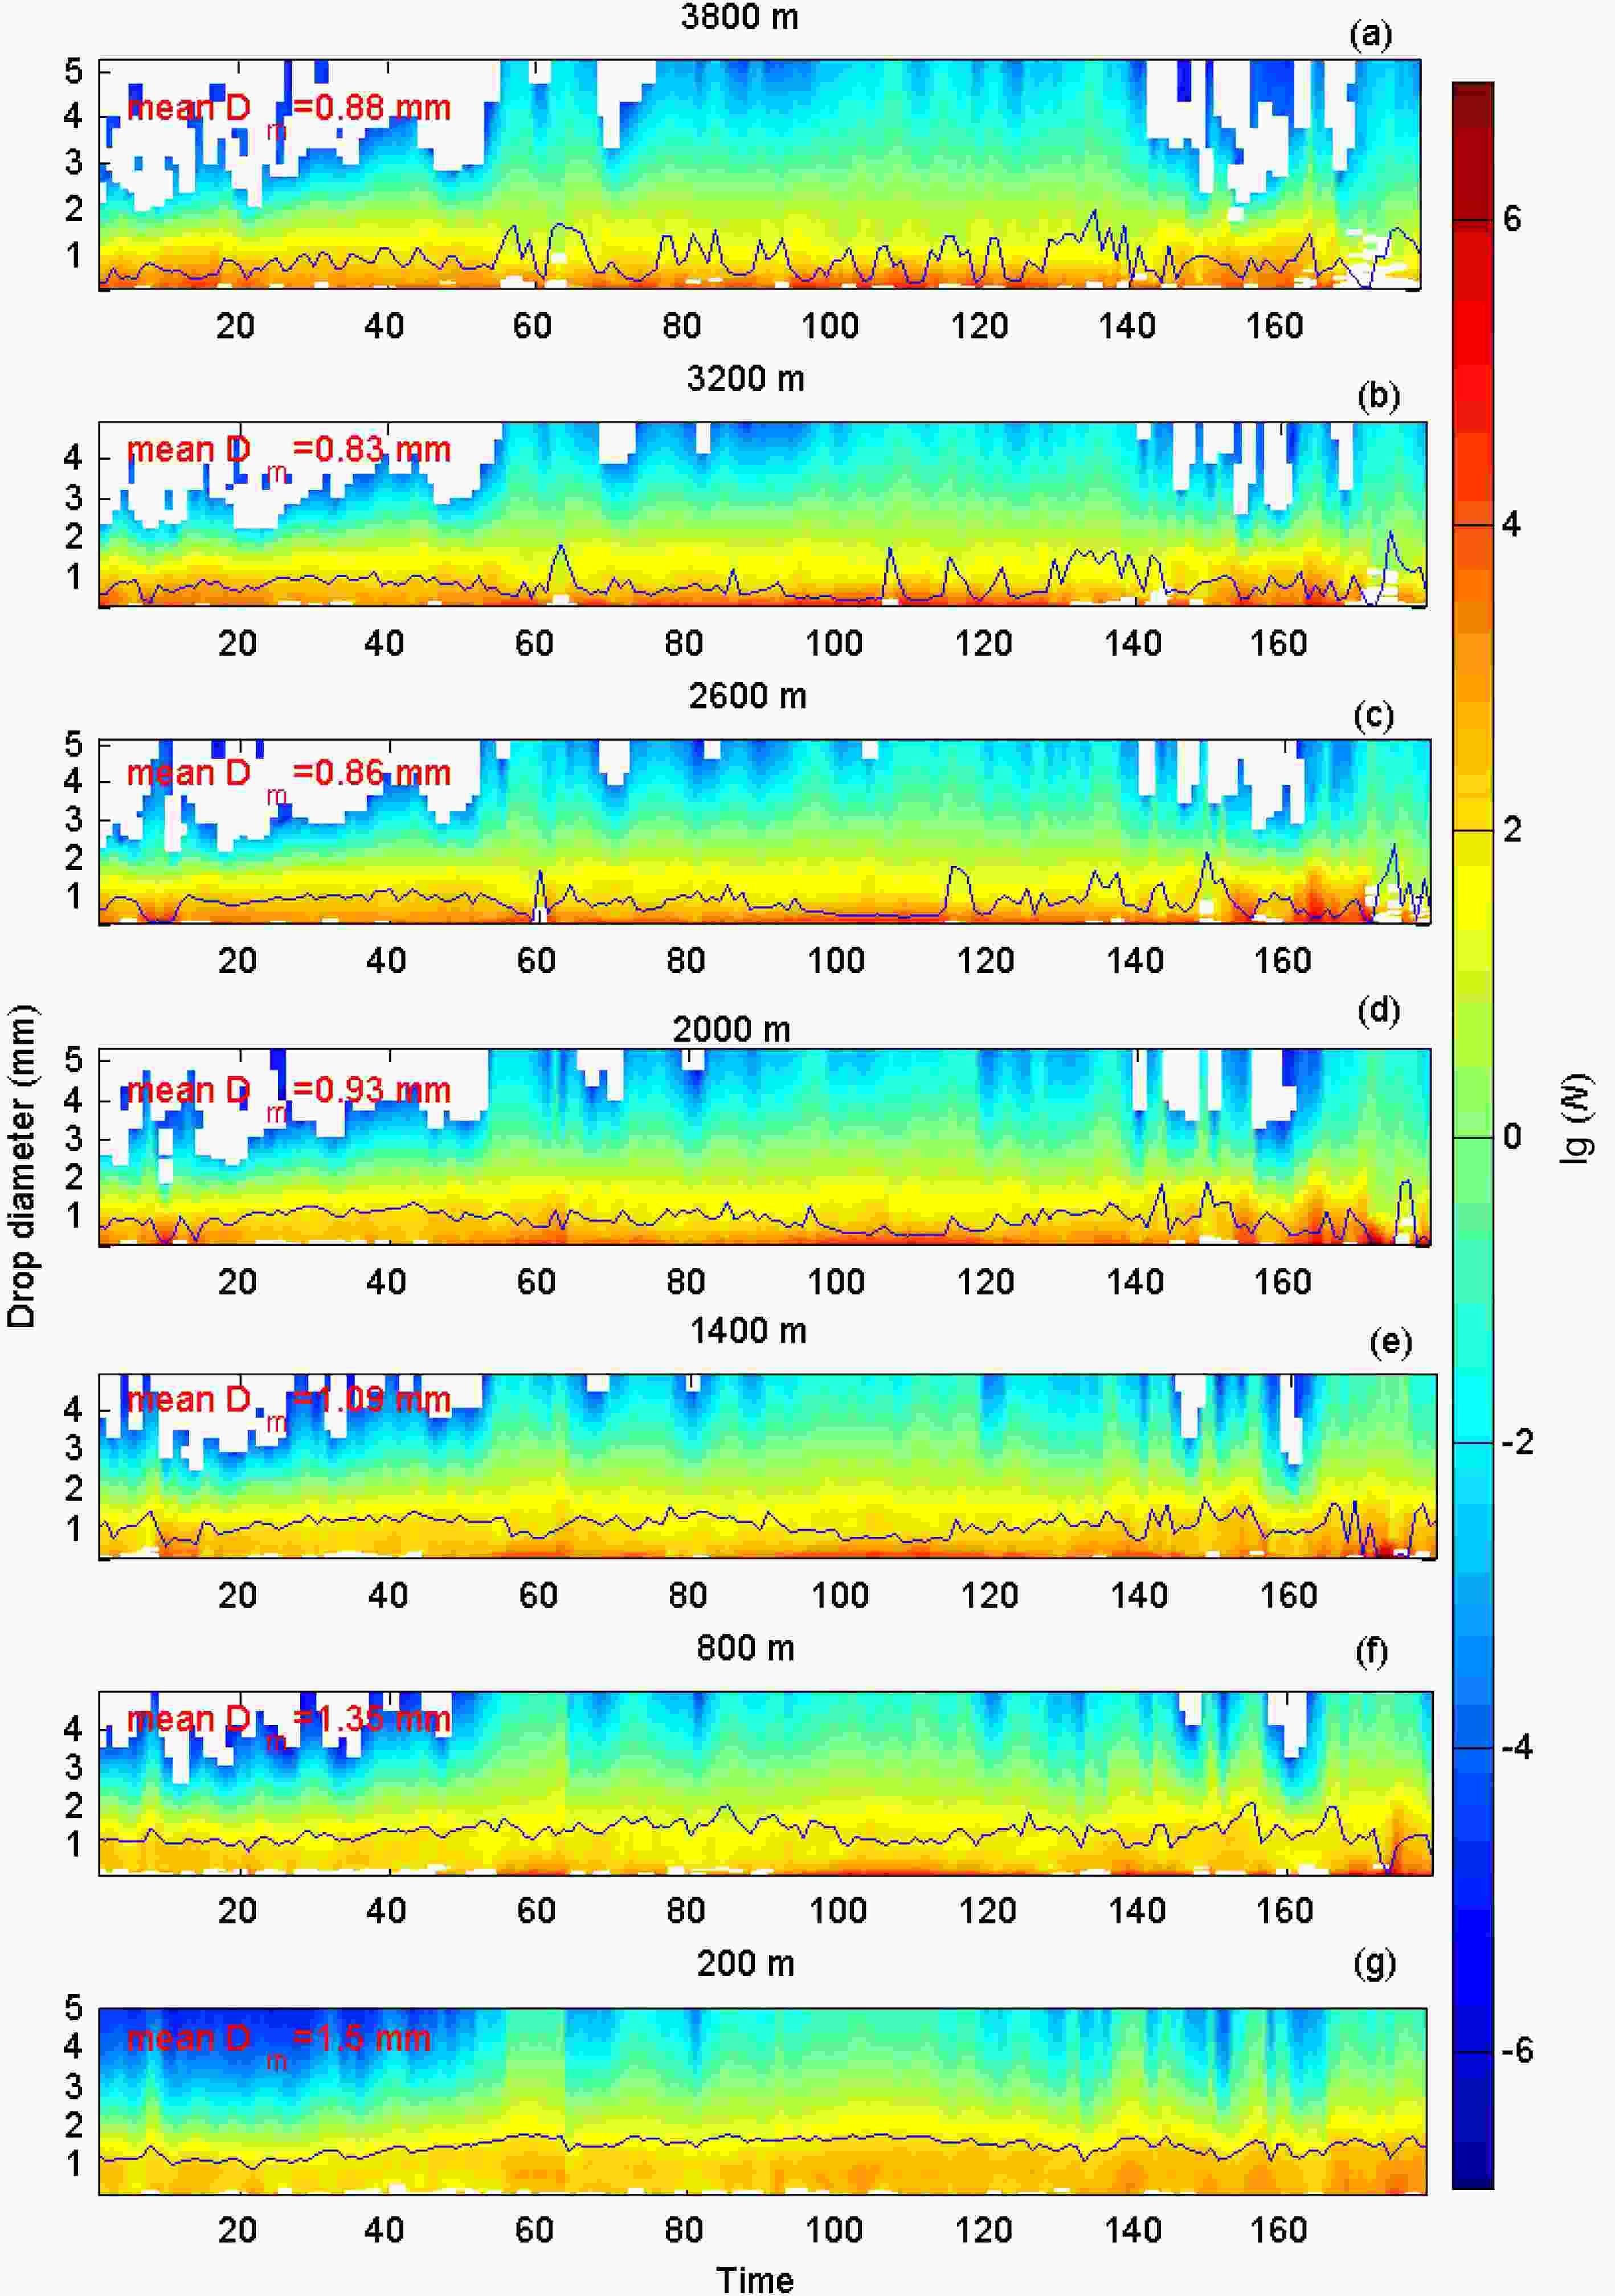
Figure 11. DSD variations with time at different heights during the stratiform precipitation period. The blue solid line in each panel represents the Dm variations with time. The unit of N is mm−1 m−3. The unit of Dm is mm.
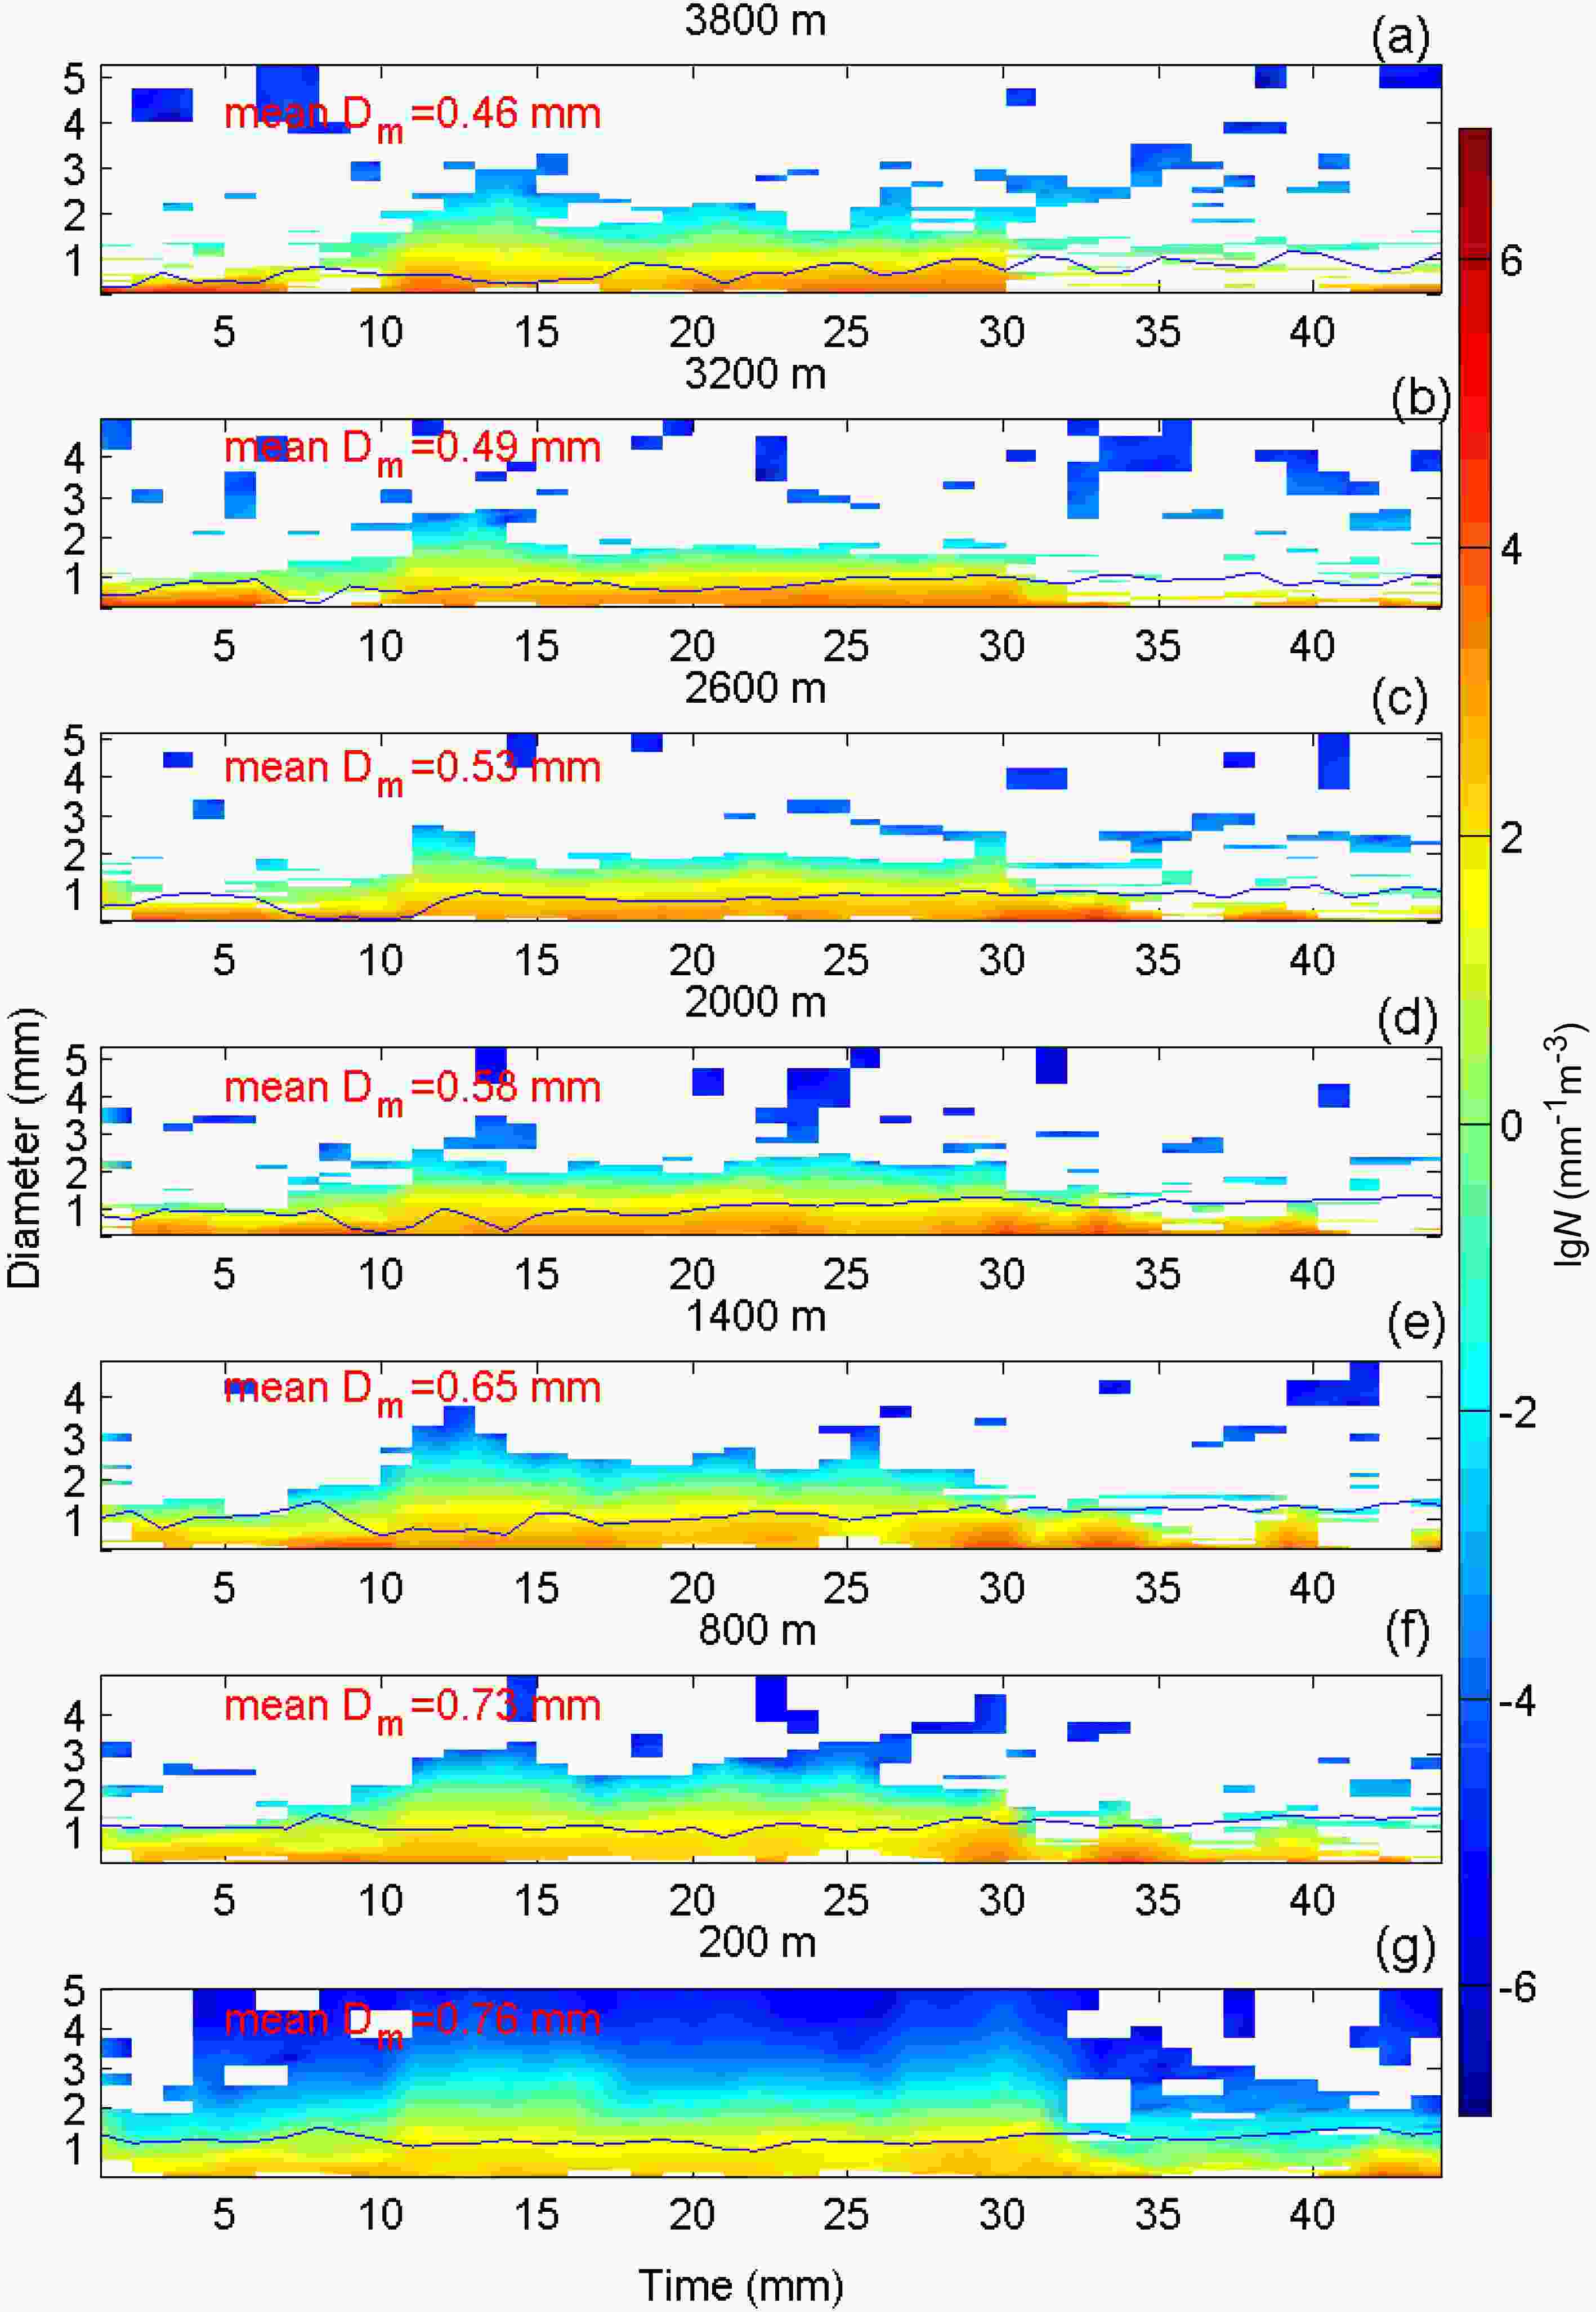
Figure 12. DSDs at different heights during light rain periods. The blue solid line in each panel represents the Dm variations with time. The unit of N is mm−1m−3. The unit of Dm is mm.
-
The joint observation of different wavelength radars can better capture the macro and micro information of precipitation. When Typhoon Yagi (201814) was impacting the city of Jinan, Shandong Province, the MRR, the cloud radar, the disdrometer, and the CINRAD-SA radar observed the precipitation processes. The main conclusions of this study can be summarized as follows:
(1) From the vertical structure of Typhoon Yagi (201814), the radar reflectivity observed by the MRR, cloud radar, and CINRAD-SA radar showed similar overall vertical structures and evolution of the precipitation and clouds, while the CINRAD-SA radar missed the bright band at a height of approximately 5 km due to its coarse vertical resolution. When the rainfall rate was relatively high (R > 20 mm h−1), significant attenuation in the MRR and cloud radar signals might be remedied by the use of the CINRAD-SA radar. Additionally, the vertical evolution of virga before precipitation observed by cloud radar could be used to cover the weakness of the MRR in observing clouds.
(2) The bias between the MRR and disdrometer data was smaller with the presence rather than in the absence of the bright band. It was found that extreme wind speeds affected the retrieval of the rainfall parameters of the MRR.
(3) The analyzed rainfall was classified into convective, stratiform, mixed, and light rain samples as observed by the Thies disdrometer. Additionally, there was a very clear separation of the convective and stratiform rain types, which is given by lgNw= –0.52Dm + 4.47. The four precipitation types had different Dm and lgNw domains but some overlapped. During the stratiform and light rain periods, as the droplets fell from the bottom of the bright band to the ground, the raindrop size increased, so the main microphysical processes for particles were the collision-coalescence of small particles. While typhoon Yagi (201814) transformed into an extratropical cyclone, its raindrop size distributions had the characteristics of continental precipitation observed in Jinan city, Shandong province, China.
Further research will focus on removing the influence of vertical airflow on the retrieval of the MRR in precipitation. It is also necessary to examine the microphysical processes of several landfalling typhoons to perform statistical analysis and reveal the possible mechanisms of typhoon rainfall using observations from different stations and different instruments, including the products of aircraft detection. In addition, an expansion of this study may lie in numerical forecasting. The characteristics of DSDs are crucial for the representation of microphysical processes in mesoscale models (Tokay et al., 2008). Microphysical parameters can compensate for the deficiencies in the bulk microphysical parameterization (BMP) schemes used in mesoscale models (Stoelinga et al., 2003). Thus, it is worth incorporating our measurements into numerical forecast models to offer improved microphysical parameterizations.
Acknowledgements. The authors would like to thank Prof. Hengchi LEI from the Key Laboratory of Cloud-Precipitation Physics and Severe Storms, Institute of Atmospheric Physics, Chinese Academy of Sciences, for the cases discussed in this paper. This study is partially supported by Shandong Provincial Natural Science Foundation (ZR2020MD054), the Key Laboratory for Cloud Physics of the China Meteorological Administration (LCP/CMA, Grant No. 2017Z016), the National Key Research and Development Program of China (Grant No. 2018YFC1507903), the National Natural Science Foundation of China (Grant No. 41475028) and the Shandong Meteorological Bureau project (Grant Nos. 2020sdqxz08, 2020sdqxm10, 2018SDQN09, 2017sdqxz05). The authors would like to sincerely thank the anonymous reviewers for their valuable comments and suggestions.
| Thies disdrometer | MRR | Cloud Radar | CINRAD-SA | |
| Temporal resolution | 1 min | 1 min | 5 s | 6 min |
| Vertical resolution | surface | 200 m | 30 m | 0.18, 0.54, 0.91, 1.25, 1.61, 2.26, 3.73, 5.57 and 7.58 km |
| Maximum height (above site) | surface | 6,000 m | 15,810 m | 7,582 m |
| Number of range gates | surface | 20 m | 527 m | 9 |
| Rain parameters | Z, LWC, V, N(D), Nw, Dm | Z(h), LWC(h), V(h), N(D,h), Nw(h), Dm(h) | Z(h), LWC(h), V(h) | Z(h) |
| Rain drop size bins | 22 gates | 64 gates | No output | No output |


 AAS Website
 AAS WeChat