


 DownLoad:


-
Freshwater is widely viewed as a fundamental natural resource, yet it is threatened by human activities (Meybeck, 2003). Over the last 50 years, water consumption has tripled due to global warming, population increase, and urbanization (Carbon Disclosure Project, 2010). Currently, nearly 80% of the global population and 65% of continents suffer from water scarcity (Vörösmarty et al., 2010). Water stress has become an inevitable obstacle to sustainable development, and freshwater security has been listed as one of the grand challenges in the coming decades by the World Climate Research Programme (Trenberth and Asrar, 2014). Terrestrial water storage (TWS) is the most ubiquitous source for high-quality freshwater which not only supports food and livestock production but also influences various aspects of the natural environment, such as affecting sea level (Pokhrel et al., 2012) and the rotation of the Earth (Kuehne and Wilson, 1991).
The TWS can be divided into surface water, soil water, snow, and groundwater. Recently, due to the vital impacts of water on sustaining human society and ecosystems, its changes over land (e.g., streamflow and TWS) have been extensively investigated. For instance, the Yellow River streamflow displays a persistent decline, and climate factors can explain about 65% of the trend (Piao et al., 2010). For TWS, similar declining trends have been observed in southern and eastern Europe (Stahl et al., 2010), northwestern North America, and the Gulf of Mexico (Kalra et al., 2008). In contrast, a slight increase in streamflow is found over the Yangtze River (Piao et al., 2010) and the Amazon River (Scanlon et al., 2018). In the future, the river discharge is projected to increase over high northern latitudes, India, and Africa, and is expected to decrease in the Mediterranean region, Australia, and parts of North and South America under a high greenhouse gas emission scenario (Schewe et al., 2014). However, the ability of the global land to retain freshwater, which directly influences the freshwater fluxes, receives less attention due to the lack of appropriate methods and global-scale observations.
McColl et al. (2017) introduced a new metric called, stored precipitation fraction, to quantify the ability of surface soil to retain a positive freshwater anomaly after hours to days during 2016, based on soil moisture observations from NASA’s Soil Moisture Active Passive (SMAP) mission. It can be viewed as a measure of surface soil memory. They found that surface soils (depth of 0–5 cm) accounted for less than 0.001% of the global freshwater storage, but retained 14% of precipitation after three days and that this fraction decreases rapidly as time increases. Hence, for longer prediction, deeper soil moisture and other terrestrial water components should be considered as indicators of TWS. Land-atmosphere coupled modeling experiments have shown land surface conditions, including snow mass and deeper soil, are crucial sources of predictability on seasonal timescales (Koster et al., 2011). The TWS involving various kinds of water can be applied to improve seasonal fire forecasts (Chen et al., 2013), and the memory of TWS can provide additional information for long-term hydrological prediction (Yuan and Zhu, 2018; Zhu et al., 2019). Therefore, the storage capability of the land and its components, such as deeper soil layers, snow, river, lake, and canopy need further investigation, especially on longer time scales. Here, we modify the method proposed by McColl et al. (2017) to quantify the freshwater storage capability (FSC) for land and various TWS components and provide further analysis regarding the land surface storage capability and its hydrological dynamics at different time scales over global major river basins.
The FSC is jointly controlled by complex factors such as land cover, precipitation, and potential evapotranspiration (PET). Investigating the spatiotemporal distribution of FSC provides implications for the global water balance in a changing climate. Based on the Gravity Recovery and Climate Experiment (GRACE) satellites (Tapley et al., 2004), large-scale terrestrial water storage change (TWSC) can be measured efficiently (Scanlon et al., 2012). In addition, TWSC can also be reasonably simulated by advanced land surface models (LSMs) (Lawrence et al., 2019). The spaceborne observations and state-of-the-art LSMs provide an opportunity to revisit the FSC of global land.
Considering that GRACE satellites only provide TWS anomaly (TWSA) observations on monthly time scale, we use GRACE TWSA and global precipitation observations to quantify the monthly FSC of the land (including storage within surface water bodies, soil, snow, and aquifers). Then, a state-of-the-art community land model (CLM5) (Lawrence et al., 2019) was applied to provide finer simulation for further analysis regarding the FSC features for TWS, snow, and different soil layers across multiple time scales. Lastly, the study investigates the decadal variability of FSC by connecting it with major modes of internal climate variability.
-
In an effort to reduce uncertainty, we apply three global precipitation datasets. These include products sourced from the Global Precipitation Climatology Centre (GPCC) (Udo et al., 2011), the Climatic Research Unit-National Centers for Environmental Prediction (CRU-NCEP) (Viovy, 2018), and the Precipitation Reconstruction over Land (PREC) (Chen et al., 2002). In addition, we use the PET dataset provided by the Global Land Evaporation Amsterdam Model (GLEAM), which maximizes the recovery of evaporation information contained in current satellite observations (Miralles et al., 2011; Martens et al., 2017), and the leaf area index (LAI) dataset which is based on Global Land Surface Satellite (GLASS) (Xiao et al., 2016) from 2001 to 2014.
The mean of GRACE mascon products provided by the Jet Propulsion Laboratory (JPL) (Swenson and Wahr, 2006; Landerer and Swenson, 2012; Swenson, 2012; Wiese et al., 2016), Center for Space Research (CSR) (Save et al., 2016), and German Research Centre For Geosciences (GFZ) (Dahle et al., 2012) is viewed as the global TWSA observation, which spans 14 years from 2003 to 2016. Furthermore, the SMAP soil moisture from 2015 to 2016 (Entekhabi et al., 2010) is used to validate the model simulation. Besides that, the CLM5 is applied to provide credible, long-term simulations of the TWS and its components, further noting that good model performance has been shown in previous studies (Niu et al., 2007; Xia et al., 2017). In this model, the TWS involves soil moisture, canopy water, snow, and surface water for rivers, lakes, and wetlands. It resolves the water and energy balance from the ground surface down to 8.6 m by dividing it into 20 hydrologically active layers (Lawrence et al., 2019). Compared with the previous models (i.e., CLM4 and CLM4.5), the CLM5 increased the vertical resolution of the soil layer, especially within the top 3 m, and removed unconfined aquifers (Lawrence et al., 2019). Meanwhile, the model is updated to account for spatial variations in soil thickness from a spatially explicit bedrock dataset (Brunke et al., 2016; Pelletier et al., 2016). When soil is below the bedrock, the soil moisture is close to or equal to zero. In this study, we used the biogeophysical part of CLM5, noting that the carbon-nitrogen processes were switched off. Two continuous centurial cycles (i.e., the first cycle ending acts as the initial condition of the second cycle) of CLM5 simulation, with a spatial resolution of one-degree, are carried out during 1901–2016 and were driven by the CRUNCEP observed meteorological forcing datasets (Piao et al., 2012). The last 66-year simulations during 1951–2016 in the second cycle are analyzed and the first 166-year simulations are regarded as land surface model spin-up, noting that the aquifer model needs a long time to reach the equilibrium (Yang et al., 1995).
To quantify the ability of the land to store freshwater, we use a newly proposed metric called stored precipitation fraction (McColl et al., 2017). The FSC(t) represents the increasing water in land normalized by precipitation as follows,
where
where
${P_i}$ is the sum of precipitation in the ith time step,$\Delta {V_i}$ stands for the change of water for different components of TWS (or the change of TWS) in the ith time step,$\Delta {V_{i + }}$ represents the increase of water for TWS components (or the increase of TWS) at given time step,$\Delta {\rm{TW}}{{\rm{S}}_i}$ is the change of TWS in the ith time step, t is the analysis time step (from one day to one month in this study), and T represents the total time span (e.g., 2003–16). Considering that the change of soil moisture affects infiltration and capillarity, we choose$\Delta {\rm{TW}}{{\rm{S}}_i}$ as the only threshold to study the contributions of different TWS components to the total FSC. Because the GRACE data only provides monthly TWSA, the central difference method is applied to calculate the average change in TWS from one month to the other (Zhang et al., 2018),where
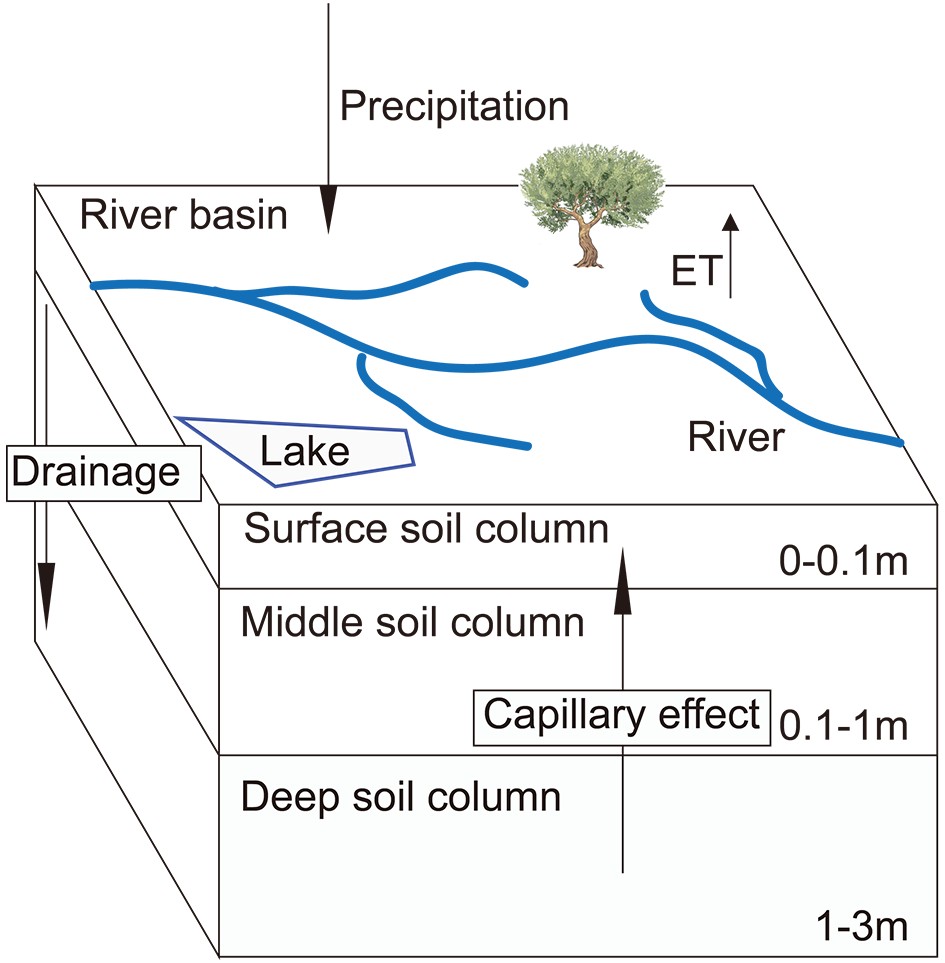
${V_i}$ is the volume of the ith TWS observation. For CLM5 simulation, we use the TWS value on the last day of the prescribed time step minus the one on the first day of the time step to get the TWSC. Note that McColl et al. (2017) used this precipitation fraction to analyze the surface soil moisture response to precipitation at three-day time scale, while here we use it to quantify the FSC for TWS and soil at different depths from daily to monthly time scales.In the water balance equation [d(TWSA)/dt = P – ET – R, where P is precipitation, ET is evapotranspiration, and R is runoff] the impact of runoff, including lateral flow, on the increase of TWS cannot be ignored especially for longer time scales and deeper soil at a given point. However, the precipitation is the only input for a river basin that normally retains water and allows no outflow to other basins (Fig. 1), and the positive change of TWS stands for the volume of precipitation that is retained in a basin. Hence, this study analyzes the FSC of land and soil columns at different depths over global major river basins (Yuan et al., 2015) rather than grids. The selected 194 river basins, based on the Global Energy and Water EXchanges (GEWEX) project, cover most of the land surface representing a broad range of climate and land cover conditions. In this regard, the FSC describes the proportion of precipitation falling on land that can be retained in the basin after a given time, which is closely linked with water security.
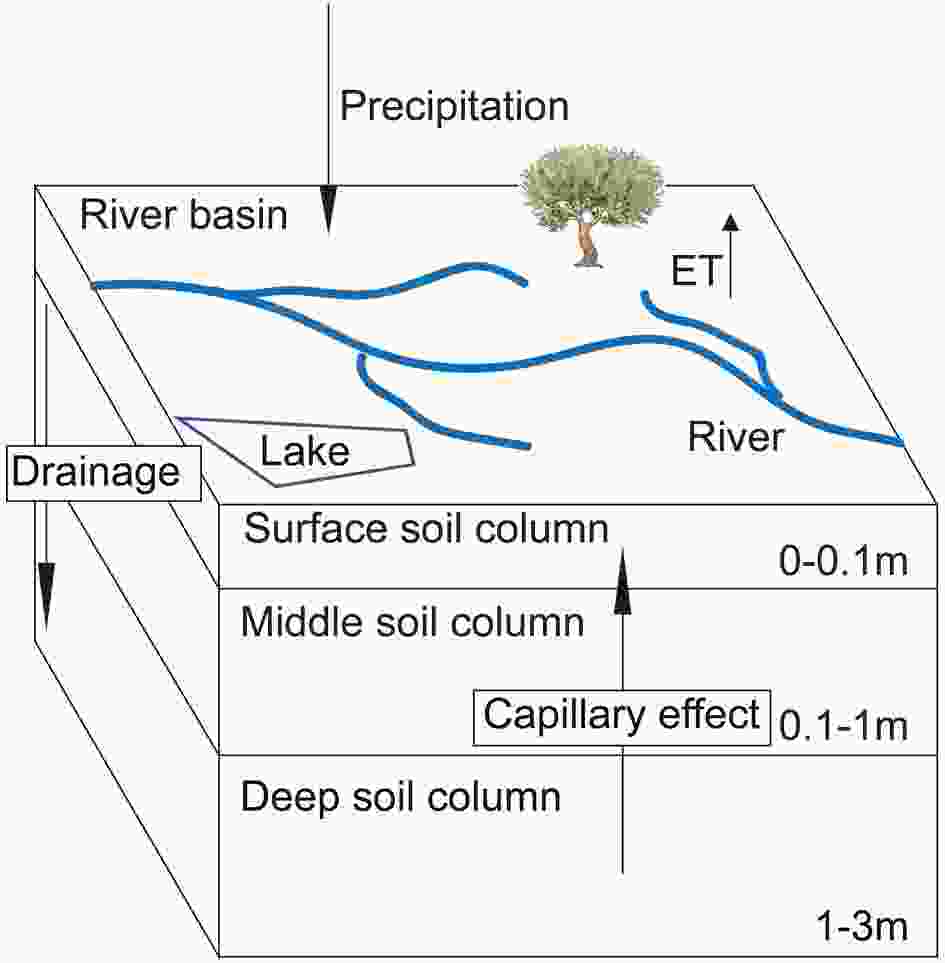
Figure 1. A schematic diagram of water exchange between different soil columns. TWS includes all the forms of storage, such as river, lake, canopy water, snow, ice, soil moisture, and groundwater.
The impacts of the uncertainty of the observations (e.g., TWS and precipitation) are nontrivial. To estimate the influences of uncertainty in precipitation datasets, we calculate the standard deviations of three groups of FSC based on mean values of TWSA from different centers and the three precipitation datasets, respectively. Conversely, to estimate the influence of GRACE uncertainty, the standard deviations of three groups of FSC based on the mean precipitation and TWSA from different centers are calculated.
Lastly, to investigate the decadal variability of total land water-based FSC, 57 groups of 10-years of CLM5 simulation (i.e., 1951–60, 1952–61, 1953–62, …) are used to estimate FSC, respectively. We also calculate the anomaly correlation coefficient (ACC) between the decadal FSC and the climate indices (i.e., PDO, IPO, and AMO). The monthly climate indices are obtained at
https://www.esrl.noaa.gov/psd/data/climateindices/list , and they are aggregated into 10-year running mean values. In this study, the significances of ACC are determined by the student’s T-test. -
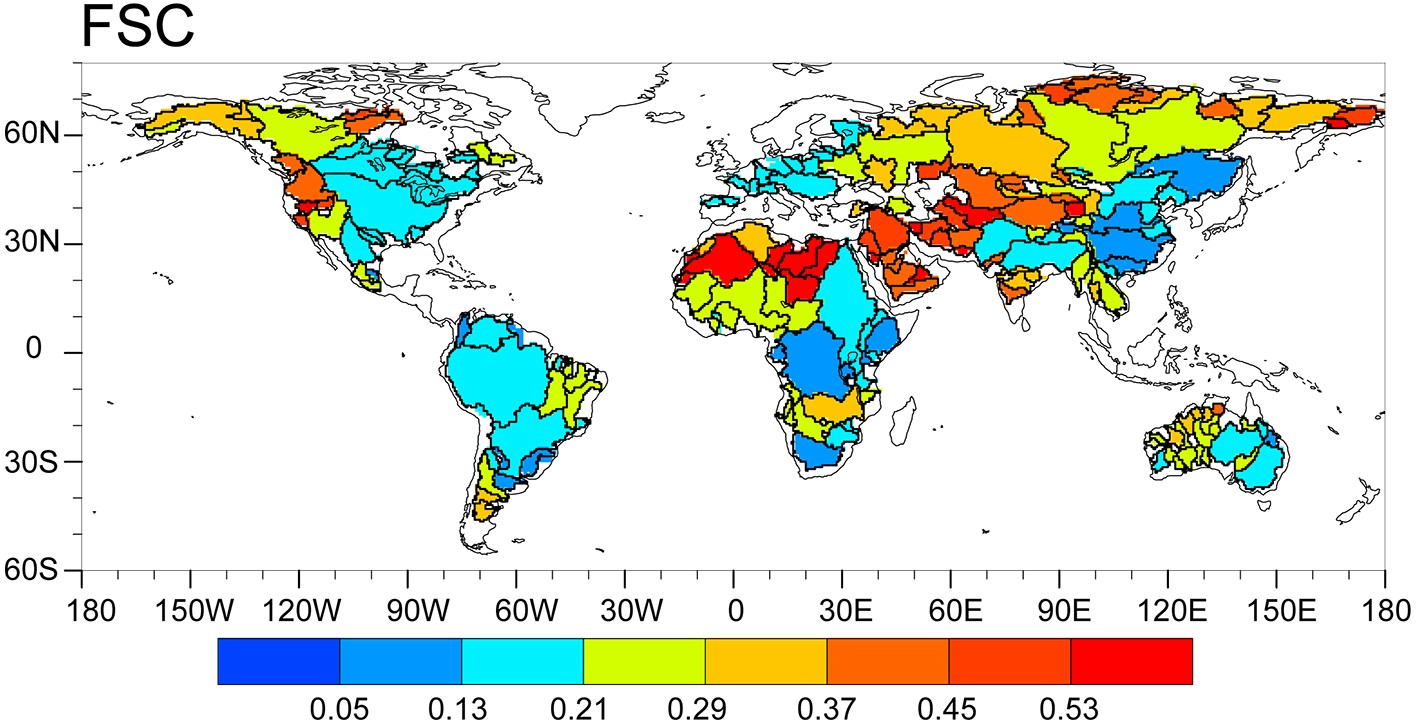
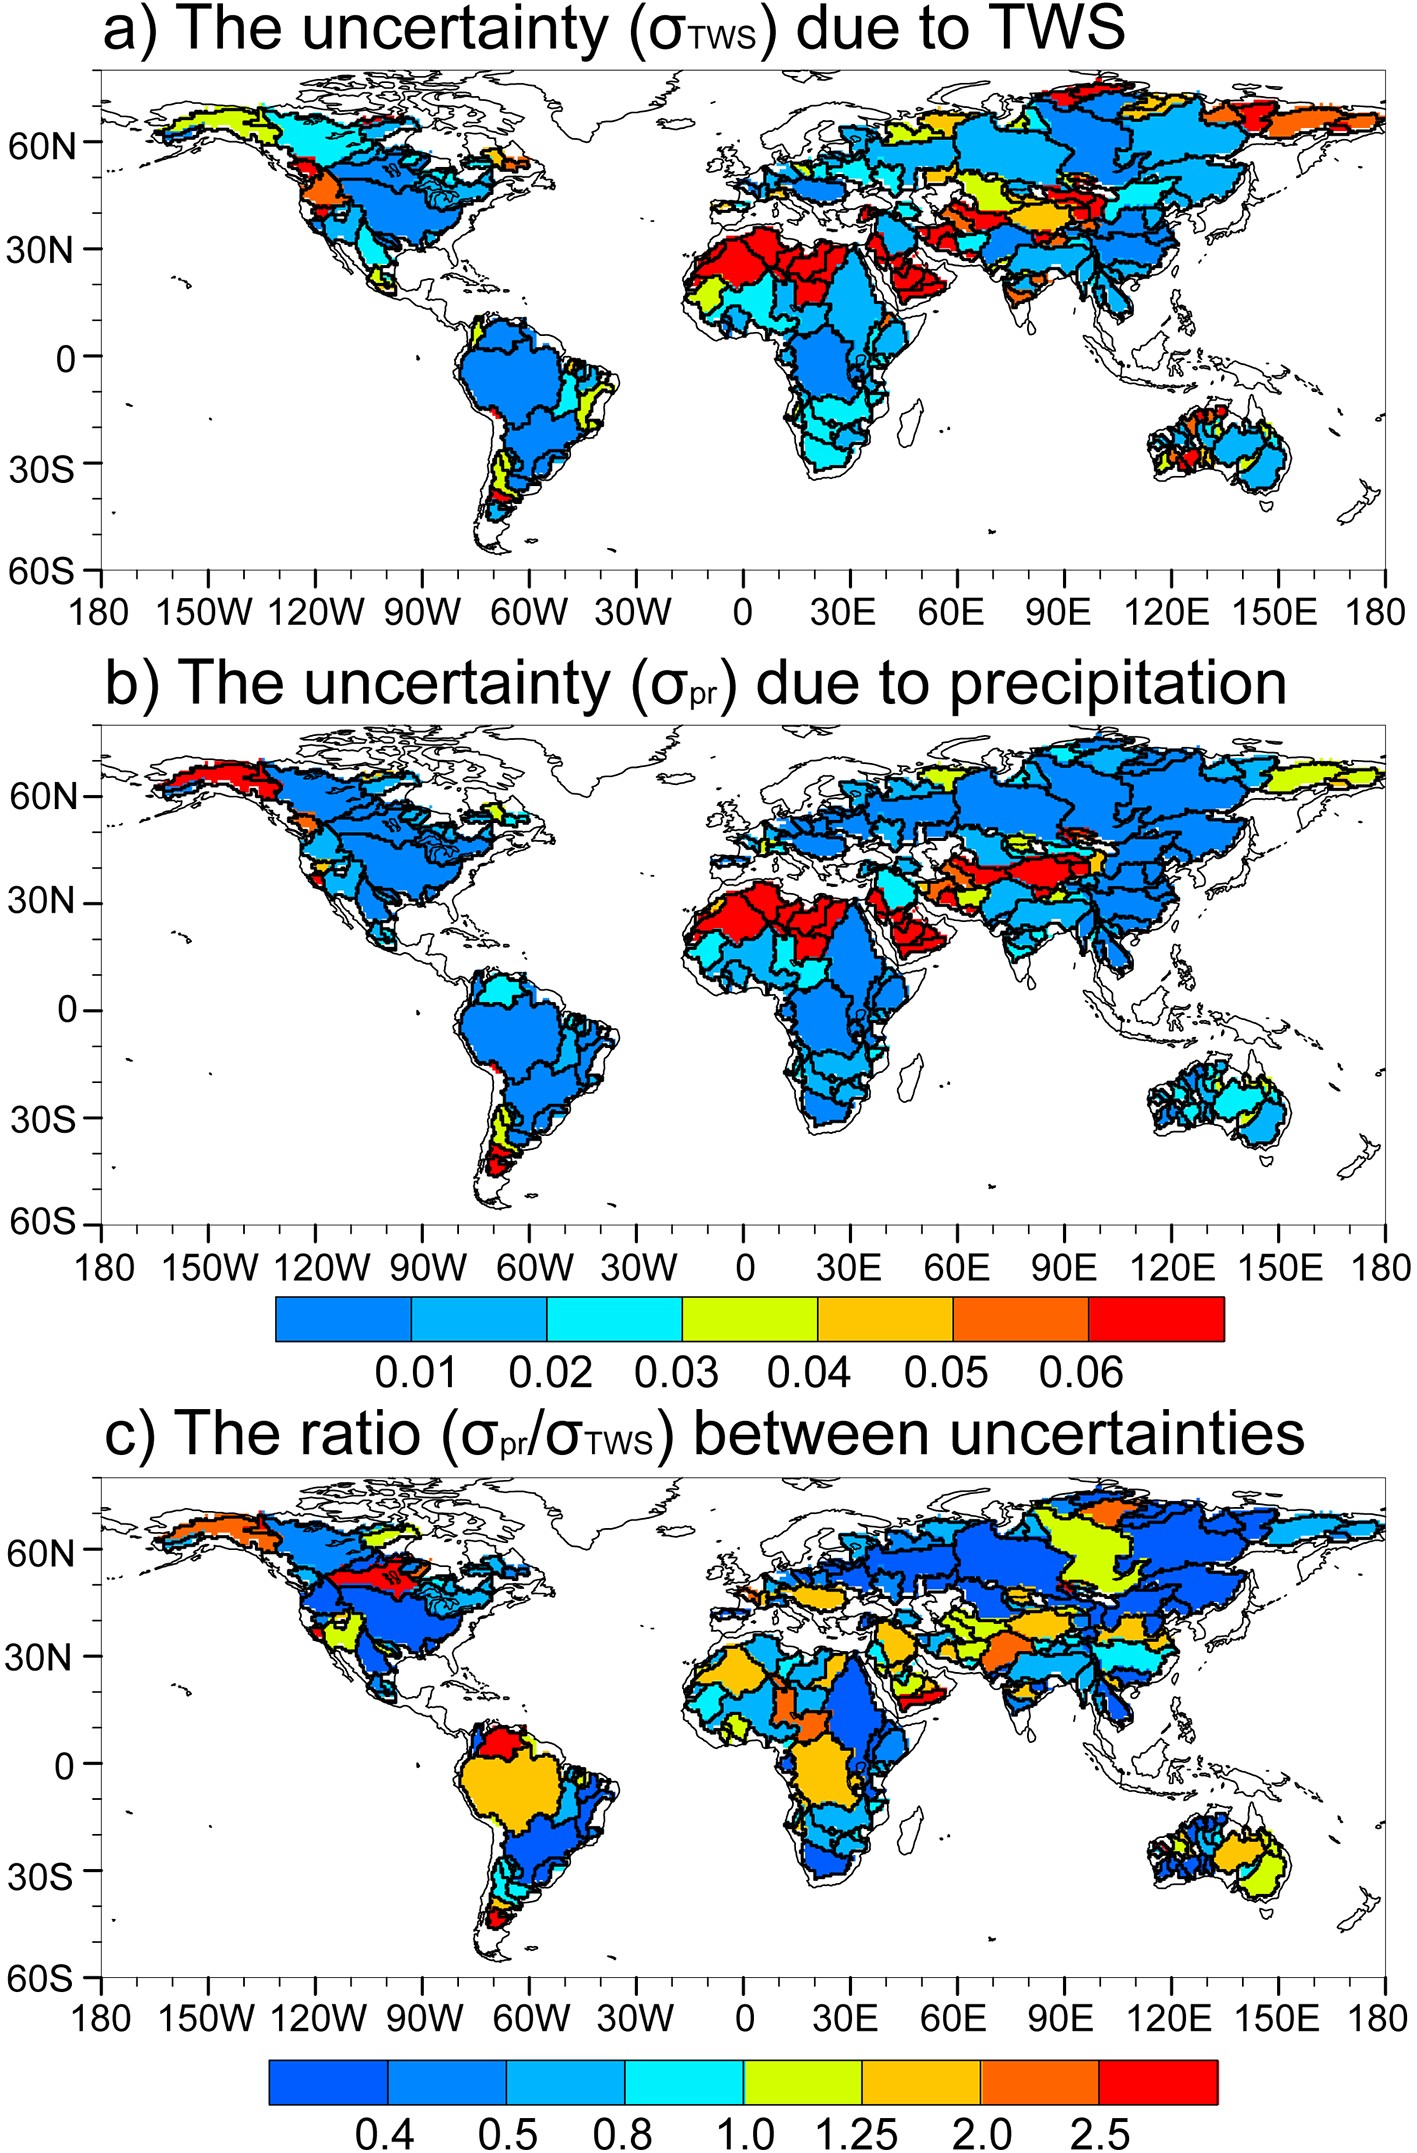
Figure 2 shows the FSC based on the average of GRACE TWS from different centers (i.e., CSR, JPL, and GFZ) and the average of precipitation datasets (i.e., GPCC, CRU-NCEP, and PREC). The weighted average of FSC across the global basins is 0.28, which means that 28% of precipitation can be retained by the land after one month. However, the distribution of FSC is spatially uneven over the globe. Generally, the lower FSC is mainly located in monsoonal regions, including southern and northeastern China, eastern North America, and parts of South America and Africa while FSC is large in arid basins, such as the Middle-East, parts of Africa, and the west coast of America. The larger value is indicative of a greater ability to retain a positive anomaly for a river basin, noting that a reliable estimate of FSC relies on the accuracy of observation. Regional differences do exist among different precipitation and TWSA datasets. Therefore, we show the standard deviation of FSC that is due to the uncertainty of TWS and precipitation (Fig. 3a–b). We can see that larger standard deviations are mainly located over the arid or semi-arid regions, such as high-latitudes of the Northern Hemisphere, the middle of Asia, parts of the Sahara, and the Arabian Peninsula (Fig. 3a), where a small observation error would exert a great influence on the estimates of FSC. Similarly, the influence of precipitation uncertainty is nontrivial over arid regions (Fig. 3b). However, the impact of precipitation uncertainty is relatively small, except in the Amazon, Congo, Middle East and high latitudes (Fig. 3c), where the in-situ observations are insufficient.

Figure 2. Global distribution of total land water-based freshwater storage capability (FSC). FSC is estimated by an average of GRACE observed terrestrial water storage (TWS) from three centers (i.e., CSR, JPL, and GFZ) and the ensemble means of precipitation observation datasets from GPCC, PREC, and CRUNCEP during 2003–16.

Figure 3. The uncertainty of FSC due to TWS observation (standard deviation
${\sigma _{\rm{TWS}}}$ ) (a), precipitation observation (standard deviation${\sigma _{\rm{pr}}}$ ) (b), and the ratio between the uncertainties (${\sigma _{\rm{pr}}}$ /${\sigma _{\rm{TWS}}}$ ) (c). (a) The uncertainty (standard deviation${\sigma _{\rm{TWS}}}$ ) of FSC due to different TWS observations is based on mean values of different precipitation datasets (PREC, GPCC, and CRU-NCEP) and GRACE TWSA from different centers (CSR, JPL, and GFZ) during 2003–16. (b) The uncertainty (standard deviation${\sigma _{\rm{pr}}}$ ) of FSC due to different precipitation observations is based on mean values of TWS from the three centers and different precipitation datasets (PREC, GPCC, and CRU-NCEP) during 2003–16. (c) The standard deviation of FSC due to precipitation observations (${\sigma _{\rm{pr}}}$ ) is divided by the standard deviation of FSC due to TWS observations (${\sigma _{\rm{TWS}}}$ ).To explore factors that influence the FSC, we analyze the distributions of the observed FSC which are conditional on the magnitude of the aridity index and LAI (Fig. 4). Previous works (McColl et al., 2017) found that the surface soil FSC is smaller in wet regions due to the significant increases in drainage which occurs when soil moisture increases. Here, we arrive at a similar conclusion that total land water-based FSC significantly increases with the increase of aridity (r = 0.92, p < 0.05) (Fig. 4a). Meanwhile, the impact of LAI on total land water-based FSC is significant and should be considered as well. It is found that FSC decreases with increasing LAI, which means that a greater LAI reduces the ability for land to retain water due to larger evapotranspiration. The correlation between them is −0.36 (p < 0.05) (Fig.4b).

Figure 4. (a–b) The relationship between FSC and aridity index/LAI over 194 major river basins. In (a) and (b), the anomaly correlation coefficients are 0.92 and −0.36 (p < 0.05), respectively.
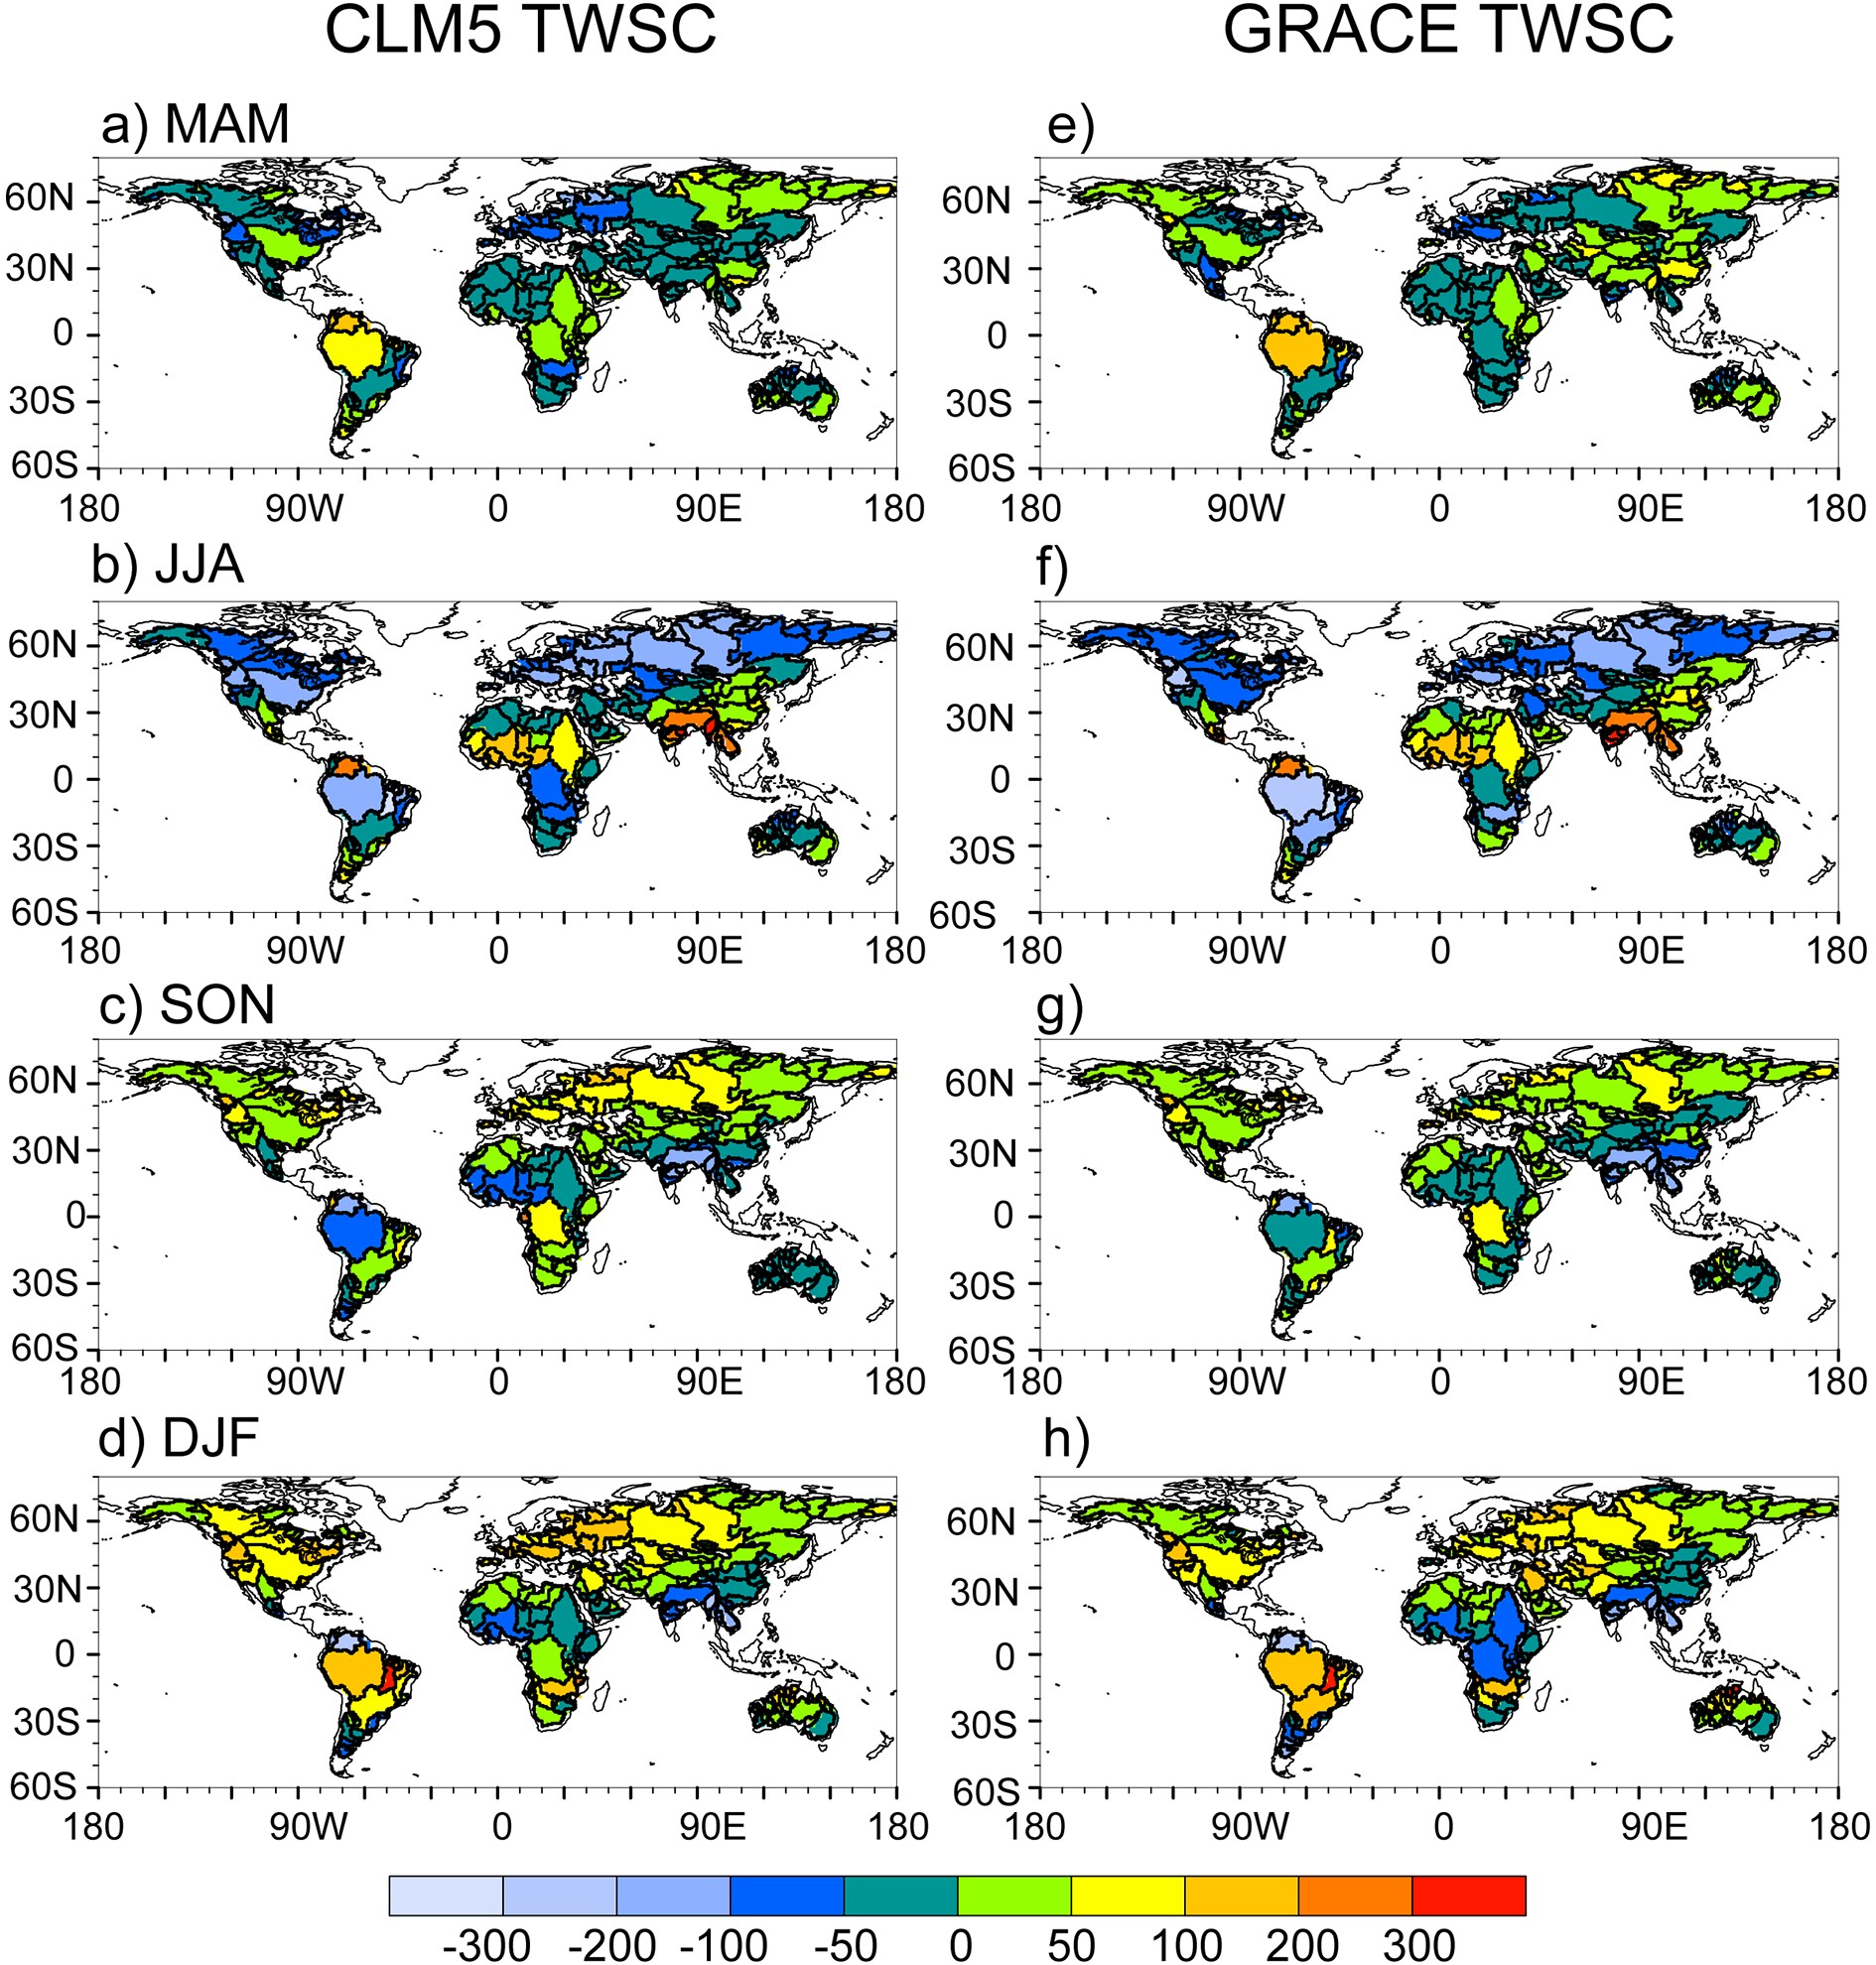
Due to the availability of GRACE, the simulation with CLM5 is a good choice to analyze FSC for land and its different components, such as soil at different depths and snow, at finer temporal resolution. Following Yuan and Zhu (2018), we utilize the CRU-NCEP dataset, in which precipitation is consistent with CRU at monthly time scale, as the atmospheric forcing for running the CLM5 simulation. We compared the seasonal TWSC from the GRACE and CLM5 simulations spanning the period from 2003 to 2016. The CLM5 simulation presents reasonable distributions of seasonal TWSC over the major global river basins (Fig. 5), and the ACCs between them are 0.66 (MAM), 0.92 (JJA), 0.77 (SON), and 0.85 (DJF) (p < 0.05), respectively. Additionally, compared to the SMAP observation from 2015 to 2016, the CLM5 can simulate the climatological distribution of surface soil moisture (5 cm) reasonably well except over high-latitude and rainforest regions where both simulations and observations may have large uncertainties (Fig. 6). The ACC over 194 basins between the SMAP observations and CLM5 simulation is 0.69 (p < 0.01). Therefore, CLM5-simulated TWS and soil moisture are used for the FSC analysis in this study. Compared with the observation (Fig. 2), CLM5 reasonably captures the climatology of the FSC distribution of the land surface (Fig. 7a) in most river basins. The basin weighted average simulated FSC (0.26) is smaller than the observation (0.28), and the ACC between them is 0.45 (p < 0.05). Moreover, the simulated total land water-based FSC shows obvious seasonal variations, especially at high-latitudes (not shown). It is large in fall (SON) and winter (DJF) (weighted means are 0.24 and 0.5, respectively) and small in spring (MAM) and summer (JJA) (0.10 and 0.07). The phenomena are closely related to freezing and melting processes because winter precipitation at northern latitudes will mostly remain on land as snow and ice until spring. However, it is noteworthy that the CLM5 simulation in this study does not include the impact of human activity, such as pumping, irrigation, and land cover change that are implicitly presented in the GRACE observation. So the differences between them, which are mainly located in North China and Central America, might be attributed to anthropogenic influences.
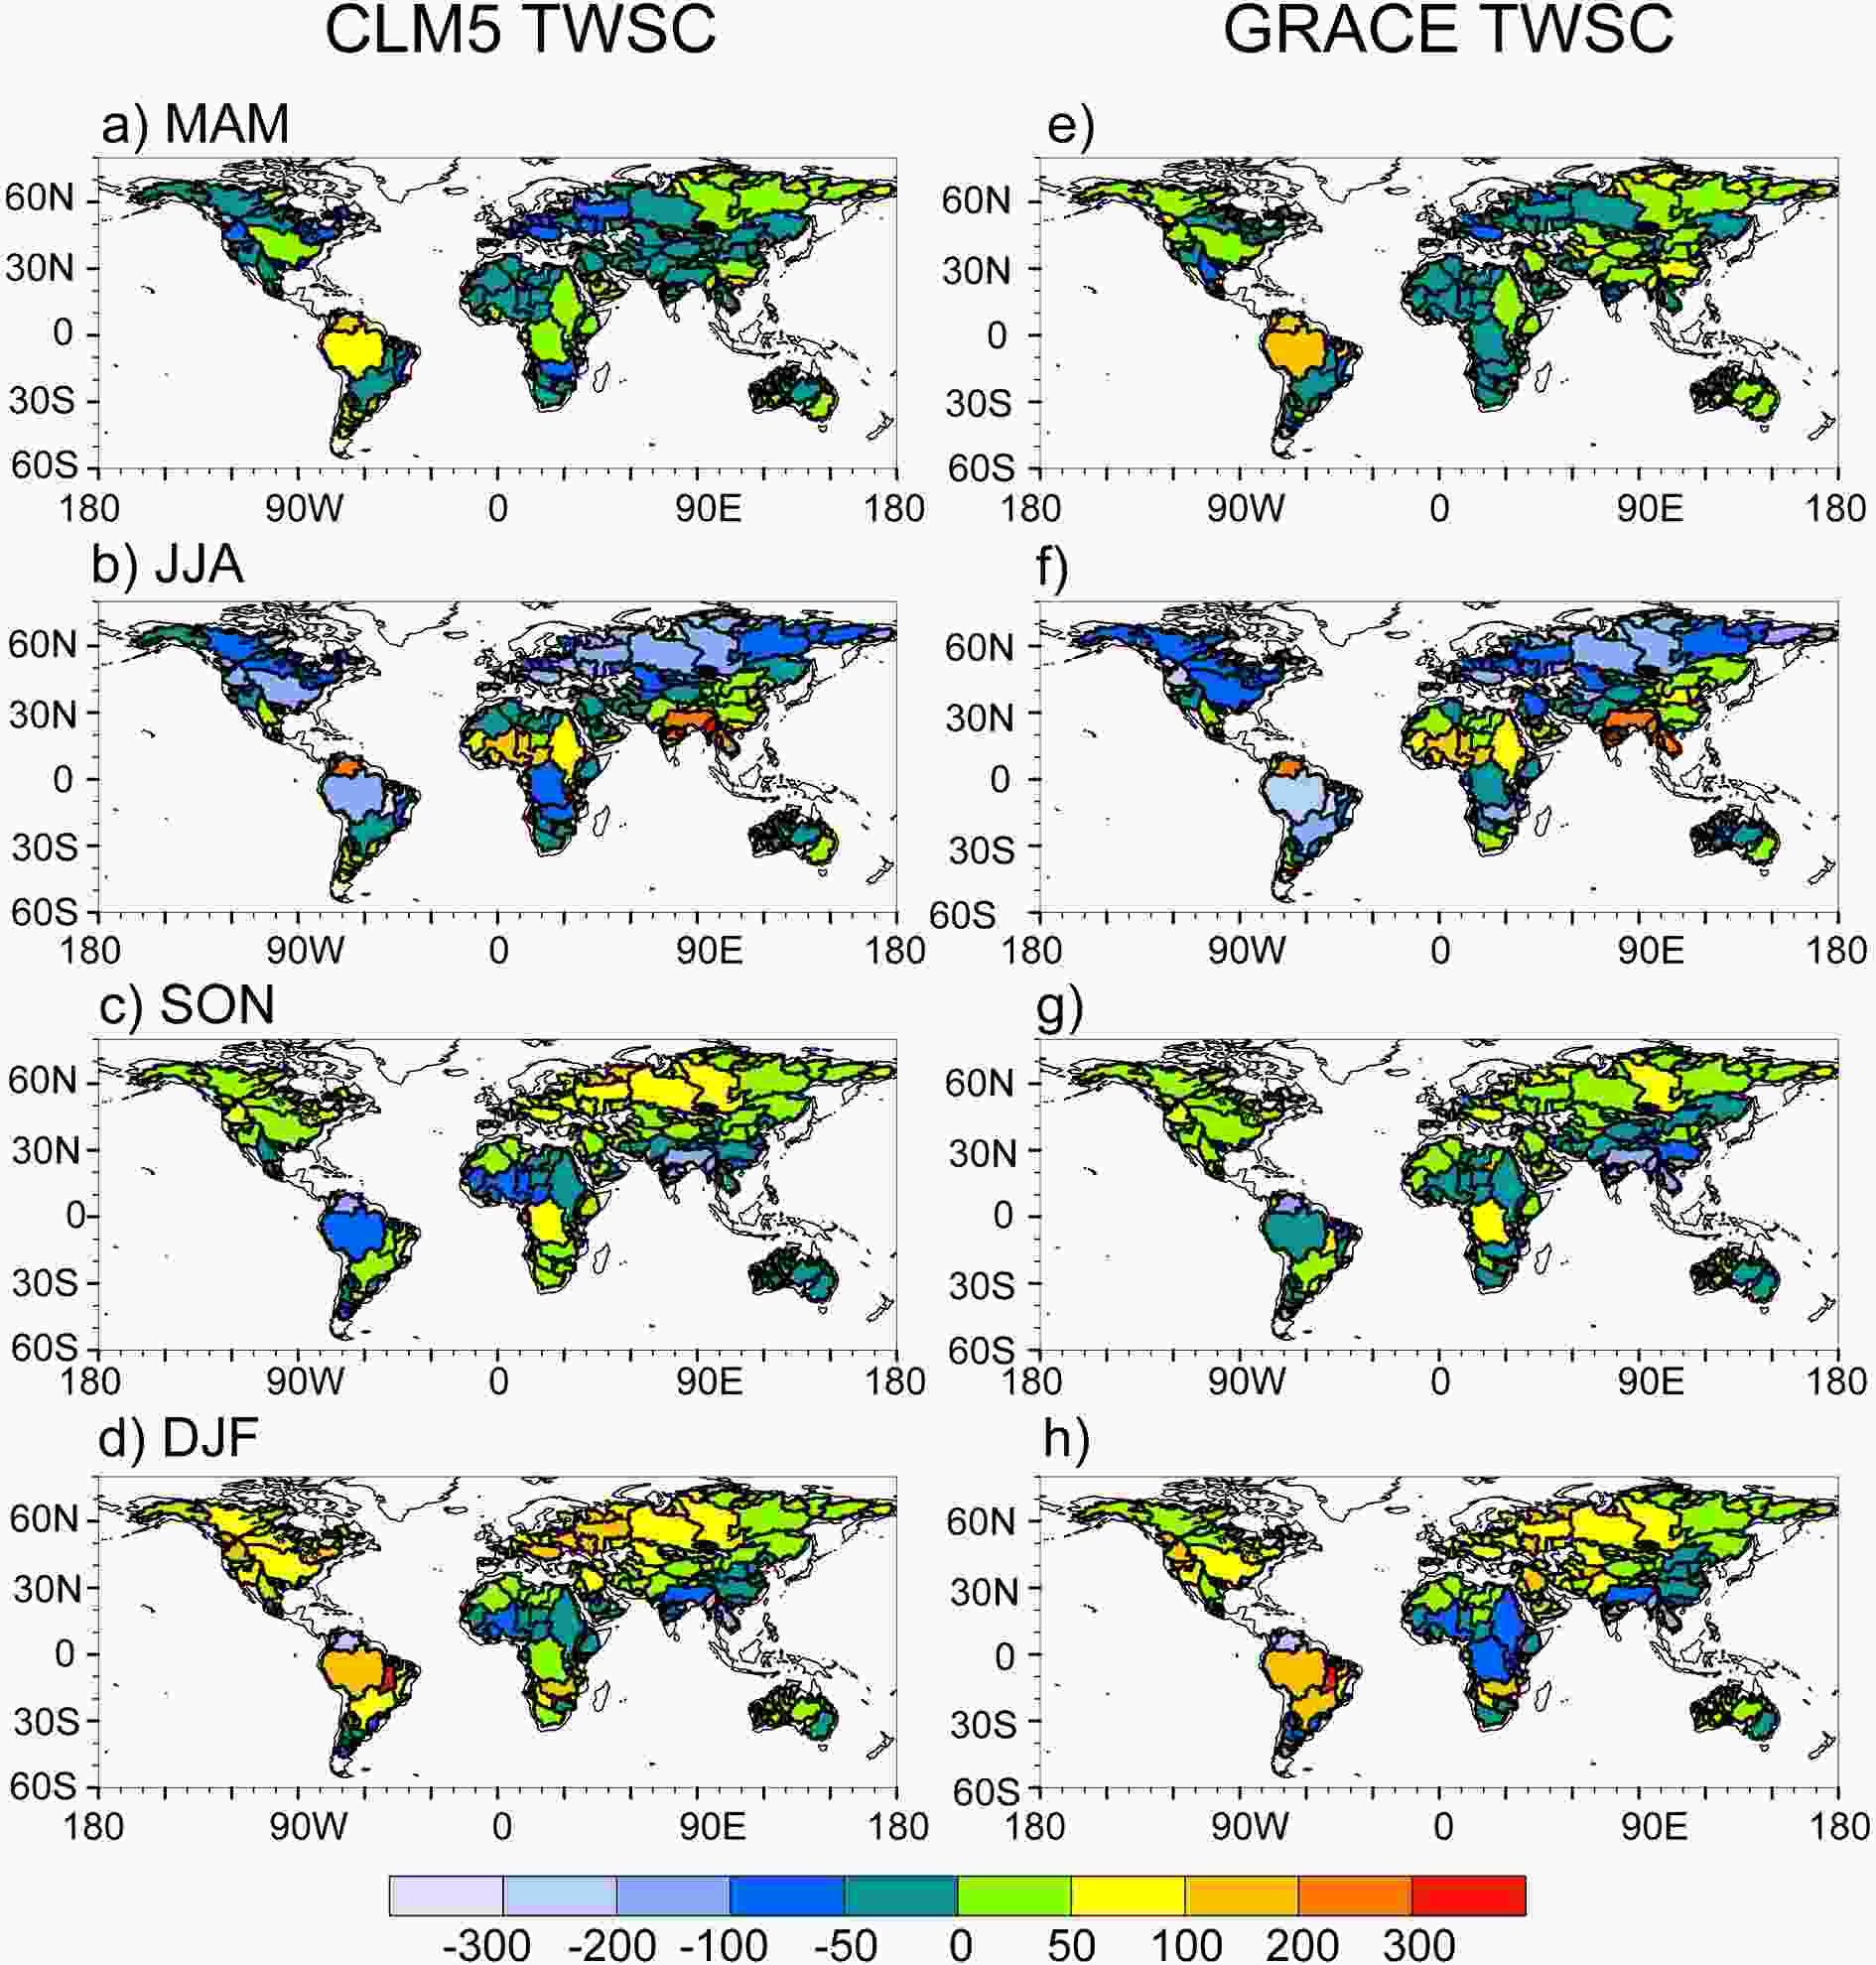
Figure 5. Validation of CLM5-simulated (left) seasonal mean terrestrial water storage change (TWSC) against GRACE satellite retrievals (right) averaged over 194 river basins during 2003–16.
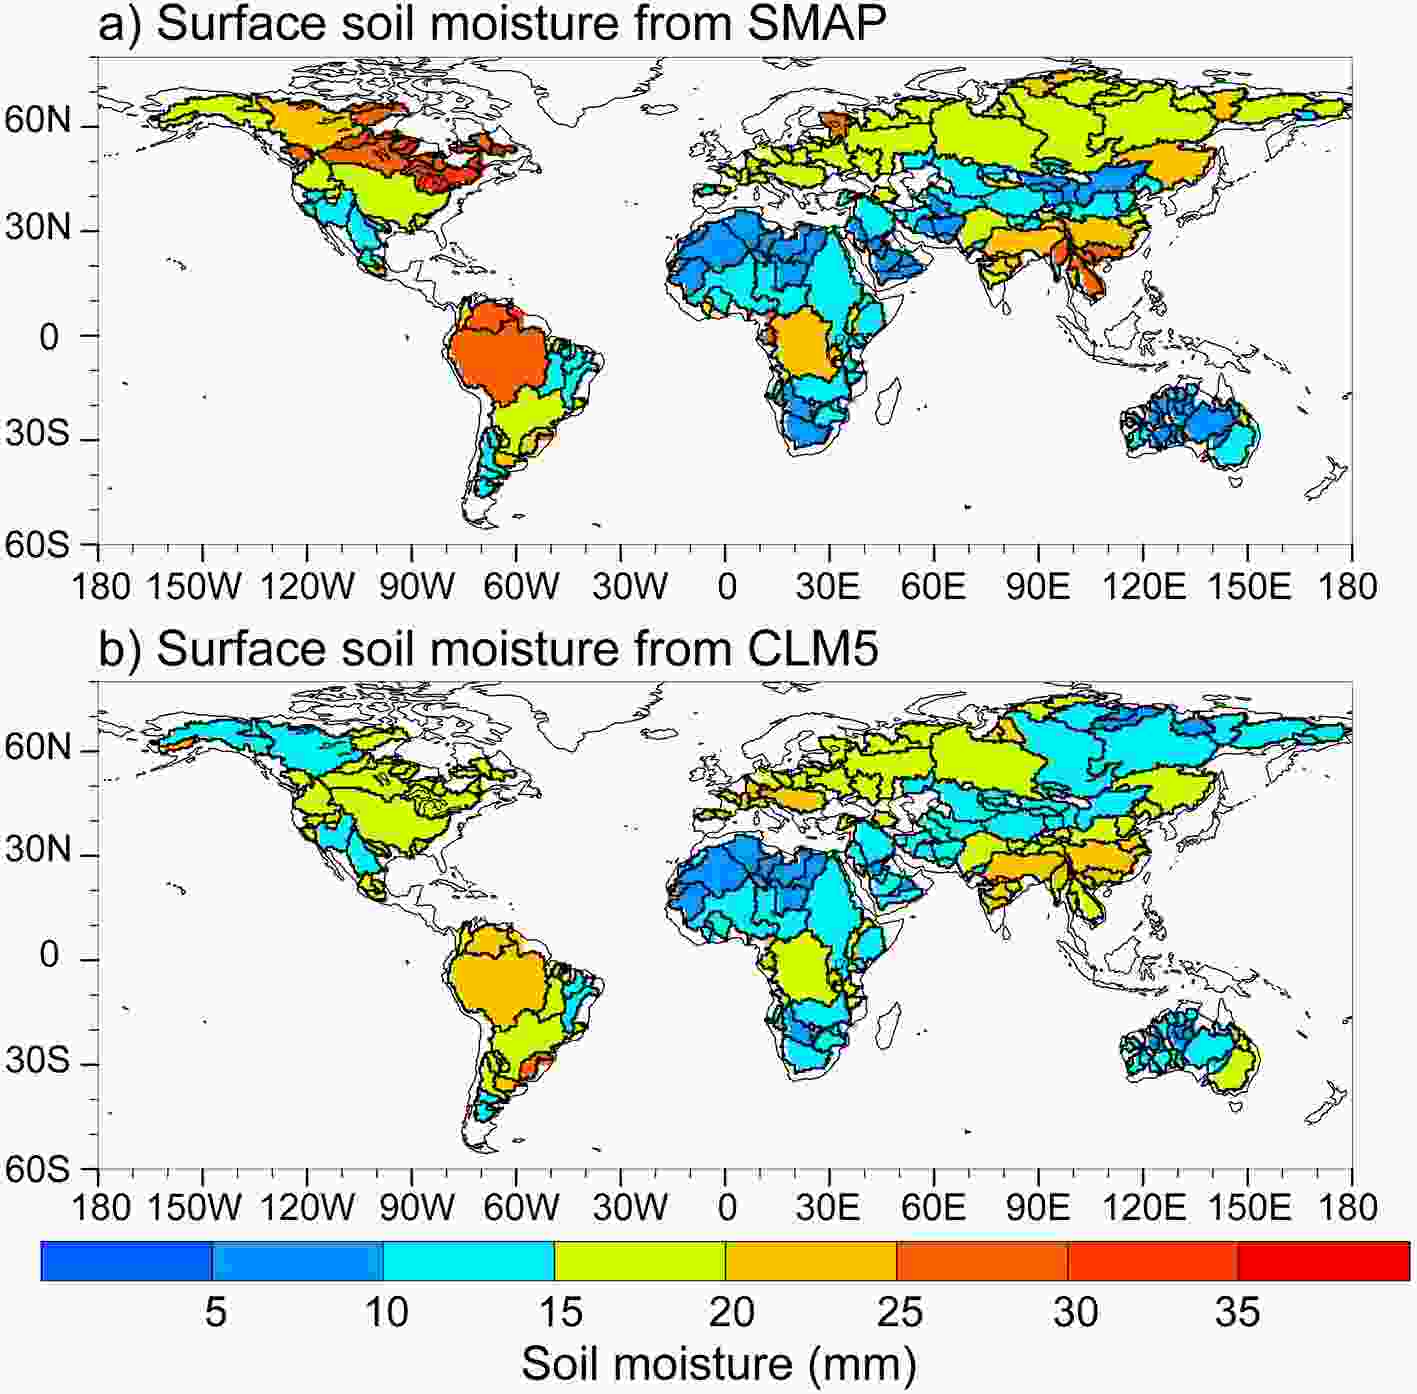
Figure 6. The climatological distribution of surface soil moisture (5 cm) based on (a) SMAP observation and (b) CLM5 simulation from June, 2015 to December, 2016.

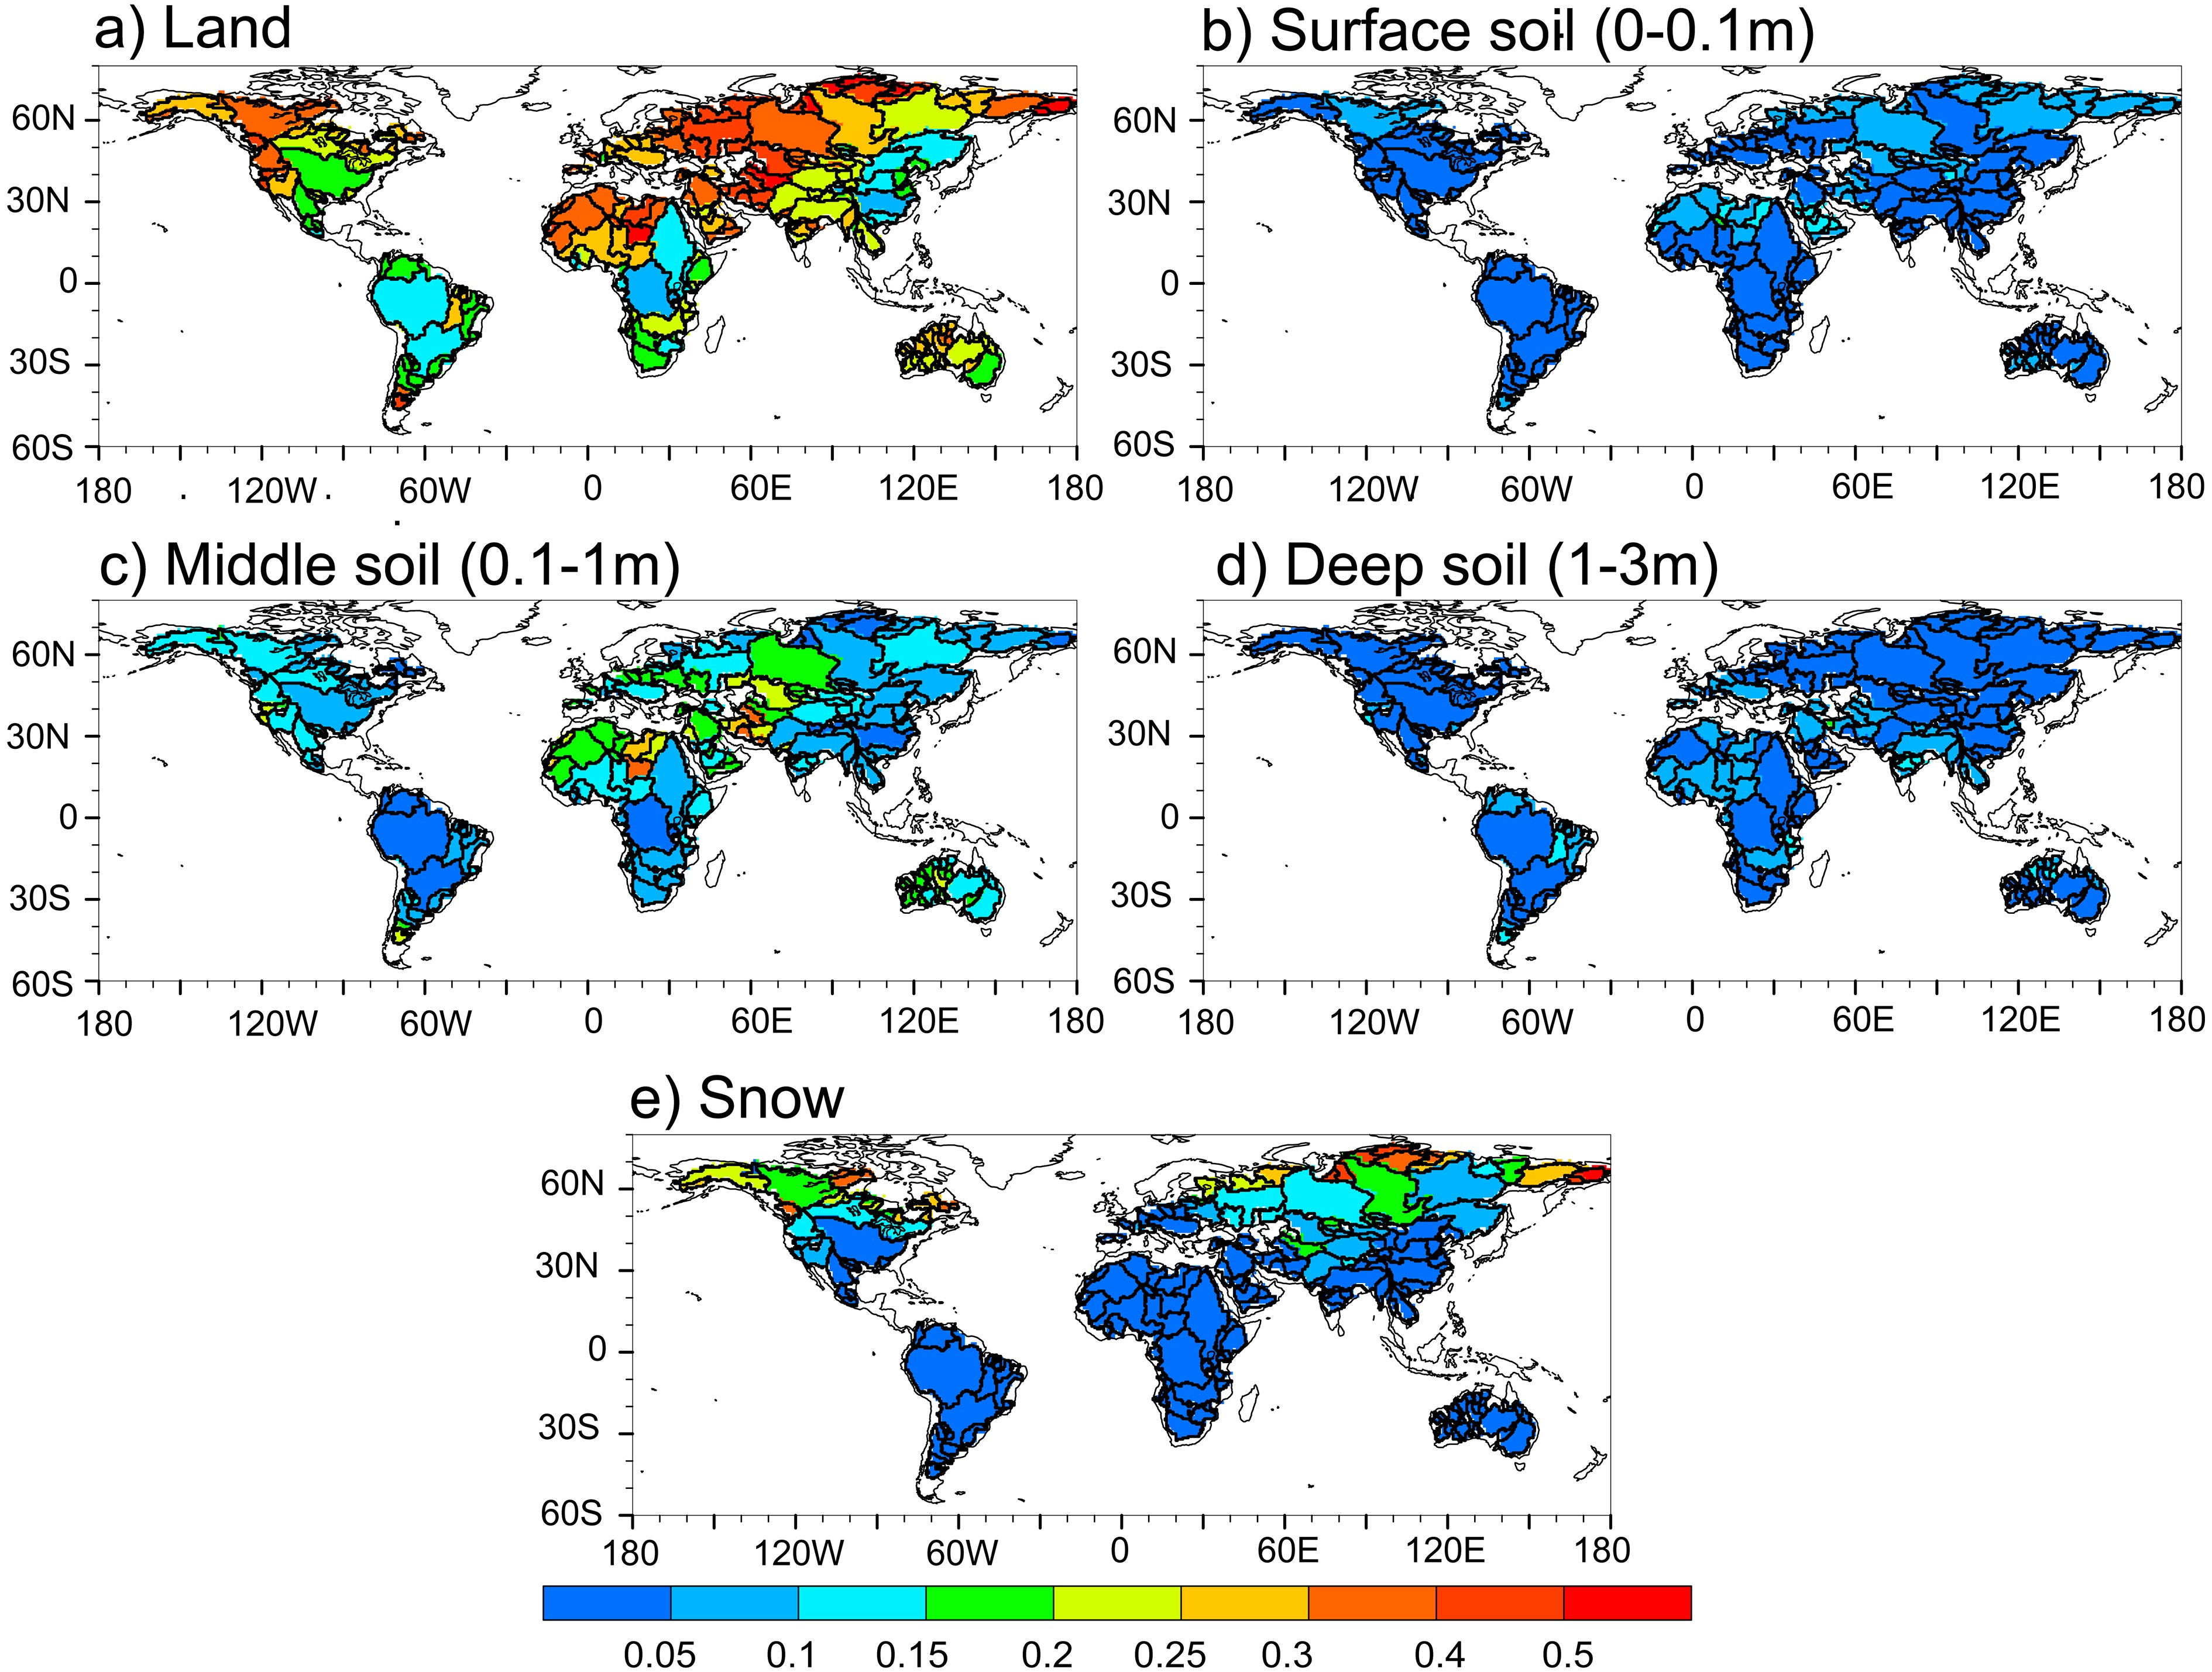
Figure 7. The FSC of land (a), soil columns at different depths (b–d), and snow (e). The TWS, soil moisture at different depths and snow are simulated by CLM5 over river basins during 2003–16.
Land surface water is stored as various components including snow, surface water, canopy water, and soil moisture at different depths. Therefore, the total land water-based FSC is controlled by a series of complicated land hydrological dynamic processes (e.g., internal drainage, capillary effect). Due to the lack of large-scale and long-term observations of these components, LSMs are widely used to provide spatiotemporal continuous estimations in practical applications. Although more water is stored in deep soil (below 3 m), the snow and soil at the top 3 m play nontrivial roles in the land FSC. Here, we investigate the temporal and spatial characteristics of FSC for various depths of soil and snow based on the CLM5 simulation. To analyze the FSC for surface and deep layer soil, we divide the soil column into three layers including depths of 0–0.1 m (surface soil), 0.1–1 m (middle soil), and 1–3 m (deep soil). It is worth noting that the bedrock depth is less than 3 m, or even 1 m in some areas, and the soil moisture most often is equal to 0 when the soil is below the bedrock, while the averaged depth in most basins is over 3 m. Therefore, in this study, the soil moisture in the 1–3 m (0.1–1 m) column over basins represents the total soil water from 1 m (0.1 m) to 3 m (1 m) or bedrock. In the simulation, the global basins weighted averaged FSC for them are 0.04, 0.11, and 0.03 at monthly time scale, respectively (Figs. 7b-7d). Although a large proportion of TWS is stored in deep soil layers over most river basins, the middle soil column (0.1–1 m) contributes to about 40% of the land FSC, especially in arid or semi-arid regions (Fig. 7c). In addition, the impact of snow should be emphasized in high latitudes where more precipitation is stored as snow instead of soil moisture in the middle soil layer, which is closely related to the large land FSC over these regions (Fig. 7e). Therefore, besides the surface soil water that can be measured by microwave remote sensing (McColl et al., 2017), the middle soil layer and snow should also be considered in the FSC analysis, especially at longer time scales.
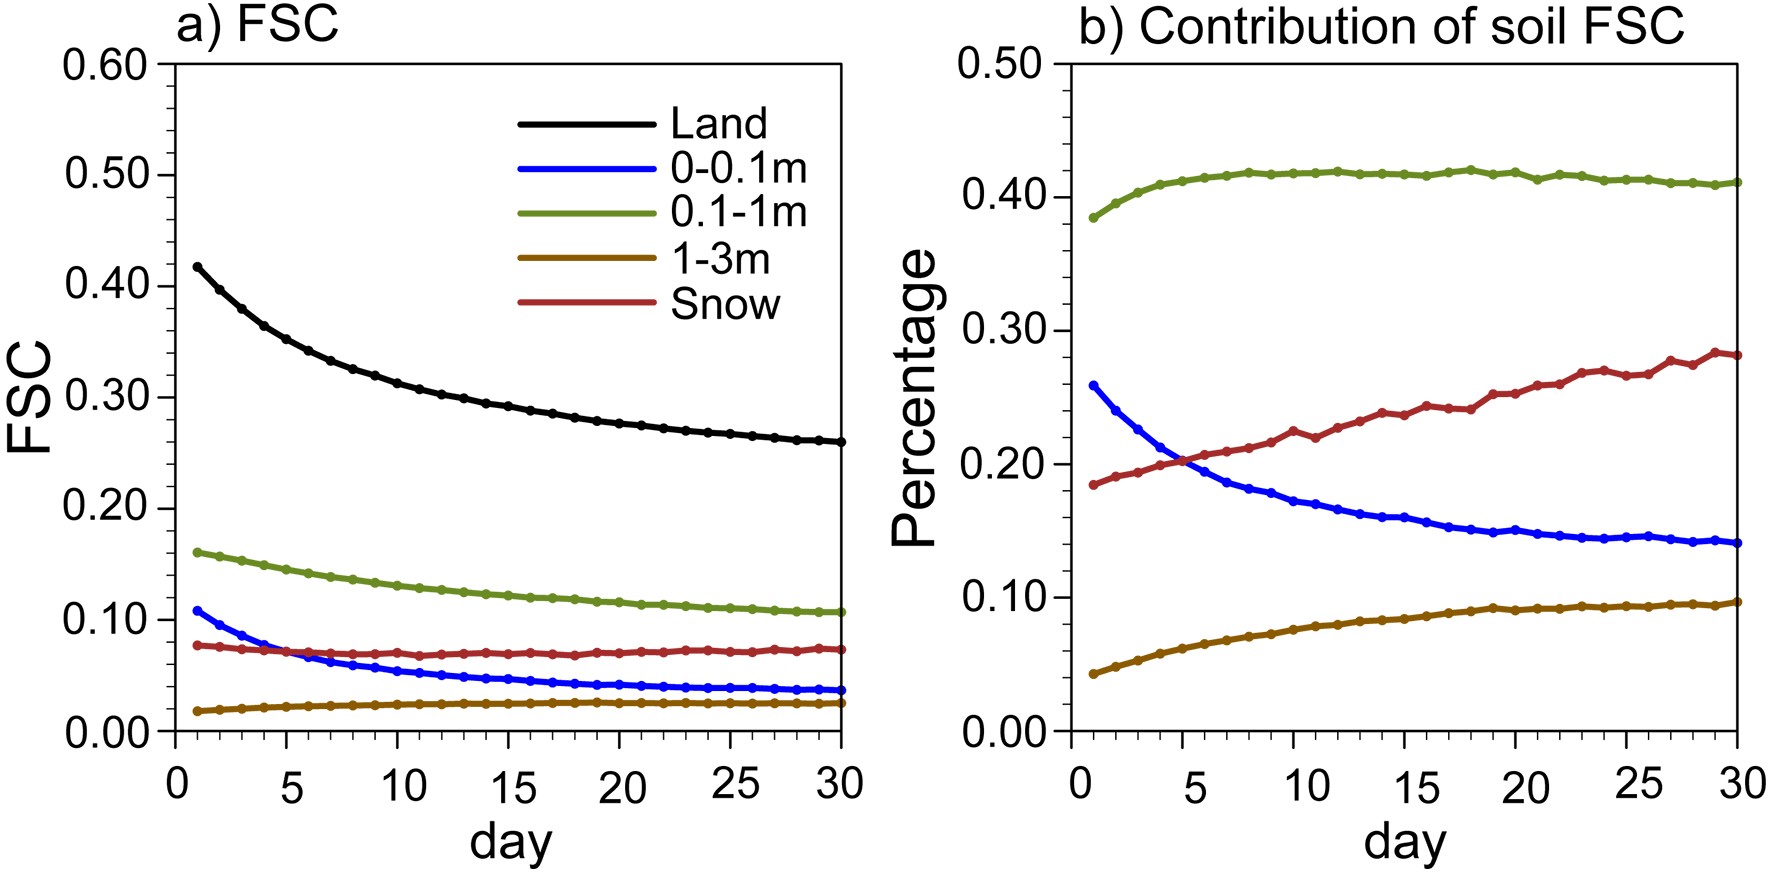
For the global basins, using the CLM5 simulation, we calculate the weighted mean FSC for land, the three layers of soil columns, and snow from day 1 to day 30 (Fig. 8a–b), respectively. In general, total land water-based FSC has decreased by about 38% in 30 days (Fig. 8a). The results based on the CLM5 simulation show that the surface soil FSC rapidly decreases during the first week (Fig. 8a) due to the combined effects of evaporation and internal drainage. The middle soil FSC also decreases from 0.16 to 0.11, but a slight increase in deep soil FSC is noted from 1 day to 30 days, due to the slow water movement. In addition, the decreasing trend of snow FSC is small as well, which contributes more than 20% to the land FSC after three days (Fig. 8b). Despite the large decrease of middle soil FSC across time scales, this layer contributes about 40% to the global total land water-based FSC at various time scales (Fig. 8b). We further note that the contribution by the surface soil is nontrivial at short intervals, but the storage of freshwater by snow plays a more important role than the surface soil after five days (Fig. 8b).
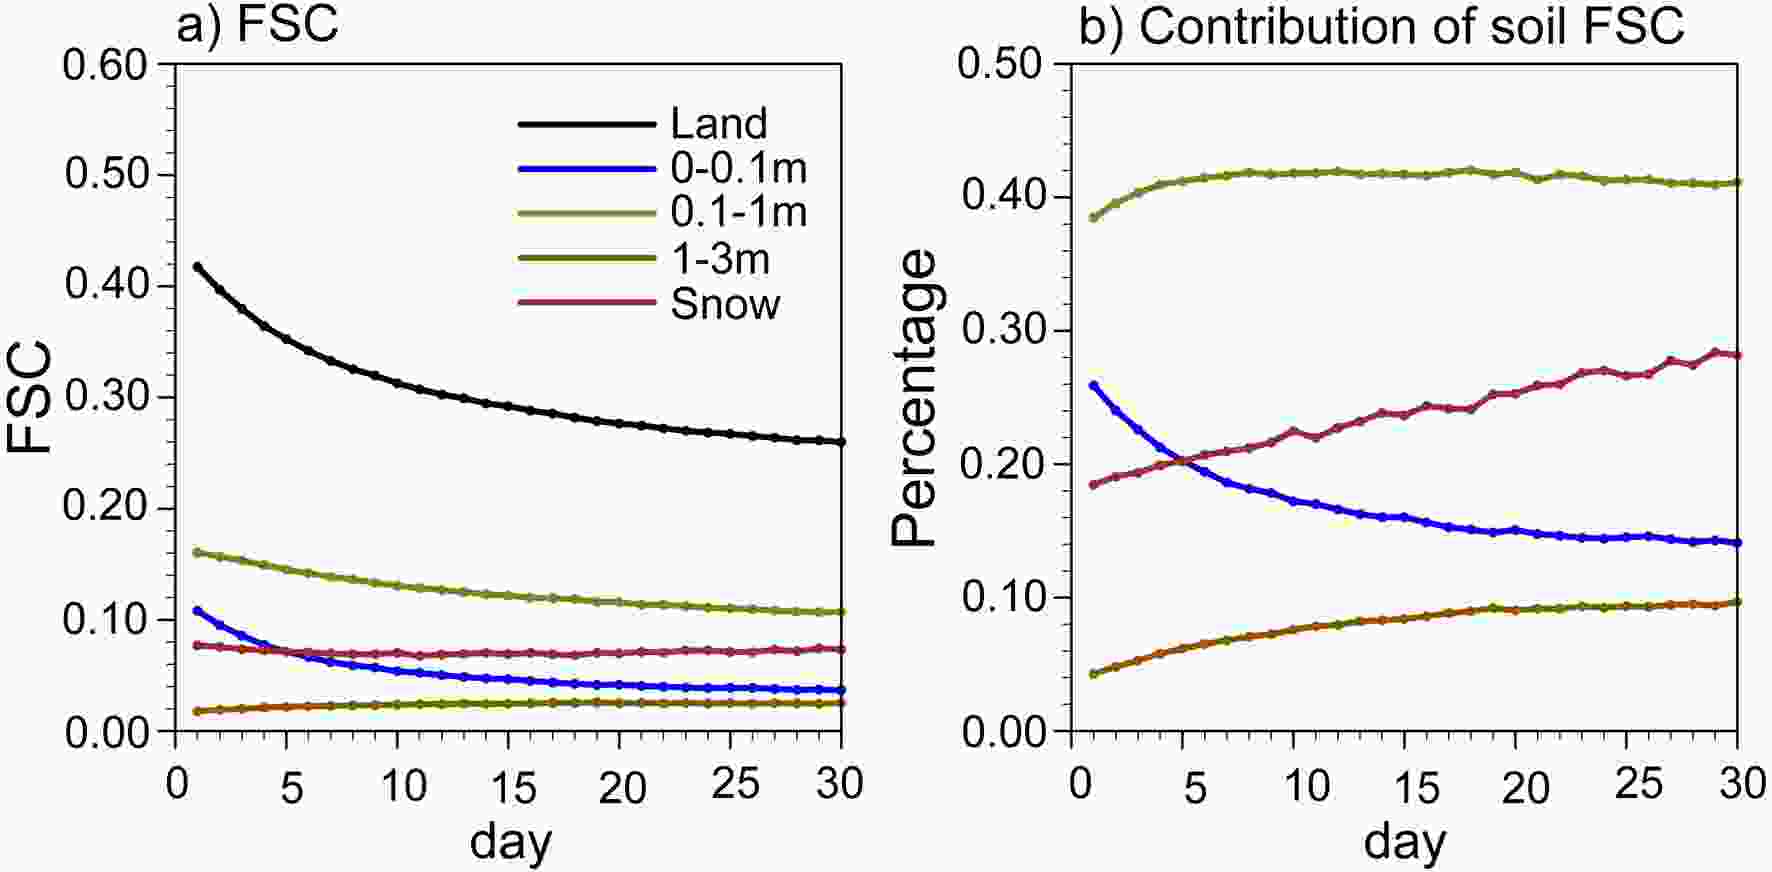
Figure 8. (a) The weighted averaged FSC for land, snow, and different soil columns at various depths across time scales for global river basins. (b) The contributions of snow and soil moisture at different depths to the total land water-based FSC. All statistics are based on the data during 2003–16.
With the time step increasing, the decrease of FSC can be observed globally, especially in monsoonal regions such as western America, southern China, India, and parts of Africa (Fig. 9a–9o). Compared with the work of McColl et al. (2017), the distribution of the surface soil FSC at 3 days (Fig. 9b) is similar, with higher FSC mainly located in arid and semiarid regions, such as parts of the Middle East, central Asia, and northwestern China, where the water cycle at the interface of the atmosphere and the land surface overturns at a slower rate. For the global basins in this study, the weighted averaged FSC for surface soil at three days is 0.09, which is smaller than the value of 0.14 found by McColl et al. (2017), noting that our surface column is thicker than the SMAP observation (5 cm). The middle soil column contributes most to the total land water-based FSC, especially in semi-arid regions such as central Asia, western America, and the Middle East (Figs. 9c, h, m), and the change of deep soil FSC is not obvious. Despite the major impacts of the middle soil layer (Fig. 8b), the impact of snow is comparable to the middle soil in some basins, especially in high latitudes (Fig. 9e), even at short time scales.
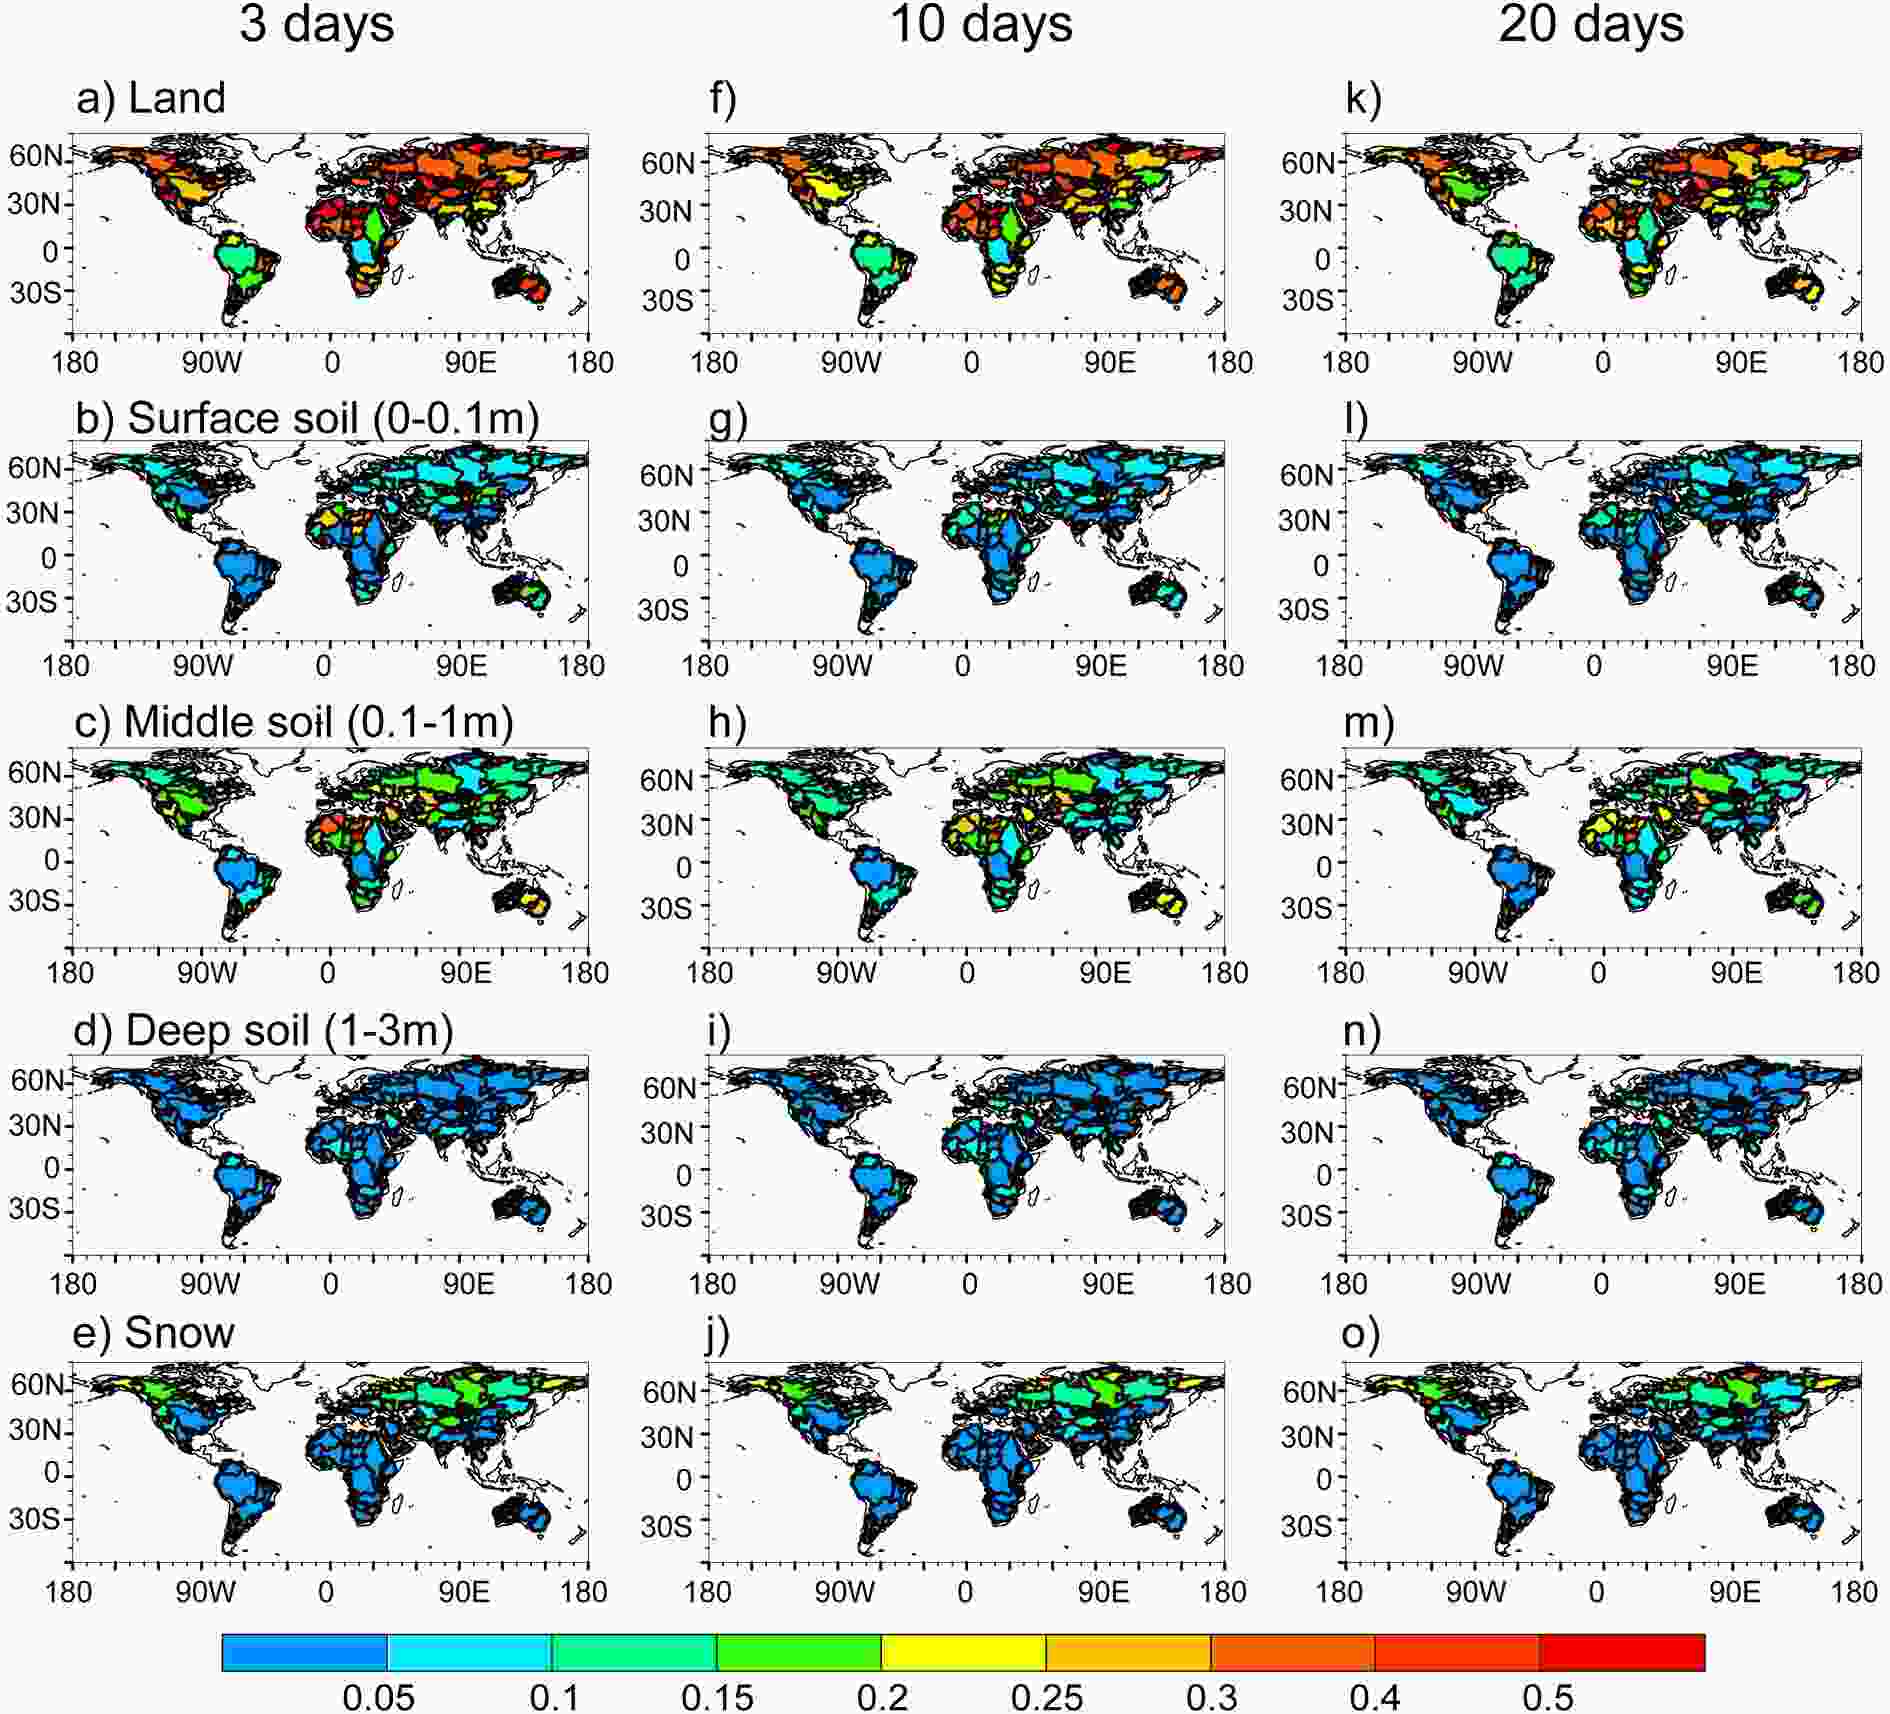
Figure 9. Distribution of FSC for land, different soil columns, and snow over global river basins for 3-day (a–e), 10-day (f–j), and 20-day (k–o) time scales based on CLM5 simulations during 2003–16.
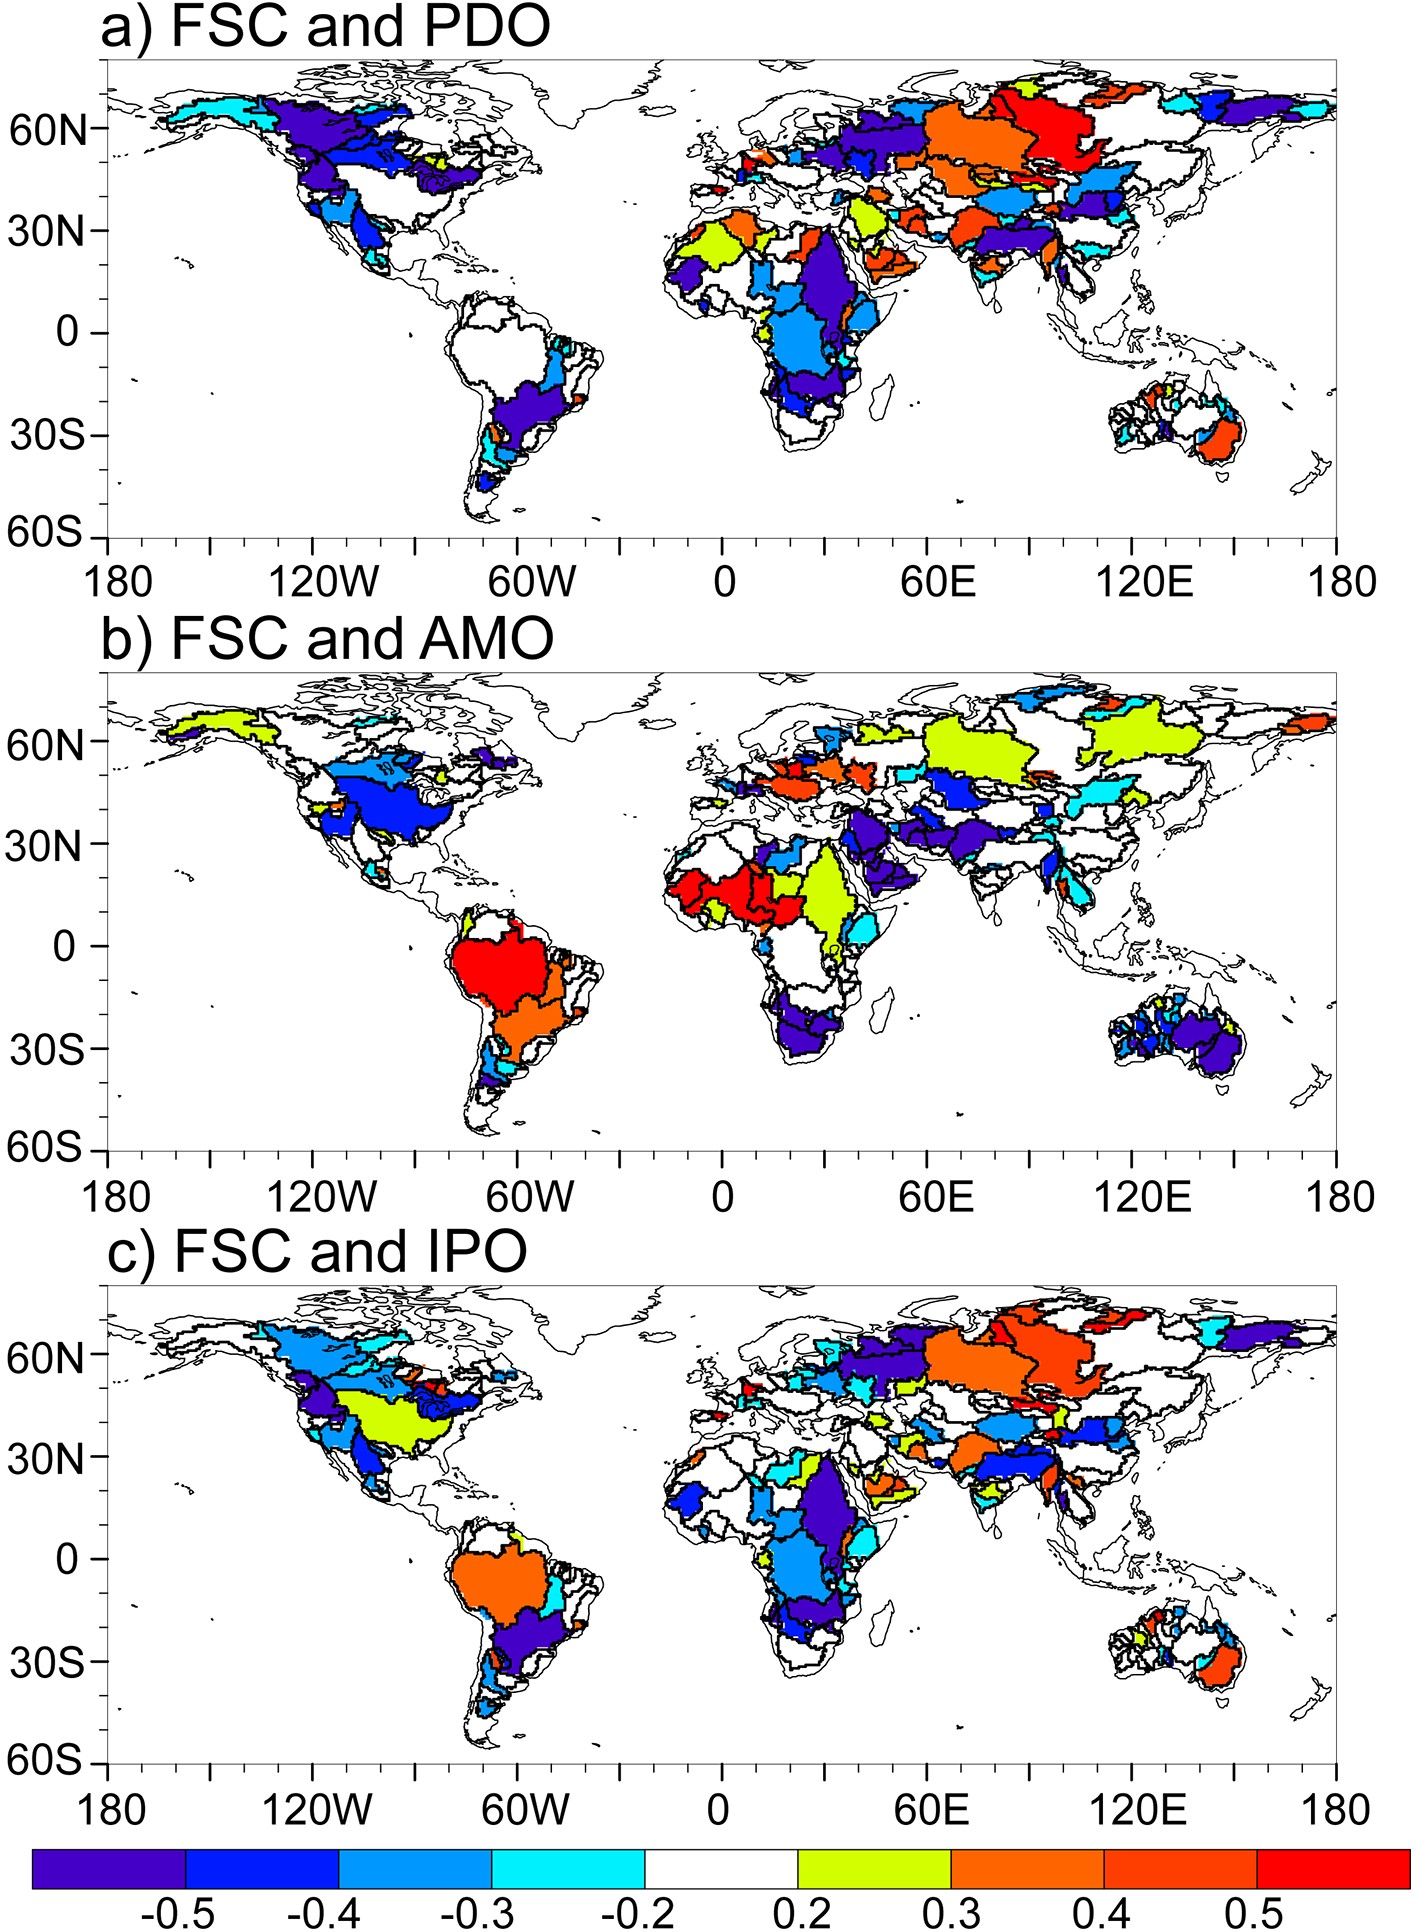
To investigate the decadal variability of global FSC, Figs. 10a–c display the spatial distributions of the ACC between climate indexes (i.e., PDO, AMO, and IPO) and the 10-year moving average of FSC for land from 1951–2016, based on a CLM5 simulation. The total land water-based FSC of Eastern Australia and parts of the mid-and high-latitudes of Asia presents a positive correlation with the PDO, while the ACCs for most basins in Africa and North America are negative (Fig. 10a). The AMO plays a major role in the Amazon and Sahara where the FSC is large when the AMO is positive, while its impact on Australia is the opposite (Fig. 10b). In addition, the spatial pattern of the ACC between IPO and FSC is similar to that of the PDO, except in the Amazon and Mississippi River basins (Fig. 10c).
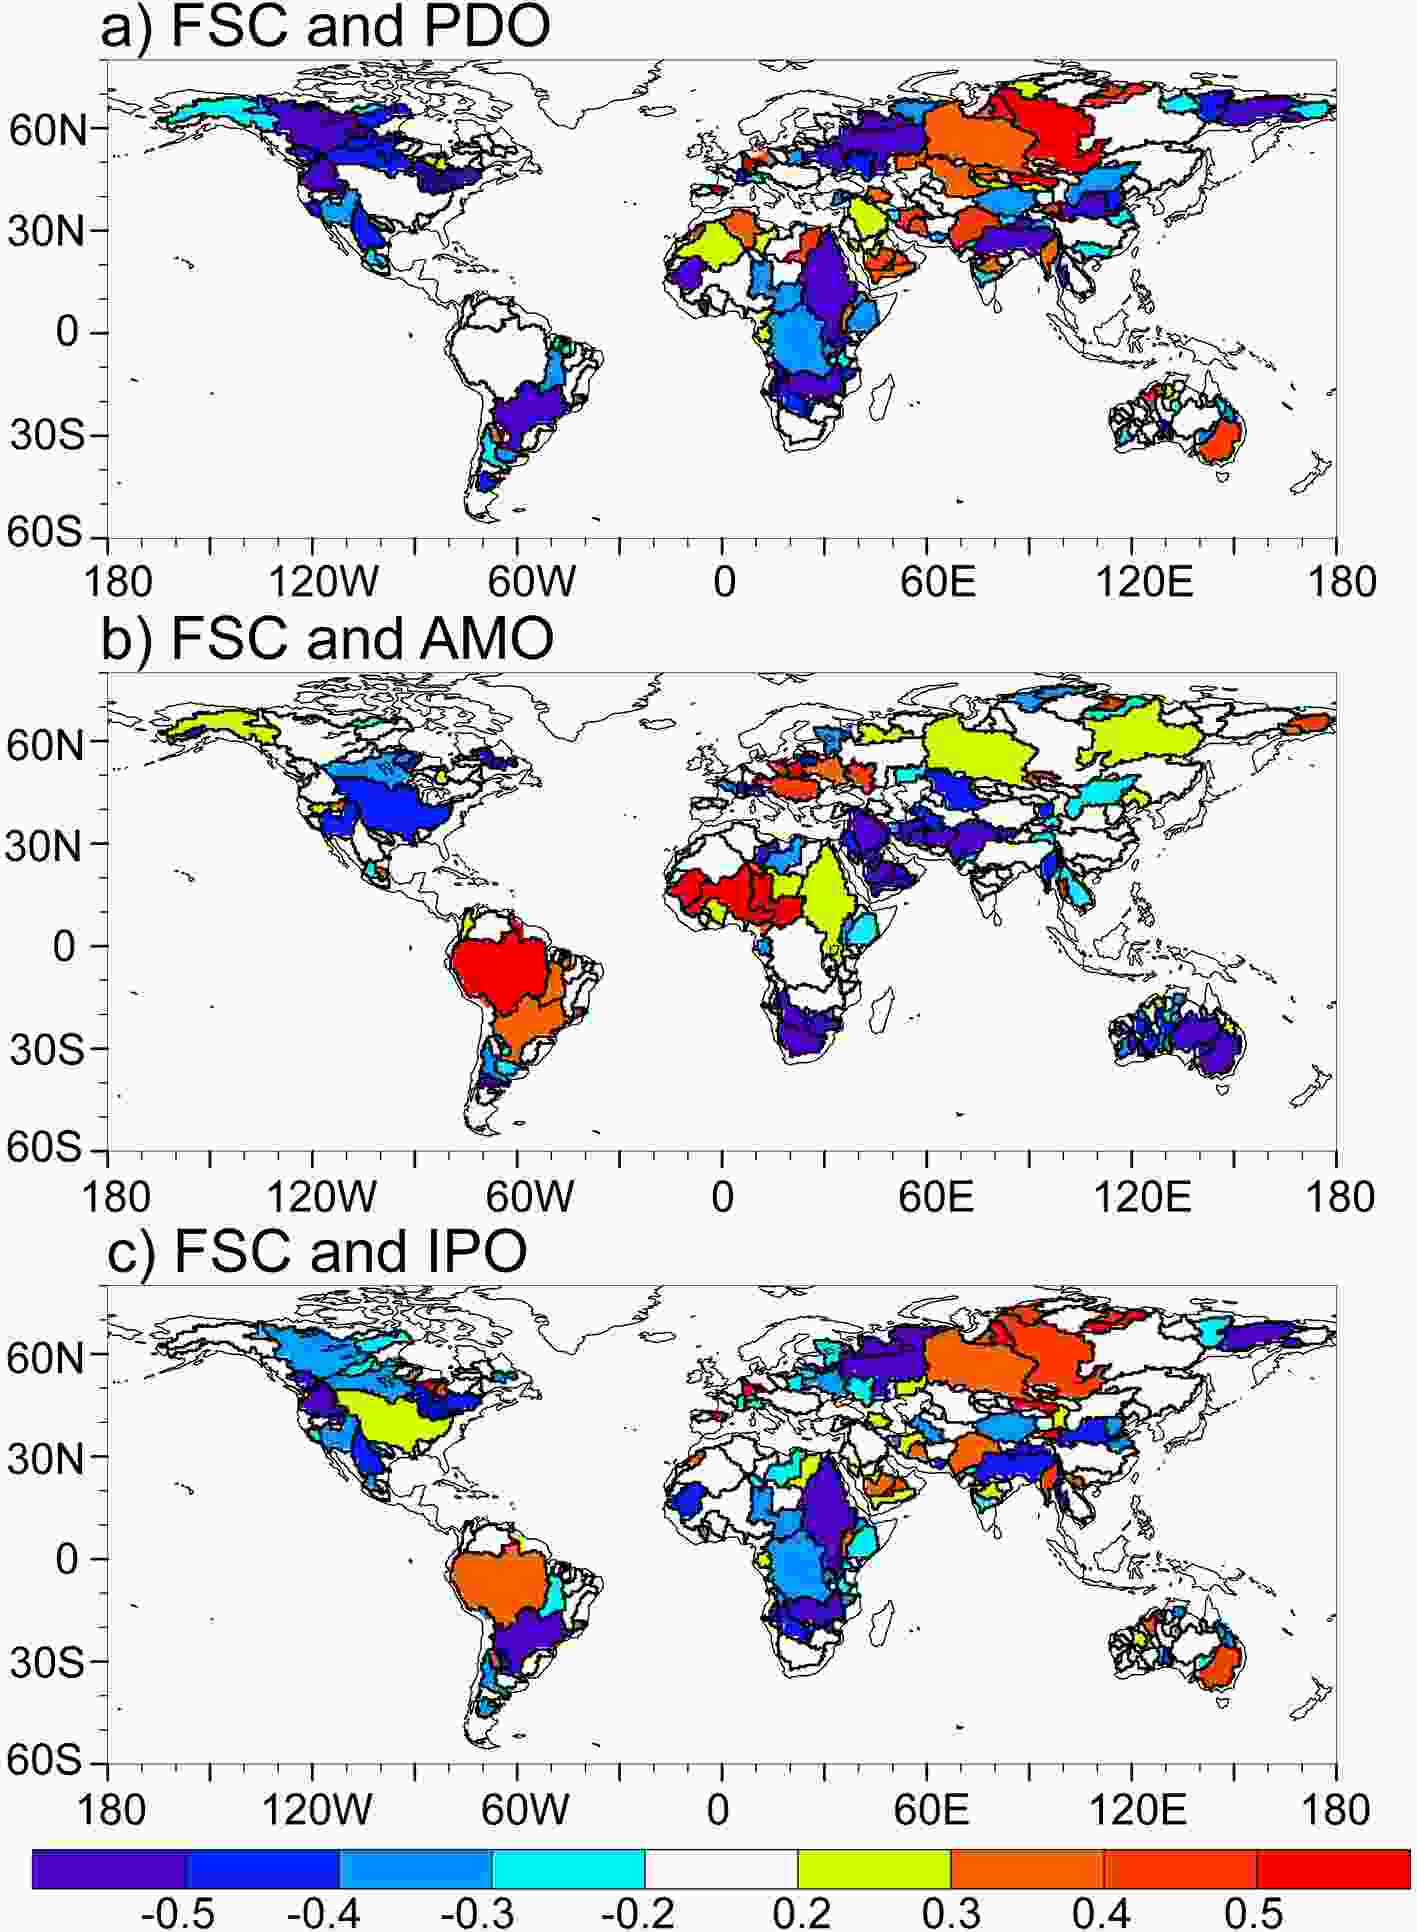
Figure 10. (a–c) Anomaly correlation coefficients between CLM5-simulated total land water-based FSC and the climate indices (PDO, IPO, and AMO) during 1951–2016.
-
This study applies a state-of-the-art method to measure FSC over global major river basins and investigates the associated hydrological dynamics through observations and land model simulations. Based on the retrievals of GRACE satellites and multisource precipitation observations, the estimated land FSC on a monthly time scale is over 0.35 for 25% of the river basins, especially in parts of the Middle East, central Asia, and high-latitude regions. In terms of weighted average, over one-fourth of the rainfall can be retained in basins after one month. Although the simulated total land water-based FSC is smaller than observations, the correlation between them is significant. In addition, the climate condition and land cover exert great influences on the FSC, with significant positive (negative) correlation between FSC and the aridity index (LAI).
The GRACE satellites provide valuable measurements for an integrated estimation of global FSC on monthly time scale, and the CLM5 land model simulations can be used to separate the contributions of different TWS components to the FSC across multiple time scales. Although the TWS can be divided into different components, the globally averaged TWS changes can be mainly partitioned between the change of soil moisture and snow (Syed et al., 2008). Similarly, we find that a large proportion of water is stored in the deeper soil, but the middle soil column (0.1–1 m) has the largest impact on the storage capability, especially in some basins, like Western Europe. Although the aquifer is another crucial component of TWS, we were not able to analyze its impacts on FSC because the CLM5 removed the unconfined aquifer module. The aquifer is recharged mainly by the water infiltration through the lower boundary, but we think the impact of aquifer on basin-scale land FSC is relatively small on monthly time scale due to the long residence times of groundwater. Nevertheless, the impacts of groundwater on longer time scales at specific regions need to be further analyzed through appropriate observations and quantification methods. Surface soil contributes more than 25% to the FSC at short time scales especially in arid regions, but it declines quickly over time, noting that snow gradually plays a more important role, especially in high-latitude regions. Therefore, middle soil moisture and snow should be considered in the analysis of the global FSC, especially at longer time scales.
The GRACE data is able to represent the impact of human activities, but the CLM5 simulations in this study ignored anthropogenic influences. Although the impact of human intervention does not contribute much to the total water storage change in large parts of the world, it should be significant and thus accounted for in areas where human activities are intensive (Haddeland et al., 2014). The difference between FSC based on observation and simulation could partly be attributed to the influence of humans, and the issue deserves more attention in some specific regions, such as North China, India, and North America. Besides that, inter-basin water transfers also need more attention, which is common in many countries such as China, America, India, and Australia (Allison and Meselhe, 2010).
Due to the long residence time, the variation in TWS containing previous climate information can affect the subsequent weather and climate through a series of complicated land-atmosphere feedback processes. Therefore, the memory from TWS, which can be measured with FSC, is a non-negligible source of climate predictability (Reager and Famiglietti, 2009). Though the memory is always viewed as a stationary feature of TWS or other components, we find that the internal climate variability or external climate forcings can alter the land memory time scale. Here, we show the response of the FSC to decadal climate variability. Our work represented the variability of FSC to climate indexes, such as the PDO, AMO, and IPO. Besides the internal climate variability, human interventions, such as land use/land cover change, and the management of water resources (e.g., reservoir regulation, irrigation, and groundwater exploitation), are also critical factors directly affecting regional or local FSC, where the analysis of LAI provides a good example. The capability to comprehend such anthropogenic pathways would in turn influence many aspects of hydrology and agriculture such as the water cycle, crop yield, and so on. Therefore, separating the influence of human activities on the changes in FSC is worthy of comprehensive research.
Acknowledgements. This work was supported by the National Key R&D Program of China (2018YFA0606002), the National Natural Science Foundation of China (41875105), and the Startup Foundation for Introducing Talent of NUIST (2018r078). The CRUNCEP forcing data are available on the UCAR website (
https://svn-ccsm-inputdata.cgd.ucar.edu/trunk/inputdata/atm/datm7/ ). The GPCC precipitation datasets are available athttps://www.dwd.de/EN/ourservices/gpcc/gpcc.html and the PREC datasets are available atftp://ftp.cpc.ncep.noaa.gov/precip/50yr/land_ocean/ . The CLM5 is available at CESM website (http://www.cesm.ucar.edu/models/cesm2/ ). The GRACE data can be downloaded from NASA website (https://grace.jpl.nasa.gov/ ).
Global Freshwater Storage Capability across Time Scales in the GRACE Satellite Era
- Manuscript received: 2020-07-07
- Manuscript revised: 2021-02-10
- Manuscript accepted: 2021-02-22
Abstract: Freshwater is recharged mainly by rainfall and stored inland for a period of time, which is directly affected by its storage capability. The storage capability of river basins has different spatiotemporal features that are important for the predictability of freshwater resources. However, the estimation of freshwater storage capability (FSC) remains a challenge due to the lack of observations and quantification indices. Here, we use a metric that characterizes hydrological “inertia” after rainfalls to analyze FSC over the 194 largest global major river basins based on satellite observations from the Gravity Recovery and Climate Experiment (GRACE) and simulations from the Community Land Model version 5 (CLM5). During 2003–16, the global land was observed to retain 28% of precipitation after one month based on GRACE observations, and the simulation depicts that the retained proportions decrease from 42% after one day to 26% after one month, with smaller FSC partly attributed to wetter conditions and higher vegetation densities. The root zone contributes about 40% to the global land FSC on daily to monthly time scales. As the time scale increases, the contribution from the surface soil decreases from 26% to 14%, while the contribution from the deep soil increases from 4% to 10%. Snow contributes over 20% of land FSC, especially over high latitudes. With six decades of CLM5 long-term simulations, it is revealed that the change of FSC in most basins is related to internal climate variability. The FSC of river basins which displays the proportion of precipitation retained on land is worthy of further attention regarding the predictability of water resources.
-
Keywords:
- freshwater,
- GRACE,
- land surface model,
- soil moisture,
- climate variability,
- storage capability
摘要: 淡水是自然界不可或缺的可再生资源,人类处处离不开水。降水是陆地淡水资源的重要补充,且由于植被、土壤等原因造成不同地区陆地储存降水能力不尽相同。陆地淡水储存能力直接决定多少降水可储存于本地,但由于缺乏数据及相应的度量手段,很难直接定量对其进行描述与分析。本研究采用最新提出的降水储存指标并结合GRACE重力卫星观测以及CLM5陆面模式模拟,揭示了全球194个主要流域陆地淡水储存能力及其时空变化特征。分析结果表明,在天时间尺度上,陆地平均可以储存42%的降水。随着时间尺度增长,蒸散发耗损增加,储水能力明显下降。在月时间尺度上,降水中平均仅有28%可储存于陆地,其中根系层(0.1−1 m)在不同时间尺度对陆地储水能力贡献最为明显(约40%),此外在中高纬度地区积雪的贡献也不能忽略(约20%)。陆地淡水储存能力空间分布的不均匀主要与不同地区干湿程度以及地表植被覆盖有关:干旱地区淡水储存能力较强,植被茂密地区储水能力则偏弱。同时,陆地储水能力随时间的变化则与气候内部变率相联系。淡水储存能力可以客观描述降水储存在陆地中的比例,这与水文记忆性紧密联系,更强的储水能力则意味着有更强的记忆性,这会对未来一段时间局地和区域天气气候产生影响。该工作不仅可以为水资源管理提供参考,也为水文预报以及陆-气相互作用研究提供新的思考角度。
-
关键词:
- 陆地淡水储存能力,
- GRACE陆地水储量,
- CLM5陆面模式,
-
, -
, -


 AAS Website
 AAS WeChat