


 DownLoad:


HTML
-
With the rapid economic growth, O3 shows an unexpected increasing trend in China, even though emissions of NOx, SO2 and PM2.5 have decreased in recent years (Sun et al., 2018b; Gaudel et al., 2018; Wang et al., 2019). Wang et al. (2019) reported that O3 has increased with a rate of 6.5 μg m−3 yr−1 in China during 2013−17, and significant O3 pollution is especially found in developed regions such as Jing-Jin-Ji (JJJ, referring to the Beijing-Tianjin-Hebei area), the Yangtze River Delta region (YRD), and the Pearl River Delta region (PRD). It is well known that O3 is formed by a series of photochemical reactions, by which its concentration mainly depends on the relative levels of its photochemical precursors NOx (NOx = NO + NO2) and volatile organic compounds (VOCs) (Seinfeld and Pandis, 2006). However, compared to NOx, the roles of VOCs in the O3 formation process are more complex due to their numerous species, differential reactivities, and variable sources (Atkinson, 2000; Sahu et al., 2016; Zhang et al., 2017). Li et al. (2020) investigated the air quality changes during the 2019−20 COVID-19 lockdown over the YRD and found that the concentrations of PM2.5, NOx, SO2, and VOCs all decreased as expected during the lockdown period, but O3 concentrations increased greatly, further suggesting the complexity of atmospheric photochemical reactions and the importance of fully understanding the connections of ozone concentration to the mixing ratios of VOCs, their sources, and their roles in the atmospheric photochemical reaction processes.
There are thousands of VOCs active in the atmosphere with parts per billion by volume to parts per trillion by volume (pptv-ppbv) levels, and most of those have atmospheric lifetimes ranging from minutes to days (Atkinson, 2000). In most cases, VOCs with a longer atmospheric lifetime evenly distribute themselves in the global atmosphere while others with a short lifetime have very strong concentration gradients in both horizontal and vertical directions due to rapid photochemical reactions (Sun et al., 2018a). Compared to those in developed countries, non-methane volatile organic compounds (NMVOCs) pollution in China is much more severe because of the high emissions from vehicular exhaust, industry, solvent usage, and biomass burning, as well as biogenic sources (Sheng et al., 2018). Previous NMVOCs studies have mainly focused on non-methane hydrocarbons (NMHCs) (Li and Wang, 2012; Wang et al., 2012; Jia et al., 2016; Sun et al., 2018b). However, a few recent studies have shown that oxygenated VOCs (OVOCs) are also an important species which affect the atmospheric oxidation capacity (Mellouki et al., 2015), among which formaldehyde, acetaldehyde, and acetone represent the three most abundant compounds, accounting for more than 70% of the total OVOCs (Guo et al., 2016; Yang et al., 2018).
Here, we give a critical review by focusing on the analytical methods, spatiotemporal variations, photochemical characteristics, and sources of NMVOCs in urban areas to fully understand the current pollution situation of NMVOCs in China. Due to the inconsistencies in the number of species measured by different studies, this paper restricts the analysis to alkanes, alkenes, and aromatics as the representatives of NMHCs, and formaldehyde, acetaldehyde, and acetone as the representatives of OVOCs to keep the data comparable further noting that this restriction possibly led to a certain underestimate of the total NMHCs and OVOCs.
-
The analysis methods for NMVOCs can be categorized into two types, i.e., offline and online. For offline analytical methods, NMVOCs species are first collected and enriched, and then monitored by gas chromatography (GC) or high-performance liquid chromatography (HPLC) with different detectors. In GC, species are separated with a chromatographic column based on different partition coefficients with the detectability of hydrocarbons, halogenated hydrocarbons, alkyl nitrate, and BTEX (shortened form of benzene series). In HPLC, species are separated based on different partition coefficients between mobile and stationary phases under high pressure. HPLC is the preferred method for the measurement of aldehydes and ketones. The commonly used detectors include a mass spectrometer (MS), a flame ionization detector (FID), and an electron capture detector (ECD). Xue et al. (2020) analyzed NMHCs by GC-MS and carbonyl compounds by HPLC during a dust-to-haze episode in Xi’an, and finally concluded that dust might accelerate the solid-gas heterogeneous reactions of atmospheric VOCs and further induce the formation of secondary organic formation (SOA) precursors. Chen et al. (2020) quantified methane and C2−C10 NMHCs by GC separation followed by FID, MSD, and ECD in an oil production region in Northern China, and found that oil field emissions are dominated by alkanes while OVOCs play an essential role in the ROx primary production, OH loss, and radical recycling. According to the offline results, there are large fluctuations in day-to-day concentrations for most NMVOCs, thus a long-term and continuous analytical method is necessary (Uchiyama and Hasegawa, 2000). In the 1990s, online monitoring instrumentation without preprocessing began to commercialize and has been widely used in laboratory, board, and flight monitoring applications. This advancement provided the ability to quickly capture the low concentration of tracers. The common used online monitoring instruments are proton-transfer reaction mass spectrometry (PTR-MS) and the remolding of other basic online instrumentation, and the development and application methods of online instruments have been well-reviewed in previous studies (Kaser et al., 2013; Yuan et al., 2017; Dunne et al., 2018). Zhang et al. (2020a) measured NMHCs by GC-FID in Shanghai, and the results showed that the largest contribution to NMHCs are alkanes and the ratio of NMHCs to NOx should be no less than 0.72, to effectively control the increase of O3. Han et al. (2020) used an online system based on GC with a photoionization detector to conduct measurements of C6−C12 VOC species. Undoubtedly, the non-pretreatment is the largest advantage for field measurements. OVOCs are also the major source of the HOx radicals, which are known to strongly affect the atmosphere oxidative capacity (Seinfeld and Pandis, 2006), however, large uncertainties exist (of order 30%−50%) within the common measurements because of their strong dependence on relative humidity (Kaser et al., 2013). Because of this, optical instrumentation methods such as spectroscopy, including Fourier transform infrared spectroscopy (FTIR), and multi-axis differential optical absorption spectroscopy (MAX-DOAS) are widely used to analyze OVOCs. Based on an FTIR analysis, Yokelson et al. (2009) reported that there have been significant increases in HCHO, H2O2, HCOOH after biomass burning. Xing et al. (2020) measured formaldehyde and glyoxal by using MAX-DOAS to identify the sources of VOCs in wintertime in Chongqing and found that biogenic emission is the main VOCs source in the 0−100-m layer, while anthropogenic emissions (especially biomass burning) is the dominant source in the other upper layers. Above all, in recent years, online instruments are increasingly becoming popular in NMVOCs observations due to their advantages regarding high time resolution, instantaneous data availability, and non-pretreatment.
-
Figure 1a shows the spatial distribution of urban NMHCs in China based on an entire year of data. The mixing ratio of total NMHCs ranged from 24.32 ppbv to 43.16 ppbv, with the lowest values observed in the background cities, like Lhasa (Lhasa, 14.12 ppbv), and the highest concentrations observed in the northwest, northeast, and developed areas such as JJJ, YRD, and PRD. Among all the NMHCs, alkanes are the dominant species across the country. Also, concentrations of aromatic hydrocarbons are observed to be relatively higher in the developed areas. NMHCs are mainly derived from vehicle exhaust, industrial emissions, coal/fuel combustion, fuel volatilization, biomass burning, and solvent usage in urban areas (Zhang et al., 2013; Zheng et al., 2013; Wang et al., 2014). The higher NMHCs in the northwest and northeast regions of China are most likely caused by coal combustion for residential heating.
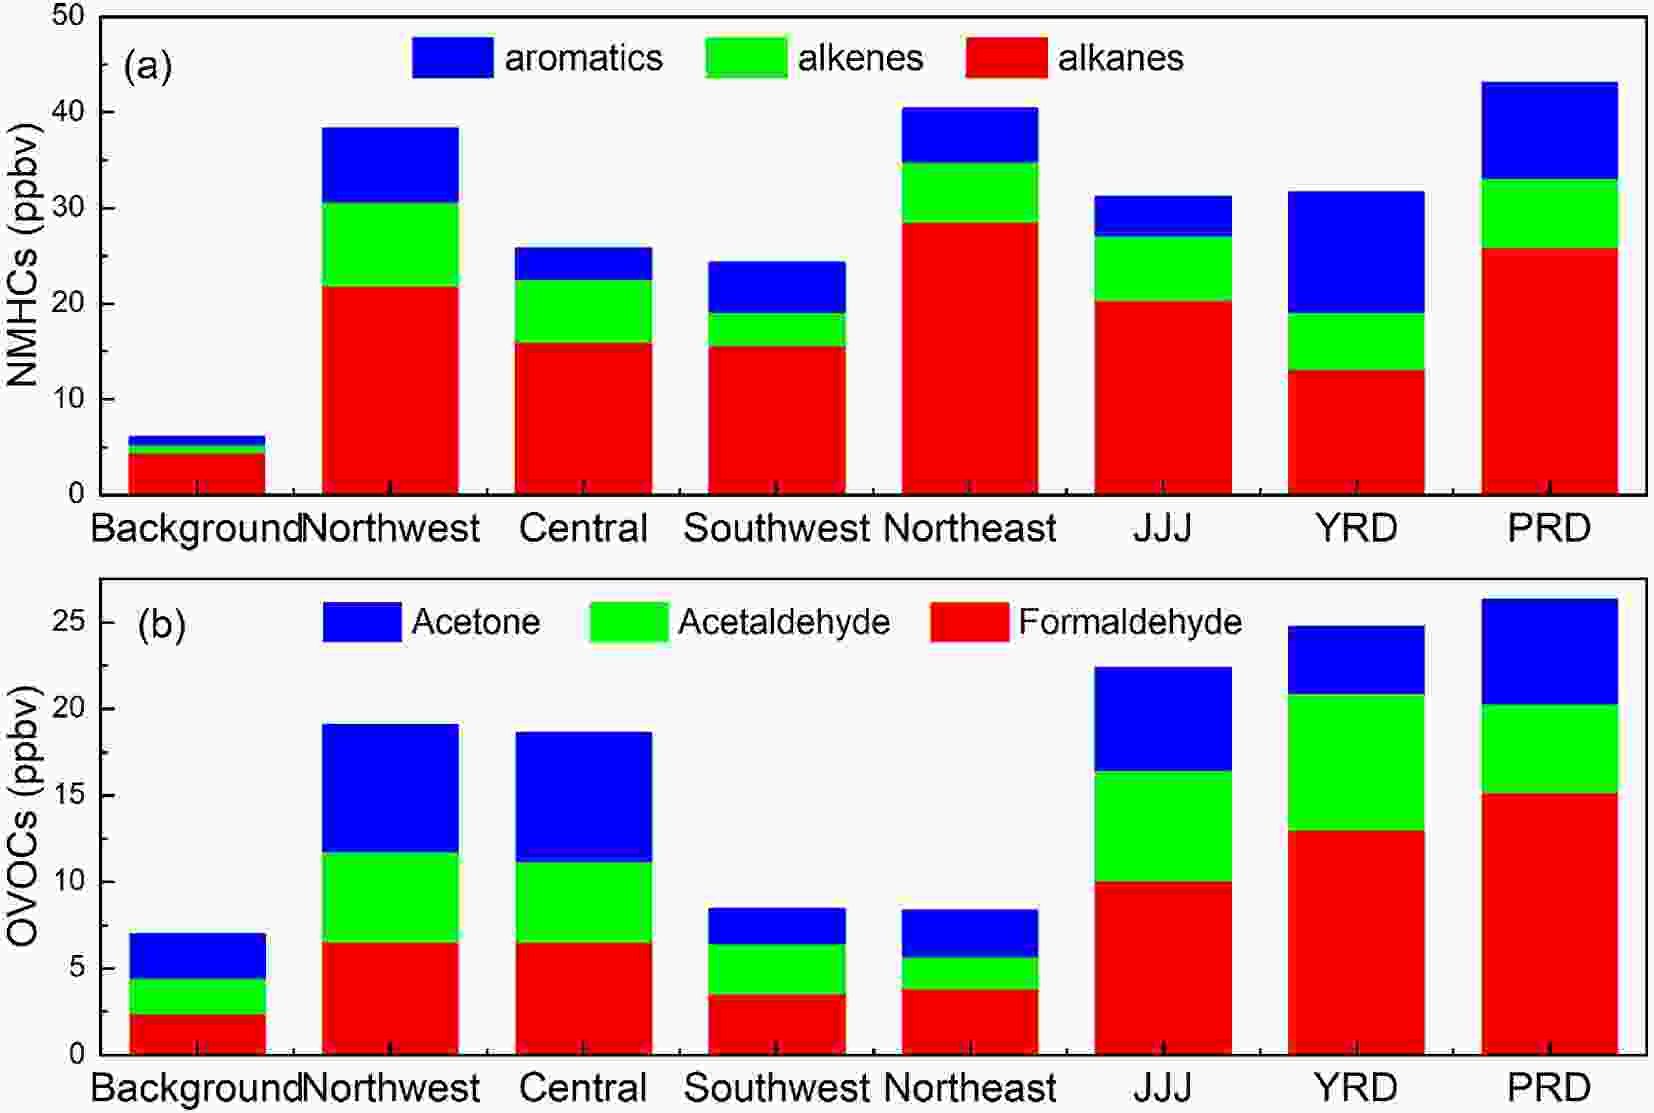
Figure 1. The spatial distribution of NMHCs and OVOCs in background regions of Lhasa (Zhang, 2016), and Dinghushan (Chi et al., 2008), northwest urban areas [Lanzhou (Jia et al., 2016), Xi’an (Ho et al., 2014)], central [Wuhan (Yang et al., 2019b)], southeast [Chongqing, Guiyang (Pang and Lee, 2010)], northeast [Shenyang (Ma et al., 2019)], and developed regions [Shanghai (Huang et al., 2008), Beijing (Pang and Mu, 2006; Sheng et al., 2018), Guangzhou (Zou et al., 2015)] (Except for the background points for comparison, the statistics all were based on whole year observations from the relevant references).
As shown in Fig. 1b, the annual mixing ratio of the total OVOCs in the urban areas of China ranged from 8.36 ppbv to 24.75 ppbv, which is about one to four times of that observed in urban downwind regions such as Dinghushan (6.99 ppbv), which is a background site of Guangzhou City. Being similar to that of NMHCs, the spatial distribution of OVOCs in China also showed higher concentrations in the developed metropolitan clusters such as JJJ, YRD, and PRD regions. Formaldehyde is the most abundant OVOC, followed by acetaldehyde in the three developed areas, while acetone is the largest species in northeastern and central China. OVOCs are primarily emitted from industry, traffic exhaust, solvent usage, coal combustion, and biogenic sources, with photochemical reactions acting as a secondary source (Chen et al., 2014). Lyu et al. (2020) performed a source apportionment of ambient formaldehyde and acetaldehyde in China, the results showed that secondary formation is the main source of formaldehyde in most cities of China. However, the sources of acetaldehyde are quite complex, of which the main sources are secondary formation in PRD and central China, the aged air masses in JJJ, and vehicle exhausts in northeast China. Recently, some new OVOCs such as formic acid and acetic acid have been measured by field observations due to the improvement of detection capability. According to previous studies, the concentration of formic acid is around 3 ppbv and the concentration of acetic acid ranges from 0.7 to 3.5 ppbv, in the autumn-winter period of China (Yuan et al., 2012; Louie et al., 2013; Ho et al., 2014; Sheng et al., 2018). A few studies reported that concentrations of OVOCs have exceeded that of aromatics and have become the second contributor to NMVOCs in some cities of China (Yuan et al., 2012; Deng et al., 2019; Mozaffar et al., 2020).
-
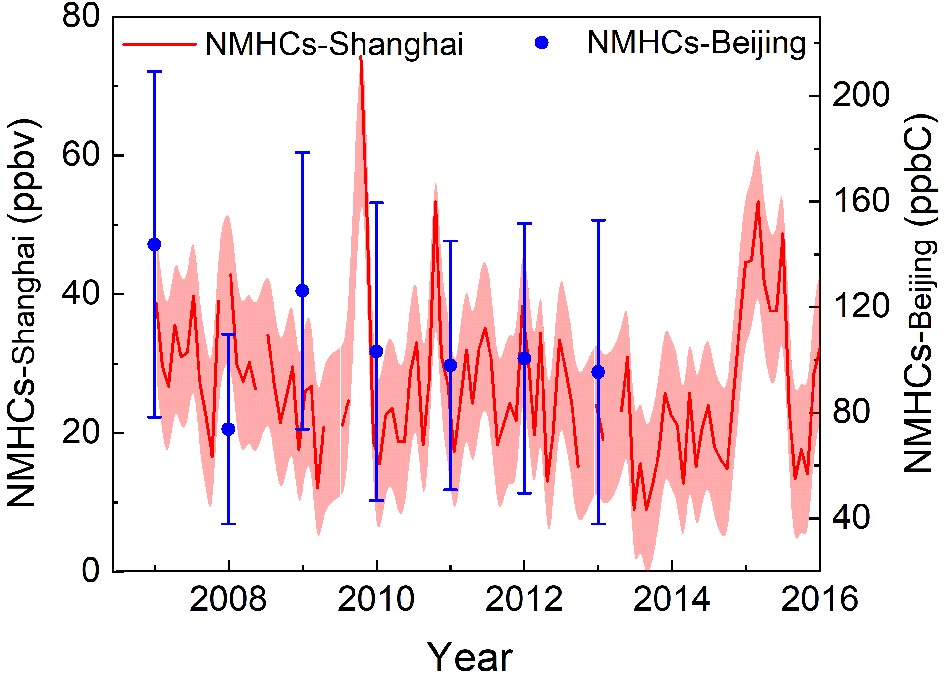
Figure 2 shows the annual variations of NMHCs after 2007, in urban Shanghai and Beijing. In Shanghai, the mixing ratio of NMHCs ranged from 8.91 to 74.27 ppbv from 2007 to 2015 and decreased by 26.1% in 2014 compared to that in 2007. Specifically, alkanes, alkenes, and aromatics all have decreased. In 2010, the average concentration of NMHCs in Shanghai was 26.45 ppbv, representing a decrease of 37.87% relative to May 2019 (Wang, 2020). Wang et al. reported that concentrations of NMHCs in Beijing increased at first due to the abrupt increase in the number of vehicles in 2000−03, and began to decrease in 2004 due to the implementation of policies concerning gasoline emission and air pollution controls (Wang et al., 2012). Wang et al. (2015) further found that the concentrations of NMHCs have continuously decreased, specifically noting a reduction of 37% in 2013 compared to that in 2007, as shown in Fig. 2. An abrupt decrease of NMHCs in 2018 in Beijing can be attributed to the 2008 Olympic Games, during which time, the Chinese government enacted very strict emission controls. A similar decreasing trend was also observed in other cities of China. For example, NMHCs exhibited a slight decrease during 2005−15 in Hong Kong (Wang et al., 2017b), and decreased by 28.8% during 2006−08 in Guangzhou (Yuan et al., 2012).

Figure 2. Annual variations of NMHCs in urban Shanghai (Gao et al., 2017; Xu et al., 2019) and Beijing (Wang et al., 2015).
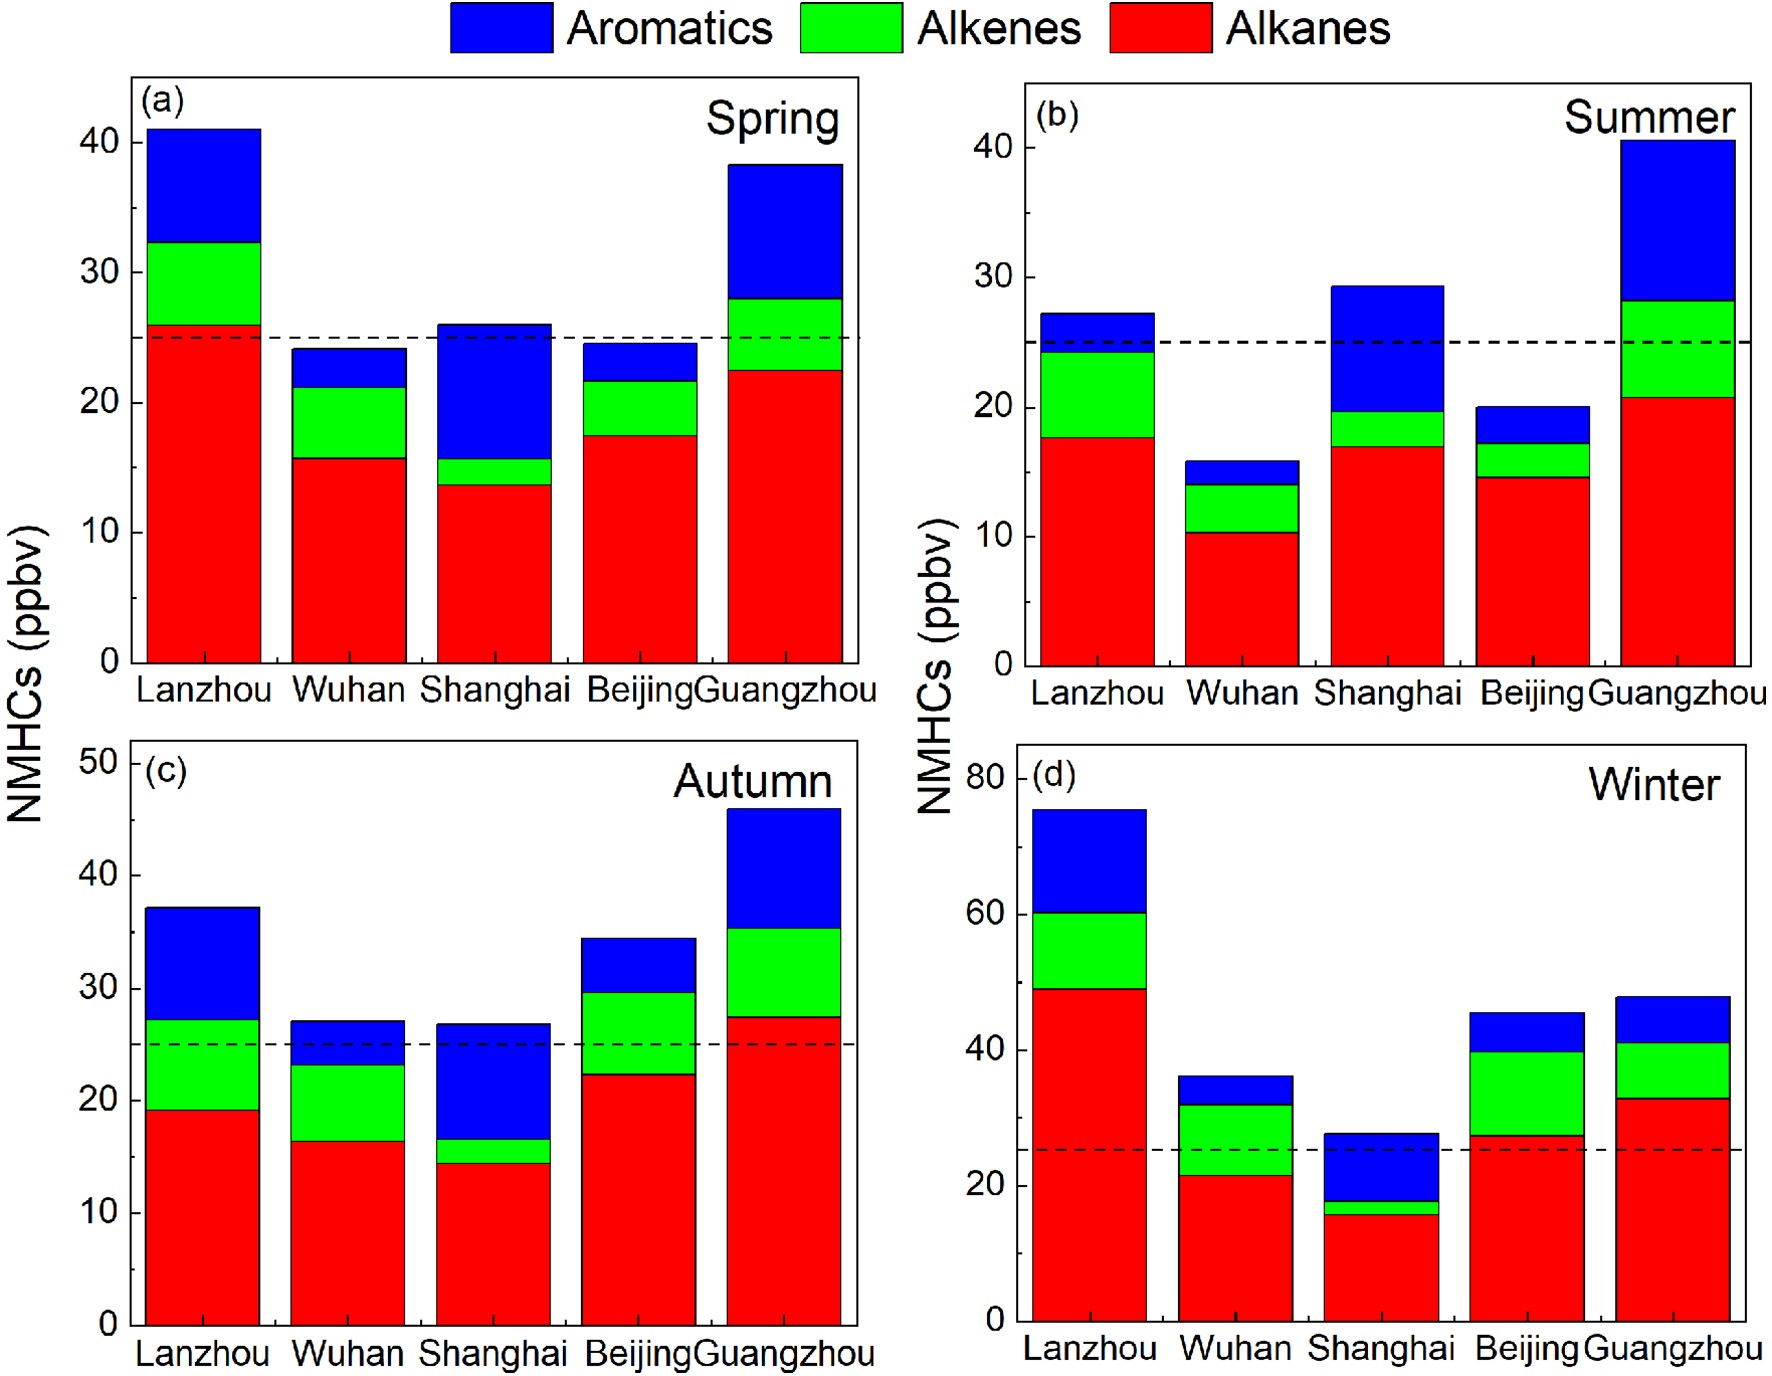
Figure 3 shows the seasonal variations of NMHCs in central (Wuhan)−western (Lanzhou or Xi’an) China and the developed regions (Beijing, Shanghai, Guangzhou). It can be seen that NMHCs concentrations are higher in winter and autumn and lower in spring and summer, with average mixing ratios of 26.48−75.43 ppbv in winter, 25.28−45.97 ppbv in autumn, 20.68−41.00 ppbv in spring, and 15.84−40.58 ppbv in summer, respectively. In all seasons, alkanes are the dominant species for all sites. The higher concentrations of NMHCs observed in winter and autumn might be caused by differential sources and meteorological factors (e.g., stagnant conditions and lower temperatures). As seen in Fig. 3, the seasonal variations in the southern part of China (20.60−26.48 ppbv in Shanghai and 38.25−47.84 ppbv in Guangzhou) are not as obvious as those in the northern part (41.00−75.43 ppbv in Lanzhou and 24.55−45.54 ppbv in Beijing). The higher concentrations of NMHCs in the northern cities during the cold seasons are believed to be a consequence of enhanced residential heating emissions.
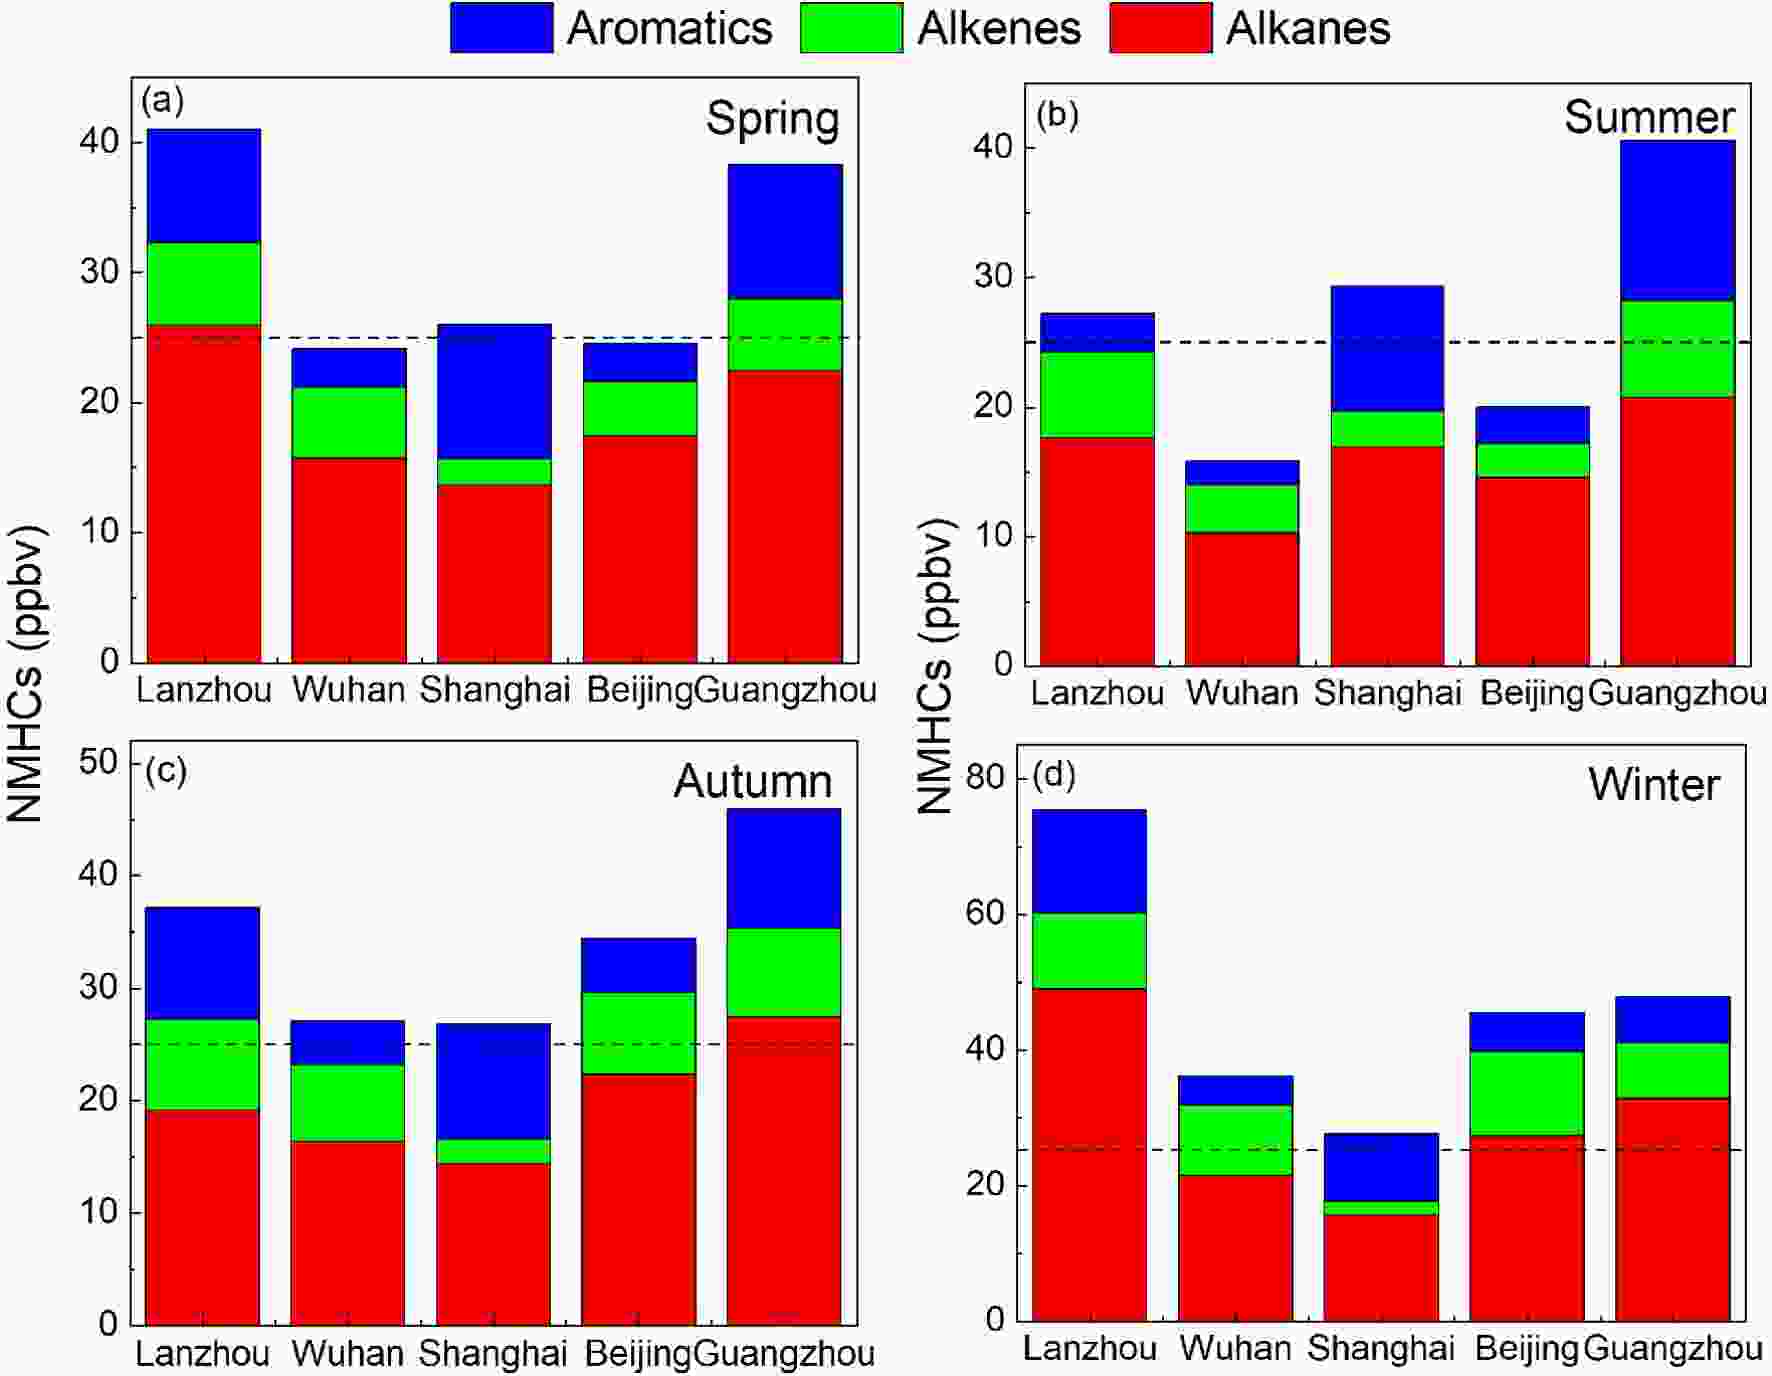
Figure 3. Seasonal variations of NMHCs in the urban atmosphere of Lanzhou (Jia, 2018), Wuhan (Yang et al., 2019a), Shanghai (Su, 2012), Beijing (Zhang et al., 2020b), Guangzhou (Zou et al., 2015). The dashed lines represent the total mixing ratio equal to 25 ppbv.
Figure 4 shows that the mixing ratios of OVOCs are highest in summer (13.30−42.00 ppbv) and lower in winter (10.22−18.57 ppbv) for the developed regions of China. Pang and Mu (2006) found that OVOCs correlated well with O3 in summer, but with CO in winter, indicating that the sources are dominated by photo-oxidation in summer as opposed to vehicular exhaust in winter. Liu et al. (2009) also reported that in Beijing, secondary formation (48%) is the largest source of acetaldehyde in summer. In western (Xi’an) and central (Wuhan) cities, slightly higher concentrations of OVOCs were observed in winter, although the mechanisms that might serve to explain the seasonal variation were not so obvious, with mixing ratios fluctuating around 10 ppbv. Such an insignificant seasonality indicated that the primary emissions of OVOCs in Xi’an and Wuhan may dominate over the secondary formation.

Figure 4. Seasonal variations of OVOCs in the urban atmospheres of Xi’an (Ho et al., 2014), Wuhan (Yang et al., 2019a), Shanghai (Huang et al., 2008), Beijing (Pang and Mu, 2006), and Guangzhou (Lü et al., 2010). The dashed lines represent the total mixing ratio equal to 10 ppbv.
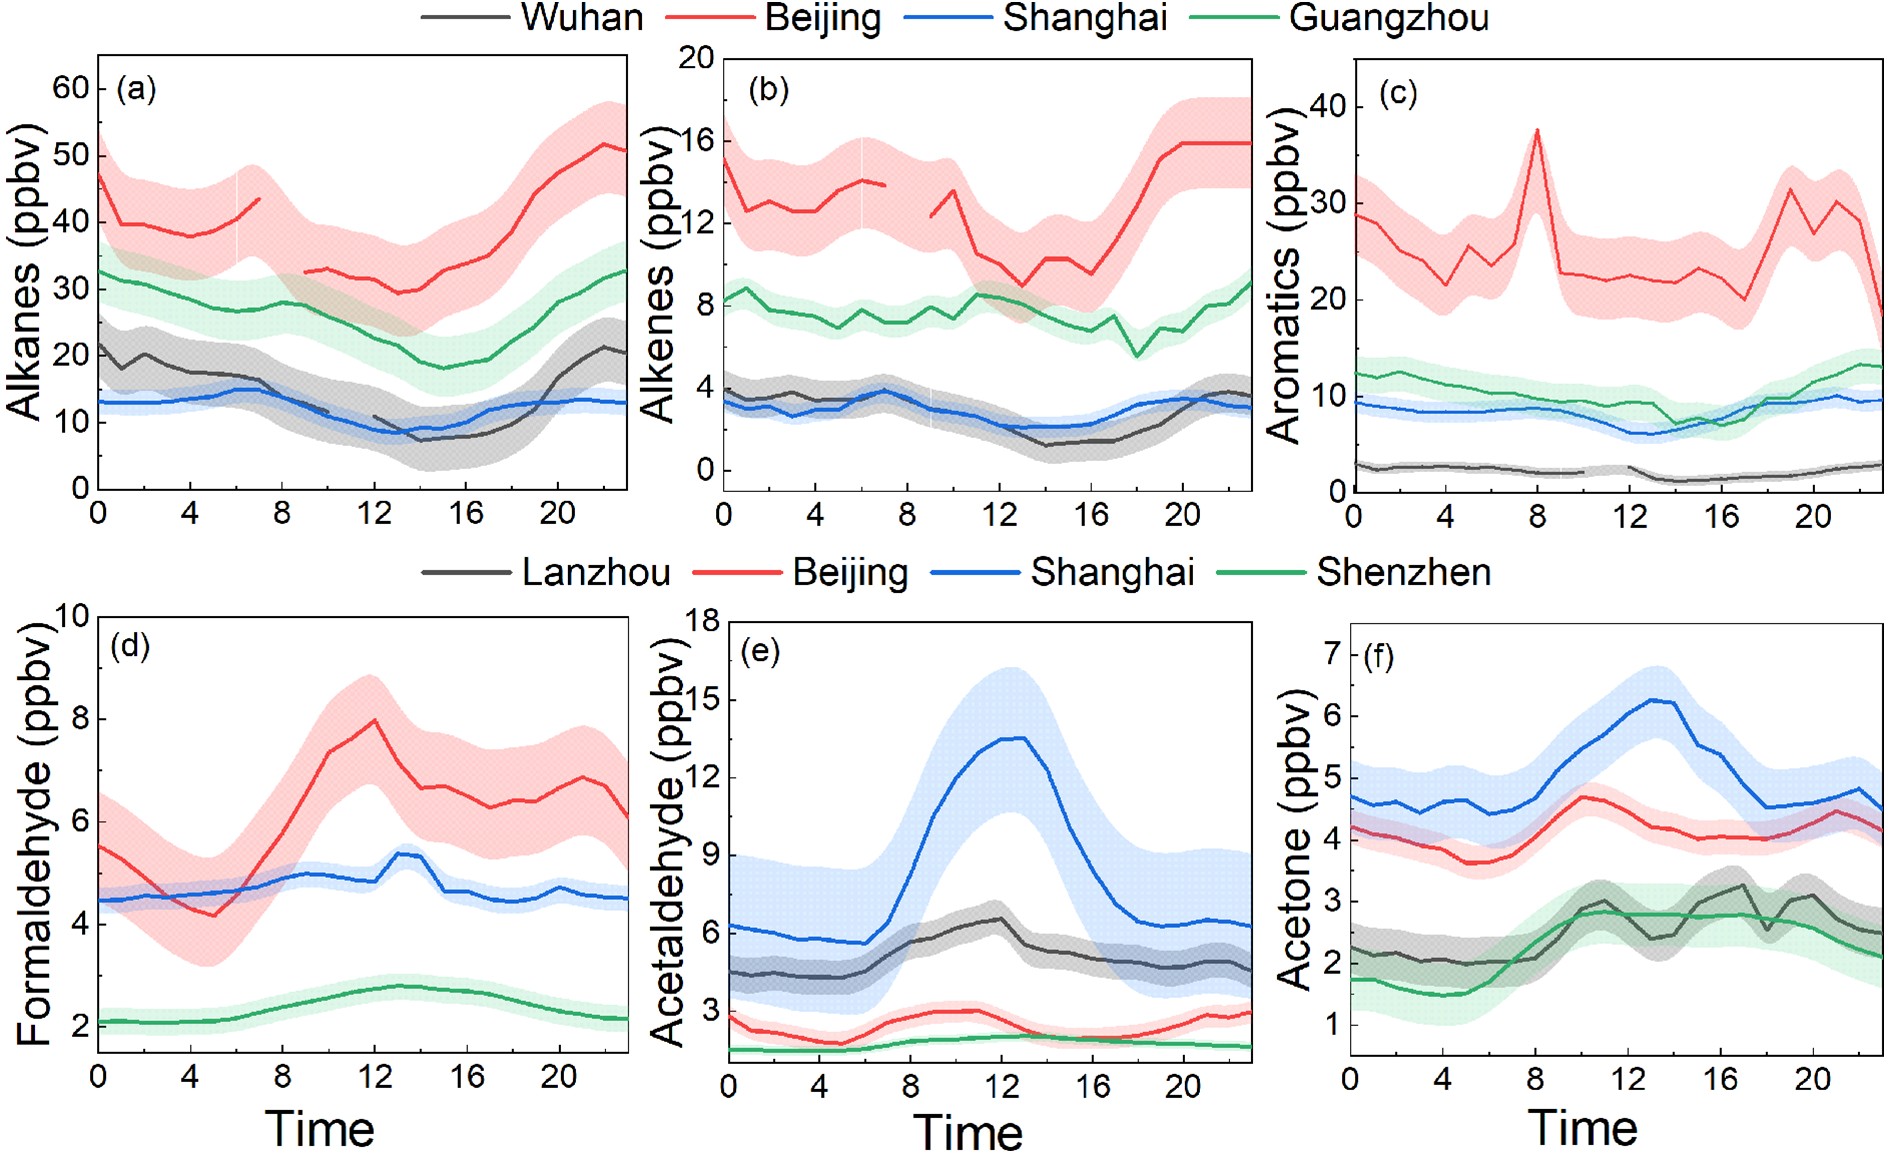
Figure 5 shows the diurnal variations of NMHCs (a−c) and OVOCs (d−e). It can be seen that alkanes, alkenes, and aromatics all showed higher mixing ratios in the morning and the afternoon, respectively. NMHCs react with OH radicals, Cl radicals, and O3 during daytime and with NO3 radicals during nighttime (Le Breton et al., 2018). The reaction rate with NO3 radicals is much lower than that with OH radicals, which is in part responsible for the lower concentrations of NMHCs observed during daytime (Xu et al., 2017). The higher concentrations in the morning are probably caused by an increase in vehicle exhaust emissions during the morning rush hours. As shown in Figs. 5d-e, the diurnal variations pattern of OVOCs is opposite to that of NMHCs, which shows higher concentrations during daytime with maxima around local noon, suggesting the importance of daytime secondary formation (Yuan et al., 2012). Additionally, some OVOCs also displayed a small peak in the evening, which is probably caused by the local primary emissions. Undoubtedly, some meteorological factors such as boundary layer height and wind speed also affect the diurnal variation patterns of NMVOCs.

Figure 5. Diurnal variations of alkanes (a), alkenes (b), and aromatics (c) in urban Wuhan (Hui et al., 2020), Shanghai (Su, 2012), Beijing (Zhang et al., 2020b), Guangzhou (Zou et al., 2015) and formaldehyde (d), acetaldehyde (e), and acetone (f) in Lanzhou (Zhou et al., 2019), Beijing (Liu et al., 2015b), Shanghai (unpublished data from this study), and Shenzhen (Huang et al., 2020).
3.1. Spatial distribution
3.2. Temporal variations
-
Theoretically, VOCs can react with NOx in the presence of solar radiation (be represented by “hv”), ultimately producing ozone and other oxidants (collectively referred as “M”) such as aldehyde, peroxyacetylnitrate (PAN), H2O2, etc. (Liu et al., 1987; Warneke et al., 1999; Tang et al., 2006).
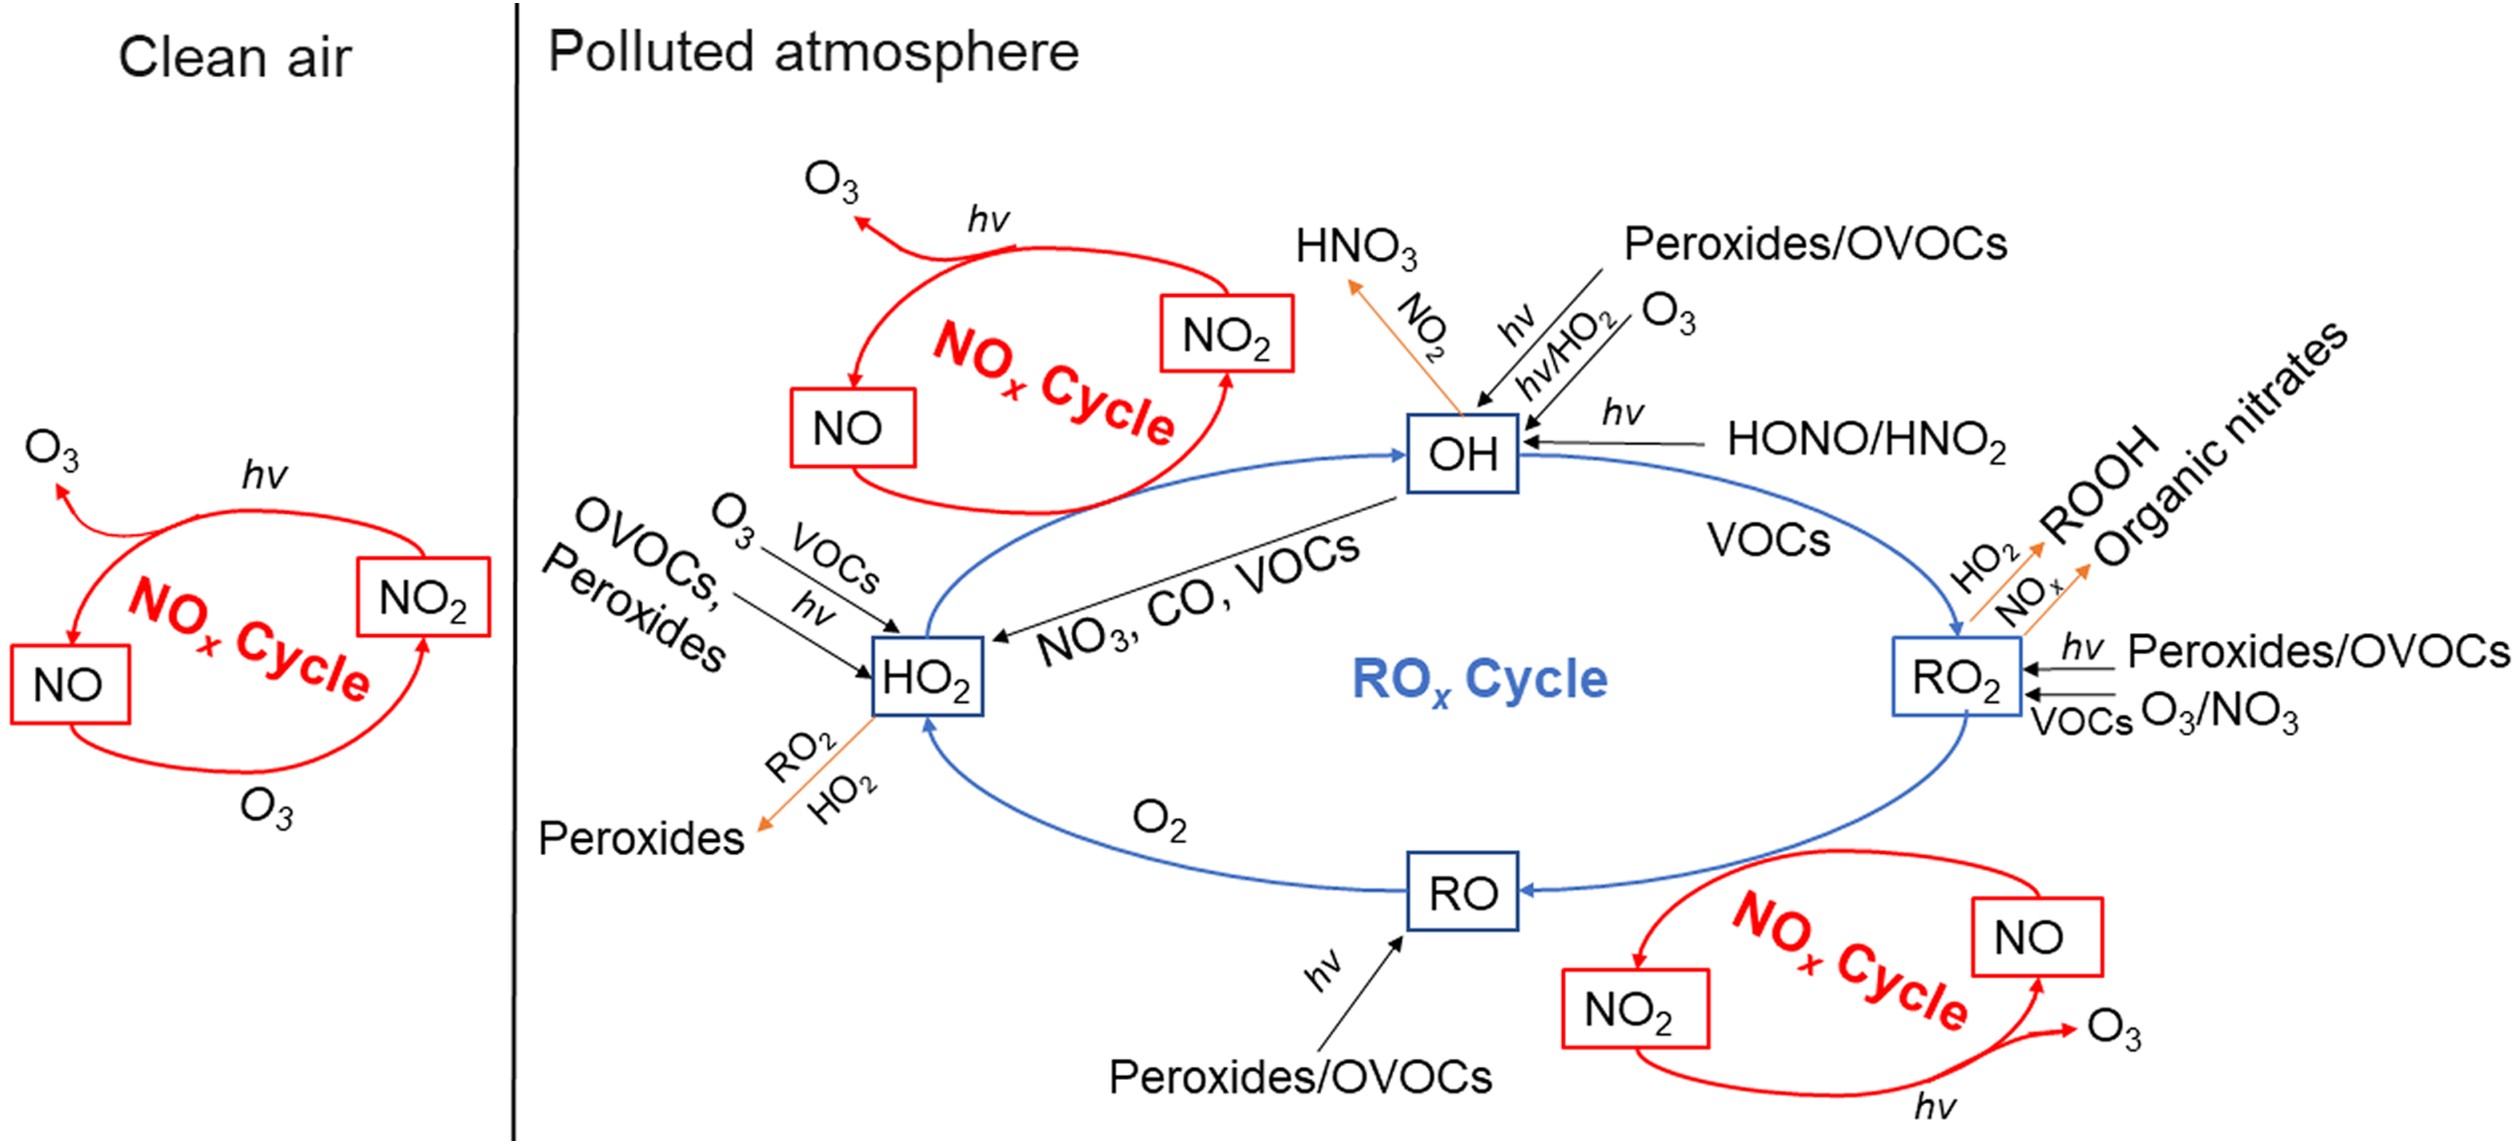
The process of atmospheric photochemical reactions is very complex, which can be roughly classified into four stages, i.e., initiation reaction, radical formation, radical chain transfer, or termination reaction (Wang et al., 2017a; Jia, 2018). They can be further categorized into the “NOx cycle” and “ROx cycle”, as shown in Fig. 6. The photochemical reactions within the NOx cycle, differ for two background situations, i.e., clean and polluted conditions. In clean air, O(3P) (oxygen atoms) can be produced through the photolysis of NO2 by wavelengths under 424 nm, which then proceed to react further with O2 to produce O3. Once O3 is formed, it can oxidize NO to NO2 [Eq. (2) −Eq. (4)]. However, this cycle quickly reaches a photochemical stable state, and thus there is no net formation of O3 and no accumulation in the atmosphere. In polluted air, many radicals exist, like OH and HO2, which are products of the photochemical reactions of VOCs. After a series of OH radical transfer reactions, many peroxy-radicals are generated such as HO2 and RO2. These peroxy-radicals can suppress and replace O3 oxidation of NO [Eq. (5)−Eq. (6)] due to their stronger oxidizing capacity, the generated NO2 can further participate in the “NOx cycle” [Eq. (2)−Eq. (4)], resulting in the accumulation of O3 in the polluted atmosphere.

Figure 6. A schematic plot for the mechanism of ozone formation in “NOx cycle” and “ROx cycle” (the red lines represent initiation reactions, the black lines represent radical formation reactions, the blue lines represent radical transfer reactions, and the yellow lines represent termination reactions).
The “ROx cycle”, is usually started by the formation of OH, and then forms a radical cycle as “OH→RO2→RO→HO2→OH” as illustrated in Fig. 6. The sources of OH are mainly dependent on the photolysis of HONO, O3, and the reactions of O3 with alkenes (Volkamer et al., 2010; Young et al., 2012). These different sources produce OH radicals at different times during the day. In the early morning (0600−0900 LST) (local standard time, hereafter), photolysis of HONO is the dominant source of OH radicals (Wang et al., 2016a; Ge et al., 2019), but a few hours later the photolysis of O3 becomes the dominant source and peaks at midday. The reaction of O3 with alkenes is a gas-phase non-photolytic source of OH that takes place during the entire day and also peaks at midday, like photolysis of O3. Additionally, the reaction of O3 with alkenes represents another important source of OH radicals in the early morning, under lower O3 and higher alkene conditions. Among the different OH sources, HONO photolysis production is the fastest (Hang et al., 2008). Except for the sources from the radical transfer reactions in the ROx cycle, the photolysis of HCHO and secondary OVOCs are also primary sources of daytime HO2 radicals, while the reactions of O3 with alkenes are the main sources in the nighttime (Shirley et al., 2006), further noting that the daytime photolysis of formaldehyde accounts for more than half of the HO2 radicals.
RO2 is mainly derived from the photolysis of OVOCs, the reactions of O3 with alkenes, the reactions of NO3 with alkenes, CO and VOCs, and OH-radical initiated oxidations of aromatics (Xue et al., 2016). The diurnal variation of RO2 radical production is similar to that of HO2 radical. In each ROx cycle, two molecules of NO are oxidized to NO2, which then goes on to generate two molecules of O3, eventually leading to the accumulation of O3. The NOx cycle and ROx cycle begin to terminate when the free radicals accumulate and achieve higher concentrations through the cross-reactions of ROx and the reactions between ROx and NOx (Whalley et al., 2009). In the areas with high NOx concentrations, the cycles are terminated by the reactions of NO2 with OH and RO2, with the terminal products being nitric acid and organic nitrates. While in the areas with low NOx, the termination reactions are dominated by the self-reactions of HO2 and the cross-reactions of HO2 and RO2, ultimately yielding peroxides (H2O2 and ROOH).
Due to the complexity of photochemical reactions and diversity of VOC species, the complete details which explain the O3 formation mechanism and probable sources of ROx are still under exploration. It was reported that ClNO2 can affect O3 formation through the reactions [Eq. (7)−Eq. (9)] by the formation of RO2 (Thornton et al., 2010; Riedel et al., 2014). Recent studies showed that ClNO2 levels ranged from 0.35 to 4.7 ppbv in the atmosphere, which can contribute to 10%−30% of ROx in the morning and enhance the integrated daytime O3 production by up to 11%−41% at a mountain site in Hong Kong and to 4.3 ppbv on average in the rural of North China Plain (Tham et al., 2016; Wang et al., 2016b). Young et al. (2012) found that radical production from HONO mainly occurs in the period of 0600−0900 LST and decreases at higher planetary boundary layer (PBL) heights, while the radicals produced from ClNO2 mainly occur in the time of 0600−1200 LST with no significant dependence on the PBL height. Their contributions to OH are comparable near the ground surface, but the fraction of ClNO2 contributing to OH radicals is higher at higher PBL heights. However, due to the inherent complexity, which species and processes dominate the nighttime OH radical production and whether or not O3 or NO3 affect or control its formation are still under exploration (Volkamer et al., 2010).
-
As the differences in structures, concentrations, and chemical reaction rates present themselves, the chemical activities of different VOC species change, resulting in differing contributions to O3 production. As discussed above, VOCs play a key and complex role in the O3 formation process, hence it is essential to find out which species are the key components that affect the atmospheric oxidizing capacity. In general, the photochemical reaction activity order of NMVOC is as follows: inner double alkene > alkyl or trialkyl aromatic hydrocarbon and outer double alkene > ethene > monoalkyl aromatic hydrocarbon > C5 and C8 alkanes > C2−C5 alkane (Tang et al., 2006). The most common recognition methods are ozone formation potential (OFP) and OH consumption rate (LOH) (Duan et al., 2008). Studies about OFP and LOH showed that alkenes, aromatic hydrocarbons, and OVOCs are key reactive species, although there are some slight differences in different areas, seasons, and pollution events (Li and Wang, 2012; An et al., 2015; Zhu et al., 2020). For example, in Shenyang, a megacity in northeast China, the top three contributors to OFP are aromatics (31.2%), alkenes (25.7%), and OVOCs (25.6%) (Ma et al., 2019). In contrast, OVOCs in Guangzhou city, south China are the largest contributors of OFP (34.0%−50.8%) (Yuan et al., 2012), while alkenes (48.34%) are the main contributors in Wuhan, central China (Hui et al., 2020).
The top ten reactive species in China are m/p-xylene, ethylene, formaldehyde, toluene, propene, acetaldehyde, o-xylene, styrene, 1,3-butadiene, and 1,2,4-trimethylbenzene (Wu and Xie, 2017). As shown in Fig. 7, their contributions to the total OFP are different in different areas (Duan et al., 2008; Deng et al., 2019; Fu et al., 2020; Zhao et al., 2020; Zhou et al., 2020; Zhu et al., 2020). Contributions of the top eight NMVOCs to OFP account for 51%−69% of the total, among which OVOCs, especially formaldehyde and acetaldehyde, contribute more to OFP in megacities. The main areas in China with high OFP, expand regionally from Jiangsu Province to four regions including the North China Plain, YRD, PRD, and the Sichuan Basin due to the rapid growth of the economy and the fast expansion of urbanization (Li et al., 2019b). Figure 8 shows the seasonal variations of OFP produced by NMHCs and OVOCs. As seen in Fig. 8, the seasonal variations are different with the highest OFP-NMHCs appearing in winter and the highest OFP-OVOCs occurring in summer. The OFPs in China are higher in developed regions than that in the northwestern and central areas, and these two categories contribute almost equally to the total OFP. Except for the primary emissions, the highest OFP-OVOCs in summer are mainly attributed to photochemical reactions, and the highest OFP-NMHCs in winter can be attributed to both unfavorable meteorological conditions and enhanced residential heating emissions. Only a few studies have focused on the diurnal variations of LOH, which tend to show that LOH achieves the highest values in the morning and the lowest values around noon and that short-chain alkenes are dominant for morning LOH while long alkenes dominate the noon LOH, however, the diurnal variation of LOH produced by OVOCs is not obvious (Xu et al., 2017).
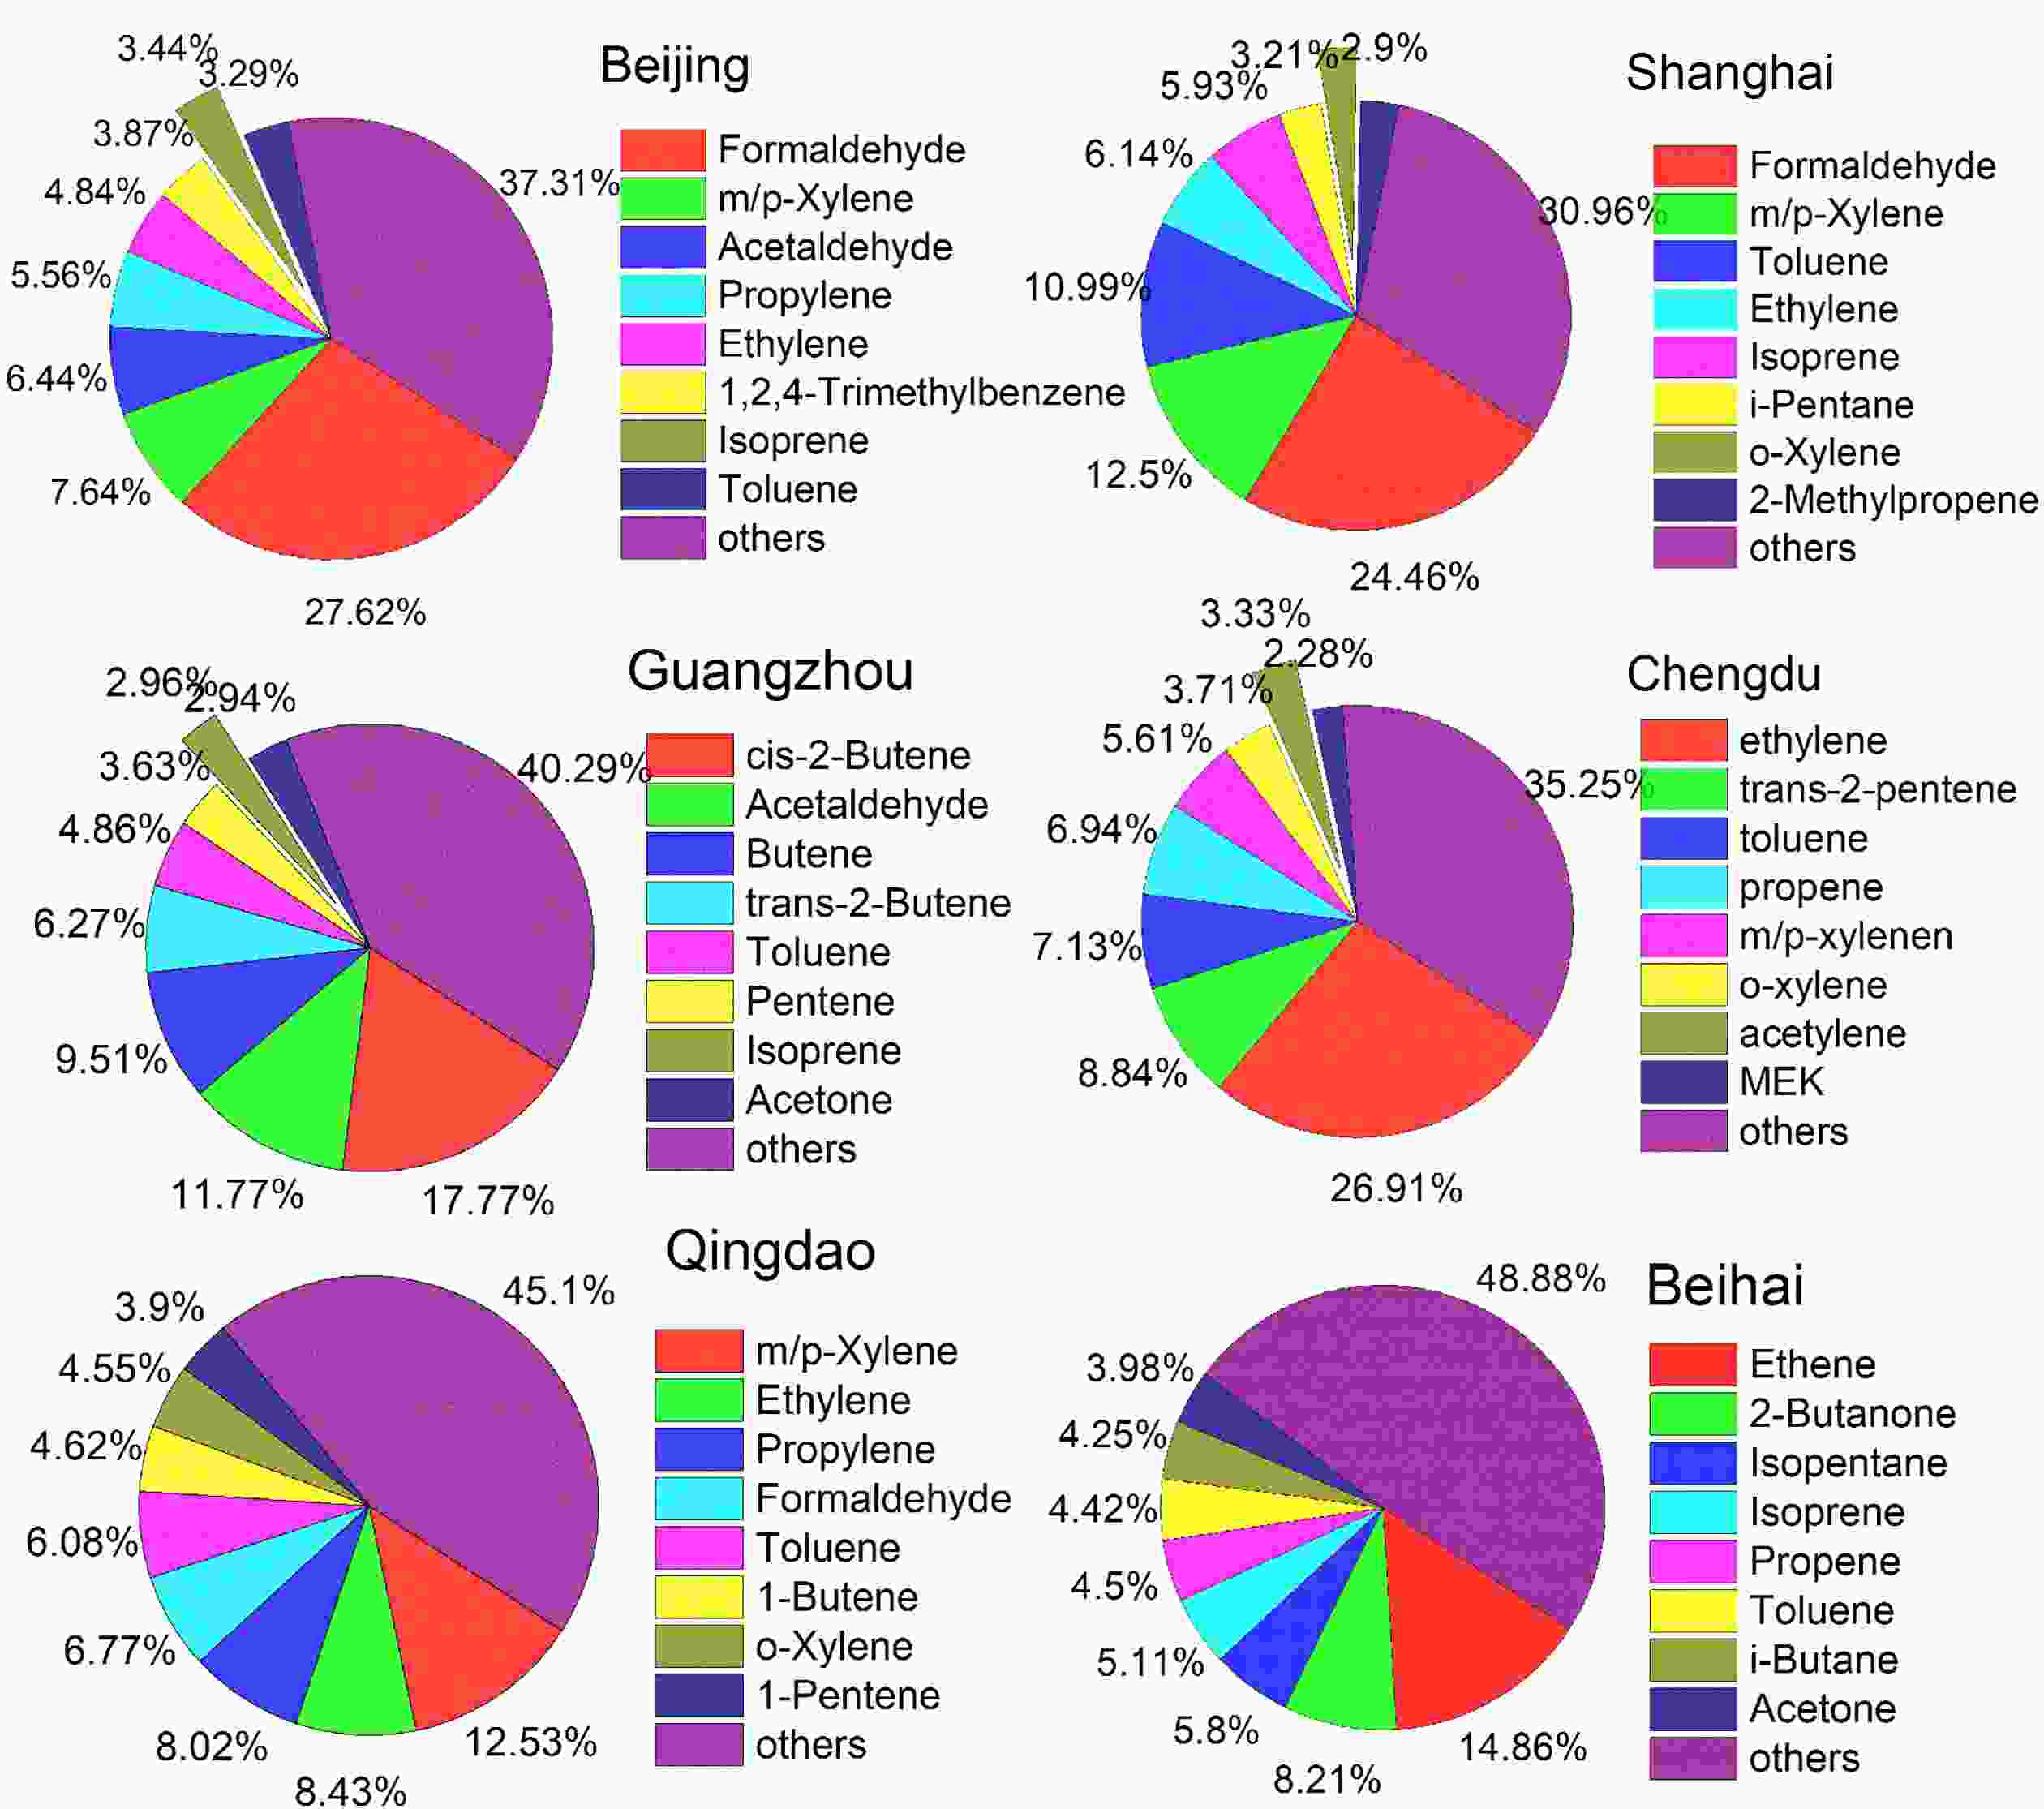
Figure 7. The contributions of the top eight NMVOCs to OFP in different cities of China.
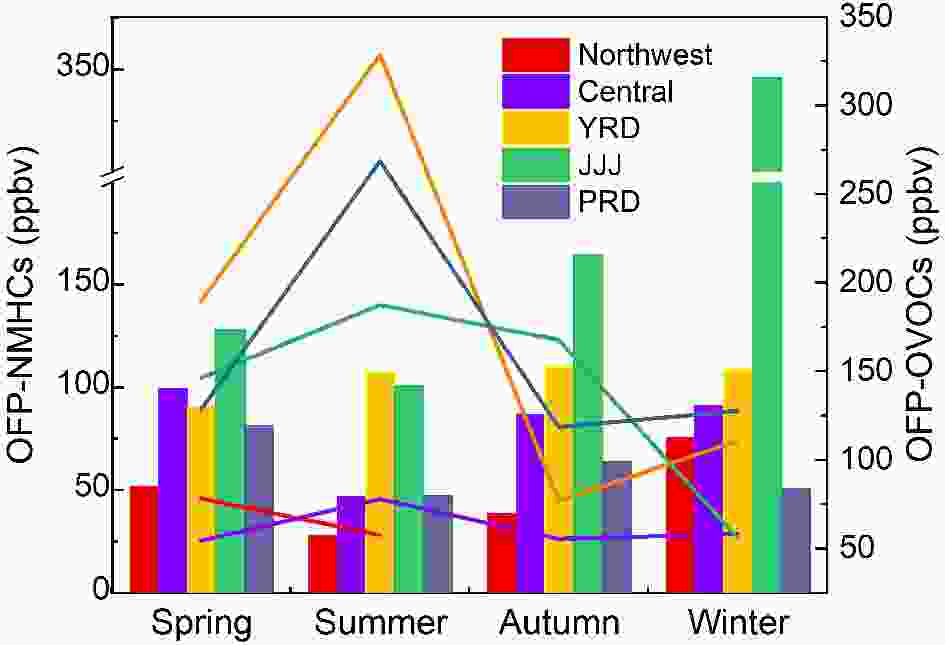
Figure 8. Seasonal variations of OFP-NMHCs (bar graph) and OFP-OVOCs (line chart) in different cities of China (The data given here are recalculated from the references cited in section 3.2).
4.1. Roles in the photochemical reactions
4.2. Key photochemical activity
-
The main methods to determine the sources of pollutants are emission analysis, trend analysis, tracer studies, trajectory analysis, receptor models, and diffusion models (Blanchard, 2003). Currently, the most commonly used methods to determine the sources of NMVOCs fall into two main categories: (1) receptor models which are supplemented with the use of tracer methods, of which the most widely used receptor models are the chemical mass balance method (CMB), principal component analysis (PCA) and positive matrix factorization (PMF); (2) emission and trend analysis.
-
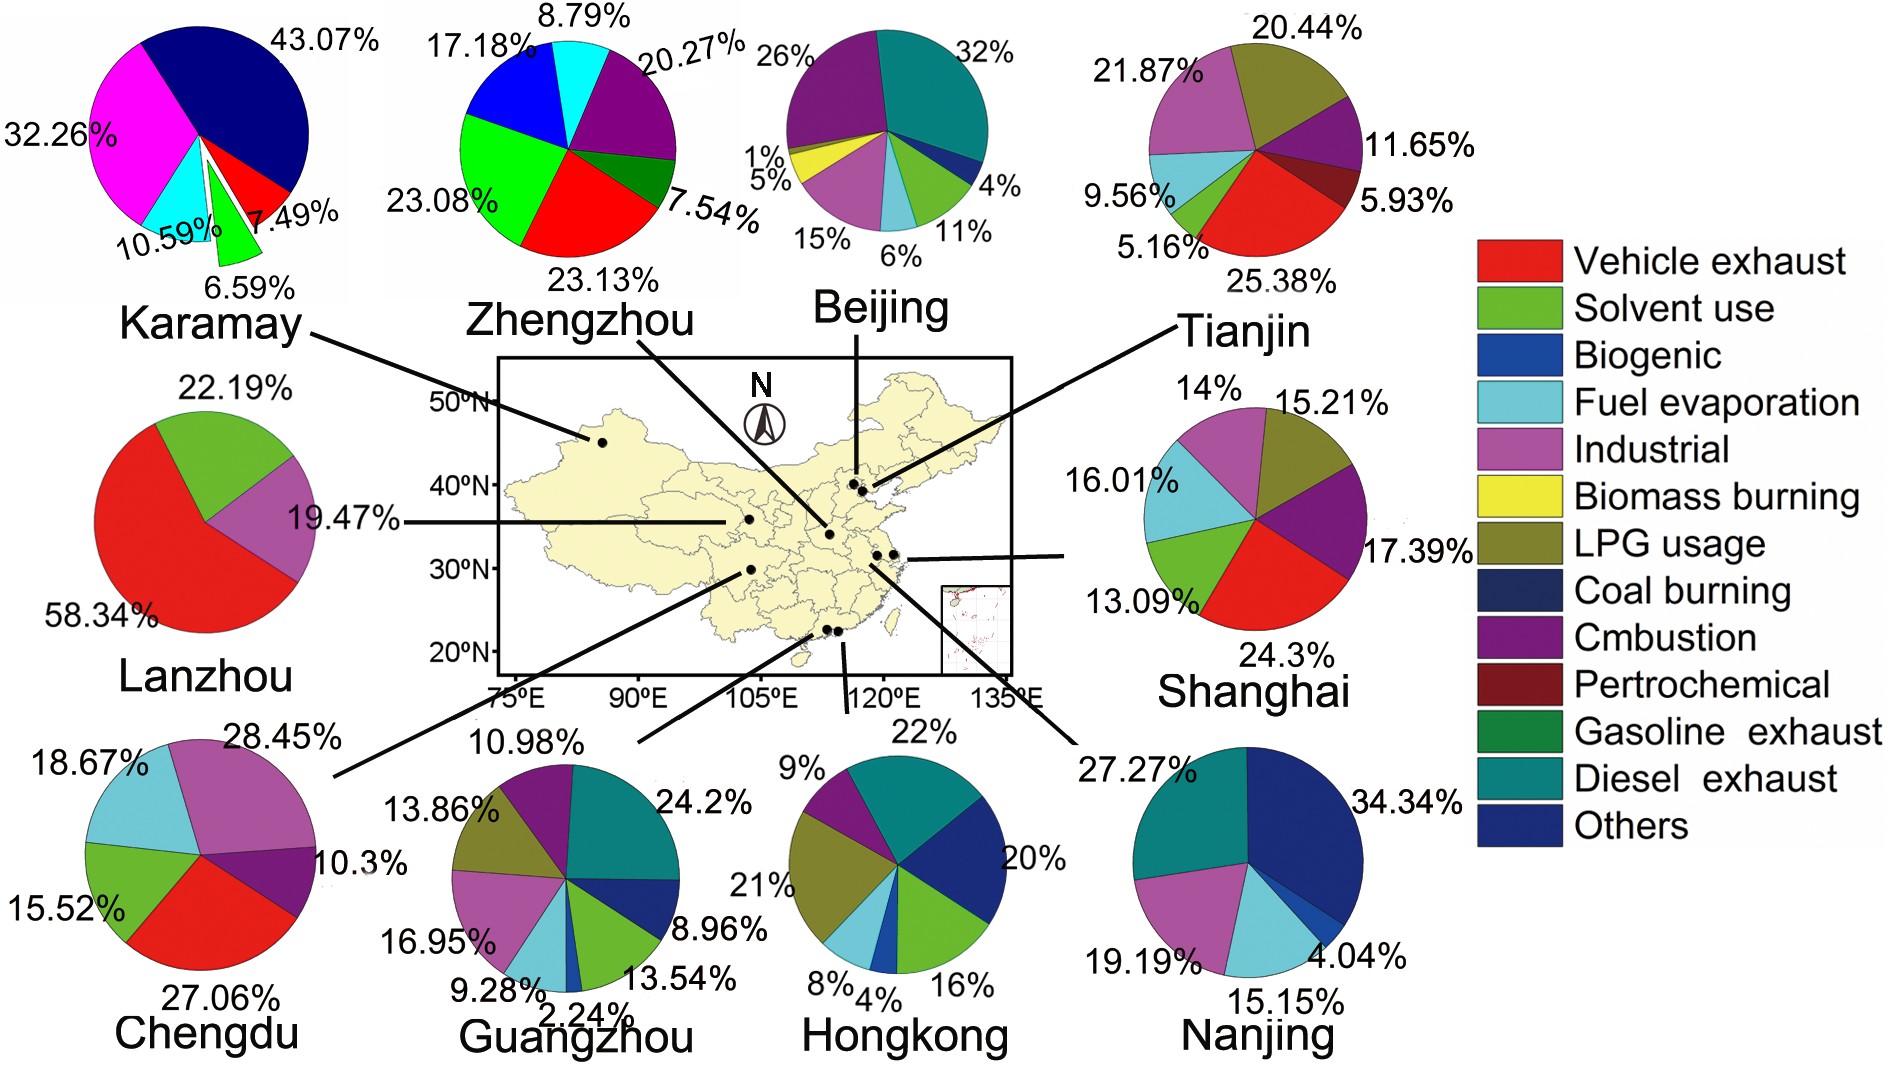
Figure 9 shows the source appointment of NMHCs based on PMF analysis. Six sources including vehicle exhaust, solvent usage, industrial emissions, fuel evaporation, liquefied petroleum gas (LPG) usage, and combustion are found to be the major sources of NMHCs in China. However, the relative contributions from each source within the various regions differ. In the Karamay of Xinjiang, coal combustion is the biggest contributor to the local NMHCs, followed by industrial emissions and oil volatilization (Zhang et al., 2019). In the developed cities (Beijing, Guangzhou, and Hong Kong), vehicle exhaust is the largest source, further noting that the contribution from gasoline exhaust is much more significant than that from diesel exhaust. In Beijing and Tianjin industrial emission is the second largest contributor of NMHCs, while in Shanghai and Nanjing, two megacities of the YRD, vehicle exhaust, industrial emissions, and fuel evaporation are the three major sources for NMHCs. In the PRD cities like Guangzhou and Hong Kong, LPG usage and solvent usage are the two main contributors to NMHCs, exceeded only by vehicle exhaust. For the megacities in Sichuan Basin such as Chengdu, vehicle exhaust, industrial emissions, fuel evaporation, and solvent usage all contribute significantly to NMHCs. In Hong Kong, Guo et al. (2006) found that 43% of NMHCs in the local atmosphere were derived from industrial emissions with an additional 39% of NMHCs transported in from the neighboring PRD region. Sources of NMHCs exhibit significant differences not only spatially, but also temporally. For example, Wu et al. (2016b) reported that in the city limits of Beijing, the wintertime of gasoline exhaust increased by 1.4 times in a haze event compared with what was observed during a non-haze period. In Dushanzi, a district of Xinjiang, during a non-heating period, coal combustion contributed 25.3% to NMHCs, but increased to 43.3% during a heating period in cold season, while the contribution of oil volatilization dramatically increased during a sandstorm event (Zhang et al., 2019).
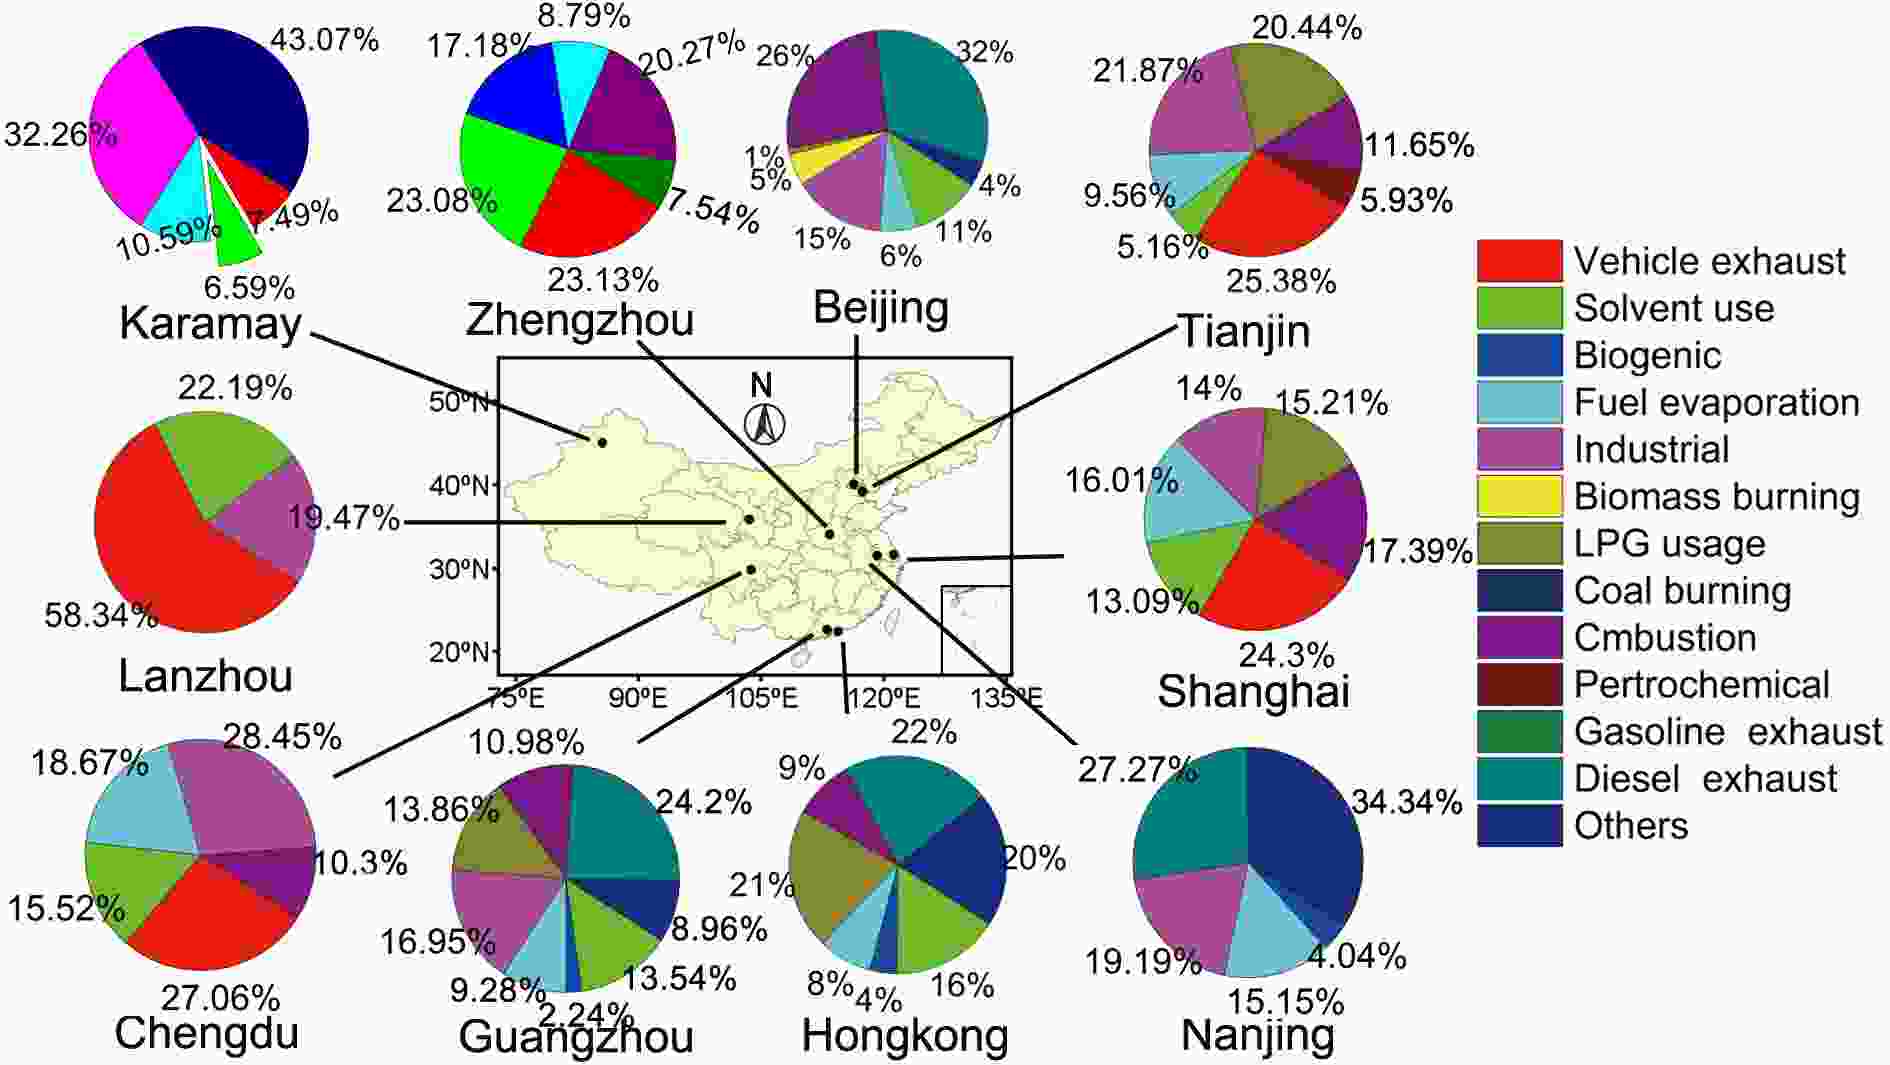
Figure 9. Atmospheric NMHCs sources in the urban atmosphere of China. The data obtained from the following references (Cai et al., 2010; Yuan et al., 2013; Ling and Guo, 2014; Li et al., 2015; Jia et al., 2016; Liu et al., 2016; Wu et al., 2016b; He, 2018; Li et al., 2019a; Zhang et al., 2019).
Table 1 lists the sources of OVOCs based on a parameterization method. It can be seen that secondary formation and biogenic emission are the two largest sources for formaldehyde, acetaldehyde, and acetone in both Beijing and Shenzhen during summer, however, acetone have a high regional background level (Yuan et al., 2013; Huang et al., 2020). Secondary formation is important for formic acid and acetic acid in Changdao Island during spring, even though primary emission is the largest source for acetic acid (Yuan et al., 2013). A source appointment study on carbonyl carried out by Chen et al. based on PMF analysis (Chen et al., 2014) showed that secondary formation, traffic-related emissions, industry emissions, solvent usage, and coal burning are the main sources of OVOCs in winter. However, in summer the main sources of OVOCs are secondary formation, traffic-related emissions, industry emissions, solvent usage, and biogenic sources. Notably, the source of secondary formation contributes to nearly half to all OVOCs in both summer and winter.
OVOCs
speciesPrimary
emission (%)Secondary
formation (%)Biogenic (%) Background (%) References Beijing (Huang et al., 2020) Formaldehyde 22 28 36 15 Acetaldehyde 16 48 13 22 Acetone 30 9 18 43 Shenzhen (Huang et al., 2020) Formaldehyde 13 20 52 15 Acetaldehyde 10 35 47 8 Acetone 14 20 30 36 Changdao Island (Yuan et al., 2013) Formic acid 17.2 31.3 — 51.5 Acetic acid 57.3 42.7 — 0 Table 1. The source appointment of OVOCs
-
With the rapid growth of the economy in China in the past decades, anthropogenic NMVOCs emissions have continuously been increasing. Wu et al. (2016a) reported that the TVOCs (total VOC) emissions in China had increased by 7.38% per year over 2008−12. Sun et al. (2018b) further reported that the annual growth rate of NMVOCs in China was 4.6% from 1949−2015, while Li et al. (2019c) found that the anthropogenic NMVOCs emissions increased by 65.8% over 1990−2017. Since 2013, Shandong, Jiangsu, and Guangdong Provinces have evolved into the three major regions that are making higher contributions to the total NMVOCs emissions in China, and have been classified as the worst- affected areas of NMVOCs pollution (Bo et al., 2008; Wei et al., 2008; Zheng et al., 2017). Although the total amount of NMVOCs emissions in China during 1990−2017 had continuously increased, the growth rate has significantly decreased after the implementation of strict reduction measures in 2015.
The NMVOCs emission source inventory generally includes residential, transportation, industry, solvent use, and power plants. For each specific source, there exist some differences in patterns related to the emissions. The emissions and growth rates of residential NMVOCs have been decreasing (Li et al., 2019c), which mainly due to the energy type conversion in households (Du et al., 2018). Transportation mainly includes road gasoline and both road and non-road diesel. The growth rate of transportation shows a sharp increase from 1990 to 2008 followed by a gradual decrease (Li et al., 2019c). The increase in transportation emissions is mainly caused by the increase in the number of cars around 2008, while the latter decrease is mainly attributed to the implementation of stricter emissions standards for new vehicles and specific control measures for in-use vehicles. However, studies also found that vehicle exhaust was the top source for O3 formation potential with a contribution of about 34.5% in cities such as Shenyang and Nanjing (Ma et al., 2019; Zhao et al., 2020). The strict controls on vehicle emissions should be process continuously through the PMF and the resulting emission trends suggest that their contributions have decreased in China. The main sources of solvent usage are pesticides and paint, in both industrial and architectural applications (Zheng et al., 2017), of which emissions have been increasing sharply, and may ultimately turn into the main source of NMVOCs in China in near future, especially in the developed regions with more industrial production. For example, Wang et al. (2014) found that solvent usage showed a significant increasing trend with a rate of 23.7% yr−1 in Beijing. Processes using VOC-containing products are the main sources in industrial sections in China due to the rapid growth of industries and less effective emissions control measures; the amount of emissions related to industry presented an upward increasing trend in all reported inventories in China (Kurokawa et al., 2013; Wang et al., 2015; Li et al., 2017; Simayi et al., 2019). Zheng et al. (2017) predicted the future emissions of industrial sources in China under different scenarios and found that although the current increases are smaller than that of solvent usage, industrial emissions will significantly increase in 2020−50 in the absence of different policy implementations. The simulation results carried out by Sun et al. (2018b) further showed that industrial processes and solvent utilization are still the major contributors in 2020 and a reactivity-based control strategy should be taken to reduce NMVOCs emissions and their OFP.
Because of the inherent differences and limitations of receptor models and emission inventories, the source contribution results are not consistent, especially for solvent usage, LPG usage, and biogenic sources (Watson et al., 2001; Morino et al., 2011; Wang et al., 2014; Ou et al., 2018). According to our review, there are some gaps in current source emission inventories and receptor models that can be summarized as follows. First, uniform standards are lacking concerning the classification of VOC sources in the current emission inventory establishment, and some source profiles are replaced by the US EPA database, which may not exactly reflect the characteristics of VOCs in China (Liu et al., 2015a; Liang et al., 2017). Secondly, emission inventories solely focus on primary sources and there are non-existing categories for secondary formation or aging air masses in emission inventories. Thirdly, the reactivity of different VOC species might affect the results of receptor models, such as the chemical losses of highly reactive VOCs that would have the potential to change the source contributions resolved by PMF (Derwent et al., 2001; Belis et al., 2015), and the long-lived VOCs species might also be overestimated by PMF source appointment as they can accumulate in the atmosphere (de Gouw et al., 2005). To obtain accurate source appointment results, future work must be done in the areas of redeveloping emission inventories with high temporal and spatial resolution and confirming VOC source structures for receptor models and emission inventories.
5.1. Receptor models
5.2. Emission and trend analysis
-
The total urban NMHCs have higher mixing ratios in the northwest, northeast, and developed cities of China compared to those in the central and southwest areas, while OVOCs have higher mixing ratios in the northwest and central areas as well as developed cities. Among all the NMVOCs, alkanes are the most abundant species followed by OVOCs. In recent years, NMHCs have been decreasing in the urban areas of Beijing and Shanghai, and the surrounding rural area of Guangzhou and Hong Kong. The seasonal concentrations of NMHCs are highest in winter while OVOCs are highest in summer. The diurnal variations of NMHCs characterized by higher mixing ratios in the morning and evening. While OVOCs showed a unimodal pattern with peaks around local noon.
As the key species of atmospheric oxidation capacity, research has revealed conclusive roles of both NMHCs and OVOCs in atmospheric photochemical reactions. However, due to the inherent complexity of photochemical reactions, many reaction processes and mechanisms have not be well understood, and some important reaction kinetics data are lacking. Further studies of atmospheric photochemical mechanisms are necessary for improving our understanding of atmospheric oxidation and oxidizing capacity. Study results on OFP showed that alkenes, aromatic hydrocarbons, and OVOCs are key activate species. Among all the NMVOCs, the contributions from the top eight species account for 50%−70% for OFP. Like OFP-NMHCs, OFP-OVOCs also make considerable contributions to O3 formation.
Vehicle exhaust, industrial emissions, and solvent usage are the main sources for NMHCs, while secondary formation is the major source for OVOCs. While emissions from vehicle exhausts have been decreasing, the emissions of solvent usage and industrial activities in China, especially in the developed regions, continue to increase. Therefore, placing controls upon solvent usage and industrial emissions in the country represents an effective strategy for emission reduction of NHMCs in the future. On the other hand, since vehicle exhaust contributes significantly to the main active NMVOCs, strict controls on vehicle emissions still remain necessary.
Acknowledgements. This work was financially supported by the National Key R&D Plan programs (Grant No. 2017YFC0210005) and the National Natural Science Foundation of China (Grant No. 41773117).
 AAS Website
 AAS WeChat