


 DownLoad:


-
Tropospheric ozone (O3) is a typical secondary pollutant in the atmosphere and poses a serious threat to human health, vegetation, and the atmospheric environment (Crutzen et al., 1973; Feng et al., 2015; Goodman et al., 2015). Urban air quality environmental monitoring data show that as the O3 concentration near the ground has increased year by year in China, O3 has gradually become the main pollutant affecting air quality in China (Li et al., 2019). Meteorological factors and synoptic patterns have great impacts on the variation of O3 (Dong et al., 2020). Also, the major contribution to O3 concentrations near the ground is well recognized to come from aerosol particles, which is clear from this study.
Black carbon (BC) accounts for a small fraction of aerosols, but it exerts a large radiative effect on the energy balance. BC is produced by incomplete combustion of carbonaceous fuels (Bond et al., 2004). Strict emissions control and reduction measures implemented in China have made both aerosol (Zhang et al., 2019a) and BC mass concentrations (Zhang et al., 2019b) decrease sharply. By absorbing solar radiation, BC can not only change the global and regional radiative balance but also reduce the photolysis coefficient, thereby reducing the concentration of O3 near the ground, which makes the influence of BC on O3 always of concern (Jacobson, 2001; Ramanathan et al., 2008; Yang et al., 2016).
Chen et al. (2019) found a negative correlation between BC and O3 through observations in the Nanjing area. Dickerson et al. (1997) proposed that BC could reduce the surface O3 concentration by reducing the photolysis rate. Jacobson (1998) and Castro et al. (2001) found that aerosols containing BC significantly reduced the photolysis coefficient by absorbing solar radiation, and the near-surface O3 concentration decreased by 5%–8%. Li et al. (2005) simulated a period of heavy air pollution in Houston through a regional chemical transport model and found that BC reduced the photolysis coefficient in the boundary layer by 10%–30% and O3 concentration by 5%–20%. Gao et al. (2018) found that absorption of radiation by BC at the top of the boundary layer inhibits the development of the boundary layer in the daytime, and a large number of O3 precursors are limited to the boundary layer, thus promoting the photochemical generation of O3. This would counteract the effect of BC lowering the photolysis coefficient to inhibit O3 formation. However, the experimental results from studies of factors such as BC scale distribution and aging process are still highly uncertain (Huang et al., 2015). The optical properties of BC and its radiative effect are not fully understood, and the mechanisms of the influence of BC on O3 needs to be further studied.
The optical properties of BC, which are closely related to its particle size distribution and mixing state, are the basis for simulating its radiative effect (Bond et al., 2013) and directly affect the simulated results for O3 (Saathoff et al., 2003; Chung et al., 2005; Ma et al., 2011). Based on a number of observations of BC particles, both BC number concentration and mass concentration are characterized by a logarithmic normal distribution (LND) (McMeeking et al., 2010; Huang et al., 2012; Wang et al., 2014). The peak particle size of approximately 120–210 nm (Kondo et al., 2006; Gong et al., 2015) is related to the environment and the emission source (Park and Lee, 2015). After being discharged into the atmosphere, BC tends to absorb other aerosols and mix with them (Oshima et al., 2009). Mixing mode, shell chemical composition, thickness, and environmental humidity are important factors that affect the mixing state of BC. Jacobson (2001) found that BC could significantly enhance radiation forcing when it was mixed with other groups, and the rate of increase was related to the hygroscopic growth effect of the aerosol. Zhang et al. (2008) found that, compared with fresh particles, the absorption efficiency of internal mixed particles was nearly two times higher and the scattering efficiency was approximately ten times higher in a high-humidity environment. Liu et al. (2015) proposed that the enhanced optical absorption effect of BC depends largely on the thickness of the shell layer, which is related to the emission source. Therefore, it is necessary to conduct sensitivity tests on BC optical parameters when studying the influence of BC on O3.
In this paper, to analyze the sensitivity of radiation and O3 to BC optical properties, the mass concentration ratio of BC in particulate matters (PM2.5) and the spectral distribution and the mixing state of BC were changed. As detailed in the following sections, Mie scattering theory and the program of coated spheres according to Bohren and Huffman (BHCOAT) scattering program were used to calculate optical parameters of BC, the tropospheric Ultraviolet and Visible radiation (TUV) model was used to calculate the value of radiation and photolysis coefficients, and a zero-dimensional box mechanism model (NCAR MM) was used to calculate O3 concentrations under different optical parameters of BC. Finally, the variation in the Empirical Kinetics Modeling Approach (EKMA) curves after radiation attenuation was analyzed by using the observed data for nitrogen oxides (NOx) and volatile organic compounds (VOCs) in Nanjing.
-
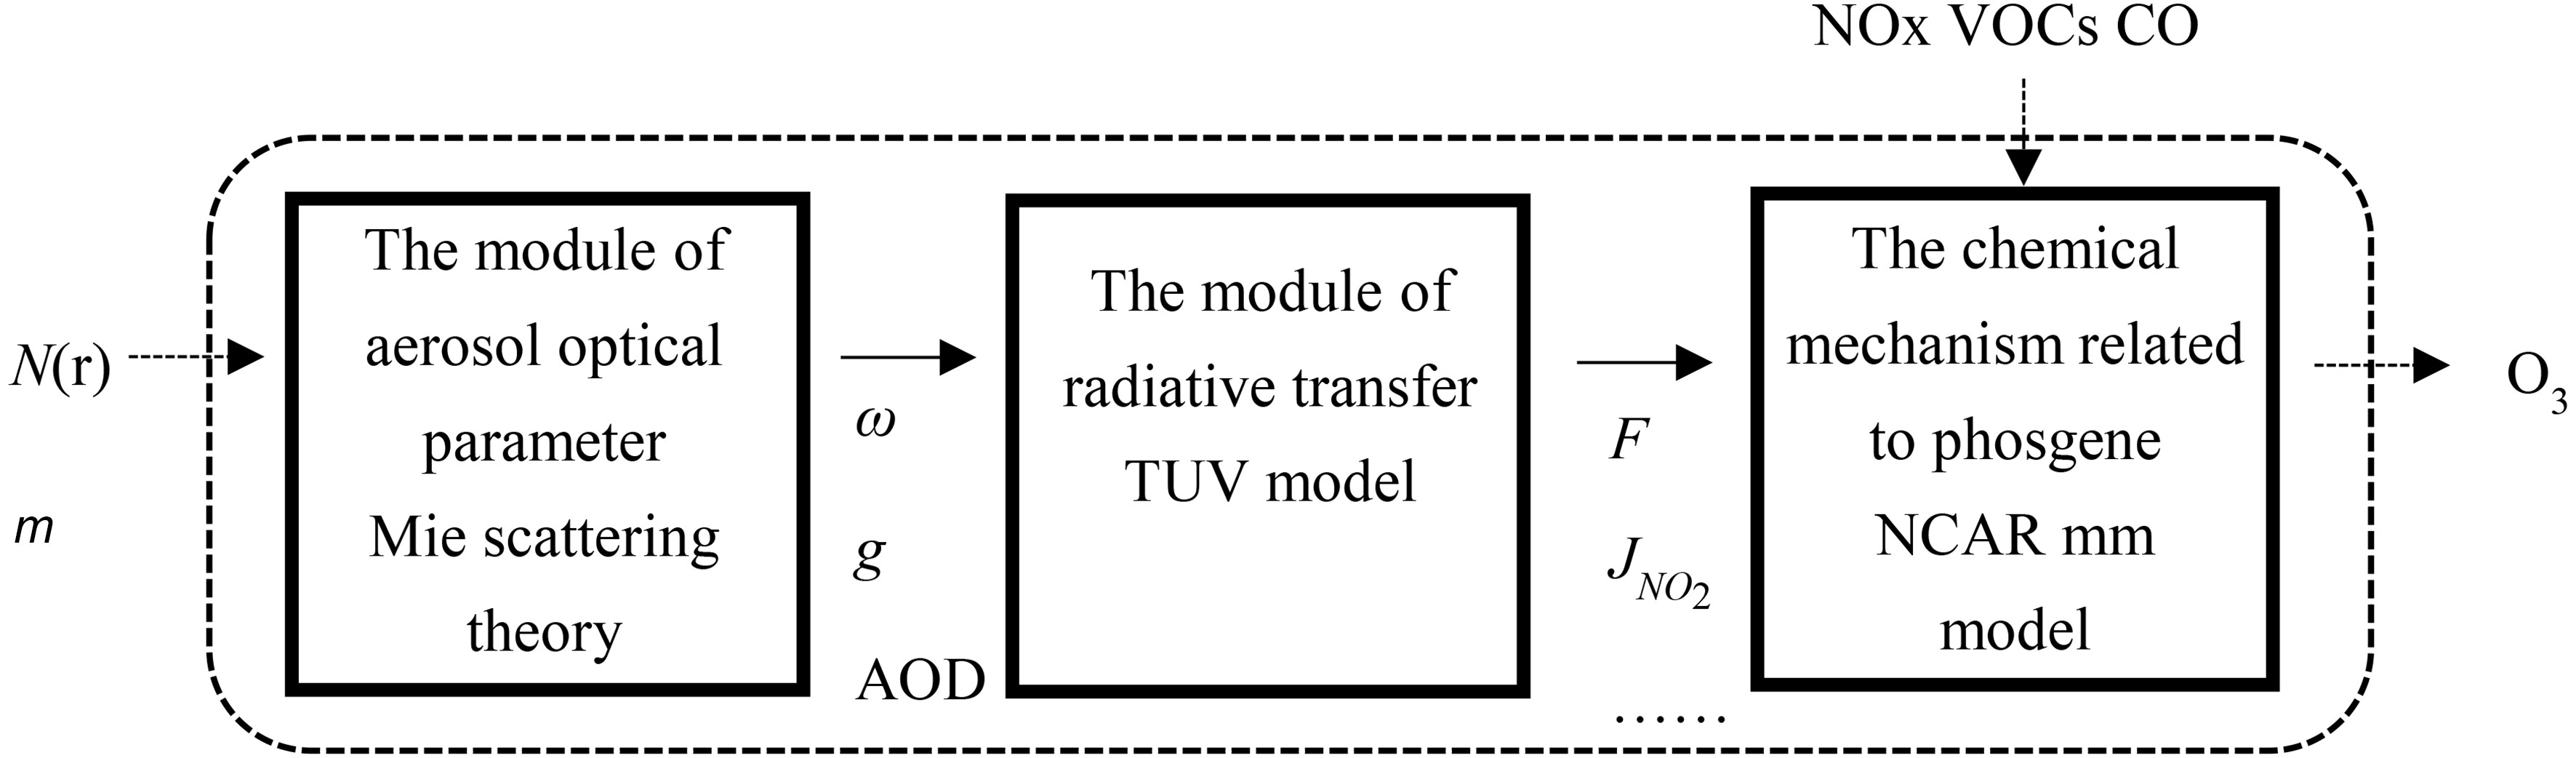
In this study, a box model with no source emission or advection and diffusion processes and only photochemical processes is used for simulation and calculation. The model is composed of three modules: aerosol optical parameter, radiative transfer, and the chemical mechanism related to phosgene (Fig. 1). The optical properties of BC are mainly calculated by Mie scattering theory. The radiation parameters and O3 concentration are respectively solved by the TUV model and the NCAR MM model. The optical parameters of fresh BC and PM2.5 are solved by the Lorenz-Mie Scattering code developed by Michael Mishchenko. Mie scattering assumes that the particles are spherical. Through the input of complex refractive index and spectral distribution, the following optical parameters of the aerosol particle swarm are obtained: single scattering albedo (ω), asymmetric factor (g), extinction efficiency (Qext), and volume extinction coefficient (kext). Refractive index and density of PM2.5 (Dubovik et al., 2002; Pitz et al., 2003) and those of BC (Hess et al., 1998; Gong et al., 2015) are shown in Table 1. A logarithmic normal distribution (LND) is selected, and the analytical expression is shown in Eq. (1):

Figure 1. Structure diagram of box model.
Complex refraction index (λ=0.55 μm) rmod,N (μm) σ (μm) ρ (g cm−3) PM2.5 1.47−0.014i 0.0873 0.43 1.6 BC 1.75−0.44i 0.0118 2 1.8 Table 1. Aerosol parameter settings.
where rmod,N is the modal radius,
$\sigma $ is the width of the spectral distribution, and N is the particle number concentration. When considering the mixing process and the influence of relative humidity (RH), the k-EC-Mie model is adopted for the optical properties of BC (Zhang et al., 2017). The k-EC-Mie model is based on the core-shell model and assumes that 1) the physical and chemical properties of particles with the same scale are the same; 2) under dry conditions, the particle consists only of BC (core), located in the center of the particle, and an envelope (shell); and 3) regardless of the hygroscopicity of BC, the coating is evenly mixed with water before the hygroscopic growth process. Finally, the layered spherical Mie scattering method (BHCOAT scattering program) proposed by Bohren and Huffman (2008) is used for calculations. The core-shell volume ratio of each particle is set as constant when calculating the optical properties of particle swarm.The TUV model is a radiation transmission model developed and continuously improved by the National Center for Atmospheric Research (NCAR) and embedded in the NCAR MM model (Madronich and Flocke, 1999). It can calculate various radiation quantities such as solar incident radiation intensity and photolysis rate coefficients of 73 photochemical reactions with wavelengths in the range of 121–1000 nm (Stamnes et al., 1988). The TUV model is widely used in the NCAR MM model, WRF-Chem model, and other regional and global atmospheric chemistry models (Shao et al., 2016; Ryu et al., 2018). Palancar et al. (2013) present a comparison between measured actinic fluxes and those simulated with the TUV model and found that the simulated result is larger and the difference between the two is about 10%–40%. In addition to input parameters such as w and g, aerosol optical depth (AOD) with a wavelength of 0.55 µm near the ground should also be calculated using Eqs. (2) and (3) (Hess et al., 1998):
where h is the height above ground, Z is atmospheric elevation (default is 8 km), M (0) is the aerosol mass concentration on the ground, and
$k{'_{{\rm{ext}}}}$ is the extinction coefficient of aerosol mass concentration per unit volume (m2 g−1).The NCAR MM model is used to calculate the chemical mechanism related to phosgene. The model includes nearly 5000 gas phase chemical reactions between more than 2000 substances. Assuming no other emission sources, no dilution, and no recombination process, it can calculate the time-dependent chemical evolution of air with known initial components (Madronich and Calvert, 1990). Users define input parameters such as initial gas component and volume fraction and then calculate the O3 concentration by combining with photolysis coefficient output from the TUV model. Lingaswamy et al. (2017) used the TUV model to calculate the photolysis rate coefficients
$ \left[ {J\left( {{\rm{O}}_3} \right),J\left( {{\rm{NO}}_2} \right)} \right] $ , used the NCAR MM model to simulate diurnal variation of CO, and reported their results.The volume fraction of gas and meteorological data required by the NCAR MM model are provided as hourly means from March 2014 to February 2015. The observation site is located in the Key Laboratory of Aerosol and Cloud Precipitation in Nanjing University of Information Technology (32°12′N, 118°42′E; altitude 62 m). O3, NO, NO2, and CO were observed using an air pollution environmental monitoring analyzer produced by Thermo Fisher Scientific in the United States, including an ultraviolet luminescence O3 analyzer (Model 49i), infrared absorption CO analyzer (Model 48i), and chemiluminescence NO-NO2-NOx analyzer (Model 42i). Detailed instrument parameters and calibration methods can be found in Hansen et al. (1984). VOCs were observed using a GC5000 automatic online gas chromatography-flame ionization detector produced by AMA Company in Germany, and detailed instrument parameters and calibration methods can be found in An et al. (2014).
-
The sensitivity experiment consists of a control experiment and four variant schemes. In the experiments, PM2.5 and BC are fully independent, and the sum of their mass concentration is always 75 μg m−3. The mixing mode between the two is external mixing. The external mixing method is actually independent scattering between particles. The aerosol optical parameters of PM2.5 and BC need to be calculated independently first, and then the optical properties of the mixed aerosol can be calculated according to the weight of the mass concentration.
In the control test, PM2.5 is regarded independently without the influence of BC. Then, the net radiation irradiance (579.85 W m−2) and the O3 concentration (46.76 ppb) near the ground can be calculated, where the concentration of PM2.5 is determined by the Chinese ambient air PM2.5 standard (75 μg m−3). In sensitivity tests, mass concentration ratio of BC to PM2.5, the spectral distribution, and mixing state are respectively changed (Table 2). Based on the observed data in Nanjing from 2015 to 2018, Tan et al. (2020) found that the annual mean ratio of BC to PM2.5 was about 4.92%, and the monthly mean was about 1.5% to 10.1%. Therefore, in this study, the ratio of BC to PM2.5 is set at 3%–9% when discussing the influence of the mass concentration of BC on O3, and the BC to PM2.5 ratio is set at 5% when discussing the influence of the spectrum distribution and mixing process of BC on O3. REO (%) is defined as the relative change between a sensitivity test and control test
$ \left[ {{\rm{Eq}}.\left( 4 \right)} \right]$ :Variables of BC Mass concentration of BC (%) Aging degree of BC Scheme 1 Mass concentration ratio 3%, 5%, 7%, 9% All Scheme 2 Median radius of the spectral distribution 5% New aerosol Scheme 3 The thickness of coating 5% Mixing process Scheme 4 Environment relative humidity 5% Mixing and hygroscopic process Table 2. Schematic setting for the sensitivity analysis.
If REO is negative, then BC has an attenuation effect on net radiation irradiance and O3. The greater the absolute value of REONRI and REOO3, the greater the attenuation of BC to radiation and O3. The above O3 concentration refers to the average of a continuous eight hours of an O3 concentration at the largest daily values, and the net irradiance is the average value in the corresponding period.
-
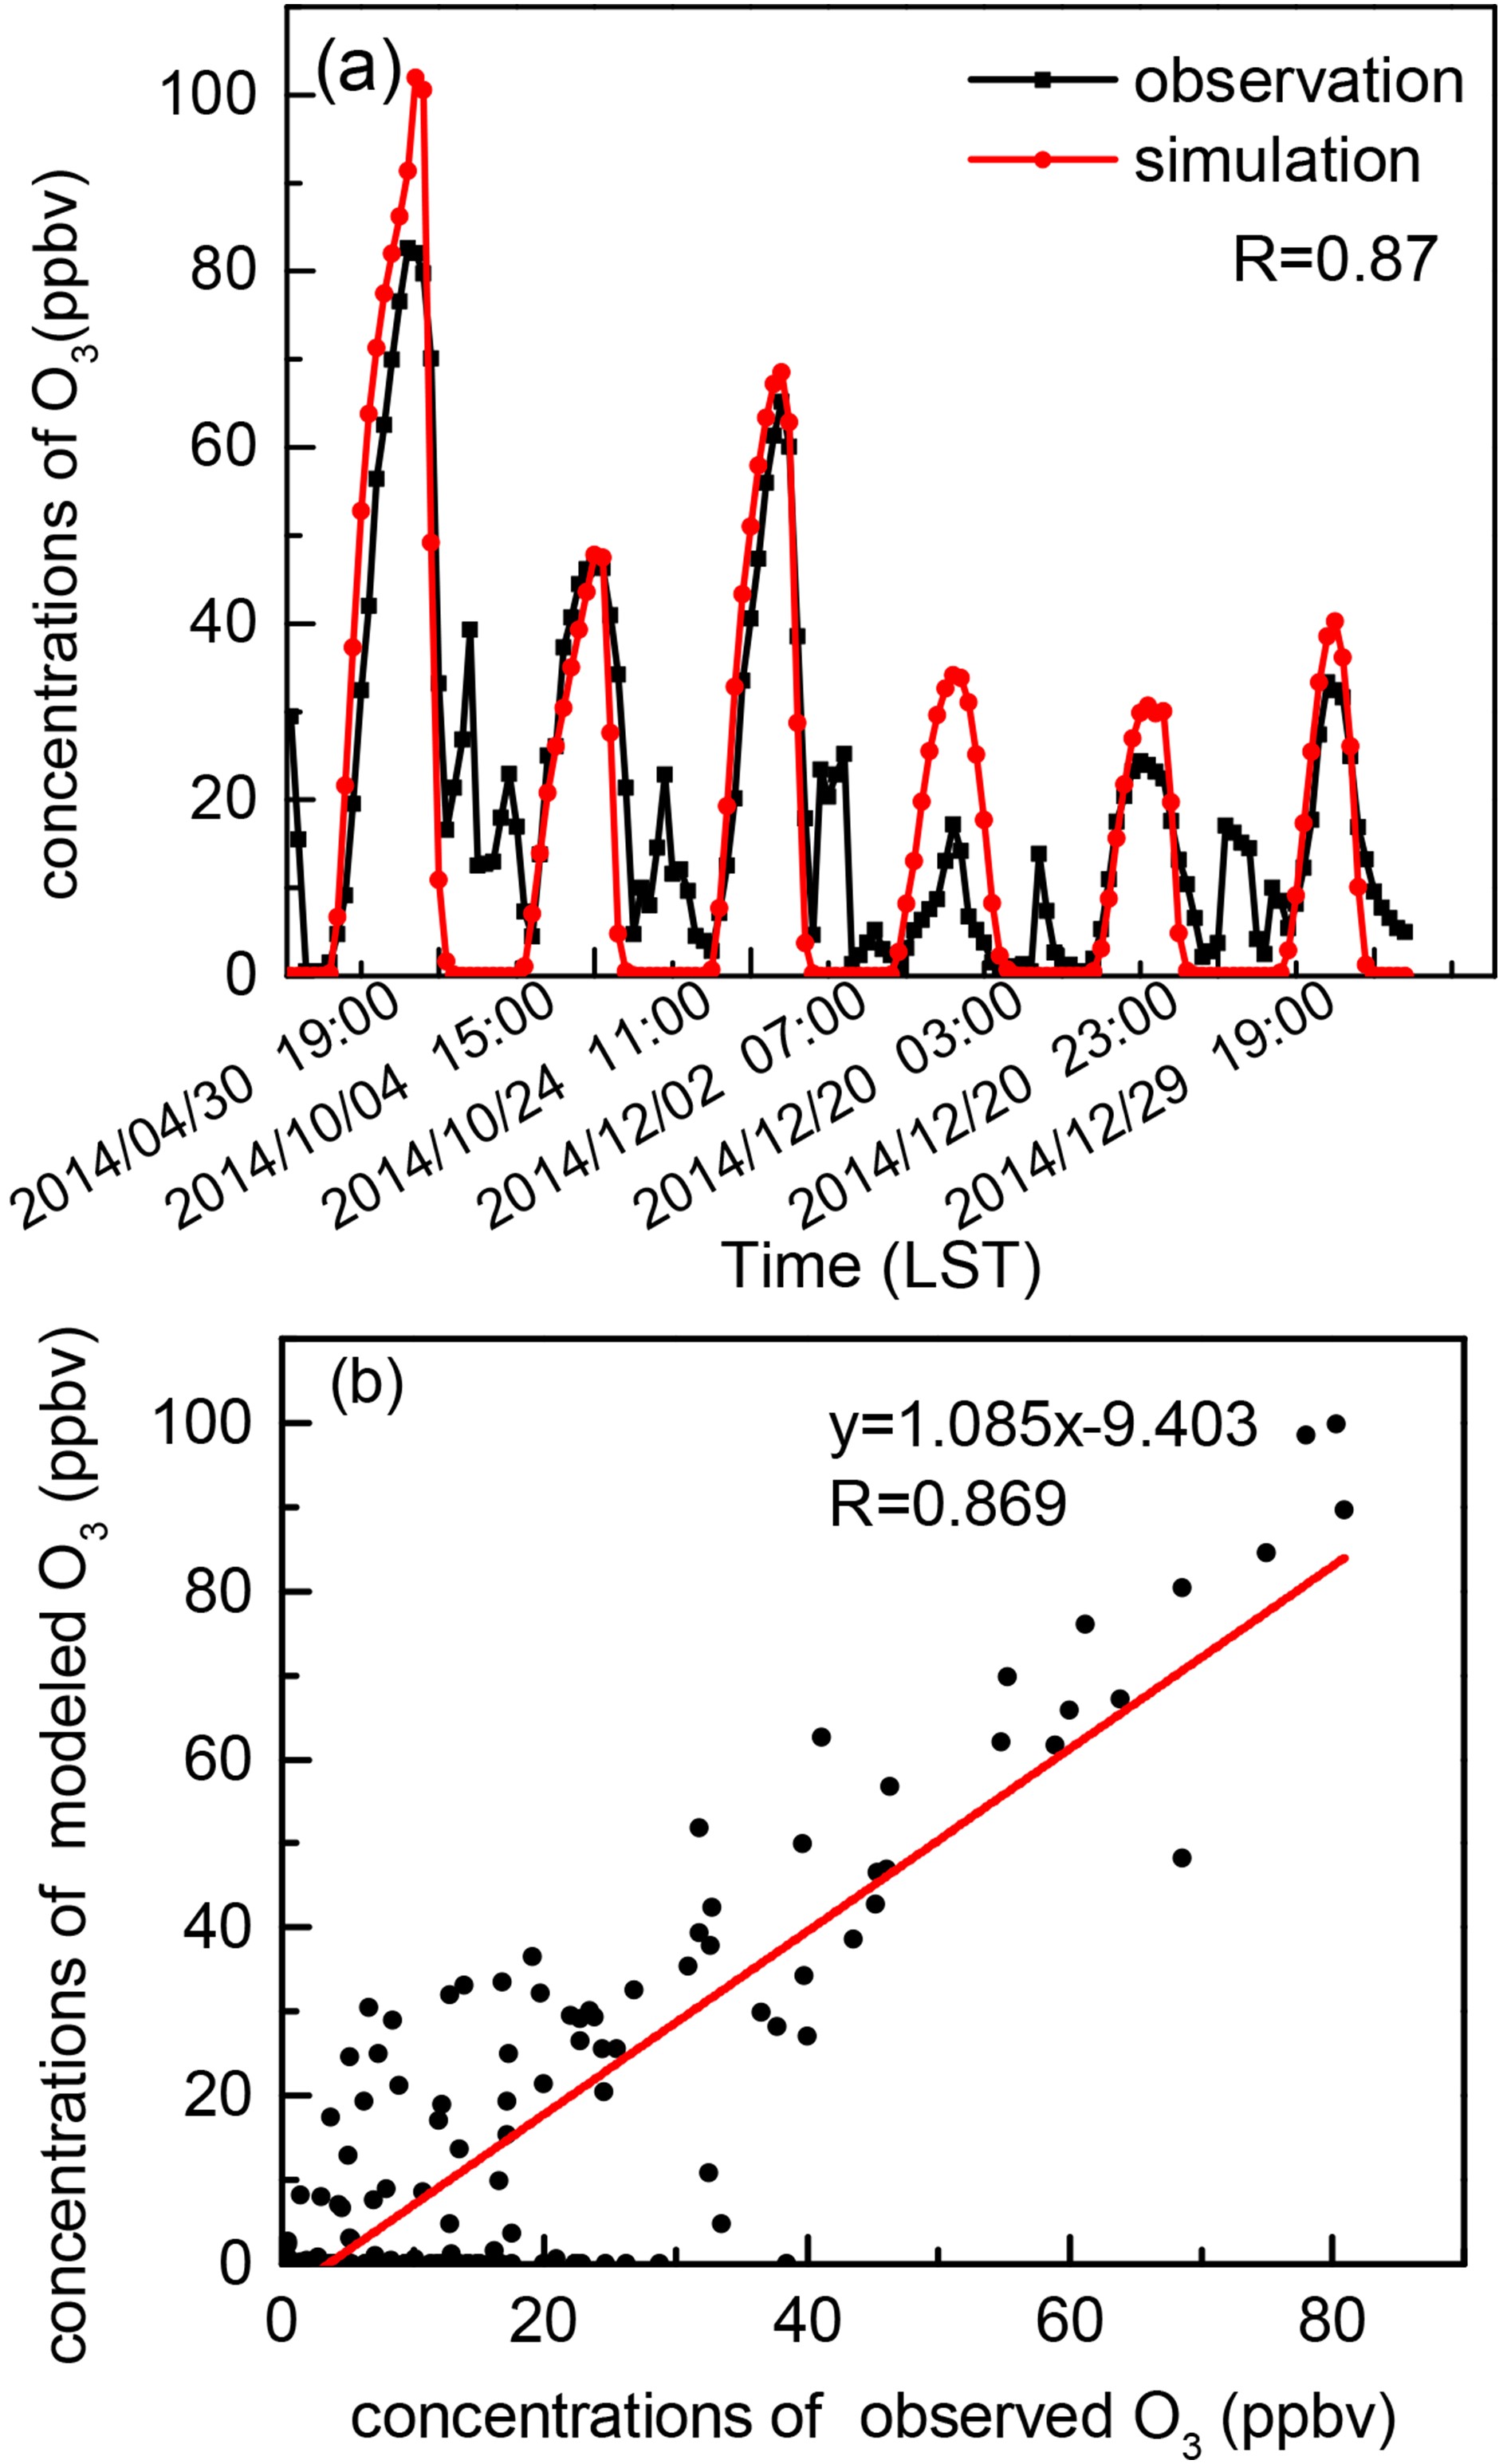
To verify the applicability of the above PM2.5 spectral distribution in the Nanjing area and the accuracy of the NCAR MM model, the observed concentration of O3 near the ground is compared with the simulation results. In this study, the measured data during sunny weather with a wind speed less than 4 m s−1 in 2014 are selected as the input to the NCAR MM model, resulting in six days being selected. By using these criteria, the simulation error caused by the transmission effect, wet deposition, and the influence of clouds will be significantly reduced (Shao et al., 2016). According to the above PM2.5 spectral distribution and the daily mean value of PM2.5 observation data, the daily ground-level AOD can be calculated. The calculated AOD and other observed data are input into the NCAR MM model for simulation. The 6-hour average value of volume fraction of O3 precursors is used as the limit of each simulation. According to the six selected samples, six simulations are performed. The simulation results show the diurnal variation of O3 and are highly correlated with the observations (R = 0.87); all reported correlation coefficients in this paper pass the significance test (P < 0.05). As shown in Fig. 2, compared with the observation data, the simulation results for tendencies in O3 variation and concentration perform well during the daytime (0600–1800 LST, LST = UTC + 8), but simulated O3 concentration is higher at noon, which may be related to real-time cloud changes (Zhang et al., 2015). In general, the observed tendency is consistent with the simulated tendency. The slope of the fitting curve is 1.085, indicating that the simulated values are relatively close to the actual values. This shows that the NCAR MM model can accurately simulate the variation tendencies and concentrations of O3, and the spectral distribution setting of PM2.5 is reasonable.

Figure 2. Comparison of observed ozone and modeled ozone in the northern suburbs of Nanjing for the selected six days in 2014.
-
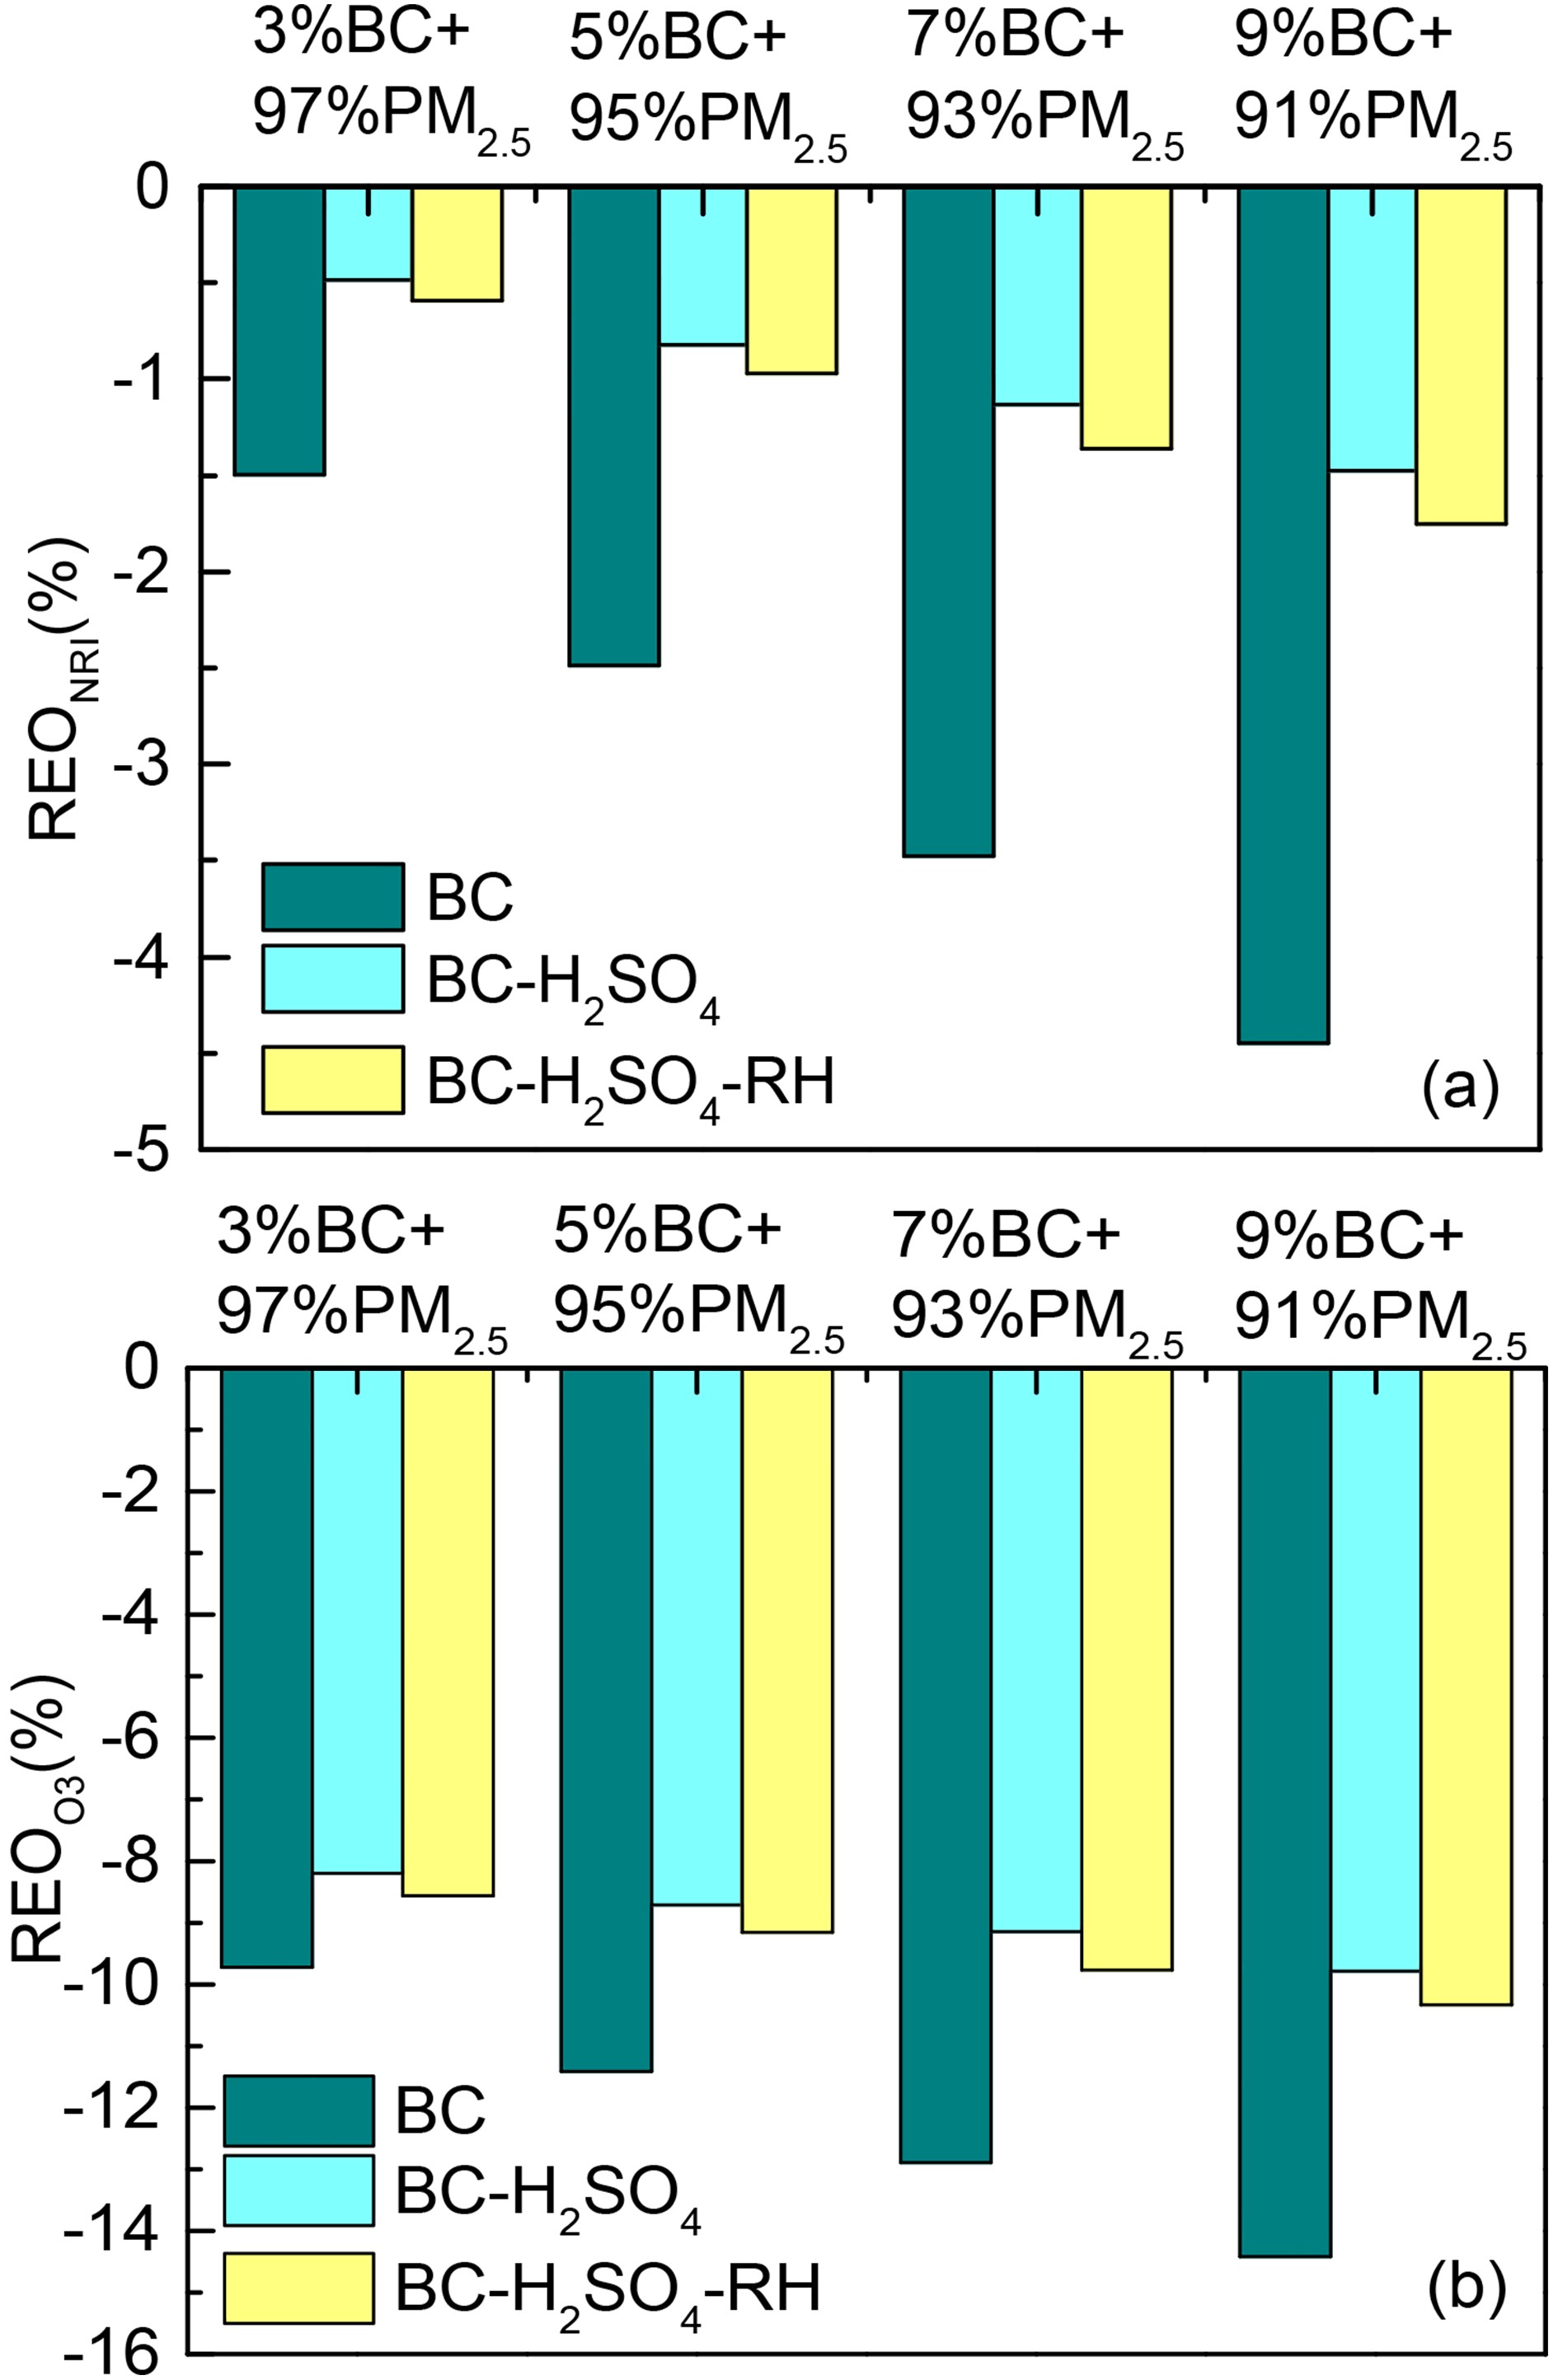
BC has a strong attenuating effect on radiation due to its strong absorption characteristics, which can lead to a decrease in O3 concentration. Therefore, this paper first discusses the sensitivity of net irradiance to BC optical properties. To analyze effects of BC mass concentration on radiation, four mass concentration ratios of BC to PM2.5 are set: 3%BC+97%PM2.5, 5%BC+95%PM2.5, 7%BC+93%PM2.5, and 9%BC+91% PM2.5. Optical properties of BC and PM2.5 are shown in Table 2. Due to the difference in extinction capacity between BC and PM2.5, the AOD of a unit of BC mass concentration in the three states (0.041, 0.021, and 0.023) are all greater than that of PM2.5 (0.012). Therefore, when the mass concentration ratio of BC increases, the attenuation of mixed aerosol to both BC and PM2.5 increases as well (Fig. 3). At the same mass concentration, the mass absorption coefficient (
$k{'_{{\rm{ext}}}}$ ) of BC is significantly positively correlated with the AOD of the mixed aerosol (R=1); the larger the coefficient value is, the larger the AOD will be (Table 3). Therefore, the attenuation of fresh BC particles to radiation is the largest, with REONPI reaching −4.45%. After the mixing process, the attenuation of BC to radiation changes significantly, and REONRI is −1.75%. The attenuation capability of BC is somewhat weakened. Therefore, it is necessary to further discuss the influence of BC mixing processes. In other experiments, the mass concentration of BC was set as 5% (3.75 μg m−3).
Figure 3. Effects of BC mass concentration on (a) net radiation and on (b) concentration of O3. REONRI and REOO3 represent the relative changes of net radiation and O3 concentration between sensitivity test and control test, respectively. “BC”, “BC-H2SO4”, and “BC-H2SO4” stand for fresh BC particles, old BC that fresh BC particles have coated with sulfate under dry conditions, and old BC that fresh BC particles have coated with sulfate under an environmental RH of 50%, respectively.
ρ of BC (g cm−3) ${k^{\rm{'}}}_{{\rm{ext}}}$ of BC (m2 g−1) AOD of mixed aerosol New BC 1.80 5.15 0.990 Mixing process, RH=0 1.82 2.67 0.916 Mixing process, RH=50% 1.47 2.89 0.922 Table 3. Optical properties of particles in three states.
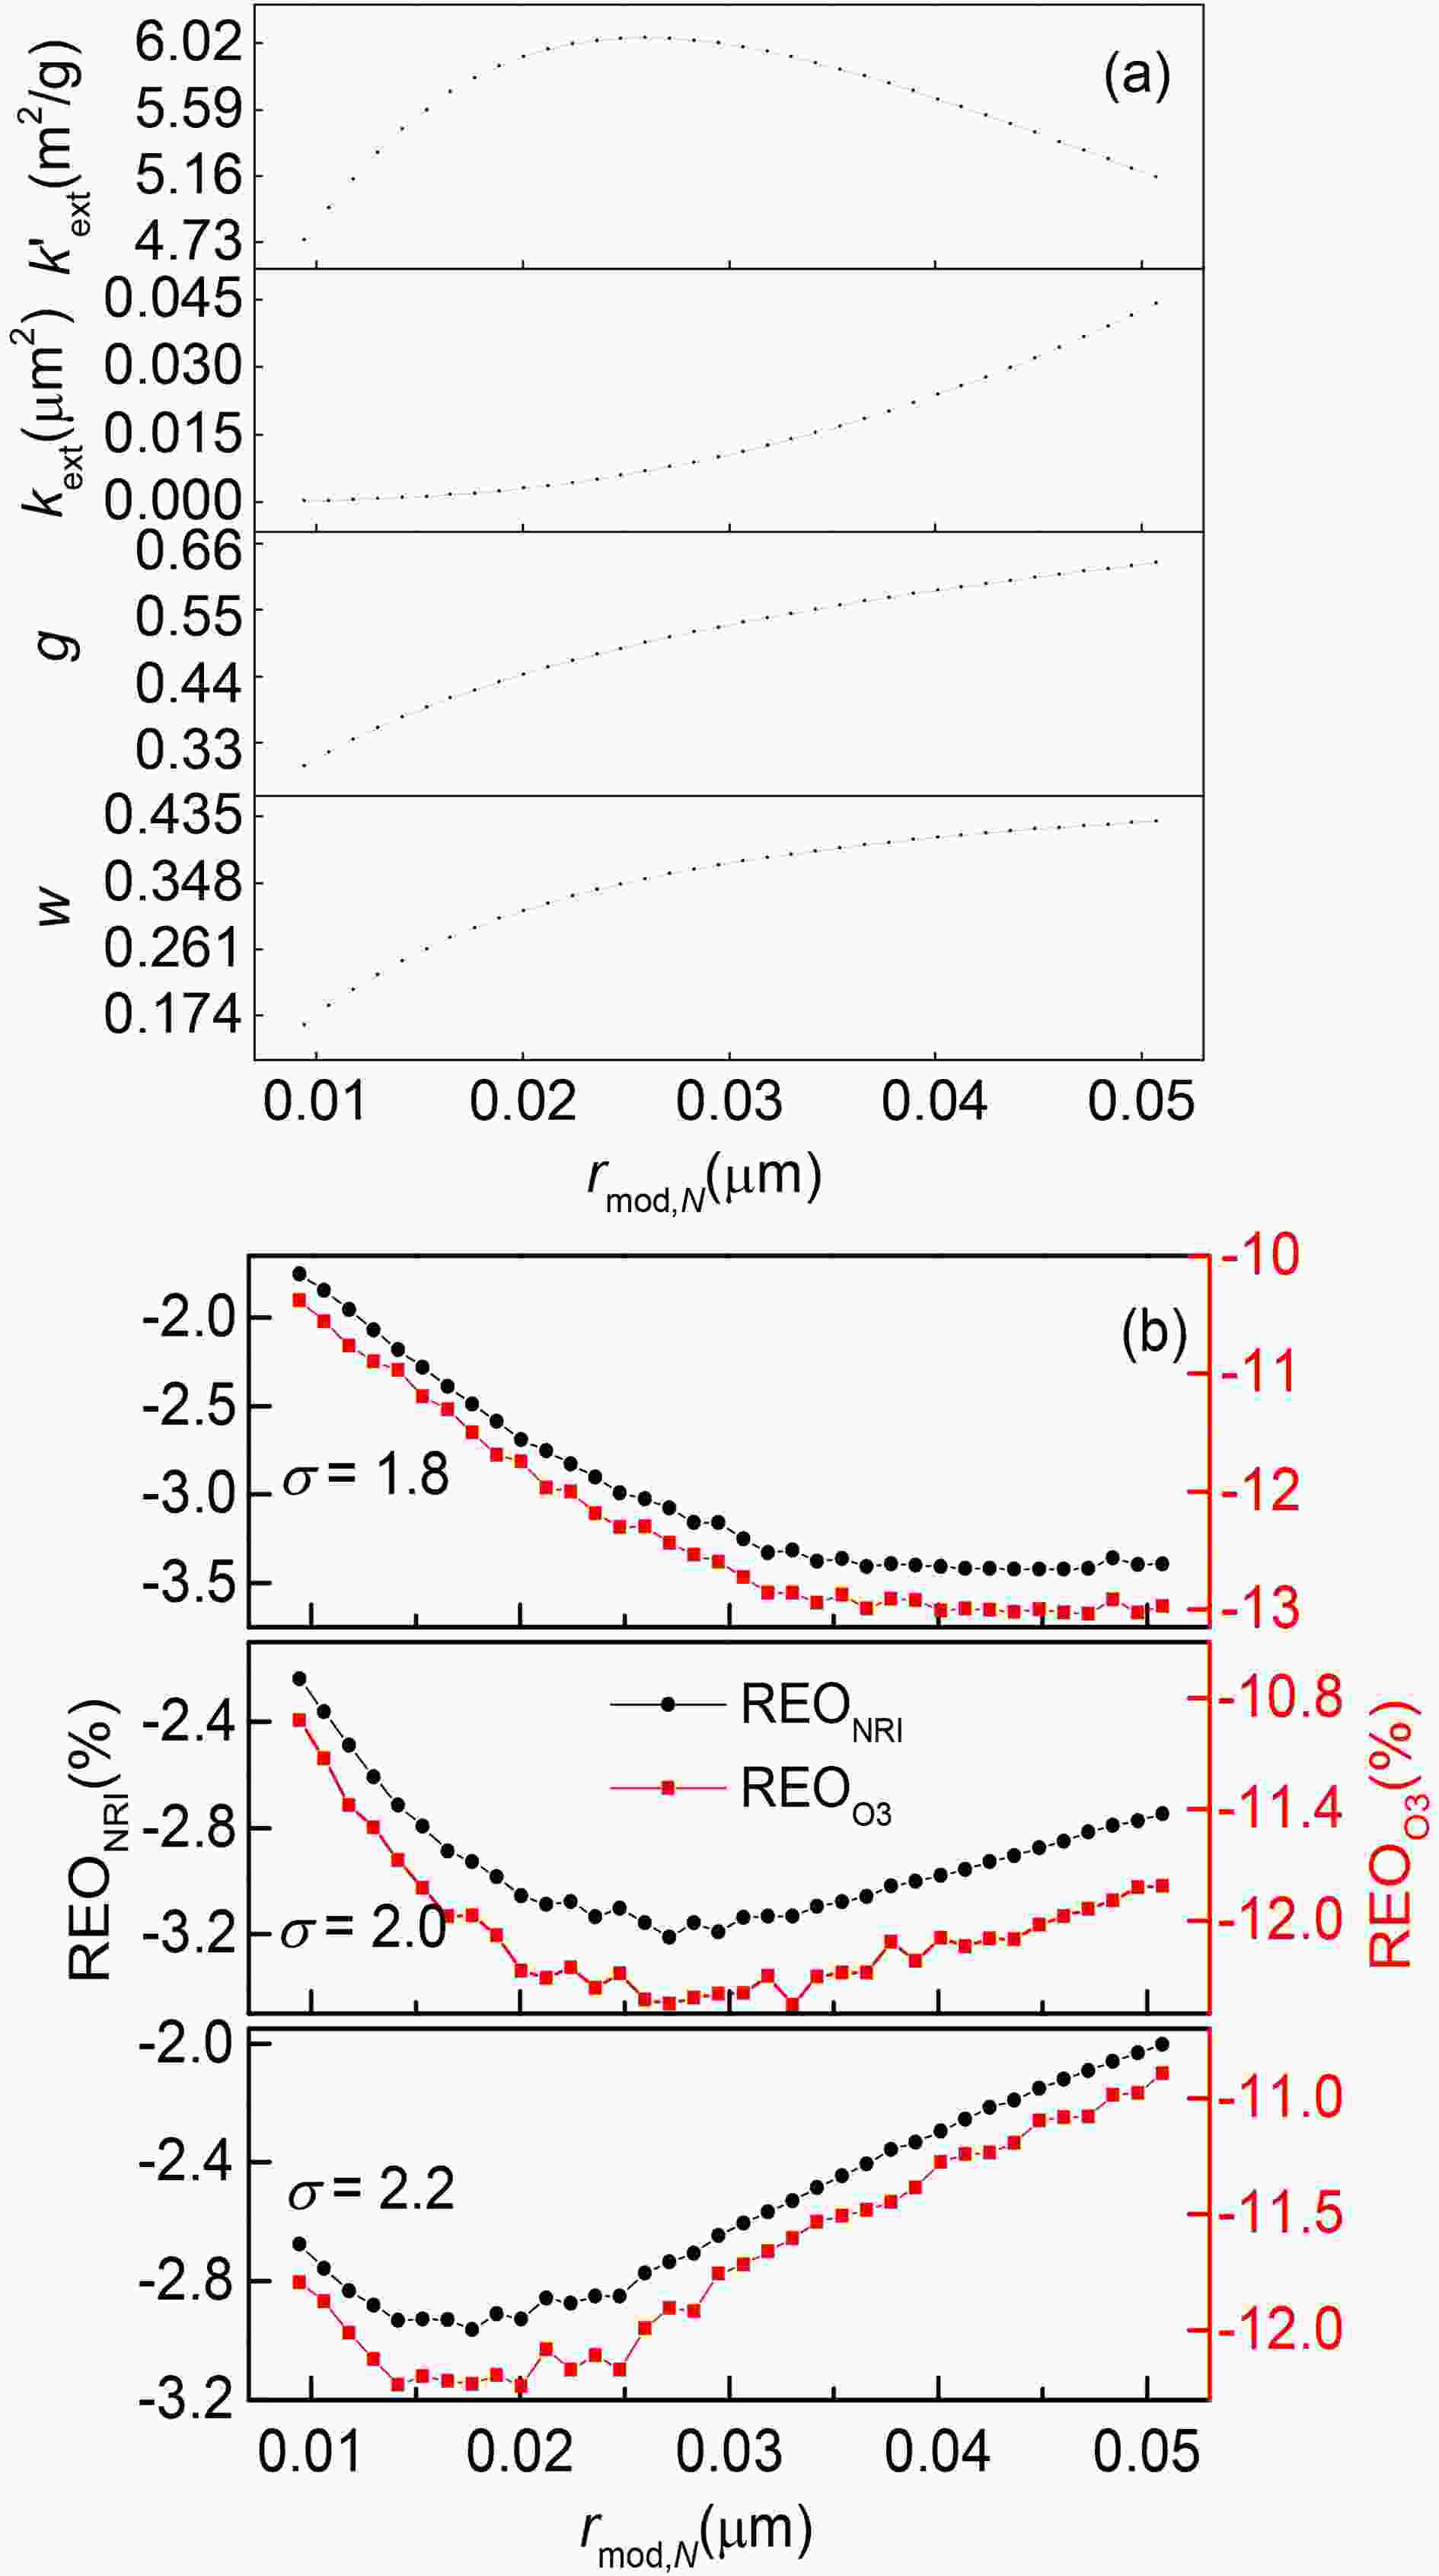
Figure 4. Effects of spectral distribution on (a) changes in optical parameters when σ is 2 and λ is 0.55 μm and on (b) changes in radiation and concentration of O3.
To explore the effect of fresh BC spectral distribution on radiation, rmod,N and width (σ) spectral distribution are changed. The larger the rmod,N or σ is, the larger the particle size of the particle population. The net radiation attenuation of fresh BC is approximately 1.75%–3.71%. As shown in Fig. 4b, REONRI first decreases and then increases with increasing rmod,N. When the value of σ is 1.8, 2.0, and 2.2, the rmod,N is approximately 0.041 μm, 0.026 μm, and 0.017 μm, respectively (i.e., a shift towards small particles when REONRI is the smallest). The corresponding effective radius (reff) is 0.097 μm, 0.088 μm, and 0.079 μm, respectively (Table 4). That is, when the reff of particle swarm is approximately 0.1 μm, BC has the strongest attenuation of radiation, which is close to the results of Zhang et al. (2017). It is found that the ratio of
$ {\sigma _i} \; {\rm{ref}}{{\rm{f}}_i} \;\pi $ to wavelength is approximately 1 in the three cases, and the above optical parameter is calculated when wavelength is 0.55 μm. The attenuation of BC is strongest when the ratio of$ \sigma \; {\rm{reff}} \; \pi $ is close to wavelength.σ
(μm)Maximum of $ {k{'}}_{\rm{ext}} $
(m2 g−1)reff
(μm)rmod,N
(μm)${\sigma _i} \; {\rm{ref}}{{\rm{f}}_i} \; \pi $
(μm2)1.8 6.365 0.097 0.041 0.548 2.0 6.055 0.088 0.026 0.549 2.2 5.803 0.079 0.017 0.546 Table 4. The values of optical parameters with maximum
$ {k{'}}_{\rm{ext}} $ .When analyzing the influence of mixing state of BC, two influencing factors are taken into account, namely, the content of the coating and its hygroscopic growth effect. When considering the mixing process of BC, the core-shell model is used, where BC is the core, and the nuclear radius is always 0.0118 μm. After the mixing process, the attenuation of BC to radiation is within 0.13%–2.98%. As the thickness of coating increases, REONRI first increases rapidly and then decreases slowly (Figs. 5a, 5c). During this process, REONRI is significantly correlated with
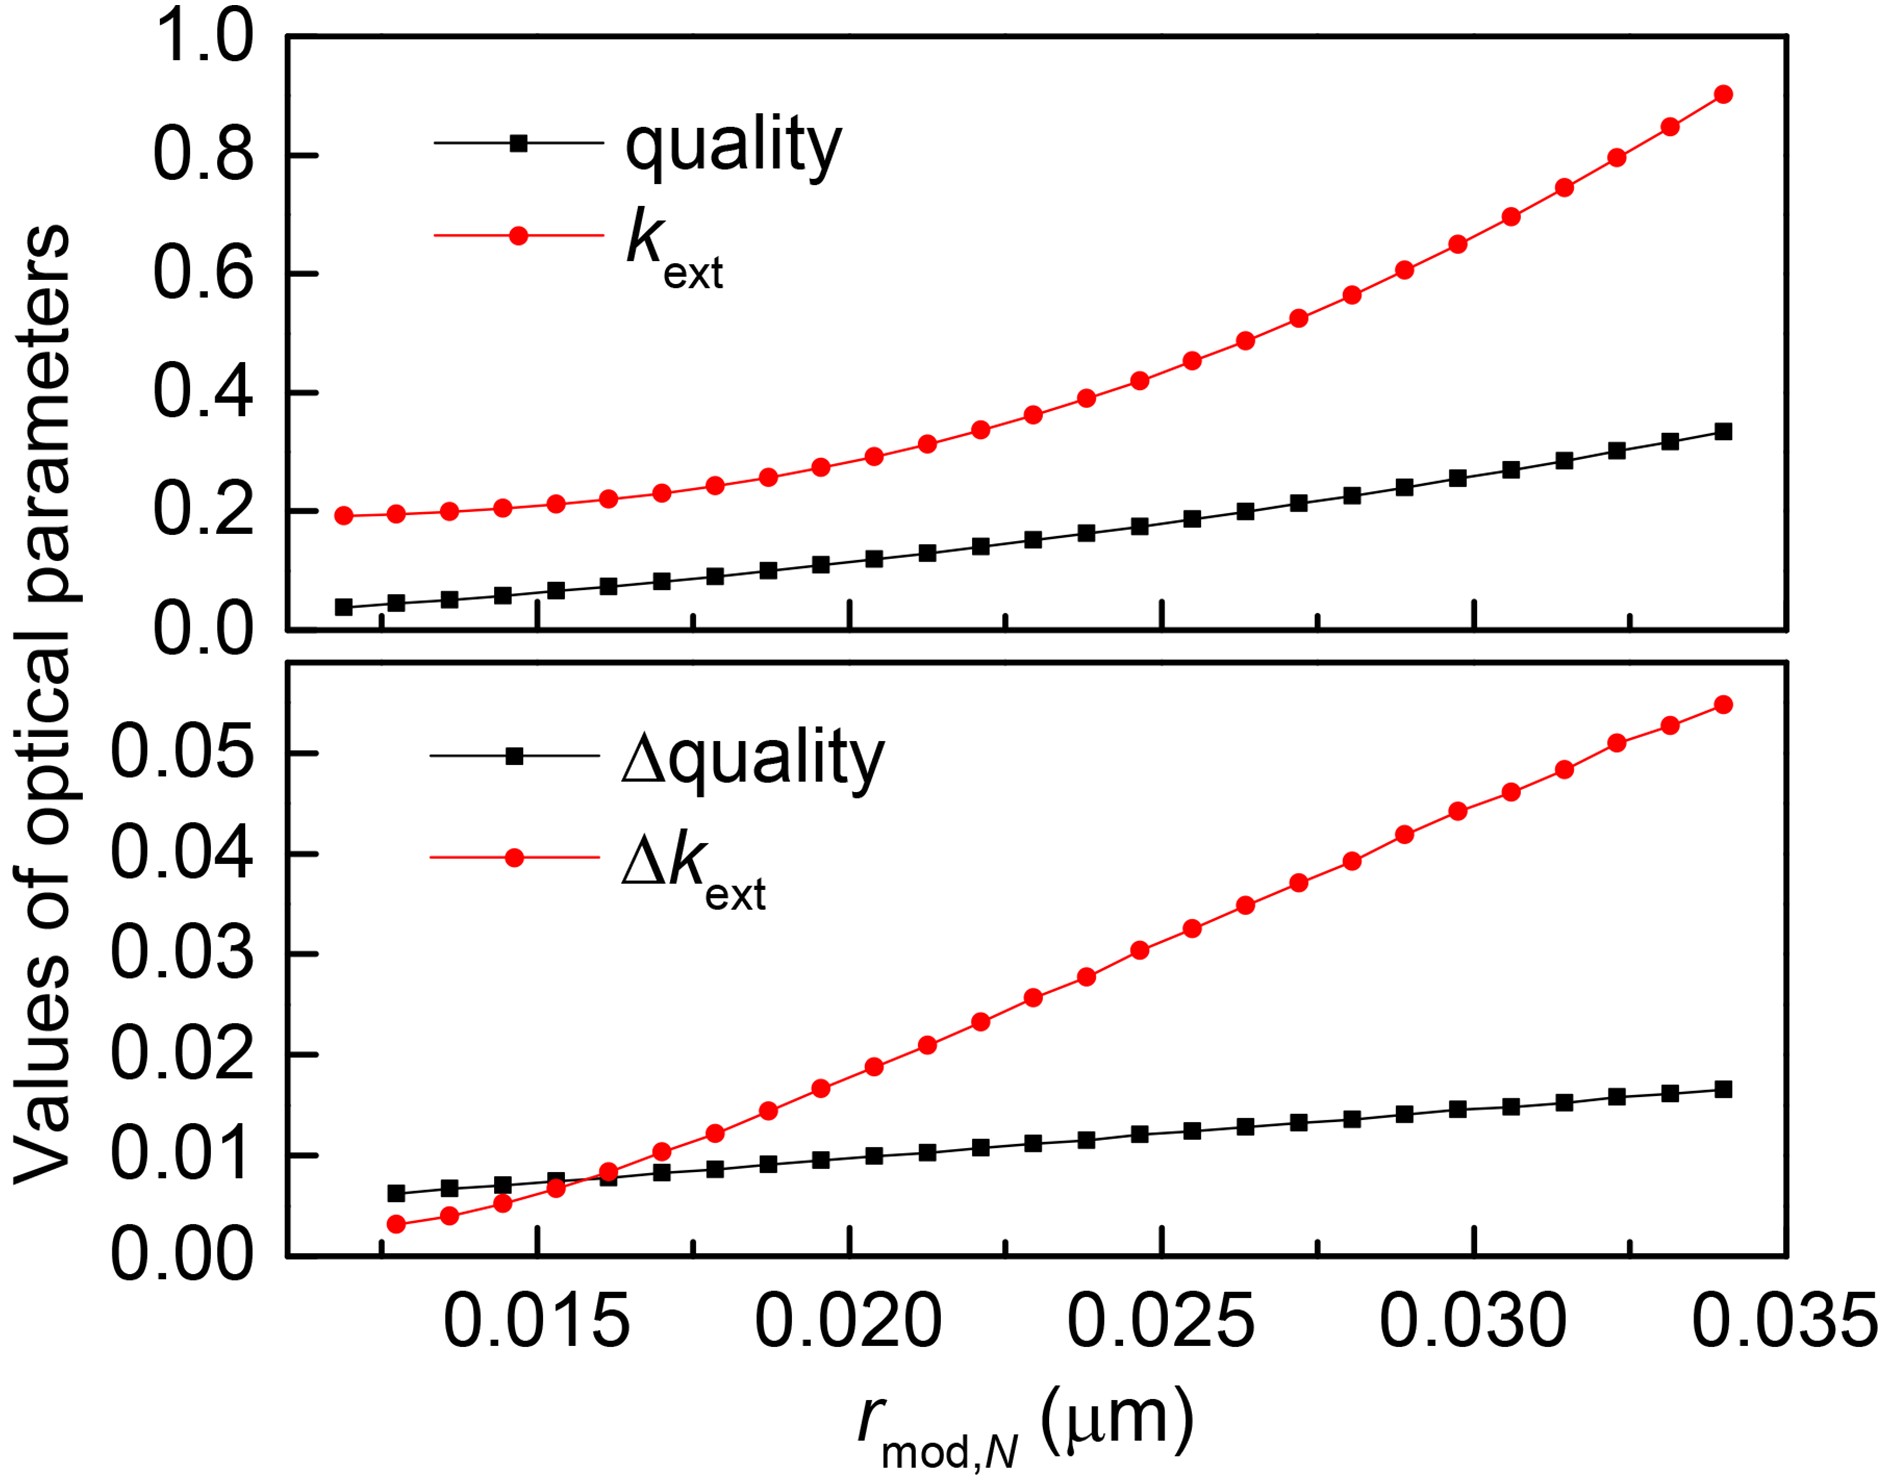
$k{'_{{\rm{ext}}}}$ (R=−0.996).$k{'_{{\rm{ext}}}}$ is the ratio of volume extinction coefficient (kext) to the mass of the particle swarm, and both show a monotonically increasing tendency (Fig. 6a). ∆quality and ∆kext describe the unit growth intensity of the particle mass and extinction coefficient (Fig. 6b). When the particle size of the particle swarm is small, the particle mass growth is dominant, and$k{'_{{\rm{ext}}}}$ decreases. When the particle size is large, the growth rate of mass is less than kext, and$k{'_{{\rm{ext}}}}$ increases. With the increase in RH, the attenuation of BC to radiation increases. Due to the hygroscopic effect, the particle size becomes larger, and the rmod,N is shifted in the direction of small particles when REONRI is the smallest.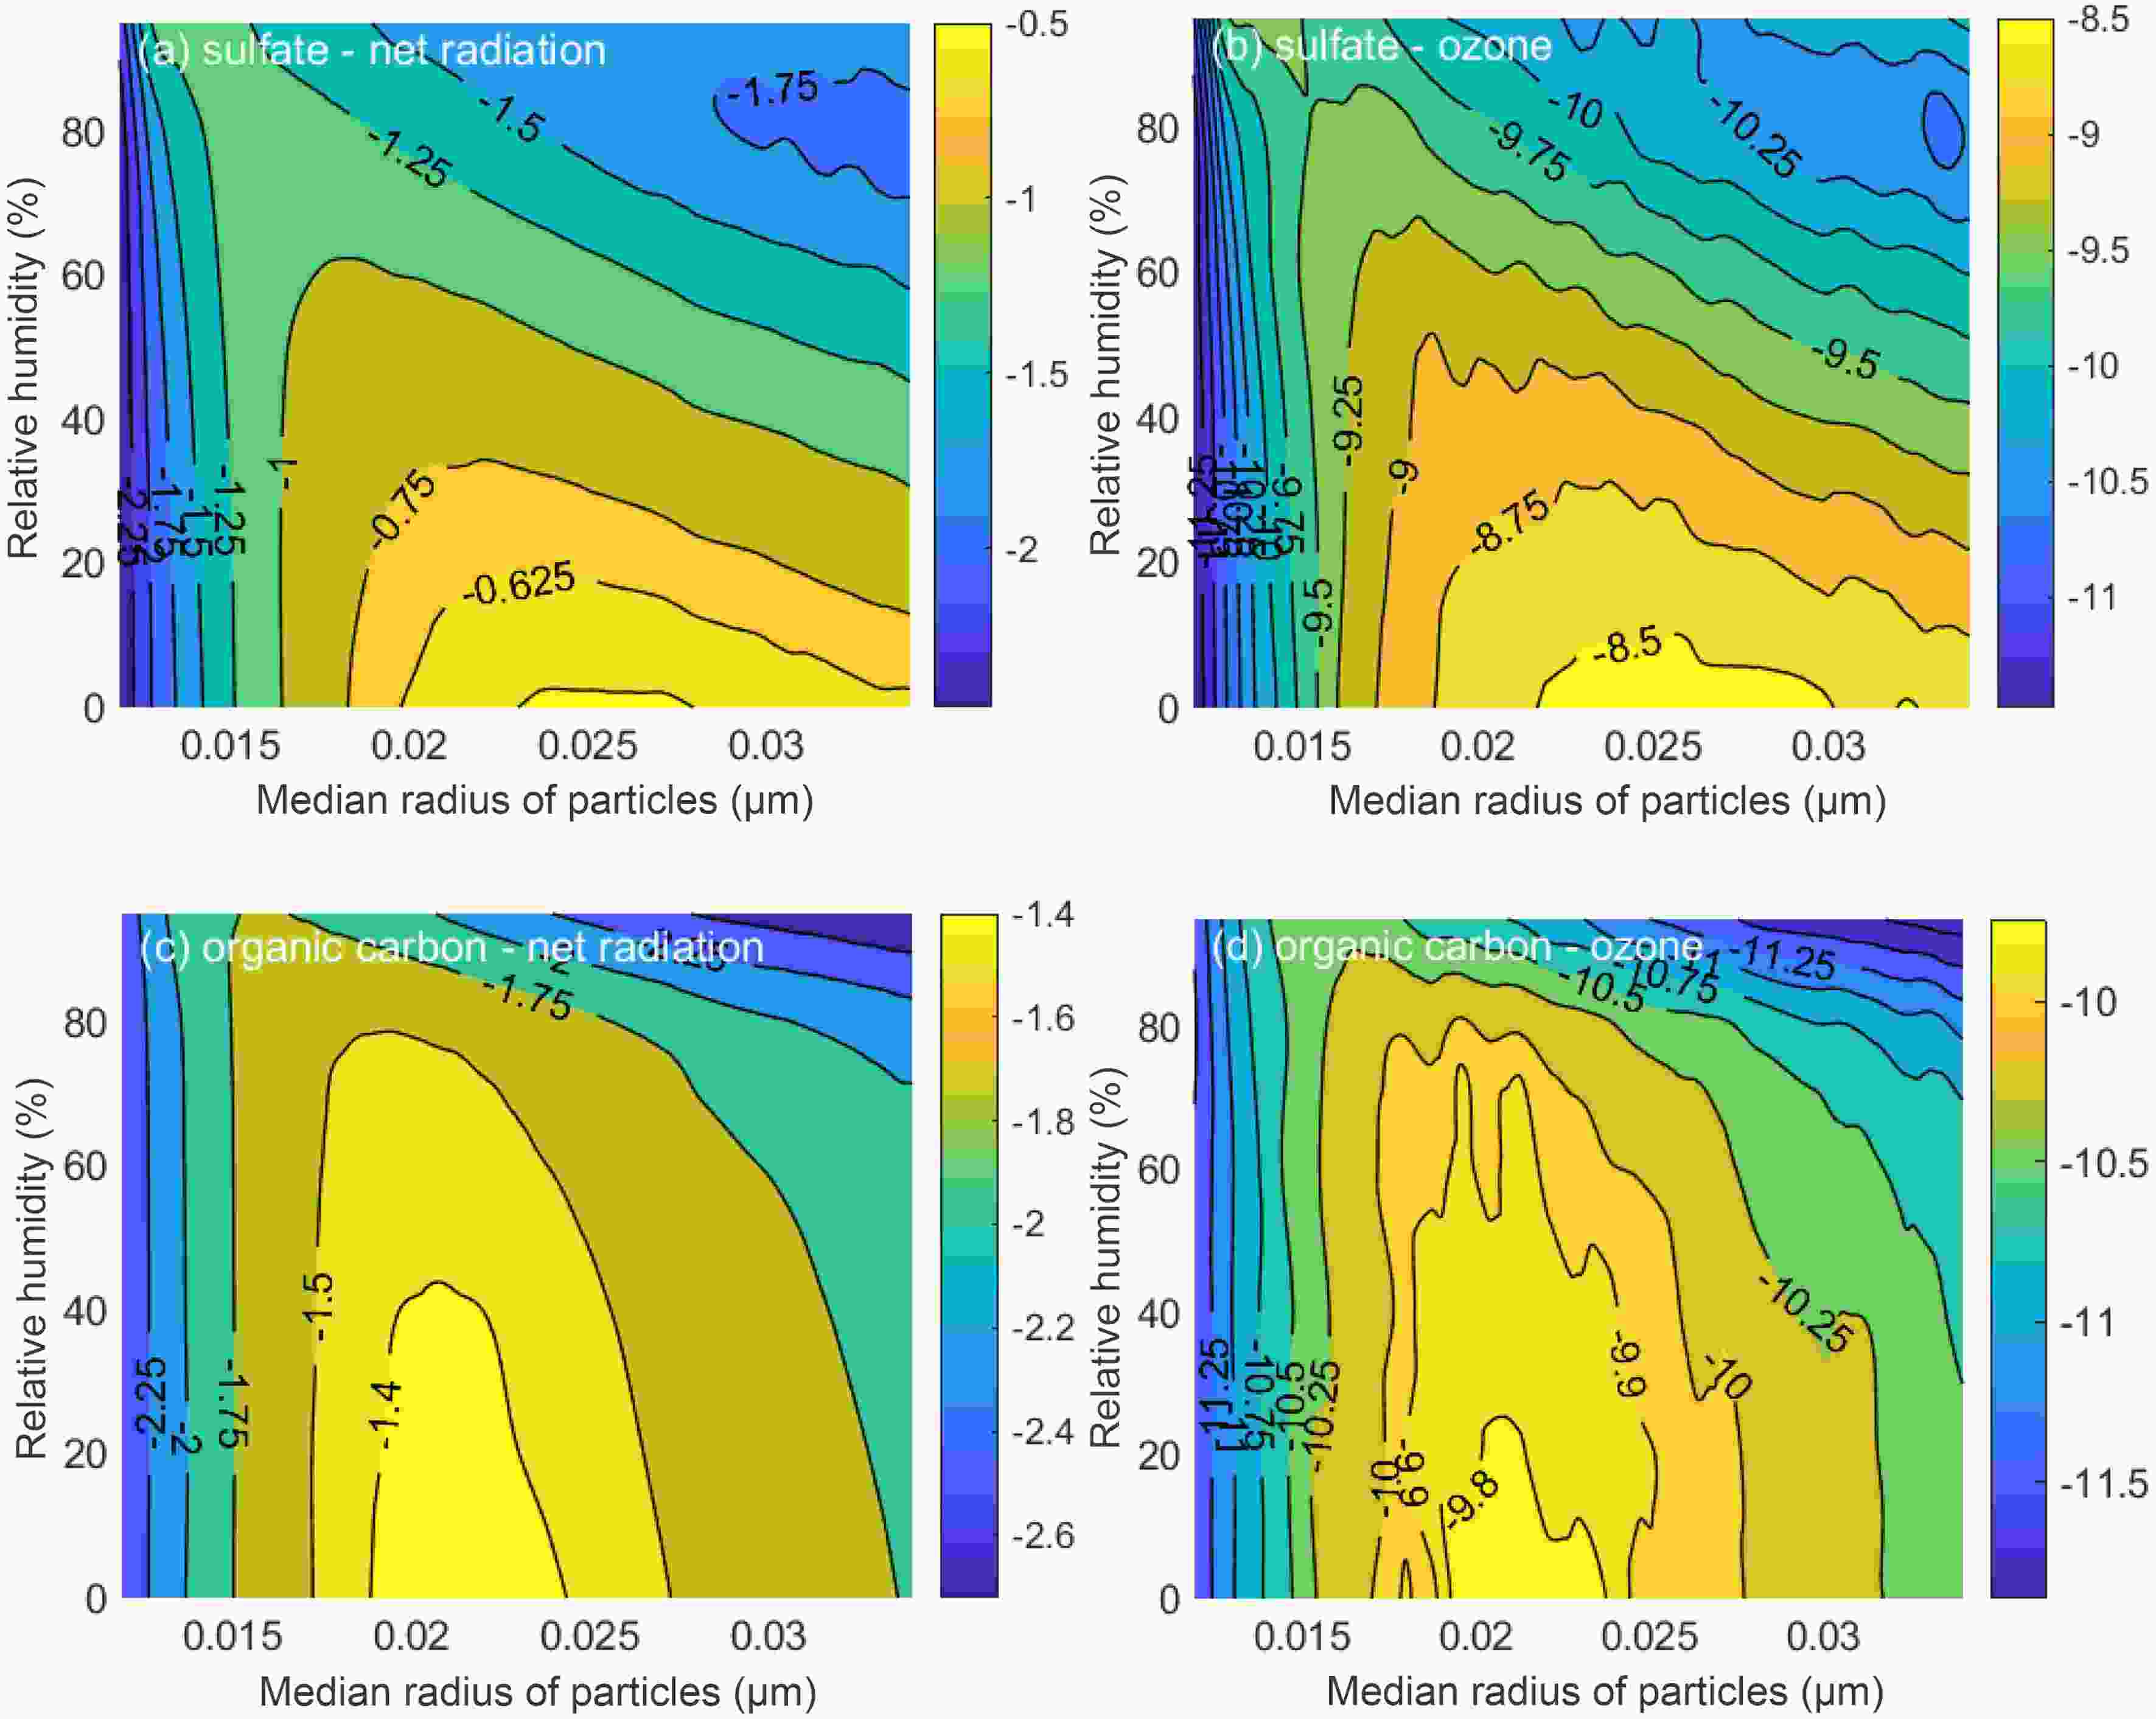
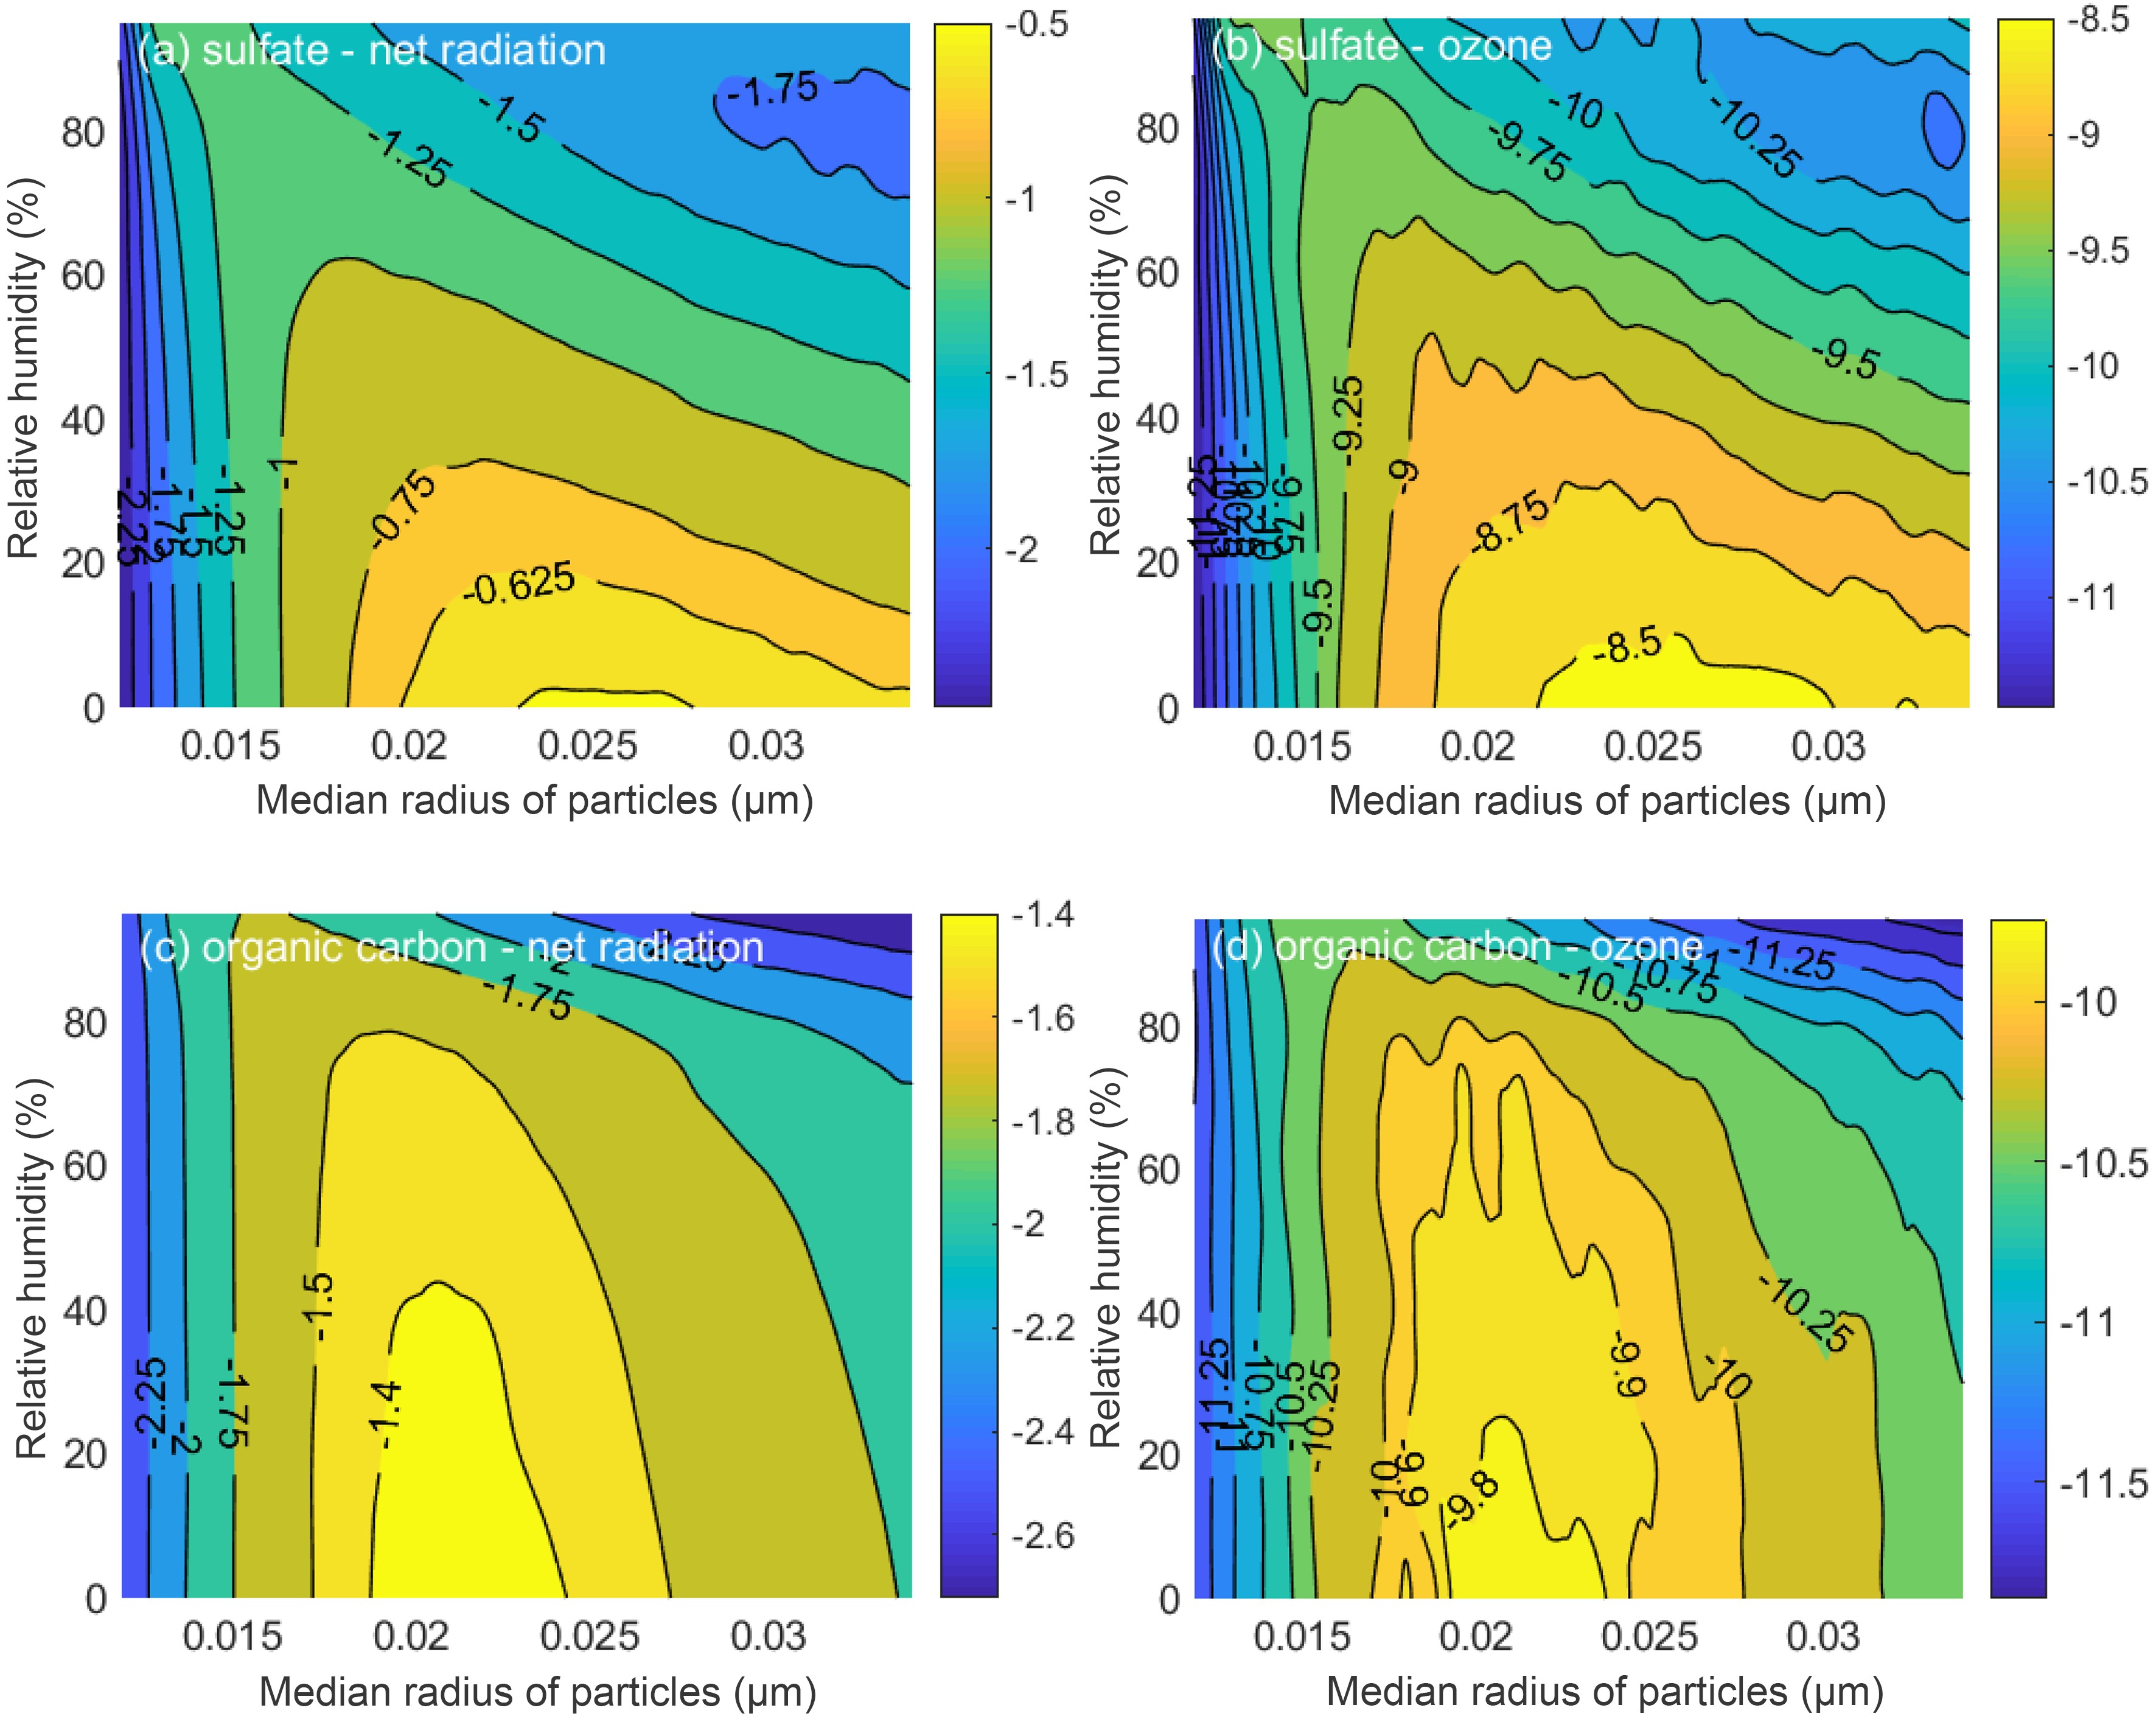
Figure 5. Effects of mixing state on (a) changes in net radiation when the coating is H2SO4, (b) changes in O3 when the coating is H2SO4, (c) changes in net radiation when the coating is OC, and (d) changes in O3 when the coating is OC. The horizontal coordinate is rmod,N in a dry state, which is proportional to the thickness of the coating, while the colored contours represent the values of REONRI and REOO3.

Figure 6. Changes in particle mass and kext when RH is 20% (top) and the coating is H2SO4 (bottom).
Two enveloping substances are considered next, namely, sulfuric acid (H2SO4) and organic carbon (OC). Table 5 shows the relevant parameters of the two enveloping substances, in which k is the moisture absorption parameter. The real and imaginary parts of the complex refraction index of OC are both greater than that of H2SO4, which makes the
$ {{k'}}_{\rm{ext}} $ of BC enclosing OC larger. Therefore, the attenuation of BC to radiation is stronger when the wrapper is OC. The hysteretic parameter of H2SO4 is 1.13, which is much higher than OC. In other words, when the coating is H2SO4, RH has a more significant influence on BC (Fig. 5).Complex refraction index (λ=0.55 μm) ρ (g cm−3) κ H2SO4 1.43 1.83 1.13 OC 1.532−0.013i 1.4 0.1 Table 5. Parameter settings for wrappers.
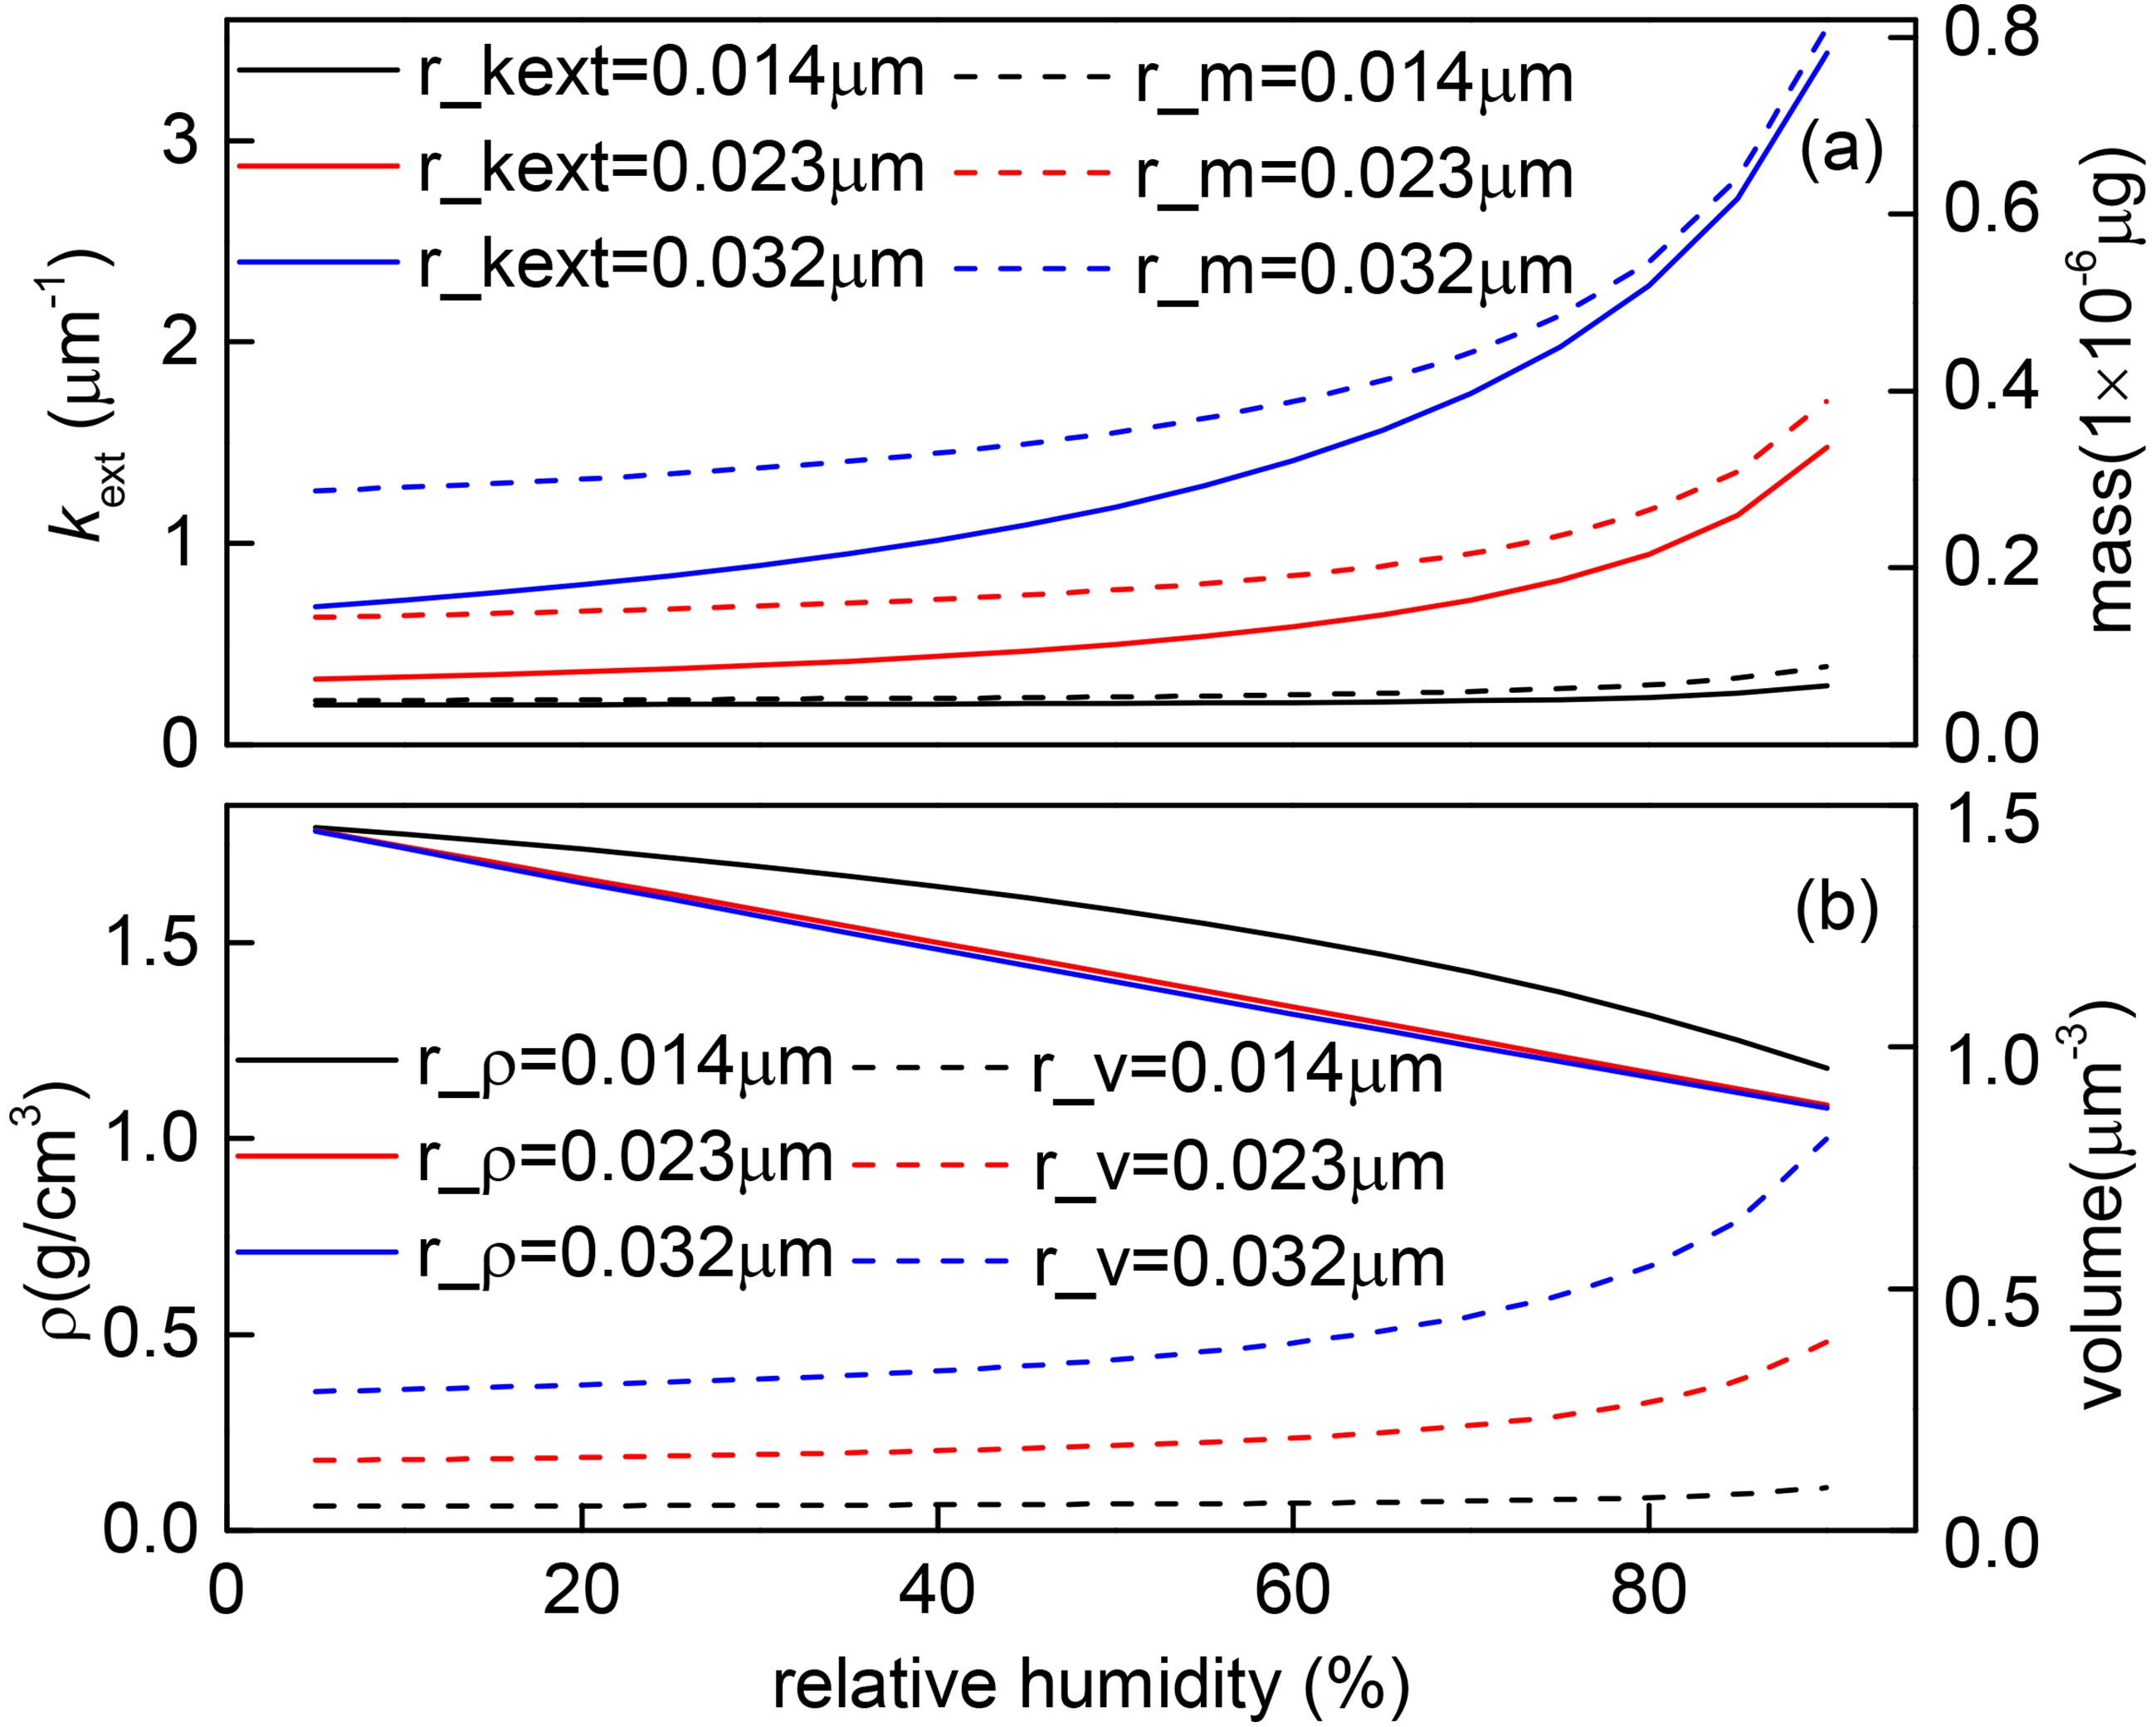
Taking the wrapper of BC being H2SO4 as an example, Fig. 7 describes the change of particle density and other parameters with changes in RH under different particle sizes. With the increase of RH, the density and refractive index of the shell show a monotonically decreasing tendency (Fig. 7b). However, due to the increase of shell hygroscopicity and particle size, the particle volume and extinction coefficient show a monotonically increasing tendency, which is consistent with other studies (Zhang et al., 2017). When the thickness of coating is small (0.012 μm < rmod,N < 0.015 μm), the contour lines are dense and nearly straight. In this case, the hygroscopic growth effect of the shell is weak, kext and mass are almost unchanged (Fig. 7a), and the effect of RH on
$ {{k'}}_{\rm{ext}} $ is very small. When RH increases from 0 to 95%, the attenuation value of net radiation only changes by 0.36%, and the thickness of coating is the main influencing factor. When the thickness of coating is close to the low center value (0.02 μm < rmod,N < 0.025 μm), the contour thinning and curvature increase, the influence of RH on BC begins to increase, and the attenuation value of BC to radiation increases with the increase in RH. When the thickness of coating is large (rmod,N > 0.025 μm), the hygroscopic growth effect of the coating is more obvious, and mass and kext increase significantly (Fig. 7a). In this case, BC reduces the net radiation by 1.25%, with this attenuation effect mainly being caused by the change in RH.
Figure 7. The change process of optical parameters with RH when the coating is H2SO4.
-
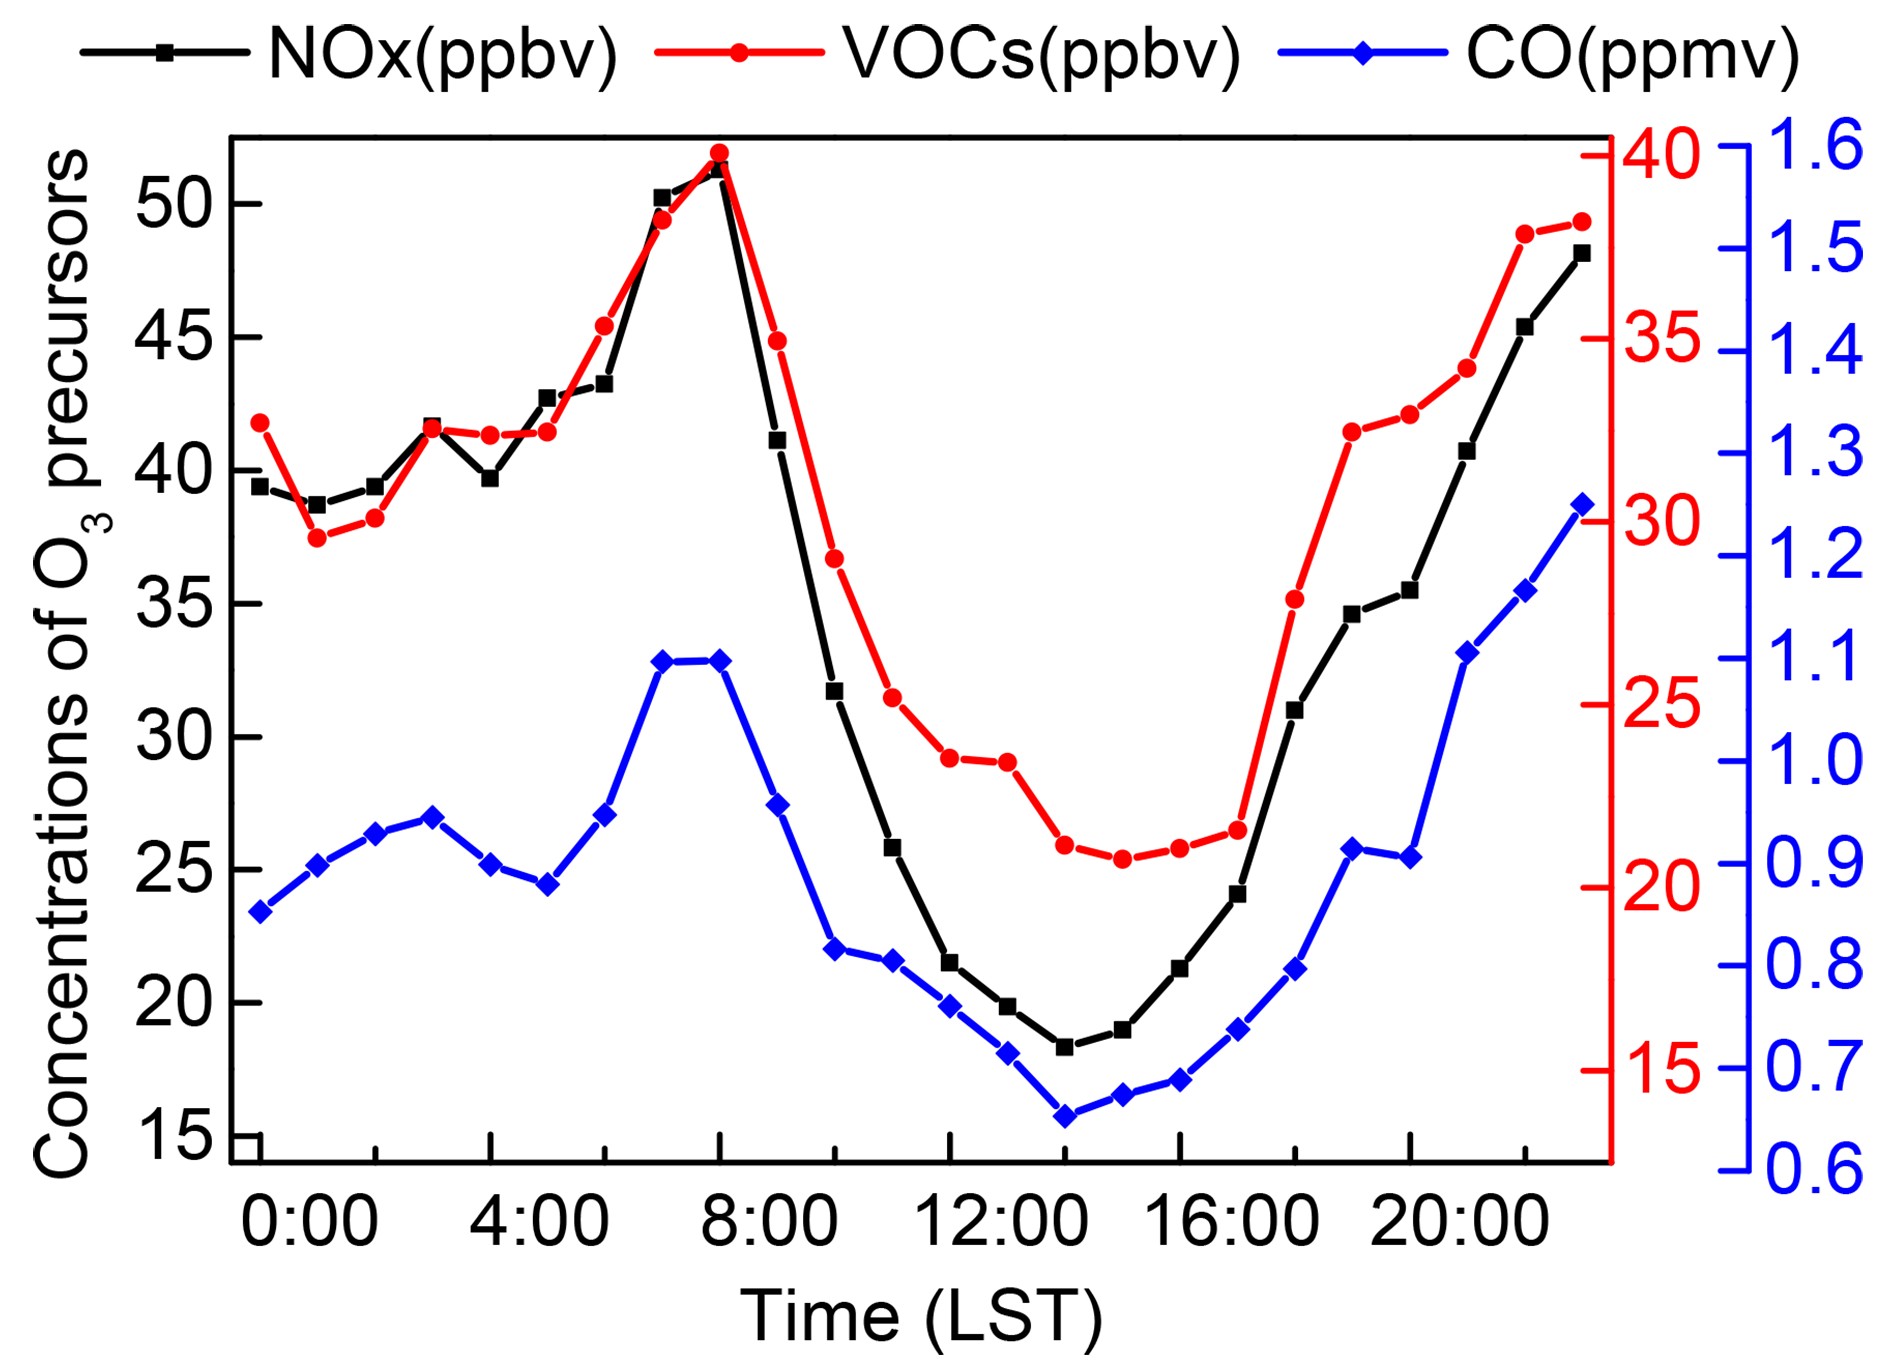
When using the NCAR MM model to calculate the change of O3, the hourly concentration value of O3 precursors is taken as the limiting condition of the model and as input to the model. In the model simulation, the data of O3 precursors from the days with no precipitation and wind speed less than 4 m s−1 in the northern suburbs of Nanjing in 2014 are used. Figure 8 describes the diurnal change process of NOx, VOCs, and CO in the northern suburbs of Nanjing for the selected days. The diurnal variations of the three factors are consistent: the concentration reaches the highest value at 0800 LST and the lowest at 1400 LST.
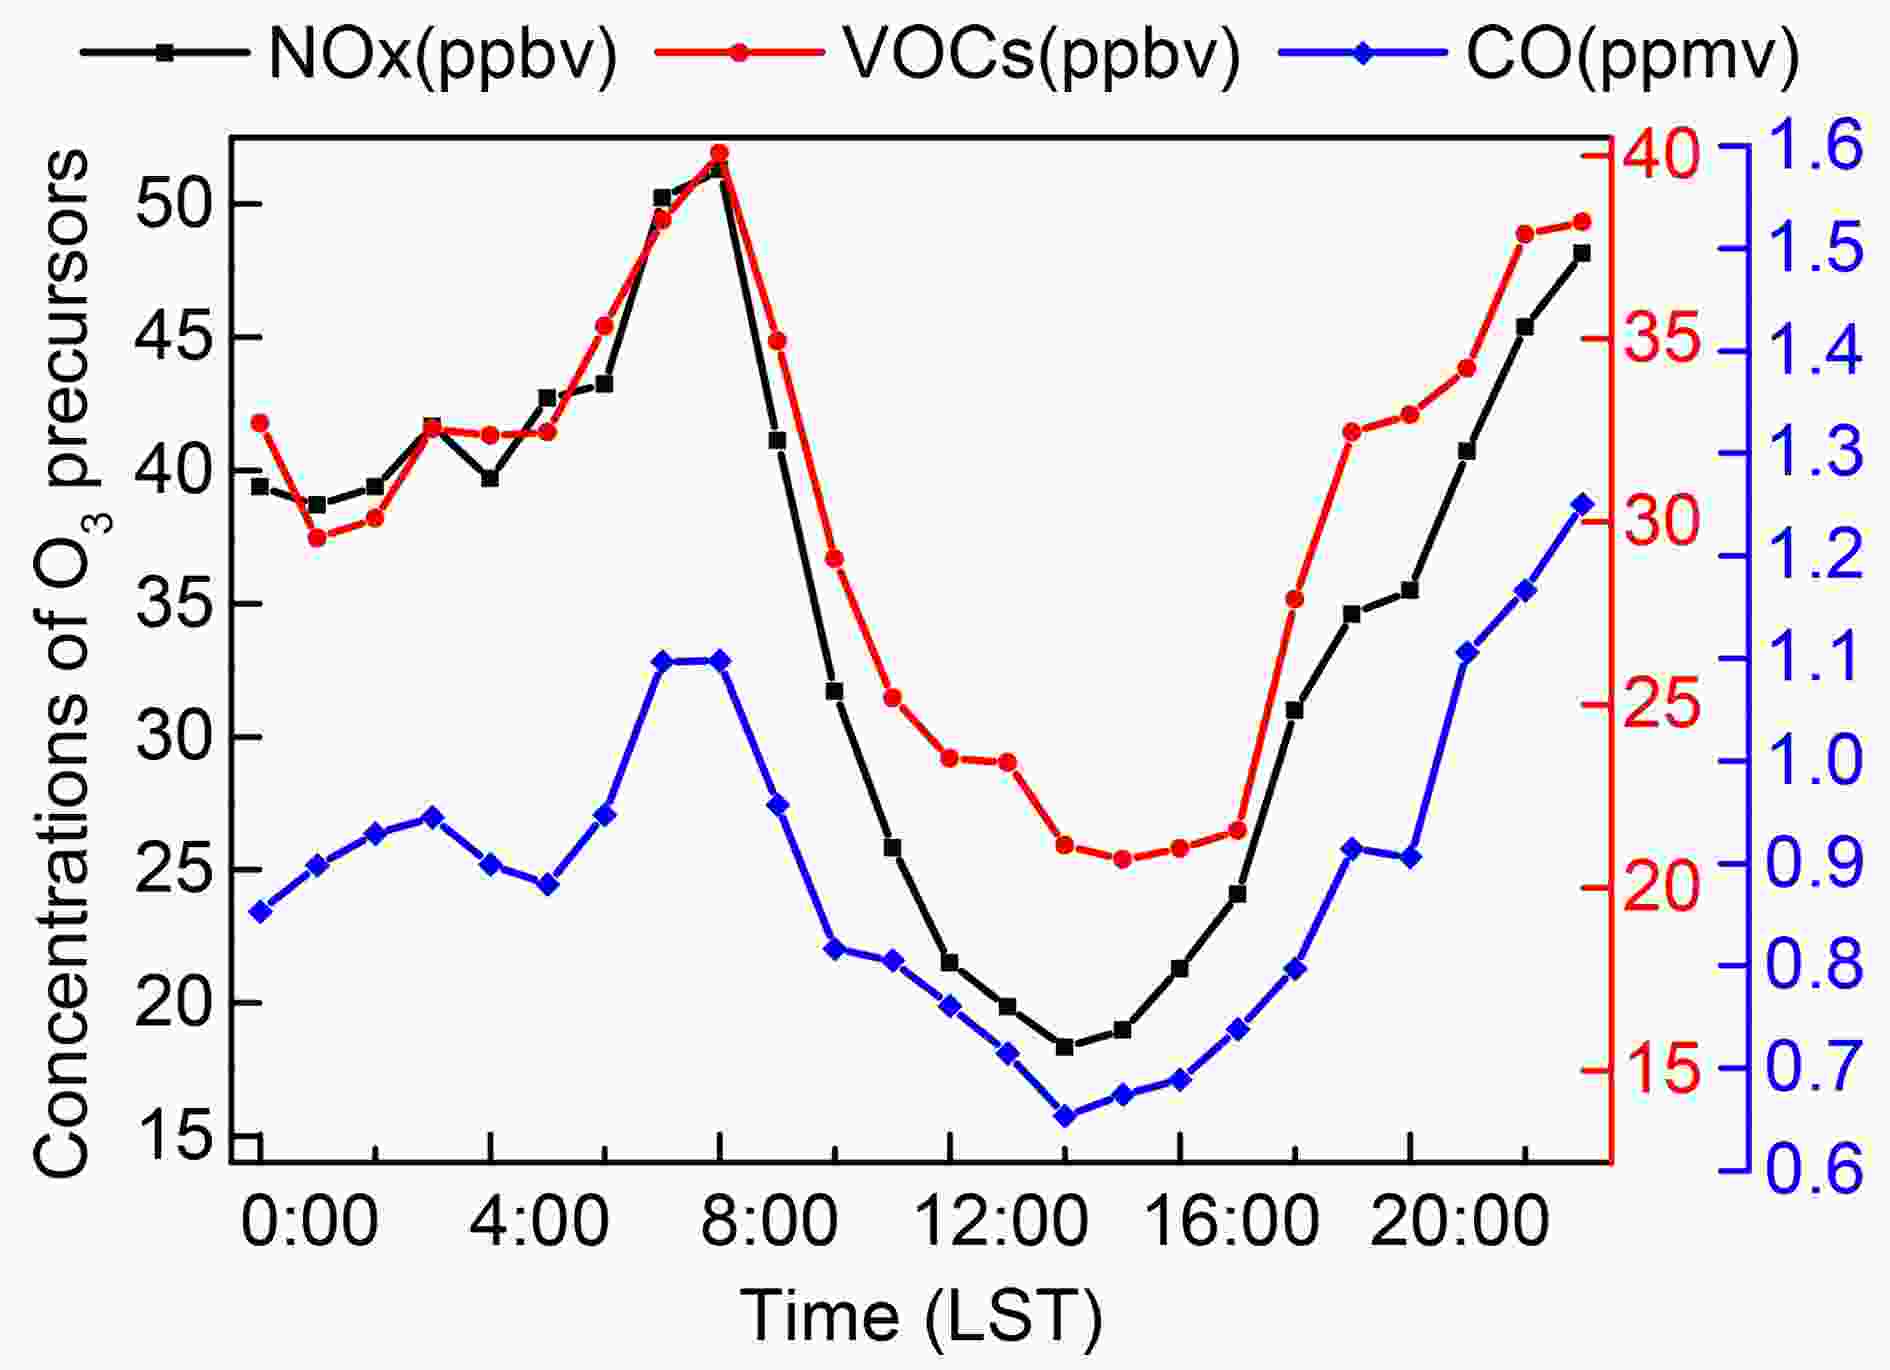
Figure 8. The diurnal variation process of NOx, VOCs, and CO in Nanjing in 2014.
In addition to the influence of O3 precursors, radiation is the most critical factor for O3 (Sillman, 1995). In the calculations, when conditions for O3 precursors are consistent, the net irradiance is significantly correlated with O3 (R=0.997), so radiation and O3 in all schemes show similar variation tendencies (Figs. 3–5) (the impact of O3 concentration changing with BC radiative effect is described in section 3.1). The higher the mass concentration of BC, the greater the attenuation to O3 will be (Fig. 3b). With the increase of rmod,N, the decay of fresh BC to O3 first increases and then decreases, and O3 concentration decreases by approximately 10.13%–13.11%. When BC undergoes a mixing process, O3 concentration is reduced by approximately 8.13%–11.94%. The attenuation value of O3 is consistent with that of radiation with respect to changing with the thickness and relative humidity of the coating. From what has been discussed above, when the BC to PM2.5 ratio is 5% in Nanjing, the change in the attenuation of BC to radiation is approximately 0.98%–1.71%, and the change in attenuation of BC to O3 can reach approximately 1.63%–2.57% due to different spectral distributions of BC; changes in the attenuation of BC to radiation and O3 are approximately 0.94%–1.97% and 1.54%–3.06%, respectively, due to different mixing processes of BC.
In both fresh BC and mixed BC, the attenuation of O3 fluctuates greatly as the particle size of BC changes. This is due to the effects of w, g, and
$k{'_{{\rm{ext}}}}$ . In addition to$k{'_{{\rm{ext}}}}$ , other optical parameters such as w and g increase with an increase of rmod,N, which leads to decreases of the w and g of the mixed aerosol, but the reductions are very small at 0.02 for each. The energy of a particle is converted into its internal energy by absorption. However, scattering merely changes the forward momentum into momentum in other directions, and there is still a part of the forward momentum component. Therefore, when calculating the loss caused by particles (${\sigma _{{\rm{pr}}}}$ ), this part of the forward component should be deducted [Eq.(5), Sheng et al., 2013]:After the maximum point,
$ {{k'}}_{\rm{ext}} $ shows a decreasing tendency and the irradiance increases with it. At this time, w and g, which show a slight decreasing tendency for the mixed aerosol, have the effect of reducing the irradiance, and that causes the drastic fluctuations of REONRI and REOO3.To further analyze the influence of radiation on the pathway of O3 generation after the attenuation effect of BC on radiation, the NCAR MM model is used to simulate the concentration of O3 (φO3) in the northern suburbs of Nanjing in 2014, and an EKMA curve for the Nanjing area is established (Fig. 9). The volume fraction of O3 precursors, such as NOx, and the proportion of alkanes, olefins, and aromatic hydrocarbons in VOCs, etc., are all based on average values of their observational data from 0700 to 0900 LST (Table 6). Other meteorological elements, such as temperature, are based on hourly mean values of the annual observation data in 2014. In NOx control areas, OH mainly reacts with VOCs, which have little influence on O3. O3 is more sensitive to NOx, so reducing NOx is beneficial for hindering the generation of O3. At VOCs > 200 ppbc and NOx < 15 ppb (i.e., when the VOCs to NOx ratio is large), the radiation has little impact on O3, and an approximately 0.95 ppb reduction in NOx achieves the φO3 in the control experiment. However, when the volume fractions of NOx and VOCs are close to the ridge line, the effect of radiation is greater. When φO3 remains the same, the difference in NOx concentration corresponding to the two experiments is as high as 6.00 ppb. In the VOCs control area, the reaction of OH and NOx is dominant, and O3 is sensitive to VOCs. In this case, reducing NOx will promote the formation of O3. In this region, radiation has a significant effect on φO3. At VOCs < 150 ppbc, NOx needs to increase by approximately 2.14 ppb for φO3 to be consistent with its value when the radiation dose decreases; at VOCs > 250 ppbc, NOx needs to increase by approximately 9.47 ppb. In addition, radiation can also cause the ridge line of the EKMA curve to shift. When the AOD increases from 0.88 to 1.08, the slope of ridge line (the NOx to VOCs ratio) decreases from 0.090 to 0.083. The original part of the region located in the NOx control area is transferred to the VOCs control area under the influence of radiation.
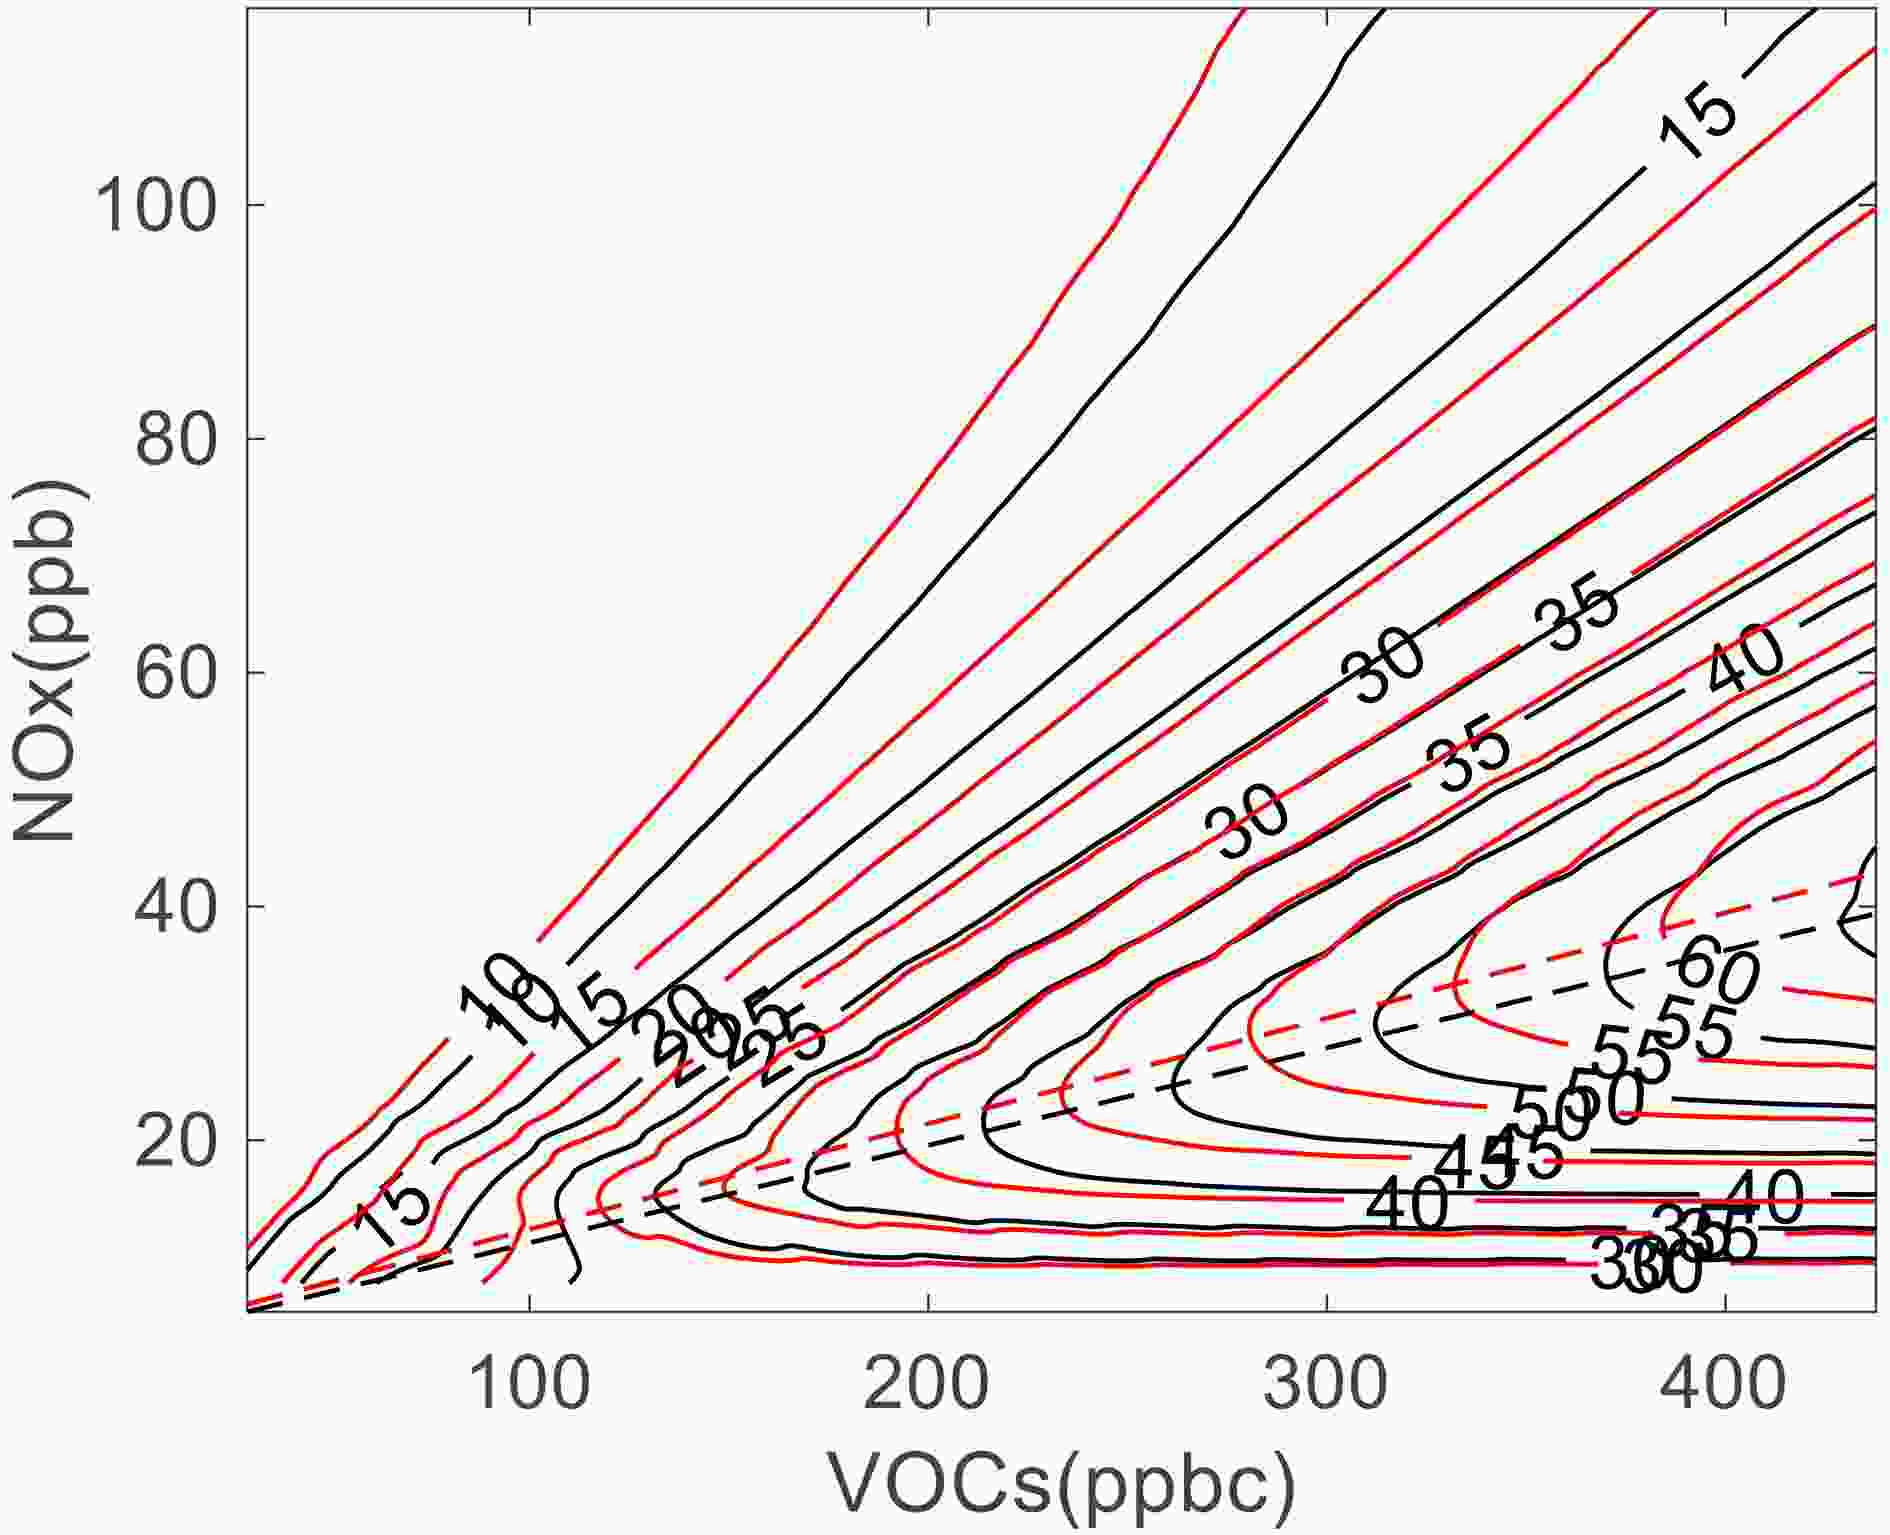
Figure 9. Influence of radiation on diurnal maximum volume fraction curve of O3. The control test (AOD=0.88, PM2.5) is shown as the red curve while the sensitivity test (AOD=1.08, 9%BC+91%PM2.5) is shown as the black curve. The dotted line is the ridge line of the EKMA curve, which is formed by fitting the turning point of each O3 contour line and the boundary between the VOCs control area and the NOx control area.
Short for substance Species Volume fraction NO Nitric oxide 6.37×10⁻⁹ NO2 Nitrogen dioxide 7.90×10⁻⁹ CO Carbon monoxide 1.05×10⁻⁶ C2H6 Ethane 1.81×10⁻⁹ C2H4 Ethene 1.49×10⁻⁹ C3H8 Propane 1.20×10⁻⁹ C3H6 Propene 4.76×10⁻¹⁰ c042 i-Butane 5.36×10⁻¹⁰ c041 n-Butane 6.59×10⁻¹⁰ C2H2 Acetylene 1.72×10⁻⁹ u041 2-Butene 6.67×10⁻¹¹ u043 1-Butene 7.91×10⁻¹¹ c053 i-Pentane 4.44×10⁻¹⁰ c052 n-Pentane 2.74×10⁻¹⁰ c062 2,3-Dimethylbutane 1.05×10⁻¹⁰ c061 2-Methylpentane, 2,2-Dimethylbutane, 3-Methylpentane 3.05×10⁻¹⁰ C6H6 Benzene 6.03×10⁻¹⁰ uu51 Isoprene 6.71×10⁻¹¹ c071 2,4-Dimethylpentane, 2-Methylhexane, 3-Methylhexane, 2,3-Dimethylpentane, n-Heptane 2.01×10⁻¹⁰ c081 2,2,4-Trimethylpentane, 2,3,4-Trimethylpentane, 2-Methylheptane, 3-Methylheptane, n-Octane 2.76×10⁻¹⁰ r071 Toluene 7.59×10⁻¹⁰ r081 m,p,o-Xylene 2.80×10⁻¹⁰ Table 6. Initial values of ozone precursors in NCAR MM.
-
BC can reduce the photolysis coefficient by absorbing solar radiation, thus reducing the near-surface O3 concentration. In this paper, the attenuation degree of BC to radiation is discussed in response to changing the optical properties of BC, including the mass concentration ratio of BC to PM2.5, the spectrum distribution of BC, the thickness of coating, and RH in the internal mixing process. Combined with observed data for O3 precursors in Nanjing in 2014, an EKMA curve was calculated to examine the change in O3 concentration near the ground and pathways for O3 generation after radiation attenuation caused by BC.
For BC, the attenuation generated by radiation is closely related to its mass, and the greater the mass, the greater the influence on radiation. When the mass concentration of the BC to PM2.5 ratio is 5% in Nanjing, the attenuation of BC particles to net irradiance is approximately 0.1%–3.70%, and the range of this attenuation is approximately 0.98%–1.71% and 0.94%–1.97%, respectively, due to different spectral distribution and mixing processes of BC. With the increase of rmod,N, the radiation attenuation of fresh BC tends to increase first and then decrease. With the increase of σ, the radiation attenuation of fresh BC tends to shift to the direction of small particles. The attenuation of BC is strongest when the product of spectral width, effective radius, and π is similar to the wavelength. After BC goes through a mixing process, the attenuation value of radiation presents an upward tendency with an increase in RH, but it first decreases rapidly and then increases slowly with the increasing thickness of coating. When rmod,N < 0.015 μm, the effect of RH is very small and the thickness of coating is the main factor affecting the attenuation capacity of BC. When rmod,N > 0.025 μm, the moisture absorption of coating increases significantly, with RH as the main influencing factor.
It is found that when O3 precursors are unchanged, net irradiance is significantly correlated with O3 (R=0.997), so in the process of changing with changes in BC optical parameters, radiation and O3 show highly similar change tendencies. When the ratio of BC to PM2.5 increases to 5% in Nanjing, O3 can be reduced by approximately 8.13%–13.11%, and the range of this attenuation is approximately 1.63%–2.57% and 1.54%–3.06%, respectively, due to different spectral distribution and mixing processes of BC. The attenuation effect of BC on radiation not only significantly reduces O3 concentration but also changes the EKMA curve. In the VOCs control area, the effect of radiation on φO3 is relatively significant. When radiation changes while φO3 stays the same, the difference in NOx concentration is approximately 2.14–9.47 ppb. In the NOx control area, only when the volume fraction of NOx and VOCs is close to the ridge line, the effect of radiation is obvious, and the difference in NOx concentration is approximately 6.00 ppb, at the most, when φO3 stays the same. In addition, when the AOD increases from 0.88 to 1.08, the slope of the ridge line (the NOx to VOCs ratio) decreases from 0.090 to 0.083 (i.e., when the AOD changes by 17.15%, the NOx to VOCs ratio will decrease by 8.27%), and part of the original NOx control area will be transferred to the VOCs control area.
Acknowledgements. This work was supported by grants from the National Key Research and Development Program of China (Grant No. 2017YFC0210003), the National Natural Science Foundation of China (Grant No. 42075177), and the Qing Lan Project.
| Complex refraction index (λ=0.55 μm) | rmod,N (μm) | σ (μm) | ρ (g cm−3) | |
| PM2.5 | 1.47−0.014i | 0.0873 | 0.43 | 1.6 |
| BC | 1.75−0.44i | 0.0118 | 2 | 1.8 |


 AAS Website
 AAS WeChat