


 DownLoad:


-
Nitrogen dioxide (NO2) is an important trace gas in the troposphere. It plays a pivotal role in atmospheric chemistry by participating in the formation of tropospheric ozone (O3) and nitrate aerosols (Varshney and Singh, 2003). In China, the 90th percentile of the maximum average O3 concentration has trended higher, with the mixing ratio increasing from 64 to 79 ppb from 2013 to 2017 (Wang et al., 2020b). Another study demonstrated that nitrate aerosols are more important than sulfate aerosols during severe pollution episodes in Beijing (Tan et al., 2018a; Wang et al., 2020b). Therefore, studies on the variation in NO2, as a precursor of O3 and nitrate aerosols, are very important to better understand their formation and influencing factors (Tang et al., 2021a, b).
Since the implementation of the State Council’s Air Pollution Prevention and Control Action Plan (the Clean Air Action), China’s environmental air quality has notably improved (Wang et al., 2020b). However, while the tropospheric NO2 columns have greatly decreased (Zhang et al., 2019), the surface NO2 concentrations have slowly decreased or even distinctly increased at certain locations (Wang et al., 2020b). To address this problem, we need comprehensive horizontal and vertical observations. Since regular ground monitoring can only provide information horizontally, it is necessary to observe NO2 in the vertical direction to control the NO2 concentration in all aspects.
There are several vertical observation methods, including tower-based observations, tethered balloon observations, aircraft aerial surveys, ground-based remote sensing, and satellite observations. Given the tower height, tower-based in situ observations only measure the near-surface atmosphere (Meng et al., 2008; Sun et al., 2010; Li et al., 2020). With onboard instruments, balloons and aircraft detect a wide range of heights but do not meet the needs of continuous monitoring (Glaser et al., 2003). Satellite observations cover a large area, but the measured results are usually underestimated (Celarier et al., 2008; Ma et al., 2013; Chan et al., 2019). Thus, satellite observations usually reveal a low observation accuracy (Ma et al., 2013). As a spectral remote measurement method, multiaxis differential absorption spectroscopy (MAX-DOAS) is a no-contact and high-accuracy detection method upon which long-term and real-time online monitoring can be performed, and this method does not require gas sampling or calibration. Therefore, it has been widely applied to acquire tropospheric column information on NO2 and other pollutants in various regions and has become a new technique for the measurement of atmospheric pollutant gases and aerosols (Wittrock et al., 2004; Wagner et al., 2011; Tan et al., 2018b).
In recent years, much comparison and verification work has been executed concerning the inversion results of aerosols and their precursors determined by MAX-DOAS. Although the formaldehyde and NO2 concentrations determined by MAX-DOAS suitably compare to those determined by the scanning imaging absorption spectrometer for atmospheric cartography and Ozone Monitoring Instrument satellites (Vigouroux et al., 2009; Chan et al., 2019), the MAX-DOAS measurement results demonstrate a low sensitivity above 2.5 km and exhibit low seasonal amplitudes (Vigouroux et al., 2009). In addition, clean areas yield higher correlations than polluted areas (Chan et al., 2015). Recently, MAX-DOAS observation results have been comprehensively verified against aircraft aerial survey data, and it has been found that the NO2 and sulfur dioxide results are notably better than the formaldehyde results, while the NO2 results are better than the sulfur dioxide results in the presence of clouds (Wang et al., 2019). The trace gas profiles obtained via inversion are different when various a priori profiles are adopted as input.
Although many comparisons and verifications have been conducted, most of these verifications were based on satellite-observed column densities and near-ground observation results. Hence, it is urgent to verify the vertical profiles retrieved by MAX-DOAS against conventional vertical detection results. In this study, MAX-DOAS observation and comparison experiments were performed in Beijing in spring. By comparing in situ measurements and the tropospheric monitoring instrument (TROPOMI) satellite observations, we analyzed the applicability of MAX-DOAS as well as the diurnal and vertical evolution characteristics of NO2 at the experimental site.
-
A MAX-DOAS instrument was set up on the roof of the building of the Chinese Academy of Meteorological Sciences, which has a height of approximately 40 m. The tower is 9 km away from Iron Tower Branch, Institute of Atmospheric Physics, Chinese Academy of Sciences (39.974°N, 116.372°E), which is surrounded by buildings with heights ranging from 30−60 m. At a distance of 200 m to the east of the tower, the Beijing-Tibet Expressway runs north-south, and 50 m to the north, the Beitucheng West Road runs east-west. In addition, there are no factories around the experimental sites, and the important emission sources come from vehicles.
-
MAX-DOAS relies on a Skype-2D-200 system, which acquires observations parallel to the tower direction. It is mainly composed of a telescope, two spectrometers (AvaSpec-ULS2048 L-USB2; UV range: 296−408 nm; visible range: 420−565 nm), a spectrometer incubator, a two-dimensional rotating platform, and a computer for control and data acquisition purposes. Approximately 15 minutes are required to complete a scan, while the elevation angle of the telescope is set to 6°, 8°, 10°, 15°, 30°, and 90°, and below 6°, the angle is increased at steps of 1°. Detailed processing after observation is shown in Text S1 in the electronic supplementary material (ESM).
With oxygen dimer differential slant column densities (dSCDs) retrieved through a specific algorithm (please refer to section 2.2.2) and the subsequently retrieved aerosol extinction, NO2 vertical profiles are finally obtained combined with the NO2 slant column densities (SCDs) observed at the different elevation angles. In this study, we considered data with a solar zenith angle smaller than 75° to avoid the strong influence of stratospheric absorption.
For the comparison of the NO2 column density, we deleted the NO2 vertical column density (VCD) measured by MAX-DOAS at the corresponding time under cloudy weather conditions from 1200−1500 LST (LST = UTC + 8) because the presence of clouds greatly complicates MAX-DOAS measurements concerning the accurate analysis of the tropospheric trace gas VCD. To obtain the NO2 VCD, we need to convert dSCDs using differential air mass factors (dAMFs) by Eq. (1) (Wagner et al., 2010):
The air mass factor calculation is solved using the radiative transfer model (RTM) to describe the absorption path of a gas in the atmosphere.
$ \alpha $ denotes the elevation angle of the telescope. Combined with downloaded TROPOMI observation data, there are 24 data sets for comparison purposes.In terms of the comparison of the NO2 vertical profiles, any anomalous measured tower-based in situ values were eliminated, and the MAX-DOAS observation data were screened according to a relevant threshold. First, the retrieved NO2 data were deleted when the chi-square value exceeded 200, the relative error of the NO2 VCD exceeded 50% or there was less than one degree of freedom (DF), and any anomalous points were then deleted from the MAX-DOAS observations. Second, because clouds greatly influence the MAX-DOAS detection method, we deleted any MAX-DOAS data measured under cloud cover based on the aerosol optical depth (AOD) level 1.5 (cloud-shielded) data measured by the CIMEL automatic solar photometer obtained from the AERONET website. Since MAX-DOAS inverts the AOD at a wavelength of 360 nm, only the corresponding moment when the AOD is not missing at wavelengths of 340 and 380 nm on the AERONET website is regarded as a cloud-free moment, and the NO2 data measured by MAX-DOAS at the corresponding moment are then retained. In addition, the all-day AOD not detected according to the AERONET website was regarded as indicating cloud cover, whereby all the associated MAX-DOAS-observed NO2 data were deleted. The method of deleting some data to avoid the influence of clouds was introduced in a previous study (Wagner et al., 2014), and we also performed an analysis in the case where clouds were not removed, as shown in Fig. S1 in the ESM.
-
Vertical profiles of the aerosols and NO2 are obtained by the HEIPRO inversion algorithm (Heidelberg Profile, developed by the IUP of Heidelberg University, Germany) (Frieß et al., 2006, 2011). This inversion algorithm is based on the optimal estimation method (Rodgers, 2000), with the use of RTM SCIATRAN as the forward model of the inversion approach, and the minimized value function
$ \;{\chi }^{2} $ is adopted to determine the optimal estimated state quantity between the measurement and prior information, thereby calculating the state quantity most closely approaching the real atmosphere through inversion. The inversion expression is as follows:where
$ {{F}}({{x}},b) $ is the forward model of the physical properties of the system, i.e., the RTM,$ {{x}} $ is the aerosol extinction coefficient or the trace gas concentration in a series of discrete height intervals,$ b $ represents the system parameters (pressure, temperature, etc.) not involved in the inversion but impacting the measurement results,$ {{y}} $ represents the dSCDs of the aerosols or trace gases measured at the different elevation angles,$ {{{x}}}_{a} $ is the a priori vector, and$ {{S}}_{\epsilon } $ and$ {{S}}_{a} $ are the covariance matrices of$ {{y}} $ and$ {{{x}}}_{a} $ , respectively. To express the sensitivity of the inversion state$ \widehat{{{x}}} $ relative to the true state$ {{x}} $ , the OEM describes this important inversion property through the averaging kernel (AK) matrix. The AK A is defined as A$ =\partial \widehat{{{x}}}/\partial {{x}} $ . In addition, to reflect the high resolution of the inversion process, namely, the independence of each information layer, we add values to the diagonal of the mean nucleus as DFs to characterize this inversion property, and the more DFs there are, the higher the inversion accuracy is. More specific settings of this retrieval approach are provided in Text S2 in the ESM. -
The atmospheric observation tower is 325 m high, containing 15 observation platforms. Each layer provides continuous observations of meteorological elements and characterizes the vertical evolution of the four key meteorological parameters: wind direction, wind speed, temperature, and relative humidity. We applied ground-based telemetry to obtain the height of the atmospheric boundary layer (BL). To determine the vertical distribution of NO2 concentrations in the area, point instruments were placed on the 60-, 160- and 280-m platforms of the tower, which could achieve the simultaneous observation of these three elevations. NO2 monitoring adopted a NO-NO2-NOx analyzer (model MMS-AC32M) produced by the French ESA company, using the chemiluminescence method to detect the NOx concentration. To provide a stable working environment for the measuring instruments, they were placed in a custom observation box, which was equipped with air conditioning to provide an appropriate operating temperature. A detailed description has been provided elsewhere (Tang et al., 2009, 2012). An enhanced single-lens ceilometer (CL-51, Vaisala, Finland) is installed near the tower to analyze the dilution capability based on strobe laser lidar (laser detection and range measurement) technology. The boundary layer height (BLH) was determined by the gradient method (Steyn et al., 1999) based on the backscatter density (Tang et al., 2016).
-
TROPOMI is the only payload carried on the Sentinel-5 precuS5P satellite launched in October 2017. The transit time is generally 1330 local time. As the next-generation atmospheric composition monitor, TROPOMI inherits the advances of the global ozone monitoring experiment, the scanning imaging absorption spectrometer for atmospheric cartography, and the ozone monitoring instrument with a wider wavelength range and higher spatial resolution. It has a maximum spatial resolution of 7 km × 3.5 km, and an observation period of daily global coverage. In addition, it has three spectral regions, seven bands, and can measure in ultraviolet-visible (270−500 nm), near-infrared (675−775 nm) and short-wave infrared (2305−2385 nm) wavelengths. In this paper, the TROPOMI Level 2 Offline NO2 product of version 1.03.01 was used to extract the time series of NO2 tropospheric column density. The product can be accessed via the Sentinel-5P Pre-Operations Data Hub (
https://s5phub.copernicus.eu/dhus/#/home ). The observation quality of individual pixels depends on many factors, including clouds, surface albedo, spectral saturation, geometric elements, etc. TROPOMI NO2 products provide a "qa_value" for each pixel of observation to provide users of the data with a simple way to filter out inaccurate results. The filtering criteria used in this paper is qa_value > 0.75. Observations at a given location are defined as the mean of valid observations around 0.1° of the included pixels. To reduce the comparison error, this study selected the average MAX-DOAS NO2 VCD from 1200−1500 LST to compare with the TROPOMI NO2 VCD. -
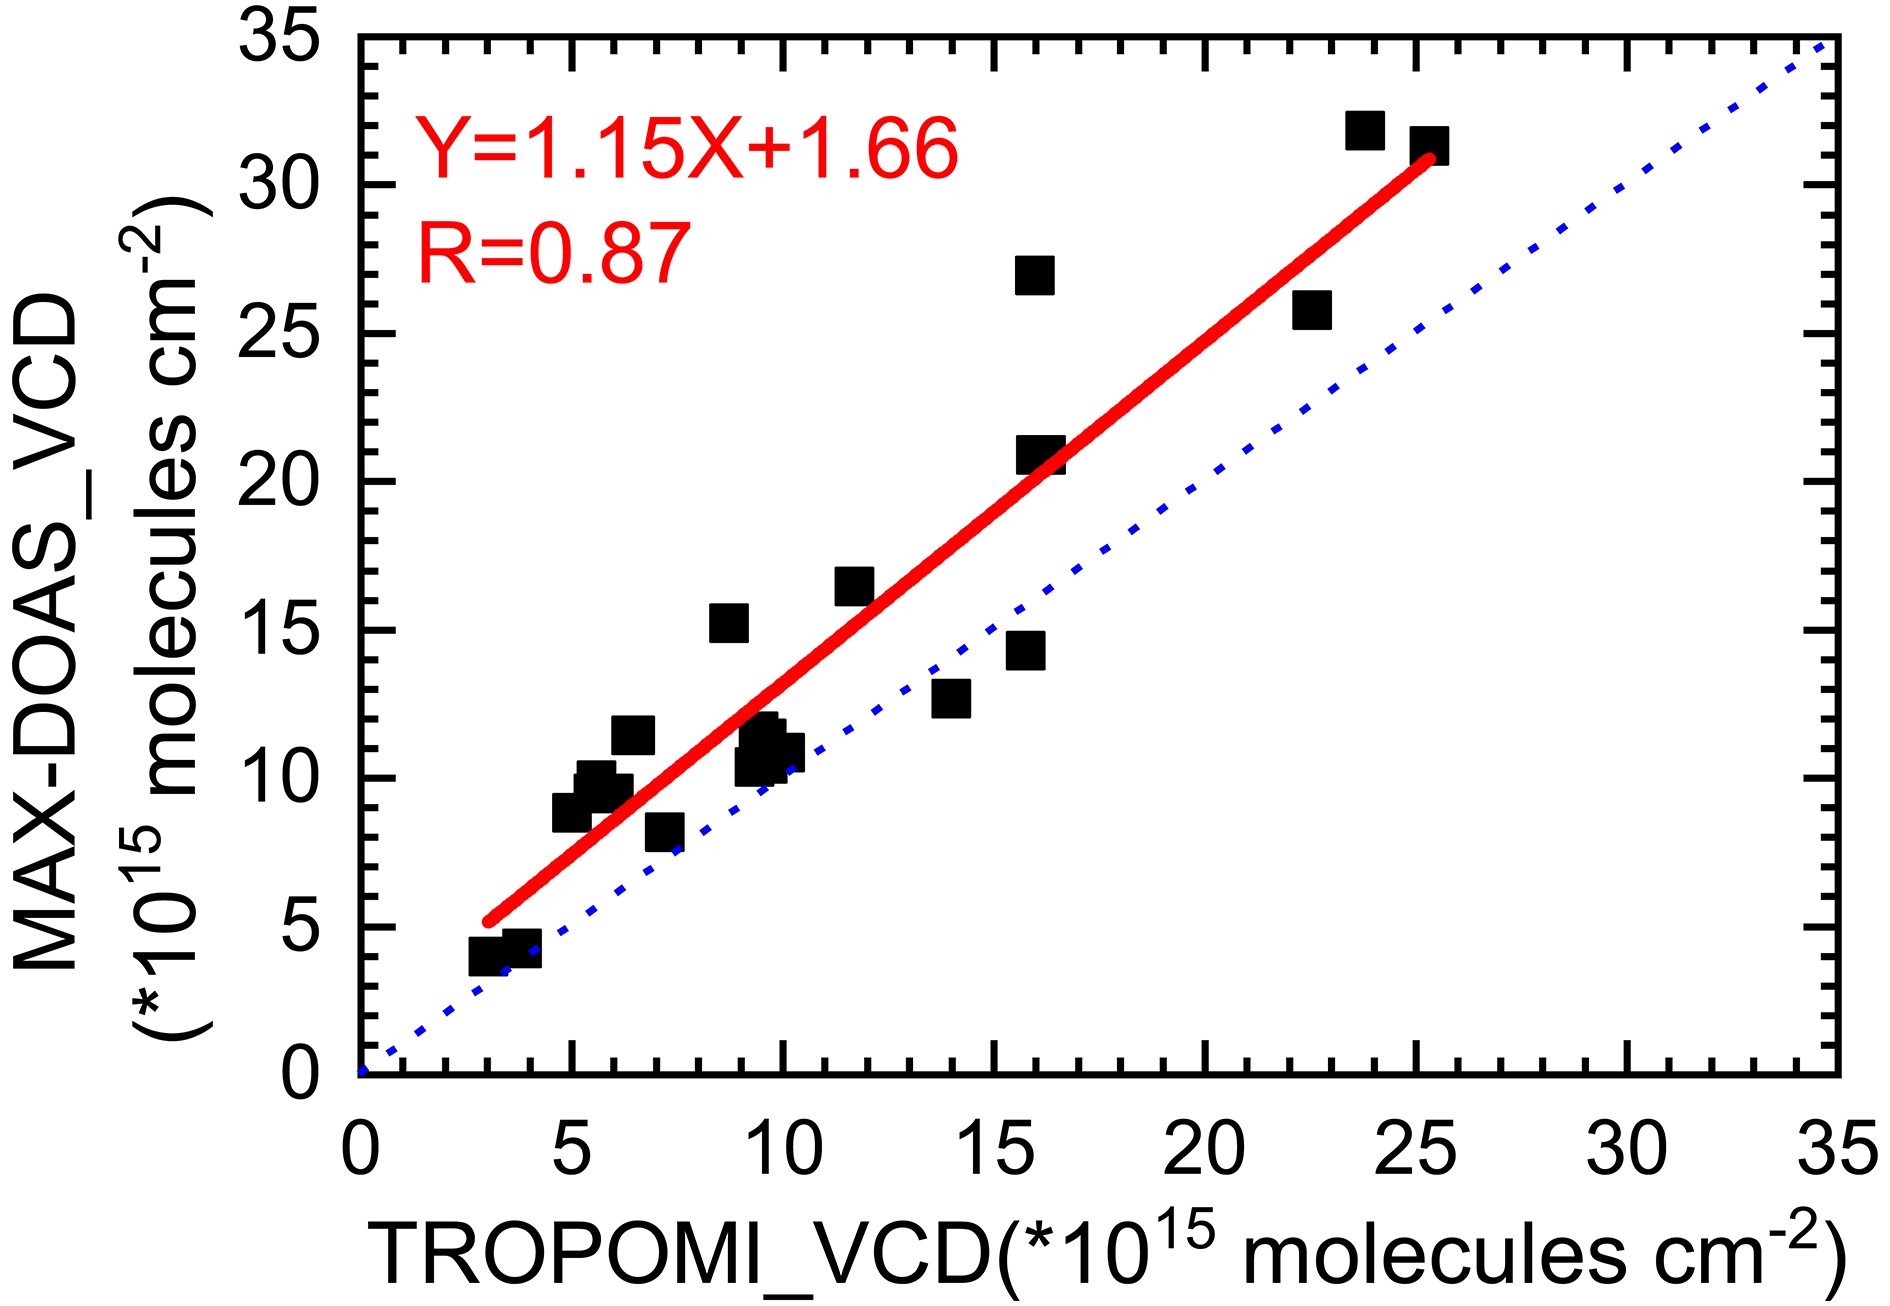
The correlation analysis is shown in Fig. 1. The correlation coefficient R between the two data sets is 0.87, indicating that the NO2 VCD results obtained by the two methods are consistent. The daytime mean NO2 VCDs (in units of 1015 molecules cm−2) varied from 4.0 to 46.5 for MAX-DOAS and from 2.3 to 37.3 for TROPOMI. The average values of the NO2 VCD measured by MAX-DOAS and TROPOMI are 15.8 and 12.4, respectively. In conclusion, the TROPOMI observation results are generally close to the MAX-DOAS observation results with significantly lower average results. Please refer to section 4.1 for the error analysis of the MAX-DOAS and TROPOMI observation results.
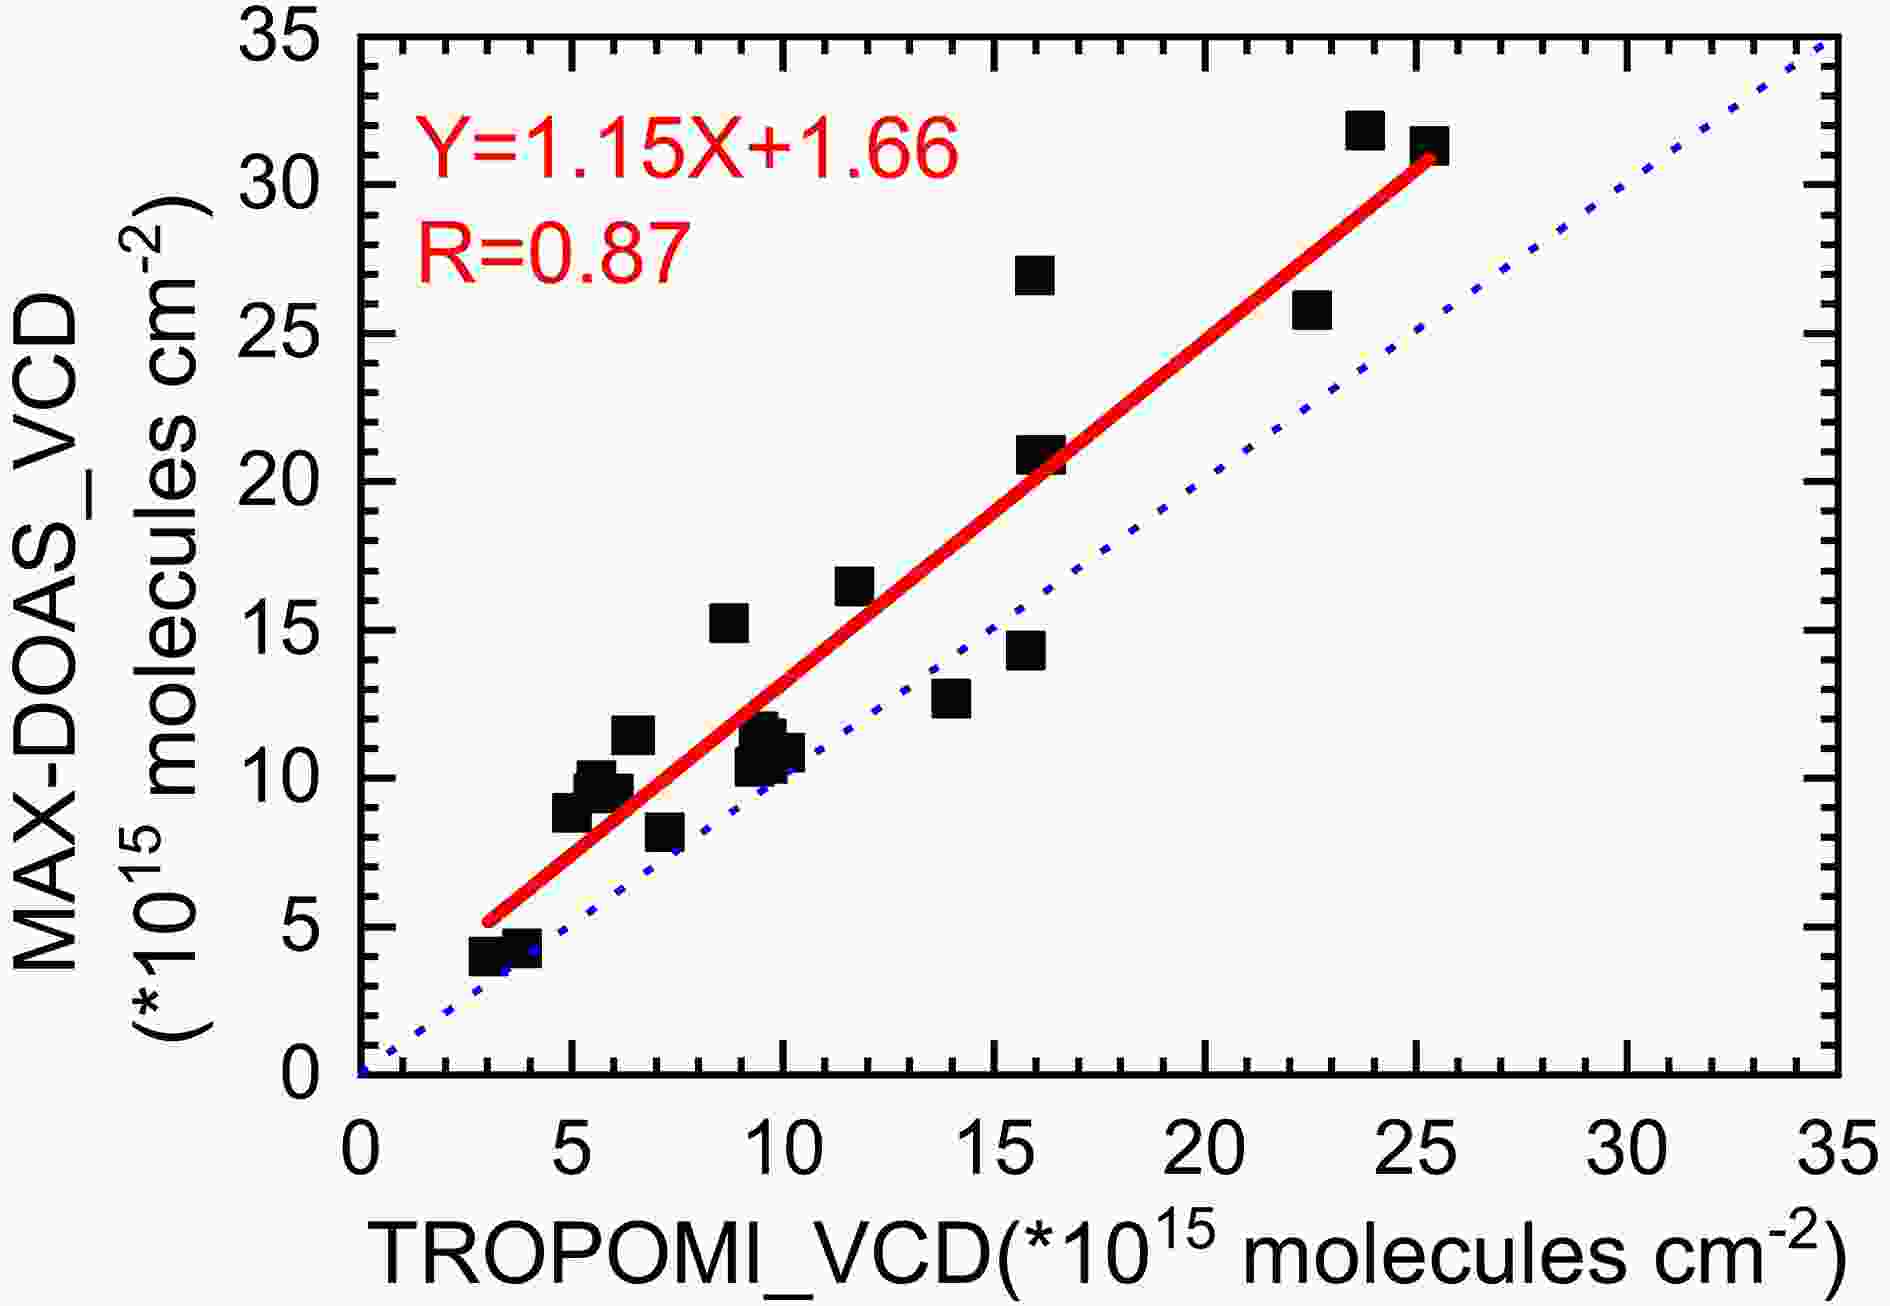
Figure 1. Correlation analysis of the MAX-DOAS and TROPOMI observations from 1 April to 31 May 2019.
-
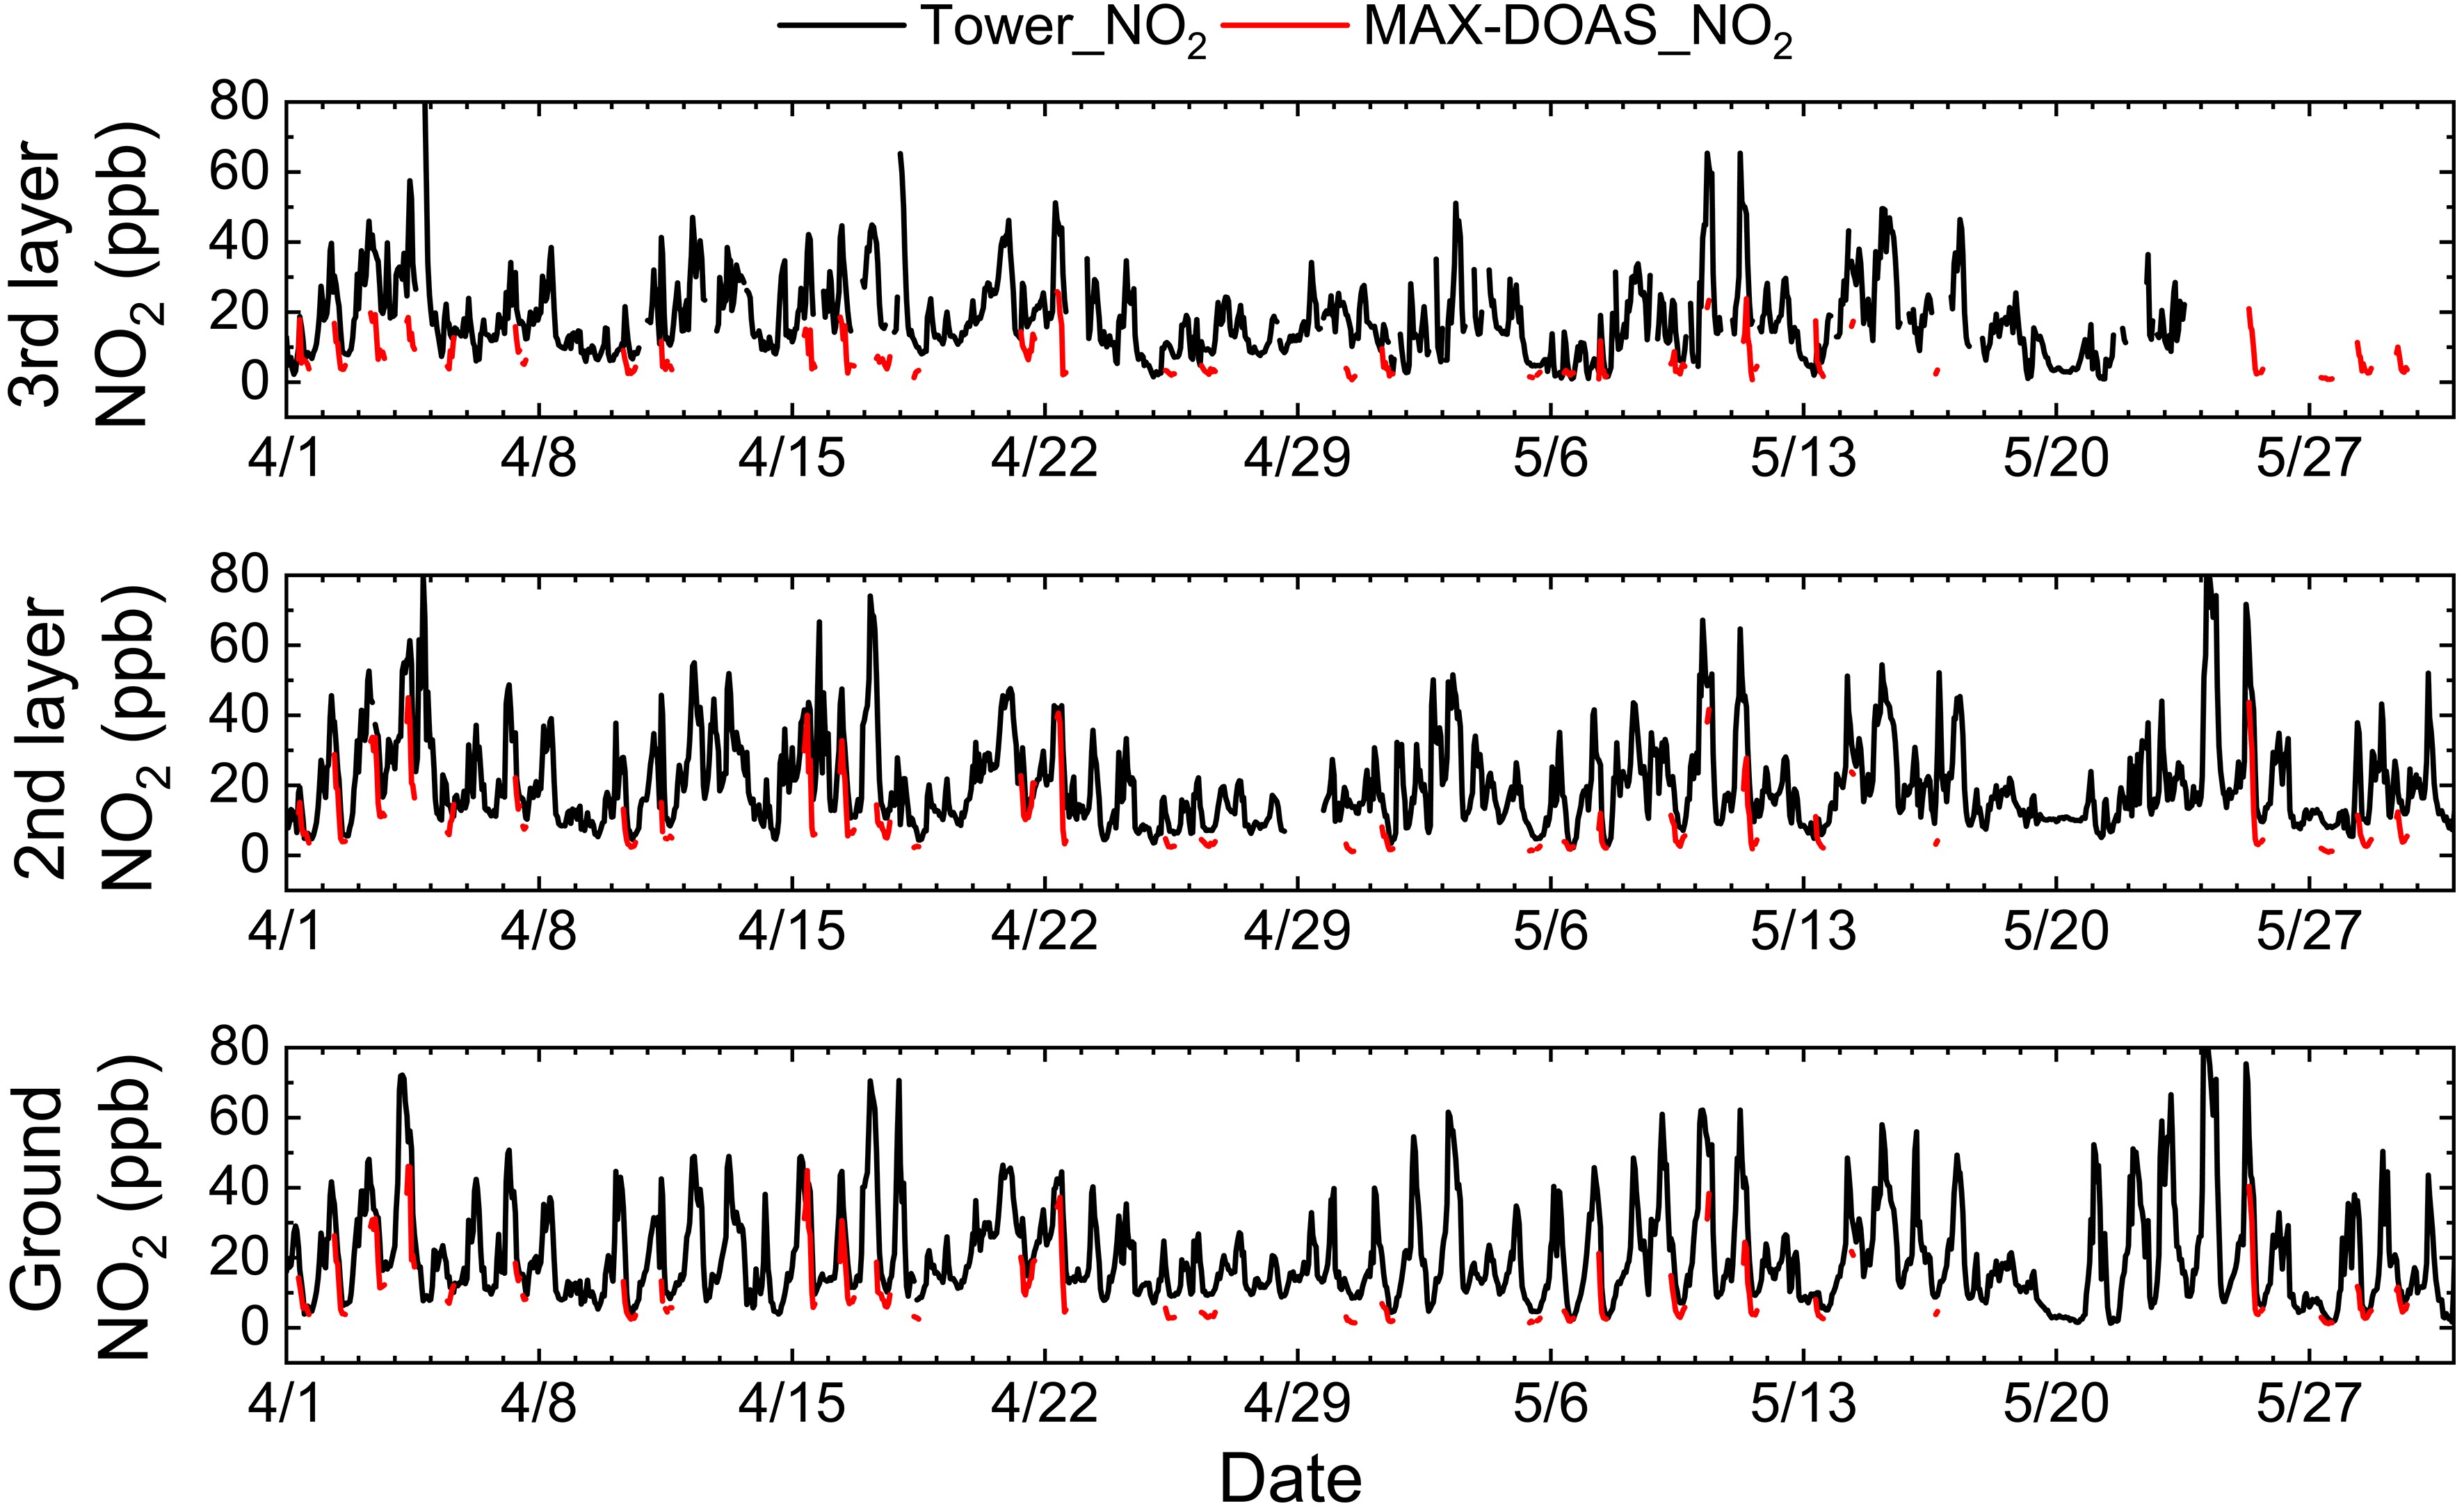
To examine the MAX-DOAS NO2 vertical profile, we selected the first three layers (10−100 m, 100−200 m, and 200−300 m) of the MAX-DOAS NO2 volume mixing ratio (VMR) inversion results and compared them to the in situ NO2 results obtained at 60, 160, and 280 m with the meteorological observation tower in Beijing. Because the MAX-DOAS instrument can only operate during the day when there is sunlight, this study only analyzes the data measured by MAX-DOAS from 0800−1700 LST. A diagram of the MAX-DOAS and tower NO2 concentration time series during the observation period after data screening is shown in Fig. 2.
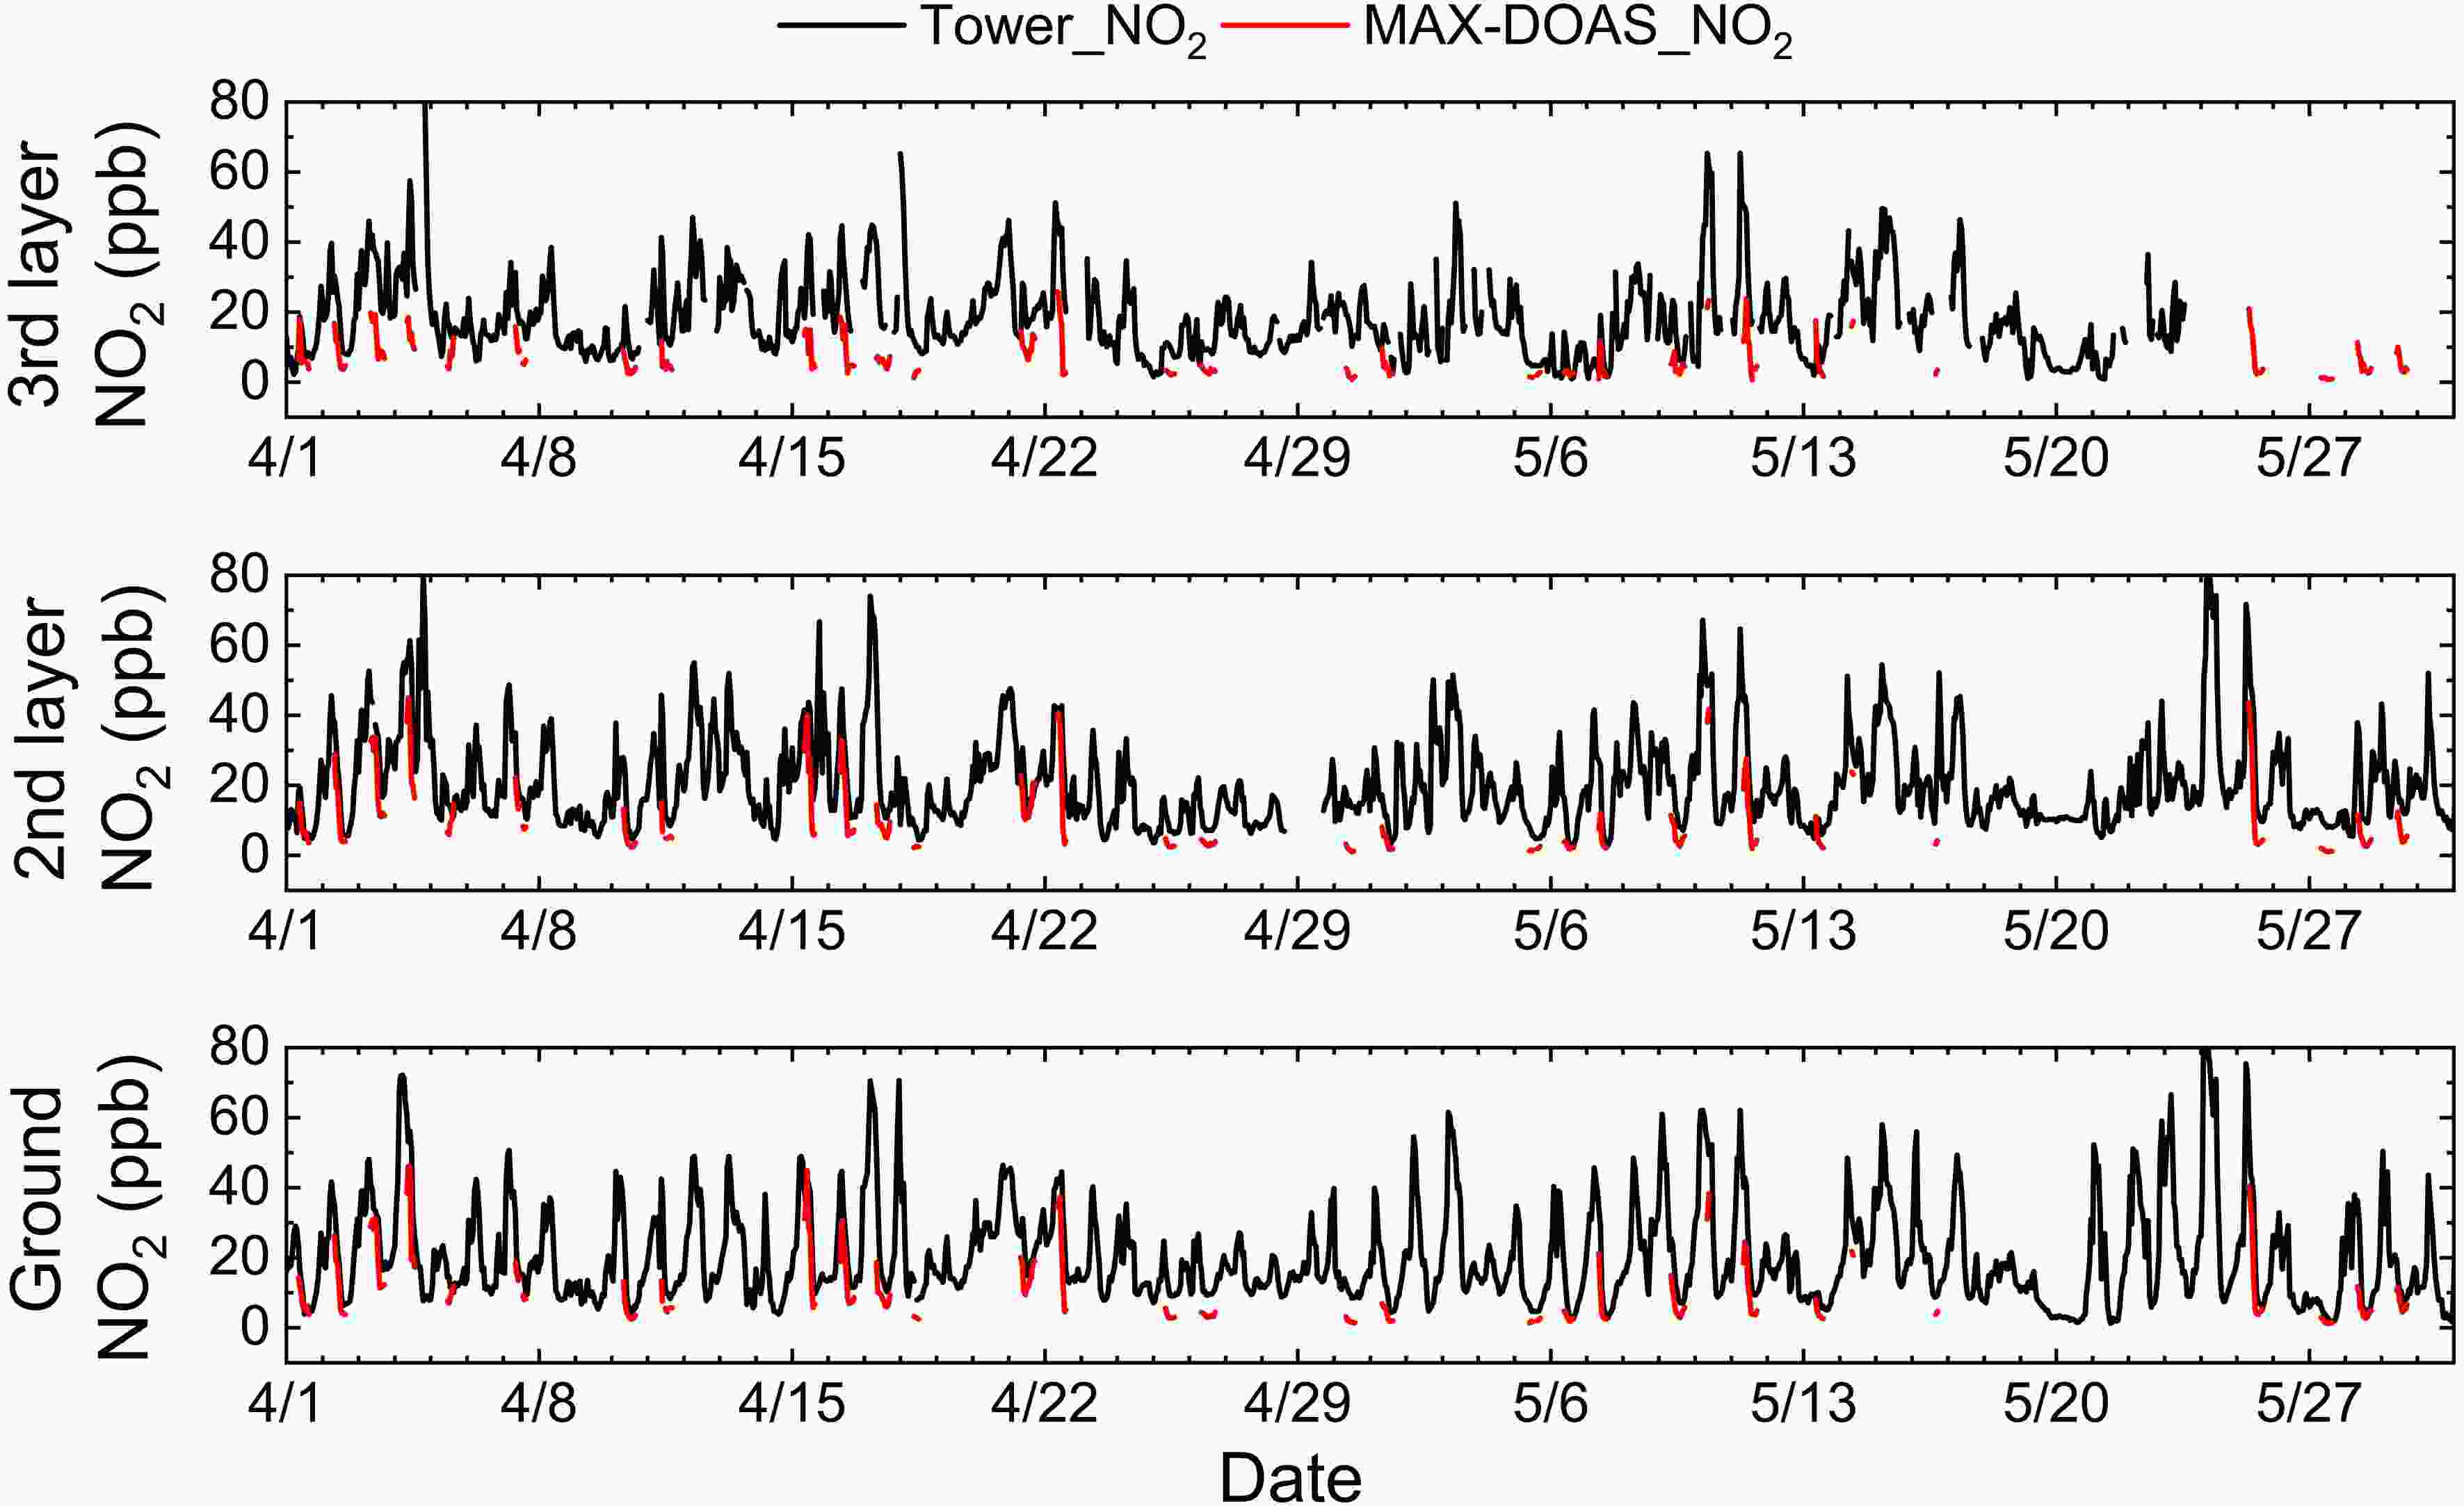
Figure 2. NO2 time series of the MAX-DOAS and tower-based in situ observations from April−May 2019.
This paper studies the obtained data in two ways. On the one hand, the MAX-DOAS three-layer data are compared to the corresponding in situ three-layer, tower-based data, and the results are shown in Figs. 3a-c. The three-layer correlation coefficients R from the ground to the upper air are 0.89 (60 m), 0.87 (160 m), and 0.76 (280 m), which decrease with increasing height. On the other hand, as the bottom concentration obtained by MAX-DOAS via inversion is the average NO2 concentration from the ground to a certain height along the effective horizontal optical path, the MAX-DOAS result represents the average concentration of one layer, while the tower observation adopts the in situ measurement method, and the measured value represents the air quality close to the instrument, which represents a point concentration. Therefore, to enable the comparison, we averaged the concentrations of the three tower layers and compared the average concentration to that of the three MAX-DOAS layers. The correlation analysis result is shown in Fig. 3d. The correlation coefficient R of the average concentration of the three layers measured by the two methods reaches 0.88. Moreover, the analysis in the case where the cloud is not removed is shown in Fig. S1 in the ESM. The correlation coefficients are 0.76, 0.78, and 0.69 from the ground to the high level, respectively, while the R of the average concentration is 0.80, which is significantly lower. Overall, regardless of the comparison with different layers or with average results, these high R values indicate that the NO2 concentration measured by MAX-DOAS is highly consistent with that measured in situ by the tower, which also demonstrates that MAX-DOAS suitably reflects the evolution trend of NO2 near the ground. In addition, the points in the four correlation analysis graphs of Fig. 3 are essentially distributed below the 1:1 line, which reveals that some deviations occur in the magnitude of the NO2 concentration measured by MAX-DOAS. Furthermore, we also compared the performance in the situations of high and low AOD, and the results are shown in Fig. S2 in the ESM. The inversion of NO2 requires aerosol profiles as a priori information, which means that the influence of aerosols has been taken into account during the inversion. Consequently, the influence of aerosols is not significant. From Fig. S2, we can see that both R and slope are similar to one other, indicating that the influence of aerosols on the retrieval of NO2 is limited.
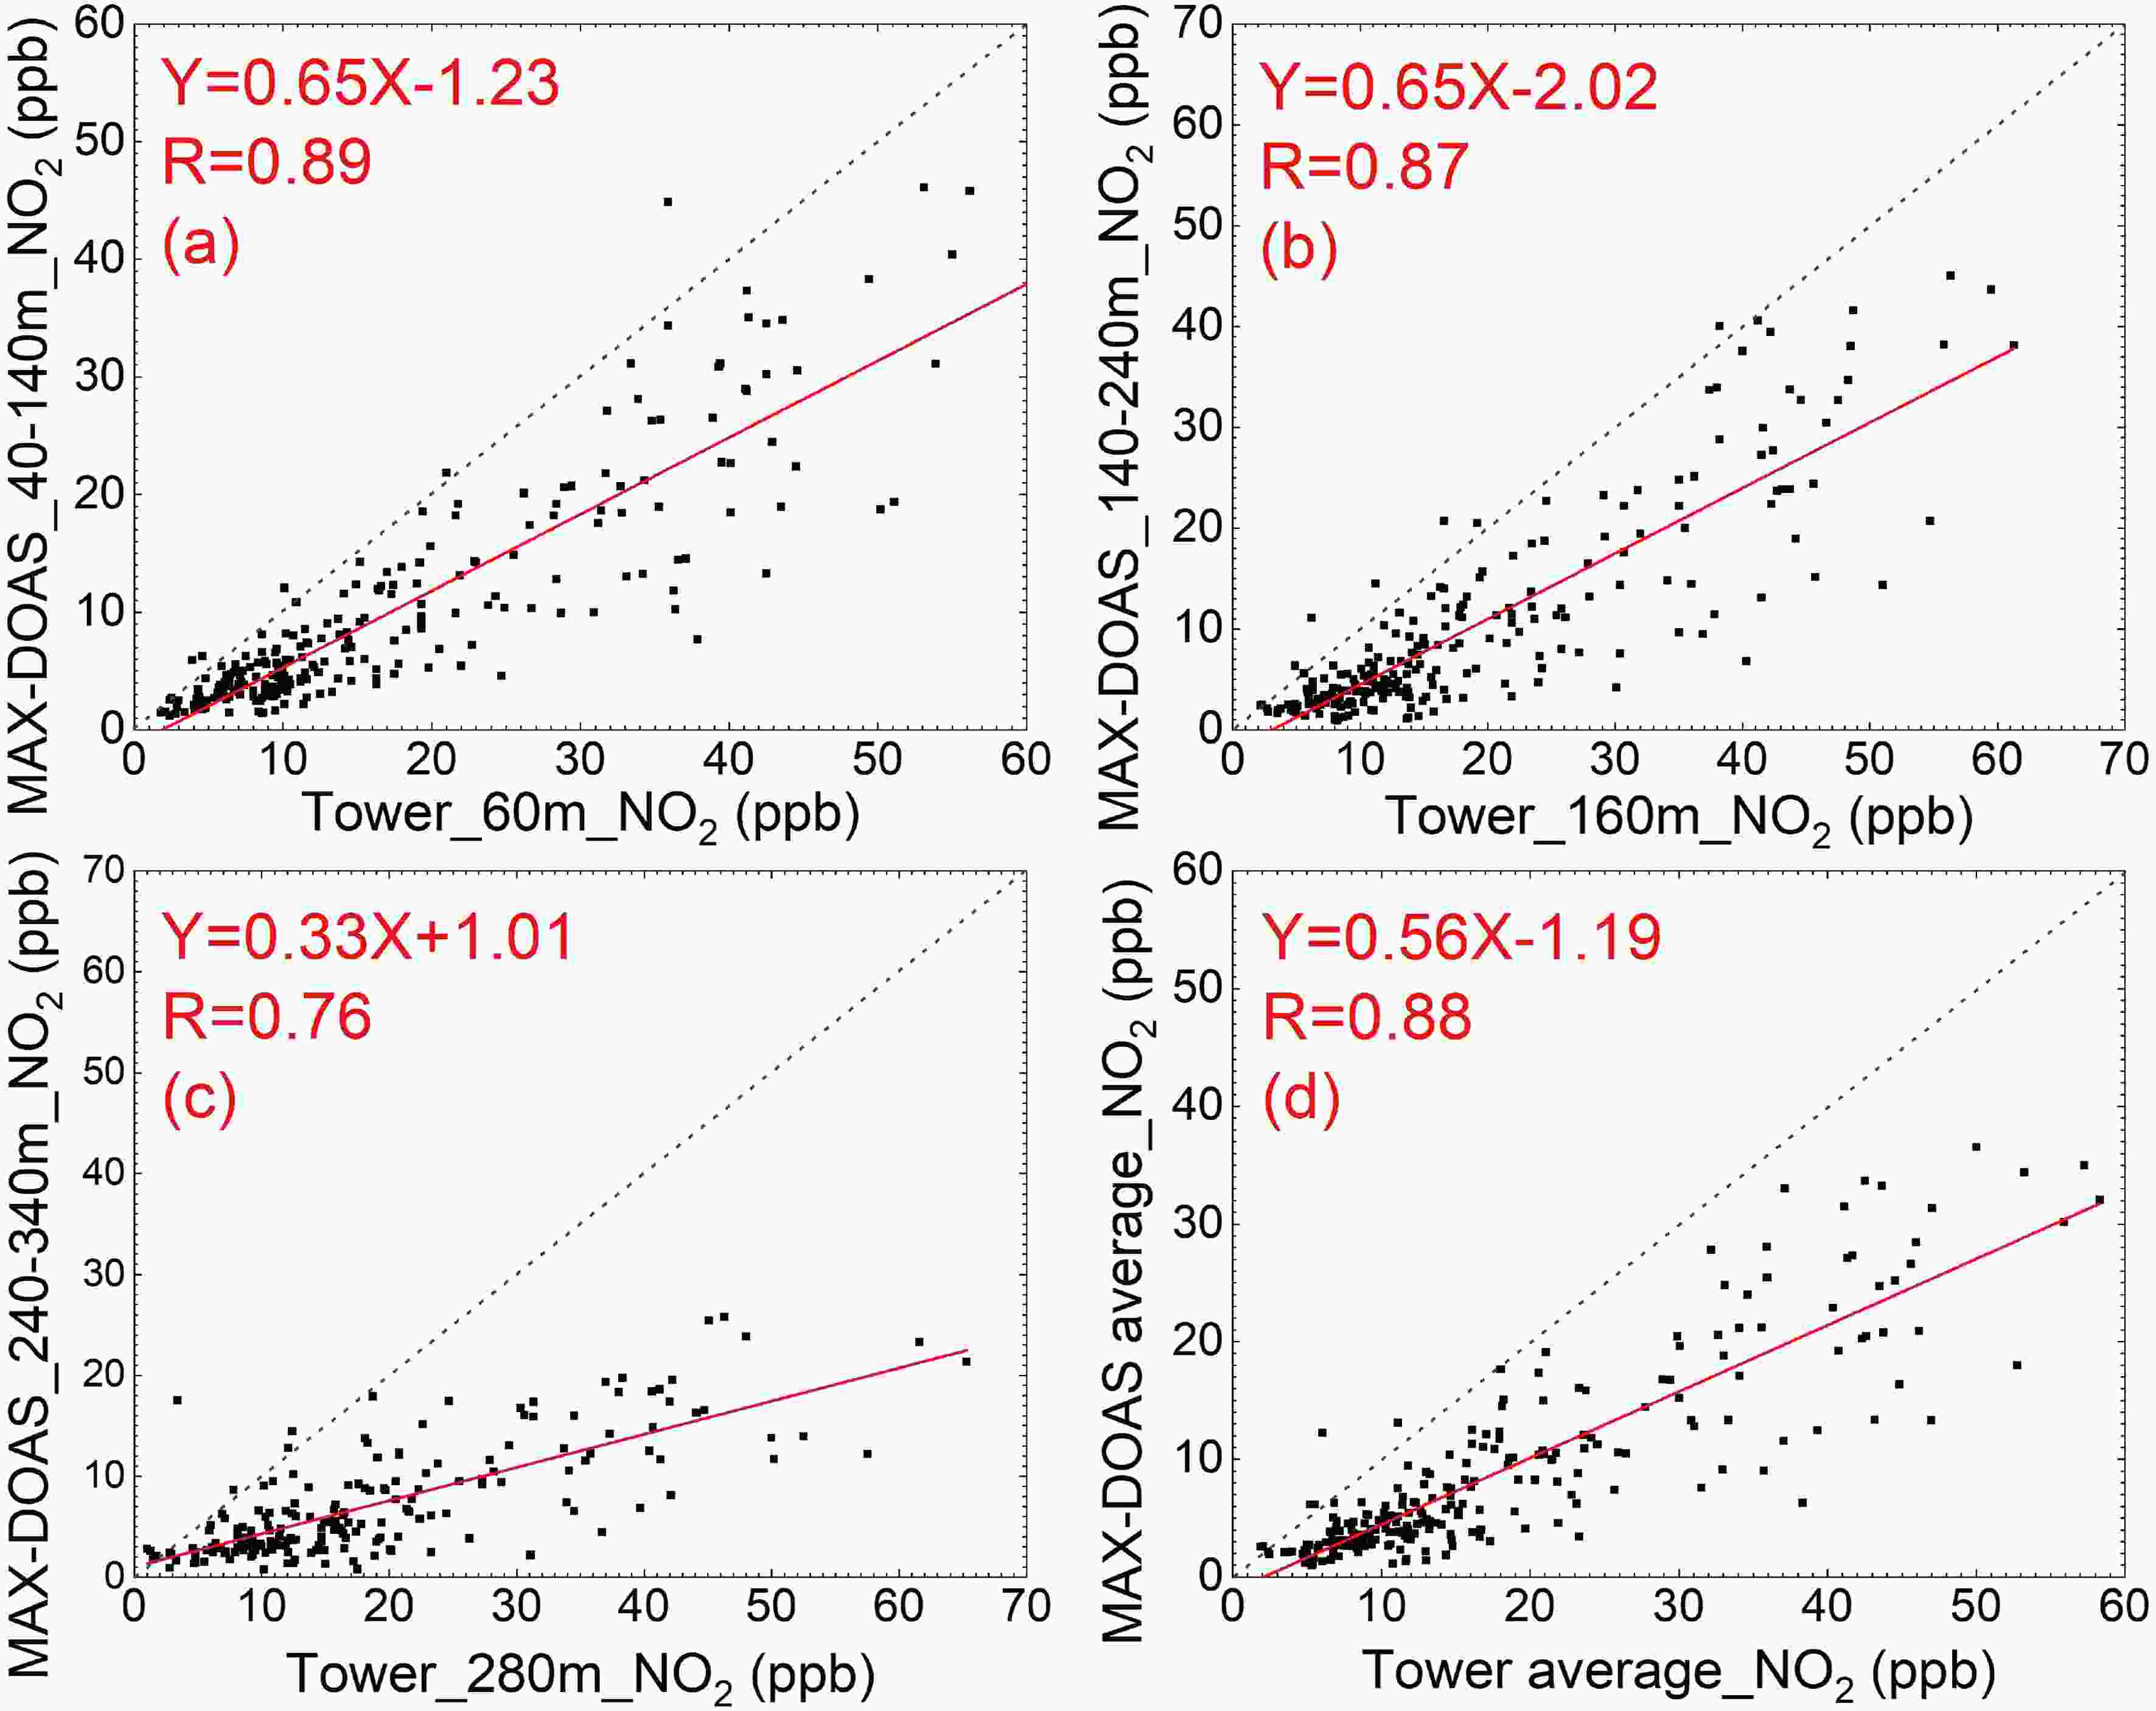
Figure 3. Correlation analysis of the MAX-DOAS and tower-based in situ VMR results in the case where the cloud is removed.
-
It should be noted that the below daily variation curve and profile analyzed by MAX-DOAS were obtained from the convolution of the true atmospheric NO2 concentration and the AK profile. However, due to height limitations, the tower-based in situ method does not detect the complete AK profile, so the tower observation data cannot be smoothed. In particular, the NO2 daily variation curve and vertical profile provided by the tower-based in situ method given below were obtained by analyzing the original atmospheric NO2 concentration. Therefore, the diurnal variation and NO2 mean vertical profiles measured by the two methods cannot be quantitatively analyzed, and only qualitative analysis can be conducted.
-
To examine the MAX-DOAS measurements at different times, diurnal variation analysis was conducted for the MAX-DOAS NO2 and tower-based in situ NO2 concentrations. The NO2 during the day and night are displayed in Fig. 4, which shows that the NO2 concentration exhibits a large range of variation throughout the day. Unfortunately, MAX-DOAS cannot record the variations due to the lack of light at night. However, the relatively high NO2 concentration in the early morning and relatively low NO2 concentration at noon confirm the diurnal variation in NO2 measured by MAX-DOAS. In the early morning, the surface NO2 concentration was high due to accumulation at night and morning peak traffic emissions. During mid-morning, at approximately 0900 LST, the surface NO2 concentration greatly decreases due to consumption processes, such as photolysis. In the afternoon (1400−1500 LST), the photolysis rate is relatively high, and the traffic load is low. Hence, the NO2 concentration reaches its lowest level of the day. Soon thereafter, photolysis weakens, the cumulative loss rate of NO2 is low, and the NO2 production volume is large. Therefore, NO2 begins to accumulate again, and the concentration increases with a peak at approximately 1700 LST. Moreover, BL dynamics also play an important role in the diurnal variation in NO2. The diurnal variation in BLH (please refer to Fig. S3 in the ESM) is low in the morning and high at noon. From morning to evening, the evolving BL dilutes NO2, and the corresponding diurnal variation in NO2 is the opposite of that in BLH, resulting in NO2 accumulation in the morning and evening. Since the NO2 concentration in the bottom layer (0−100 m) is more sensitive to near-surface emissions and diurnal variations in the BLH, a high NO2 concentration in the bottom layer is more evident in the morning and evening, when emissions are the primary source of the NO2 pollution detected at the experimental site.
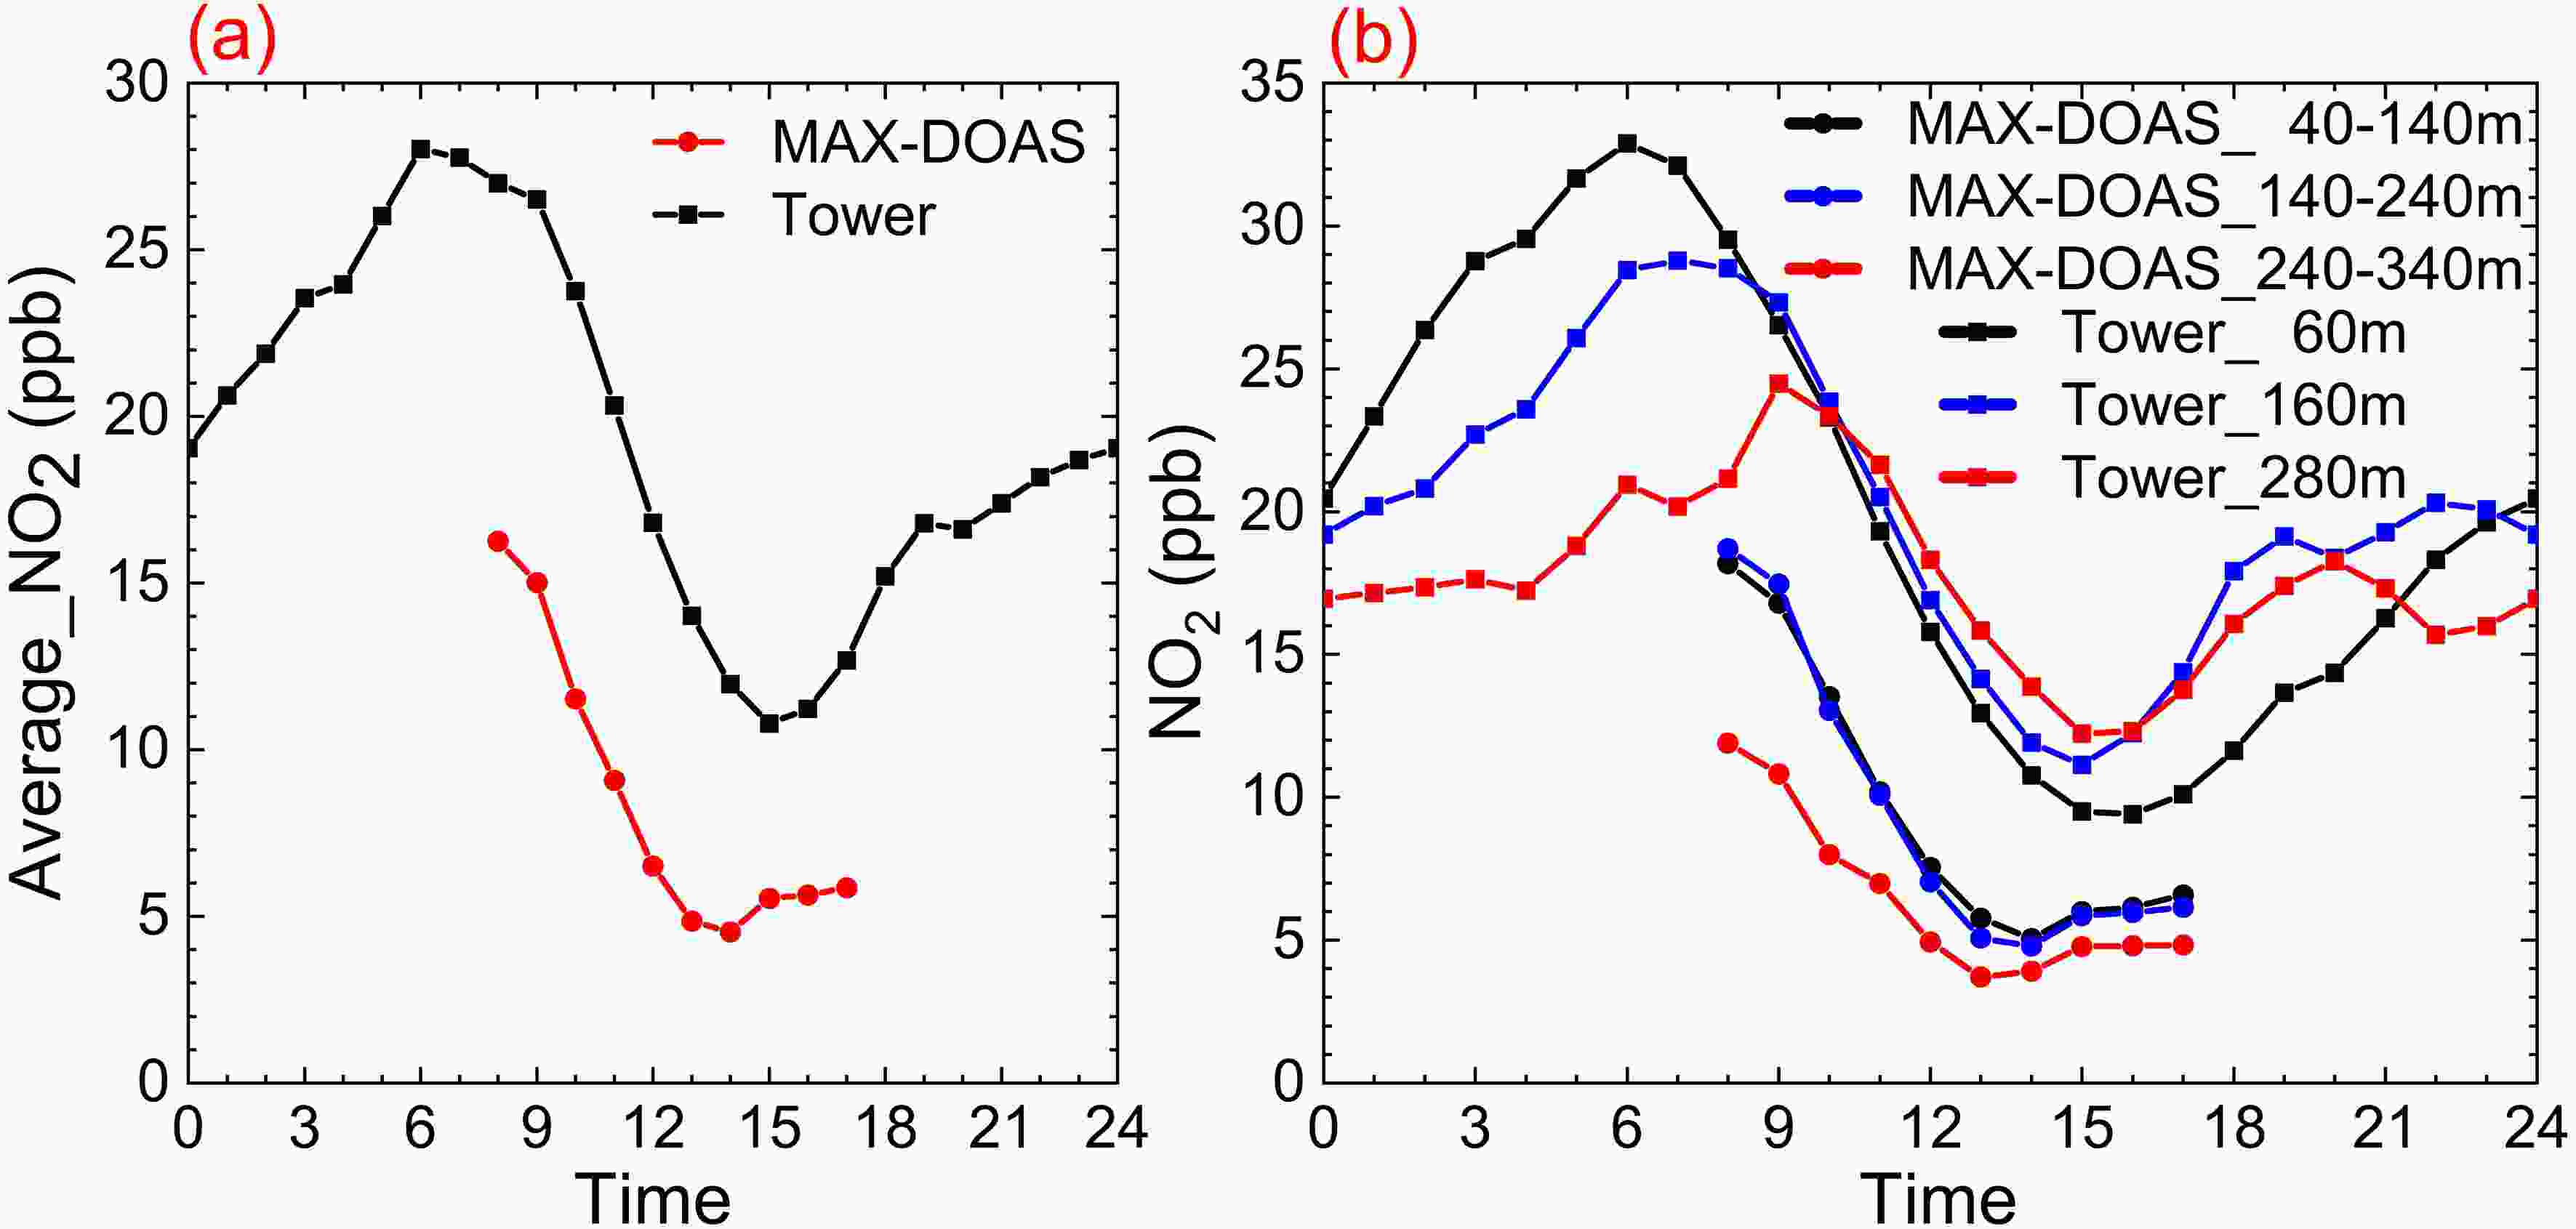
Figure 4. Comparison of the NO2 diurnal variations ((a) mean concentration of the three MAX-DOAS layers and in situ tower (b) concentration of a single layer).
Figure 4b shows the changes in the NO2 gradient measured in the aforementioned two ways. In the daytime, the differences between the three layers are small in both measurements because the troposphere shows high mixing rates during the day, and pollutants are evenly distributed in the mixed layer. However, the NO2 concentration of the third layer of MAX-DOAS is significantly lower, which implies that the near-ground NO2 at the experimental point mainly originates from the ground. At night, the difference between the three layers becomes larger from the gradient measured in situ by the tower, which is contrary to the daytime. Due to the difference between the MAX-DOAS and in situ measurements concerning air mass quality detection [please refer to section 4.2 (1) for details], the NO2 measured by MAX-DOAS is more spatially representative, and its vertical evolution rule is detailed in section 3.2.2.
-
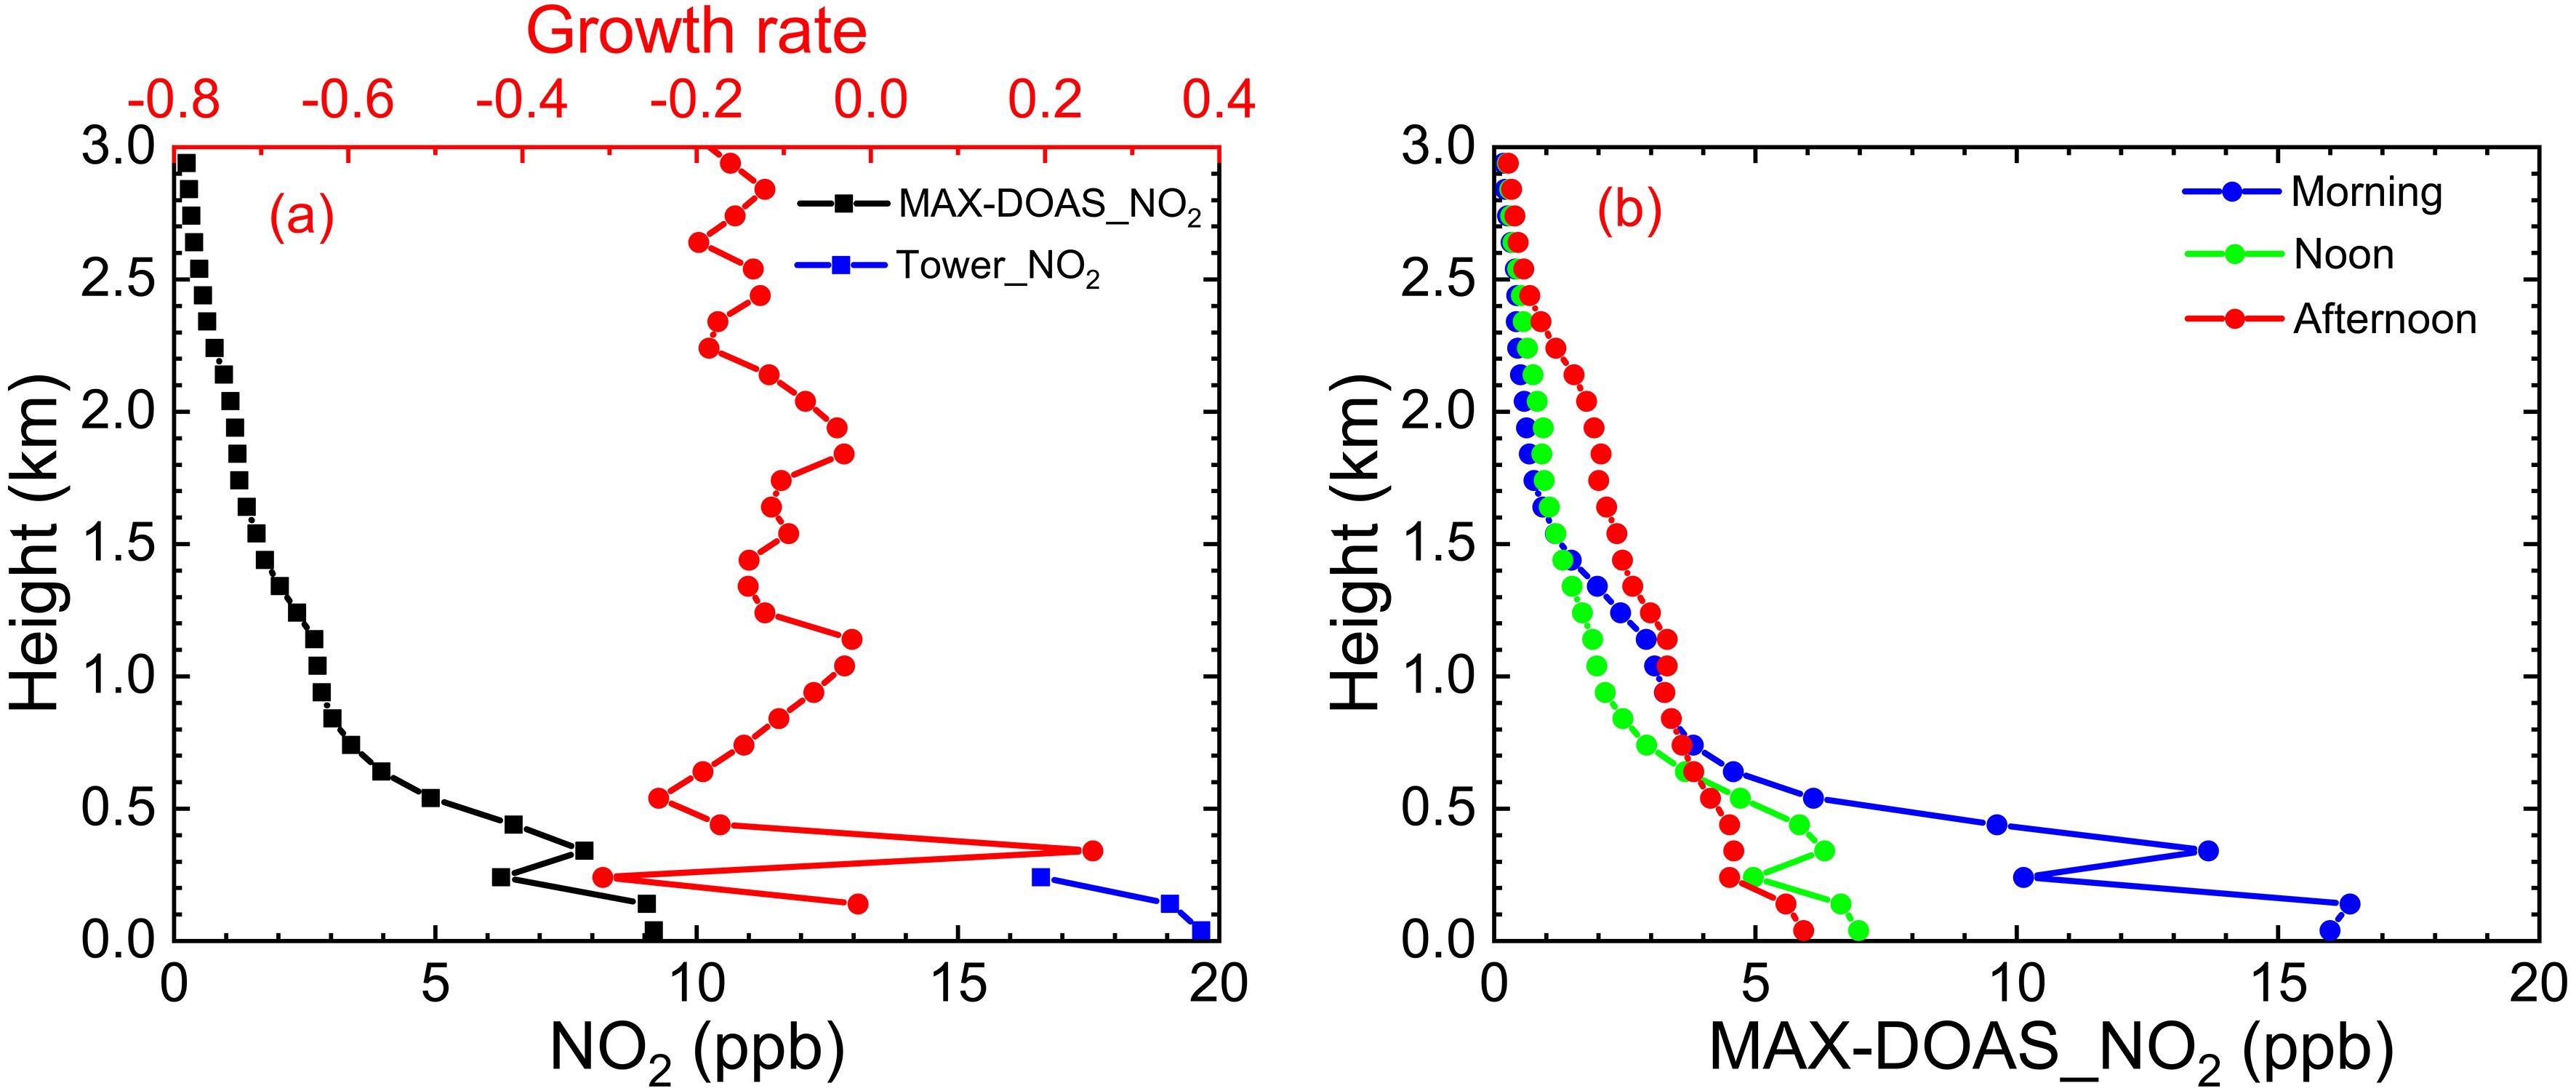
Because MAX-DOAS is not sensitive to pollutants above 3 km (Wang et al., 2013), this article only analyzes the vertical evolution of NO2 below 3 km. Figure 5a shows the vertical evolution trend of NO2 obtained by the two methods. The average NO2 vertical profile decreases exponentially with increasing height, and most of the high NO2 concentrations occur below 1 km. Simultaneously, based on Fig. S3, we find that the NO2 concentration was distributed mainly within the BL. As a result, the NO2 changes are consistently reflected in the BL changes, which notably verifies that the MAX-DOAS inversion method is correct.

Figure 5. Averaged NO2 vertical profiles during the observation period (a) and at certain times of day (b).
In Fig. 5b, we divided the daytime into three parts, 0800−1000 LST, 1100−1300 LST, and 1400−1700 LST, to analyze the typical NO2 profiles in the morning, at noon, and in the afternoon, respectively. Near the ground, it is obvious that the NO2 concentration is morning > afternoon > noon. Since the NO2 in the urban atmosphere is mainly from the emission of mobile sources such as cars, near-ground NO2 is highly related to traffic emissions. In addition, as shown in Fig. 5a, the growth rate of NO2 changes little in the vertical. As a result, the measured NO2 in the study area generally depends on the local distribution. From Fig. 5b, we also find that the NO2 concentration above 1.4 km in the afternoon is approximately 1 ppb higher than that in the morning and noon. This can also be seen in Fig. S3. In Fig. S3, the BLH starts to decrease at 1500 LST and drops significantly at 1600 LST at approximately 1.4 km, which leads to the NO2 concentration at approximately 1.4 km increasing in turn. Moreover, pollutants in the residual layer (RL) can impact pollution near the surface (Liu et al., 2021). With strong turbulence in the daytime, the NO2 in the BL is then transported into the free atmosphere above the BL, and when the BL begins to decrease, the NO2 in the free atmosphere is stored in the RL until the next morning, leading to a high NO2 concentration above the BL in the early morning of the next day. Therefore, it is clearly shown in Fig. S3 that within the BL, the NO2 concentration is low in the daytime when the BL develops, while it is higher in the afternoon when the BL begins to decrease.
-
Both the average observation value and measurement range of TROPOMI are lower than that of MAX-DOAS, which are mainly caused by the following two factors:
(1) It is partly related to the a priori vertical distribution of NO2 used in the AMF calculation of the satellite retrieval, which is not able to fully resolve emission hot spots over cities (Chan et al., 2020), noting that the uncertainty in the estimate of the tropospheric AMF is the largest source of uncertainty in NO2 satellite retrievals in situations with enhanced trace gas concentrations (Wang et al., 2020a).
(2) It is due to the effect of aerosols and clouds, both of which can mask some of the tropospheric NO2 (Wang et al., 2020a). Because aerosols have a longer lifetime than NO2 in the atmosphere, near-ground aerosols influence satellite measurements of NO2 (Ma et al., 2013). Therefore, the sensitivity of satellite instruments is limited near the ground, while MAX-DOAS exhibits the highest sensitivity near the ground, and its sensitivity is almost zero at heights above 3−4 km.
-
Regarding the low MAX-DOAS measurement results, the following reasons are given:
(1) The difference in spatial representation between the measured values increases the observation bias over the entire measurement period. The gas concentration measured by MAX-DOAS is the average gas concentration along the optical path from several hundred meters to several kilometers, which ensures more representative detection results. The in situ measurement method is more sensitive to the air mass at the measuring port of the instrument, and it only measures the air pollution in the sampling space at the monitoring site. When a high air mass concentration occurs, the measured value will be high.
(2) It is attributed to the difference in sensitivity of different hights measured by MAX-DOAS. From the perspective of the error, the MAX-DOAS inversion error mainly includes a smoothing error, which is caused by a smoothing of the real profile (Hong, 2019), and the smoothing effect mainly depends on the AK. The AK results in the MAX-DOAS method exhibiting different vertical resolutions and inversion sensitivities at various heights. With increasing height, the sensitivity of MAX-DOAS to trace gas and aerosol profile inversion systematically decreases. Previous experiments have also demonstrated that the MAX-DOAS-measured results after smoothing are lower than the real results, and in particular, the concentration of pollutants above 1 km is conspicuously underestimated (Wang et al., 2017, 2019), while profile inversion is more sensitive to the near-ground height (Hong, 2019).
-
In this paper, we applied MAX-DOAS to conduct vertical observations of the tropospheric NO2 concentration in Beijing from 1 April to 31 May 2019. Moreover, we compared the MAX-DOAS NO2 results to the TROPOMI NO2 VCD and tower-based in situ NO2 VMR results. Several conclusions are drawn as follows:
(1) The MAX-DOAS results are highly consistent with the satellite and tower-based in situ measurement results, and the approach accurately detects the trend of the tropospheric NO2 concentration. Although MAX-DOAS does not directly provide the NO2 concentration near the ground, the bottom concentration of the NO2 profile yielded by MAX-DOAS reflects the near-surface NO2 trend, which proves that the profile inversion results are highly reliable.
(2) The NO2 vertical evolution trend measured by MAX-DOAS is correct, but the measured NO2 concentrations differ in magnitude.
(3) The inversion results of the NO2 profile during the experiment indicate that the NO2 observed at the experimental site mainly occurs in the near-surface layer below 1 km, and the average NO2 vertical profile decreases exponentially with increasing height. The NO2 vertical profile evolution also coincides with the BLH evolution.
Acknowledgements. This work was supported by the National Key R&D Program of China (Grant No. 2017YFC0210000), the National Natural Science Foundation of China (Grant Nos. 41705113, 41877312), the National Research Program for Key Issues in Air Pollution Control (Grant No. DGQQ202004), and the Beijing Major Science and Technology Project (Grant No. Z181100005418014).
Electronic supplementary material: Supplementary material is available in the online version of this article at
https://doi.org/10.1007/s00376-021-0370-1 .
Evaluation and Evolution of MAX-DOAS-observed Vertical NO2 Profiles in Urban Beijing
- Manuscript received: 2020-11-06
- Manuscript revised: 2021-04-13
- Manuscript accepted: 2021-04-19
Abstract: Multiaxis differential absorption spectroscopy (MAX-DOAS) is a newly developed advanced vertical profile detection method, but the vertical nitrogen dioxide (NO2) profiles measured by MAX-DOAS have not yet been fully verified. In this study, we perform MAX-DOAS and tower gradient observations to simultaneously acquire tropospheric NO2 observations in the Beijing urban area from 1 April to 31 May 2019. The average values of the tropospheric NO2 vertical column densities measured by MAX-DOAS and the tropospheric monitoring instrument are 15.8 × 10¹⁵ and 12.4 × 10¹⁵ molecules cm−2, respectively, and the correlation coefficient R reaches 0.87. The MAX-DOAS measurements are highly consistent with the tower-based in situ measurements, and the correlation coefficients R from the ground to the upper air are 0.89 (60 m), 0.87 (160 m), and 0.76 (280 m). MAX-DOAS accurately measures the trend of NO2 vertical profile changes, although a large underestimation occurs by a factor of two. By analyzing the NO2 vertical profile, the NO2 concentration reveals an exponential decrease with height. The NO2 vertical profile also coincides with the evolution of the boundary layer height. The study shows that the NO2 over Beijing mainly originates from local sources and occurs in the boundary layer, and its vertical evolution pattern has an important guiding significance to better understand nitrate production and ozone pollution.
-
Keywords:
- MAX-DOAS,
- NO2,
- tower-based in situ observation,
- TROPOMI,
- validation,
- vertical
摘要: 多轴差分吸收光谱法(MAX-DOAS)是一种先进的大气污染物垂直廓线探测方法,但其测量的二氧化氮(NO2)垂直廓线尚未得到充分验证。2019年4月1日至2019年5月31日期间,我们同步开展了MAX-DOAS和气象塔梯度观测,结合卫星观测的NO2柱浓度对MAX-DOAS探测结果进行了验证。结果表明,MAX-DOAS和卫星测量的对流层NO2垂直柱浓度平均值分别为15.8 × 10¹⁵ 和 12.4 × 10¹⁵ molecules cm−2,相关系数高达0.87。 MAX-DOAS测量值与塔基原位测量值也高度一致,从地面到高空的相关系数分别为0.89(60 m),0.87(160 m)和0.76(280 m)。虽然探测的NO2绝对量值仍存在显著低估(约为塔基原位测量值的二分之一),但是MAX-DOAS可以精确测量NO2垂直变化趋势。 NO2浓度随高度呈指数下降趋势,且其垂直演变规律与边界层高度变化相吻合。以上研究结果表明,北京地区的NO2主要来自局地,控制本地NO2排放是降低硝酸盐生成和臭氧污染的首要手段。


 AAS Website
 AAS WeChat