


 DownLoad:


HTML
-
Ozone (O3) is an important pollutant in the troposphere, especially in the urban atmosphere, which affects the quality of atmospheric environment (Dong et al., 2020; Kinose et al., 2020) and human health (Liang et al., 2020; Zhao et al., 2020). In the past few decades, ozone has received considerable attention (Carter et al., 1993; Derwent et al., 2007; Wang et al., 2017; Cao et al., 2020).
In recent years, although a series of control measures for air pollution have been formulated and implemented in various places, ozone pollution incidents still occur frequently (Chi et al., 2018; Ma et al., 2019; Guérette et al., 2020; Janik et al., 2020; Kalabokas et al., 2020; Seltzer et al., 2020). In the Beijing−Tianjin−Hebei region, the Yangtze River Delta, and the Pearl River Delta of China, air pollution events with ozone concentration exceeding 100%−200% of the air standard value have been observed many times (Wang et al., 2017). Cao et al. (2020) observed that the ozone concentration in the west China rain zone and its adjacent regions has exceeded the relevant ecological critical loads. In Sydney, Australia, the ozone concentration can even exceed 100 ppb when ozone pollution occurs (Guérette et al., 2020). Seltzer et al. (2020) found that the harmful impacts of long-term exposure to ambient ozone on human health increased from 2000 to 2015 in USA.
O3 precursors are volatile organic compounds (VOCs) and nitrogen oxide (NOx). Among thousands of VOCs species, carbonyl compounds such as aldehydes and ketones are considered to be the important precursors of ozone formation (Dong et al., 2014; da Silva et al., 2016). It is known that acetaldehyde, as one of the main carbonyl compounds, has a significant effect on the formation of ozone (Saengsai and Jinsart, 2015). Guo et al. (2014) found that acetaldehyde contributed 42% of the total carbonyl compounds to the summer ozone concentration in the rural areas of Southern China, while da Silva et al. (2016) found that acetaldehyde was the most important precursor of ozone in Rio de Janeiro as compared with other carbonyls such as formaldehyde and aromatics such as benzene and toluene. In fact, its contribution to local ozone was about 2.6 times that of formaldehyde.
Many chemical mechanisms have been widely used to simulate ozone formation (Shi et al., 2012), such as Master Chemical Mechanism (MCM) (Jenkin et al., 1997, 2003, 2015) and Statewide Air Pollution Research Center mechanism (SAPRC) (Carter and Heo, 2013; Venecek et al., 2018). It is often found that there are some differences in the simulation results between different chemical mechanisms (Zong et al., 2018). To improve the accuracy of simulation results, it is necessary to evaluate and improve the chemical mechanisms according to experimental results (Derwent et al., 1998; Carter and Heo, 2013; Zong et al., 2018). Carter and Heo (2013) have supplemented the SAPRC mechanism many times, and the MCM mechanism has also been modified in some studies (Jia et al., 2009; Jia and Xu, 2016). To the best of our knowledge, the only known experimental study on the ozone formation of acetaldehyde was carried out by Carter et al. (1993), whose purpose was to verify the accuracy of the simulation result of SAPRC. Their experiments mainly focused on the influence of effective light intensity under low relative humidity (~15%). Smog chamber experiments regarding the influences of relative humidity (RH) and precursor concentrations on ozone formation from the photochemical reaction of acetaldehyde have not been reported in detail. Also, whether the MCM mechanism can accurately simulate the reaction process under different reaction conditions remains to be evaluated by experiments.
In this study, the ozone formation potential of acetaldehyde is studied in detail through the smog chamber system. The main research purposes are as follows: (1) to determine the influence of initial CH3CHO/NOx ratios (RCN) on ozone concentrations under different RHs, (2) to evaluate whether the current known chemical mechanism (MCM) can accurately simulate the photochemical reaction of acetaldehyde, and (3) to estimate the influence of acetaldehyde on the ozone concentrations in the real atmospheric environment.
-
All experiments in this study were carried out in a smog chamber system. The detailed description of this smog chamber system has been given in our previous studies (Jia and Xu, 2016, 2018). The reactor has a volume of 1.3 m3 in this study. The light source was supplied by two types of UV lamps F40 BLB (GE, USA) and UVA-340 (Q-Lab Corporation, USA), with center wavelengths of 365 nm and 340 nm, respectively. These types of UV lamps have been used in other similar studies to simulate the sunlight in the real atmospheric environment (Wang et al., 2015; Luo et al., 2019, 2020; Chen et al., 2020). The NO2 photolysis rate constant was determined to be J[NO2] = 0.20 min−1 to represent the effective light intensity in the reactor, which is in the range of 0.139−0.44 min−1 widely used in other similar photochemical reaction systems such as 1,2,3-trimethylbenzene-NOx (Luo et al., 2019), toluene-NOx (Chen et al., 2020), and styrene-NOx (Luo et al., 2020).
The background air used in all experiments was zero air produced by the Zero Air Supply (Model 111 and Model 1150, Thermo Scientific, USA), in which the concentrations of O3, NO and NOx are below 1 ppb, and the concentrations of SO2 and hydrocarbon (HC) are below 50 ppt and 100 ppb, respectively. The concentration of the NO2 standard gas was 508 ppm (diluted by N2, Beijing Huayuan Gas Co., Ltd., China). The purity of acetaldehyde was 99.9% (Aladdin Reagent Co., Ltd., China). The RH of background air was controlled by bubbling zero air through the highly purified water. A hygrometer (Model 645, Testo AG, Germany) was used to measure temperature and RH in the experiments, with the accuracy being ±0.1°C and ±1%RH. The concentrations of NOx (NO and NO2) and O3 were measured online by a NOx analyzer (Model 42C, Thermo Scientific, USA) and an O3 analyzer (Model 49C, Thermo Scientific, USA), respectively. The concentration of NO2 measured by the NOx analyzer included all other nitrogen-containing substances (NO2, HNO3, etc.) except NO, which is expressed as NOy below. The concentration of acetaldehyde was measured by GC-MS (7890A/5975, Agilent, USA).
Before each experiment, the reactor was flushed with zero air with the light on until the concentrations of NO, NOy and O3 in the reactor were all lower than the detection limit of the instruments (1 ppb). A solenoid valve was used to control the flow of the background air into the reactor. When the background air filled half of the volume of the reactor, acetaldehyde was introduced into the reactor with zero air through the tee on the intake pipe, and the NO2 standard gas was directly injected from the sample inlet of the reactor with a special syringe. After the reactor was full, the reactor was left for 0.5 h under the condition of no light and no activity, and then the initial condition in the reactor, including the temperature of the reactor and the initial concentrations of NO, NO2, O3 and acetaldehyde, was determined. After the measurement of the initial condition, the light was immediately turned on, marking the beginning of the experiment. During the experiment, the temperature around the reactor was kept stable (±1°C). The experimental initial conditions are shown in Table 1. Experiments 1−8 are used to study the effect of the ratio of initial CH3CHO concentrations to NOx concentrations (NOx = NO + NO2) on ozone concentrations under low-RH (10.7%−13.5%), while Experiments 9−14 are used for high−RH conditions (77.5%−79.8%). Hereafter, the ratio of initial CH3CHO concentrations to NOx concentrations is termed RCN. The variation of RCN was mainly realized by changing initial NOx concentrations under the fixed initial CH3CHO concentrations. Because the ozone concentration at 6 h in the photochemical reaction was generally used to represent the actual ozone formation ability of VOC (Carter et al., 1993), an experiment in this study lasted for 6 h.
Expts. No. CH3CHO (ppm) NOx (ppb) RH (%) T (K) RCN 1 0.62 539.0 12.7 299.0 1.1 2 0.65 325.0 10.9 299.2 2.0 3 0.65 191.0 10.7 299.2 3.4 4 0.60 a 131.2 12.0 300.8 4.6 5 0.64 87.4 10.7 301.3 7.3 6 0.69 75.4 11.5 301.0 9.2 7 0.60 57.2 13.5 300.3 10.4 8 0.60 43.7 11.4 301.0 13.7 9 0.66 506.0 77.5 300.4 1.3 10 0.65 345.0 78.0 299.7 1.9 11 0.57 187.5 79.8 298.8 3.0 12 0.65 96.8 78.3 298.8 6.7 13 0.68 87.9 79.4 299.8 7.7 14 0.61 46.9 79.8 299.2 13.0 Table 1. Initial conditions in the CH3CHO-NOx experiments. (a: Initial concentrations of CH3CHO were calculated based on the injected volume of acetaldehyde regent.)
-
In order to evaluate the accuracy of the MCM mechanism regarding the photochemical reaction of acetaldehyde, the results from the smog chamber experiments were compared with the simulated results by using MCM v3.3.1 (Jenkin et al., 2015). In the simulation of MCM v3.3.1, the wall loss rates of NOx, O3, acetaldehyde, formaldehyde, etc. were taken into account, and the source of HONO from NO2 was also included. In addition to these chamber-dependent reaction processes and species, the mechanism of the photochemical reaction of acetaldehyde in MCM v3.3.1 included 136 chemical reactions and 46 species (
http://mcm.leeds.ac.uk/mcmv3.3.1/ ). To solve these many ordinary differential equations and run the kinetic model under MATLAB, a chemical reaction compiler (CRC) developed by Jia (2007) was used to automatically generate MATLAB code for the simulation of the kinetic processes of the chamber experiments. A variable-order solver soft package called ode15s in MATLAB was used.
2.1. Experimental details
2.2. Simulation details
-
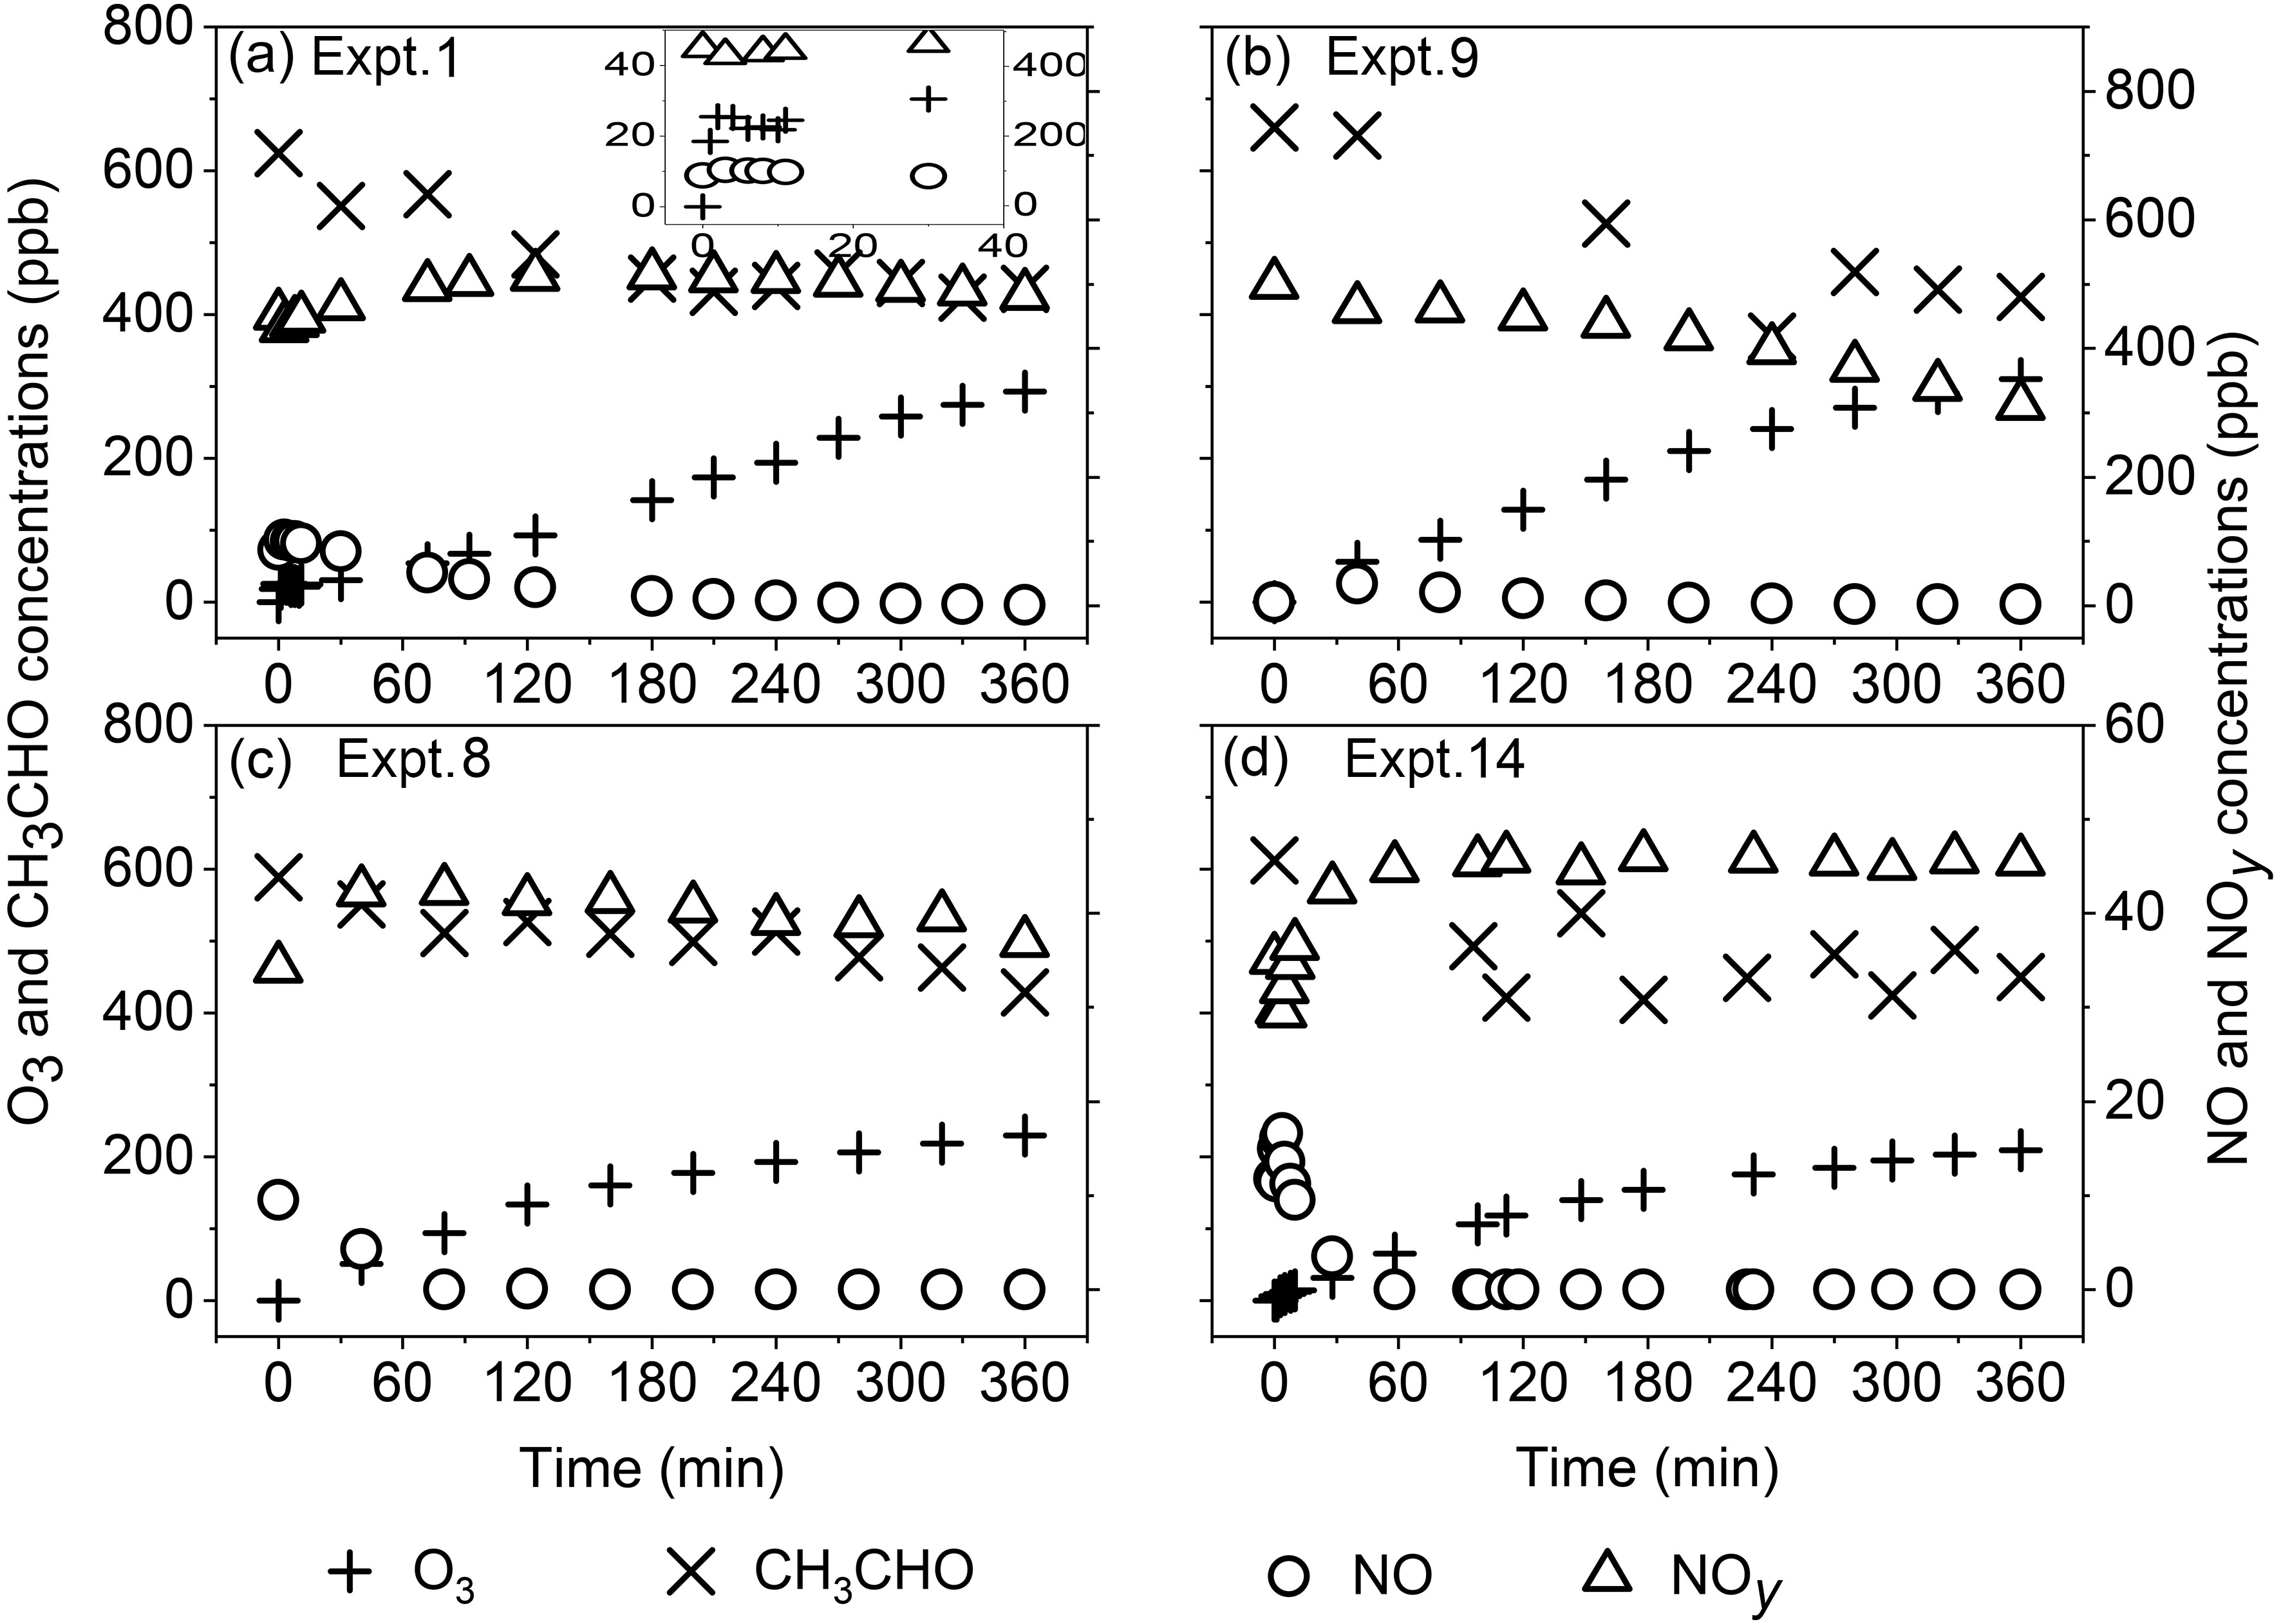
Figure 1 shows variations of O3, NOy, NO and CH3CHO concentrations with time from the experiments under different RHs and initial reactant concentration ratios. The growth rate of O3 concentrations is the largest in the first 1−2 minutes from the start of the experiment (Fig. 1a). After that, the O3 concentration maintains a rapid increasing trend, which is due to formation of RO2 radicals generated from the photochemical reaction of CH3CHO. Because of the photolysis of NO2, the concentration of NO increases rapidly and NOy decreases rapidly within the first 1−2 minutes. Then, the NO concentration decreases gradually, and meanwhile, the NOy concentration increases slowly, which is due to the gradual conversion of NO to nitrogen-containing substances such as NO2 and peroxyacetyl nitrate (PAN). However, due to the effect of wall losses, there is a decreasing trend of NOy in the later stage of reactions. The CH3CHO concentration decreases rapidly at the beginning of reactions, but the decreasing rate gradually becomes smaller in the later stage of most experiments.
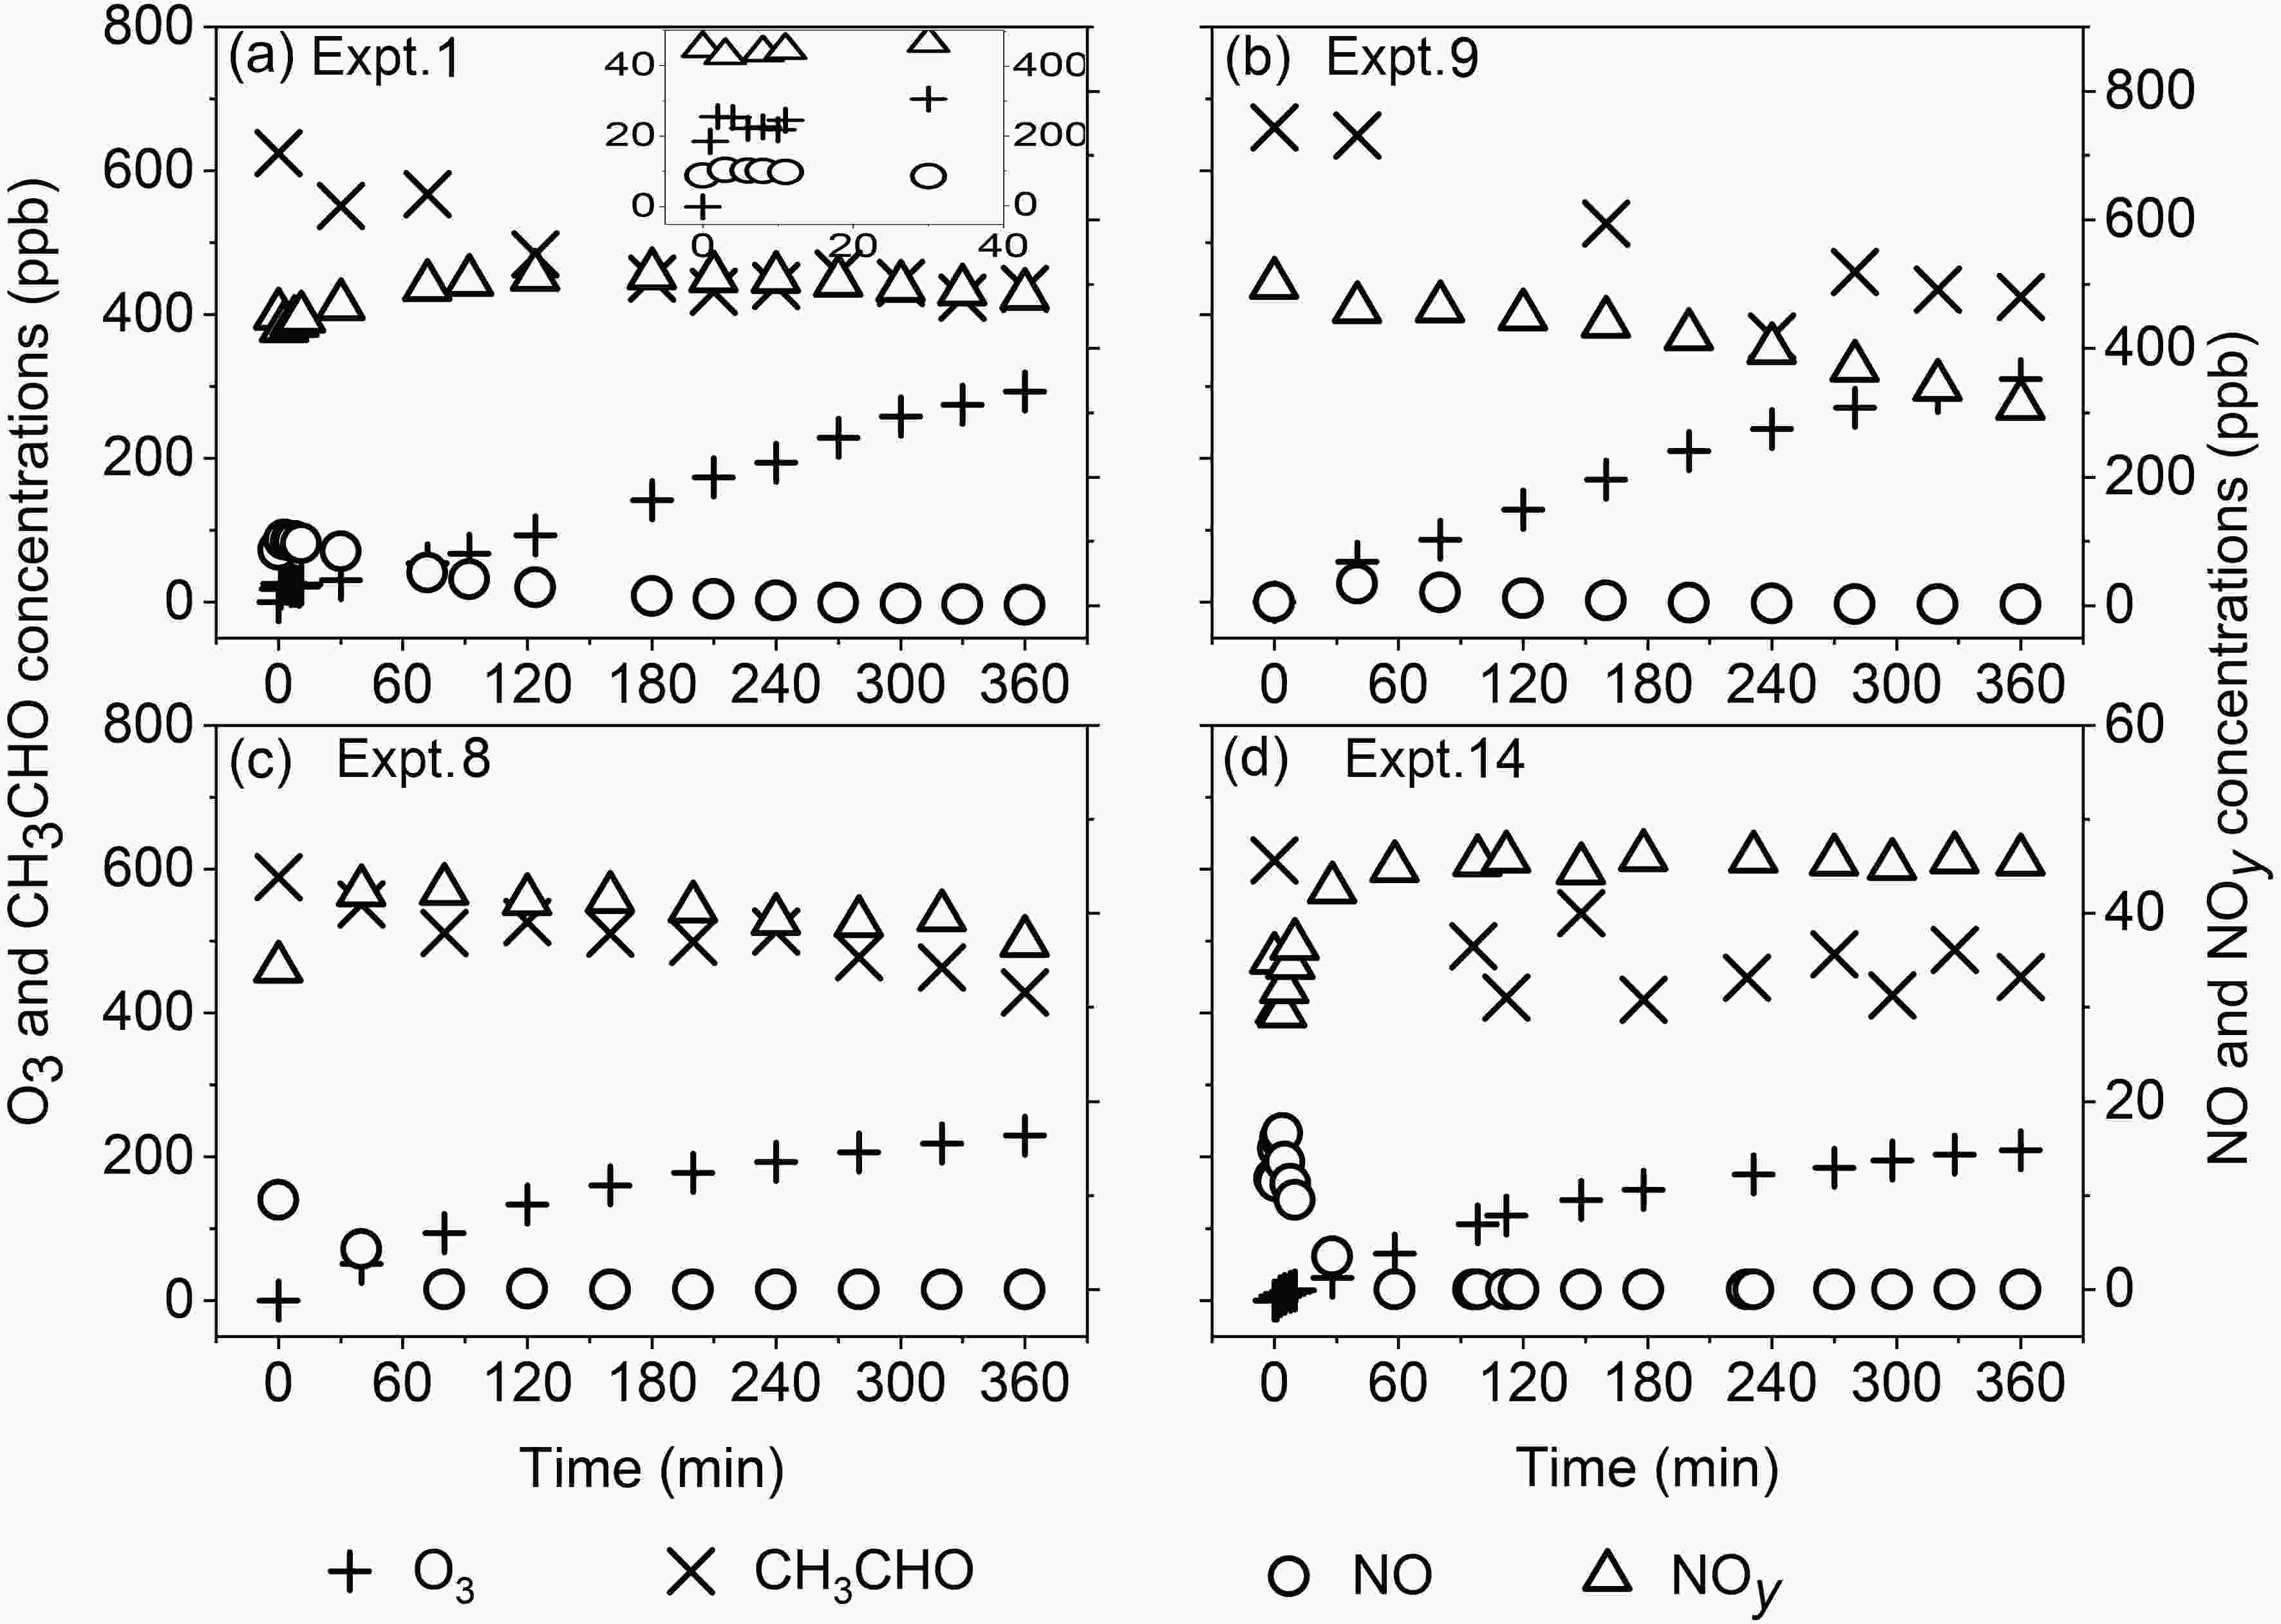
Figure 1. Variations of measured concentrations of O3, NO, NOy and CH3CHO in the reactions with time under different RHs (a: 12.7%; b: 77.5%; c: 11.4%; d: 79.8%) and RCN (a: 1.1; b: 1.3; c: 13.7; d: 13.0) (No wall loss correction for all concentrations).
The photochemical reaction process is significantly affected by light intensity, temperature, RH, reactant concentrations, etc. In this study, the impacts of the initial reactant concentration ratio RCN and RH on the photochemical reaction of acetaldehyde were the primary foci of interest, and only these results are reported herein.
-
RCN has a significant effect on NOy, for which the different RCN effects can be seen under different RH conditions (Fig. 1). Under low-RH conditions, RCN greatly affects the increase rate of NOy in the early stage of the reaction. The time required for the NOy concentration to reach its maximum value in Expt. 8 (RCN = 13.7, RH = 11.4%) is about 80 minutes earlier than that in Expt. 1 (RCN = 1.1, RH = 12.7%). However, under high-RH conditions, RCN mainly affects the pattern of the variation of NOy with time. In Expt. 9 (RCN = 1.3, RH = 77.5%), the NOy concentration decreases almost linearly with time after the start of reactions, while in Expt. 14 (RCN = 13.0, RH = 79.8%) it increases during the first one hour of reactions, and then becomes essentially unchanging. At the same RH conditions, the conversion rate of NOx is different under different RCN, which leads to the difference of the concentrations of chemical components in NOy. In addition, the rate of conversion of NO2 to HONO under different RHs is significantly different (Hu et al., 2011), and the different wall loss rate of NO2 under different RHs was also observed (Jia et al., 2011). These are probably the reasons for the influence of RCN and RHs on the NOy concentrations.
The RCN also has a significant impact on the O3 concentration during the experiment. Under the condition of RCN = 1.1 in Expt. 1 (Fig. 1a), the average formation rate of O3 is about 0.79 ppb min−1 in the first 180 minutes, which is close to 0.83 ppb min−1 during the second 180 minutes from time t = 180−360 minutes. However, under the condition of RCN = 13.7 in Expt. 8 (Fig. 1c), the average formation rate of O3 is about 1.00 ppb min−1 in the first 180 minutes, but it is only 0.35 ppb min−1 during the later stage of 180 minutes from t = 180−360 minutes. Similarly, the average formation rate of O3 in Expt. 9 (RCN = 1.3) does not change significantly during the first and second 180 minutes of the experiment, while in Expt. 14 (RCN = 13.0) it is larger in the first 180 minutes than in the second 180 minutes. With the increase of RCN, the concentration of NO2 decreases. Therefore, under high RCN, such as Expts. 8 and 14, the low concentration of NO2 reduces the increase of the formation rate of O3 at the later stage of reactions.
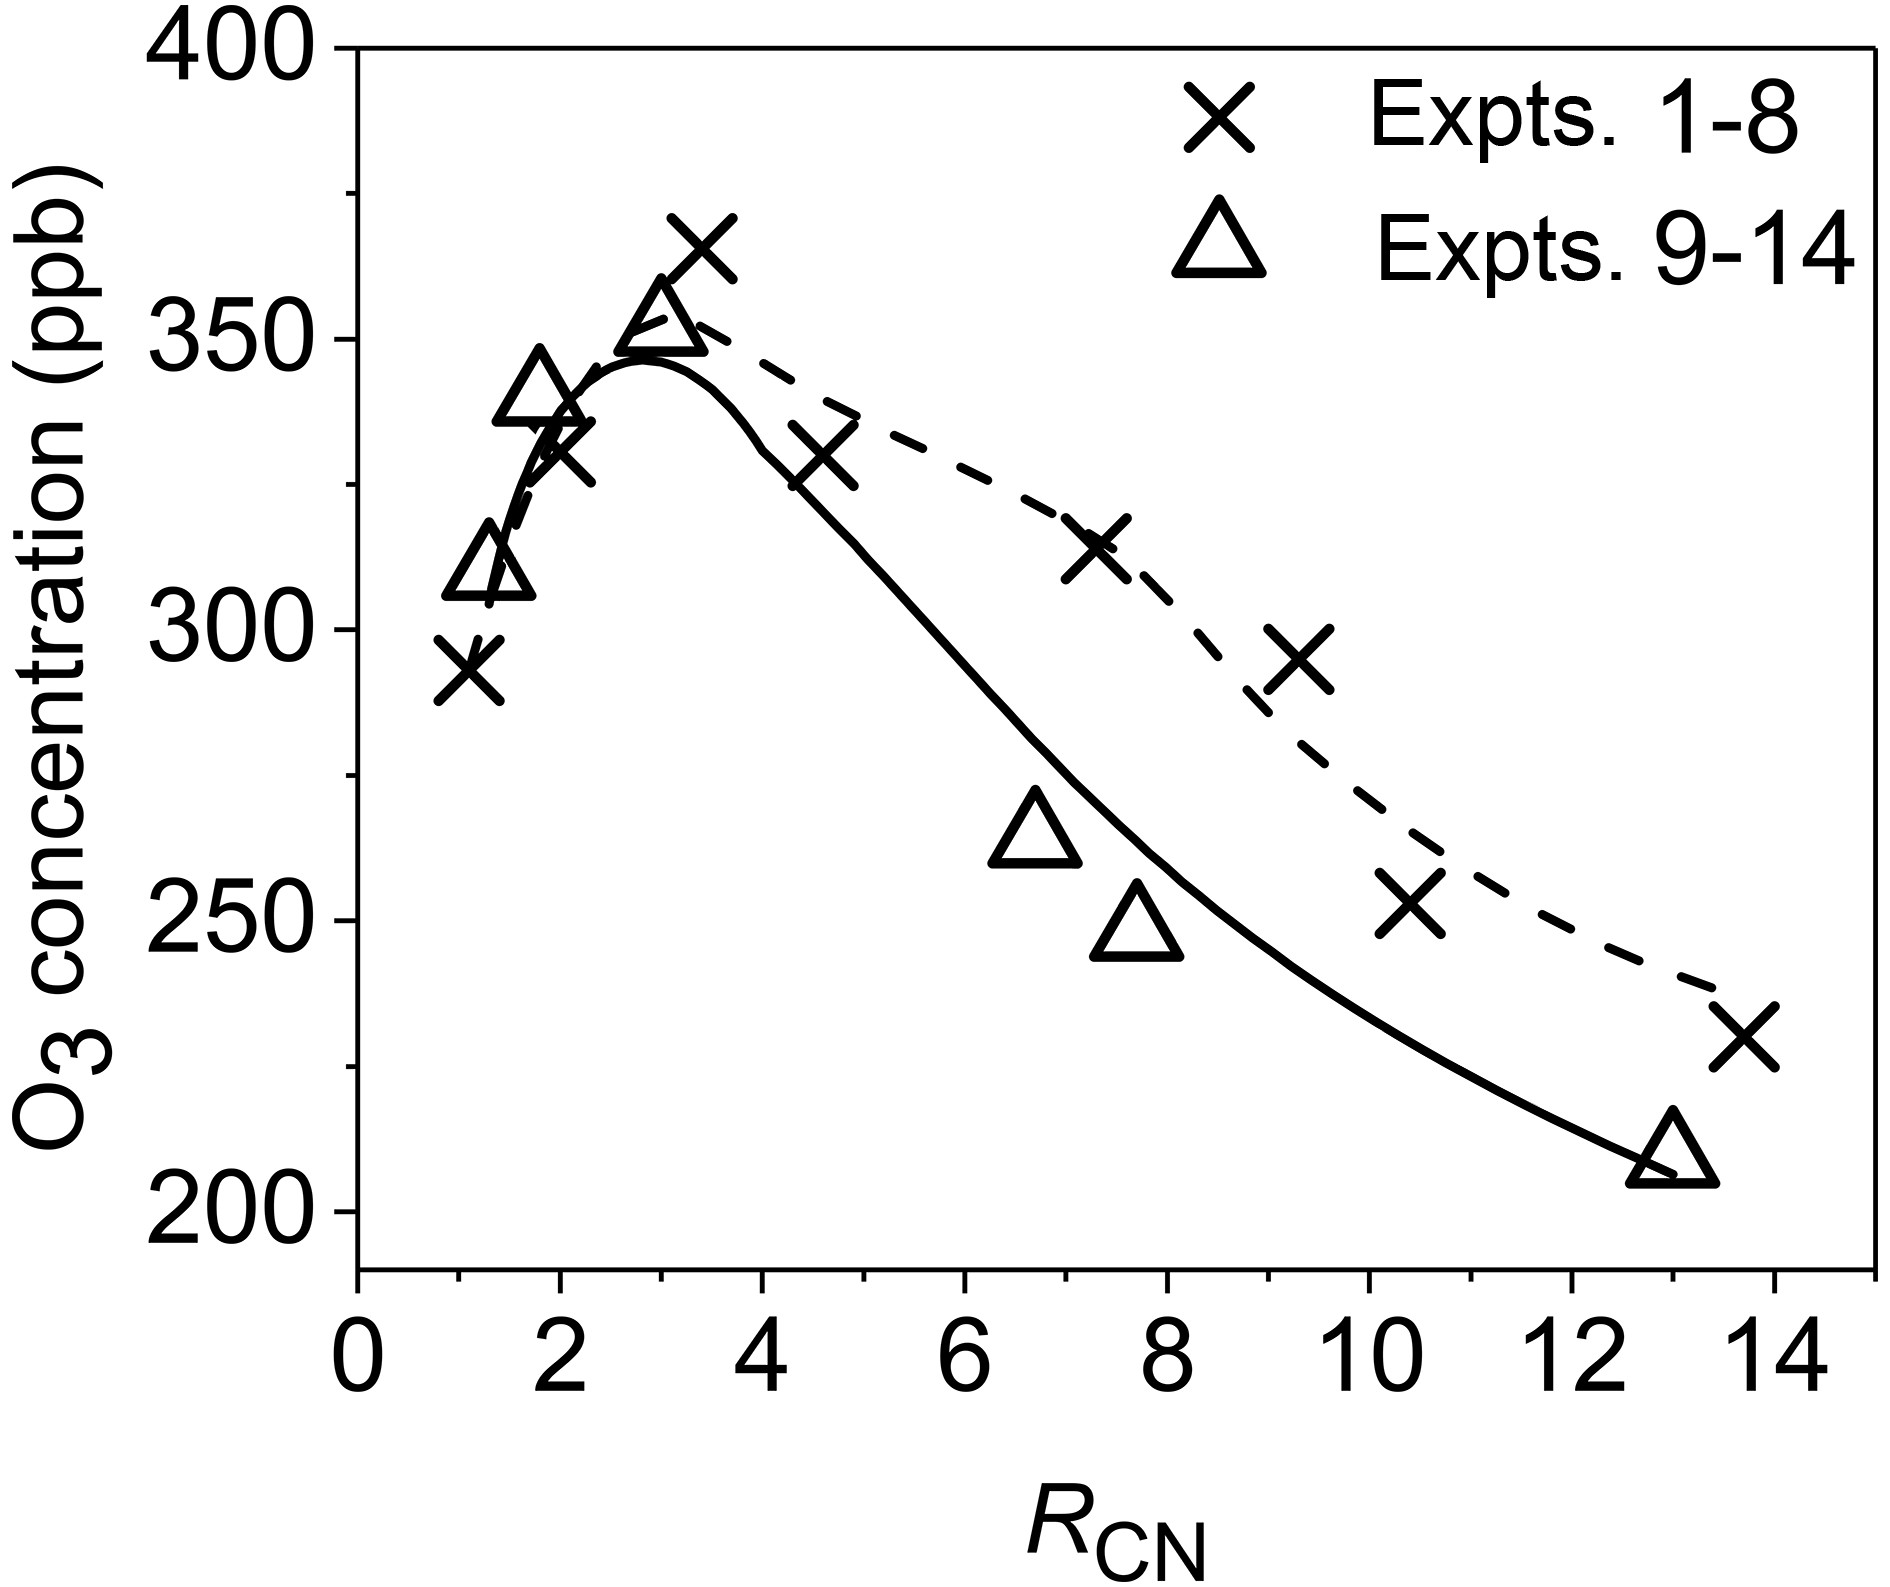
Variation of the O3 concentration with RCN at time t = 6 h is shown in Fig. 2. Under low-RH conditions (Expts. 1−8), with the increase of RCN from 1.1 to 3.4, the O3 concentration at t = 6 h increases rapidly, while the O3 concentration at t = 6 h decreases rapidly with the increase of RCN in the range of 4.6−13.7. According to the variation pattern of O3 concentration with RCN in Expts. 1−8 in Fig. 2, it is estimated that the RCN at the inflection point of the curve that describes variation of O3 concentrations with RCN is 3.2. Similarly, under high-RH conditions, the fitting result of RCN for Expts. 9−14 is 2.8 at the inflection point.
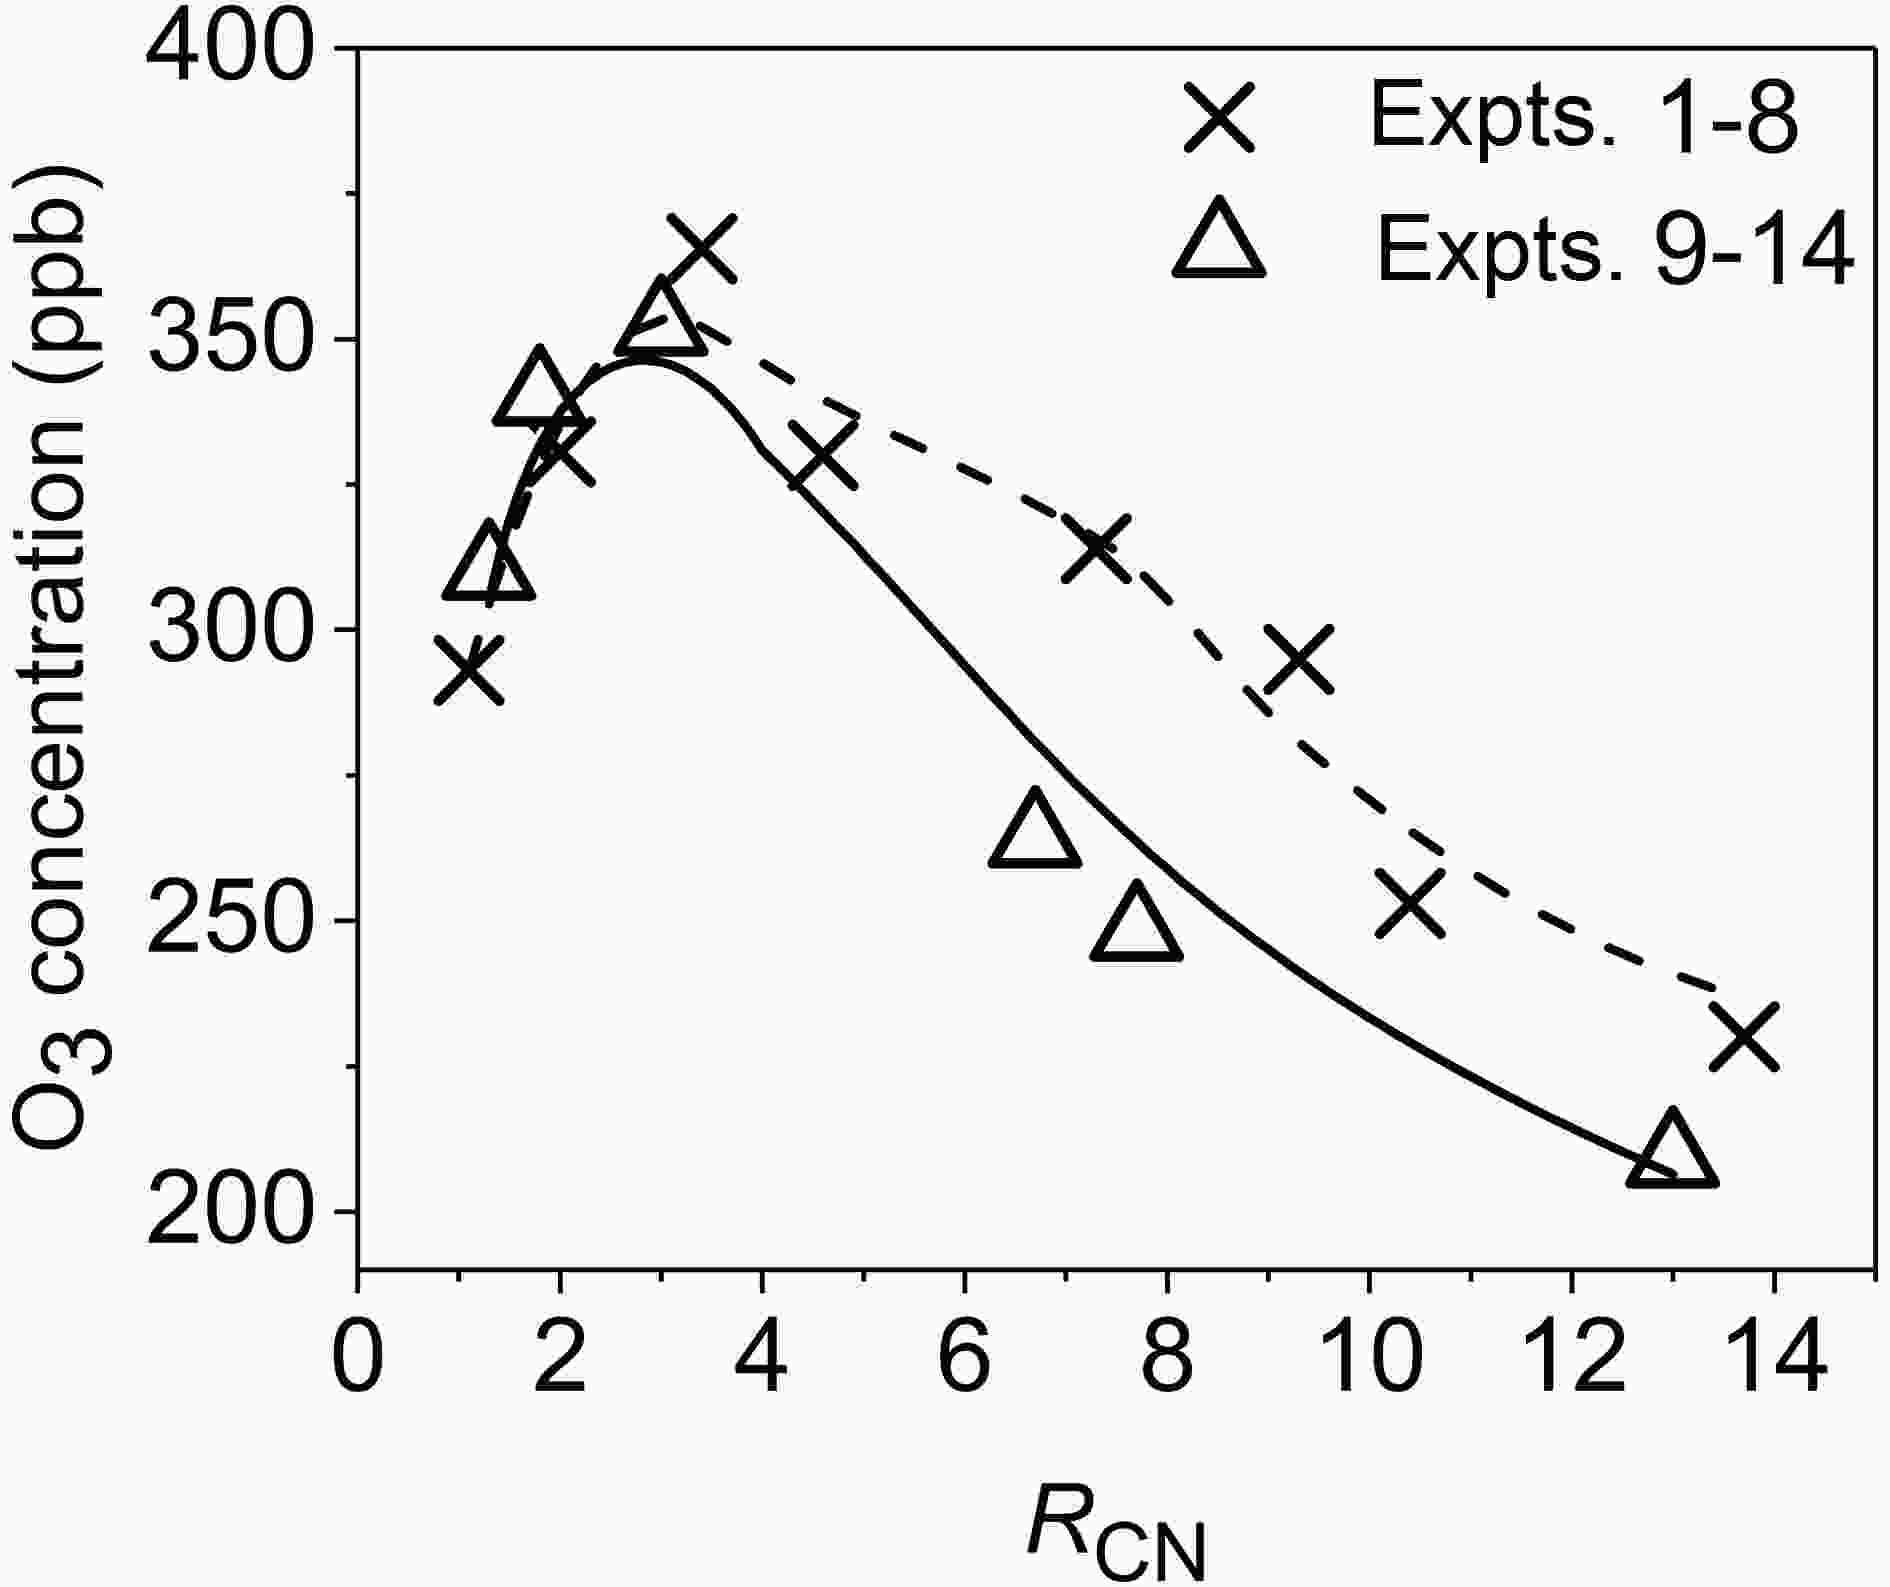
Figure 2. Variations of the O3 concentration at time t=6 h with RCN under different RHs (11.6%±1.1% in Expts. 1−8, 78.8%±1.0% in Expts. 9−14; the symbols represent experimental values, and the dashed and solid lines represent fitting results of Expts. 1−8 and Expts. 9−14, respectively).
-
It is known from Fig. 2 that the effect of RH on the O3 concentration at 6 h is different under different RCN. On the left side of the O3 inflection point (RCN < 3), there is no significant difference in the O3 concentration at 6 h between low and high RHs. As RCN rises, the difference increases. When RCN > 4.6, the O3 concentration at 6 h under high RH is about 16% lower than that under low RH on average. Under low RCN (RCN on the left side of the O3 inflection point), the wall loss rate of O3 increases under high RH, but the increase in the loss of NO2 on the reactor surface can promote the formation of O3. Thus, the RH effect on the O3 concentration is generally limited. However, under high RCN (RCN on the right side of the O3 inflection point), the increase of NO2 wall loss under high RH will further reduce the O3 formation. As a result, the O3 concentration under high RH is lower than that under low RH.
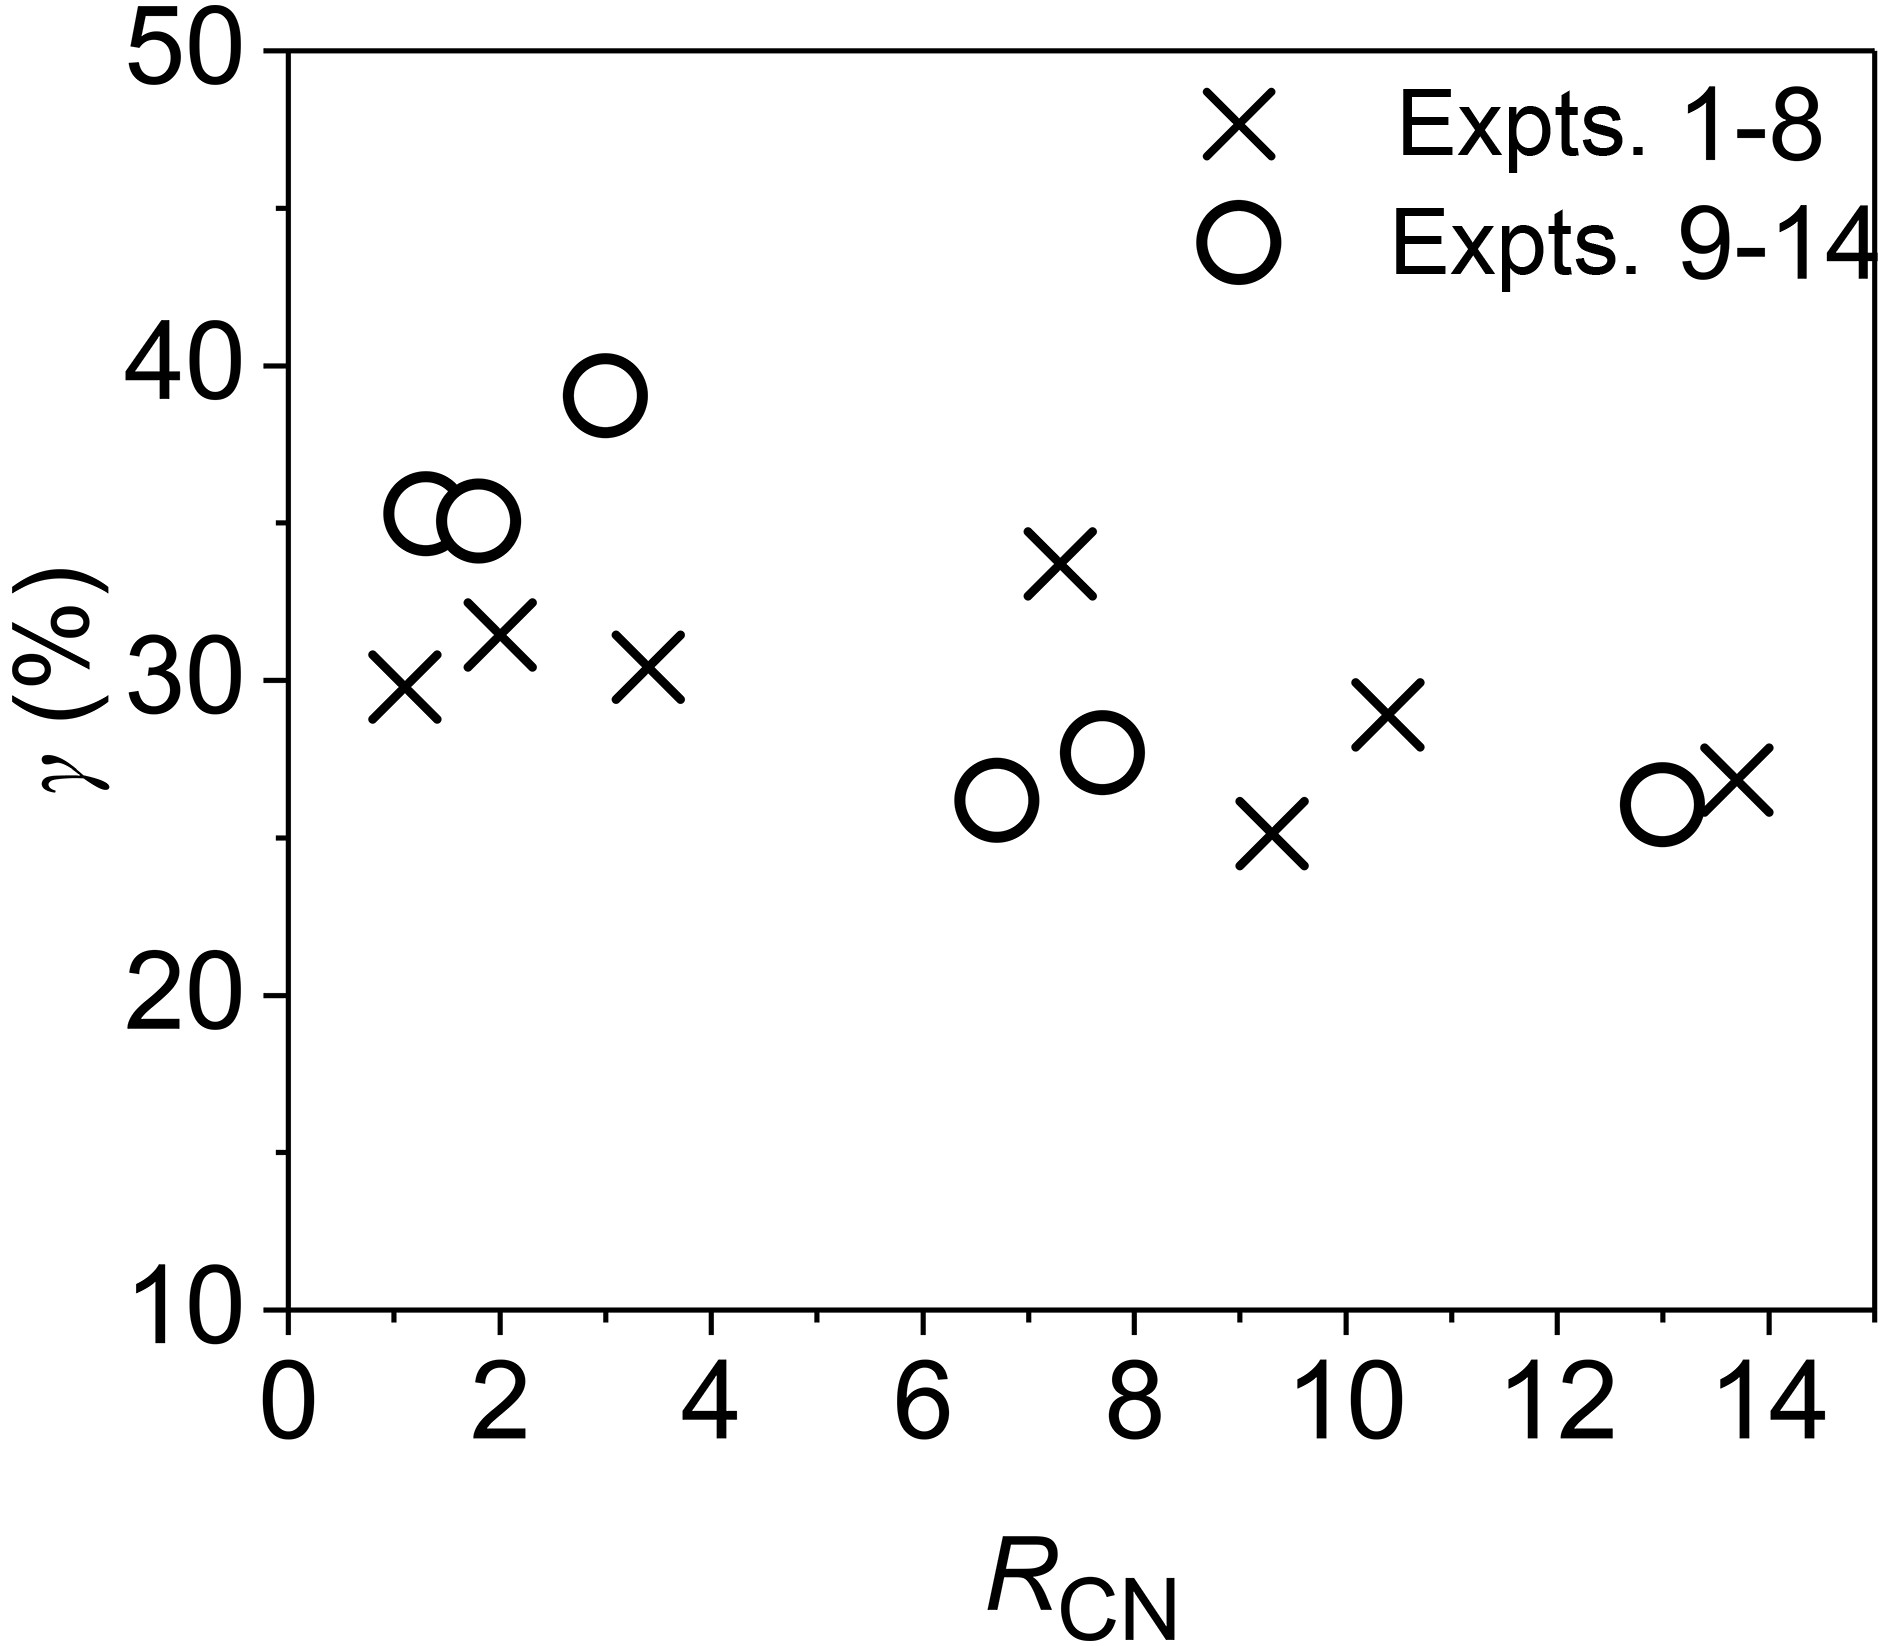
RH can also affect the amount of acetaldehyde consumed in the reaction. According to the change of CH3CHO concentrations, the proportion (γ) of CH3CHO that participated in the reaction at the end of each experiment (the ratio of CH3CHO consumed at the end of an experiment to its initial concentration) was calculated and is plotted against RCN in Fig. 3. In the low-RH experiments (Expts. 1−8), the values for γ range from 25% to 33% under the different RCN, for which γ is 31% and 29% on average under RCN ≤ 3.4 and RCN ≥ 4.6, respectively. However, in the high-RH experiments (Expts. 9−14), under RCN ≤ 3.0, the average value of γ is 36%, which is higher than that under RCN ≥ 6.7 (27%). Under low RCN, the initial concentration of NO2 was larger than that under high RCN, which generated higher HONO concentrations and OH radical concentrations. This is a main reason for larger consumption of acetaldehyde under low RCN.

Figure 3. Variations of proportion (γ) of CH3CHO consumed in the reactions with RCN.
-
In order to further study the formation of O3 from CH3CHO, the incremental reactivity (IR) of acetaldehyde is calculated using the following formula (Carter et al., 1995):
where
${\rm{\Delta }}\left({{{\rm{O}}_{\rm{3}}}{\rm{ - NO}}} \right)_{t{\rm{,test}}}^{}$ is ([O3]t−[NO]t)−([O3]0−[NO]0) measured at time t from the start of an experiment where the test VOC is added,${\rm{\Delta }}\left({{{\rm{O}}_{\rm{3}}}{\rm{ - NO}}} \right)_{t{\rm{,blank}}}^{}$ is the corresponding value from the experiment where the test VOC is not present, and [VOC]0 is the amount of test VOC added. Taking Expt. 2 as an example, we see that IR shows a strongly increasing trend with reaction time (Fig. 4a) until the end of the experiment (6 h). Similar changes in IR from other experiments are also seen, which is probably due to the presence of PAN as the reservoir of NOx in the reaction, leading to the time lag to reach the maximum O3 concentration. From the comparison of Expt. 2 (RH = 10.9%) with Expt. 10 (RH = 78.0%), it is found that RH has little effect on IR during the experiment, and the IR at the end of the experiment (6 h) in Expt. 2 is about 5% larger than that in Expt. 10. Similarly, for Expts. 8 and 14, RH generates a 12% difference in IR between these two experiments (Fig. 4a). However, the comparison of Expts. 2 (RCN = 2.0) and 8 (RCN = 13.7) shows that RCN has an effect on IR, and the IR at 6 h (IR6h) from Expt. 2 is about 1.8 times that from Expt. 8. The variation of IR6h under different RCN is shown in Fig. 4b. This indicates that under different RH conditions, the IR6h is larger under low RCN than under high RCN. Under high RCN, the low concentration of NO2 is not conducive to the formation of ozone, which is consistent with the small amount of CH3CHO consumed. In addition, the IR6h under high RH is lower than that under low RH, which is consistent with the variation of O3 concentrations under different RH conditions. The wall loss rate of O3 increases with increasing RH, which leads to a decrease in IR. Besides, the wall loss rate of NO2 also increases with the increase in RH, which further reduces the O3 formation under high RCN, leading to great reduction of the IR of acetaldehyde.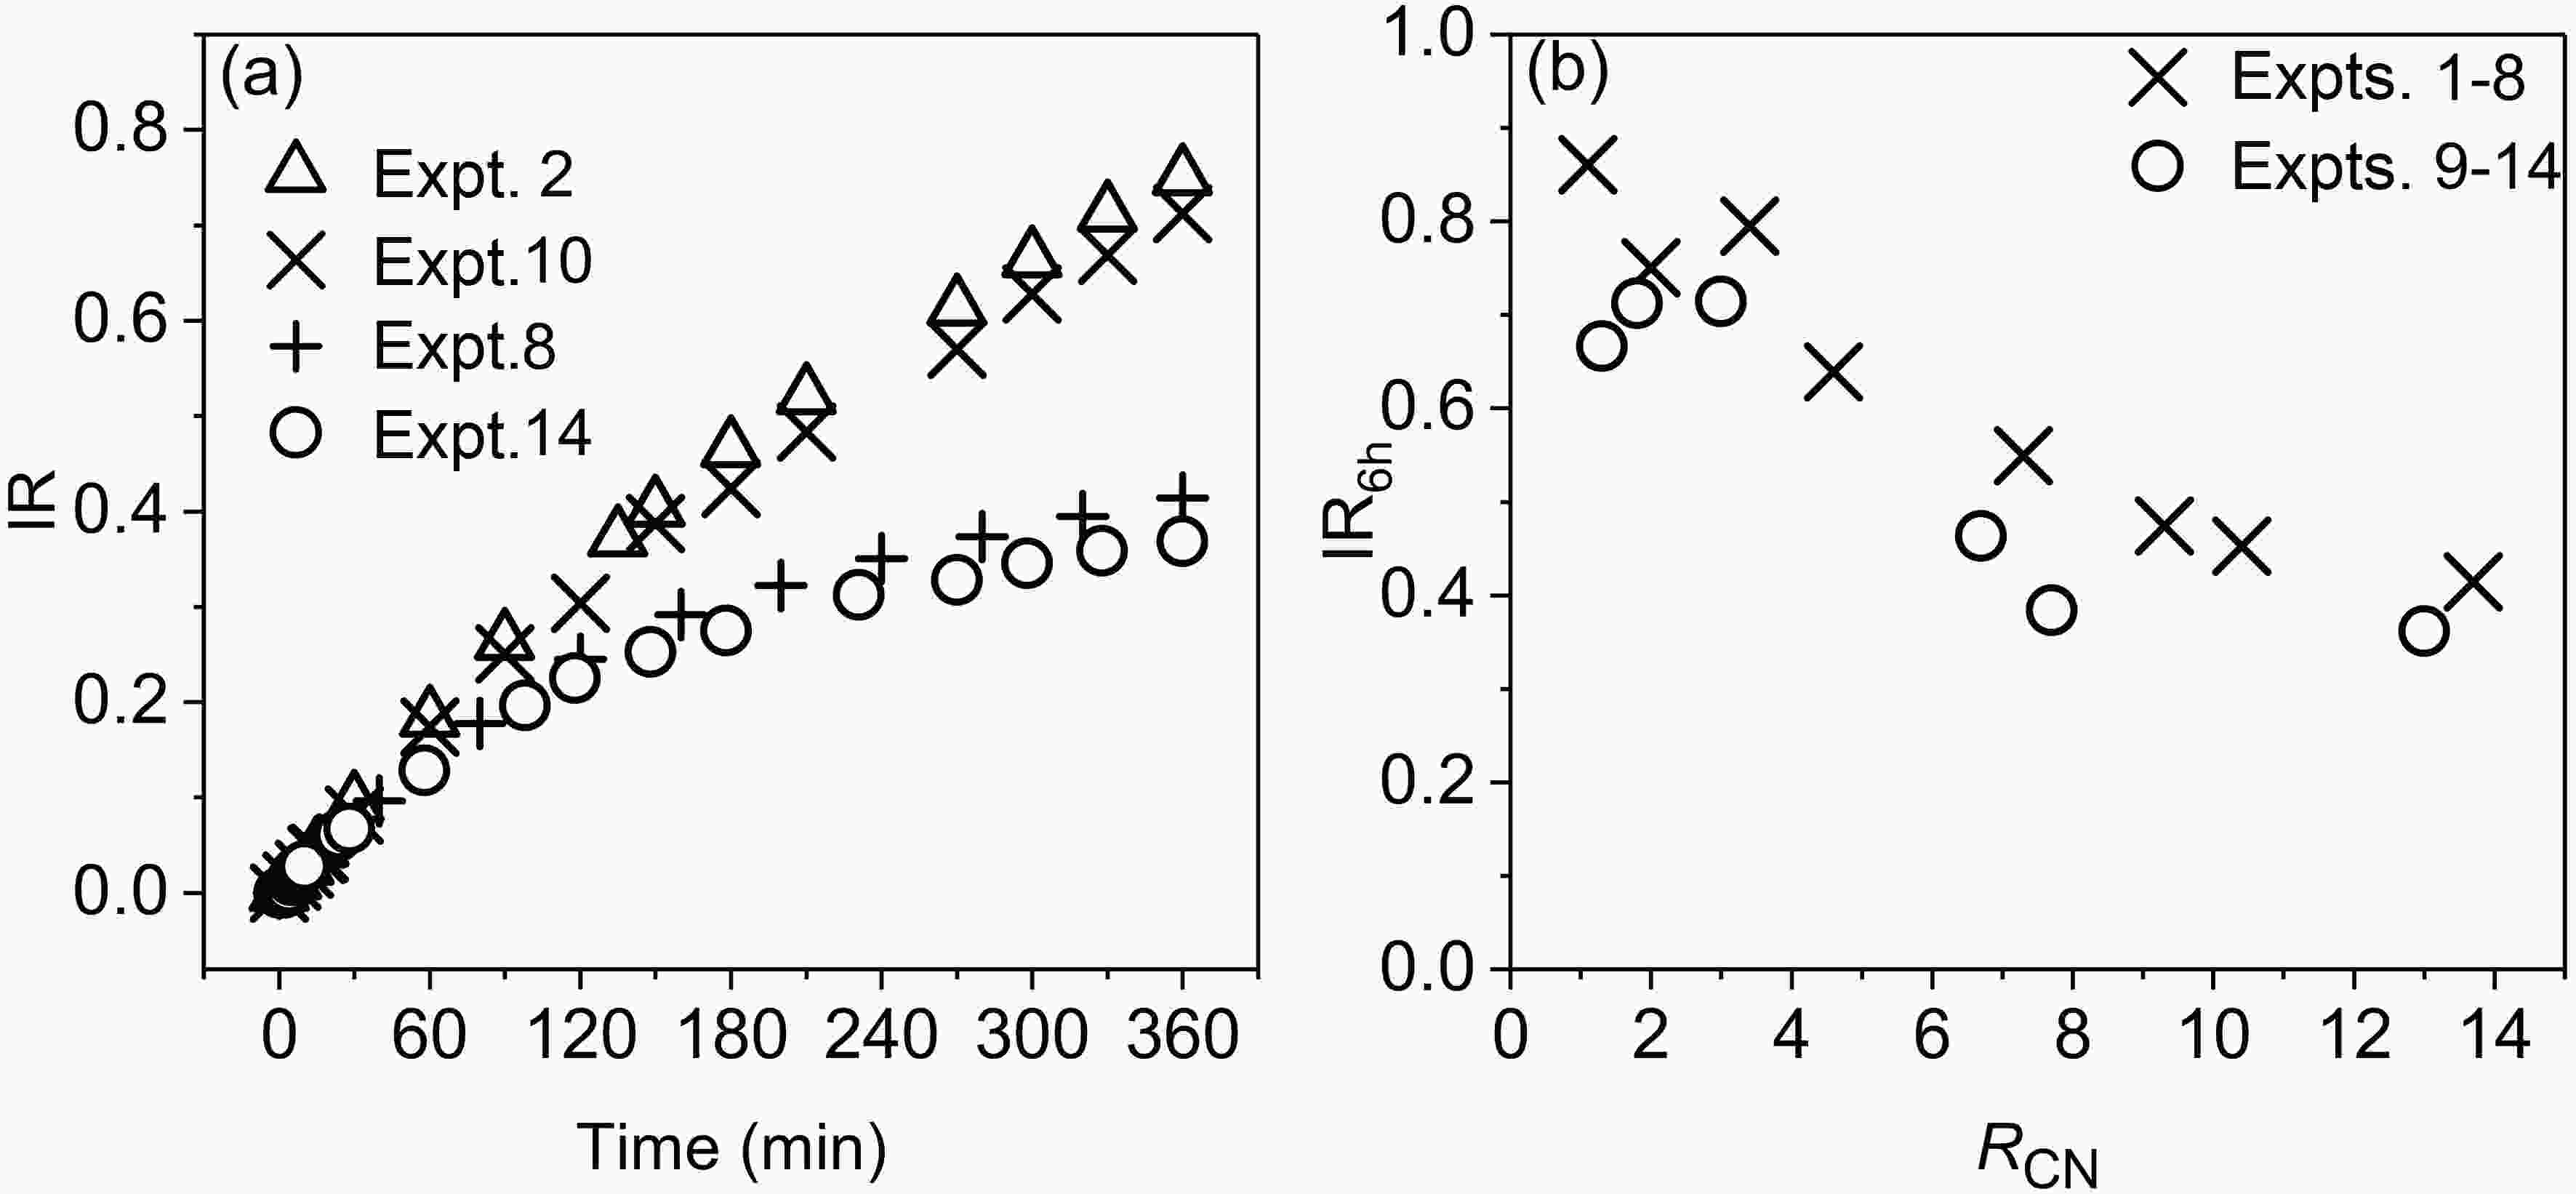
Figure 4. Variations of experiment-based incremental reactivity (IR) of acetaldehyde with time (a), and IR6h with RCN (b).
-
MCM v3.3.1 was used to simulate the concentrations of NO, NOy, CH3CHO and O3 in Expts. 1−14. The simulation from the original MCM mechanism and relevant auxiliary reactions (mainly wall losses) is named Run1 below.
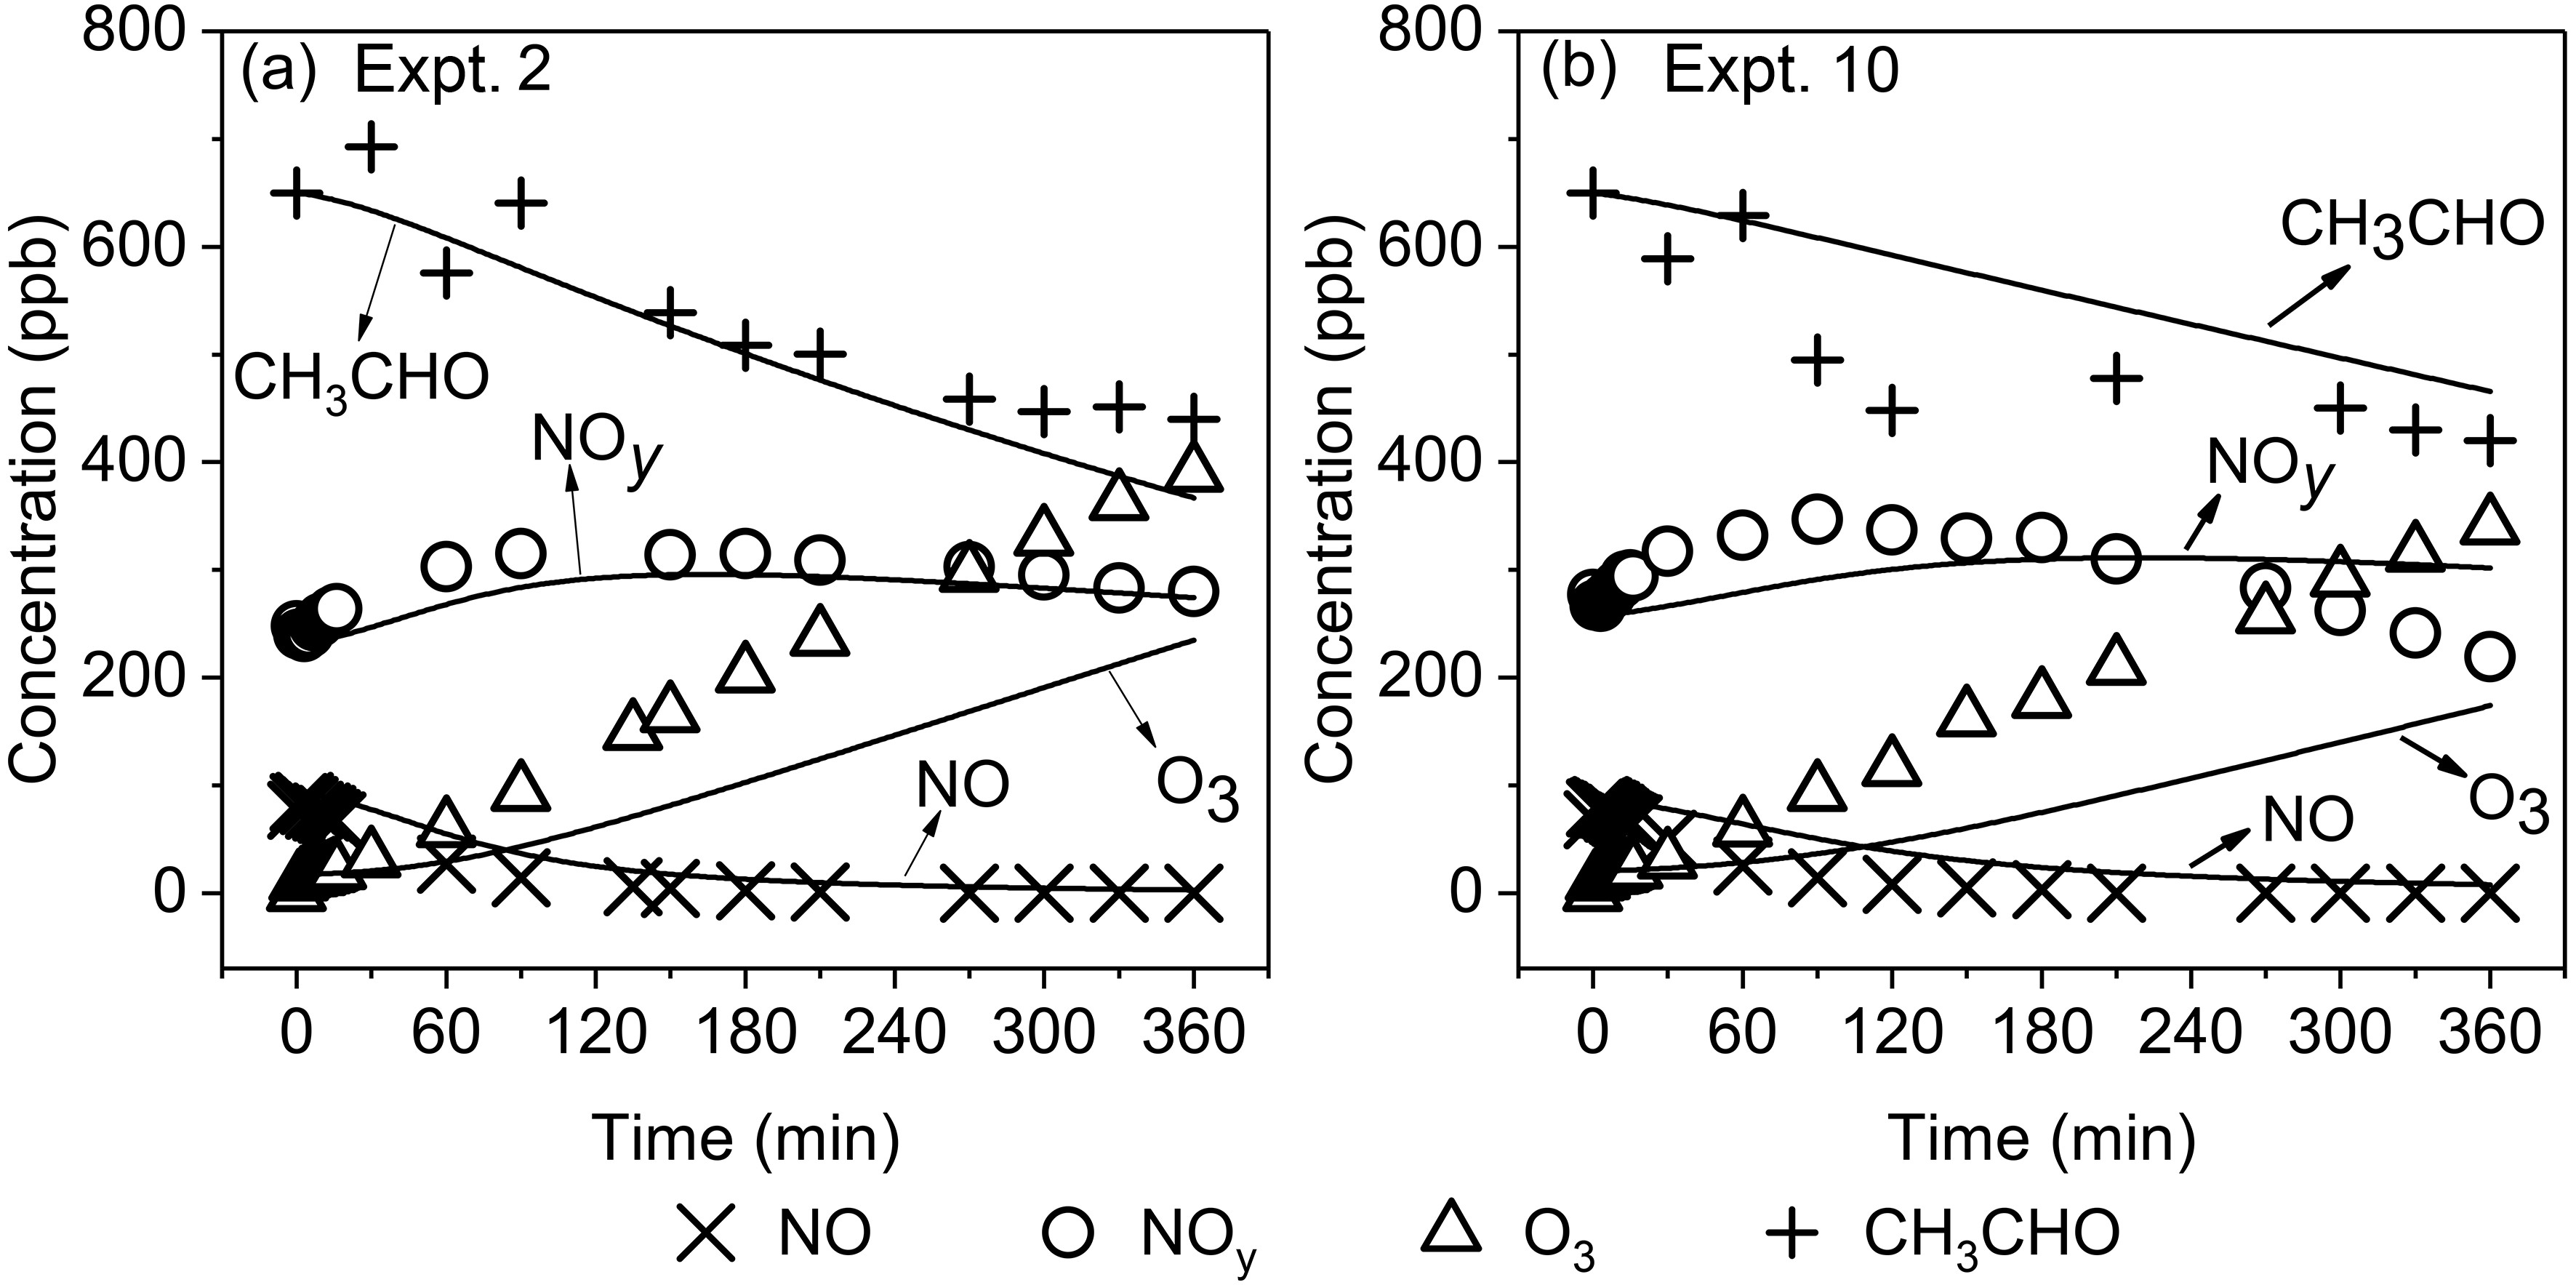
Compared with the measured O3 concentrations, the simulated results from Run1 are underestimated under different RH conditions. Taking Expts. 2 and 10 as examples (Fig. 5), we see that the differences in the O3 concentration between the simulations and experiments increase with the reaction time. As a result, the simulated O3 concentrations at the end of experiments (6 h) are 29% and 49% lower than the measured concentrations in Expts. 2 and 10, respectively. Further analysis shows that the maximum difference between the simulated and measured O3 concentrations at the end of experiments appears to be at the inflection point of the curve that describes variation of O3 concentrations with RCN (Figs. 6a and 6b). Meanwhile, it should be noted from Figs. 6a and 6b that under both low and high RHs, the RCN values at the inflection point of O3 concentrations at 6 h differ greatly between the experiments and simulations. For Expts. 9−14 with high RH, the experimental O3 concentration at 6 h reaches a maximum at RCN = 3.0 (Expt. 11), while the simulated O3 concentration reaches the maximum at RCN = 7.7 (Expt. 13). Thus, the simulated O3 concentration at 6 h for the RCN of 3.0 (Expt. 11) is 49% lower than the observed value, while for the RCN of 7.7 (Expt. 13) the simulated value is only 17% lower than the observed one. Similarly, for Expts. 1−8 with low RH, the experimental O3 concentration at 6 h reaches a maximum at RCN = 3.4 (Expt. 3), while the simulated value reaches the maximum at RCN = 4.6 (Expt. 4), leading to the maximum difference between the simulated and measured O3 concentrations appearing at RCN = 3.4 (Expt. 3).
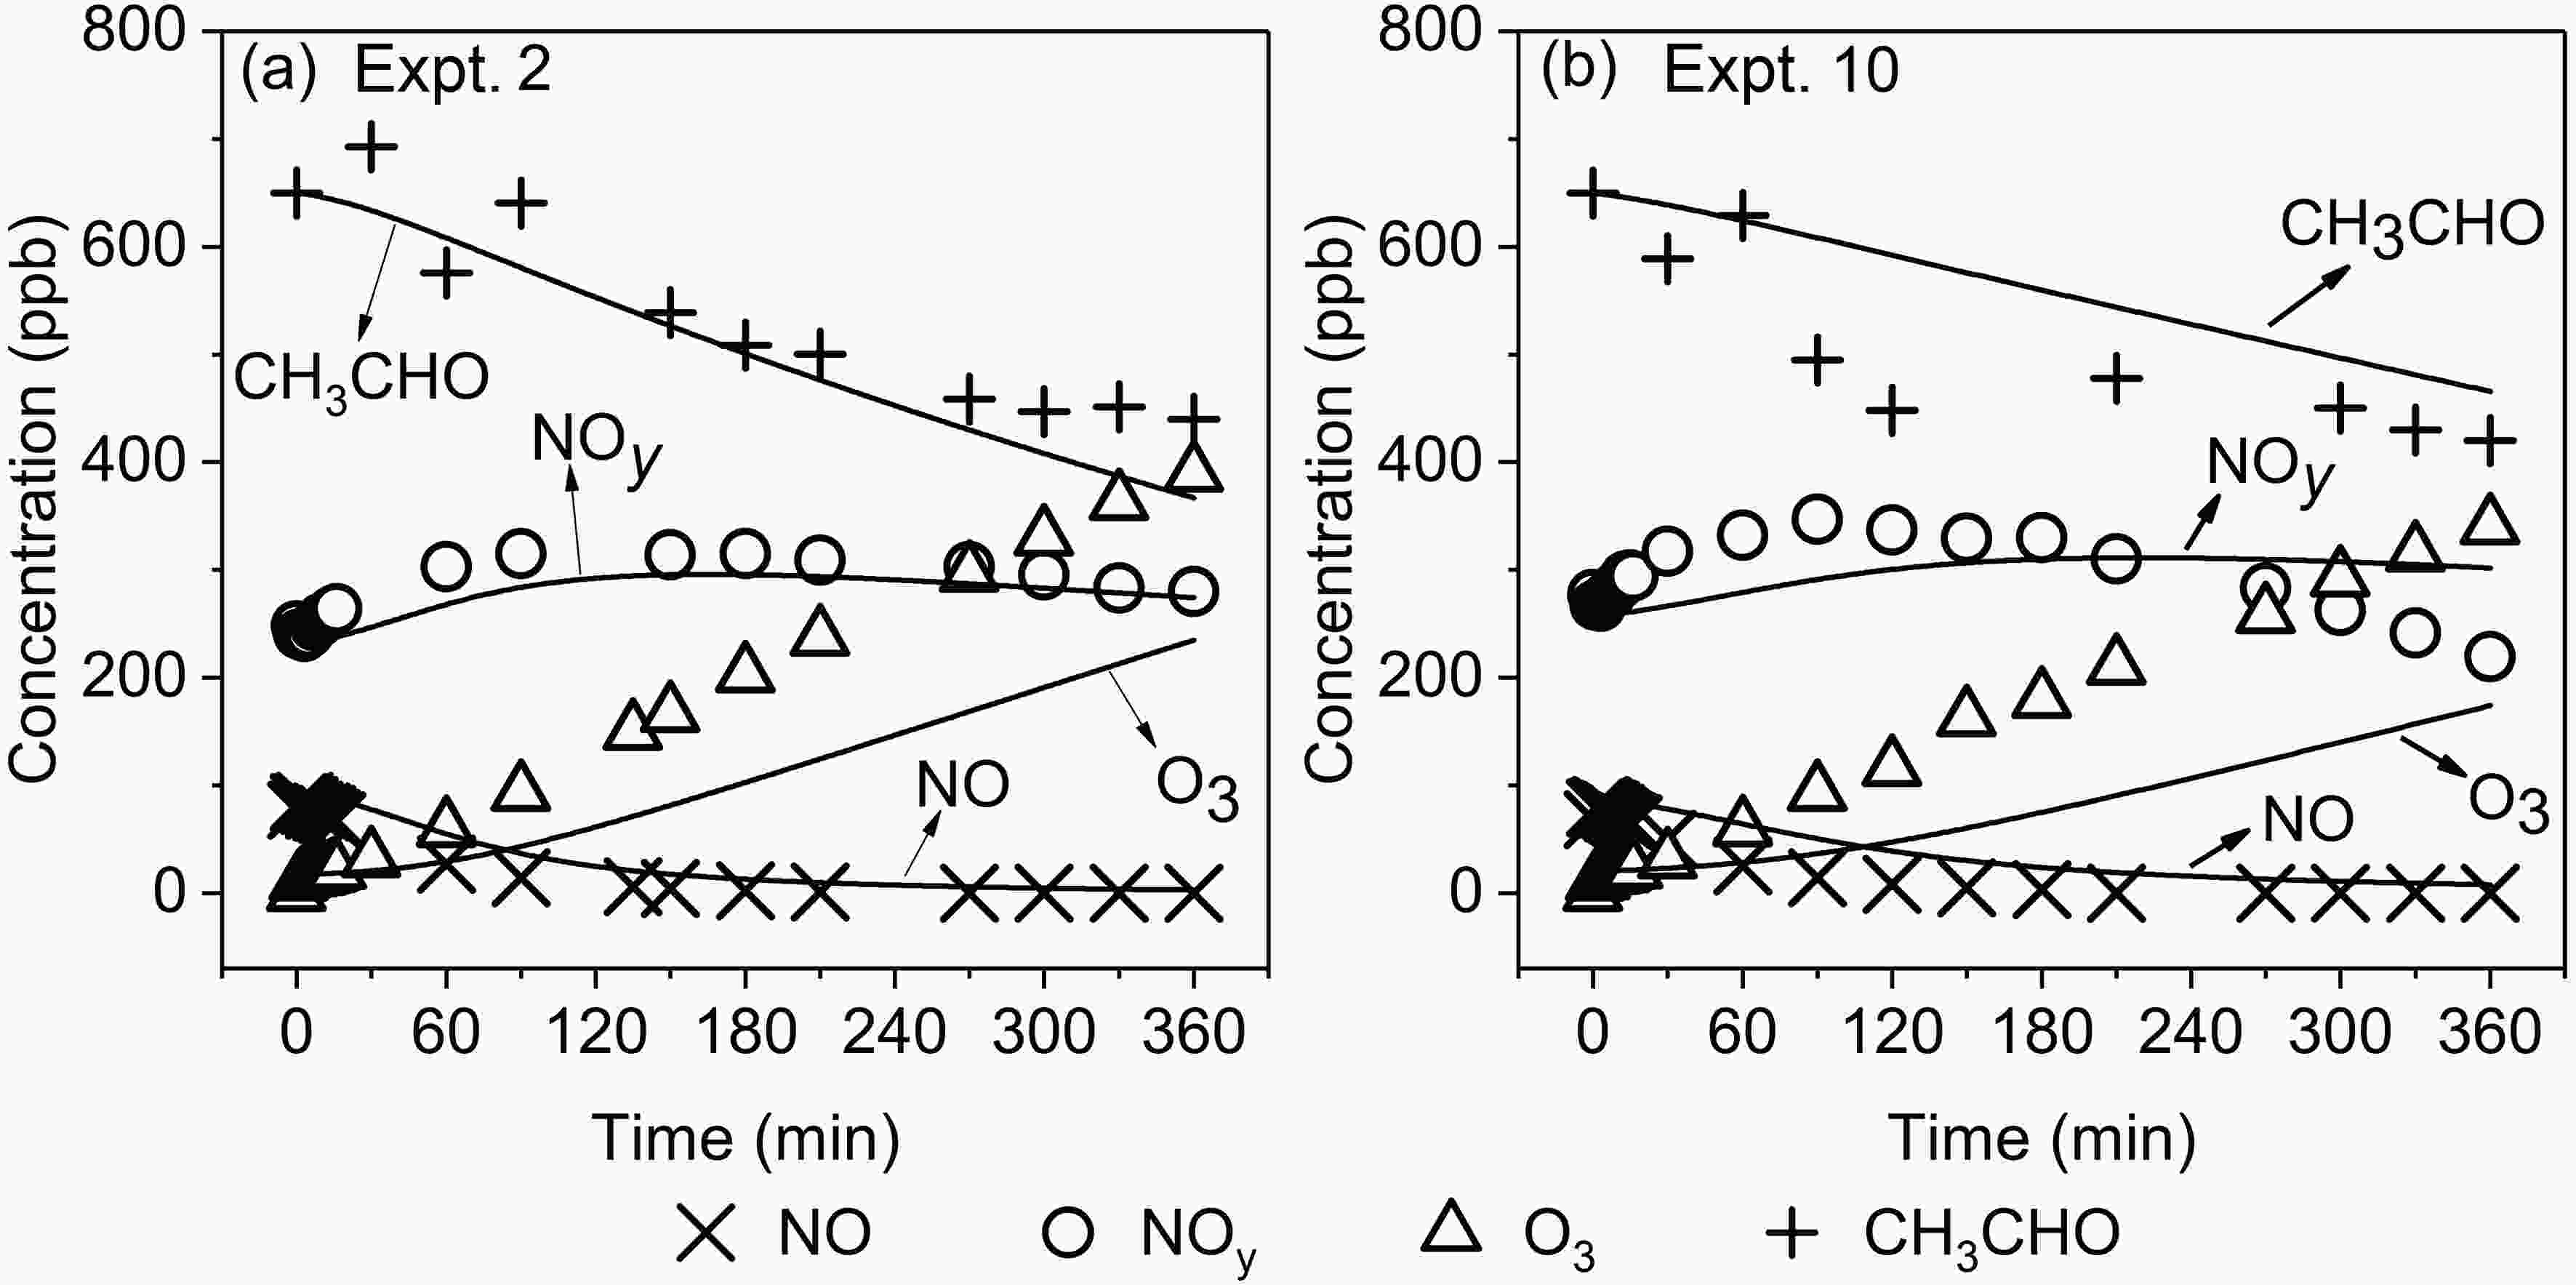
Figure 5. Variations of simulated and measured concentrations of NO, NOy, O3 and CH3CHO (Symbol in the figure represents experimental observation values, and solid line represents simulated values by MCM v3.3.1).
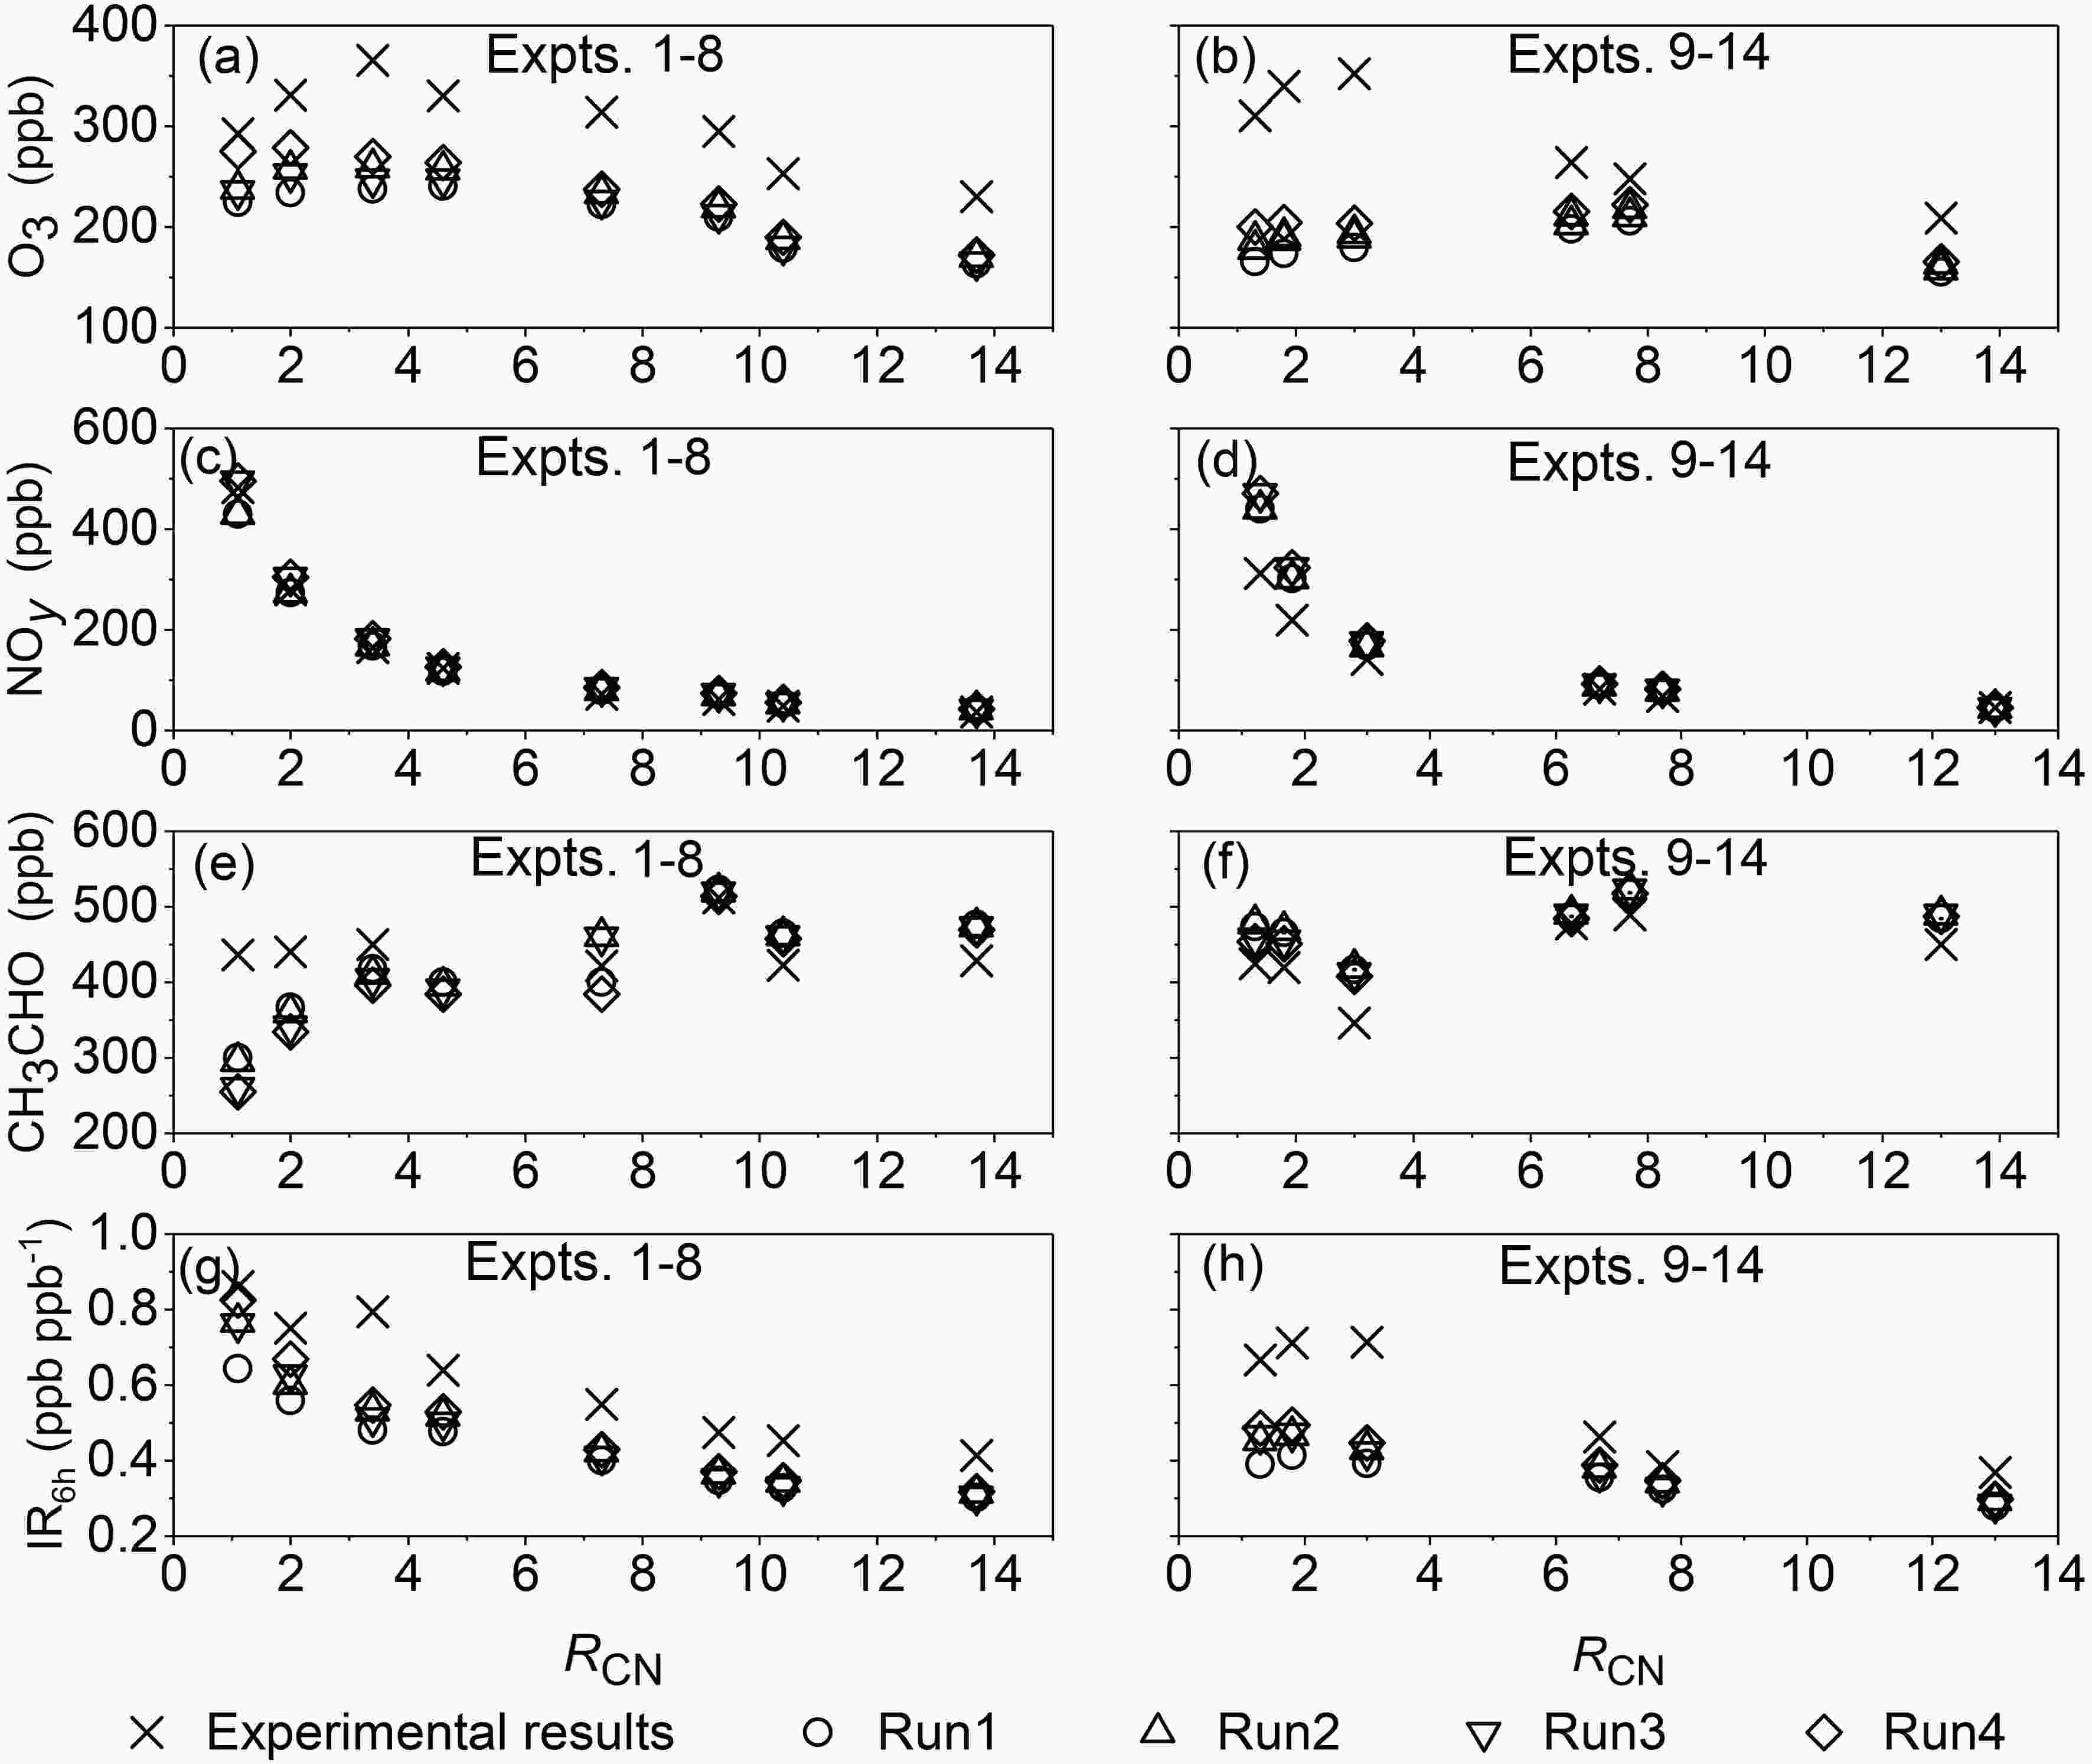
Figure 6. Comparison of simulated and measured concentrations of O3, NOy, CH3CHO and IR6h at the end of experiments from different cases (Run1: original MCM v3.3.1; Run2: MCM v3.3.1 with R1; Run3: MCM v3.3.1 with R2; Run4: MCM v3.3.1 with R1 and R2).
It can be concluded that when RCN ≤ 3.4, the difference in the O3 concentration at 6 h between simulations and experiments in the high-RH experiments (48% ± 1%) is larger than that in the low-RH experiments (29% ± 6%), while when RCN ≥ 4.6, this difference in the high-RH experiments (23%±5%) is smaller than that in the low-RH experiments (29% ± 1%).
Run1 simulates well the variation of the experimental NO concentration, although the simulated concentration is higher than the measured value, which is consistent with the underestimation of O3 in Run1. Meanwhile, Run1 simulates well the variation of NOy with time (Fig. 5), with the largest difference between the simulated and measured values mainly appearing at the end of the experiments (6 h) as a whole, as shown in Figs. 6c and 6d. The differences in the NOy concentration at 6 h between the simulations and experiments are generally less than 20% except for Expt. 9 (41%) and Expt. 10 (38%). Under high-RH conditions, the effect of wall losses on NOy was probably large, and at the same time, the NOy concentration decreased with increasing RCN. Combination of high RH and low RCN generates the large difference in NOy for Expts. 9 and 10.
The difference between the measured and simulated CH3CHO concentrations is relatively smaller than that for other chemical components, with the largest difference appearing at the end of Expt. 1, in which the simulated result is 31% lower than the measured result (Figs. 6e and 6f). Nevertheless, under low- and high-RH conditions, the differences between the simulated and measured CH3CHO concentrations at the end of the experiments are 12% ± 10% and 9% ± 7% on average, respectively. In addition, in the low-RH experiments (Expts. 1−8), the simulated acetaldehyde concentration at 6 h gradually varies from underestimate to overestimate, while in the high-RH experiments (Expts. 9−14), all Run1-simulated results are slightly larger than the experimental results. The simulation of CH3CHO can be affected by the simulation of NOy. For example, when Run1-simulated results underestimate the experimental concentrations of NOy under low RCN, the reaction between OH radical and acetaldehyde is generally enhanced, which leads to the underestimation of the acetaldehyde concentration, whereas under high RCN, the overestimation of NOy can promote the formation of OH radicals, which also can lead to the underestimation of acetaldehyde.
It is known that the accuracy of Run1-simulated results for different species is different in the photochemical reaction of acetaldehyde, and the accuracy of simulated results is closely related to the reactant concentration and RH. Therefore, for the verification of the accuracy of different mechanisms for the photochemical reaction of acetaldehyde, the influence of reaction conditions should be fully considered.
-
The simulated IR value of acetaldehyde at the end of experiments (6 h) by MCM v3.3.1 is lower than the experiment-based value (Figs. 6g and 6h), with the underestimated values being 28% ± 5% in Expts. 1−8 and 32% ± 12% in Expts. 9−14, respectively. In the low-RH experiments (Expts. 1−8) both the simulated and experiment-based IR6h values decrease with increasing RCN, while in the high-RH experiments (Expts. 9−14), the experiment-based IR6h varies non-monotonically with increasing RCN, but the simulated IR6h varies steadily as a whole. It is known that high RH accentuates the difference in IR6h between MCM and experiments. This further demonstrates that the mechanism of the photochemistry of acetaldehyde in MCM v3.3.1 probably needs to be improved.
-
In the simulation results from Run1, the NOy concentration includes the PAN concentration, which can account for about 80% of the NOy concentration at the end of the experiments. Because there are some differences in the NOy concentration between the Run1-simulated and experimental results, it is considered that the reaction process of PAN is probably important for improving the simulation.
The removal process of PAN in the real atmospheric environment mainly includes its reaction with OH radicals, pyrolysis process and photolysis process (R1) (Seinfeld and Pandis, 2006). It is considered that the atmospheric loss rate of PAN by photolysis is greater than that by its reaction with OH radicals, and when altitude is > 7 km from the ground, the loss rate of PAN by photolysis is even larger than that by pyrolysis (Talukdar et al., 1995).
Many researchers have investigated the photolysis process of PAN (Libuda and Zabel, 1995; Talukdar et al., 1995; Flowers et al., 2007). With the further understanding of the photolysis process of PAN, the influence of photolysis processes on the loss of PAN has been gradually realized in the photochemical reaction of acetaldehyde. In the earlier version (SAPRC-99) of the SAPRC mechanism, the photolysis process of PAN (R1) was ignored. This process was included for the first time in version SAPRC-07 (Carter, 2010), and it is also used in the latest version of SAPRC-11 (Carter and Heo, 2013). The photolysis rate constant adopted was k1 = 6.12 × 10⁻⁵ cm3 molecule−1 s−1 (300 K). Nevertheless, only the reaction of PAN with OH radicals and its pyrolysis have been included in MCM v3.3.1, while the photolysis of PAN has not yet been included.
In order to determine the influence of R1 on the photochemical reaction of acetaldehyde in this study, R1 was added to original MCM v3.3.1, and k1 = 6.12 × 10⁻⁵ cm3 molecule−1 s−1 was also used in the simulation, but the influence of temperature difference between different experiments is ignored. The smog chamber experiments in this study were re-simulated, which is named Run2 below.
The simulated O3 concentrations at time t = 6 h from Run2 are shown in Figs. 6a and 6b. Compared with Run1, the simulated O3 concentrations at 6 h in Expts. 1−8 and Expts. 9−14 in Run2 increased by 4%−10% and 5%−8%, respectively. Also, the increased amount for RCN ≤ 3.4 (8.3% ± 2.1% for Expts. 1−8 and 7.7% ± 0.2% for Expts. 9−14) is larger than that for RCN ≥ 4.6 (5.1% ± 0.9% and 6.0% ± 0.9%). In Expts. 1−8 and Expts. 9−14, the average differences between the Run2-simulated and measured NOy concentrations at 6 h are 3% ± 9% and 19% ± 17%, respectively, which are close to those between the Run1-simulated and measured results (4% ± 9% and 20% ± 17%) (Figs. 6c and 6d). Similarly, the average differences between the Run2-simulated and measured CH3CHO concentrations at 6 h are 4% ± 16% and 11% ± 6% for Expts. 1−8 and Expts. 9−14, which are also close to those between Run1 and experimental results (5% ± 15% and 10% ± 6%) (Figs. 6e and 6f). Because of the competitive reactions of PAN and CH3CHO with OH radicals, adding R1 to MCM will lead to the increase of OH radical concentrations, which will slightly increase the amount of CH3CHO consumed in the reactions and promote the formation of O3. For example, compared with the simulation results for Expt. 2 in Run1, the OH radical concentration at 6 h in Run2 increased by 9% in Run2, and the amount of the consumed CH3CHO increased by 3%, leading to a 10% increase in the O3 concentration at 6 h.
In recent years, some studies have found that the photolysis reaction (R2) of nitric acid or nitrate adsorbed on the surface of natural and artificial materials may be an important source of HONO in the atmospheric environment, which is 1−3 orders of magnitude higher than that in the gas or liquid phase (Baergen and Donaldson, 2013; Ye et al., 2016, 2019). In the simulation of Run1 and Run2, the photolysis process of HNO3 adsorbed on the reactor surface was treated the same as that in the gas phase, which may lead to a difference between the simulated and measured results. Thus, reaction R2 was added to the original MCM v3.3.1 (without R1) and then the simulation was re-conducted (Run3). In order to determine the maximum effect of reaction R2 on the results, the photolysis rate constant used for R2 was taken to be 3 orders of magnitude higher than that in the gas phase.
Compared with Run1, under low-RH conditions, the simulated O3 concentrations at 6 h for RCN ≤ 3.4 in Run3 increased by 4%−8%, while for RCN ≥ 4.6, they increased by only 1%−3%. Nevertheless, under high-RH conditions, the simulated O3 concentrations at 6 h for RCN ≤ 3.0 in Run3 increased by 5%−13%, but for RCN ≥ 6.7, they increased by only 1%−2%. Compared with Run1, the Run3-simulated NOy concentrations at 6 h only increased by 8% and 6% on average in Expts. 1−8 and Expts. 9−14, respectively. The Run3-simulated CH3CHO concentrations at 6 h are 6% ± 19% and 9% ± 6% higher than the measured results in Expts. 1−8 and Expts. 9−14, respectively, which are also close to those between Run1-simulated results and experiments (5% ± 15% and 10% ± 6% in Expts. 1−8 and Expts. 9−14) (Figs. 6e and 6f). Therefore, compared with the Run1-simulated results, the results of NOy and O3 are improved to some extent under different reaction conditions.
As discussed above, compared with the Run1-simulated results, the increase of O3 in Run2 was generally larger than that in Run3, which may be due to the effect of HNO3 concentration on the reactor surface. Because the effect of R2 on the reaction increases with the increase of the HNO3 concentration on the reactor surface, in the early stage of the reaction, the low content of HNO3 on the reactor surface led to the small effect of R2 on the reaction. Taking Expt. 2 as an example, compared with the simulation results in Run1, the OH radical concentration at 3 h increased by 11% in Run3, while it increased by 28% at 6 h. Under high RCN, the content of HNO3 on the reactor surface is lower than that under low RCN. Thus, after R2 was added into the MCM, the increase for O3 under high RCN is smaller than that under low RCN.
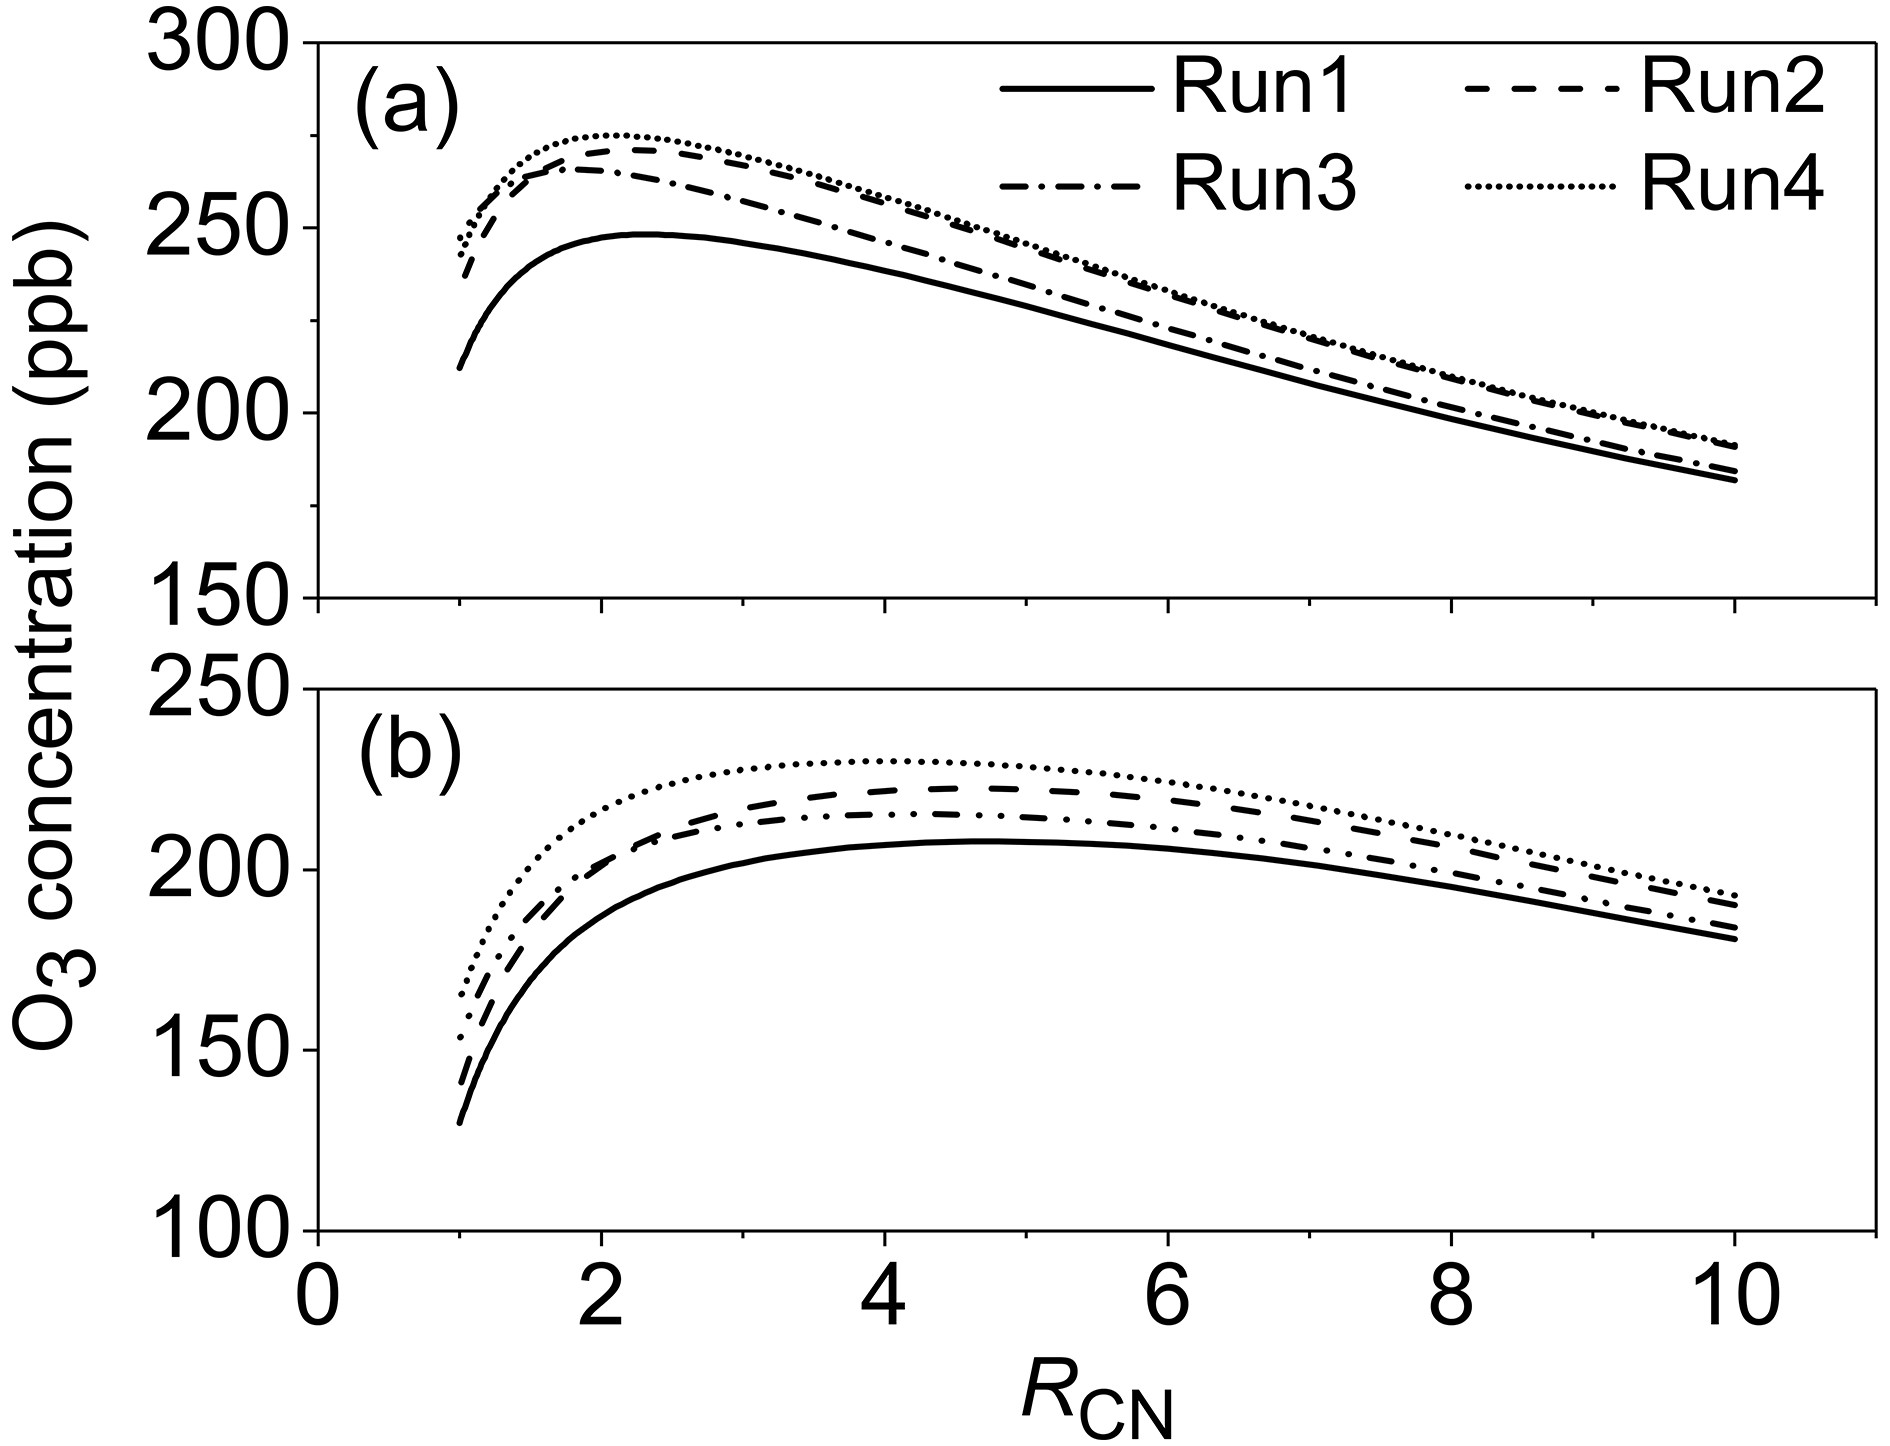
Because both reactions R1 and R2 can affect the conversion of NOx, there may be interactions between R1 and R2 in the reaction. In order to determine the influence of the interaction between R1 and R2 on the simulated results, both R1 and R2 were added into the original MCM v3.3.1 for re-simulation (Run4) (Fig. 6). Under low-RH conditions (Expts. 1−8), the simulated O3 concentrations at 6 h in Run4 increased by 14%−23% as compared with those in Run1 for RCN ≤ 3.4, while they displayed an increase of 5%−10% for RCN ≥ 4.6 (Fig. 6a). Similarly, under high-RH conditions (Expts. 9−14), compared with Run1, the simulated O3 concentrations at 6 h in Run4 increased by 13%−21% and 6%−9% for RCN ≤ 3.0 and RCN ≥ 6.7, respectively (Fig. 6b). On the whole, the differences in O3 concentrations at 6 h between simulations and experiments are greatly reduced from 24%−35% and 17%−49% in Run1 to 6%−26% and 10%−42% in Run4 for low- and high-RH experiments, respectively. This demonstrates that the inclusion of both R1 and R2 in MCM can greatly improve the simulation of O3 by 13%−74%, relative to original MCM. Meanwhile, compared with the Run1-simulated IR6h, Run4-simulated results of IR6h increased by 12% ± 8% and 14% ± 7% in Expts. 1−8 and Expts. 9−14, respectively (Figs. 6g and 6h).
It is known from the simulated O3 concentrations that the combined effect of R1 and R2 is clearly greater than that of R1 or R2 alone and is nearly equal to the total effect of the sum of R1 and R2 in some experiments. Taking Expt. 2 as an example, compared with Run1, the addition of R1 into original MCM (Run2) reduced the concentration of PAN at 6 h by 1.2%, but increased the concentration of HNO3 on the reactor surface at 6 h by 4.0%, which increased the O3 concentration at 6 h by 10.4%. After adding R2 into original MCM (Run3), the HNO3 on the reactor surface at 6 h reduces by 69.1%, but the PAN concentration at 6 h increased by 15.8%, leading to the increase of the O3 concentration at 6 h by 8.4%. After adding R2 and R3 into original MCM (Run4), the HNO3 on the reactor surface at 6 h reduced by 67.9%, but the PAN concentration at 6 h increased by 15.0%. As a result, the O3 concentration at 6 h increased by 19.7%. Therefore, when R1 and R2 exist at the same time, their effects on the O3 concentration are close to the total effect of the sum of R1 and R2.
In order to see whether MCM can accurately determine the inflection point of variation of the O3 concentrations at 6 h with RCN, the MCM mechanisms used in Runs1−4 above were used to simulate the O3 concentrations at 6 h (CH3CHO = 600 ppb). Under the conditions of RH = 12%, the RCN at the inflexion points in Runs1−4 was found to be 2.4, 2.2, 1.8 and 2.1, respectively (Fig. 7). Obviously, the simulation that is closest to the fitting result in Expts. 1−8 (RCN = 3.2) is Run1, followed by Run2, Run4 and Run3. Under the condition of RH = 78%, the RCN at the inflexion points in Runs1−4 is 4.8, 4.6, 4.1 and 4.0, respectively, while it is 2.8 from the fitting result in Expts. 9−14. Therefore, the modified MCM can improve the simulation of RCN at the inflection point under high-RH conditions while it can worsen the simulation under low-RH conditions. In addition, the simulated results in Runs1−4 also show that the effects of RH on the O3 concentrations under high RCN are larger than those under low RCN, which is in agreement with experimental results.
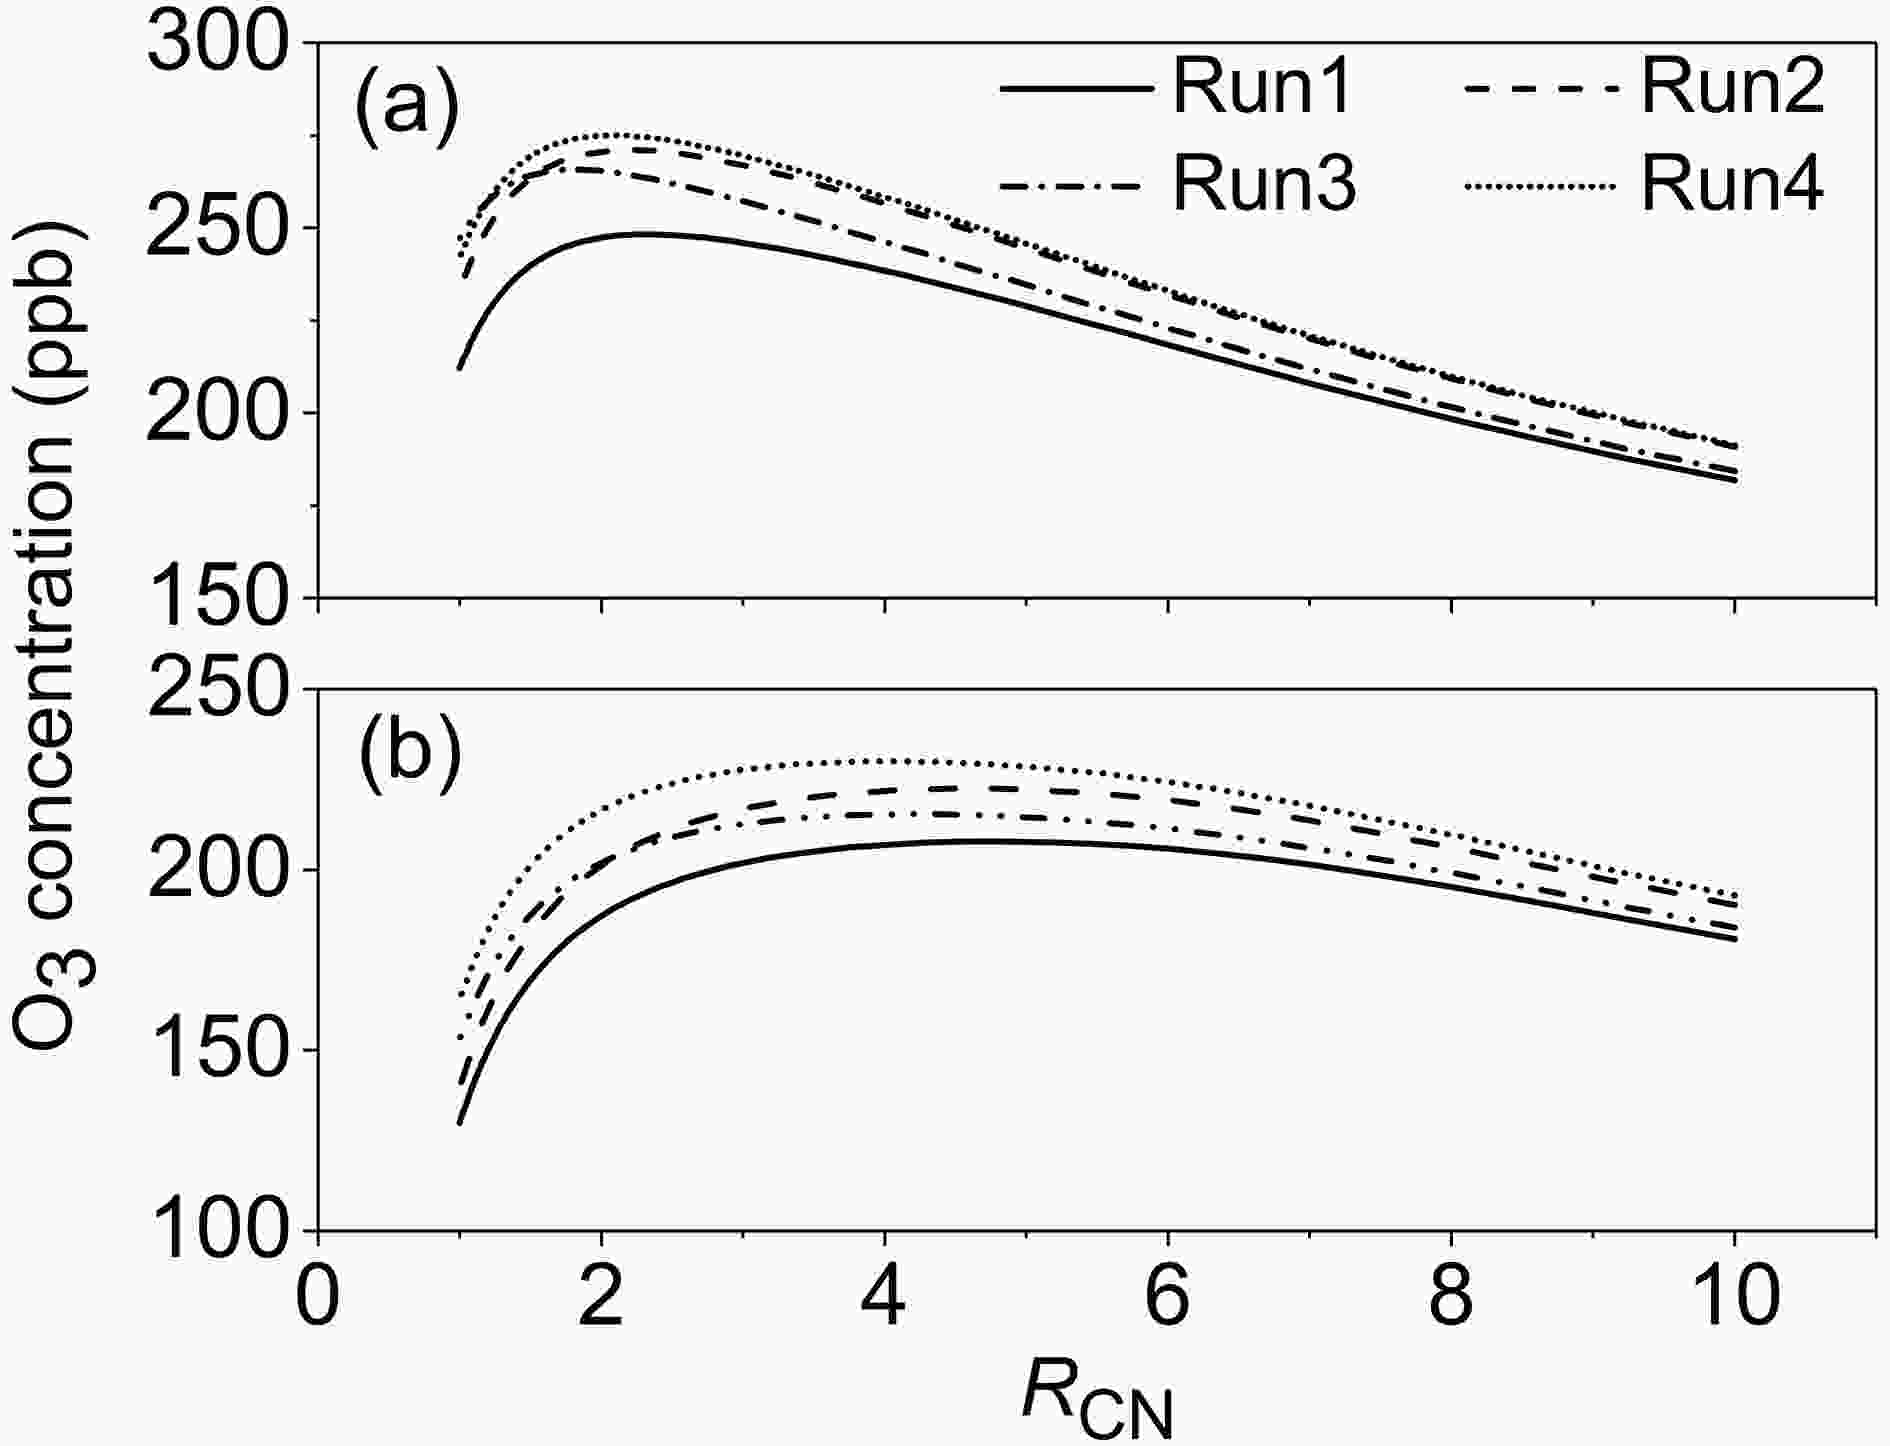
Figure 7. Variations of simulated O3 concentrations at 6 h by MCM mechanism with RCN (CH3CHO = 600 ppb, T = 300 K; a: RH = 12%; b: RH = 78%; Run1: original MCM v3.3.1; Run2: MCM v3.3.1 with R1; Run3: MCM v3.3.1 with R2; Run4: MCM v3.3.1 with R1 and R2).
-
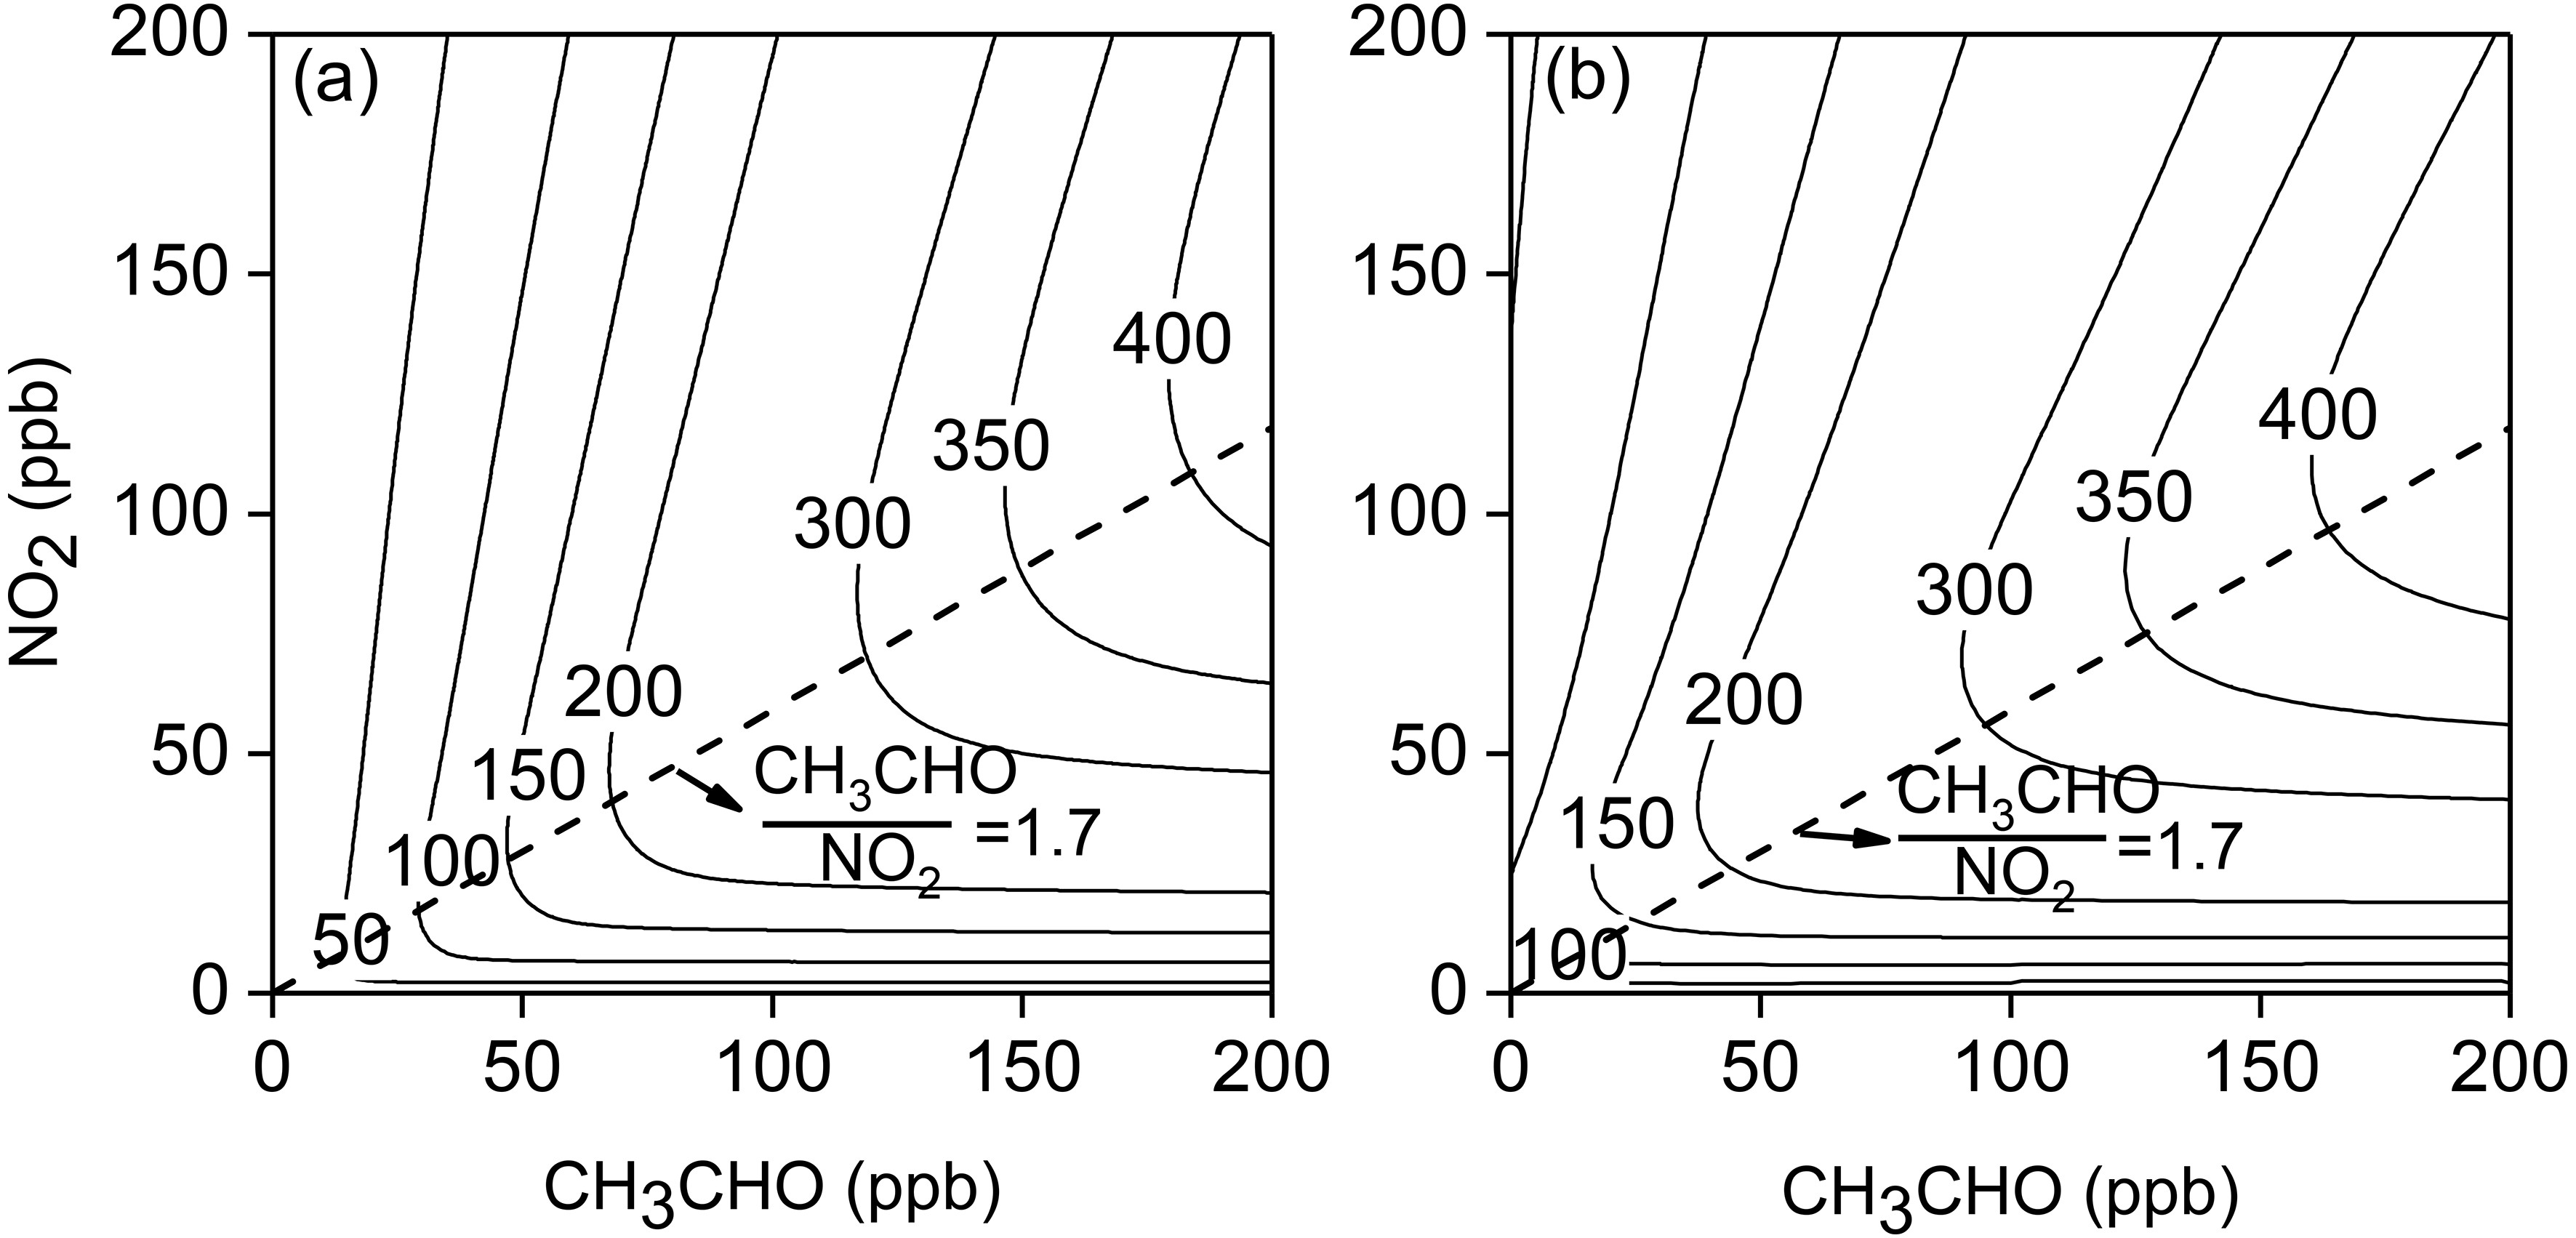
The ozone concentration at 6 h is generally used to represent the actual ozone formation ability of VOC under typical sunlight irradiations, while the maximum ozone concentration is used to represent the ozone formation potential (Carter et al., 1993). The modified MCM with R1 and R2 was used to simulate the O3 concentrations generated by 6 h of photochemical reactions of acetaldehyde under different concentrations of CH3CHO and NO2. The results are shown in Fig. 8a and Table 2. It can be estimated that in Fig. 8a, the RCN value at the ridge of the ozone isolines is about 1.7, which indicates that in the regime of RCN < 1.7, the formation process of O3 by acetaldehyde photochemistry is sensitive to CH3CHO, while in the regime of RCN > 1.7, O3 is under the NOx -sensitive condition. In Expts. 9−14, the RCN value at the inflection point of the O3 concentrations at 6 h is about 2.8 (Fig. 2). This demonstrates that the modified MCM still underestimates the experiment-based RCN by 39%.

Figure 8. Isogram of simulated O3 concentrations after 6 h-photochemical reactions (RH = 70%, J[NO2] = 0.56 min−1, T = 300 K; (a) acetaldehyde as a single VOC; (b) acetaldehyde plus other 11 species of VOCs: m/p-xylene = 1.6 ppb, propylene = 1.2 ppb, ethylene = 1.5 ppb, isoprene = 1.0 ppb, toluene = 2.4 ppb, 1-butene = 0.5 ppb, o-xylene = 0.6 ppb, isopentane = 2.2 ppb, 1,2,4-thrimethylbenzene = 0.3 ppb, n-butane = 2.7 ppb). The dashed line indicates the transition from CH3CHO-sensitive to NOx-sensitive conditions.
NO2 (ppb) CH3CHO (ppb) O3 6ha (ppb) IR6h (ppb ppb−1) MIR (ppb ppb−1) 50−200 20−200 16−416 (24−380)b 1.6−3.3 (1.3−3.6) b 3.9 (6.4) b 30−50 10−20 18−55 (32−70) b 3.0−3.4 (3.4−4.0) b 3.9 (4.4) b ≤10 ≤2 1−7 (1−4) b 3.2−3.8 (0.5−1.8) b 4.0 (1.8) b Table 2. Simulated results for different scenarios and background conditions. (a: Contribution of acetaldehyde to O3 at 6 h, with deduction of the background O3 concentration. b: The values in brackets indicate that the reactions of other VOCs have been added to the simulation as the background conditions, and the initial concentrations of other VOCs: m/p-xylene = 1.6 ppb, propylene = 1.2 ppb, ethylene = 1.5 ppb, isoprene = 1.0 ppb, toluene = 2.4 ppb, 1-butene = 0.5 ppb, o-xylene = 0.6 ppb, isopentane = 2.2 ppb, 1,2,4-thrimethylbenzene = 0.3 ppb, n-butane = 2.7 ppb.)
It is known from the simulation results that under different scenarios the contribution of acetaldehyde to ozone is very different (Fig. 8a). For example, under the scenario of NO2 = 50−200 ppb, CH3CHO = 20−200 ppb, acetaldehyde can contribute 16−416 ppb O3, whereas under the scenario of NO2 = 30−50 ppb, CH3CHO = 10−20 ppb, acetaldehyde can contribute 18−55 ppb O3, which indicates that the contribution of acetaldehyde to ozone can still increase with the concurrent decrease of NO2 and acetaldehyde concentrations. However, under the scenario of NO2 ≤ 10 ppb, CH3CHO ≤ 2 ppb, acetaldehyde can only contribute 1−7 ppb O3.
In the actual atmospheric environment, there are many other kinds of VOCs that can affect the photochemical reaction of acetaldehyde and NOx. For example, under the conditions of CH3CHO = 2 ppb and NO2 = 40 ppb, it is calculated that the O3 concentration after 6-h reaction is 17 ppb. When the background air contains 1.6 ppb m-xylene, which was measured in the actual urban environment (Li et al., 2020), it can be calculated that the O3 concentrations after 6-h reaction are 20 ppb and 24 ppb under the CH3CHO concentrations of 0 and 2 ppb (NO2 = 40 ppb), respectively, indicating that the ozone formation potential of m-xylene is larger than that of acetaldehyde, and that the existence of m-xylene greatly reduces the contribution of acetaldehyde to ozone. In order to analyze the sensitivity of O3 formation to the acetaldehyde concentration in the actual atmospheric environment, we selected 11 species of VOCs with large contributions to the O3 concentration in urban areas in the study of Li et al.(2020) as the background condition for the photochemical reaction of acetaldehyde. The simulated results are shown in Fig. 8b and Table 2. It is found that when the acetaldehyde concentration is much lower than the background VOCs (e.g., CH3CHO ≤ 2), because the reactions of background VOCs with OH radicals are dominant relative to acetaldehyde, background VOCs will weaken the contribution of acetaldehyde to O3. When CH3CHO = 10−20 ppb, NO2 = 30−50 ppb, because the reaction of acetaldehyde with OH radicals is dominant or comparable relative to the background VOCs, and O3 formation is mainly VOC-limited, background VOCs will enhance the contribution of acetaldehyde to ozone. When the acetaldehyde concentration is much larger than those of background VOCs, the effect of background VOCs on the photochemical reaction of acetaldehyde depends on the actual ratio of VOCs to NO2. Indeed, in the actual environment, since the acetaldehyde concentration is much lower than those of background VOCs, it is considered that other VOCs will weaken the O3 formation by the photochemical reaction of acetaldehyde in the actual environment.
The IR values of acetaldehyde under different reaction conditions (RH = 70%, T = 300 K) were simulated by using the modified MCM and Eq. (1) in this study. Taking the O3 concentrations at 6 h, the IR6h values were computed, and the results are shown in Fig. 9a. In addition, the maximum incremental reactivity (MIR) was also simulated according to the maximum O3 concentration under different scenarios (Table 2). The simulated results indicate that the MIR of acetaldehyde from the modified MCM is 4.0 ppb ppb−1, which is 23% lower than the MIR value computed by Carter (2010) using the SAPRC-07 mechanism (RH = 50%, T = 300 K).
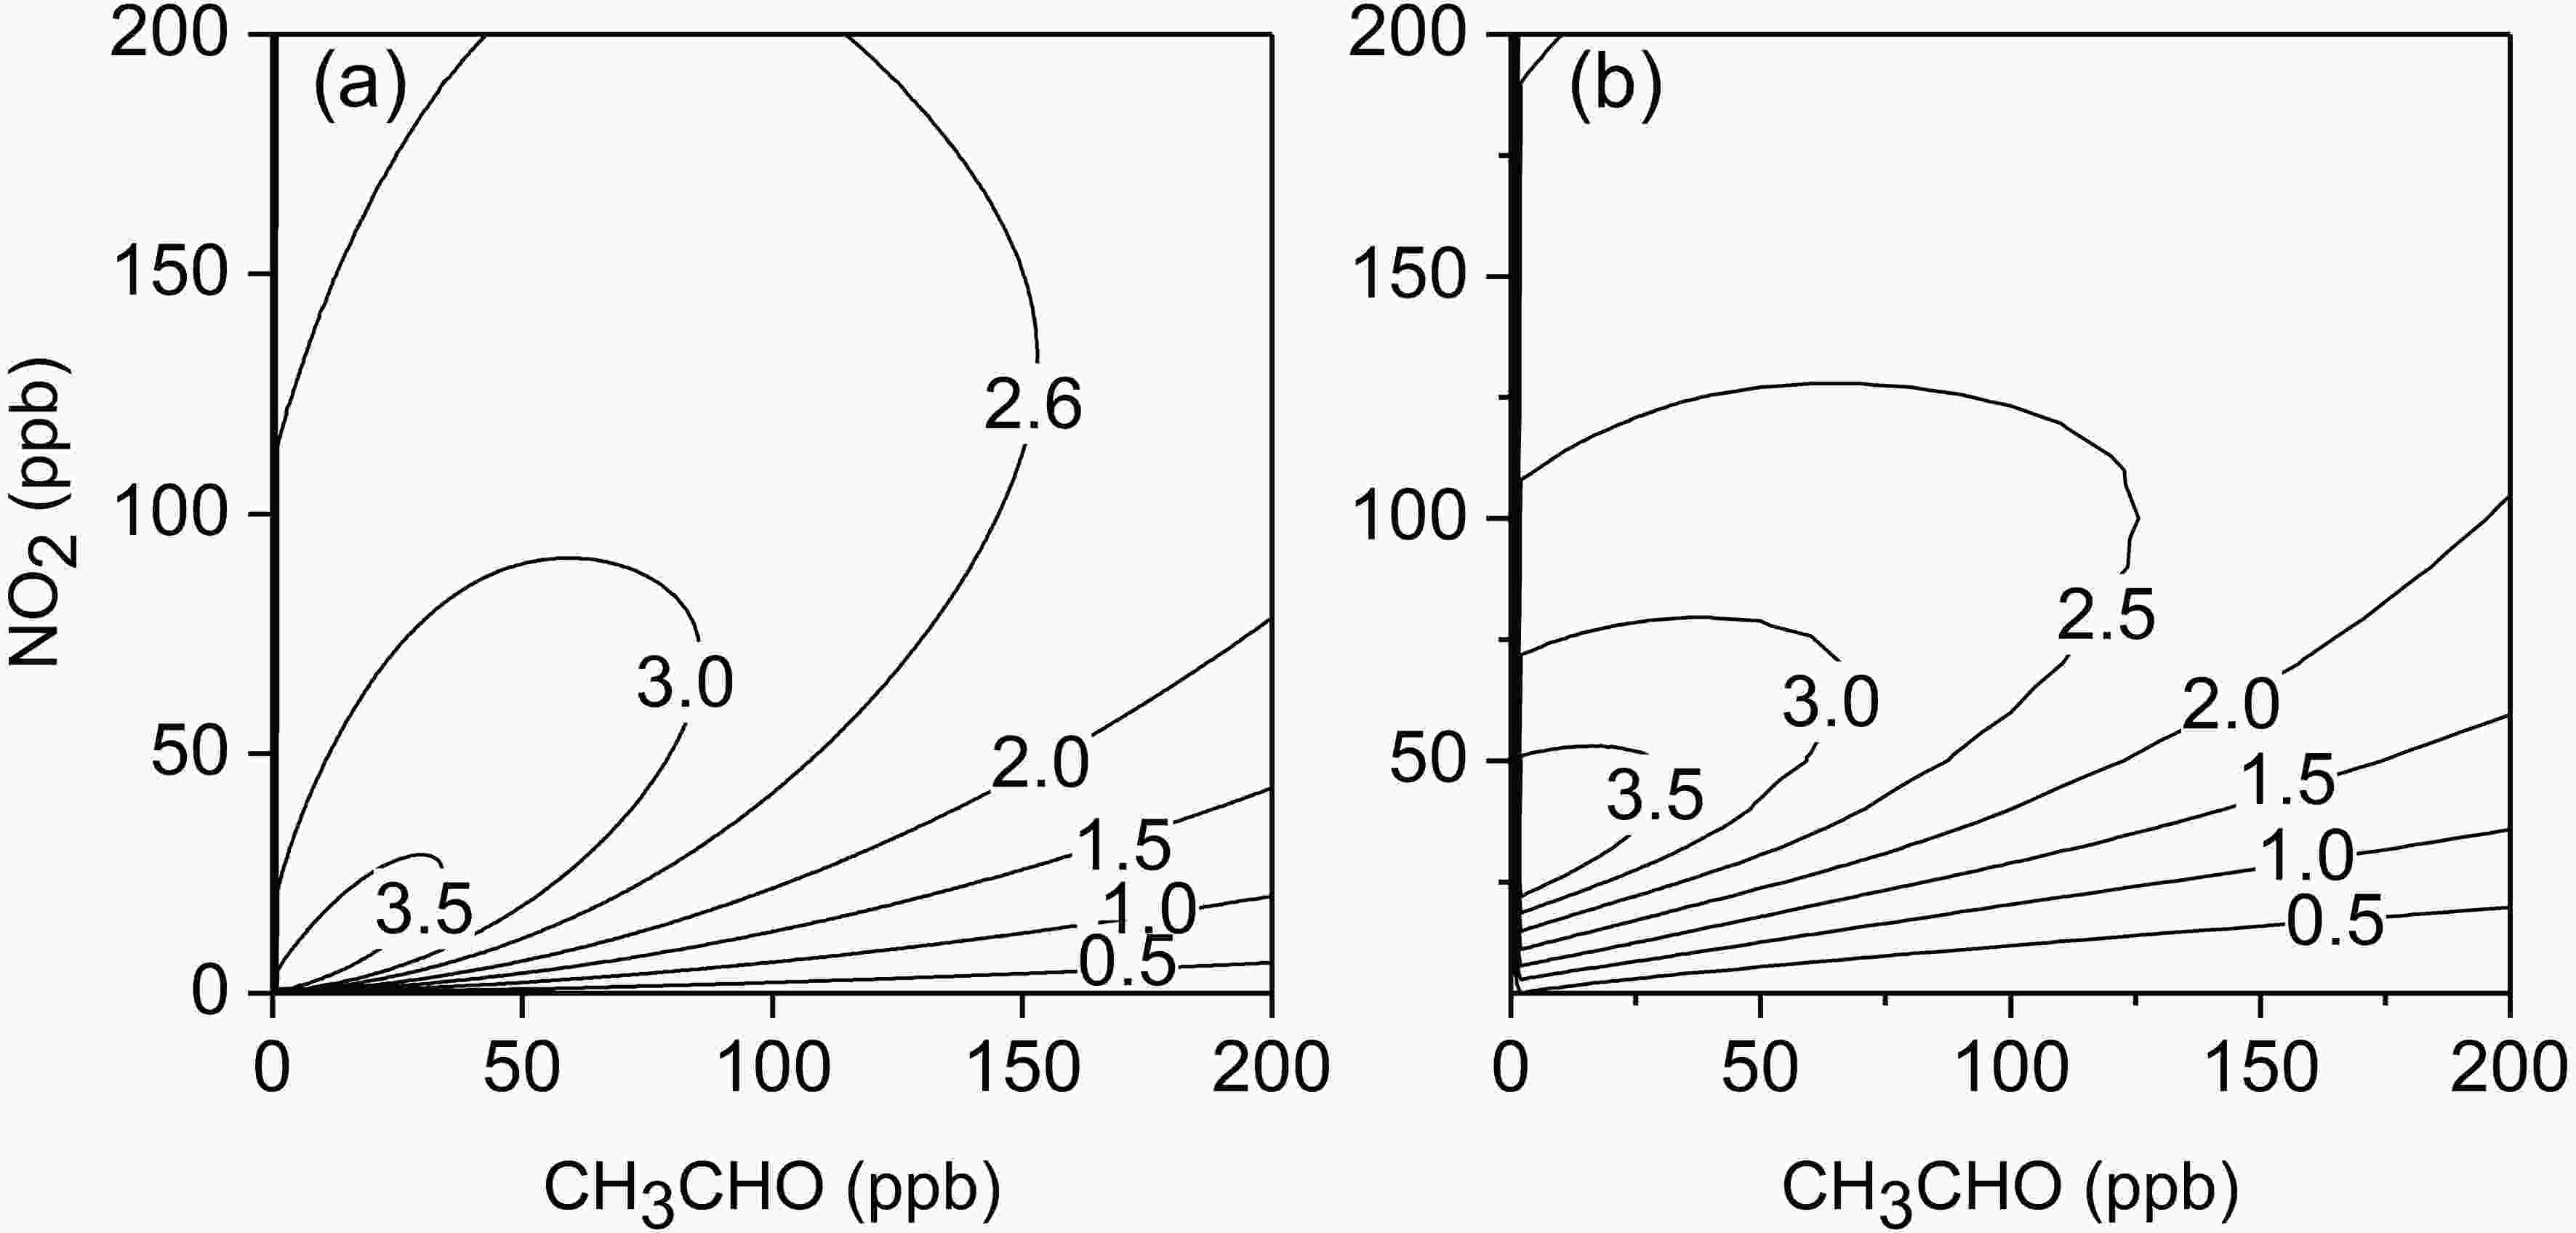
Figure 9. Isogram of simulated IR at 6 h (RH = 70%, J[NO2] = 0.56 min−1, T = 300 K; (a) acetaldehyde as a single VOC; (b) acetaldehyde plus other 11 species of VOCs: m/p-xylene = 1.6 ppb, propylene = 1.2 ppb, ethylene = 1.5 ppb, isoprene = 1.0 ppb, toluene = 2.4 ppb, 1-butene = 0.5 ppb, o-xylene = 0.6 ppb, isopentane = 2.2 ppb, 1,2,4-thrimethylbenzene = 0.3 ppb, n-butane = 2.7 ppb).
Similarly, to illustrate the effects of other VOCs on the IR value of acetaldehyde in the actual environment, the 11 species of VOCs were also added into the simulation of MCM as the background condition (Fig. 9b). It is found that the variation of IR6h is similar to the variation of O3 concentration before and after adding background VOCs. The IR6h value of acetaldehyde will decrease under CH3CHO ≤ 2 ppb and NO2 ≤ 10 ppb, but it will increase when CH3CHO = 10−20 ppb and NO2 = 30−50 ppb. Nevertheless, when CH3CHO = 20−200 ppb and NO2 = 50−200 ppb, the variation of IR6h depends on the actual ratio of VOCs to NO2. Therefore, when the IR value is used to estimate the O3 formation by acetaldehyde, the IR value should be selected according to the actual environmental conditions.
It is known from the MIR of acetaldehyde that acetaldehyde has an intermediate ozone formation potential. As estimated by Carter (2010), some species have high MIR values, such as methylglyoxal (22.2 ppb ppb−1) and m/p-xylene (14.6/18.1 ppb ppb−1), while some species have low MIR, such as benzene (0.68 ppb ppb−1) and acetylene (0.27 ppb ppb−1). If the difference in IR6h between our simulation and experiments is taken into account, our MIR of acetaldehyde is underestimated by 25%. Thus, actual MIR of acetaldehyde should be 5.0 ppb ppb−1, which is close to the value proposed by Carter (2010) (5.2 ppb ppb−1). In this way, the MIR of acetaldehyde is probably between that of formaldehyde (4.5 ppb ppb−1) and isobutene (6.2 ppb ppb−1).
To estimate the role of acetaldehyde in the formation of O3 in terms of MIR, the acetaldehyde concentration in the atmosphere is required. In Beijing of China, the concentration of acetaldehyde can reach about 5 ppb (Gu et al, 2019). In Sao Paulo megacity of Brazil, the concentration of acetaldehyde can reach about 10 ppb (Dominutti et al., 2020), while in the port megacity of Istanbul of Turkey, it can even reach about 15 ppb (Thera et al., 2019). Therefore, the contribution of acetaldehyde to ozone formation potential can be 25−75 ppb according to the MIR of acetaldehyde, which is an important precursor of ozone.
3.1. Results from smog chamber experiments
3.1.1. Impacts of initial concentration ratios on O3
3.1.2. Impacts of RH on O3
3.1.3. Incremental reactivity (IR) of CH3CHO


3.2. Simulated results
3.2.1. Evaluation of MCM v3.3.1 with experimental results
3.2.2. Evaluation of MCM with IR
3.2.3. Improvement of the MCM mechanism of acetaldehyde
3.3. Ozone formation potential of CH3CHO
-
The photochemical reaction processes of CH3CHO-NOx have been studied in detail by smog chamber experiments and simulated by the MCM mechanism. The experiment results show that the RCN has a significant effect on the concentrations of O3 in the reaction process. In the low-RH experiments (RH = 11.6%±1.1%), when RCN < 3.2, the O3 concentration at 6 h increases with the increase of RCN, while it decreases with the increase of RCN when RCN > 3.2. Similarly, the RCN at the inflexion point of the change of O3 concentration at 6 h is 2.8 in high RH experiments (RH = 78.8%±1.0%). Under low RCN (< 3), RH has no significant effect on the O3 concentrations, but under high RCN (> 3), the O3 concentrations at 6 h in the high-RH experiments were 16% lower than those in the low-RH experiments on average. Original MCM v3.3.1-simulated results of O3 concentrations at 6 h are much smaller than those from the low- and high-RH experiments. After adding both the photolysis process of PAN and the photolysis process of HNO3 on the reactor surface into the original MCM, the difference between the simulated O3 concentrations by MCM and the experimental results at the end of experiments reduced from 24%−35% and 17%−49% to 6%−26% and 10%−42% under low- and high-RH experiments, respectively. The current MCM mechanism of acetaldehyde underestimates the ozone generation potential of acetaldehyde, and the simulated MIR of acetaldehyde with the modified MCM mechanism is 4.0 ppb ppb–1 without considering the effects of other VOCs. When other 11 typical VOCs are included into the simulation of ozone as a background condition, the MIR value of acetaldehyde increased to 6.4 ppb ppb–1. This demonstrates that acetaldehyde is probably an important precursor for ozone in the troposphere.
Acknowledgements. This work was supported by the National Key R&D Program of China (2017YFC0210005), the National Natural Science Foundation of China (Nos. 41875163, 41875166 and 41375129).
 AAS Website
 AAS WeChat