


 DownLoad:


-
Global-scale warming within the climate system has been unequivocal over recent decades and is expected to continue under continued emissions of greenhouse gases (Stocker et al., 2013). In response to global warming, various phenomena in the climate system are undergoing potential changes of different extents. For example, it has been documented that the climatology of extreme events has undergone great changes under global warming, which could lead to enormous economic losses and significant human casualties (Field et al., 2012). Therefore, an examination of the future changes in extreme events in a warming world is of great significance for policy-makers to develop adaptation strategies and to avoid potentially devastating impacts.
In recent decades, the frequency of climate extremes has generally increased worldwide. A large number of studies have reported that extreme events, such as heatwaves (Sun et al., 2014; Habeeb et al., 2015; Perkins-Kirkpatrick and Gibson, 2017; Chen and Zhai, 2017; Luo et al., 2020; Wang et al., 2020b), droughts (Trenberth et al., 2014; Dai and Zhao, 2017), and heavy precipitation (Sun and Ao, 2013; Lehmann et al., 2015; Papalexiou and Montanari, 2019), exhibit an increasing trend under global warming. For instance, it is argued that higher temperatures will lead to more evaporation and thus surface drying, increasing the intensity and duration of droughts (Trenberth, 2011). Warmer air can also hold more moisture, providing a favorable atmospheric condition for the development of extreme precipitation events (Lenderink and van Meijgaard, 2008; Berg et al., 2013). Thus, it seems that there is a potential connection between the increasing frequency of climate extremes and the global warming trend.
To meet the demand of examining the response of extreme events to global warming, the coupled general circulation model (CGCM) has become an effective tool. With the aid of the latest-released CMIP6 models, Li et al. (2021a) show that there will be global-scale increases in daily maximum temperatures but decreases in daily minimum temperatures under continued global warming. Based on the CMIP6 model projection results, Du et al. (2019) reported that daily and persistent precipitation extremes would be more intense for most land areas but become weaker for parts of southern and northern Africa, which is generally consistent with the projection results revealed by CMIP5 models (e.g. Kharin et al., 2013; Sillmann et al., 2013b; Zhou et al., 2014; Chen et al., 2014; Wu et al., 2015; Zhang and Zhou, 2020). According to the projection derived from four credible coupled models, Sun et al. (2010) analyzed the alteration in the frequency of extreme snowfall events in China under global warming and found that the frequency of extreme snowfall events over southern China will be reduced in the twenty-first century, whereas that over northern China will maintain an increasing trend before the middle twenty-first century and then start to decrease afterwards. However, the credibility of the projected future changes in climate extremes may critically depend on the simulation skill of CGCMs. Though many studies have reported that there have been some improvements with regard to the simulation skill of climate extremes and their historical trends (Sillmann et al., 2013a; He et al., 2019; Zhu et al., 2020), there is still large uncertainty regarding the projection results. With the aid of 31 CMIP5 models, Chen et al. (2014) investigated global precipitation extremes in future projections. They found that there is great inter-model uncertainty in terms of the future change in precipitation extremes for large areas in the tropics and midlatitudes; even the model projections cannot agree on the signs of the changes. Likewise, large uncertainty in projecting droughts is widely acknowledged (e.g., Wartenburger et al., 2017). Consequently, effective approaches are highly demanded to reduce the uncertainty in future projection issues. One strategy is firstly identifying the so-called better models (those have good credibility in simulating historical climate extremes) and then investigating their projection results as well as the inter-model consistency (e.g., Sun et al., 2010). But such a strategy requires a large number of model samples for model evaluation and filtration at the first step. Another strategy is to adopt a certain coupled model that has good ability in simulating extreme events to perform a large number of simulations and then analyze the large-member ensemble results from this single climate model (hereafter large-member ensemble strategy). Such a strategy can reduce the uncertainty that arises from the model internal variability, as the results built on small-member sizes may include uncertainty (Deser et al., 2012; Xie et al., 2015; Zhang et al., 2020). In this study, both the multimodel ensemble approach and the large-member ensemble approach will be employed for future projections. Based on these two strategies, we synthesize the projected results to provide some understanding of the changes and uncertainty of precipitation extremes in the future climate.
Many studies that have focused on climate extremes have paid more attention to their durations, as long-lasting extreme events would induce more severe impacts (Easterling et al., 2000). For example, a 12-day heavy rainfall event in 1998 caused severe flooding over the Yangtze River Basin, China, leading to more than 3000 deaths and direct economic losses of 250 billion Yuan (40 billion U.S. dollars; Lu, 2000). Thus, long-lasting extremely hot, cold, dry, and wet events have received wide attention in previous studies (e.g., Karl and Knight, 1998; Alexander et al., 2006; Zhang et al., 2020; Ren et al., 2020; Freychet et al., 2021; Wang et al., 2021b). There is evidence suggesting that global warming has already increased the durations of heavy precipitation events and heatwaves (Zhao et al., 2010; Zhu et al., 2012; Perkins-Kirkpatrick and Gibson, 2017), and these trends are projected to continue with further warming. Pfleiderer et al. (2019) reported that dry-warm persistence will increase by 20% in eastern North America in a 2°C-warmer world, and the probability of persistent precipitation increases by 26% for midlatitudes. It is therefore necessary to devote more efforts to understanding the behavior of persistent extreme events and their future changes in the warming world.
The middle and lower Yangtze River basin (MLYRB), which is one of the most populous and economically developed regions in China, is particularly vulnerable to extreme events, such as long-lasting heatwaves (Ye et al., 2014; Guan et al., 2015; Chen and Zhou, 2018; Zhou et al., 2019) and daily and persistent heavy precipitation events (e.g., Zhai et al., 2005; Su et al., 2006; Ding et al., 2008, 2009; Zhang et al., 2008; Chen and Zhai, 2013; Guan et al., 2017; Nanding et al., 2020; Zhou et al., 2021a). It is of particular interest that the MLYRB experienced a persistent heavy rainfall (PHR) event in the 2020 boreal summer. Specifically, the National Climate Center of China reported that the mei-yu season of 2020 spanned from 9 June to 31 July, lasting 62 days, which is 23 days longer than the climatology; the accumulated precipitation over the MLYRB during the 2020 mei-yu season broke the record held since 1961 with a value of 753.9 mm (
http://www.cma.gov.cn/2011wmhd/2011wzbft/2011wftzb/202008/t20200805_560160.html ). The heavy rain and floods caused 219 people to be declared dead or missing and direct economic losses of 179 billion Chinese Yuan (28 billion U.S. dollars;https://www.mem.gov.cn/xw/yjglbgzdt/202008/t20200813_368002.shtml ). Among the climate community, a burst of studies (e.g., Liu et al., 2020; Takaya et al., 2020; Ding et al., 2021b; Fang et al., 2021; Guo et al., 2021; Li et al., 2021b; Pan et al., 2021; Qiao et al., 2021; Ye and Qian, 2021; Zheng and Wang, 2021; Zhou et al., 2021b) have emerged that investigate the physical causes for the unprecedented long-lasting precipitation event in summer 2020. Although some of these recent studies are built on the perspective of interannaul variation (e.g., Liu et al., 2020; Pan et al., 2021; Zheng and Wang, 2021) and the others are from a subseasonal perspective (Liu et al., 2020; Ding et al., 2021a; Qiao et al., 2021; Zhang et al., 2021) or even an interdecadal perspective (Guo et al., 2021), all the studies agree that the anomalously strong and westward western Pacific subtropical high was crucial for the formation of this extreme rainfall event. Nonetheless, the detailed interpretations vary among these studies, and it is suggested that the exceptionally heavy rainfall in summer 2020 was related to the impact of Indian Ocean SST anomalies (e.g., Takaya et al., 2020; Ding et al., 2021b; Guo et al., 2021; Li et al., 2021b; Tang et al., 2021; Zhou et al., 2021b) and/or the combined effects of SST anomalies from the Pacific, Indian, and Atlantic Oceans (Fang et al., 2021; Pan et al., 2021; Wang et al., 2021a; Zheng and Wang, 2021), the sequential warm and cold mei-yu front modulated by the North Atlantic Oscillation (NAO) (Liu et al., 2020), the joint influence of midlatitude teleconnection and a positive Pacific–Japan pattern (Qiao et al., 2021), an obvious southward shift of the East Asian midlatitude westerly jet (Li et al., 2021b), the Arctic sea ice loss and its resultant blockings over Siberian blockings (Chen et al., 2021), and so on. In addition to the various interpretations for this extreme precipitation event, another scientific question about whether the likelihood of extreme events like the PHR in summer 2020 would change in response to anthropogenic forcing has already caught some attention (e.g., Zhou et al., 2021a). It is worth noting that the precipitation extremes that have occurred in the MLYRB region, such as the cases in 1998 and 2016, were linked to the super El Niño in the preceding boreal winter (Wang et al., 2000a; Li et al., 2017); however, the 2020 persistent rainfall extreme occurred in the context of a weak El Niño phase. This implies that there might be some connection between the 2020 persistent heavy rainfall event in MLYRB and global warming. Some recent studies (Ye and Qian, 2021; Zhou et al., 2021a) have pointed out that the record-breaking precipitation event in summer 2020 exhibited strong persistence and high intensity, and they have suggested that the emergence of extreme events may be attributed to anthropogenic influences. Specifically, Zhou et al. (2021a) estimated the influences of different anthropogenic forcings on the extreme mei-yu rainfall in summer 2020 through analyzing model simulations under different external forcing scenarios with the aid of the simulation results from the Detection and Attribution Model Intercomparison Project (DAMIP) of CMIP6. They found that greenhouse gas emissions have increased the occurrence probability of extreme mei-yu rainfall such as that in 2020 by 44%; however, this effect is offset by the influence of anthropogenic aerosols, which has reduced the probability by 73%. Ye and Qian (2021) found this extreme precipitation event to be largely attributed to climate change by employing the flow-analogues method; and they further suggested that the occurrence probability of an event similar to the extreme case in summer 2020 under similar atmospheric circulation conditions has increased by five times under the present-day climate (1985–2019) compared with past climate (1960–84) due to the climate change. Some previous studies have already reported that summer persistent rainfall events around the Yangtze River basin significantly lengthened during the latter half of the past century, and they inferred that this change is attributed to global warming (e.g., Zhao et al., 2010; Zhu et al., 2012; He and Zhai, 2018). Chen and Zhai (2013) investigated the observed precipitation during 1951–2010 and concluded that persistent rainfall extremes occurred more frequently after 1990, with high intensity and larger affected areas. In this sense, the potential changes of such an extremely persistent heavy rainfall event over the MLYRB in response to different future warming scenarios also deserves further study. Zhou et al. (2021a) estimated the future change in the risk of an extreme Meiyu rainfall event such as that in summer 2020 by the end of the 21st century (2081–2100) based on the 10 CMIP6 models and concluded that the occurrence probability of a similar extreme rainfall event will dramatically increase due to global warming. Zhou et al. (2021a) evaluated the performance of the models before conducting the specific analysis, but they mainly examined the simulation performance for the multimodel ensemble mean of the 10 CMIP6 models. As some models may be unable to reproduce extreme precipitation events similar to the summer 2020 MLYRB event, it is argued that selecting the relatively credible CMIP6 models to study future projections may be requisite. Besides, Zhou et al. (2021a) mainly focused on the change in the probability of extreme precipitation events by the end of the 21st century; the time-varying feature of the slowly changing likelihood throughout the entire 21st century may deserve some more attention. Therefore, the current study will focus on the overall and time-varying risk changes of the PHR event resembling the summer 2020 MLYRB event (hereafter 2020PHR-like extreme event) from the beginning to the end of the 21st century in response to various warming scenarios. The aim of this study is to provide more scientific reference and useful information for the decision-makers and stakeholders to plan out policies to deal with climate change.The rest of this paper is constructed as follows. In section 2, we introduce the observational data, model data, key study region, and methods applied to identify and evaluate the precipitation extremes. In section 3, we present the characteristics of the observed 2020 persistent heavy rainfall. The projected changes from the large-member ensemble of CanESM2 is investigated in section 4, and those from the multimodel ensembles are presented in section 5. Finally, conclusions and discussions are given in section 6.
-
The current study collects the observed daily precipitation data from 824 national baseline stations in China during the period of 1951–2020 (Fig.1), which is derived from the version 3.0 of China surface climate daily dataset released by the National Meteorological Information Center (NMIC) of the China Meteorological administration (CMA). As reported by NMIC, the version 3.0 of China surface climate daily dataset is created with strict quality control methods, and the numerous error and missing observations are corrected and re-entered (Ren et al., 2012). Through these efforts, the present version of the daily dataset is substantially improved compared to its previous versions, with the integrity of the observations exceeding 99% and the accuracy approaching 100%.
In order to avoid the bias in calculating spatial means caused by the irregular distribution of the stations (Jones et al., 1986), we interpolate the station data onto a regular grid of 1° × 1° with the Cressman's objective analysis method (Cressman, 1959), which is one of the most popularly used and reliable schemes to transform precipitation data from stations into gridded data (Chen et al., 2008; Luo et al., 2013).
-
The model data used in this study includes the daily precipitation, monthly specific humidity, and zonal and meridional wind components derived from the large-ensemble runs of the second-generation Canadian Earth System Model (CanESM2, Arora et al., 2011). CanESM2 provides a large ensemble of 50 members that are driven by the natural and anthropogenic forcing for the historical period of 1950–2005, as well as the representative concentration pathway (RCP) 8.5 scenario for the future period of 2006–2100 with different initial conditions (Fyfe et al., 2017). The atmospheric component model of CanESM2 is the fourth generation of the Canadian Atmospheric Global Climate Model (CanAM4, von Salzen et al., 2013) that employs the T63 triangular truncation with a horizontal resolution of 2.8°.
The present study also employs the daily precipitation that is derived from the multimodel ensemble of the Coupled Model Intercomparison Project Phase 5 (CMIP5) and the latest-released Coupled Model Intercomparison Project Phase 6 (CMIP6) archive for the historical period and future projections under RCP4.5 and 8.5 scenarios of CMIP5 and Shared Socioeconomic Pathway (SSP) 1–2.6, 2–4.5, 3–7.0, and 5–8.5 of CMIP6, which are the four "high priority" scenarios for IPCC AR6 (Meinshausen et al., 2019). Each SSP scenario of the CMIP6 framework can be understood as an SSP-RCP combination. The RCPs used in the CMIP5 simulations represent the magnitude of enhanced radiative forcing at 2100, such as 2.6 W m–2, 4.5 W m–2, 7.0 W m–2, and 8.5 W m–2. Whereas the SSPs describe alternative evolutions of future society with different climate policy: SSP1-sustainability; SSP2-middle of the road; SSP3-regional rivalry; SSP4-inequality; and SSP5-fossil-fuelled development. More details about the SSP scenario work can be found in O’Neill et al. (2016).
In this study, the 50-member ensemble of CanESM2 is analyzed with the historical period of 1951–2005 and RCP8.5 scenario of 2006–2100. For the multimodel ensemble strategy, the historical simulation (1950–2005) and two RCP scenario projections (2006–2100) from twenty-two CMIP5 coupled models (Table 1) are adopted; and the historical simulation (1950–2014) and four SSP scenario projections (2015–2100) derived from twenty-one CMIP6 archives (Table 2) are employed. All the CMIP5 and CMIP6 model outputs are re-gridded to a common resolution of 1°×1° with the bilinear interpolation scheme prior to analysis.
No. Model Name Institution Atmospheric
resolution1 ACCESS1.0 Commonwealth Scientific and Industrial Research Organization and Bureau of Meteorology (Australia) 1.24° × 1.875° 2 ACCESS1.3 Commonwealth Scientific and Industrial Research Organization and Bureau of Meteorology (Australia) 1.24° × 1.875° 3 CMCC-CM Centro Euro-Mediterraneo per I Cambiamenti Climatici (Italy) 0.75° × 0.75° 4 CMCC-CMS Centro Euro-Mediterraneo per I Cambiamenti Climatici (Italy) 1.24° × 1.875° 5 CNRM-CM5 Centre National de Recherches Météorologiques–Centre Européen de Recherche et de Formation Avancée en Calcul Scientifique (France) 1.4° × 1.4° 6 CSIRO-Mk3.6.0 Commonwealth Scientific and Industrial Research Organization in collaboration with Queensland Climate Change Centre of Excellence (Australia) 1.24° × 1.875° 7 FGOALS-g2 LASG, Institute of Atmospheric Physics, Chinese Academy of Sciences (China) 3.0° × 2.8° 8 FGOALS-s2 LASG, Institute of Atmospheric Physics, Chinese Academy of Sciences (China) 1.67° × 2.8° 9 GFDL-CM3 NOAA Geophysical Fluid Dynamics Laboratory (USA) 2.0° × 2.5° 10 GFDL-ESM2M NOAA Geophysical Fluid Dynamics Laboratory (USA) 2.0° × 2.5° 11 HadGEM2-AO Met Office Hadley Centre (UK) 1.24° × 1.875° 12 HadGEM2-CC Met Office Hadley Centre (UK) 1.24° × 1.875° 13 HadGEM2-ES Met Office Hadley Centre (UK) 1.24° × 1.875° 14 INMCM4 Institute for Numerical Mathematics (Russia) 1.5° × 2.0° 15 IPSL-CM5A-LR L’Institut Pierre-Simon Laplace (France) 1.875° × 3.75° 16 IPSL-CM5A-MR L’Institut Pierre-Simon Laplace (France) 1.26° × 2.5° 17 IPSL-CM5B-LR L’Institut Pierre-Simon Laplace (France) 1.875° × 3.75° 18 MIROC-ESM National Institute for Environmental Studies, The University of Tokyo (Japan) 2.8125° × 2.8125° 19 MIROC5 National Institute for Environmental Studies, The University of Tokyo (Japan) 1.4° × 1.4° 20 MPI-ESM-LR Max Planck Institute for Meteorology (Germany) 1.875° × 1.875° 21 MPI-ESM-MR Max Planck Institute for Meteorology (Germany) 1.875° × 1.875° 22 NorESM1-M Norwegian Climate Centre (Norway) 1.8725° × 2.5° Table 1. Model names, institutions, and the atmospheric resolutions of 22 CMIP5 coupled models.
No. Model Name Institution Atmospheric
resolution1 ACCESS-CM2 Commonwealth Scientific and Industrial Research Organization and Australian Research Council Centre of Excellence for Climate System Science (Australia) 1.25° × 1.875° 2 ACESS-ESM1-5 Commonwealth Scientific and Industrial Research Organization (Australia) 1.24° × 1.875° 3 BCC-CSM2-MR Beijing Climate Center, China Meteorological Administration (China) 1.125° × 1.125° 4 CESM2-WACCM National Center for Atmospheric Research, Climate and Global Dynamics Laboratory (USA) 0.9375° × 1.25° 5 CMCC-CM2-SR5 Fondazione Centro Euro-Mediterraneo sui Cambiamenti Climatici (Italy) 0.9375° × 1.25° 6 CanESM5 Canadian Centre for Climate Modelling and Analysis, Environment and Climate Change Canada (Canada) 2.8125° × 2.8125° 7 EC-Eartn3 EC-Earth-Consortium 0.7° × 0.7° 8 EC-Earth3-Veg EC-Earth-Consortium 0.7° × 0.7° 9 FGOALS-g3 LASG, Institute of Atmospheric Physics, Chinese Academy of Sciences (China) 2.25° × 2.0° 10 GFDL-ESM4 NOAA Geophysical Fluid Dynamics Laboratory (USA) 1.0° × 1.25° 11 INM-CM4-8 Institute for Numerical Mathematics, Russian Academy of Science (Russia) 1.5° × 2.0° 12 INM-CM5-0 Institute for Numerical Mathematics, Russian Academy of Science (Russia) 1.5° × 2.0° 13 IPSL-CM6A-LR L’Institut Pierre-Simon Laplace (France) 1.26° × 2.5° 14 KIOST-ESM Korea Institute of Ocean Science & Technology (Korea) 1.875° × 1.875° 15 MIROC6 Japan Agency for Marine-Earth Science and Technology (Japan) 1.4° × 1.4° 16 MPI-ESM1-2-HR Max Planck Institute for Meteorology (Germany) 0.9375° × 0.9375° 17 MPI-ESM1-2-LR Max Planck Institute for Meteorology (Germany) 1.875° × 1.875° 18 MRI-ESM2-0 Meteorological Research Institute (Japan) 1.125° × 1.125° 19 NESM3 Nanjing University of Information Science and Technology(China) 1.875° × 1.875° 20 NorESM-LM Norwegian Climate Centre (Norway) 1.875° × 2.5° 21 NorESM-MM Norwegian Climate Centre (Norway) 0.9375° × 1.25° Table 2. Model names, institutions, and the atmospheric resolutions of 21 CMIP6 coupled models.

Figure 1. Locations of 824 national baseline stations in China (green crosses). The red box denotes the middle and lower Yangtze River basin (110°–122°E, 28°–32°N).
-
The middle and lower Yangtze River basin (hereafter, MLYRB) is characterized by heavy precipitation during early summer in its long-term climatology. Considering the fact that the extremely long-persisting rainfall in summer 2020 over the MLYRB is also known as an extreme Meiyu rainfall (e.g., Liu et al., 2020; Ye and Qian, 2021), the specific MLYRB region used in this study is based on the national standards’ mei-yu Monitoring region published by the National Climate Center (NCC) of CMA in 2017. According to the national standards, the MLYRB region generally stretches zonally from Yichang at 110°E to the east coast of China and reaches meridionally from Changsha at 28°N to Nanjing at 32°N. Here, we simply use the precipitation averaged in the box of 110°–122°E and 28°–32°N to directly reflect the rainfall intensity over the MLYRB.
-
To identify the persistent heavy rainfall event resembling the extremely long-persisting rainfall over the MLYRB in summer 2020, an N-day running window has been applied to the daily precipitation time series over the boreal summer (June–August). The maximum accumulated precipitation of the N-day window is picked out as the intensity of the summer persistent heavy rainfall, which is hereafter referred to as RxNday. Although we filter out some models that do not show good present-day simulation ability according to some criteria, the remaining models may still exhibit slight overestimation or underestimation of rainfall intensity compared to the observation. As such, here, we employ the normalization method when selecting the precipitation extremes to correct the models' biases in simulating the rainfall intensity, as proposed by Zhang et al. (2020). Specifically, the normalized RxNday is calculated as a percentage anomaly relative to the climatological RxNday averaged over the present-day climate period.
-
The generalized extreme value (GEV) distribution is adopted in this study to compute the risk indices of the persistent heavy rainfall events for the observation and model simulations. The GEV distribution is a widely used statistical metric to analyze extreme values, and it has been proven as an effective tool in estimating the occurrence probability of extreme precipitation events for many regions (Feng et al., 2007; Zhang et al., 2020). The cumulative distribution function of the GEV distribution is shown below:
where
$ \mu $ ,$ \sigma $ , and$ \xi $ are the location, scale, and shape parameters, respectively. The particular cases for$ \xi =0 $ ,$ \xi > 0 $ , and$ \xi < 0 $ in Eq. (1) are known as the Gumbel, Frechet, and negative Weibull distributions, respectively.Before fitting the GEV distribution to the normalized RxNday for the observation and the simulations, all linear trends are removed to ensure the stationary nature of the targeted time series. It is worth mentioning that the main conclusions derived from the detrended time series are close to those derived from the raw time series without detrending (not shown). After completion in fitting the GEV distribution, we evaluate the risk of a persistent heavy rainfall event by calculating the occurrence probability of the normalized RxNday exceeding a certain magnitude. Further, a risk ratio has been proposed to estimate the changing likelihood in the future projections (e.g., Zhang et al., 2020). Specifically, the risk ratio (RR) compares the occurrence probability of a persistent heavy rainfall event for the historical period (PHist) with the occurrence probability for the future projections (PProj) using the expression of RR=PProj/PHist.
In addition to the occurrence probability, it can be straightforward to understand the risk of a certain kind of precipitation extreme by describing it as a “1-in-T-year event”, which straightforwardly denotes that such kind of extreme event would occur one time in every T years. This information is obtained from the aforementioned GEV distribution described in Eq. (1); the expression is as follows:
where
$ {x}_{\mathrm{T}} $ and$ T $ represent the return level and return period, respectively. It can be summarized by stating that the value of$ {x}_{\mathrm{T}} $ is expected to occur on average once in every$ T $ years. -
The uncertainties of the occurrence probability, risk ratio, and return period are estimated based on a bootstrap method. Specifically, a new set of members (models) is constructed by resampling all ensemble members (models) randomly with replacement to compute a new risk index such as occurrence probability. The entire procedure is repeated 1000 times, and thus a new series of each risk index is produced. We next fit the empirical distribution to the new series, and then the 5th, 25th, 50th, 75th, and 95th percentiles of the distribution are detected to estimate the uncertainty regarding the projection results.
-
As we apply the coupled-model simulations as the main tool to investigate the future changes of precipitation extremes as well as the projection uncertainty under different warming scenarios, a premise of this strategy is to firstly ascertain whether a certain coupled model is capable of reasonably representing the observed persistent heavy rainfall variability in present-day simulations. This is of a great significance in gaining robustness of future projection results. Therefore, in order to pick out the models with good simulation skills for further investigation, we simply assess the performance of each model by evaluating the GEV distribution of the normalized RxNday for its historical simulation against the counterpart for the observation using a Kolmogorov–Smirnoff (K–S) test. The p-value derived from the K–S test serves as an inspector to ascertain the model’s ability in simulating the 2020PHR-like event in the present-day climate. Specifically, a larger p-value indicates better agreement in the distributions of the normalized RxNday between the model present-day simulation and the observation. In this study, a criterion where the p-value exceeds 0.05 is adopted when selecting the models with good simulation skills for further investigation.
-
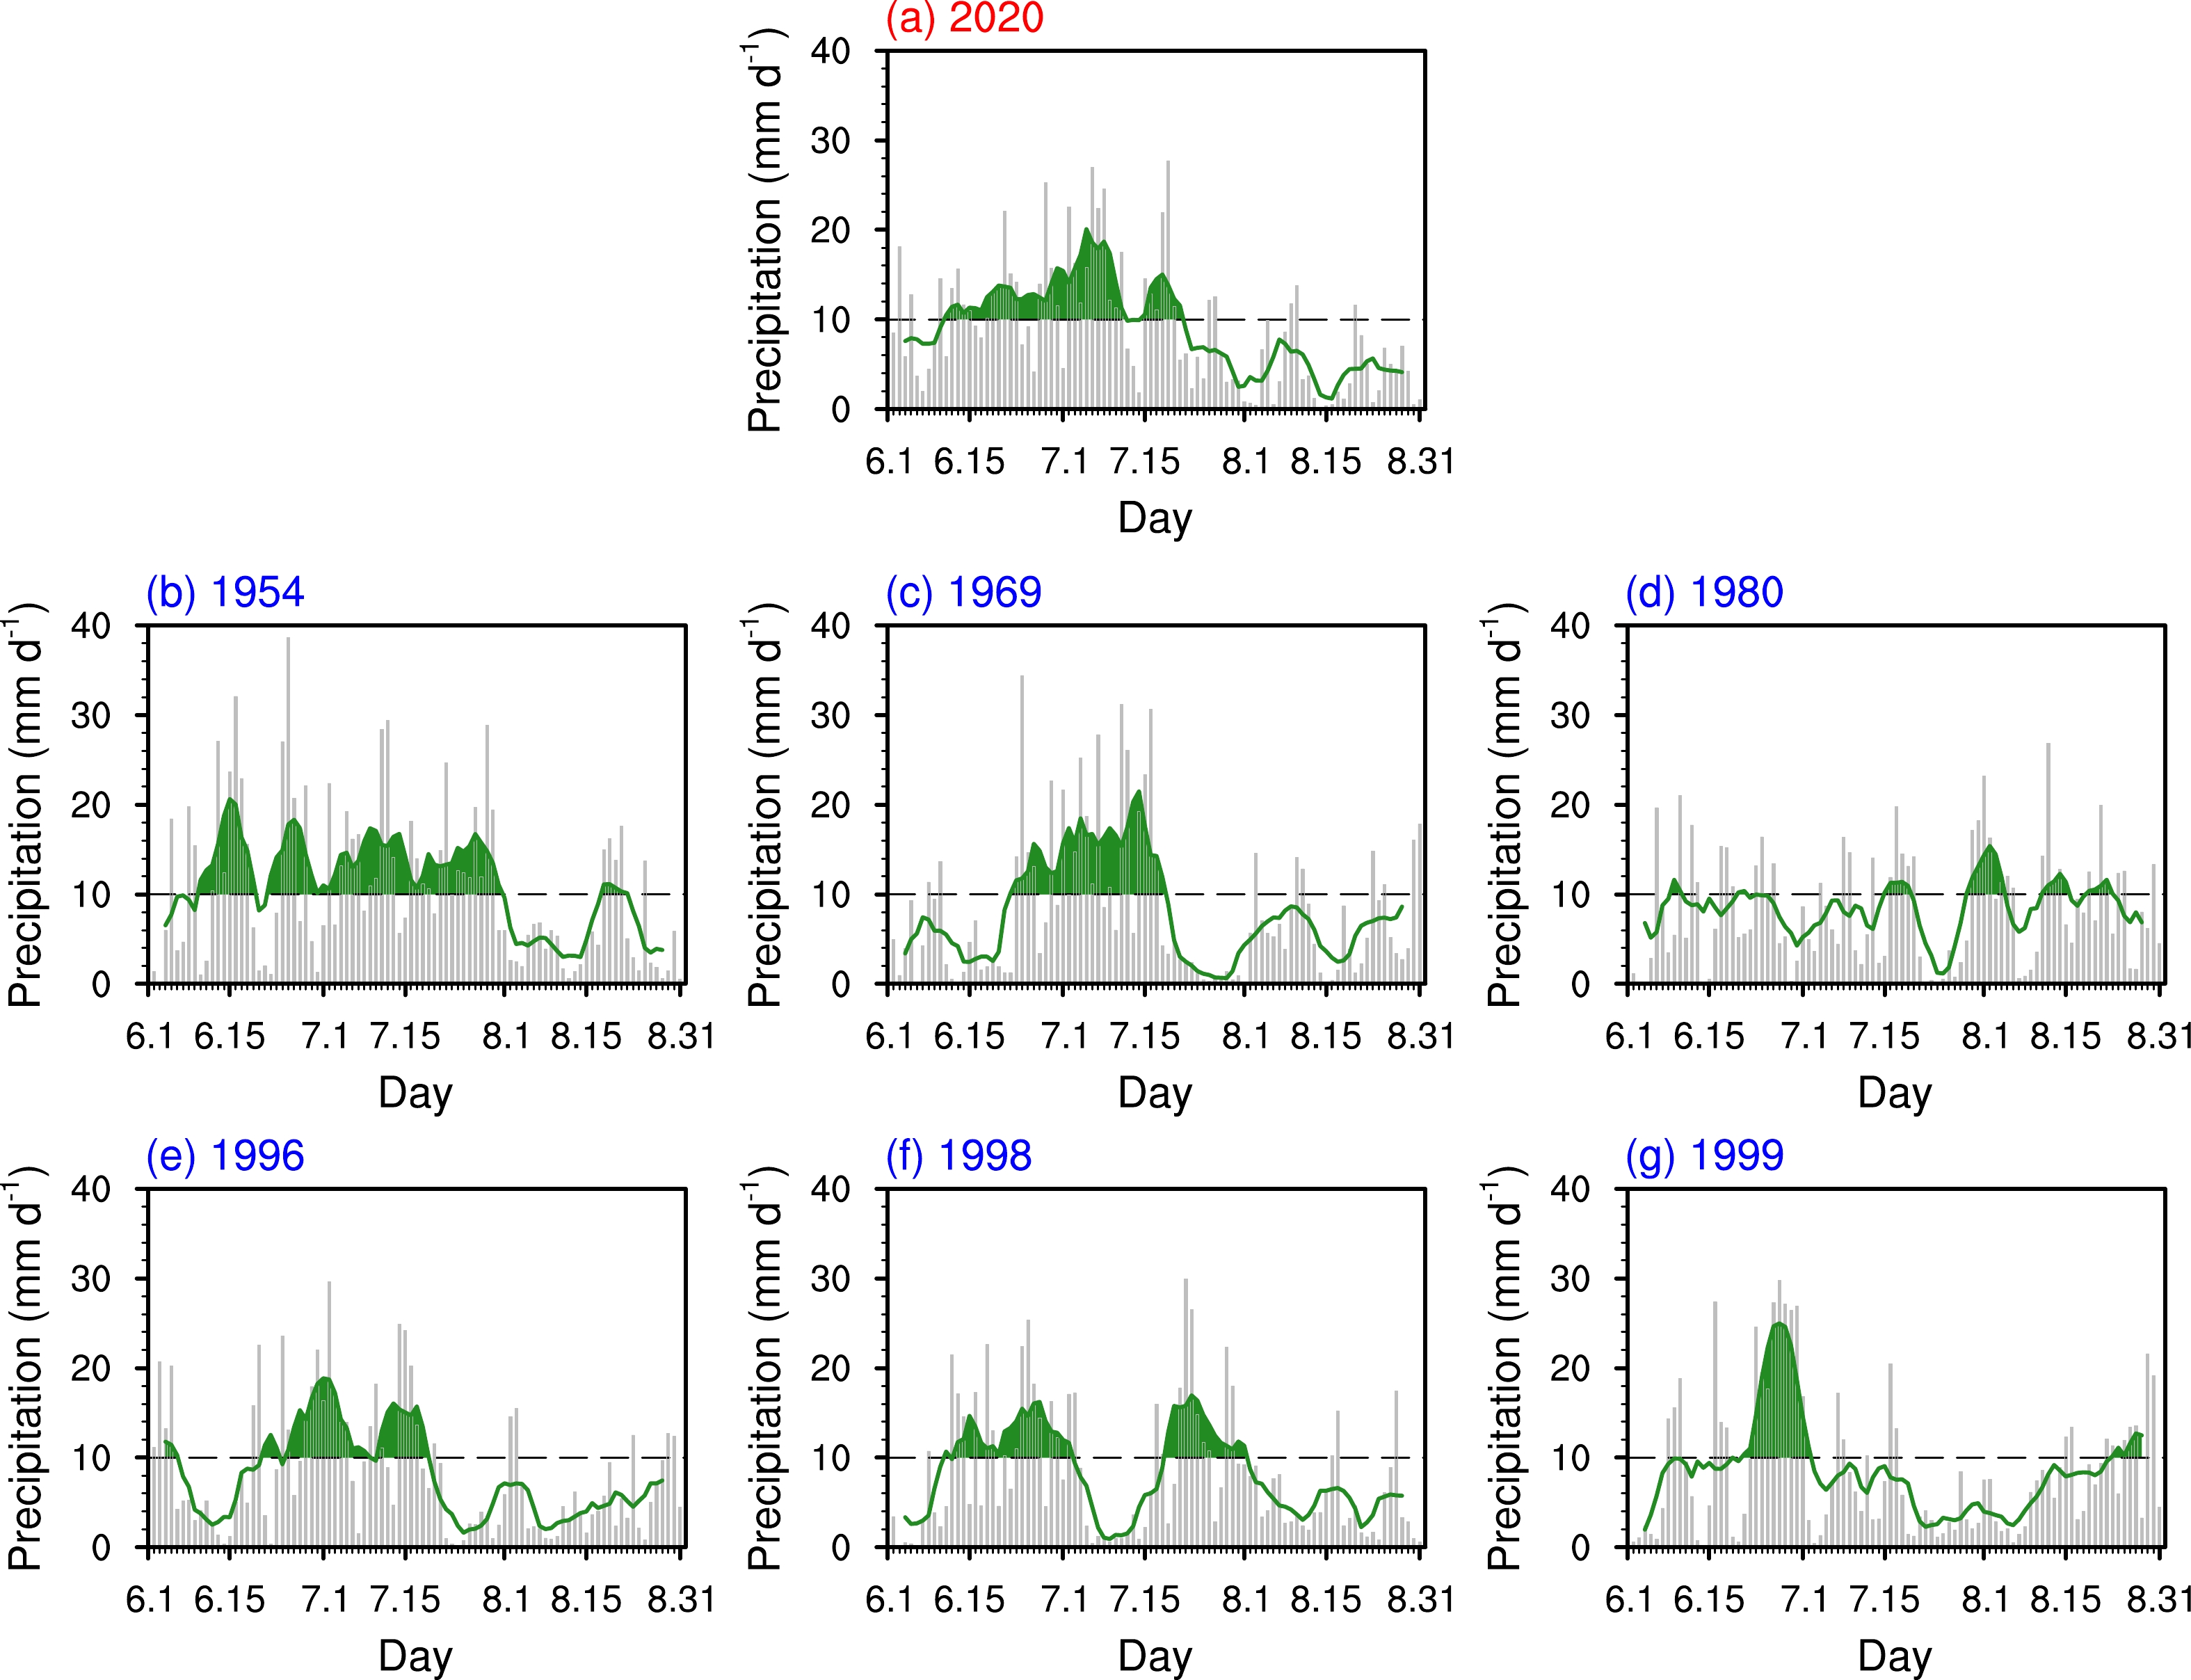
During summer 2020, the MLYRB (red box in Fig. 2a) was continuously affected by heavy rainfall. From an intensity perspective, the daily mean precipitation reached 8.9 mm d–1 in summertime of 2020, which is the second wettest case on record during the period of 1951–2020 (Fig. 2b); the case in summer 1954 ranks first. In addition to its extreme intensity, the 2020 heavy rainfall event exhibits a feature of exceptionally long persistence. Throughout the observational period of 1951–2020, there are seven cases in which the summer accumulated precipitation amount exceeded the 90th percentile. Although these seven extremely heavy rainfall events exhibit similar large intensities regarding the accumulated precipitation amount over the MLYRB, their persistence features differ. Figure 3 shows the time series of daily rainfall amount from June to August for these seven heavy rainfall events. As indicated by the green solid line (i.e., one-week running mean results) in Fig. 3, the heavy rainfall in the summers of 2020 and 1954 exhibited pronounced long persistence, that is, the period that the daily rainfall amount exceeded 10 mm d–1 lasted more than six consecutive weeks. In Fig. 3, the dashed line indicates the reference line, and the green shading indicates the values above the reference value. In contrast, none of the other heavy rainfall cases presented a continuous wet process lasting for more than five consecutive weeks (see the green shading in Figs. 3c–g). For example, the strong heavy rainfall is mainly concentrated within four consecutive weeks (from 23 June to 17 July) in summer 1969 (Fig. 3c), occurs by fits and starts in summer 1980 (Fig. 3d), and occurs with a bimodal distribution regarding the persistence period (12 June–3 July, and 17 July–2 August) in summer 1998 (Fig. 3f). To further investigate the 2020PHR-like extreme event occurring over the MLYRB, the maximum of the accumulated precipitation over any consecutive five weeks during June to August (say, Rx35day) is defined as the criterion for identifying persistent heavy rainfall events over the MLYRB. Note that the results below are not sensitive to small variations in the length of the persistence time, e.g., the projection results can hold if the Rx28day or Rx42day is used. As shown in Fig. 4, the time series of the normalized Rx35day during the observational period of 1951–2020 shows that the 2020 event is 60% stronger than the 1951–2005 climatology. The 2020 extreme event ranks the second highest since 1951, following the extremely heavy rainfall event occurring in summer 1954. The GEV distribution (black solid line in Fig. 4b) and return periods (Fig. 4c) fitted to the observed Rx35day denote that the persistent heavy rainfall in summer 2020 is a 1-in-70-year event.
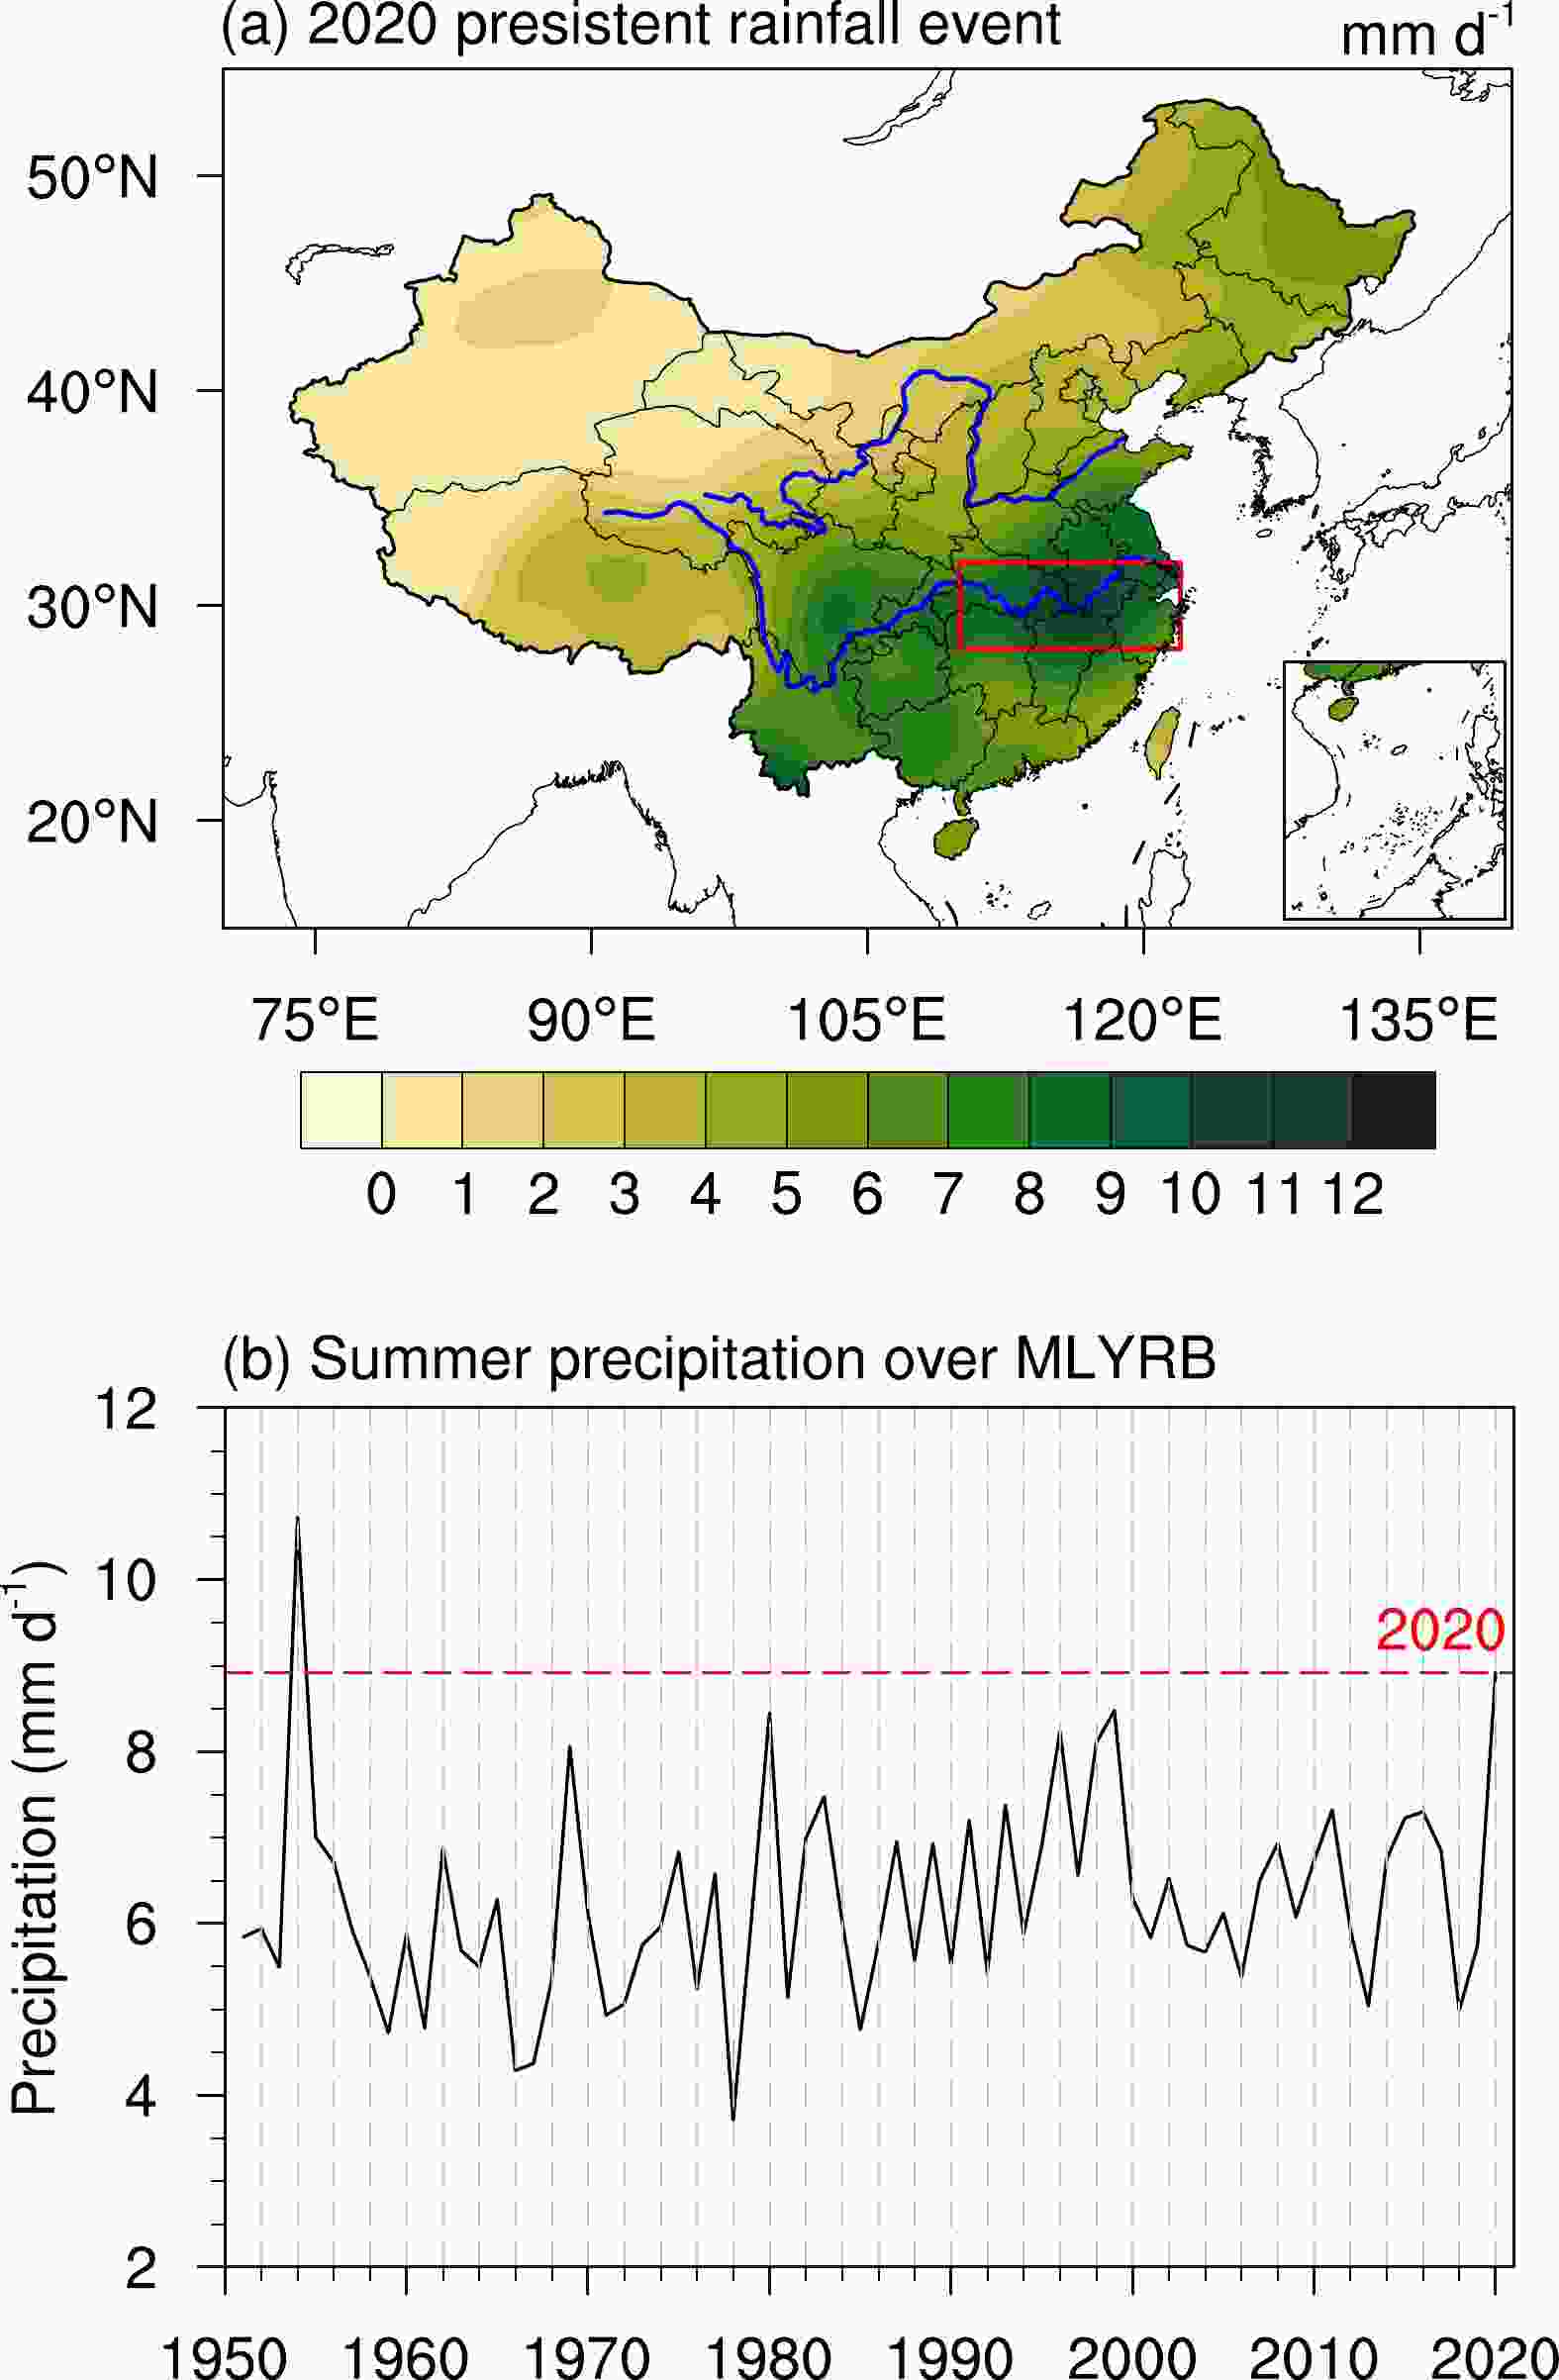
Figure 2. (a) The observed horizontal pattern of the mean precipitation during the summer of 2020 (units: mm d–1). The red box denotes the middle and lower Yangtze River basin (110°–122°E, 28°–32°N). (b) Time series of the mean precipitation over the MLYRB in the boreal summer (June–August) from 1951 to 2020. The red dashed line denotes the summer precipitation in 2020 (units: mm d–1).
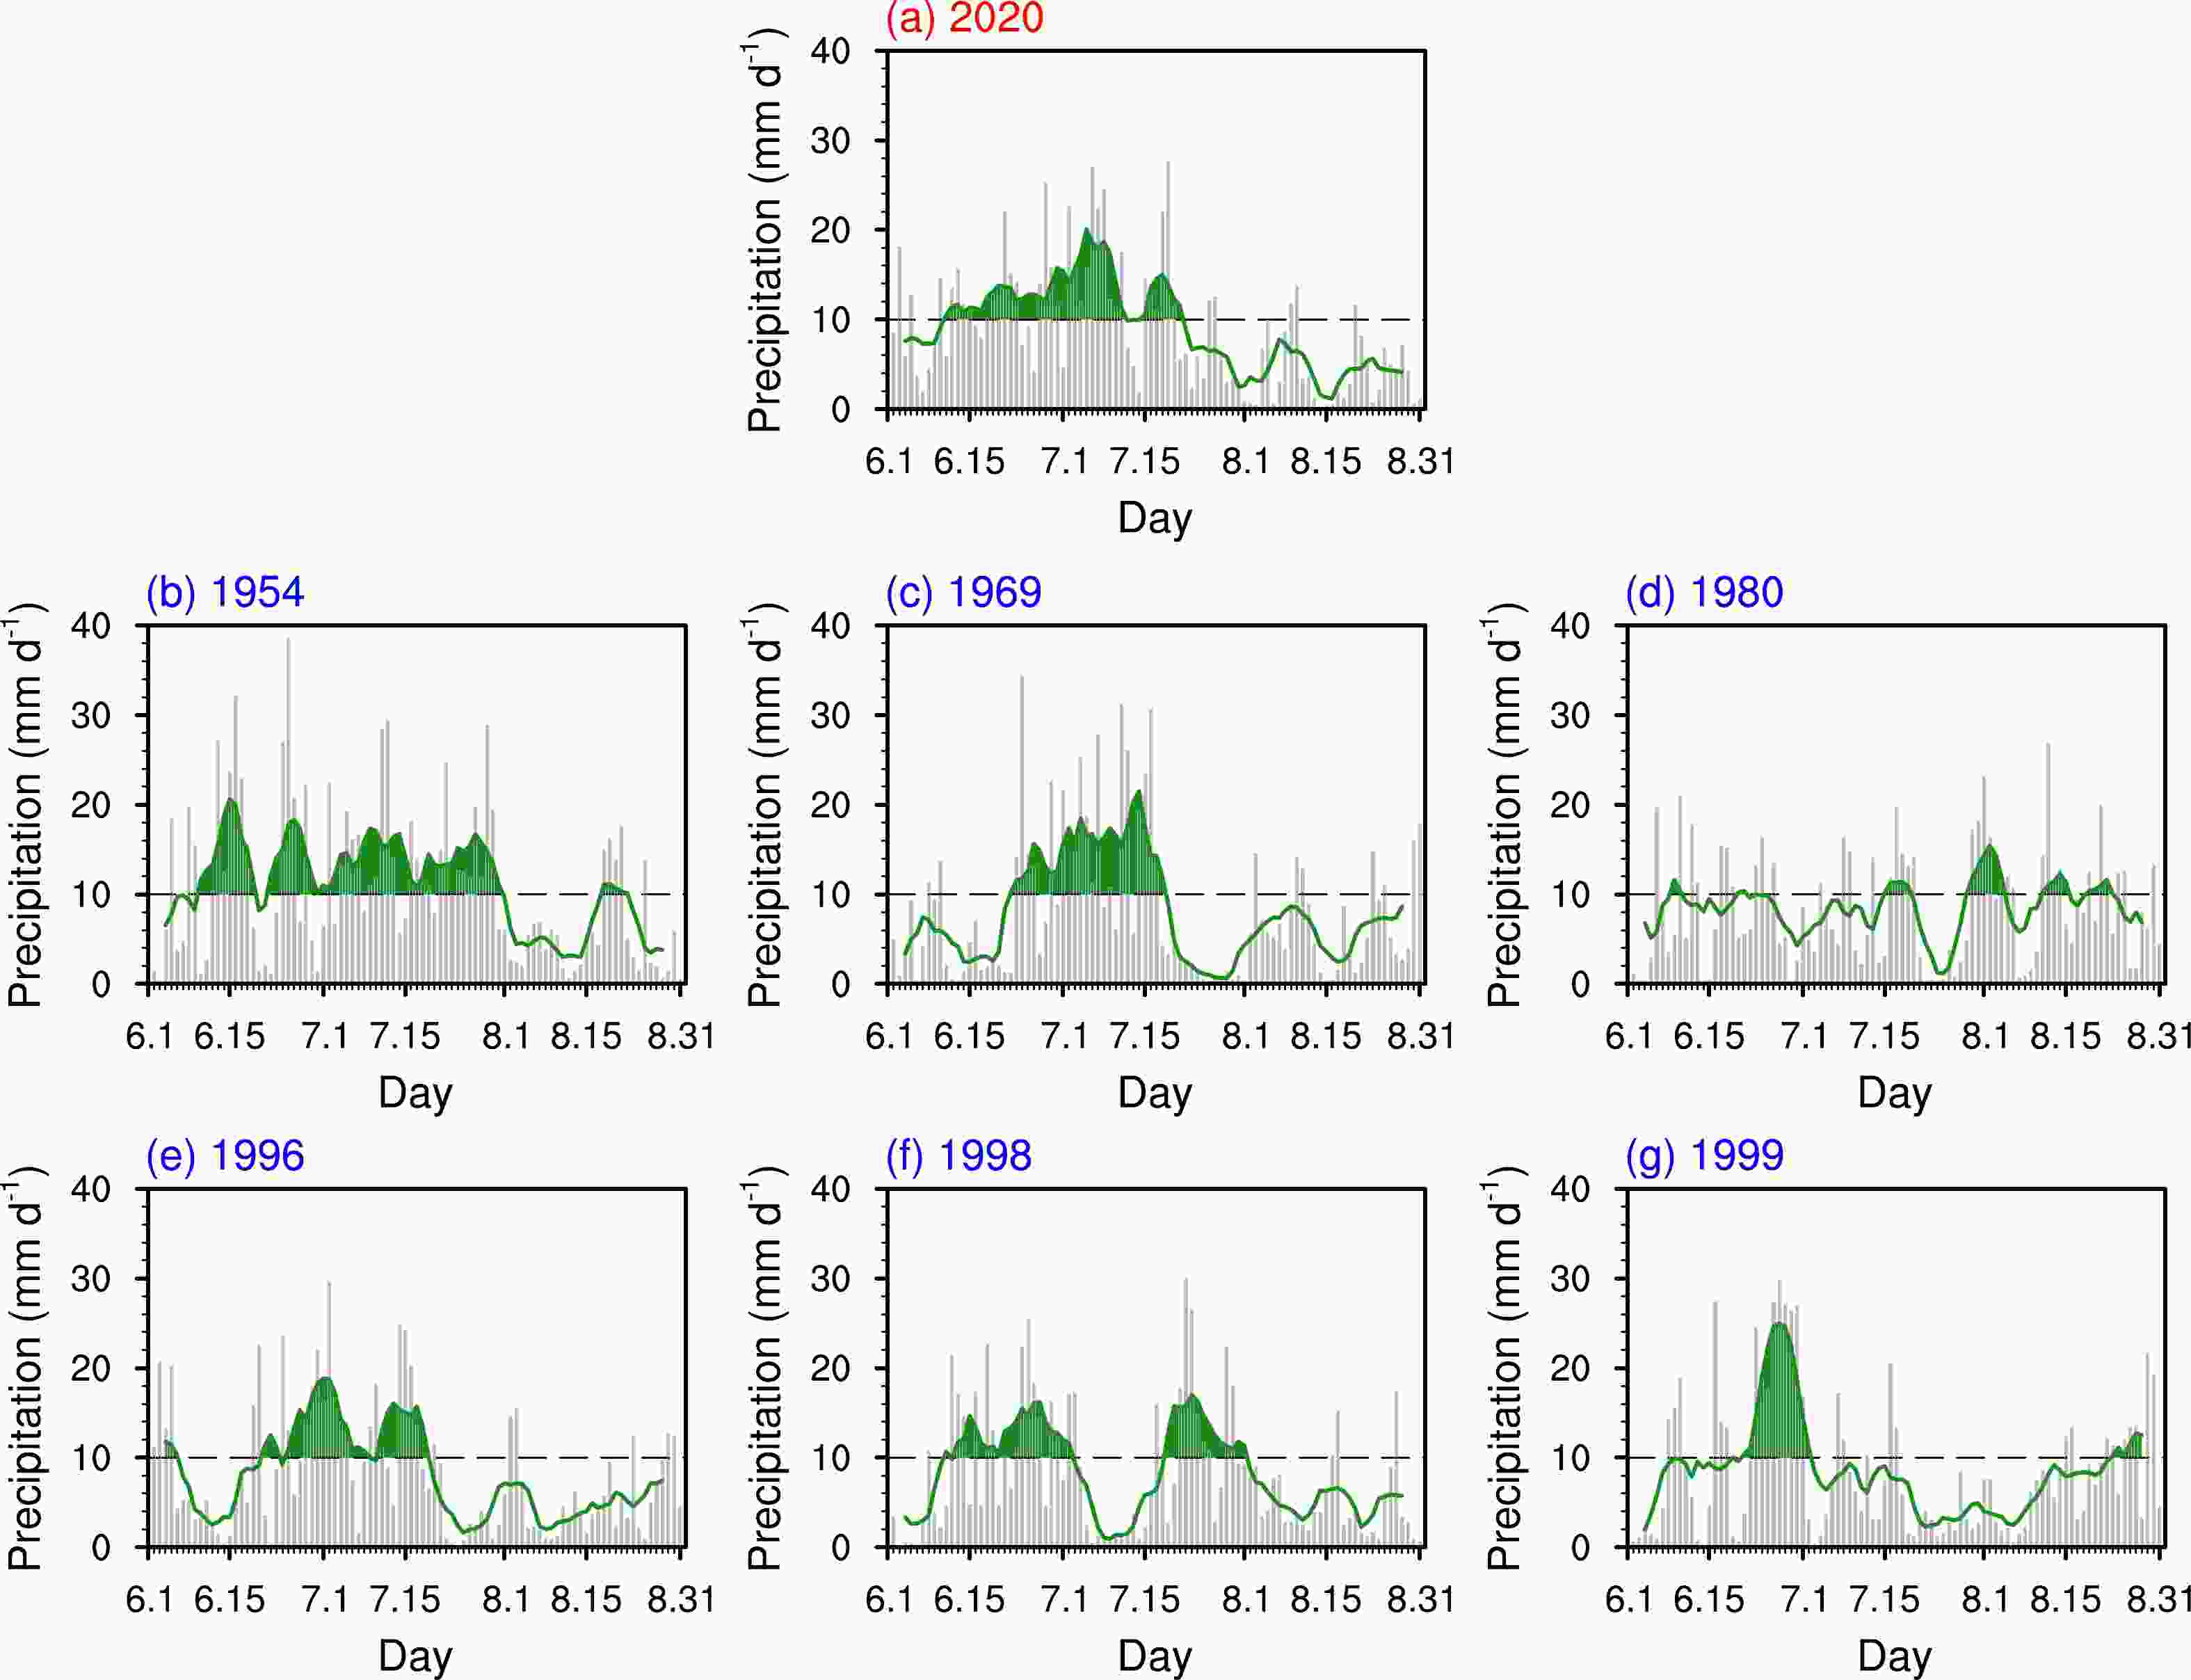
Figure 3. Time series of the daily accumulated precipitation averaged over the MLYRB in the summer of (a) 2020, (b) 1954, (c) 1969, (d) 1980, (e) 1996, (f) 1998, (g) 1999 (gray bar, units: mm d–1). The green solid line is the time series smoothed by a one-week running window. The black dashed line represents a value of 10 mm d–1, and the daily precipitation that exceeds 10 mm d–1 is highlighted with green shading.
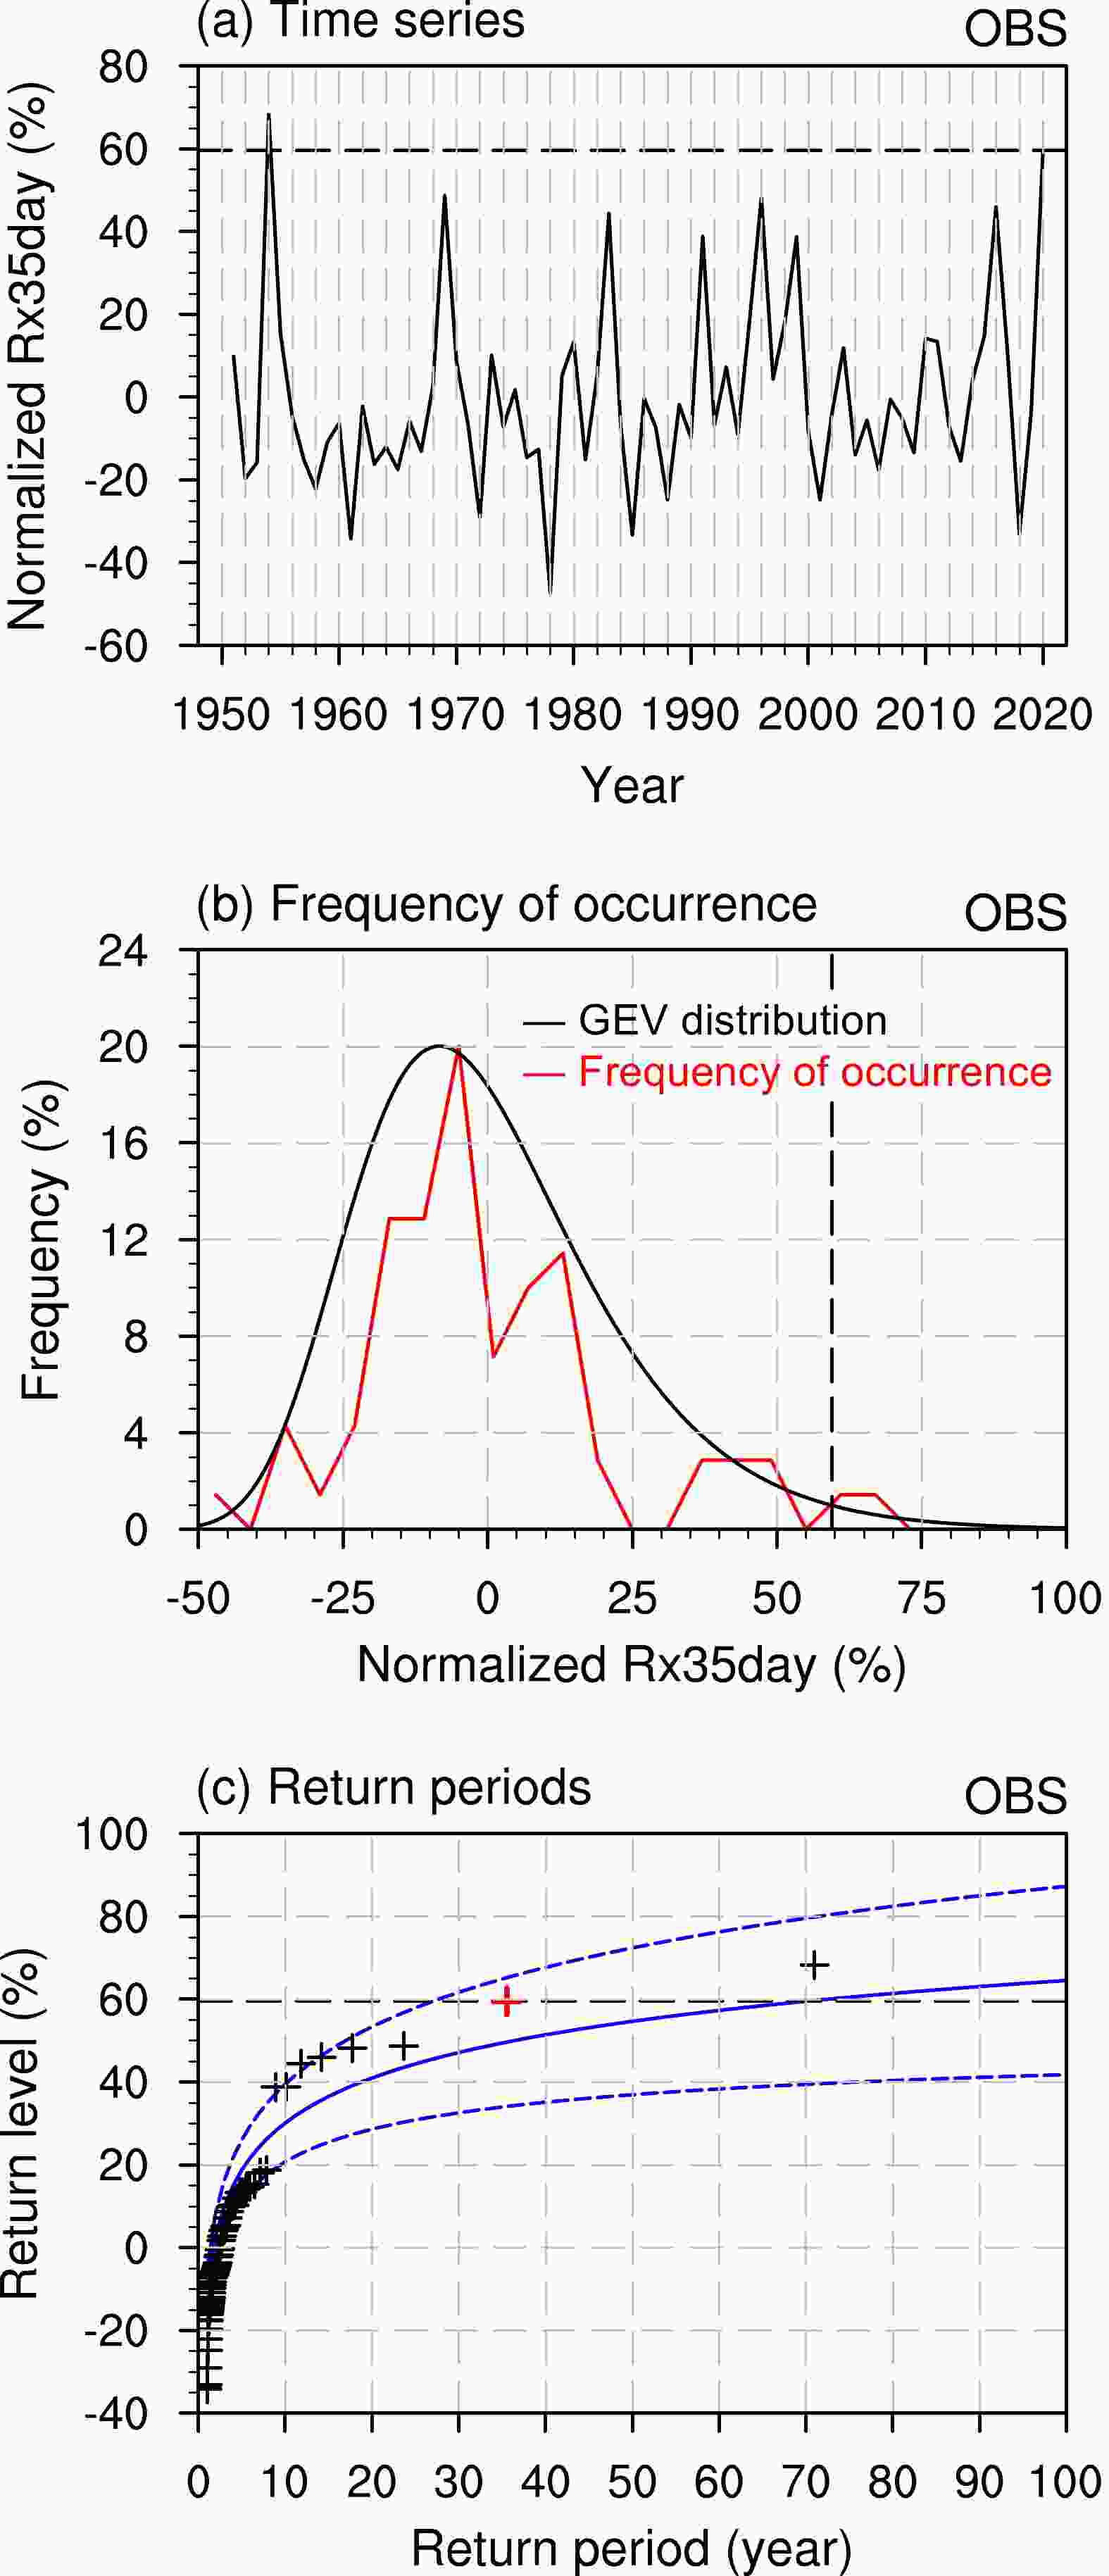
Figure 4. (a) Time series of the Rx35day from 1951 to 2020 normalized by the mean value over the period of 1951–2020. (b) Frequency of occurrence (red solid line) and GEV fit (black solid line) and (c) return periods of the normalized Rx35day with 95% confidence intervals. The crosses are observed Rx35day with the red marker representing the 2020 event. The dashed black lines indicate the magnitude of the 2020 event.
It is worth mentioning that in the region of the MLYRB (110°–122°E and 28°–32°N) discussed in our study, the distribution of stations is relatively sparse before 1960. Specifically, there are only 33 stations that provide available datasets in 1954, and then the number of stations rapidly reached up to 80 after 1960. One natural question is whether our statistical results based on observational station datasets can still hold true, as one of the top two extremely heavy rainfall events lies in summer 1954. Figure S1 (in the electronic supplementary material, ESM) shows the distribution of the national baseline stations (marked by green crosses), including the 33 stations over the MLYRB available in 1954 (marked by green crosses with black circles). In general, these 33 stations available in 1954 are distributed uniformly over the MLYRB region (see the cross markers with circles in Fig. S1), which is of great significance in accurately reflecting the regional mean precipitation. We interpolate the observed precipitation datasets derived from these 33 stations from 1951 to 2020 onto a regular grid of 1° × 1°, analogous to how we treated all available station datasets within the MLYRB region. Based on this new gridded data, we recalculate the time series, GEV distribution, and return periods of the normalized Rx35day over the MLYRB (red lines in Fig. S2 in the ESM) and make a direct comparison with the original results that are derived from all available stations (black lines in Fig. S2). Clearly, the difference between these two results is negligible, indicating that the difference in the number of stations before and after 1960 has no influence on our results. Additionally, our argument that the persistent heavy rainfall in summer 1954 ranks first, followed by the case in 2020, still holds true if only the same 33 stations are used. In fact, a mass of previous studies have already documented the extremely heavy rainfall in summer 1954 over the MLYRB (e.g., Zhang et al., 2006; Liu and Ding, 2020).
In summary, the heavy rainfall over the MLYRB in summer 2020 is an extraordinarily persistent heavy rainfall event, which is expected to occur on average once in every 70 years based on the GEV distribution method. Next, we will investigate whether the likelihood of the 2020PHR-like event would undergo pronounced changes in response to greenhouse gas (GHG) emissions by adopting both large-member ensemble and multimodel ensemble strategies.
-
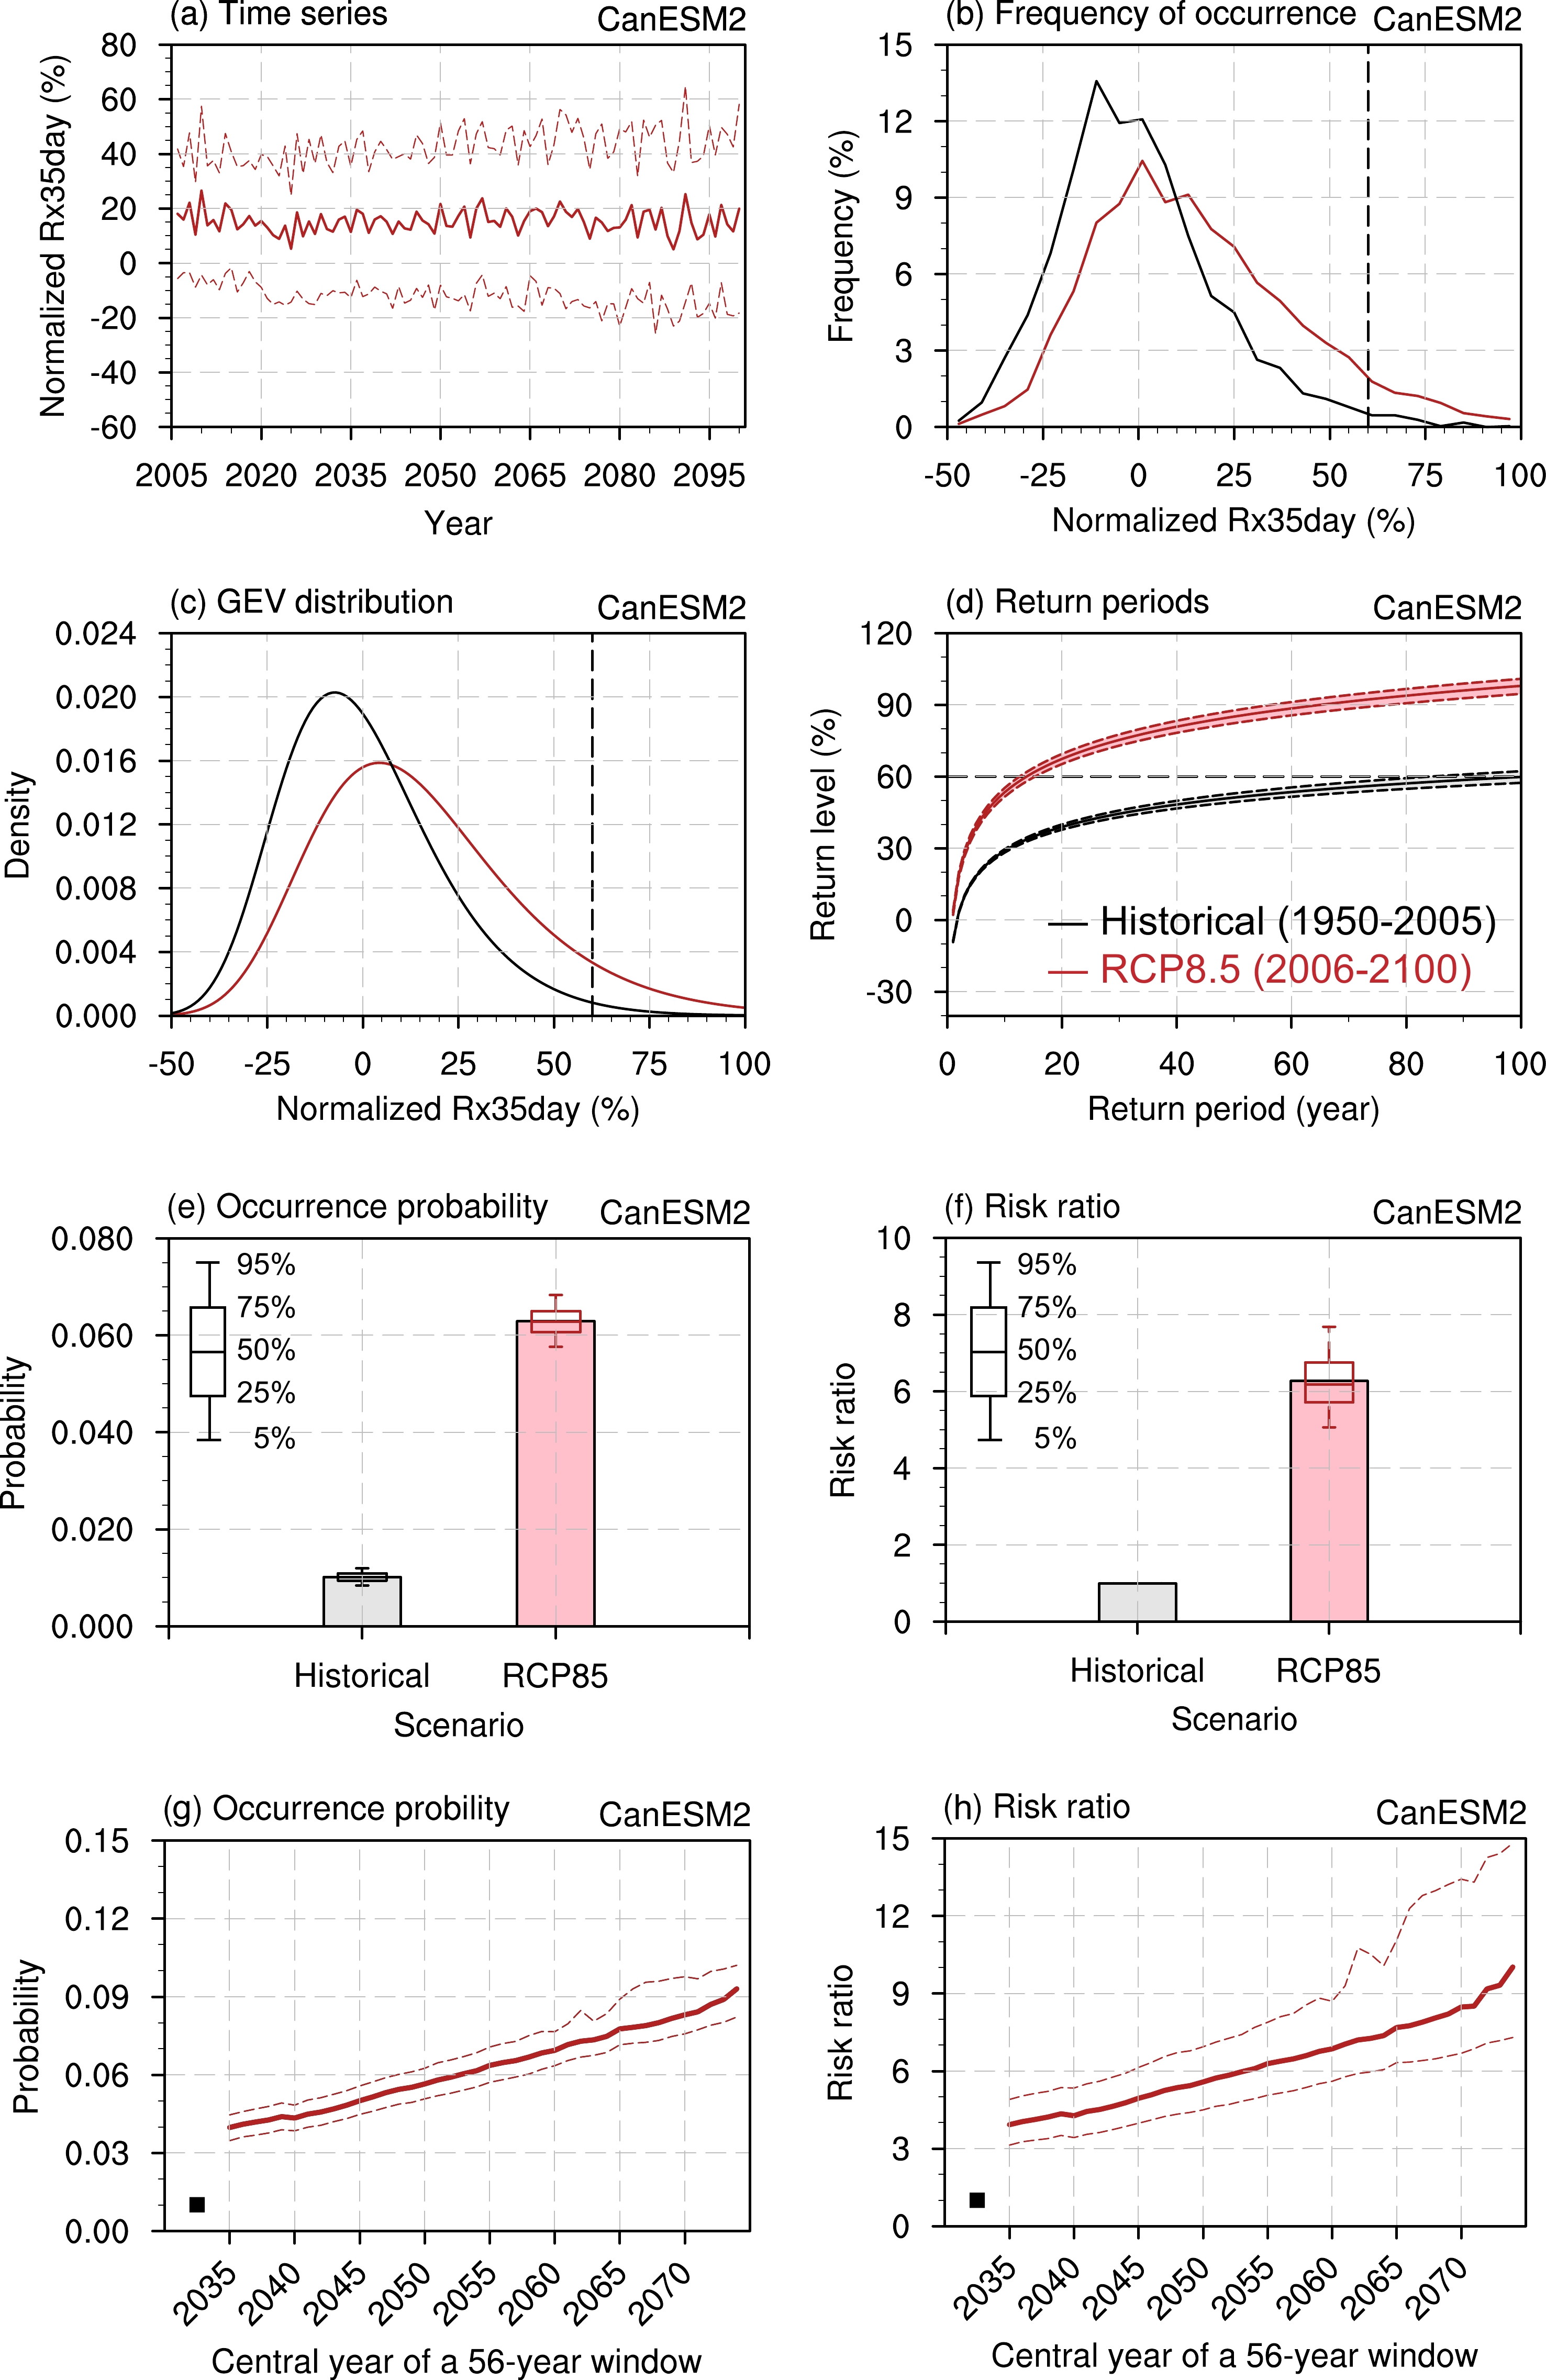
As CanESM2 provides not only the historical simulation but also the RCP8.5 scenario simulation with a large ensemble of 50 members, we firstly employ CanESM2 to examine whether the risk of the 2020PHR-like event would undergo changes in a warming climate. A preliminary evaluation for the model performance regarding the persistent heavy rainfall over the MLYRB is conducted. The 1951–2010 climatological Rx35day simulated by CanESM2 is 6.5 mm d–1, showing a reasonable magnitude of the persistent heavy rainfall in comparison with 8.6 mm d–1 in the observation. Then the time series of Rx35day is normalized and expressed as a percentage anomaly in relation to the climatological Rx35day. In this way, the influence of the systematic bias (i.e., the underestimation bias) can be alleviated to some extent. It is found that the GEV distribution fitted to the normalized Rx35day simulated by the historical run of CanESM2 (black solid line in Fig. 5c) cannot be distinguished from the observation (Fig. 4c) using the K–S test (p-value=0.95>0.05). This indicates that the historical run of CanESM2 is capable of reasonably reproducing the probability distribution of the 2020PHR-like event. Figure 5c shows the GEV distributions of the simulated persistent heavy rainfall for the historical and RCP8.5 period. Overall, the distribution shows a shift towards a wetter condition, demonstrating increases in the probability of such persistent rainfall extremes over the MLYRB under RCP8.5 forcing. More precisely, the occurrence of the 2020PHR-like event becomes significantly more frequent, from a 1-in-100-year event under present-day climate to a 1-in-15-year event under the RCP8.5 forcing (Fig. 5d). Correspondingly, the occurrence probability of the 2020PHR-like event increases from 1.0% (0.8%–1.2%) to 6.3% (5.8%–6.8%) (Fig. 5e), which corresponds to a dramatically higher risk ratio of 6.2 (5.1–7.7, Fig. 5f) in the RCP8.5 projection than that in the historical simulation. Here, the above values within the parentheses indicate the inter-member uncertainty, which is obtained by bootstrapping 50 members for 1000 times with replacement, and the 5th and 95th percentiles of the distribution indicate the lower and upper limits for the uncertainty.
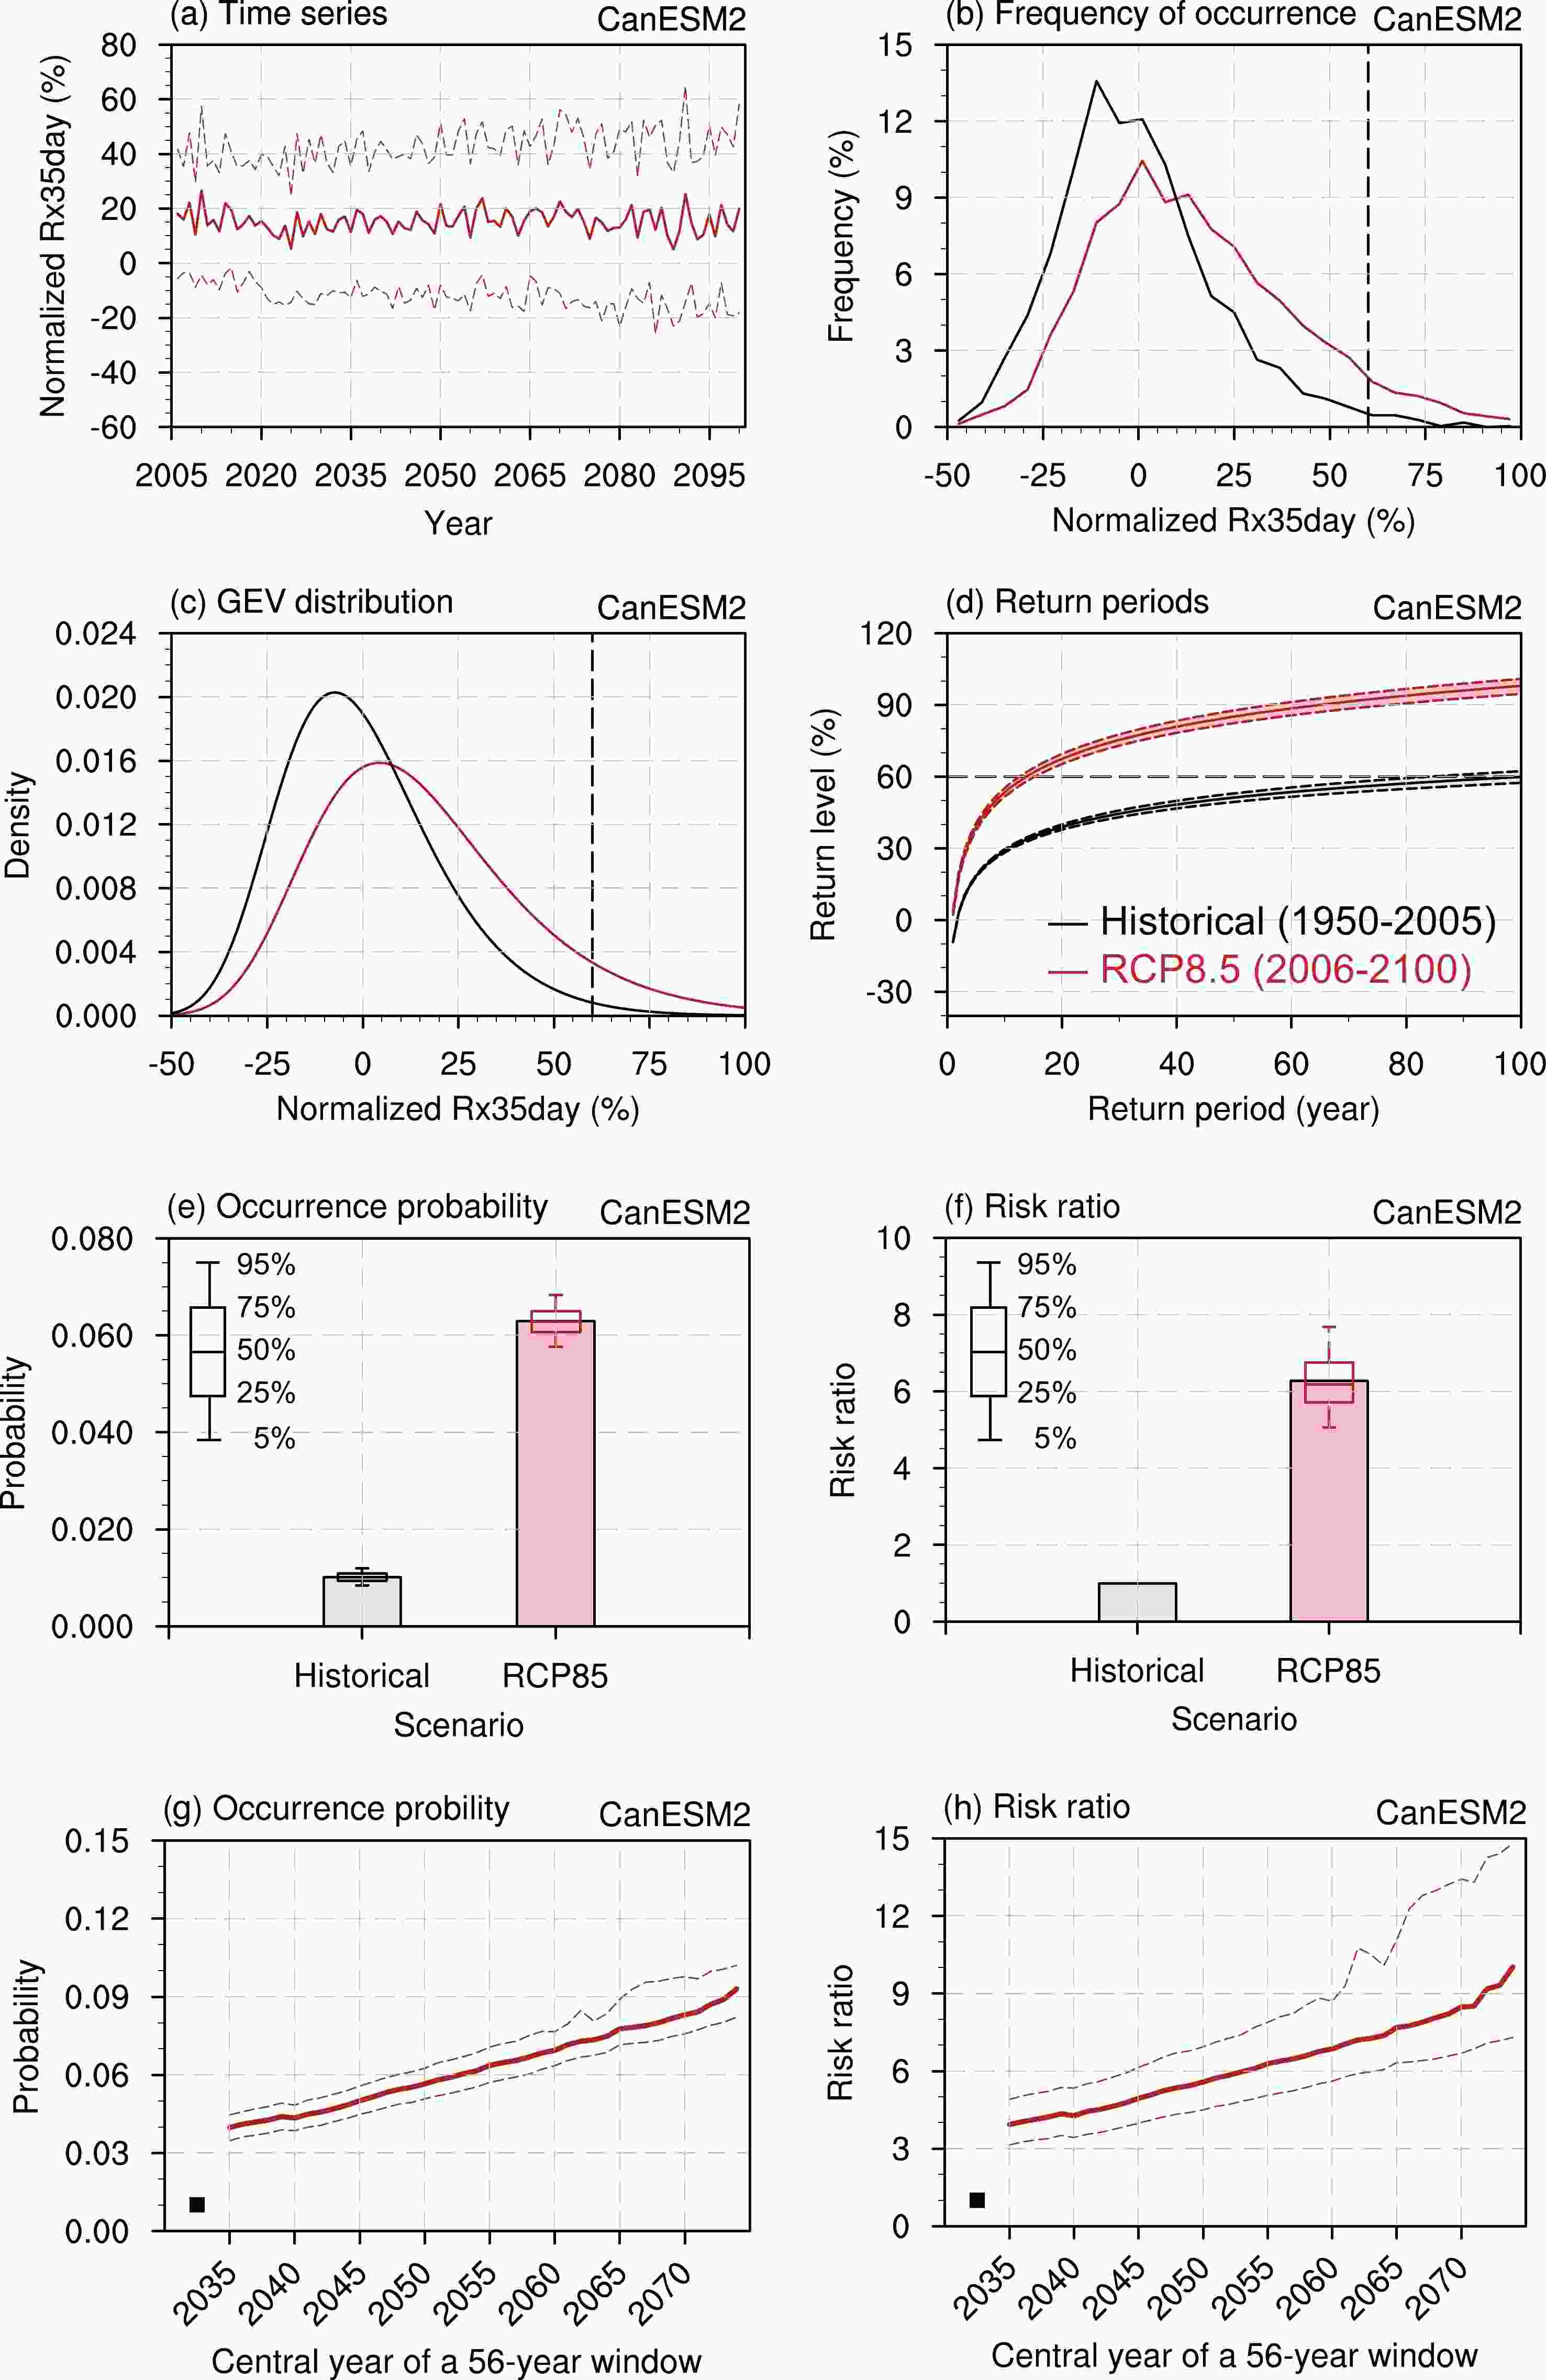
Figure 5. (a) Time series of the normalized Rx35day for the RCP8.5 (red solid line) emission scenarios over the period of 2006–2100 simulated by 50 members of CanESM2. The colored dashed line indicates the inter-model spread of a standard deviation. (b) Frequency of occurrence, (c) GEV distributions, (d) return periods with 90% confidence interval, (e) occurrence probability and (f) risk ratio with inter-model uncertainties (box-and-whisker), the multi-year running (g) occurrence probability and (h) risk ratio with 90% confidence interval of the normalized Rx35day for the historical simulation (1950–2005) and RCP8.5 emission scenario (2006–2100). The black square markers indicate the occurrence probability and risk ratio of the historical simulation. The length of the running window is chosen to correspond to the length of the corresponding historical simulation period. All inter-model uncertainties are estimated by bootstrapping 10 models for 1000 times with replacement.
To further clarify the time-varying feature of the slowly changing likelihood of the 2020PHR-like event under the RCP8.5 warming scenario, we calculated the occurrence probability (Fig. 5g) and risk ratio (Fig. 5h) with a 56-year running window from 2006–2061 to 2045–2100. The length of the running window (56 years) is chosen to correspond to the length of the historical period (1950–2005). It is found that the risk of the 2020PHR-like event exhibits a continued increase with the world getting warmer. During the first half of the twenty-first century, the probability of the 2020PHR-like event reaches 3.9 (3.1–4.9) times as high as that in the historical simulation, which steadily reaches up to 10.0 (7.3–14.8) times by the latter half of the twenty-first century.
Although the estimation derived from the large-member ensemble of CanESM2 is of a great robustness, it is built on a single model with multiple members produced by perturbations in the initial atmospheric states. In fact, this single model shows that the occurrence probability of the 2020PHR-like event in present-day climate is 1.0%, showing some underestimation bias compared to the observation. To minimize the uncertainties that arise from the model itself, it is of great significance to further investigate the response of the 2020PHR-like event to different warming scenarios with the aid of multimodels from CMIP5 and CMIP6 archives.
-
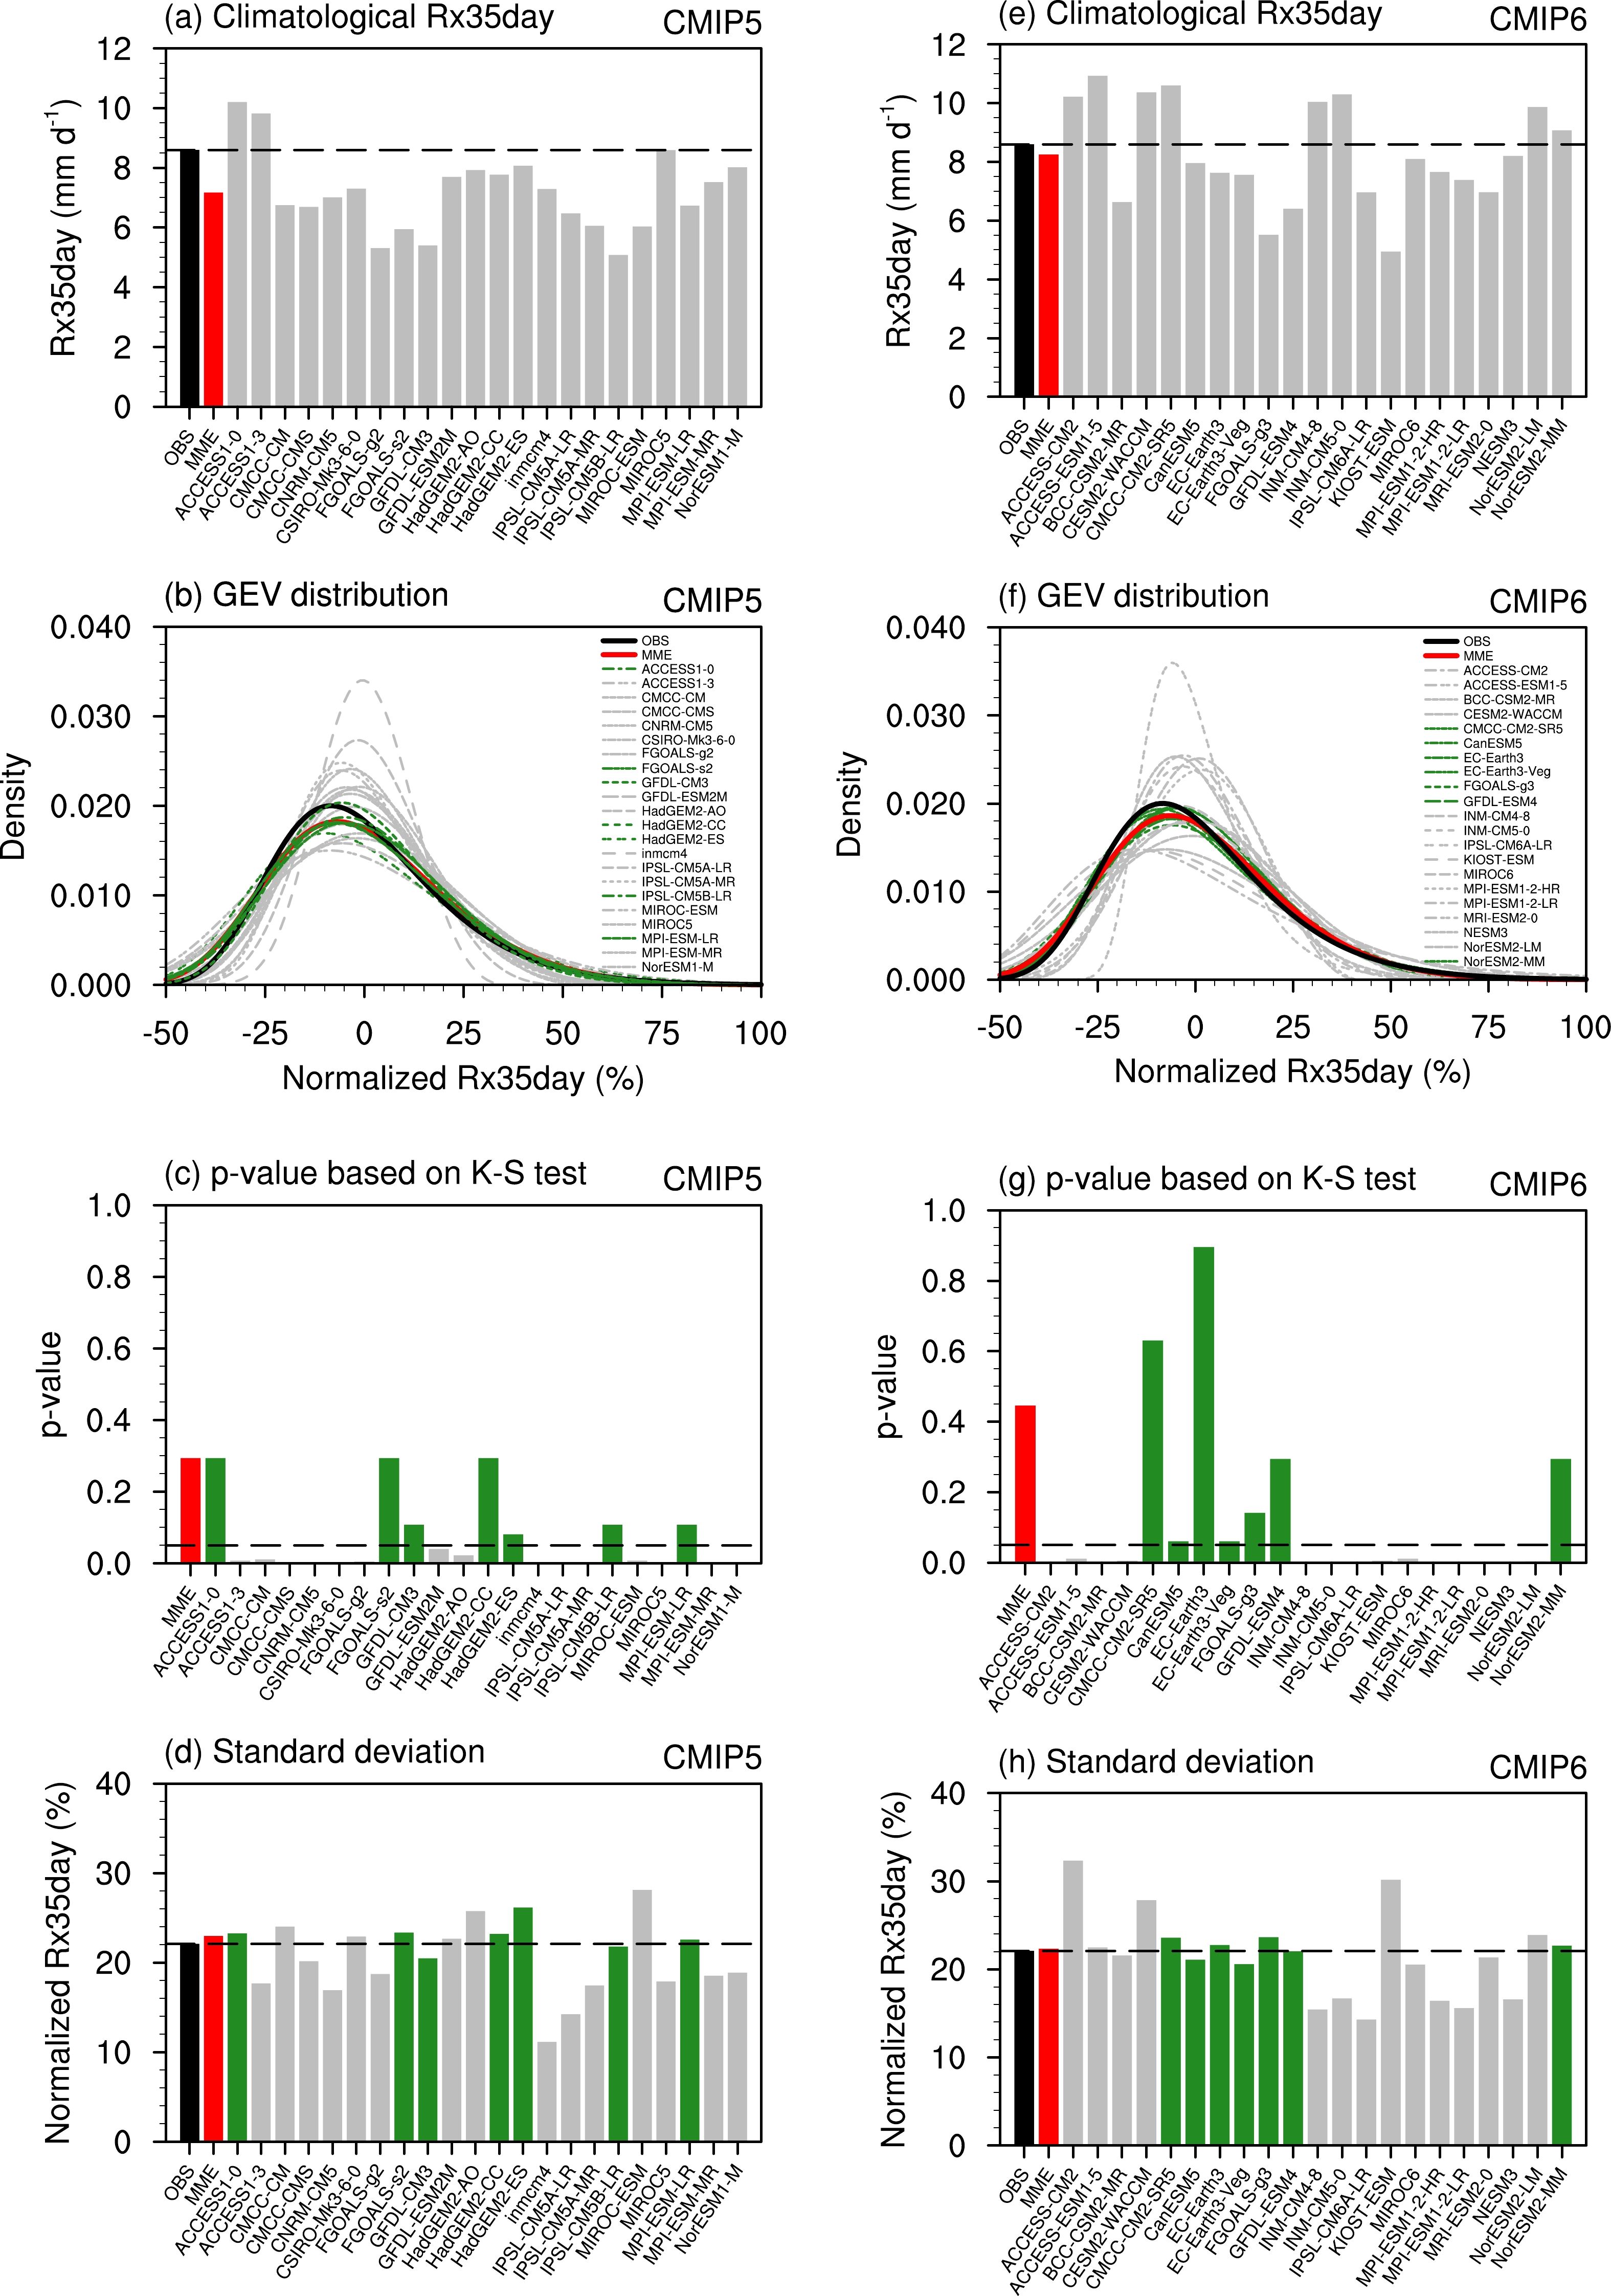
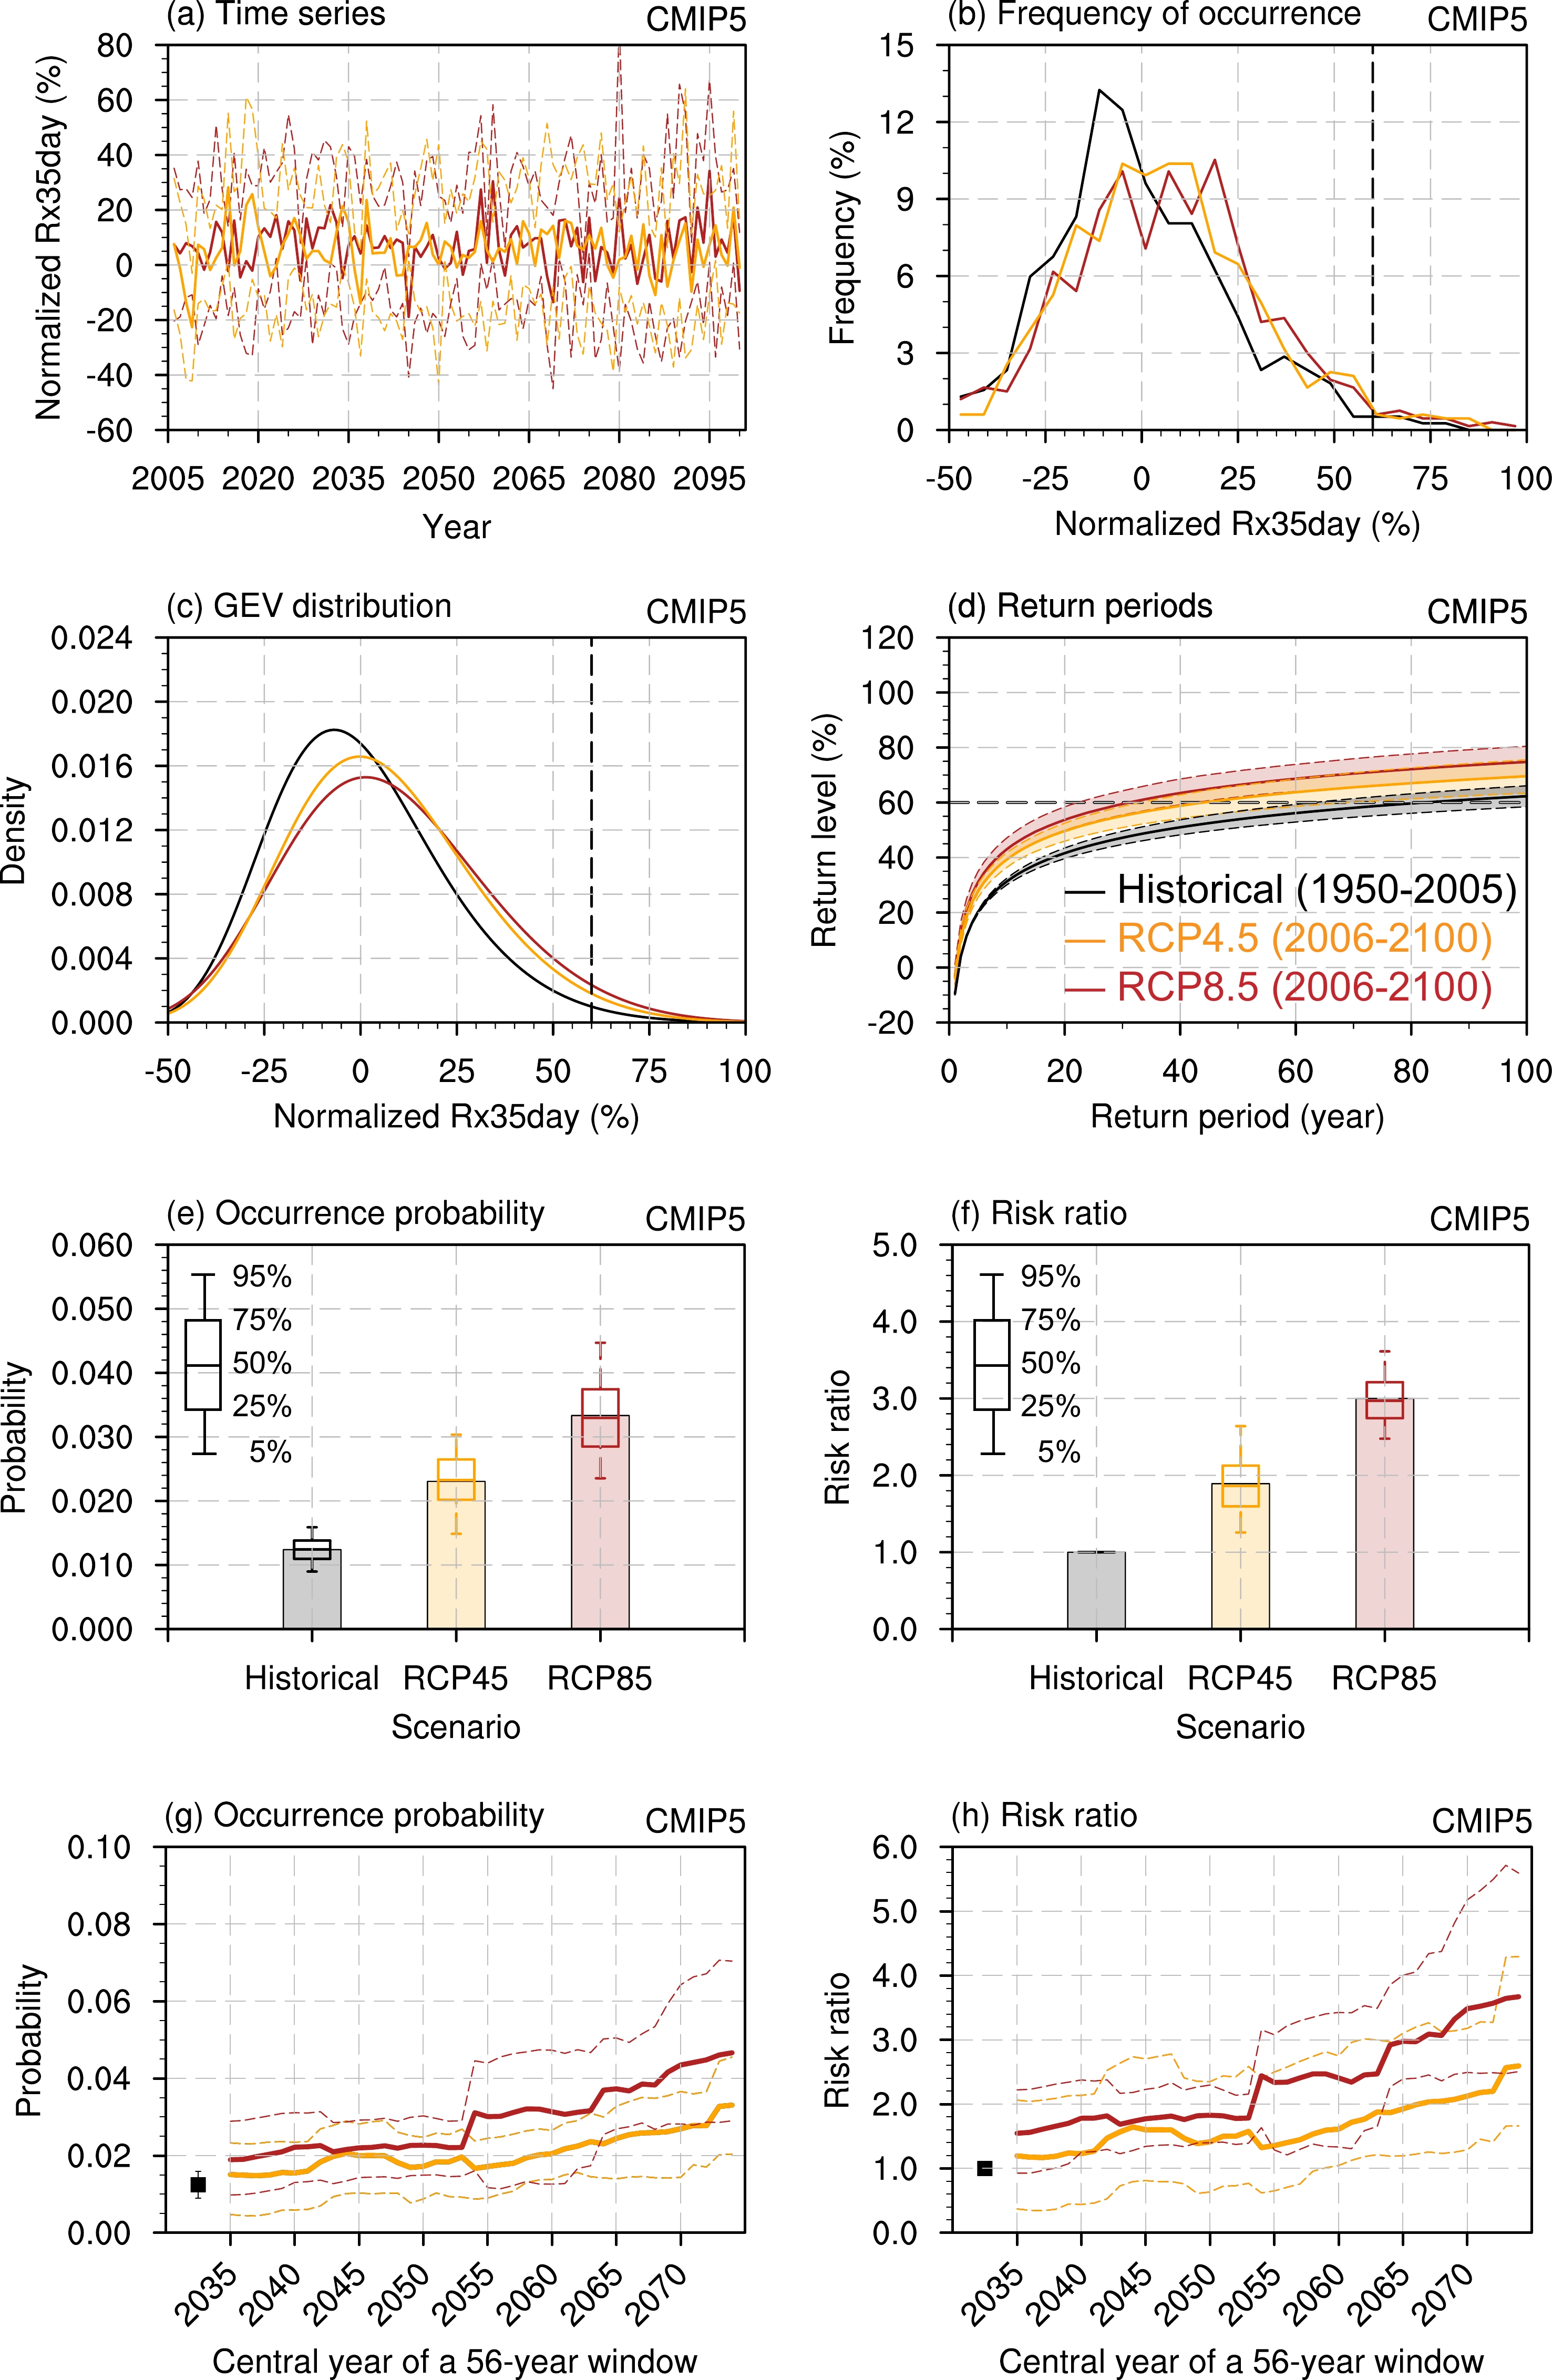
In this section, we employ the historical, RCP4.5, and RCP8.5 simulations derived from 22 CMIP5 archived models to estimate the changing likelihood of the 2020PHR-like event in different warming scenarios as well as the uncertainty. We firstly pick out the relatively reasonable CMIP5 models that can duplicate the 2020PHR-like event in their historical simulations. As shown in Fig. 6a, the climatological Rx35day simulated by the multimodel ensemble mean (MME) of 22 CMIP5 models is 7.1 mm d–1, exhibiting an underestimation by 17%. Although the climatological Rx35day of the MME is relatively reasonable, the individual models may still have overestimated or underestimated the climatological Rx35day compared with the observation to various extents. As such, the Rx35day time series derived from each model is firstly normalized and expressed as a percentage anomaly in relation to their climatological Rx35day to correct the models' biases in simulating the rainfall intensity. We next present the GEV distributions fitted to the normalized Rx35day reproduced by the 22 CMIP5 models (Fig. 6b) and their corresponding p-values (Fig. 6c). Denoted by green colors in Figs. 6b and c, 7 out of 22 CMIP5 models are capable of reproducing a reasonable Rx35day variability, and from the perspective of the K–S test, they are not distinguished from the observation. Additionally, each of these seven models exhibits a relatively reasonable variability of Rx35day in comparison with the observation, which further confirms that these selected models have relatively good performance in representing the Rx35day features in their historical simulations (Fig. 6d). Consequently, we next use these seven relatively credible models (ACCESS1-0, FGOALS-s2, GFDL-CM3, HadGEM2-CC, HadGEM2-ES, IPSL-CM5B-LR, and MPI-ESM-LR) to project the future changes in the occurrence probability of the 2020PHR-like event. As shown in Fig. 7c, the GEV distributions of the Rx35day shows that there is a progressively increasing probability regarding extremely wet events in the RCP4.5 and RCP8.5 scenarios compared to the historical simulation. The results of the return periods from the historical, RCP4.5, and RCP8.5 simulations also confirm that the 2020PHR-like event will occur more frequently under a more intense emission scenario (Fig. 7d). Specifically, the occurrence probability of the 2020PHR-like extreme event for the historical period is 1.2% (0.9%–1.6%), while it reaches 2.3% (1.5%–3.0%) in the RCP4.5 simulation. Furthermore, the occurrence probability of the 2020PHR-like extreme event can rise to 3.3% (2.4%–4.4%) in the more intense emission scenario (say, RCP8.5). Here the above values within parentheses denote the uncertainty indicated by inter-model spread. Accordingly, the 2020PHR-like event is 1.9 (1.3–2.6) and 3.0 (2.5–3.6) times more likely to occur under RCP4.5 warming scenario and RCP8.5 warming scenario, respectively. To examine whether the probability of the 2020PHR-like event increases monotonously along with the gradual warming progress, we further present the time-varying response of the 2020PHR-like event to the warming scenario with a 56-year running window. As the 56-year running window advances, the risk of persistent precipitation extremes exhibits a monotonous increase along with the rise of the GHG emissions (Figs. 7g and h). Also, it is found that both the occurrence probability and risk ratio under the RCP8.5 warming scenario are higher than those under the RCP4.5 warming scenario, and the difference of risk indices between these two scenarios is continually enlarged until the end of the twenty-first century.

Figure 6. (a, e) Climatological Rx35day. (b, f) GEV distributions, (c, g) p-values, (d, h) standard deviations of the normalized Rx35day time series for (a, b, c, d) 22 CMIP5 models and (e, f, g, h) 21 CMIP6 models. The highlighted green dashed lines in (b, f) and green bars in (c, d, g, h) denote the models whose p-values exceed the threshold of 0.05.
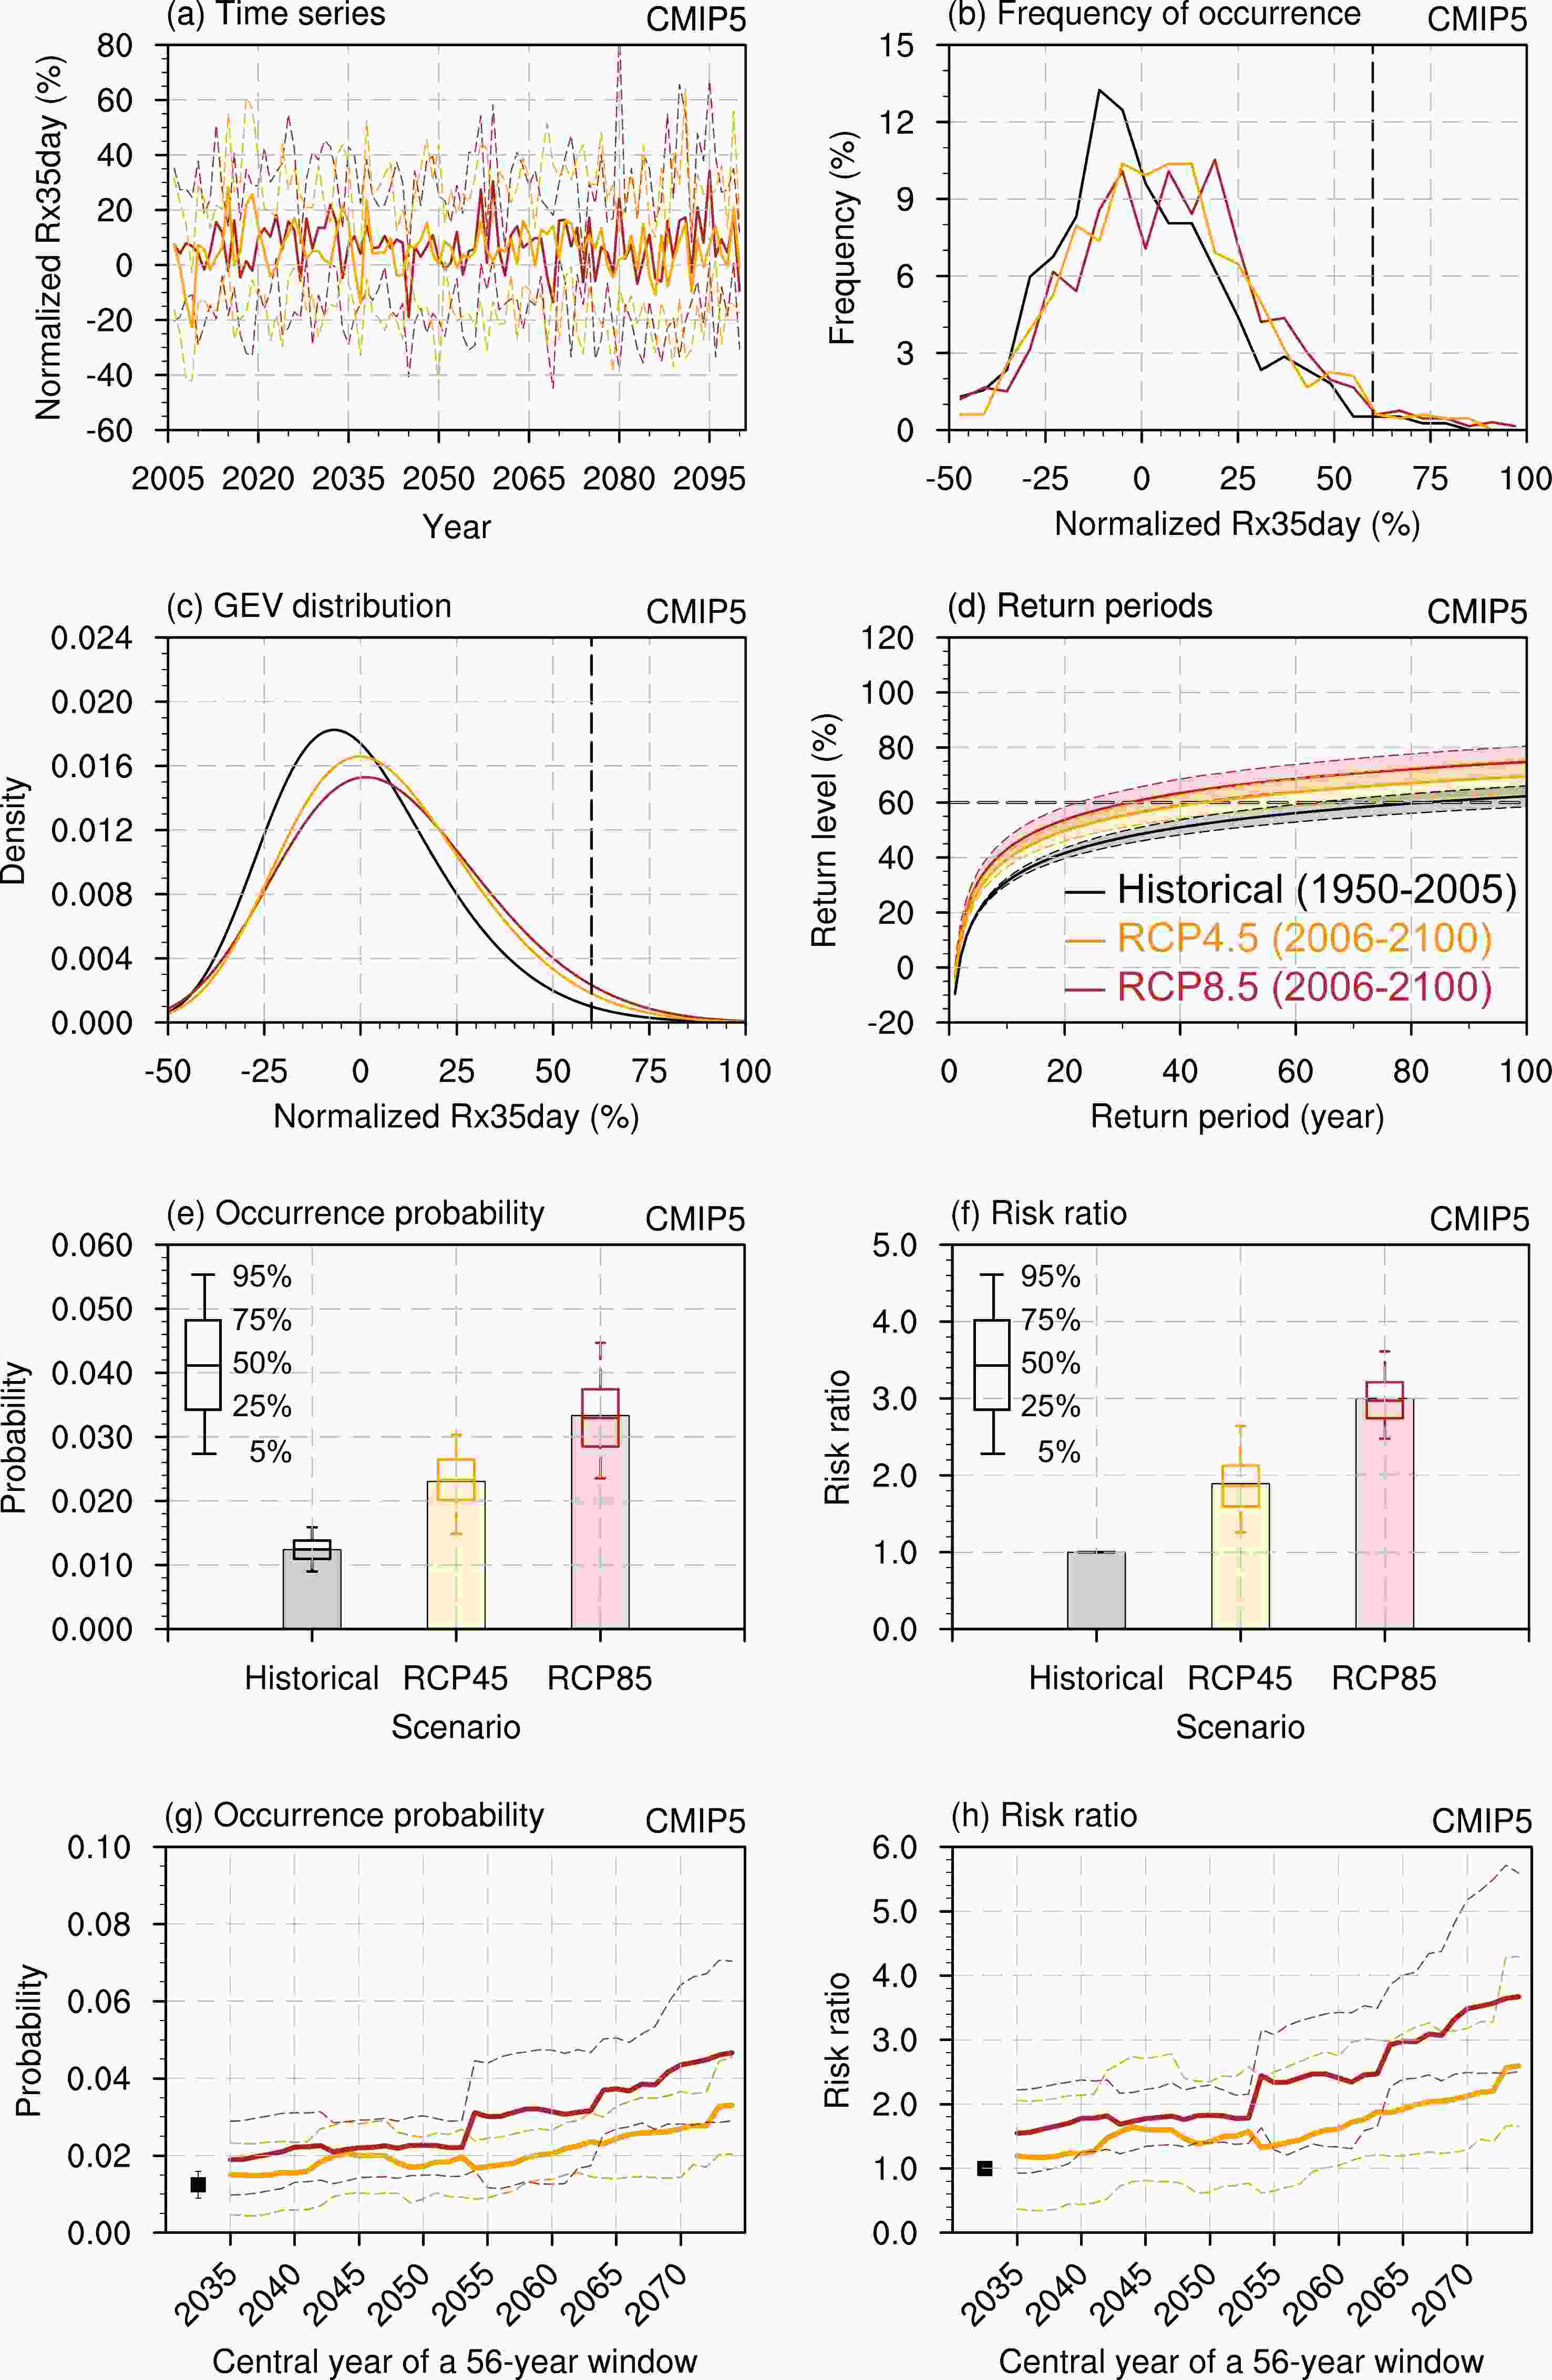
Figure 7. (a) Time series of the normalized Rx35day for the RCP4.5 (orange solid line) and RCP8.5 (red solid line) emission scenarios over the period of 2006–2100 simulated by seven CMIP5 models. The colored dashed line indicates the inter-model spread of a standard deviation. (b) Frequency of occurrence, (c) GEV distributions, (d) return periods with 90% confidence interval, (e) occurrence probability and (f) risk ratio with inter-model uncertainties (box-and-whisker), the multiyear running (g) occurrence probability and (h) risk ratio with 90% confidence interval of the normalized Rx35day for the historical simulation (1950–2005) and two RCP emission scenarios (2006–2100). The black square markers indicate the occurrence probability and risk ratio of the historical simulation. The length of the running window is chosen to correspond to the length of the corresponding historical simulation period. All inter-model uncertainties are estimated by bootstrapping 10 models for 1000 times with replacement.
In general, the future changes of the 2020PHR-like event projected by the multimodel ensemble of CMIP5 yield a good agreement with the counterpart projected by the multimember ensemble of CanESM2, both of which demonstrate a significant increase in the likelihood of the 2020PHR-like event in response to global warming. It is also enlightening that the risk of heavy rainfall is higher in the RCP8.5 warming scenario than in the relatively mild RCP4.5 warming scenario. Next, we will further use the latest-released CMIP6 models to double-check the changing likelihood of the 2020PHR-like event in response to different emission scenarios.
-
The historical simulation and several emission scenarios, including the SSP1-2.6, SSP2-4.5, SSP3-7.0, and SSP5-8.5 simulations derived from CMIP6 archives are used here. Analogous to the strategy for CMIP5 models, we firstly evaluate the basic performance in reproducing the 2020PHR-like event in the historical simulation. The climatological Rx35day simulated by the MME of 21 CMIP6 models reaches 8.3 mm d–1, showing a quite reasonable magnitude of the climatological Rx35day (Fig. 6e). Analogous to the method applied for CanESM2 and CMIP5 models, we firstly normalized the time series of Rx35day for each model and then expressed them as a percentage anomaly in relation to their climatological Rx35day. Afterwards, the GEV distributions fitted to the normalized Rx35day derived from the 21 CMIP6 models (Fig. 6f) and their corresponding p-values (Fig. 6g) are obtained. It is found that 7 out of 21 CMIP6 models (CMCC-CM2-SR5, CanESM5, EC-Earth3, EC-Earth3-Veg, FGOALS-g3, GFDL-ESM4, and NorESM2-MM) are qualified for further projection analysis, as they have the capability of reproducing a reasonable Rx35day variability based on the K–S test (Figs. 6f and g). Also, these seven selected CMIP6 models can duplicate the variability of Rx35day well (Fig. 6h). Based on the multimodel ensemble mean derived from these seven CMIP6 models, the future projection results show that the occurrence probability of the 2020PHR-like event becomes higher and the return period of the 2020PHR-like event becomes shorter under all four warming scenarios, compared to the counterparts obtained from the historical simulation (Figs. 8c and d). Specifically, the occurrence probability of the 2020PHR-like event is 1.1% (0.7%–1.3%) for the present-day climate, but reaches up to 1.9% (0.9%–3.0%) for SSP1-2.6, 2.1% (0.8%–3.4%) for SSP2-4.5, 3.2% (1.5%–4.8%) for SSP3-7.0, and 4.8% (3.1%–6.5%) for SSP5-8.5, corresponding to the incremental risk ratios of 1.9 (0.8–3.7), 2.0 (0.7–4.1), 2.9 (1.2–6.0), and 4.8 (2.3–8.9) for the above four SSP scenarios, respectively. It is worth noting that the risk ratio does not show an obvious difference between the two low GHG emission scenarios (i.e., SSP1-2.6 versus SSP2-4.5), but it exhibits a sharp increase when the GHG emission is set to the scenarios of SSP3-7.0 and SSP5-8.5. This indicates the importance of carbon emission reduction and carbon neutrality. Figures 8g and h provide the time-varying response of the occurrence probability and the risk ratio of the 2020PHR-like event to each SSP scenario. In general, both the occurrence probability and the risk ratio exhibit a monotonously increasing feature along with the marching of the 65-year running window. Also, it is clear that the increases of both the occurrence probability and risk ratio are sharper in the higher-GHG emission scenarios than in the milder-GHG emission scenarios throughout the entire projection period.
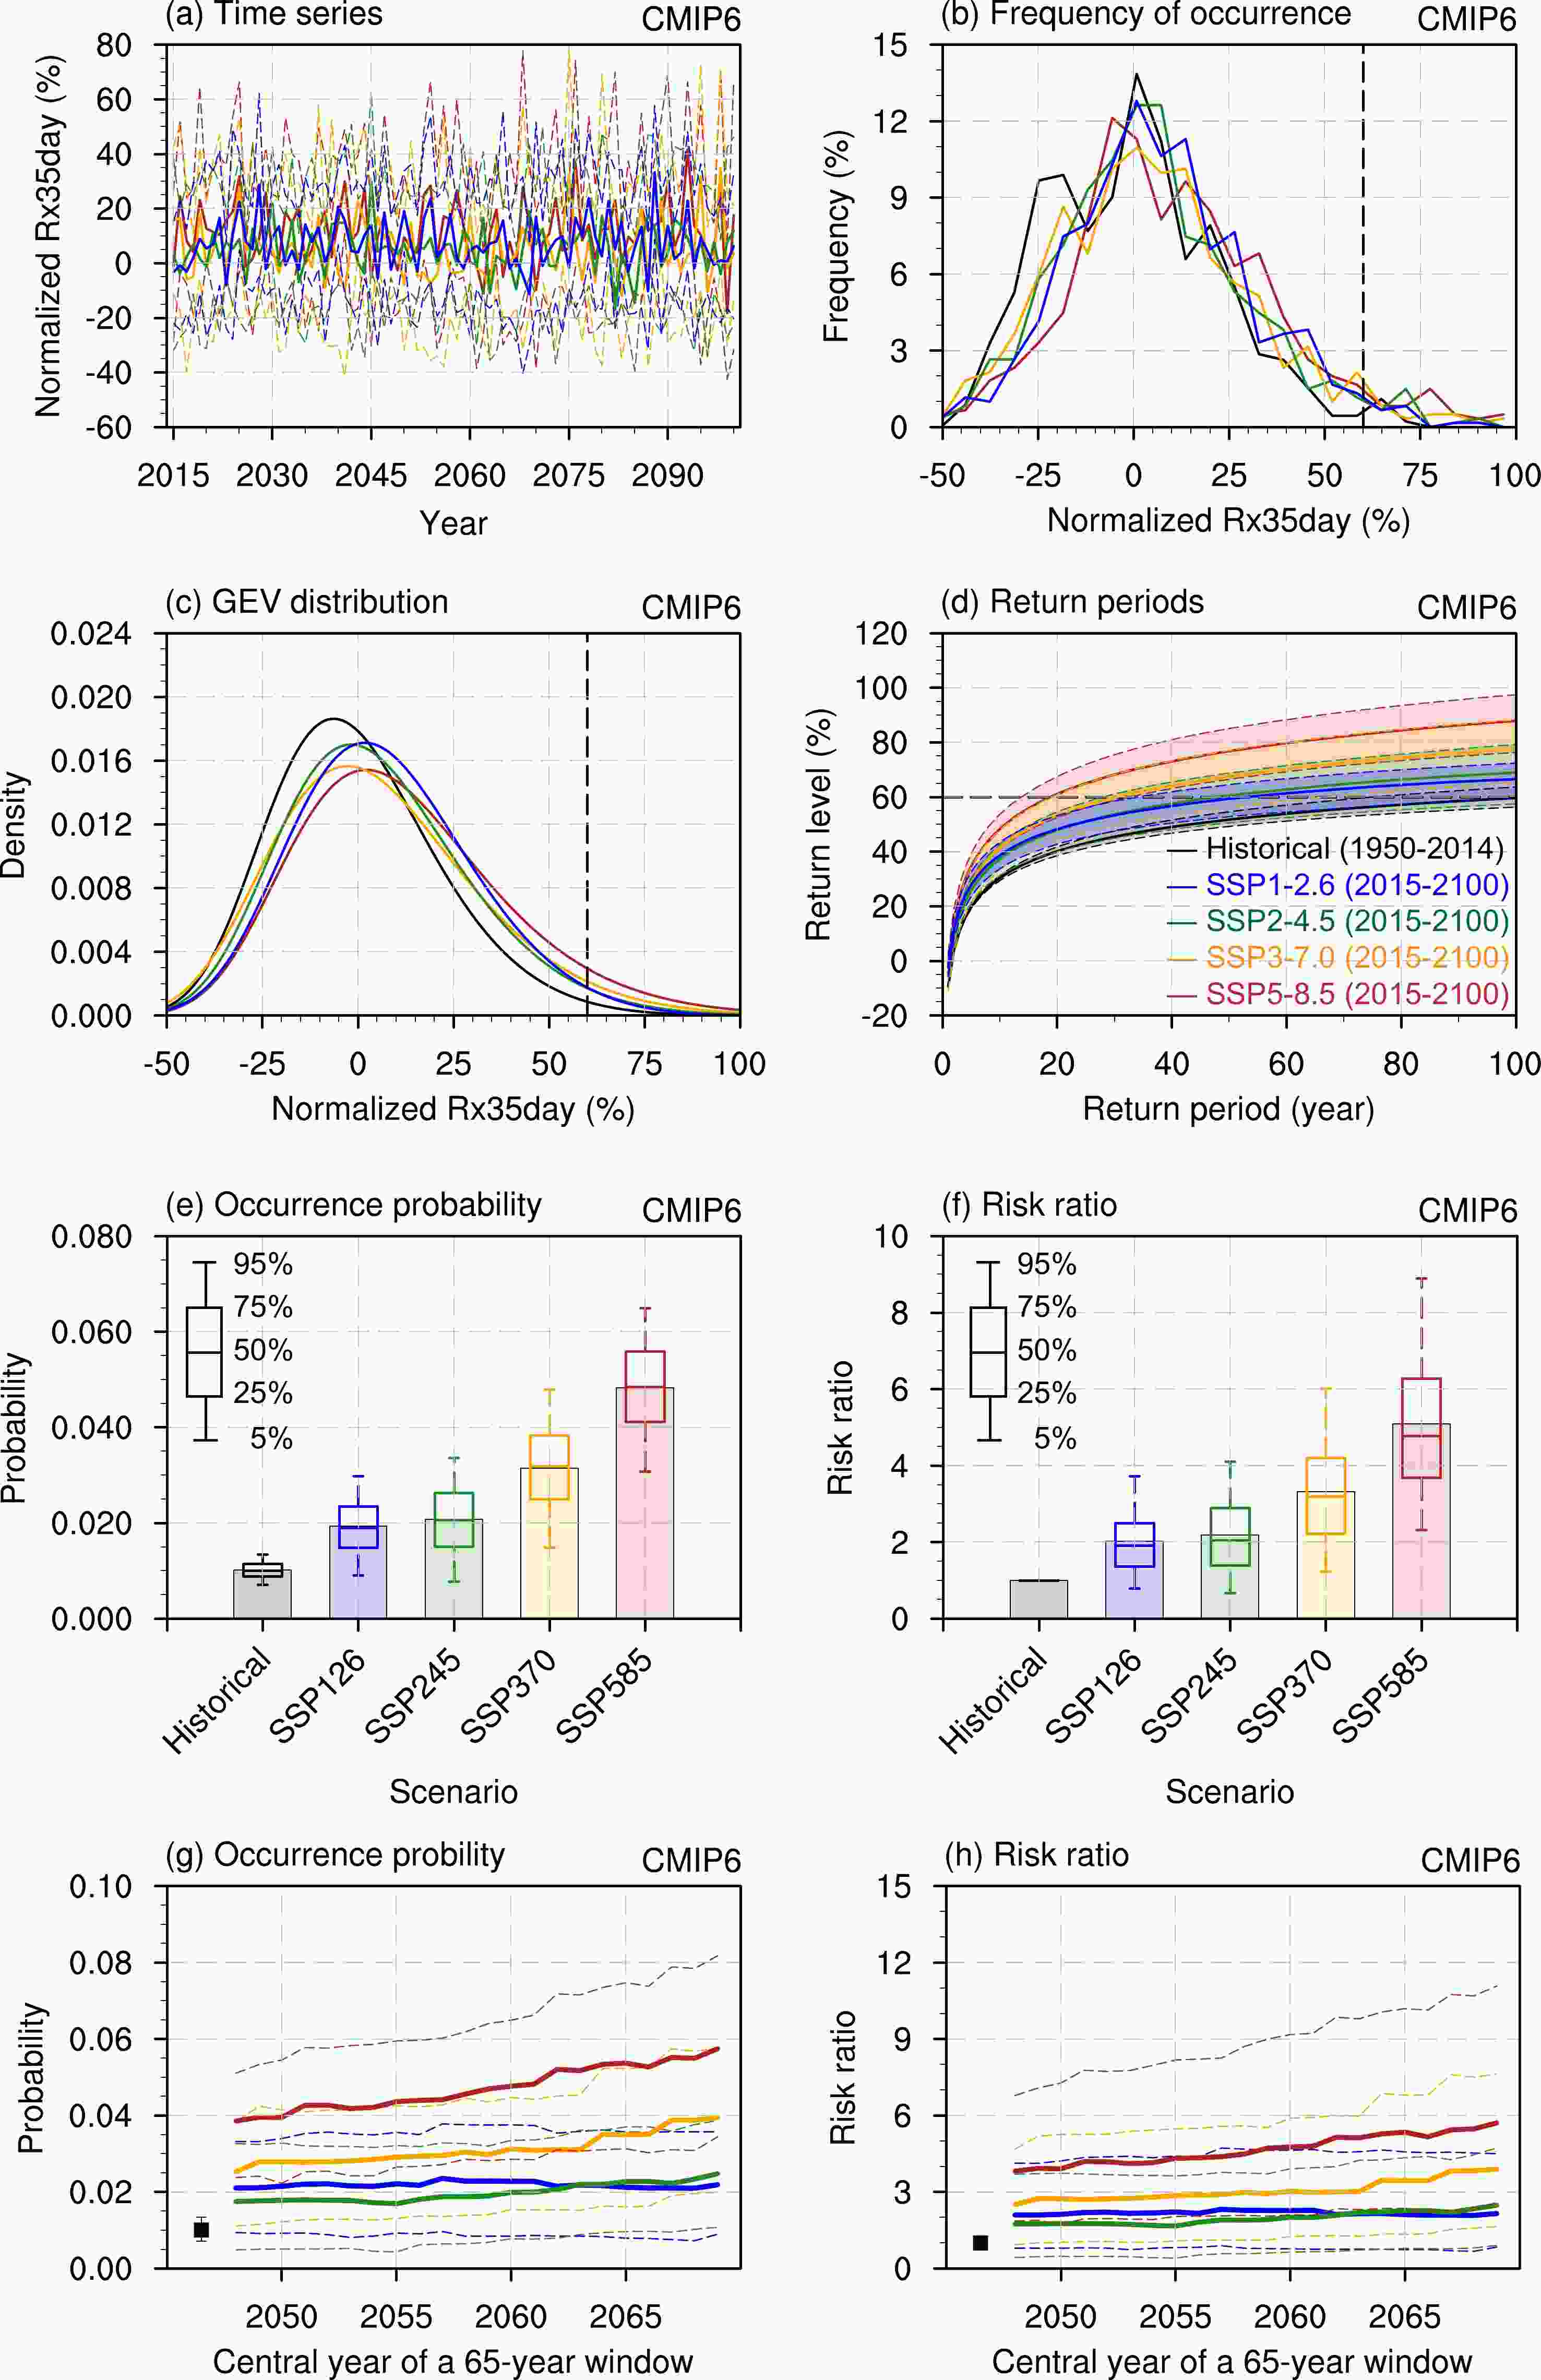
Figure 8. (a) Time series of the normalized Rx35day for the SSP1-2.6 (blue solid line), SSP2-4.5 (green solid line), SSP3-7.0 (orange solid line), and SSP5-8.5 (red solid line) emission scenarios over the period of 2015–2100 simulated by seven CMIP6 models. The colored dashed line indicates the inter-model spread of a standard deviation. (b) Frequency of occurrence, (c) GEV distributions, (d) return periods with 90% confidence interval, (e) occurrence probability and (f) risk ratio with inter-model uncertainties (box-and-whisker), the multiyear running (g) occurrence probability and (h) risk ratio with 90% confidence interval of the normalized Rx35day for the historical simulation (1950–2014) and four SSP emission scenarios (2015–2100). The black square markers indicate the occurrence probability and risk ratio of the historical simulation. The length of the running window is chosen to correspond to the length of the corresponding historical simulation period. All inter-model uncertainties are estimated by bootstrapping 10 models for 1000 times with replacement.
In summary, the multimodel ensembles of CMIP5 and CMIP6 models present a robust projection regarding the change of the 2020PHR-like event under global warming with mild uncertainty, that is, the occurrence probability and the risk of the 2020PHR-like event will significantly increase under various emission scenarios, and such increase becomes sharper in the high-GHG emission scenarios than in the low-GHG emission scenarios.
-
We further synthesize the projection results derived from the multimodel ensemble of CMIP5 and CMIP6 models and find that the projection results are generally consistent with each other (Table 3). On one hand, the occurrence probability of the 2020PHR-like event projected by the RCP4.5 scenario of CMIP5 is 1.9 times as much as the present-day level, which is very close to the 2.0 times projected by the SSP2-4.5 scenario of CMIP6. On the other hand, for the higher-CO2 emission scenario, the occurrence probability of the 2020PHR-like event projected by the RCP8.5 scenario of CMIP5 is 3.0 times as much as the present-day level, which is slightly higher than the 2.9 times projected by the SSP3-7.0 scenario of CMIP6. Recalling that the experimental protocol of CMIP5 and CMIP6 (refer to Figs. 3a–c in O’Neill et al., 2016) shows that the CO2 emissions and CO2 concentration for the RCP4.5 of CMIP5 is close to that for SSP2-4.5 of CMIP6, while the CO2 emissions and concentration for the RCP8.5 of CMIP5 is between SSP3-7.0 and SSP5-8.5, this indicates that the multimodel ensemble results from CMIP5 are generally consistent with those of the multimodel ensemble from CMIP6.
Ensemble name Experiment Occurrence probability Risk ratio OBS historical 1.3% (0–3.6%) − CanESM2 historical 1.0% (0.8%–1.2%) − RCP8.5 6.3% (5.8%–6.8%) 6.2 (5.1–7.7) CMIP5 historical 1.2% (0.9%–1.6%) − RCP4.5 2.3% (1.5%–3.0%) 1.9 (1.3–2.6) RCP8.5 3.3% (2.4%–4.4%) 3.0 (2.5–3.6) CMIP6 historical 1.1% (0.7%–1.3%) − SSP1-2.6 1.9% (0.9%–3.0%) 1.9 (0.8–3.7) SSP2-4.5 2.1% (0.8%–3.4%) 2.0 (0.7–4.1) SSP3-7.0 3.2% (1.5%–4.8%) 2.9 (1.2–6.0) SSP5-8.5 4.8% (3.1%–6.5%) 4.8 (2.3–8.9) Table 3. The occurrence probability calculated based on the observed data, modeled historical data, and future projections, and the risk ratio calculated between the future projections and modeled historical.
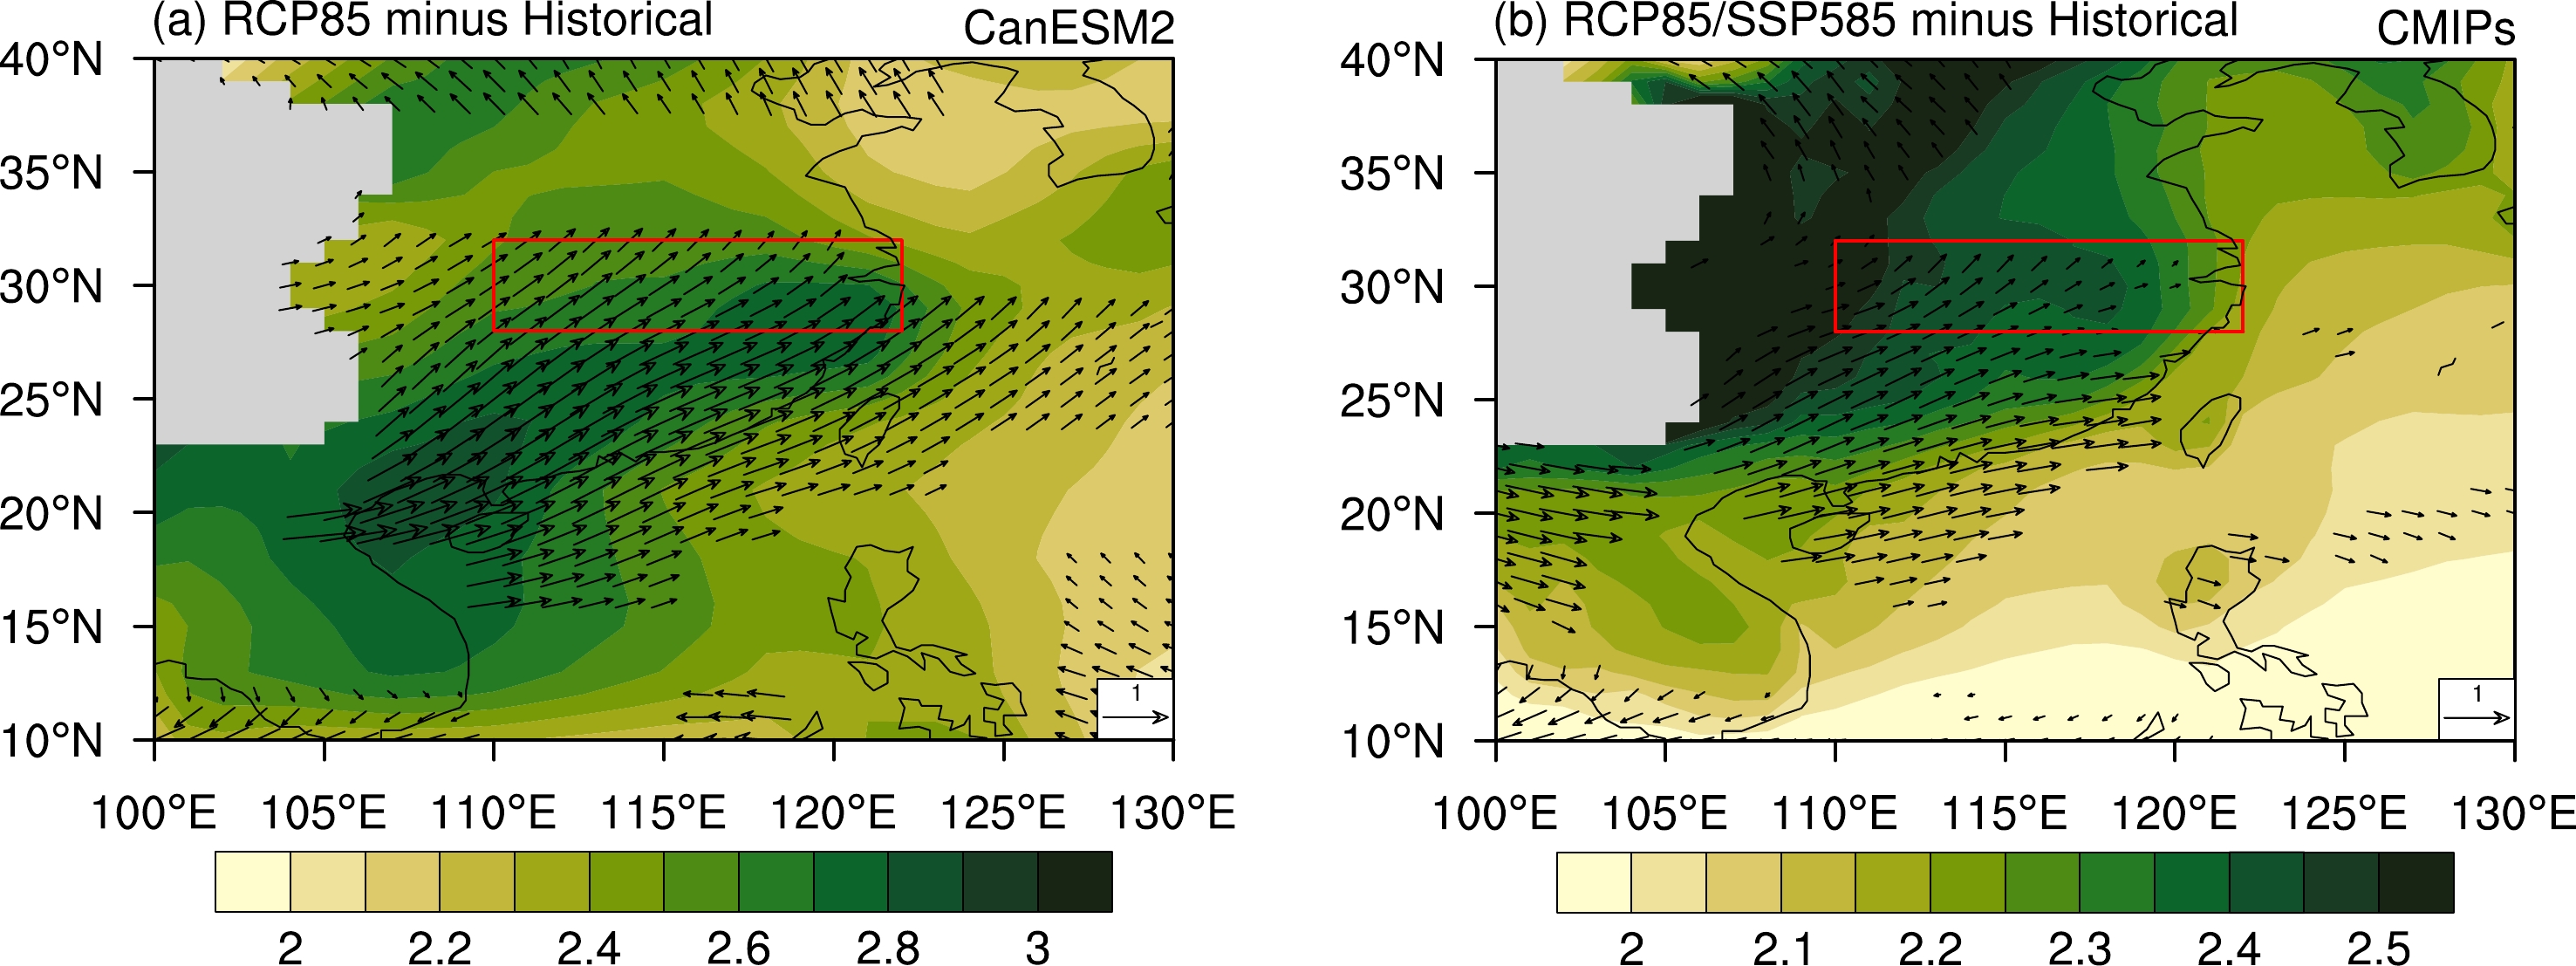
Although the main purpose of this study is investigating the changes of the 2020PHR-like event under global warming as well as the uncertainty, one may still wonder about the physical reasons responsible for the changes of extreme events. Figure 9 shows the differences in summer mean moisture and atmospheric circulation between the RCP8.5 simulation and historical simulation. Both the multimember ensemble mean of CanESM2 (Fig. 9a) and the multimodel ensemble of the selected CMIP5 and CMIP6 models (Fig. 9b) reveal that there is more moisture in the MLYRB under global warming, accompanied by strengthened southwesterly winds. The increase of the occurrence frequency of persistent heavy rainfall extremes in the MLYRB may benefit from the increase of mean low-level moisture.
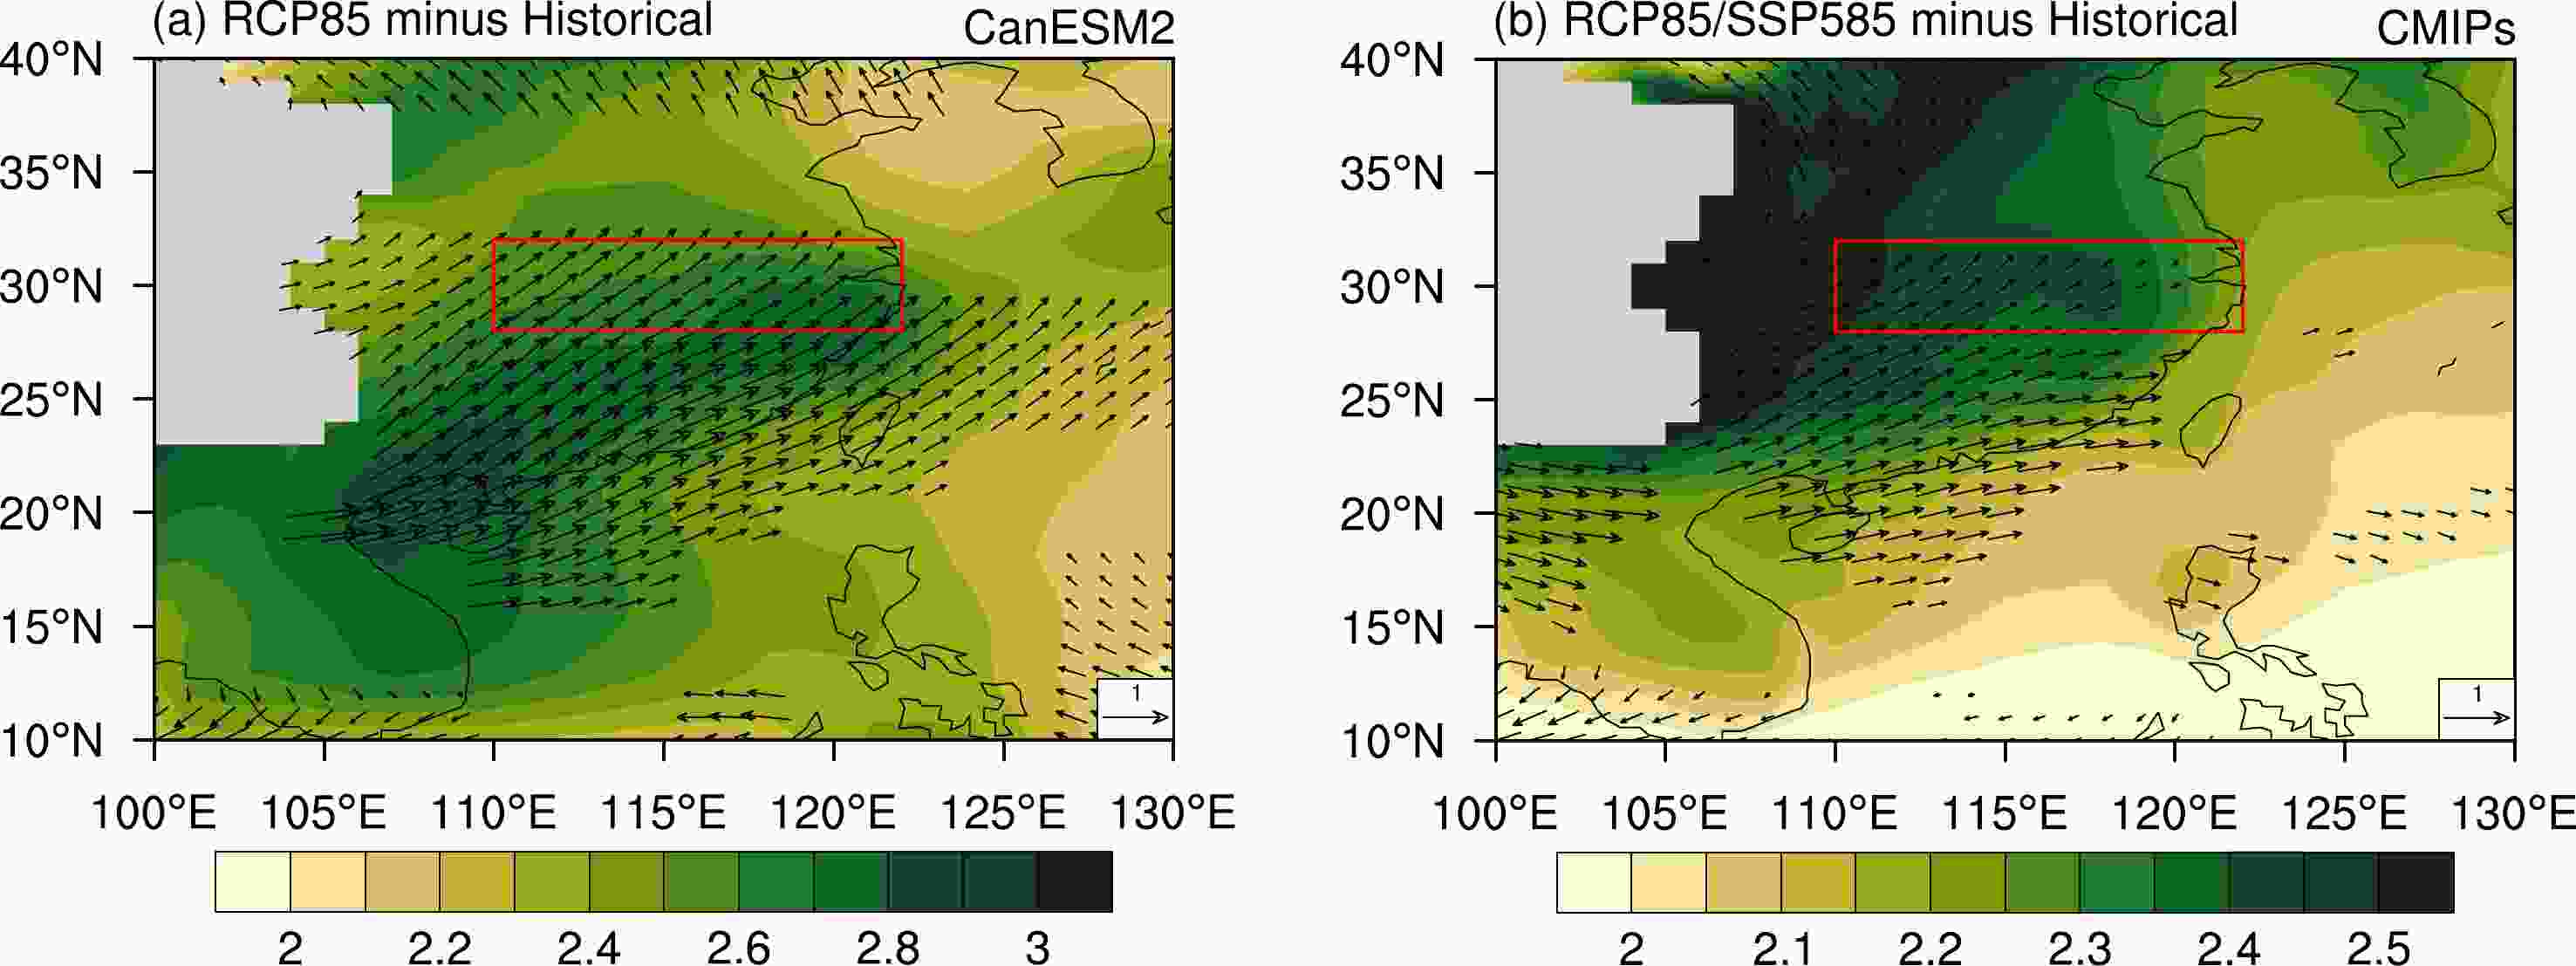
Figure 9. The differences in summer mean 850-hPa specific humidity (shading, units: 10–3) and atmospheric circulation (vector, units: m s–1) between the projected future and historical period for (a) large-ensemble runs of CanESM2 and (b) CMIP5 and CMIP6 models. Only anomalous specific humidity and winds that exhibit the same sign (positive or negative) in at least two-thirds of 50 members (or 14 models) are shown.
In fact, we are fully aware that the attributions of the changes in precipitation extremes are of great complexity. Here, this study just presents a preliminary analysis and provides some clues; an in-depth investigation regarding the specific physical reasons for the changes in extreme precipitation events in the MLYRB under global warming is still needed in the future.
A recent study (Zhou et al., 2021a) estimated the influences of different anthropogenic forcings on the extreme mei-yu rainfall in summer 2020 as well as its future risk change by the end of this century (2081–2100) based on the MME of 10 CMIP6 models. Through analyzing the model simulations under different external forcings that participate in the DAMIP of CMIP6, they pointed out that GHG emissions have increased the occurrence probability of extreme mei-yu rainfall in 2020 by 44%; however, this effect was offset by anthropogenic aerosols, which reduced the probability by 73%. They also pointed out that the occurrence probability of the 2020PHR-like event will dramatically increase under global warming, which is consistent with the current study in the qualitative sense.
However, there are some differences between their study and the current study. Firstly, this study uses a longer observational period of 1951–2020 to provide more reliable statistical results when calculating the extreme features of the observed 2020 PHR event, while they focus on the observational time span of 1961–2020. As the PHR event in summer 1954 is the wettest case on record during the period of 1951–2020, whether the PHR event in summer 1954 is included may significantly affect the statistical risk indices (e.g., return period) for the 2020PHR-like extreme event. Secondly, a larger number of model datasets including multimember and multimodel ensembles are used in this study. More model samples allow us to assess the individual models’ abilities in reproducing the 2020PHR-like extreme event in the corresponding historical simulation, prior to the detailed future projection. It is worth noting that only one-third of the CMIP5 and CMIP6 models have reasonable performance in simulating the probability distribution of Rx35day. Thus, it is suggested that the future projection results derived from the selected models may be more credible. Additionally, this study presents the time-varying results for the occurrence probability and risk ratios throughout the entire projected period, while Zhou et al. (2021a) mainly focus on the probability change of the precipitation extreme by the end of this century (2081–2100). On the whole, this study provides some additional information for the future projection of the 2020PHR-like extreme event.
Despite the aforementioned differences between this study and Zhou et al. (2021a), some conclusions of our research are consistent with those in Zhou et al. (2021a) from the qualitative perspective, e.g., the occurrence probability of the 2020PHR-like event will dramatically increase under higher-emission scenarios. Nevertheless, the detailed risk changes under different emission scenarios given by Zhou et al. (2021a) are prevalently larger than those in this study, even though the same projected period of 2081–2100 is used (not shown). Such a difference is likely attributed to the use of different model datasets and methodologies (e.g., an extreme rainfall index of Rx35day is used in this study, whereas Zhou et al. (2021a) focused on Rx28day). Despite the difference in the quantitative sense, both studies highlighted that the occurrence probability of the 2020PHR-like event will dramatically increase under higher-emission scenarios, highlighting the need for an efficient mitigation policy regarding GHG emission.
-
This study firstly presents an overview of the characteristics of the persistent heavy rainfall over the MLYRB in summer 2020, which exhibits an extraordinarily long persistence feature. Next, this study investigates the changing likelihood of the 2020PHR-like extreme event under different future projections with the aid of the large-member ensemble of CanESM2 and the multimodel ensemble of CMIP5 and CMIP6 archives. The main findings are summarized as follows:
(1) The extremely heavy rainfall event that took place in summer 2020 over the MLYRB is the second strongest on record since 1951. Moreover, it exhibits a significantly long persistence feature, with continuous rainfall for about six consecutive weeks. Through examining the Rx35day, which denotes the maximum accumulated precipitation over five weeks from June through August, it is found that the maximum accumulated precipitation over five weeks for the 2020 persistent heavy rainfall is 60% stronger than the climatology. The GEV distribution and return periods fitted to the observed Rx35day further indicate that the persistent heavy rainfall in summer 2020 is a 1-in-70-year event.
(2) The large-member ensemble of CanESM2 is firstly employed for projection analysis. A preliminary evaluation reveals that the large-member ensemble of CanESM2 is capable of reproducing a realistic Rx35day variability based on the K–S test. Through comparing the RCP8.5 experiment results with the historical simulation results derived from CanESM2, it is found that the occurrence probability of the 2020PHR-like extreme event increases from 1.0% (0.8%–1.2%) under present-day climate to 6.3% (5.8%–6.8%) under RCP8.5 forcing. The projection results building on large-member ensemble of CanESM2 show minor inter-member uncertainties, which are estimated by a bootstrap method. It is worth mentioning that such a strategy that builds on the large-member ensemble approach can effectively reduce the uncertainty due to the model internal variability, but this single model still shows a slight underestimation bias regarding the occurrence probability of the 2020PHR-like event in its present-day climate simulation. Therefore, conducting the projection analysis derived from multimodel ensembles is also beneficial for minimizing uncertainty, as the multimodel ensemble strategy may reduce the uncertainty due to model bias.
(3) We next turn to multimodel archives for further investigation. Prior to using the CMIP5 and CMIP6 model archives, we pick out the models that have reasonable performance in reproducing the 2020PHR-like event in their historical simulations. It is found that about one-third of the models derived from the CMIP5 and CMIP6 archives (7 out of 22 CMIP5 models and 7 out of 21 CMIP6 models) are capable of simulating the observed Rx35day variability. Based on these relatively reasonable models, the overall projection results show that the occurrence probability and the risk of the 2020PHR-like event will significantly increase under various warming scenarios. Specifically, the occurrence probability of the 2020PHR-like extreme event under RCP4.5 forcing and RCP8.5 forcing will reach 1.9 and 3.0 times as high as the level in the present-day simulation, respectively. Then, the four warming scenario projections from the latest released CMIP6 outputs, including the SSP1-2.6, SSP2-4.5, SSP3-7.0, and SSP5-8.5 scenarios, are further used for a double-check. It is found that the occurrence probability of the 2020PHR-like extreme event in response to the four SSP warming scenarios reaches 1.9, 2.0, 2.9, and 4.8 times as high as the present-day climate’s level, respectively. Moreover, the inter-model spread regarding the changes in the occurrence probability and risk ratios under global warming is minor, which lends confidence to the projection results.
Finally, the occurrence probabilities and risk ratios for the observation, the historical simulation, and the future projections are summarized in Table 3. Conclusively, the current state-of-the-art climate models provide a consistent and robust projection result that the MLYRB region will suffer more frequent persistent heavy rainfall extreme events like that of summer 2020 under global warming compared to the present-day level. Moreover, the increases in the occurrence probability and risk ratio of the 2020PHR-like event become sharper in the high-GHG emission scenarios than in the low-GHG emission scenarios. This indicates the importance of carbon emission reduction and carbon neutrality.
Acknowledgements. We would like to thank Dr. Wenxia ZHANG for helpful discussion and anonymous reviewers for insightful suggestions and comments. This work was jointly supported by the National Natural Science Foundation of China (Grant No. 42088101), the National Key Research and Development Program of China (2020YFA0608901 and 2019YFC1510004), the Natural Science Foundation of Jiangsu (BK20190781), the National Natural Science Foundation of China (Grant No. 42005020), and the General Program of Natural Science Foundation of Jiangsu Higher Education Institutions (19KJB170019).
Electronic supplementary material: Supplementary material is available in the online version of this article at
https://doi.org/10.1007/s00376-022-1351-8 .
| No. | Model Name | Institution | Atmospheric resolution |
| 1 | ACCESS1.0 | Commonwealth Scientific and Industrial Research Organization and Bureau of Meteorology (Australia) | 1.24° × 1.875° |
| 2 | ACCESS1.3 | Commonwealth Scientific and Industrial Research Organization and Bureau of Meteorology (Australia) | 1.24° × 1.875° |
| 3 | CMCC-CM | Centro Euro-Mediterraneo per I Cambiamenti Climatici (Italy) | 0.75° × 0.75° |
| 4 | CMCC-CMS | Centro Euro-Mediterraneo per I Cambiamenti Climatici (Italy) | 1.24° × 1.875° |
| 5 | CNRM-CM5 | Centre National de Recherches Météorologiques–Centre Européen de Recherche et de Formation Avancée en Calcul Scientifique (France) | 1.4° × 1.4° |
| 6 | CSIRO-Mk3.6.0 | Commonwealth Scientific and Industrial Research Organization in collaboration with Queensland Climate Change Centre of Excellence (Australia) | 1.24° × 1.875° |
| 7 | FGOALS-g2 | LASG, Institute of Atmospheric Physics, Chinese Academy of Sciences (China) | 3.0° × 2.8° |
| 8 | FGOALS-s2 | LASG, Institute of Atmospheric Physics, Chinese Academy of Sciences (China) | 1.67° × 2.8° |
| 9 | GFDL-CM3 | NOAA Geophysical Fluid Dynamics Laboratory (USA) | 2.0° × 2.5° |
| 10 | GFDL-ESM2M | NOAA Geophysical Fluid Dynamics Laboratory (USA) | 2.0° × 2.5° |
| 11 | HadGEM2-AO | Met Office Hadley Centre (UK) | 1.24° × 1.875° |
| 12 | HadGEM2-CC | Met Office Hadley Centre (UK) | 1.24° × 1.875° |
| 13 | HadGEM2-ES | Met Office Hadley Centre (UK) | 1.24° × 1.875° |
| 14 | INMCM4 | Institute for Numerical Mathematics (Russia) | 1.5° × 2.0° |
| 15 | IPSL-CM5A-LR | L’Institut Pierre-Simon Laplace (France) | 1.875° × 3.75° |
| 16 | IPSL-CM5A-MR | L’Institut Pierre-Simon Laplace (France) | 1.26° × 2.5° |
| 17 | IPSL-CM5B-LR | L’Institut Pierre-Simon Laplace (France) | 1.875° × 3.75° |
| 18 | MIROC-ESM | National Institute for Environmental Studies, The University of Tokyo (Japan) | 2.8125° × 2.8125° |
| 19 | MIROC5 | National Institute for Environmental Studies, The University of Tokyo (Japan) | 1.4° × 1.4° |
| 20 | MPI-ESM-LR | Max Planck Institute for Meteorology (Germany) | 1.875° × 1.875° |
| 21 | MPI-ESM-MR | Max Planck Institute for Meteorology (Germany) | 1.875° × 1.875° |
| 22 | NorESM1-M | Norwegian Climate Centre (Norway) | 1.8725° × 2.5° |


 AAS Website
 AAS WeChat