


 DownLoad:


-
Global climate models (GCMs) are considered to be capable of providing useful insights into global tropical cyclone (TC) characteristics across various time scales from sub-seasonal to future climate projections (Manganello et al., 2012; Camargo, 2013; Strachan et al., 2013; Aarons et al., 2021). However, low-resolution GCMs (~100 km) generally underestimate the frequency of intense TCs and have difficulty in realistically replicating the TC activity in terms of its climatology and variability, as well as the TC wind and precipitation structures (Moon et al., 2020; Li et al., 2021). With the continuous improvement of computational power and modeled physical processes, more advanced high-resolution GCMs have been developed and have since brought significant benefits to the simulation of global TC activity and structures. For instance, the CMIP6 High-Resolution Model Intercomparison Project (HighResMIP; Haarsma et al., 2016) contains a multimodel ensemble of atmosphere-only and coupled experiments at resolutions ranging from 25 to 250 km for 1950–2050, which makes it feasible to study the impact of resolution on global TC simulations and future projections. Some recent evaluation studies, based on different HighResMIP models, have suggested that as the horizontal resolution is increased towards 25 km, the simulations of key characteristics (genesis, track, intensity, structure) of TC in terms of their climatology or seasonal-to-interannual variability are generally improved compared to their low-resolution counterparts (Murakami et al., 2011; Roberts et al., 2020a, b; Li et al., 2021).
Still, systematic biases exist with large inter-model differences in TC simulations over key ocean basins for these high-resolution GCMs. For instance, Roberts et al. (2020b) compared a set of 36-year present-day ensemble simulations from six global atmospheric models (AGCM) with grid spacings of 25 km in HighResMIP-PRIMAVERA. Their result shows that for the simulation of TC frequency and track density, most models produce negative biases in the northern Atlantic and eastern Pacific, and a positive bias in the north Indian ocean. A common negative bias also exists in the Western North Pacific (WNP), which has been noted in previous studies, albeit with regional differences (Murakami et al., 2011; Li et al., 2021). For the simulation of TC intensity, most of these high-resolution models still struggle to produce intense TCs greater than category 2-3 in the Western Pacific and northern Atlantic oceans. For the TC structure simulation, the radii of maximum winds are still too large for strong TCs, and rising motion erroneously occurs at the storm centers based on three AGCMs at 0.25° horizontal resolution (Moon et al., 2020). The simulations of precipitation around TCs, in particular, show large uncertainty regarding the position of extreme precipitation (Li et al., 2021).
This study focuses on the Western North Pacific, because this region has the most active TCs across the world and is increasingly affected by more disastrous TCs in recent years, such as Rammasun (2014), Meranti (2016), and Lekima (2019). More importantly, the TC activity over this region is affected by a variety of complex climate factors, showing prominent multi-scale variabilities, which remains a challenge for current high-resolution GCMs to accurately simulate its TC climatology features and variability. However, the latest evaluation studies using two high-resolution AGCMs, FGOALS-f3-H (25 km) and MRI-AGCM3-2-S (20 km), pointed out that these models have been significantly improved over their coarse-resolution versions, especially in simulating the climatological mean, seasonal, and interannual variations of TC activity over the WNP (Murakami et al., 2011; Li et al., 2021). But these two models have not been compared in previous studies despite being included in HighResMIP. Their evaluations are based on different time periods and TC tracking algorithms that focus on different TC characteristics. Therefore, this study will comprehensively compare the performance of these two models in simulating the WNP TC climatological characteristics and the associated interannual variations. Our purpose is to investigate the biases in the simulation of TCs over the WNP for these high-resolution AGCMs, and to explore the key influencing factors and the underlying physical mechanisms, to improve the models further and reduce the uncertainty of TC projections.
Based on the above evaluation, this study focuses on analyzing the simulation bias of TC genesis frequency (TCGF) because the change in TCGF largely affects the change in TC frequency of occurrence (TCF) and track density, which is essential for future projections of TC activity and impact assessment (Murakami et al., 2011; Shaevitz et al., 2014). Previous modeling studies mostly applied the genesis potential index (GPI) to examine the importance of large-scale environmental factors (e.g., low-level vorticity, mid-tropospheric relative humidity, maximum potential intensity, vertical wind shear, and mid-level vertical velocity) for TC genesis. However, these studies only pointed out the bias of each factor and their relative contributions to the bias of TC genesis, but the possible links between these factors and the underlying predominant physical process responsible for the TCGF biases are not fully explored. Murakami et al. (2011) used GPI analysis and further explored the physical mechanisms responsible for the change of TCGF over different regions of WNP in the future projections (2075–2099) compared to the present day (1979–2003) simulation by the MRI-AGCM (20 km) model. For instance, their study showed that there will be a future reduction of TCGF in the western WNP, mainly due to the reduction of large-scale ascending motion and mid-tropospheric relative humidity, which are attributed to the weakening of tropical overturning circulation resulting from the reduction in diabatic heating in the southeastern Philippine Sea. However, their study did not examine biases related to key factors from the GPI analysis and their associated physical mechanisms that affect present-day TCGF simulations.
Understanding the model bias of TCGF over the WNP and the controlling processes is particularly difficult because TC genesis and its associated variability in this region are modulated by various large-scale oceanic and atmospheric factors and their complex interactions (Zhan et al., 2022). Besides, since large-scale environmental conditions act as a background for TC genesis (Tippett et al., 2011; Pun et al., 2013), more attention has been paid to intraseasonal-interannual climatic factors, including tropical variabilities associated with moist processes (e.g., Madden-Julian Oscillation and convectively coupled equatorial waves), the El Niño-Southern Oscillation (ENSO), sea surface temperature anomalies in the East Indian and Atlantic Oceans, as well as the Pacific meridional mode (Wang and Chan, 2002; Camargo and Sobel, 2005; Zhang et al., 2016; Magee et al., 2021). Recent evaluations have shown that high-resolution FGOALS-f3-H and MRI-AGCM models both have certain abilities of capturing these signals, and simulate the influence of the most pronounced interannual signal of ENSO on the TCGF over the WNP especially well (Murakami et al., 2011; Li et al., 2019, 2021). However, the latest study of Zhan et al. (2022) proposed a critical upper-level atmospheric forcing factor, the Western Pacific Tropical Easterly Jet (WP_TEJ), which highly influences the WNP TCGF by regulating the upper-troposphere divergence, upward motion and low-level convergence to the north of jet axis. Meanwhile, they also mentioned that the interannual variation of WP_TEJ intensity might be caused by the changes in the Walker and anomalous local Hadley circulations, which are induced by diabatic heating related to the Western Pacific summer rainfall and El Niño Modoki, respectively. As such, the WP_TEJ strongly links the large-scale environmental conditions for TC genesis identified in the GPI, and its intensity is also regulated by the variations of oceanic factors and atmospheric circulations on the interannual timescale. Therefore, the WP_TEJ could be a crucial factor for analyzing the physical causes for the simulation biases of the TCGF climatological distribution and interannual variations over the WNP.
Because TCs in the WNP are generated mainly during the peak season of July–October (JASO), the objectives of this study are to compare two high-resolution AGCMs, FGOALS-f3-H (25 km) and MRI-AGCM3-2-S (20 km) to (1) fully evaluate their model performances in simulating the TC climatological characteristics (genesis, frequency, track, intensity, thermodynamic structures, and precipitation) and seasonal-interannual variations of TCGF over the WNP during JASO; (2) specifically explore the physical causes for the JASO TCGF simulation biases over the WNP, with a focus on examining the simulation of WP_TEJ and its role in modulating the key large-scale environmental conditions based on GPI analysis.
The remainder of this paper is organized as follows. Section 2 briefly describes the configurations and atmosphere-only simulations of the two high-resolution AGCMs, FGOALS-f3-H and MRI-AGCM3-2-S, the observational datasets, and TC tracking algorithms, as well as the TC intensity classification method. Section 3 compares the simulations of these two AGCMs regarding the TC climatological characteristics and seasonal-interannual variations of TCGF over the WNP. Section 4 focuses on the role of WP_TEJ and its modulation of large-scale environmental factors in contributing to the biases of WNP TCGF climatological distribution and interannual variations. Finally, the main conclusion and related discussions are summarized in section 5.
-
The two high-resolution AGCMs, FGOALS-f3-H and MRI-AGCM3-2-S, and the model simulations used in this study, are all derived from the HighResMIP, which is a part of the Coupled Model Intercomparison Project (CMIP6). Currently, CMIP6-HighResMIP has incorporated GCMs with grid spacings ranging from the CMIP6 resolution (250-km atmosphere and 100-km ocean) to higher resolutions (25-km atmosphere and 10-km ocean). A large ensemble of atmosphere-only and coupled model experiments are conducted for these GCMs using consistent forcings covering the present-day (1950–2014) and future period (2015–50) under the high-emission SSP585 scenario. More specific details about CMIP6-HighResMIP can be found in Haarsma et al. (2016). This study focuses on the simulations of highresSST-present experiment of their first ensemble member (r1i1p1f1) under the same external conditions with prescribed SST forcing. This methodology helps to clarify the responses to identical forcing changes across models with higher resolutions.
FGOALS-f3-H is the high-resolution version of the Chinese Academy of Sciences Flexible Global Ocean-Atmosphere-Land System, Finite-Volume Version 3 model. It includes two sets of configurations with horizontal grid spacings of 100 km (C96) and 25 km (C384) for HighResMIP Tier 1, and this study uses the higher resolution simulation of 25 km. The atmospheric component of FGOALS-f3-H is FAMIL2.2 has been largely developed in terms of its dynamic core and physics parameterizations, especially the resolving convective precipitation (RCP) scheme (Bao and Li, 2020), which greatly benefits the simulation of moist processes and associated tropical variabilities (He et al., 2019, 2020; Bao et al., 2020). Additional details about the oceanic, land surface, and sea-ice components can be found in Li et al. (2021).
MRI-AGCM3-2-S is a spectral model with a very high resolution of T959L60, equivalent to a 20-km grid spacing with 60 vertical layers. It is version 3.2 developed by the Japan Meteorological Agency (JMA) and MRI from the previous version 3.1. An important update was to replace the prognostic Arakawa-Schubert convection scheme in Version 3.1 with a modified Tiedtke scheme by incorporating two convective updrafts with different entrainment and detrainment rates. This modification has been recognized in MRI-AGCM V3.2 to effectively improve the simulation of tropical precipitation and TC activities (Mizuta et al., 2012; Murakami et al., 2012). More details about its physics parameterization schemes can be found in Mizuta et al. (2012) and Yoshimura et al. (2015).
-
The TC observations are derived from the International Best Track Archive for Climate Stewardship (IBTrACS v04r00), which is a global tropical cyclone multisource dataset (Knapp et al., 2010). Among them, the Regional Specialized Meteorological Centre Tokyo (RSMC) and Chinese Meteorological Administration-Shanghai Typhoon Institute (CMA_BST) in IBTrACS from 1985–2014 are selected to evaluate WNP TC activities (Ying et al., 2014; Lu et al., 2021). Here, the time period before 1985 is excluded due to the large data uncertainty for the lack of satellite observations. As suggested by Li et al. (2021), the 1-min-average maximum wind is converted to a 10-min-average maximum wind average by a reduction factor of 0.88. In addition, the Global Precipitation Measurement (GPM) IMERG-V6 product (resolution 0.1°) for the time period 2000–14 is used as the TC precipitation observations (Hou et al., 2014; Huffman et al., 2019). The fifth generation European Centre for Medium-Range Weather Forecasts atmospheric reanalysis dataset (ERA5, resolution 0.25°) is used to evaluate the simulation of large-scale atmospheric circulations (Hersbach et al., 2020).
-
TempestExtremes v2.1, a framework for scale-insensitive pointwise feature tracking introduced by Ullrich and Zarzycki (2017), is used for both AGCMs to detect the simulated TCs based on 6-h model output. This TC tracking algorithm essentially searches for a local minimum of sea-level pressure that is collocated with a local maximum of low-level cyclonic vorticity at 850 hPa and a warm core aloft at middle-to-upper pressure levels) and defines a minimum threshold for the maximum surface wind speed. Given that the 6-h surface wind for these two models is not released on the HighResMIP website, we use the 850-hPa wind speed as a detection criterion following the study of Murakami et al. (2012). In addition, the lifetime of the TC must be greater than 72 hours to filter out short-lived TCs. These key parameters in TempestExtremes v2.1 are determined from a sensitivity analysis (the Morris Method) based on four reanalysis data for TC tracking (Zarzycki and Ullrich, 2017). It is more reliable and flexible than traditional TC tracking algorithms (Ullrich et al., 2021) and has been widely used for TC detection in the HighResMIP models (Roberts et al., 2020a, b). Table 1 lists the TC identification criterion in TempestExtremes for FGOALS-f3-H and MRI-AGCM3-2-S, referring to Li et al. (2019) and Murakami et al. (2012), respectively.
FGOALS-f3-H MRI-AGCM3-2-S 850-hPa wind speed (m s–1) ≥ 15.4 ≥ 10 Absolute vorticity at 850 hPa (s–1) ≥ 3.5×10⁻⁵ − Relative vorticity at 850 hPa (s–1) − ≥ 2.0×10⁻⁵ Average temperature deviations between 300 and 500 hPa (K) ≥ 1 − Sum of the temperature deviations at 300, 500, and 700 hPa (K) − ≥ 1 Lifetime ≥ 72 h ≥ 72 h Table 1. Parameters of tropical cyclone tracking detection algorithms for FGOALS-f3-H and MRI-AGCM3-2-S
Given that GCMs still have difficulty in reproducing intense wind speeds for strong TCs, using the minimum sea level pressure (MSLP) to classify the TC intensity is considered to be more reliable than using the surface maximum wind speed for different climate models (Knaff and Zehr, 2007; Roberts et al., 2015, 2020b). Following Roberts et al. (2015), the intensity of TCs over the WNP can be classified into five categories, based on the relationship between MSLP and the maximum surface wind speed range in terms of the modified SS scale (Saffir-Simpson hurricane wind scale) as shown in Table 2.
TC Category Wind speed range (m s–1) Minimum sea level pressure range (hPa) TS (Tropical storm) 17.2–24.4 ≥ 985 STS (Severe tropical storm) 24.5–32.6 970–984 TY (Typhoon) 32.7–41.4 955–969 STY (Severe typhoon) 41.5–50.9 935–954 SSTY (Super typhoon) ≥ 51 <935 Table 2. The intensity classification of tropical cyclone over the Western North Pacific
-
The genesis potential index (GPI) applied in this study for analyzing the TCGF bias is based on Emanuel et al. (2004) and modified by Murakami and Wang (2010). Unlike the GPI definition used by Li et al. (2021), this GPI explicitly includes the vertical velocity and especially improves the GPI performance over the WNP. The modified GPI is defined as:
where
$ \eta $ is the 850-hPa absolute vorticity (s–1),$ \mathrm{R}\mathrm{H} $ is the 600-hPa relative humidity (%),$ {V}_{\mathrm{s}} $ is the magnitude of the wind shear between 850 and 200 hPa (m s–1),$ \omega $ is the vertical pressure velocity at 500 hPa (Pa s–1), and$ {V}_{\mathrm{m}\mathrm{a}\mathrm{x}} $ is the maximum potential intensity (MPI, m s-–1), which is defined by its original version in Emanuel (1995) as:where
$ {C}_{k} $ is the exchange coefficient of enthalpy,$ {C}_{\mathrm{d}} $ is the drag coefficient,$ {T}_{\mathrm{s}} $ is the SST, and$ {T}_{0} $ is the mean outflow temperature at 50 hPa (Gilford, 2021).$ {\mathrm{C}\mathrm{A}\mathrm{P}\mathrm{E}}_{*} $ is the convective available potential energy (CAPE) of the air, lifted from saturation at sea level, and$ {\mathrm{C}\mathrm{A}\mathrm{P}\mathrm{E}}_{\mathrm{b}} $ is the CAPE of the boundary layer air. The variables for$ {V}_{\mathrm{m}\mathrm{a}\mathrm{x}} $ are consistent with those of Li et al. (2021). -
Figure 1 compares the observed and simulated distributions of all TC tracks for five intensity categories, the TC frequency of occurrence (TCF), and the genesis frequency (TCGF) from the two high-resolution AGCMs (FGOALS-f3-H and MRI-AGCM3-2-S) during the peak season of JASO from 1985 to 2014. Overall, these two models capture the key TC genesis locations over the South China Sea and the southern WNP, with the TCF maximum simulated to the northeast of the Philippines (~20°N, ~125°E); furthermore, they are capable of producing severe typhoons (STY). However, different biases in the simulations of TCGF and TCF still exist, including the related TC tracks. For the TCGF simulation, both models underestimate the TCGF over the South China Sea and the southwestern WNP, but FGOALS-f3-H largely overestimates the TCGF over the WNP east of 150°E. For the simulation of TC tracks and TCF, FGOALS-f3-H largely overestimates the track densities of typhoons and severe typhoons (TY and STY) with northward-biased paths over the entire eastern WNP, leading to widespread overestimates in TCF east of the Philippines and north of the WNP. However, MRI-AGCM3-2-S severely underestimates the track density of weaker TCs (TS and STS) over the East and South China Seas and overestimates the track density of stronger TCs (STY and SSTY) with their northward-recurving paths occurring farther to the east, causing it to apparently underestimate (slightly overestimate) the TCF in the western (northeastern) WNP.
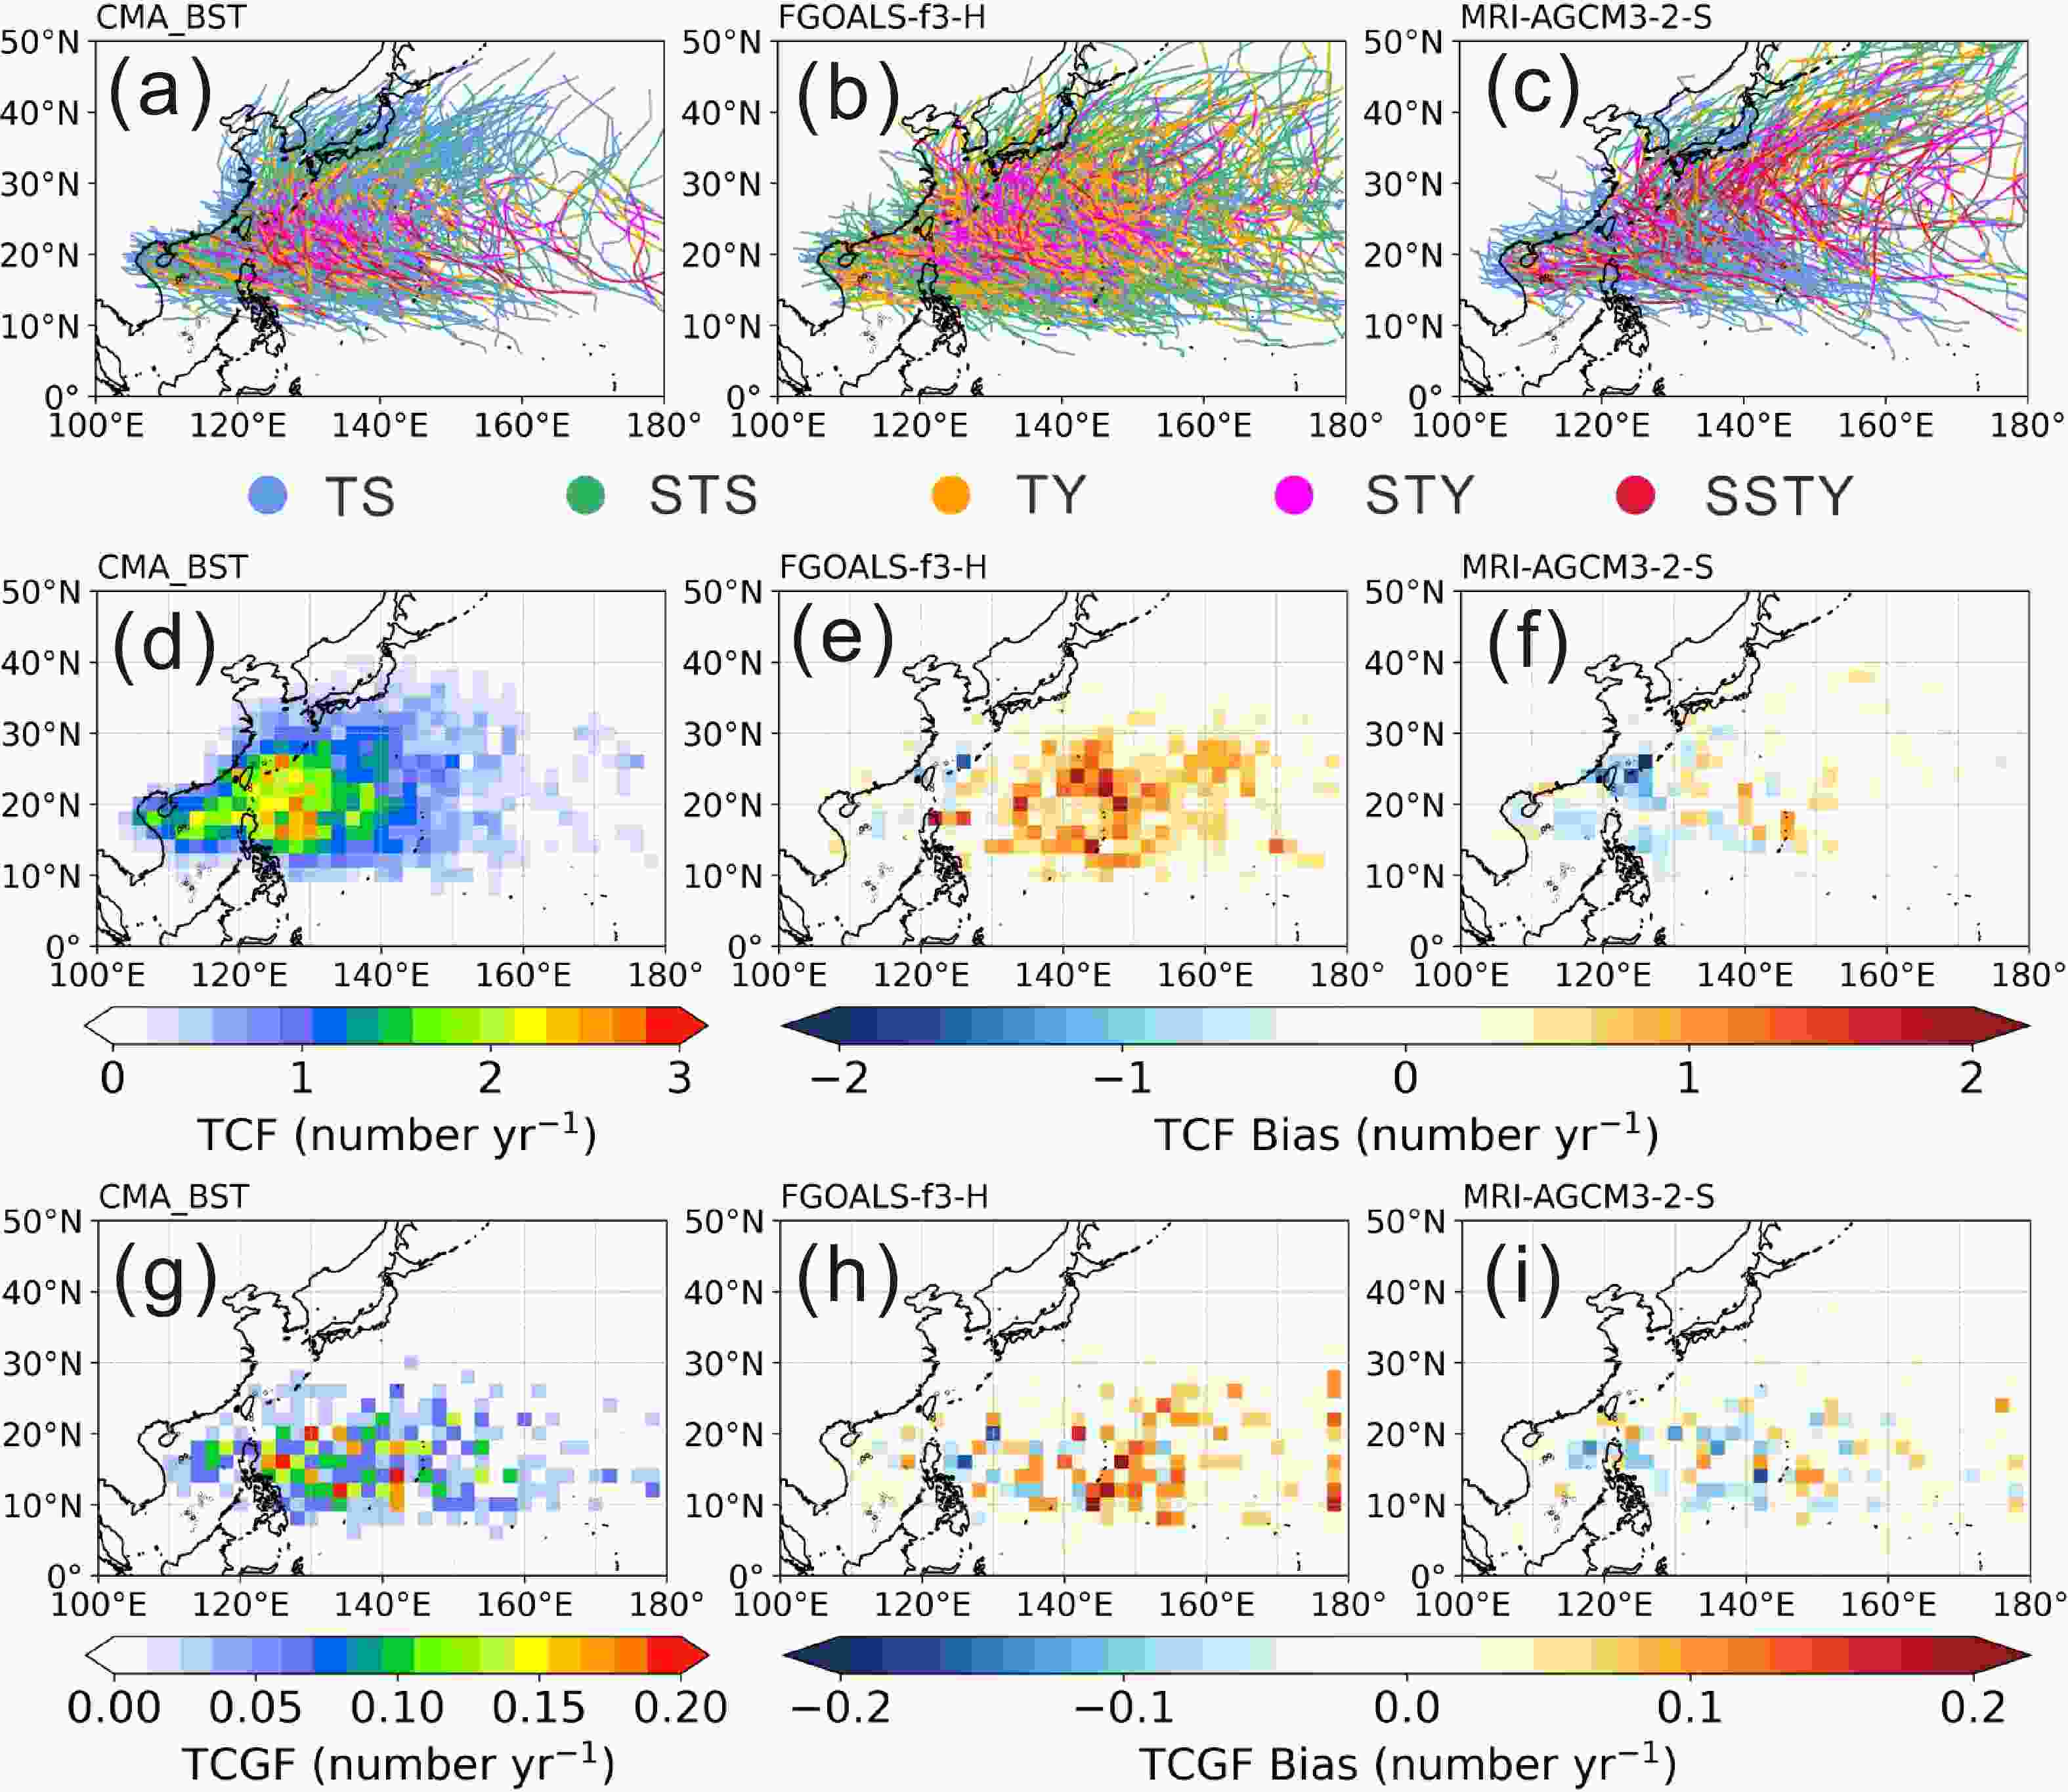
Figure 1. The distributions of TC tracks for five different intensity categories (a–c), TC frequency of occurrence (TCF, d–f), and the TC genesis frequency (TCGF) (g–i) over WNP (analyzed in 2° × 2° grid boxes) during JASO (July–October) from 1985 to 2014 in the observations (CMA_BST) and in the simulations of two high-resolution AGCMs (FGOALS-f3-H and MRI-AGCM3-2-S), where the simulated TCF and TCGF are shown by model biases.
-
Figures 2a and b first compare the original and normalized seasonal cycles of TCGF simulated by two AGCMs with the observation of CMA_BST and RSMC. The comparison suggests that the two sets of observations are highly consistent, except for a small difference in the TC numbers from January to May. Hereafter, the CMA_BST data is chosen as the observation in this study. Both AGCMs generally capture the seasonal cycle of TCGF, but show different biases in its peak season and numbers. Specifically, FGOALS-f3-H more realistically captures the peak season from July to October but systematically overestimates the TC numbers. However, MRI-AGCM3-2-S tends to produce a one-month delayed peak with underestimated TC numbers.
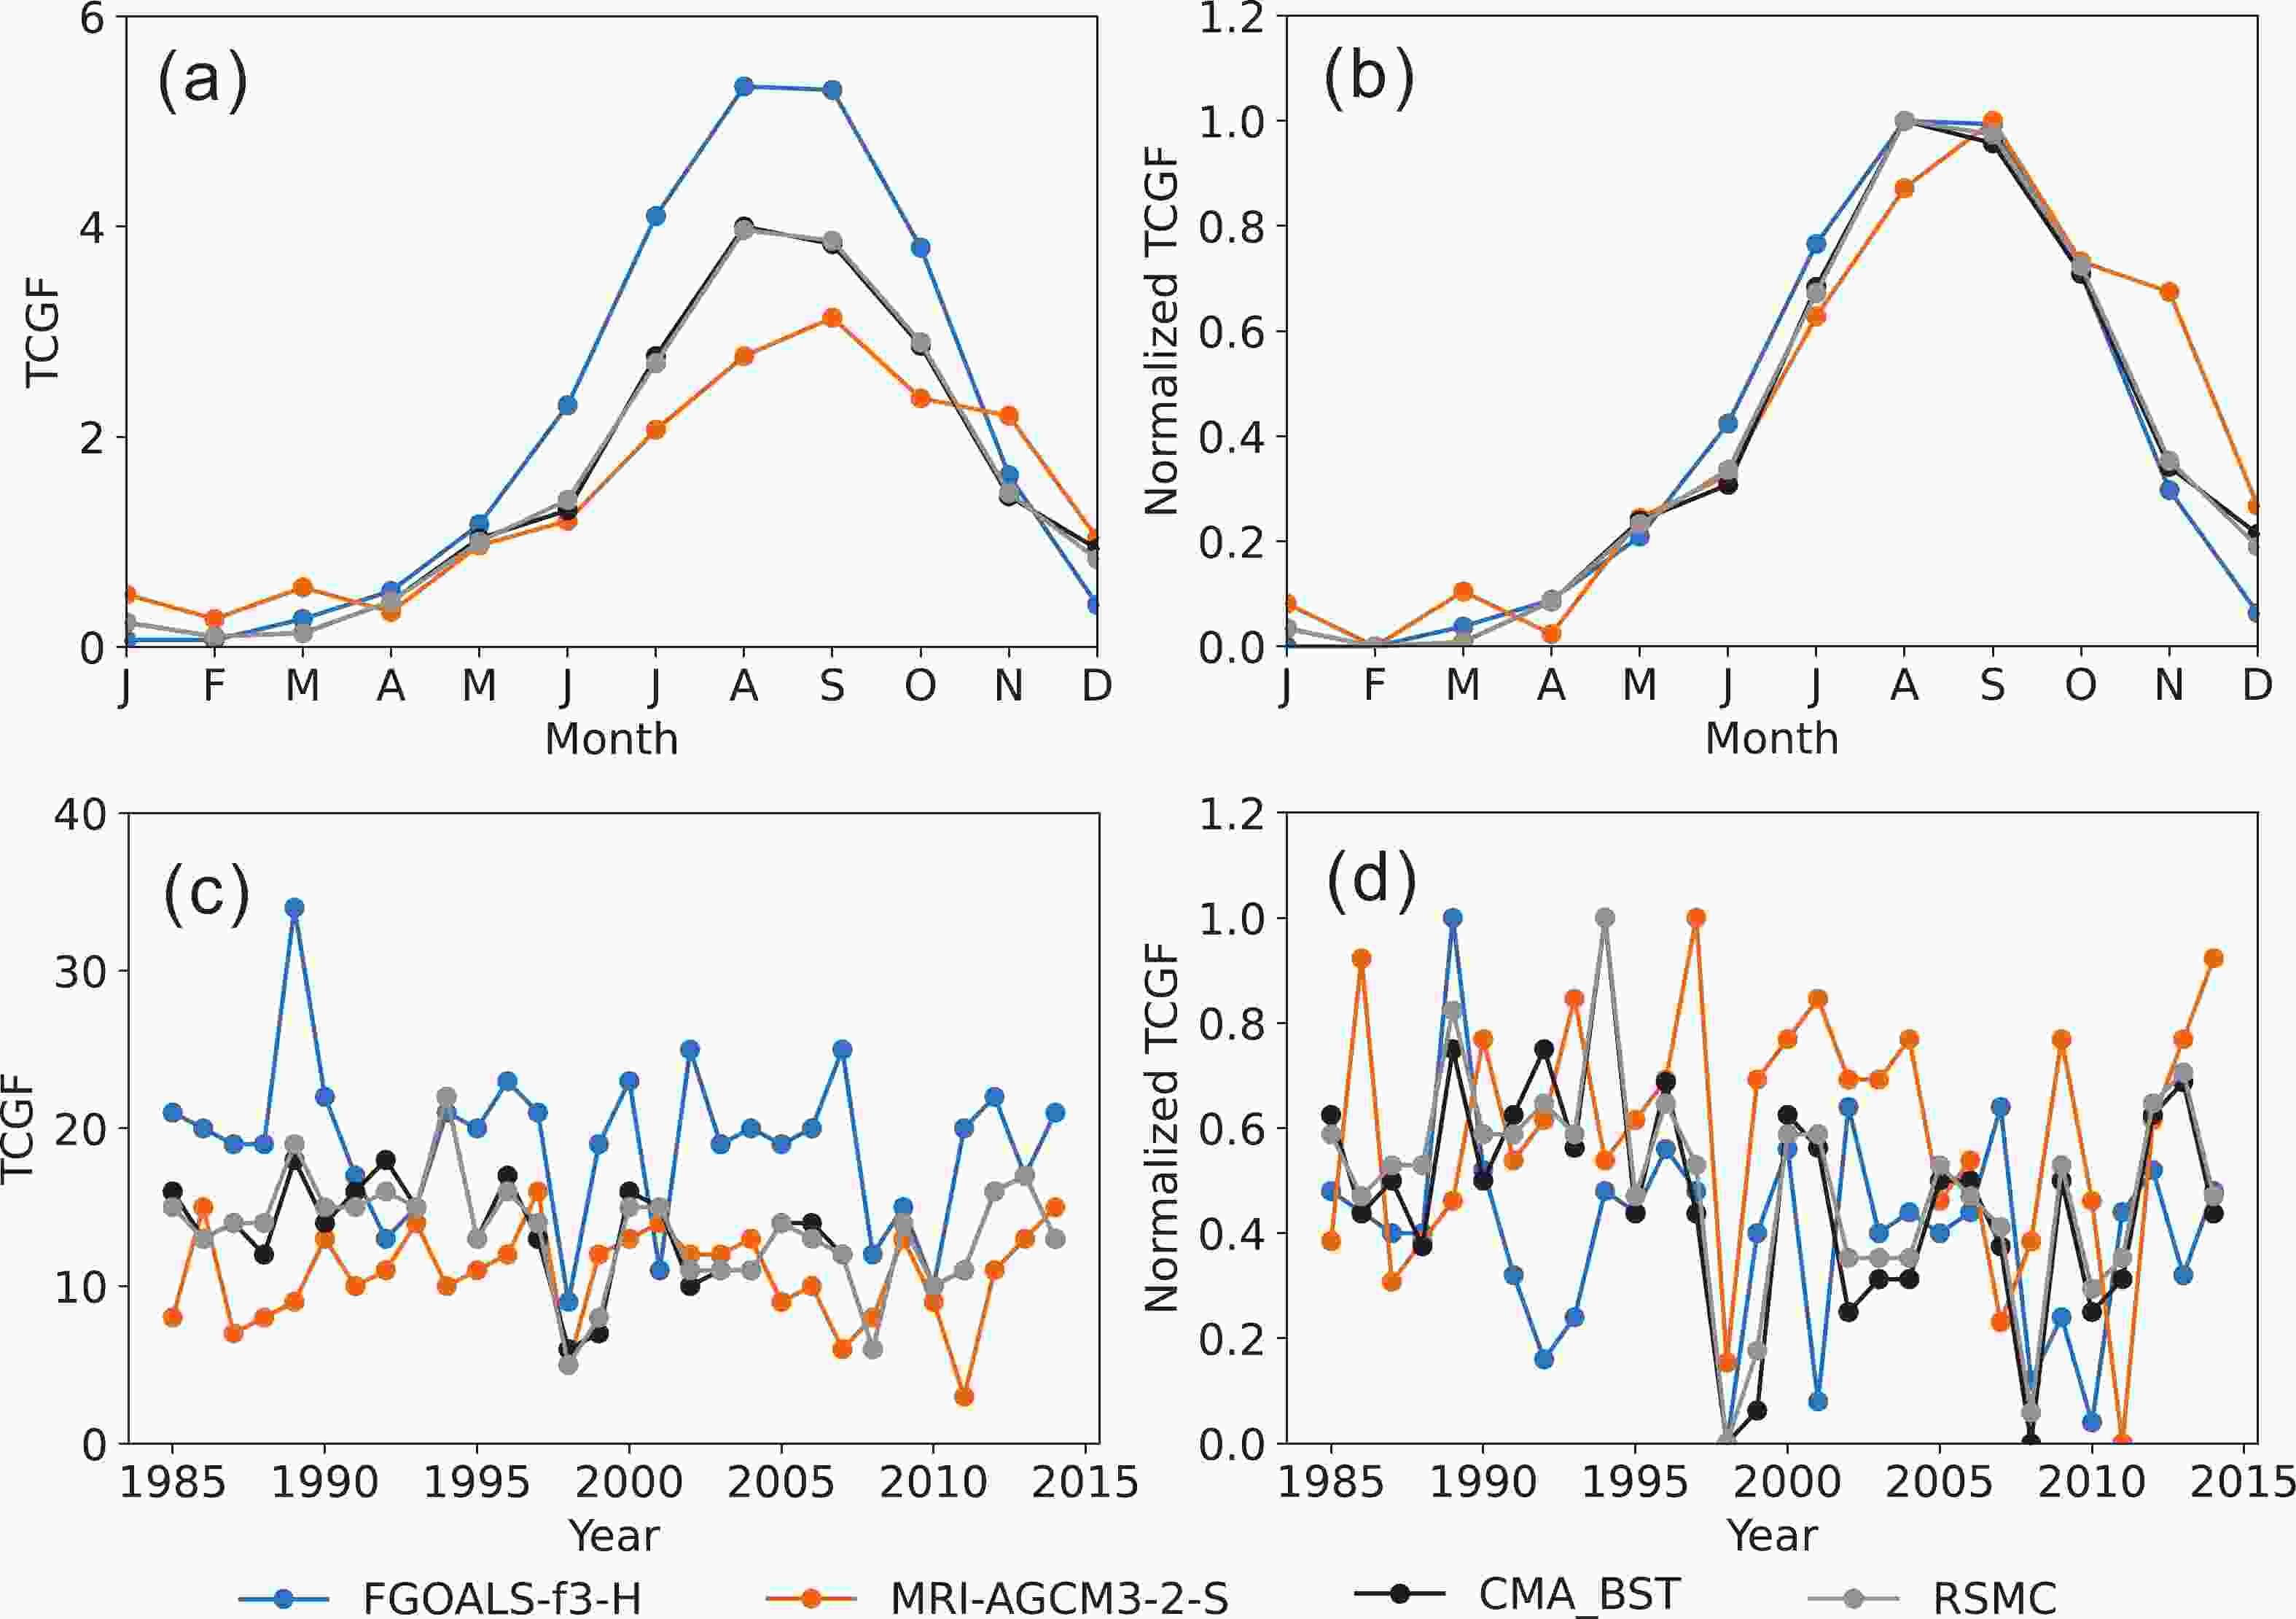
Figure 2. Seasonal cycles and interannual variations of TC genesis frequency in the western North Pacific during JASO using original (a, c) and normalized (b, d) values, based on the observations (CMA-BST and RSMC) and the simulations from two high-resolution AGCMs (FGOALS-f3-H and MRI-AGCM3-2-S) from 1985 to 2014.
Figures 2c and d further compare the original and normalized interannual variation of TCGF during JASO from 1985–2014 as observed and simulated by two AGCMs. The correlation coefficients (CC) and root mean square errors (RMSE) for both model simulations against the CMA_BST observation are also calculated. Two AGCMs basically capture the interannual anomalies of TCGF with close values of CC (0.44 for FGOALS-f3-H and 0.51 for MRI_AGCM3-2-S), although the RMSE of FGOALS-f3-H (7.3) is larger than that of MRI-AGCM3-2-S (4.7). However, after normalization, FGOALS-f3-H better simulates the interannual variability of TCGF with a significantly reduced RMSE (0.25) compared to that of MRI-AGCM3-2-S (0.31), albeit the amplitude of interannual variation of TCGF in FGOALS-f3-H is still greater than the observation, which will be further explored in section 4.3.
-
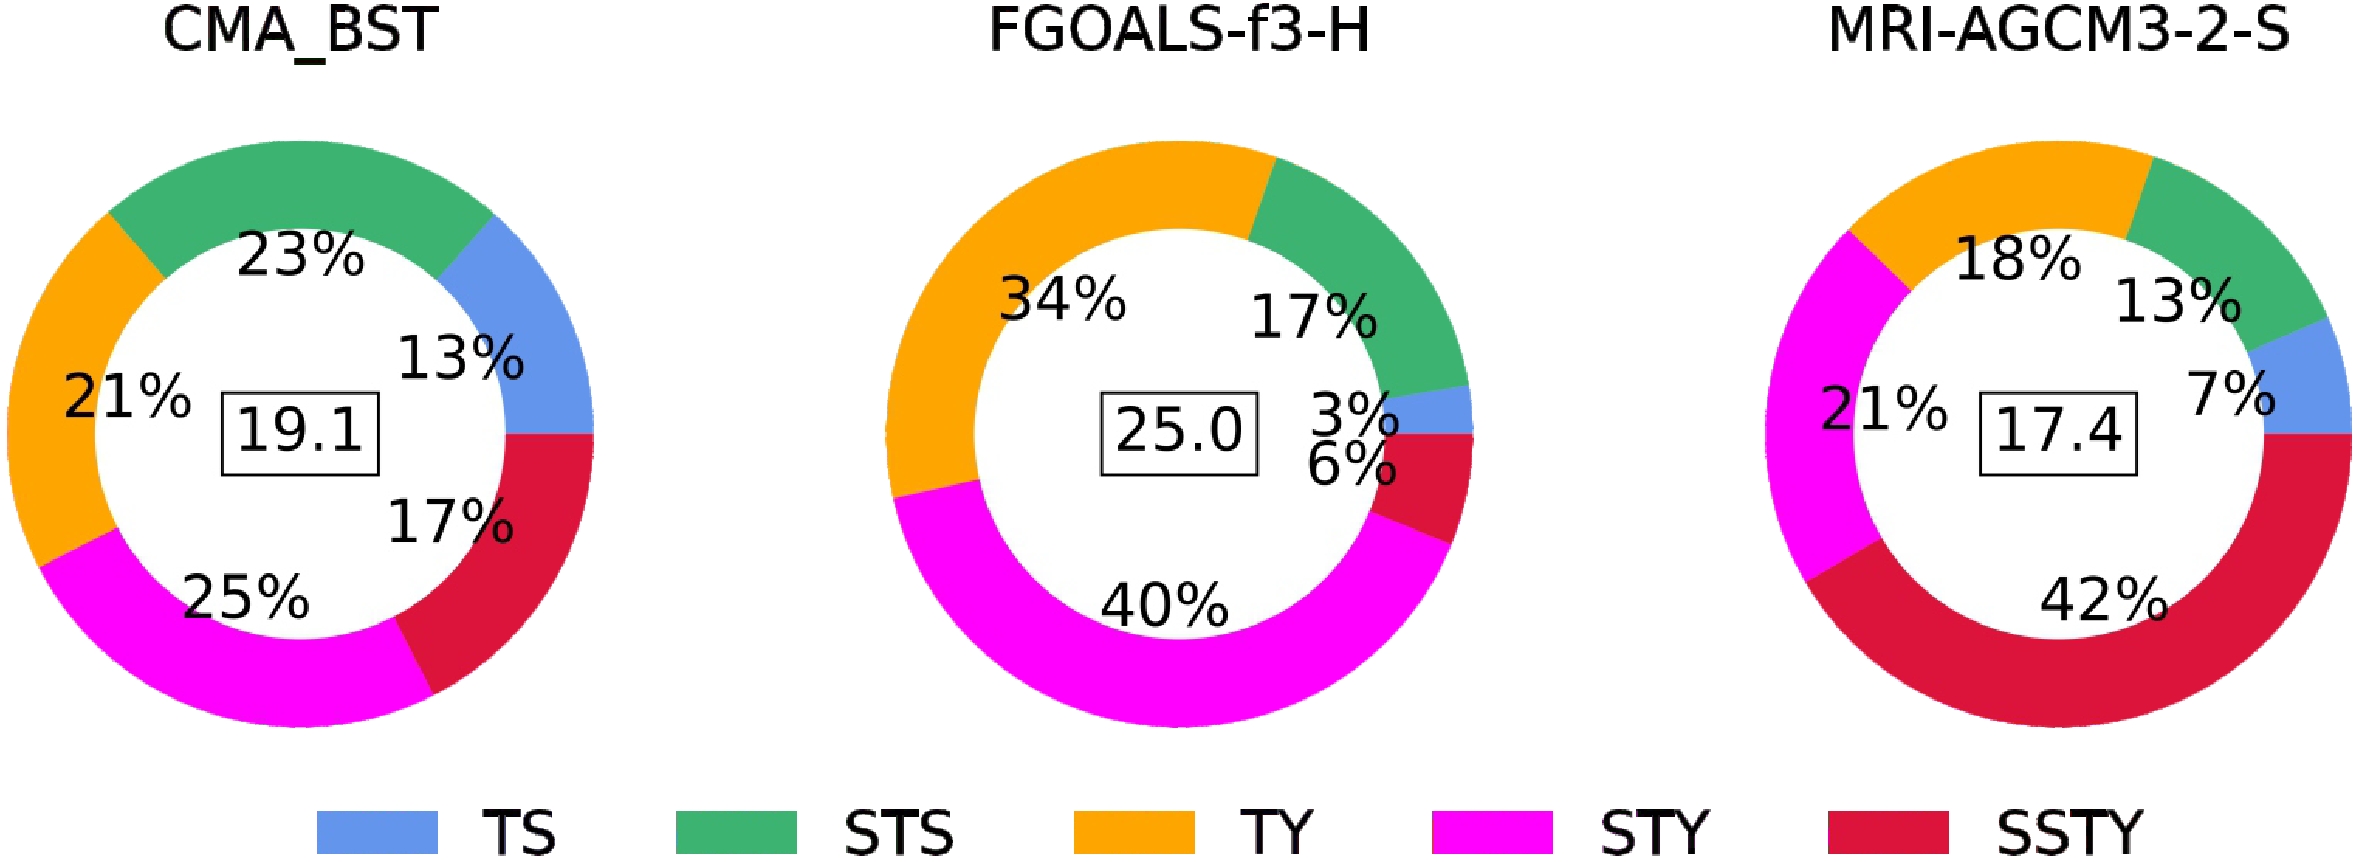
Figure 3 compares the observed and simulated numbers of TCs with different intensities and their proportions in total TC frequency (mean TCs counts per year over the WNP during 1985–2014). Both models are capable of simulating a certain number of strong TCs of the typhoon level and above but show different biases. For FGOALS-f3-H, the total number of simulated TCs is overestimated; most especially, the proportions of TY and STY are too high, reaching 34% and 40%, largely exceeding the observed proportions of 21% and 25%, respectively. On the contrary, the proportions of TS and SSTY are 3% and 6%, respectively, which are largely underestimated compared to the observed 13% and 17%. For MRI-AGCM3-2-S, it produces fewer TC numbers than the observation but severely overestimates the proportion of SSTY, reaching 42%, which is higher than 17%.

Figure 3. Comparison of the percentage of the number of tropical cyclones for five different intensity categories (TS: Tropical storm, STS: Severe tropical storm, TY: Typhoon, STY: Severe typhoon, SSTY: Super typhoon) in the Western North Pacific over 1985–2014 between the observations (CMA_BST) and two AGCMs (FGOALS-f3-H and MRI-AGCM3-2-S). The center of each donut is the annual mean number of TCs per year, with the number outside denoting the annual mean percentage of TCs for each intensity category.
Figure 4 further compares the observed and simulated wind-pressure relationship (WPR) for all TCs based on the life-cycle maximum surface wind speed and minimum sea level pressure using a linear regression fitting. FGOALS-f3-H tends to simulate a weaker WPR than the observation, which is a common problem in most AGCMs (Manganello et al., 2012), but it simulates too many moderate-intensity TCs (TY and STY shown in Fig. 3) and too few weak and extremely intense TCs (TS and SSTY shown in Fig. 3). In contrast, MRI-AGCM3-2-S better simulates the slope of WPR, with the distribution of surface maximum wind speeds systematically shifting towards the high end, which corresponds to the higher proportion of super typhoons in Fig. 3.

Figure 4. Comparison of wind-pressure pairs for each TC maximum 10-m wind speed (m s–1) and minimum sea level pressure (hPa) in the Western North Pacific between the observations (CMA_BST) and two high-resolution AGCMs (FGOALS-f3-H and MRI-AGCM3-2-S). A linear regression is fitted to each distribution of wind-pressure pairs.
-
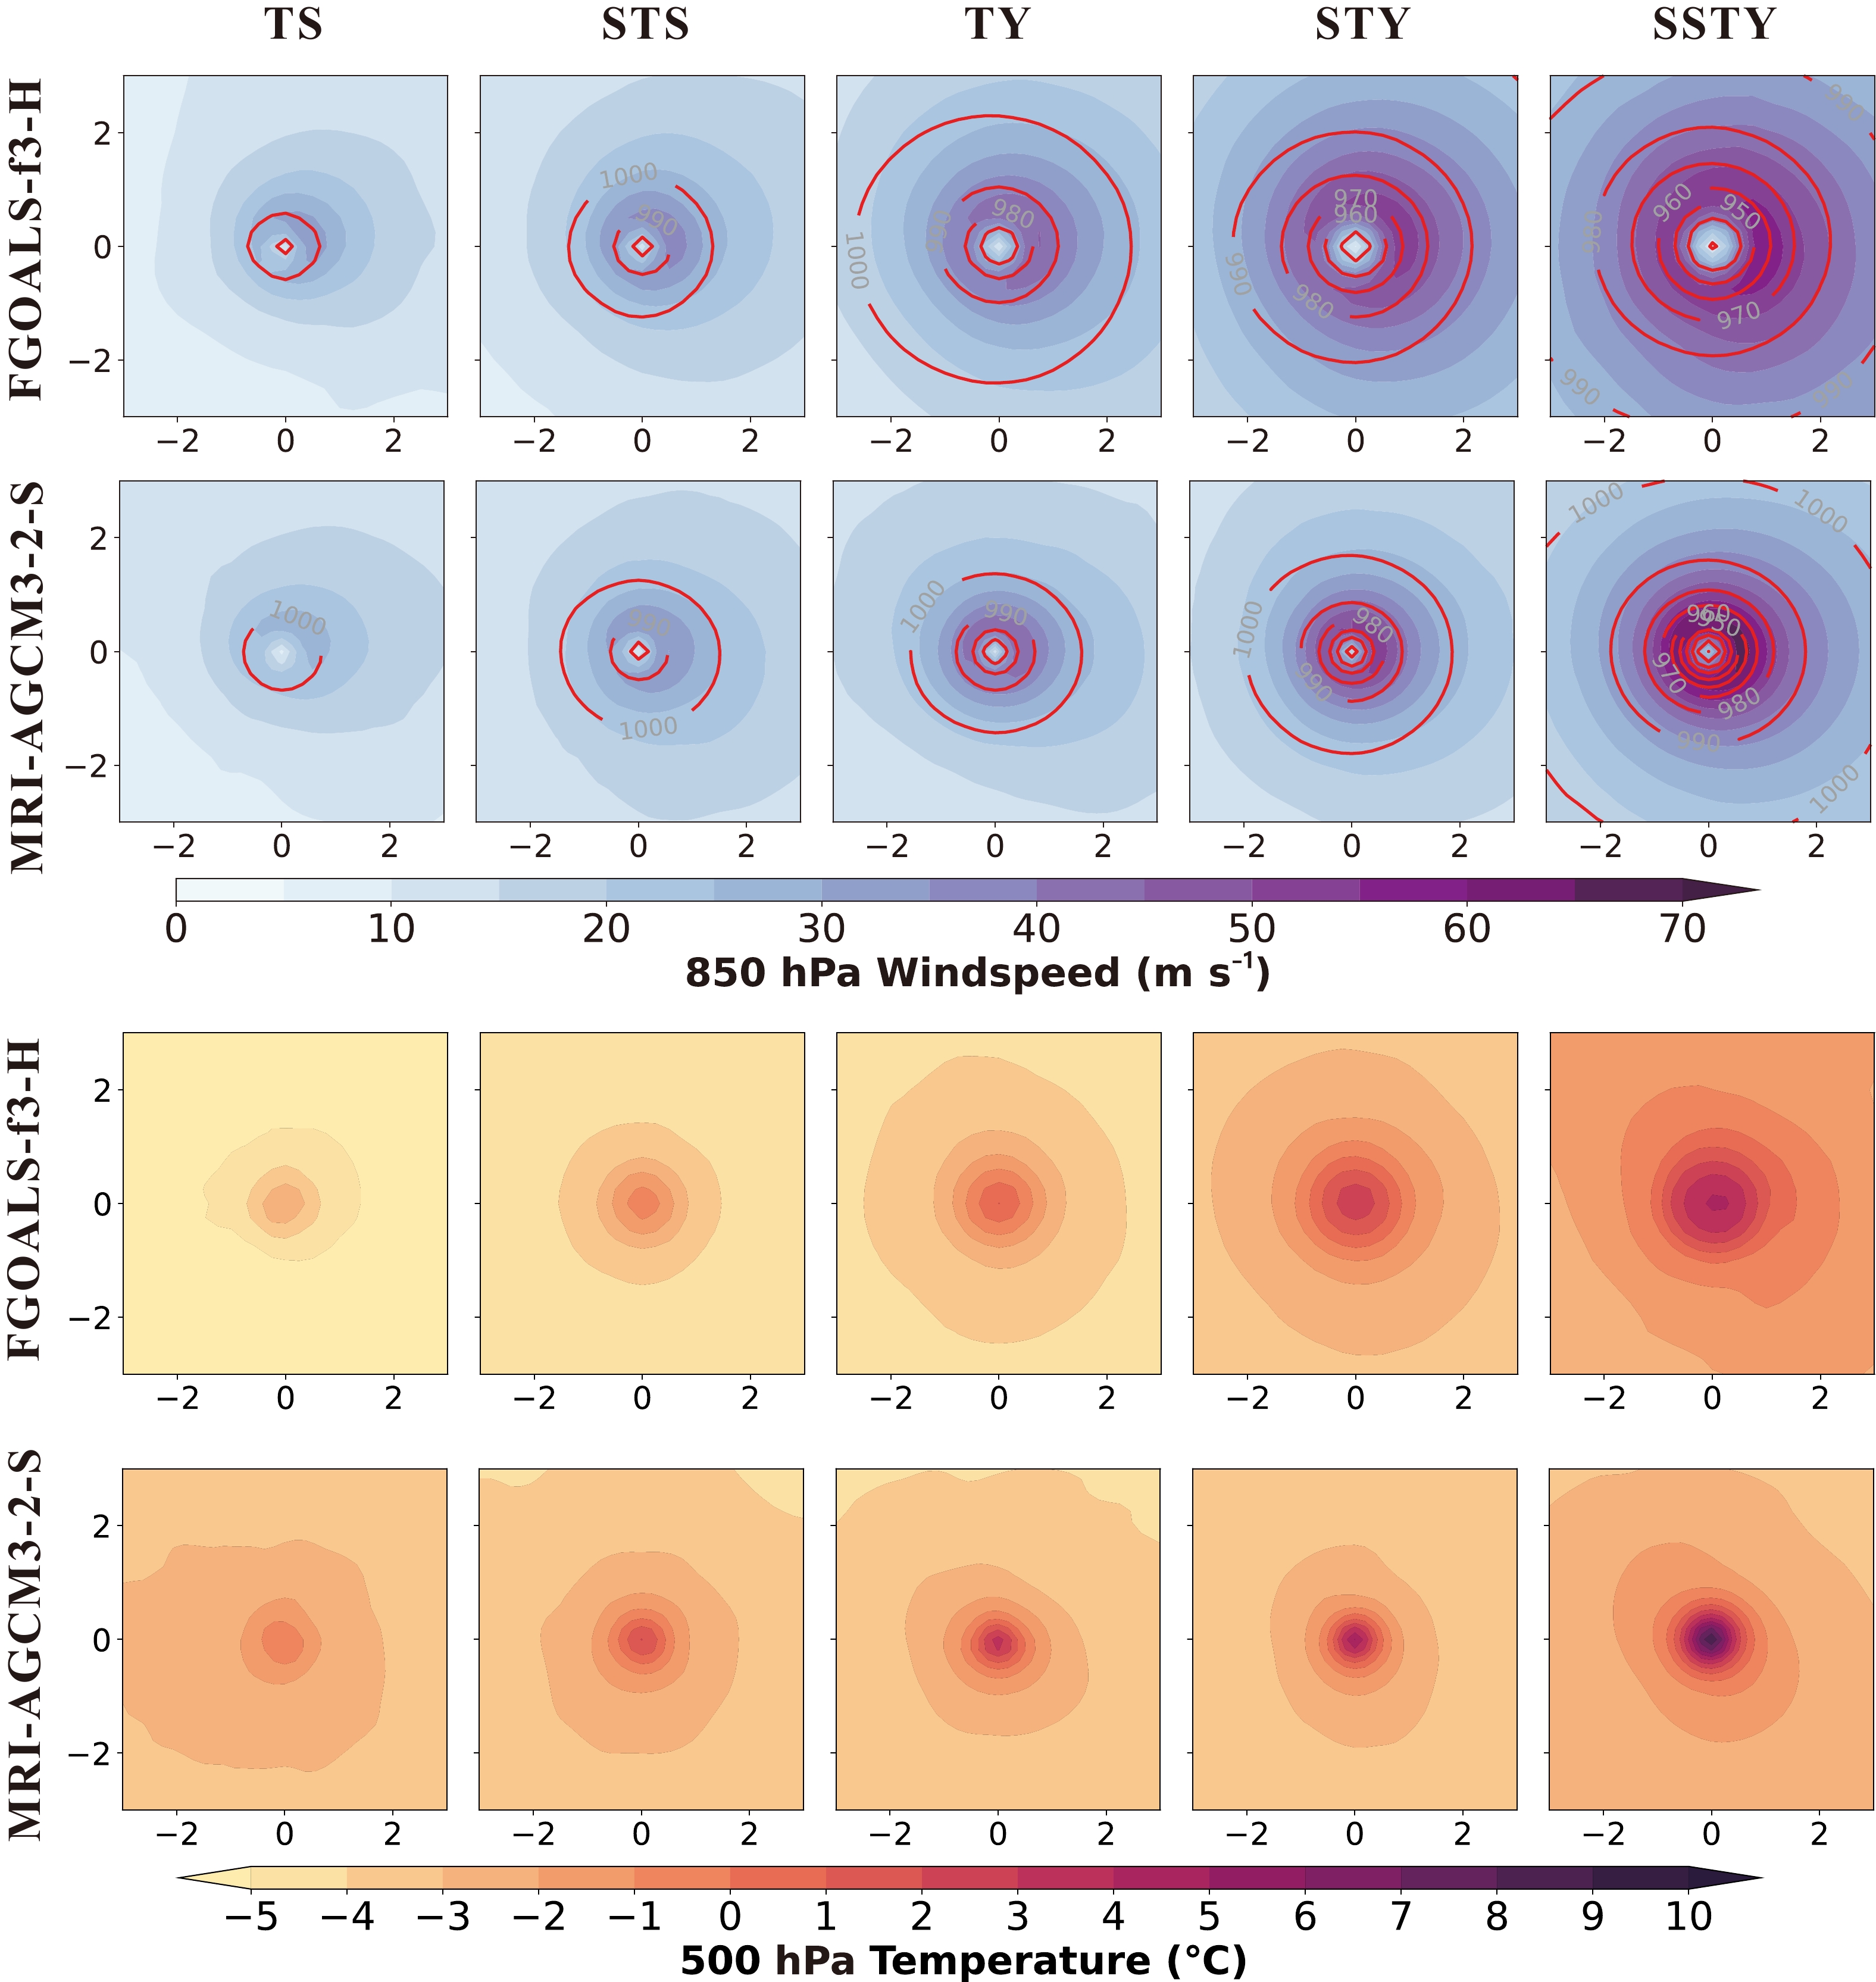
Examination of the TC wind and thermodynamic structures might help to provide insight for optimizing the model representation of physical processes that influence TC intensity (Moon et al., 2020). Figure 5 compares the composite structures of 850-hPa horizontal wind fields and 500-hPa warm-core temperature anomalies of TCs at five different intensity categories (only snapshots of TCs at their lifetime maximum intensity, LMI) simulated by the two AGCMs. The observed structure is not shown here because the ERA5 reanalysis is considered to produce weaker TC structures (Xi et al., 2021). The two models show little difference in the simulation of low-level winds and upper-level temperature anomalies for weak TCs such as TS and STS. With an increase of TC intensity, FGOALS-f3-H systematically simulates larger TCs with a greater radii of maximum wind (RMW) but with weaker warm cores and smaller upper-level horizontal temperature gradients compared to MRI-AGCM3-2-S. This model-structure difference is the most significant for intense TCs (STY and SSTY), indicating that MRI-AGCM3-2-S simulates a more compact inner-core wind structure and a stronger warm-core anomaly than FGOALS-f3-H for TCs with the intensity of TY and above.

Figure 5. Composite analysis of (a) 850-hPa wind speed (shaded area) with sea-level pressure (red circles) and (b) 500-hPa temperature anomalies based on WNP TCs at their lifetime maximum intensity simulated by two high-resolution AGCMs (FGOALS-f3-H and MRI-AGCM3-2-S).
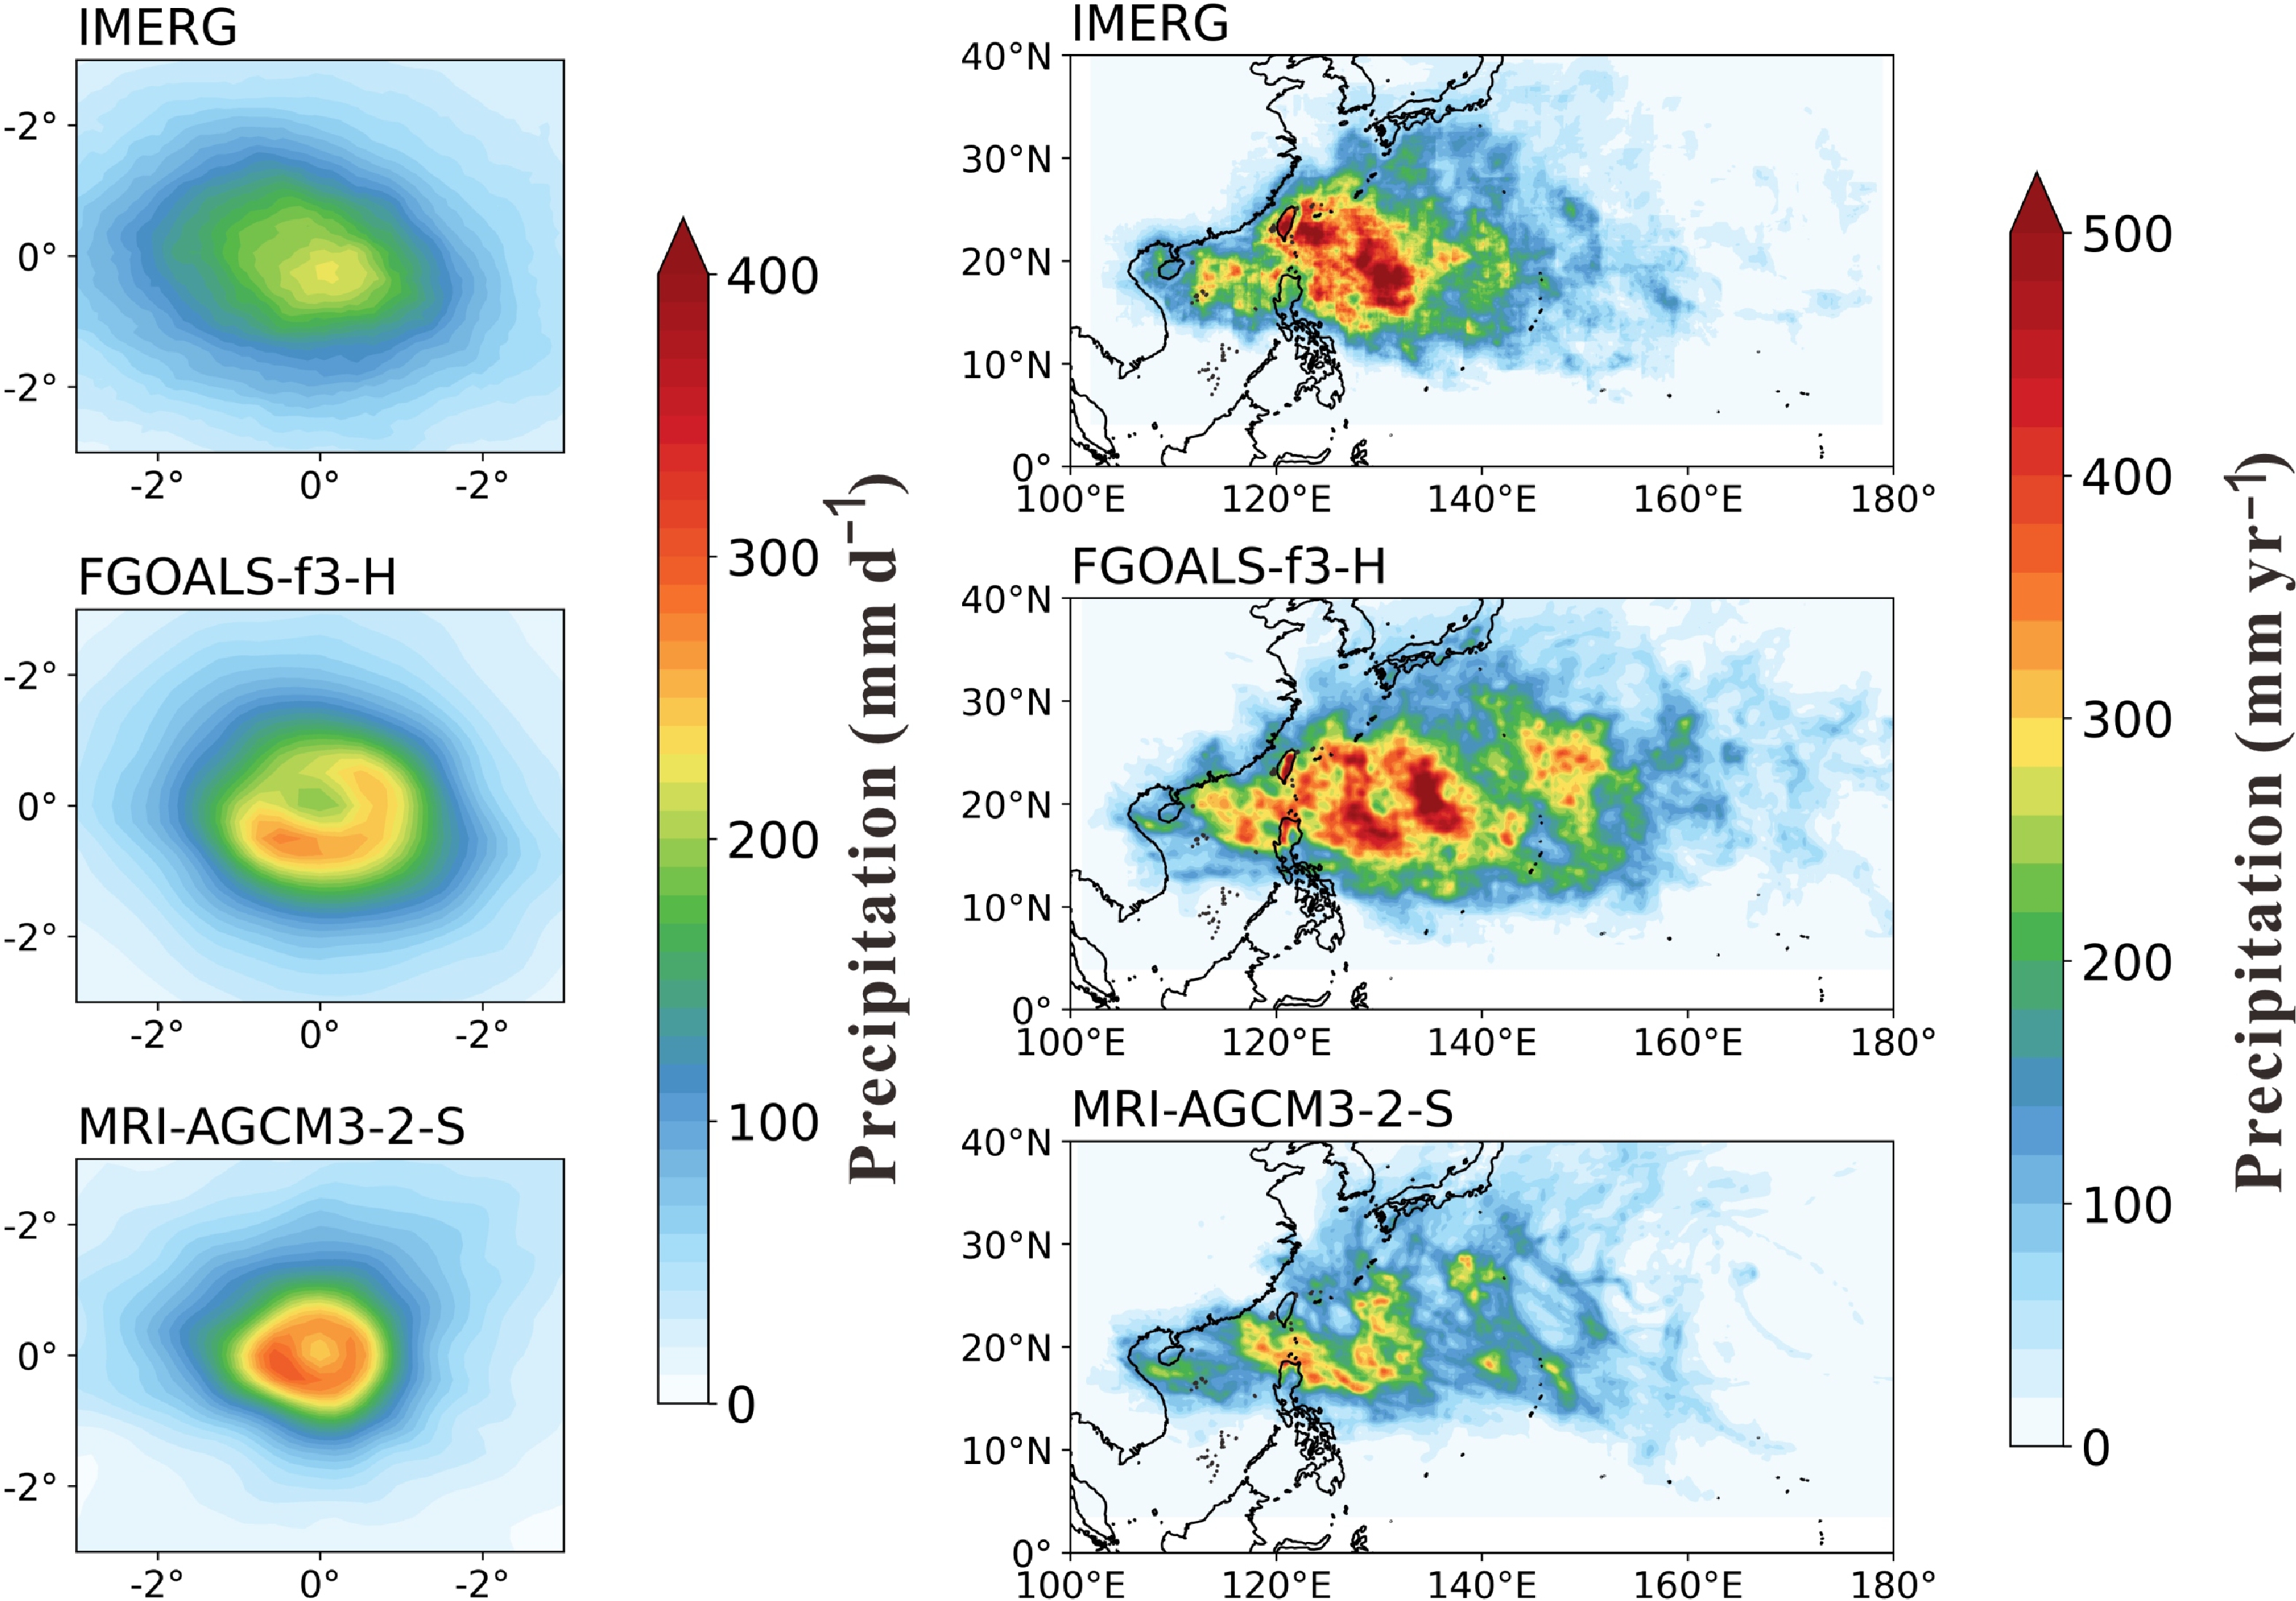
The TC precipitation distribution and its relationship with TC intensity have always attracted great attention for GCM simulations. Generally, the GCMs that produce stronger TCs also have greater precipitation with more symmetrical distributions (Moon et al., 2020). Figure 6 compares the daily precipitation distribution for the horizontal composite of the STYs and SSTYs at their LMI between the observation and the simulations of two AGCMs. The TC extreme precipitation simulated by MRI-AGCM3-2-S is apparently more compact and symmetrical than FGOALS-f3-H, and the precipitation rate is higher than the observation, which corresponds to its overestimated proportion of SSTY. However, the distribution of TC extreme precipitation simulated by FGOALS-f3-H is more asymmetrical with the maximum, appearing 100 km to the east and south of the eyewall, consistent with the underestimated proportion of SSTYs by FGOALS-f3-H.
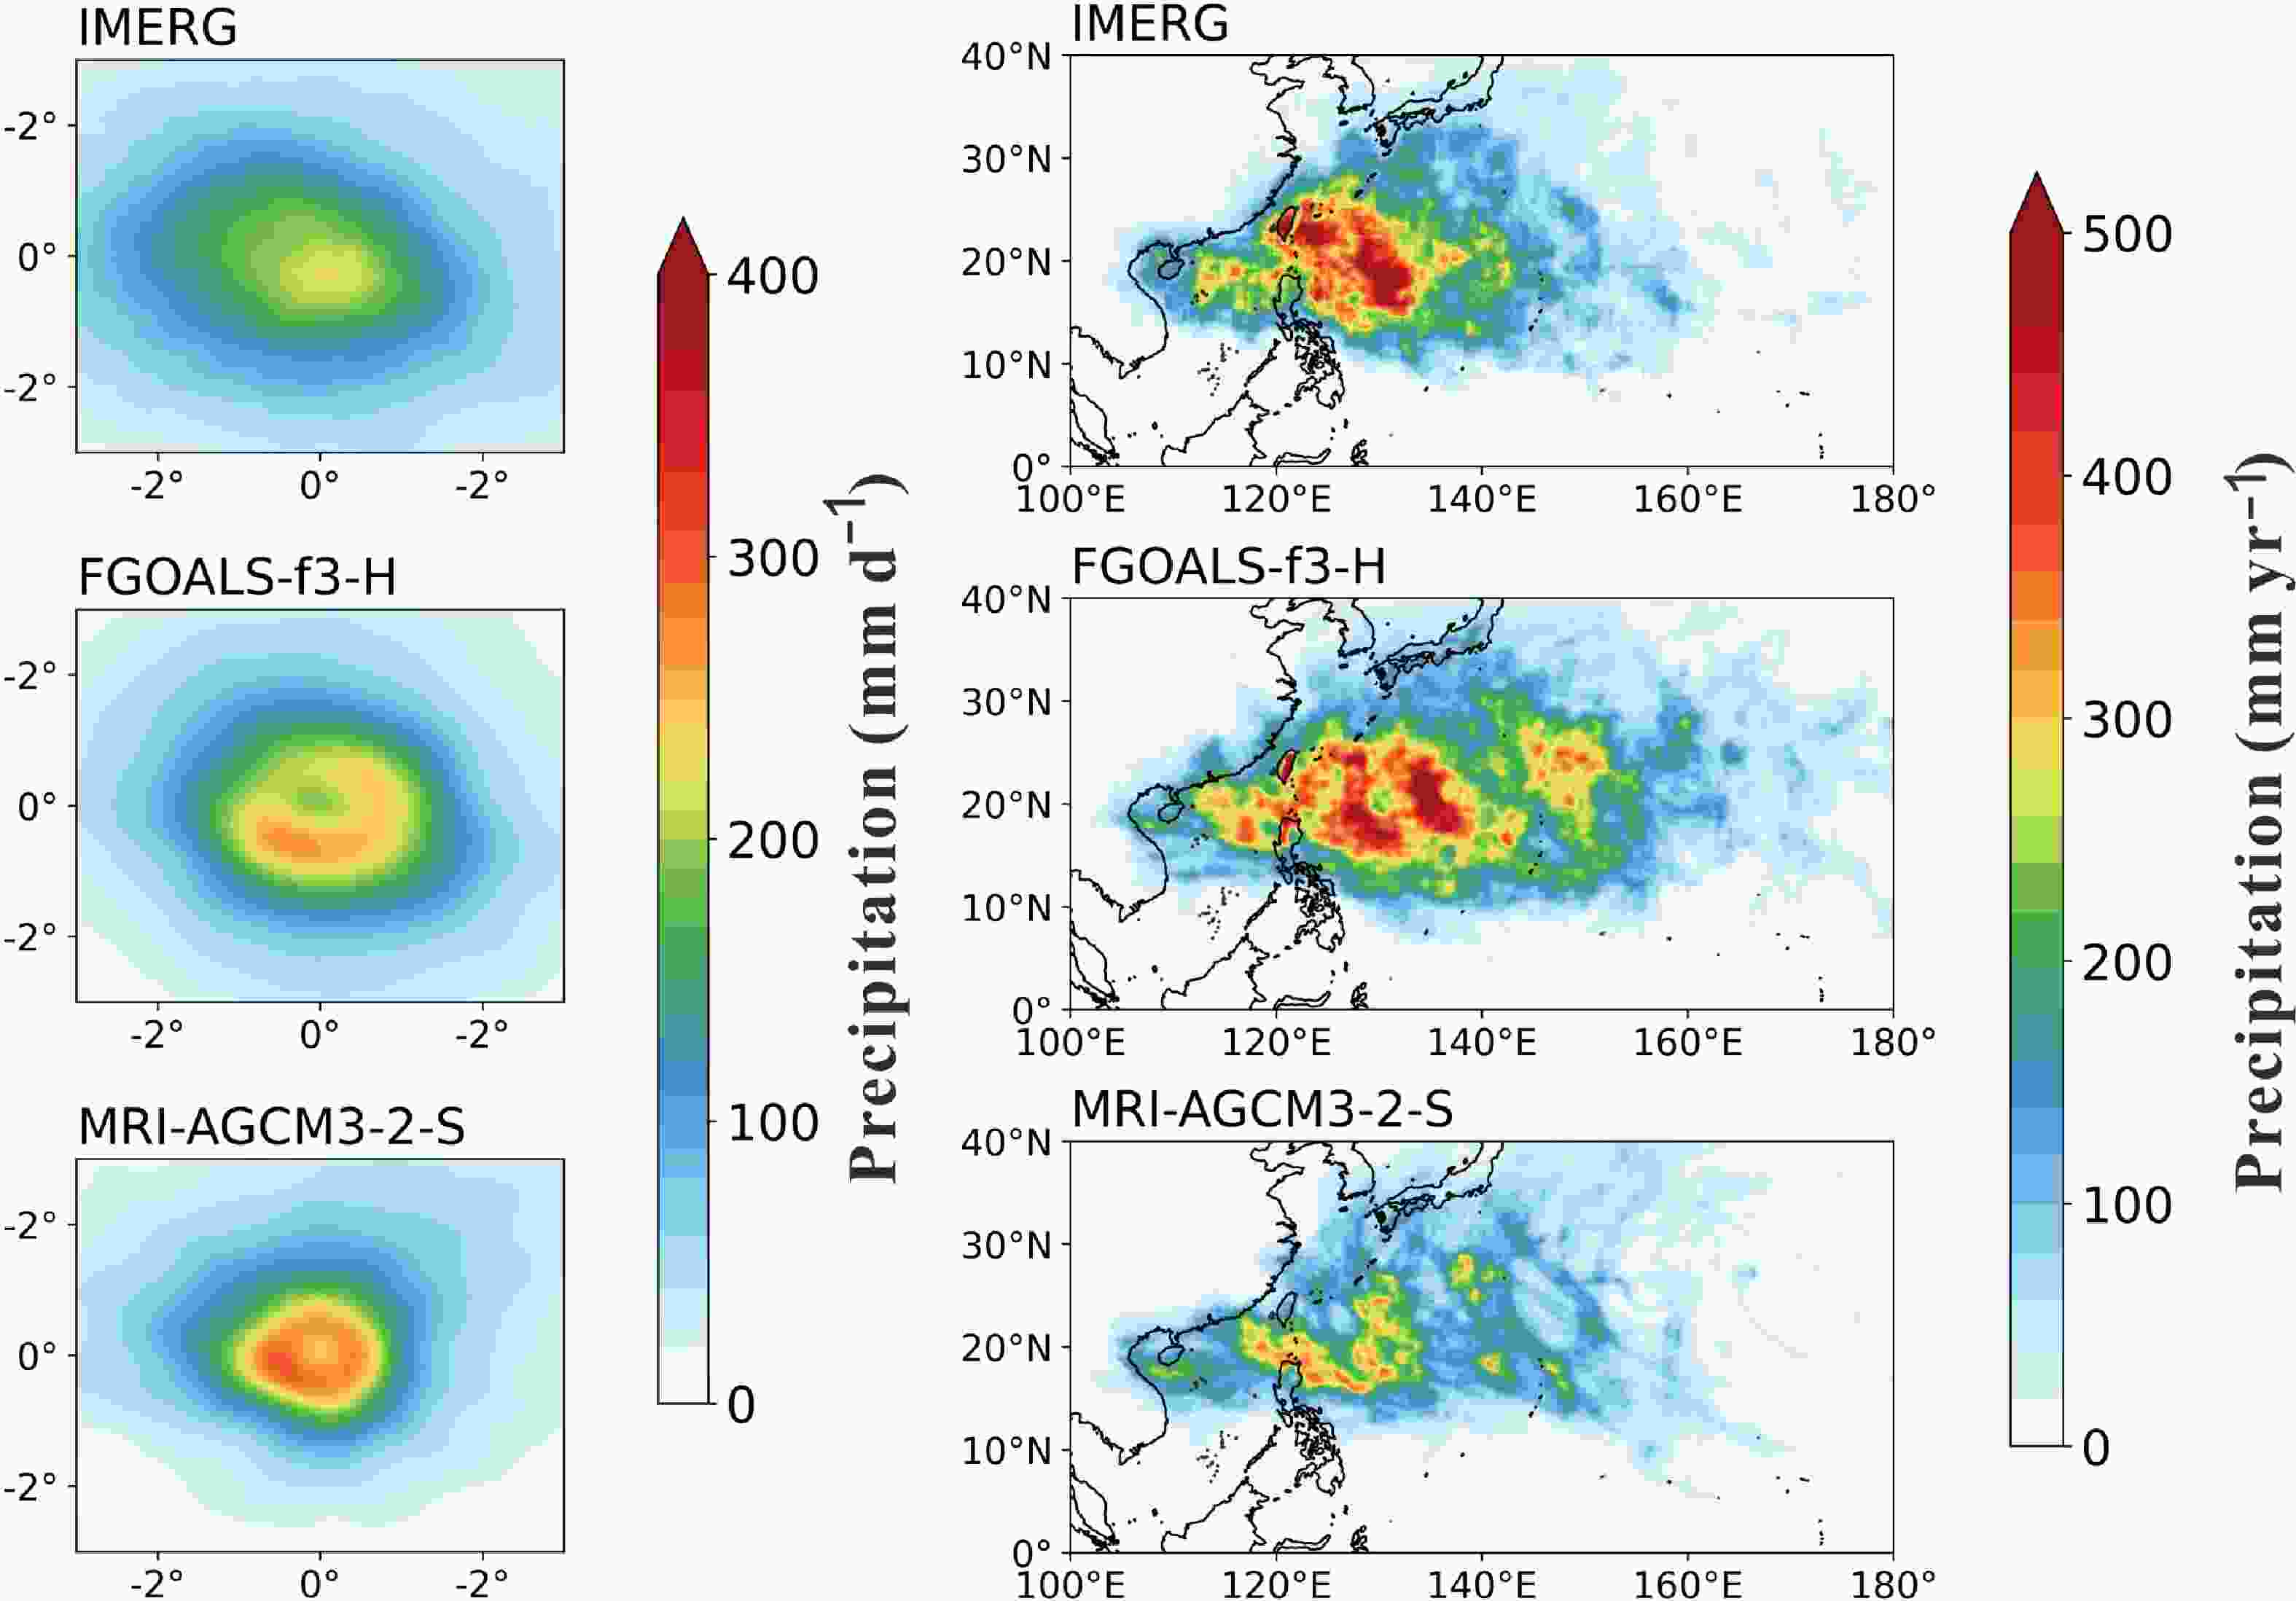
Figure 6. Daily precipitation distributions for the composite of STYs and SSTYs at their lifetime maximum intensity (Left panel, units: mm d–1) and annual mean distribution of all TC-induced precipitation (Right panel, units: mm yr–1) during the TC peak season (July to October) from 2001 to 2014 from the GPM-IMERG-Final precipitation product and two high-resolution AGCMs (FGOALS-f3-H and MRI-AGCM3-2-S).
In addition, the distribution of the simulated annual mean precipitation of all the TCs over the WNP during JASO between 2001 to 2014 is also compared in Fig. 6 with the observation. The distribution of TC-induced precipitation in all models is highly consistent with the distribution of modeled TCF and track density. Specifically, FGOALS-f3-H reasonably simulates the main precipitating areas, except for an unrealistic precipitation region in the northeastern WNP, attributed to its overestimated track densities of TY and STY with its northward-biased paths, both of which are shown in Fig. 1. However, MRI-AGCM3-2-S severely underestimates the total TC precipitation over the WNP, mainly due to its underestimation of TCF and the associated track density of weaker TCs moving into the East and South China Sea. Therefore, FGOALS-f3-H has a significant advantage over MRI-AGCM3-2-S in simulating the total TC precipitation distribution over the WNP.
-
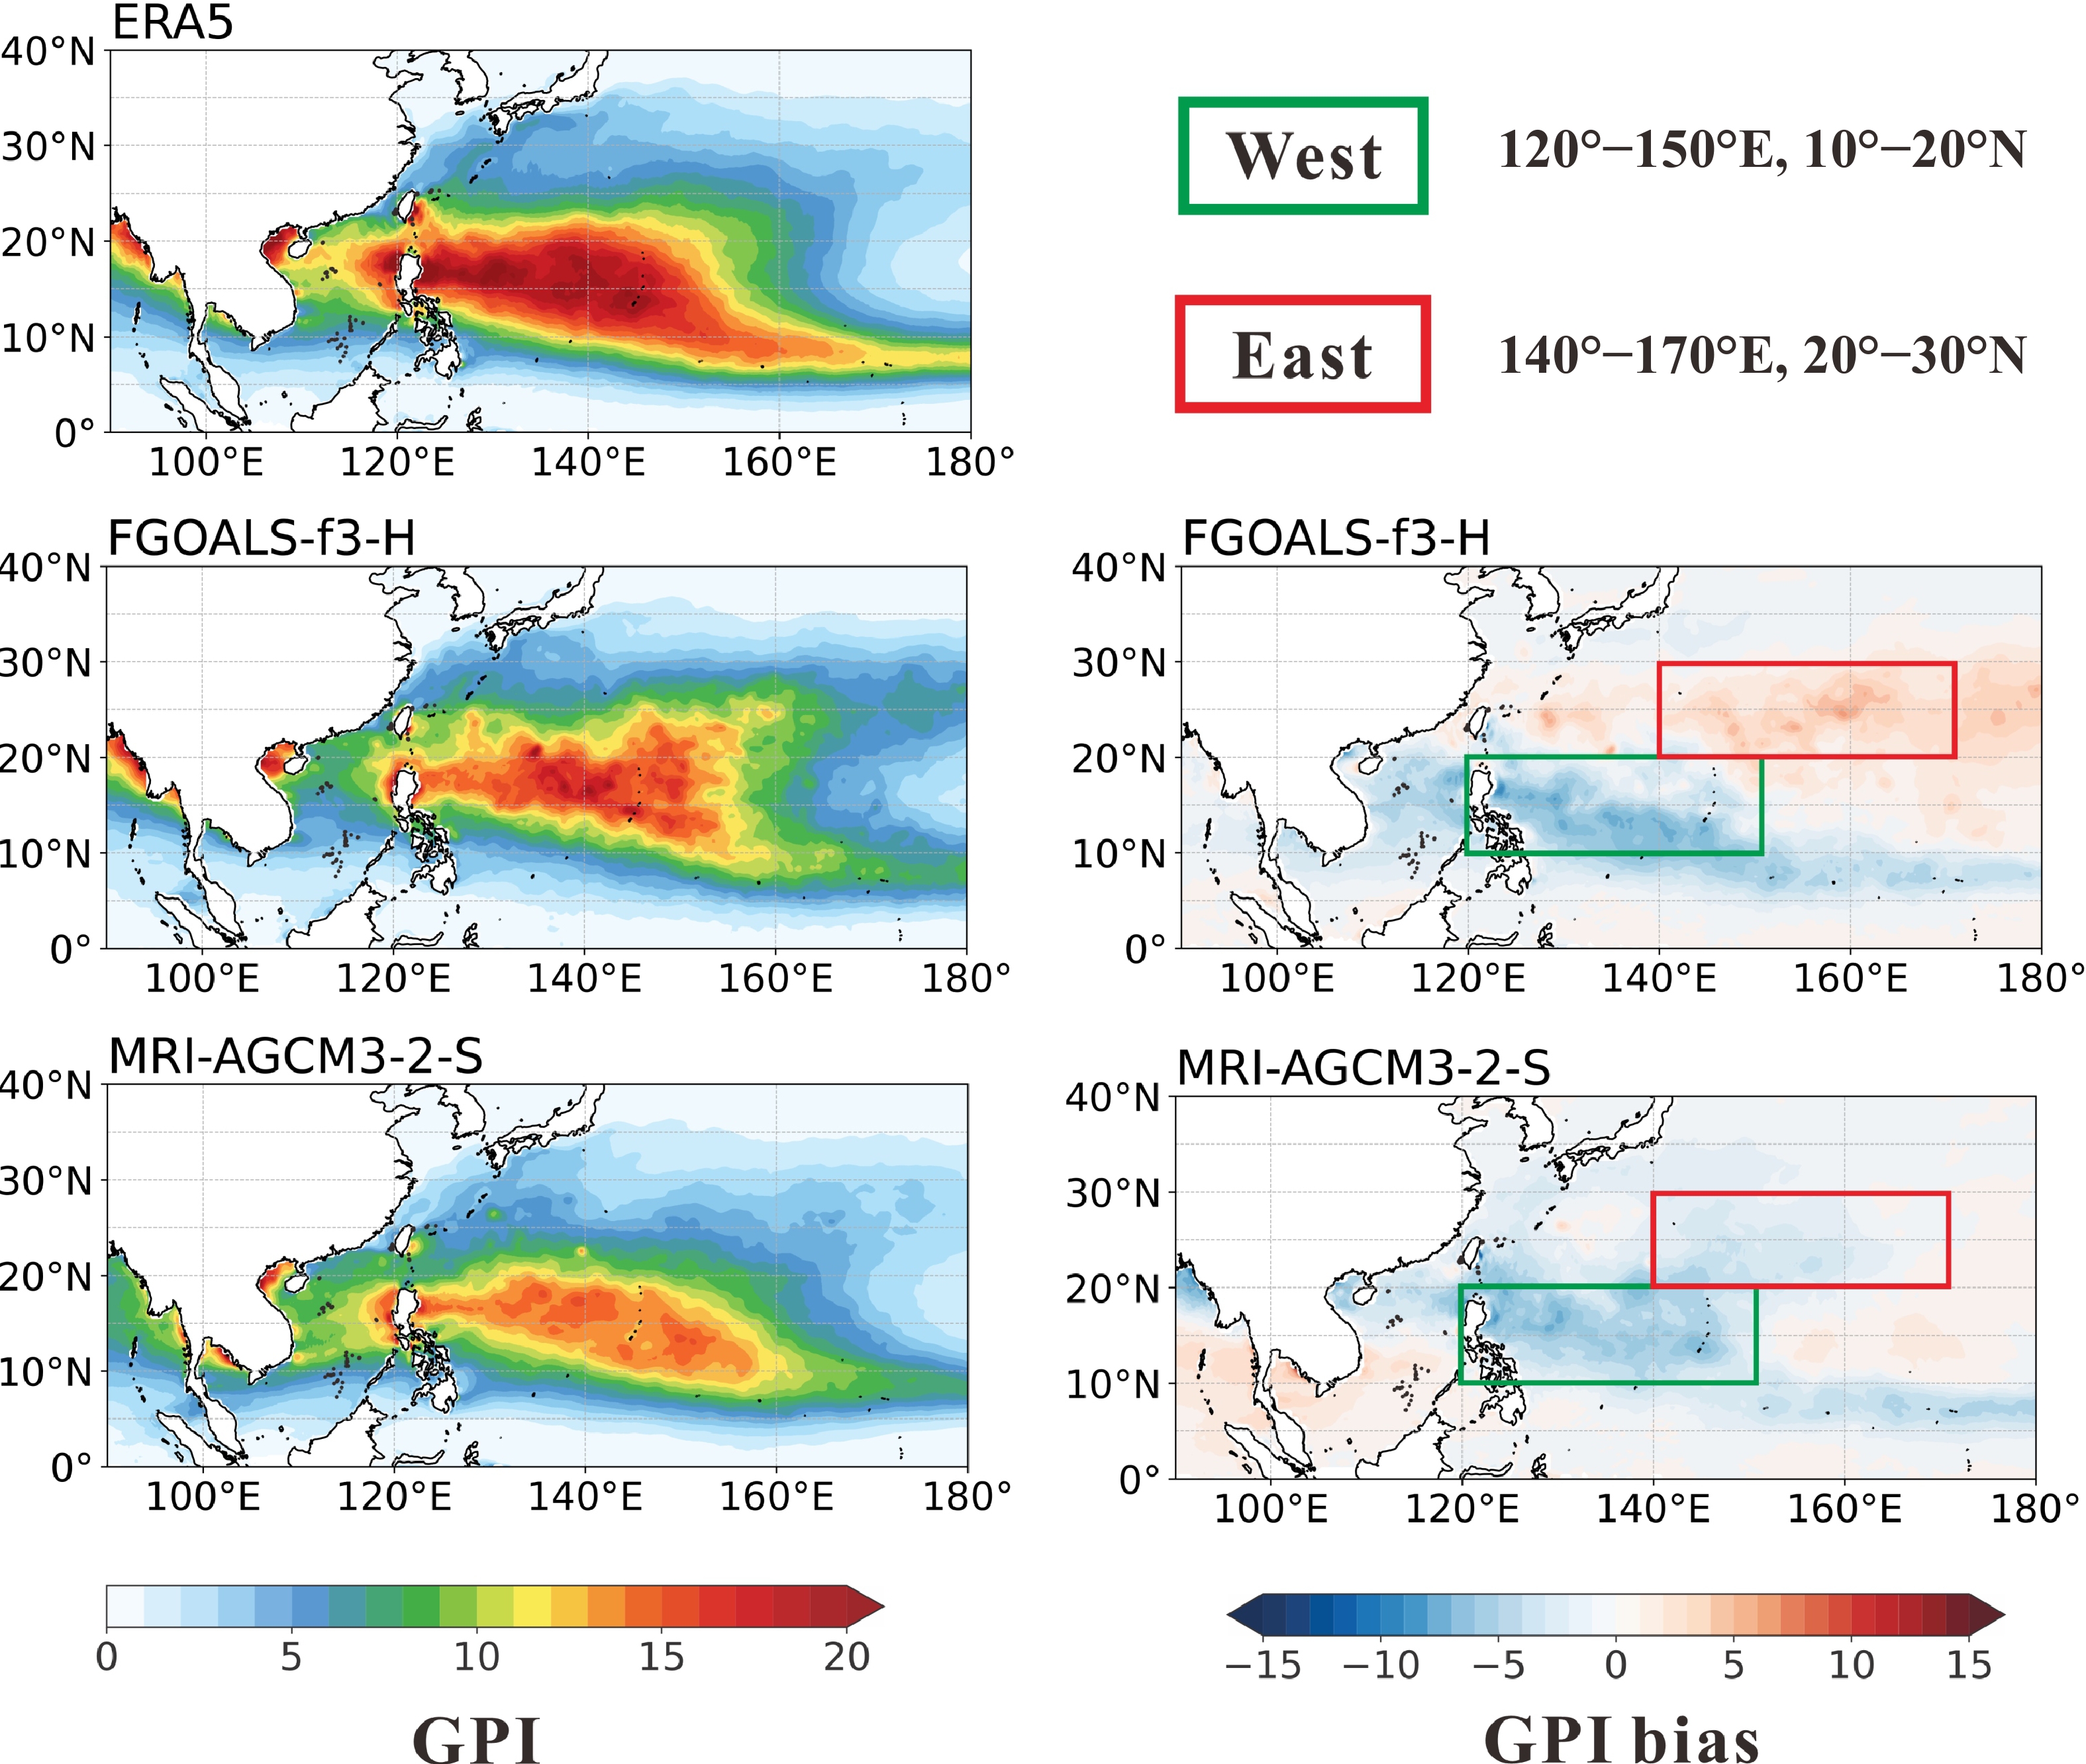
Figure 7 presents the observed and simulated distributions of GPI and their biases from the two AGCMs. Both models generally capture the spatial pattern of GPI in the ERA5 reanalysis over the WNP, but with different regional biases. Specifically, two models share a common negative bias over the southwestern WNP (West: 10°–20°N, 120°–150°E) but show an opposite bias over the northeastern WNP (East: 20°–30°N, 140°–170°E), with a relatively larger overestimation in FGOALS-f3-H but an underestimation in MRI-AGCM3-2-S, which largely corresponds to the distribution of TCGF biases shown in Fig. 1. Thus, GPI can be further analyzed to examine the large-scale environmental impacts on the TCGF biases over the two different regions of the WNP.

Figure 7. Distributions of the Genesis Potential Index (GPI) during the TC peak season (July to October) from 1985 to 2014 in the ERA5 reanalysis and simulations of two high-resolution AGCMs (FGOALS-f3-H and MRI-AGCM3-2-S) as well as the model biases.
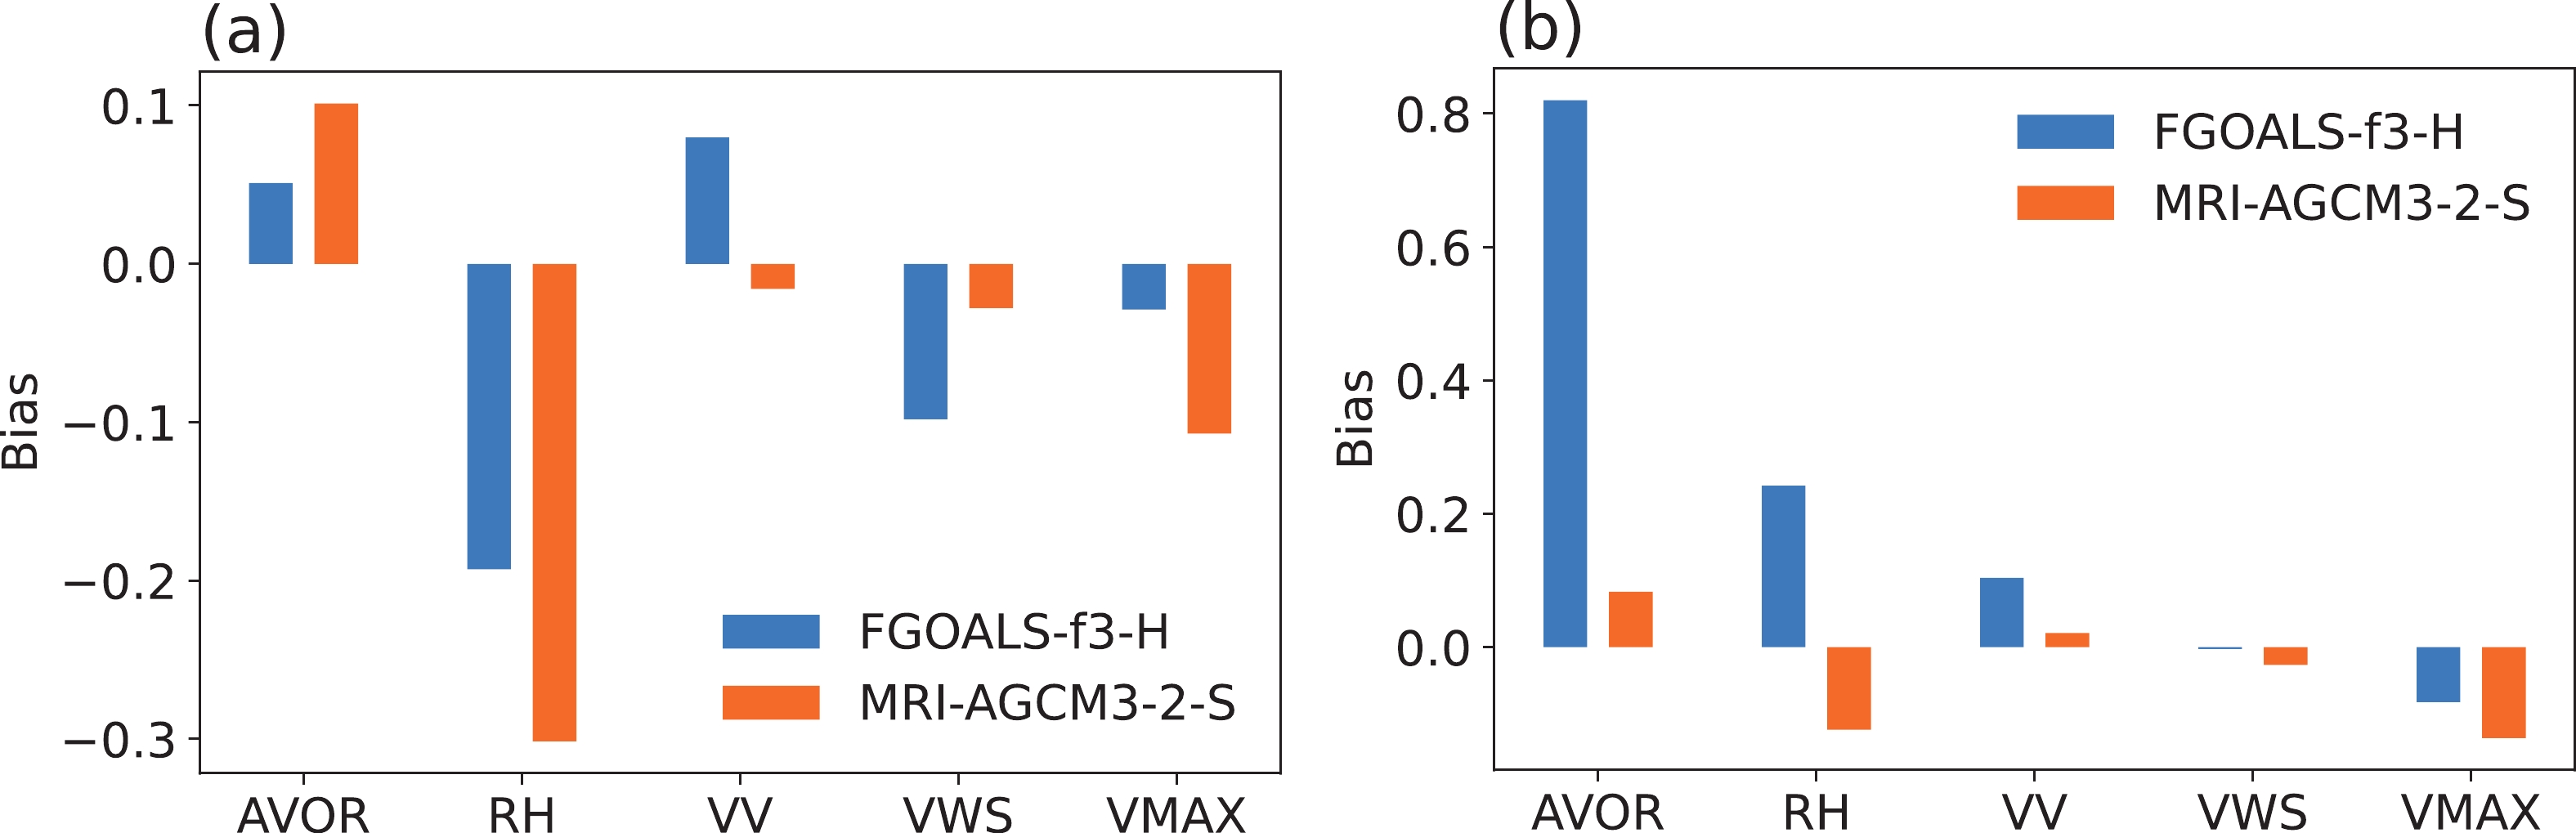
Figure 8 compares the bias contributions over two key regions of the WNP from the five components of GPI, including the 850-hPa absolute vorticity (AVOR), 600-hPa relative humidity (RH), 500-hPa vertical velocity (VV), environmental vertical wind shear (VWS), and maximum potential intensity (VMAX). Both regions in the WNP show a common negative VMAX bias. This may be because two AGCMs are driven by prescribed SSTs and thus have limited air-sea coupling processes, resulting in higher temperatures in the near-surface layer and excessive CAPEb for calculating the VMAX. Besides the bias of VMAX, the GPI biases in the two regions are caused by different environmental factors. In the West region, the common negative bias of GPI for both models is mainly caused by two large-scale environmental factors: lower RH and stronger VWS, among which the lower RH contributes the most. On the other hand, in the East region, the positive bias of GPI for FGOALS-f3-H is mainly due to the overestimated AVOR and mid-level RH, while the negative bias of GPI for the MRI-AGCM3-2-S is mainly due to underestimated RH. Therefore, it can be deduced that the GPI bias over the WNP is mainly from three key, large-scale atmospheric factors: low-level AVOR, VWS, and mid-level RH, which is consistent with the previous studies (Camargo and Sobel, 2004; Fu et al., 2012; Zhao et al., 2019), although their relative importance of contribution to the biases is still debatable.
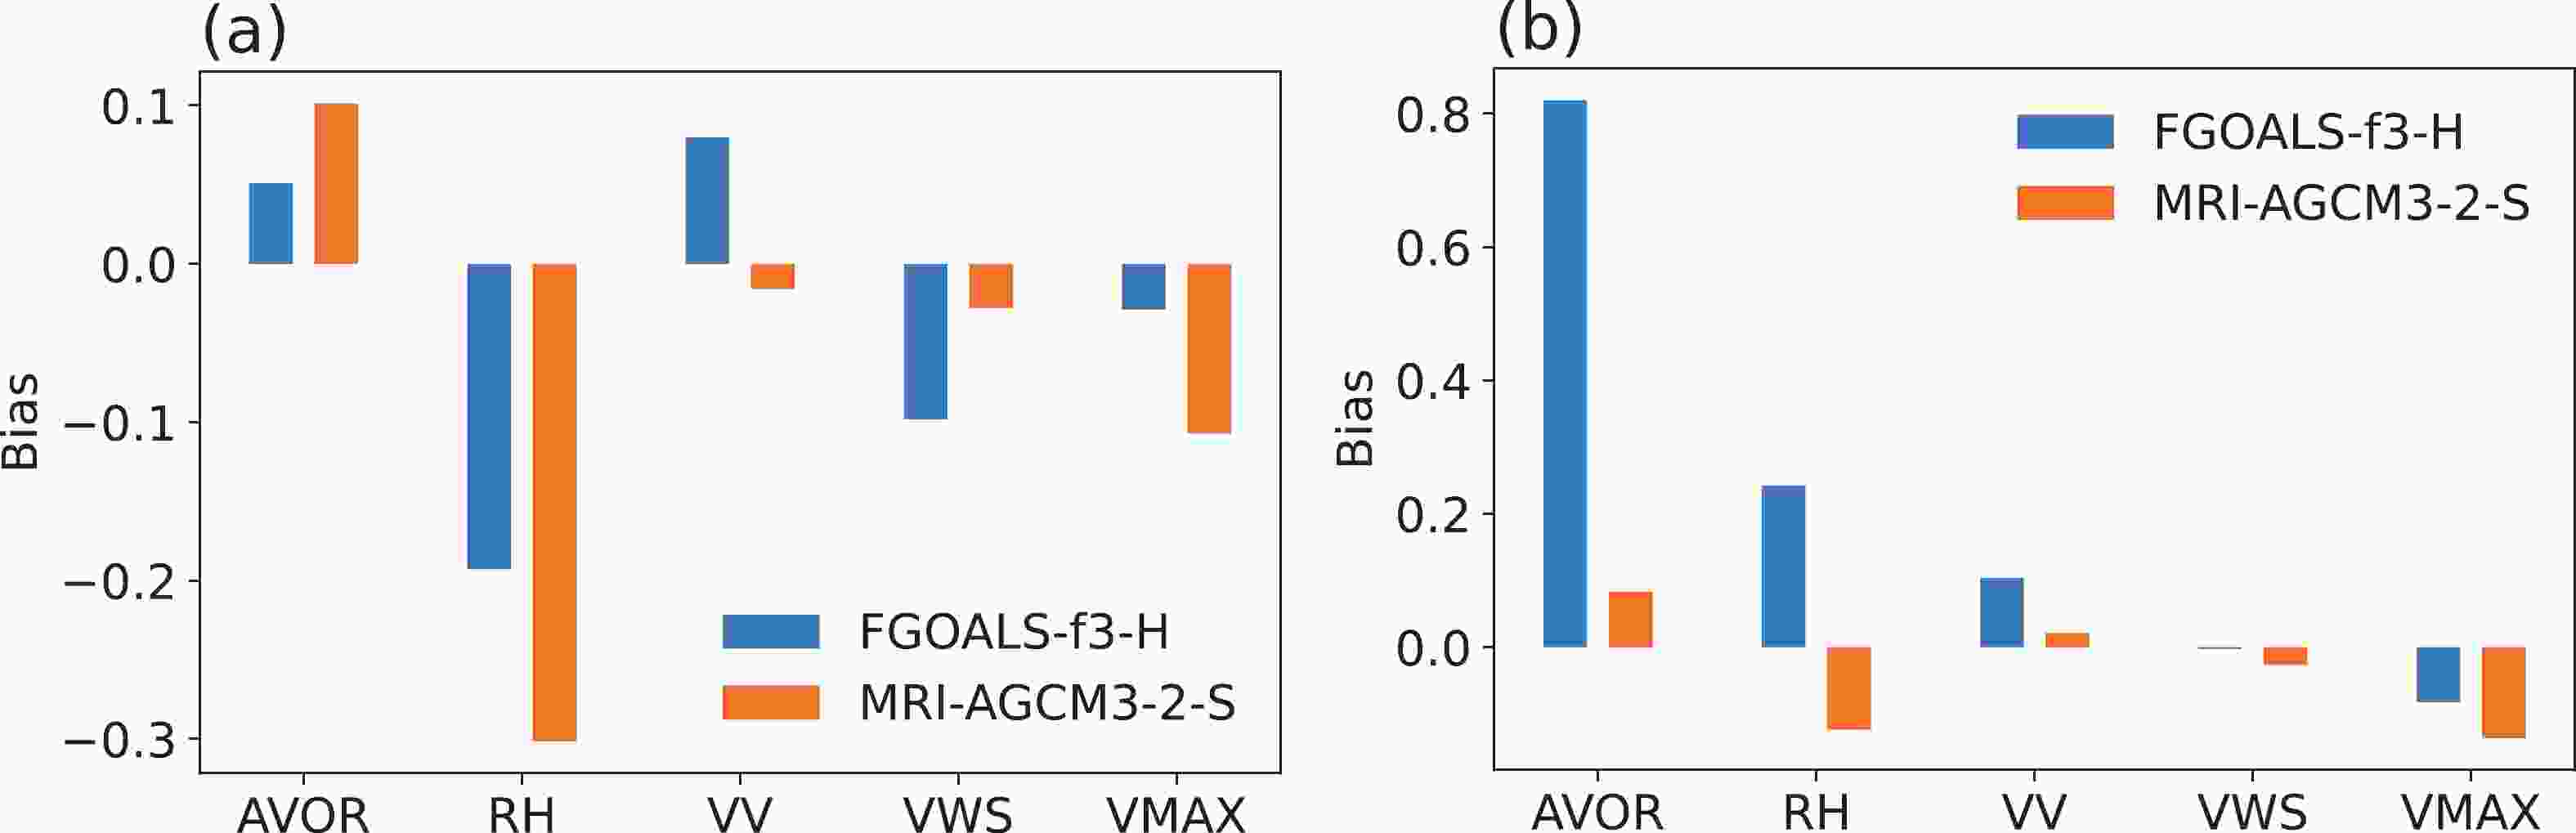
Figure 8. Bias contributions of five GPI components to the total GPI bias (AVOR: 850-hPa absolute vorticity; RH: 600-hPa relative humidity; VV: 500-hPa pressure vertical velocity; VWS: magnitude of the wind shear between 850 hPa and 200 hPa; VMAX: maximum potential intensity) in the simulations of two high-resolution AGCMs (FGOALS-f3-H and MRI-AGCM3-2-S) over the (a) West (10°–20°N, 120°–150°E) and the (b) East region (20°–30°N, 140°–170°E) of WNP.
-
According to Zhan et al. (2022), the strengthened WP_TEJ near 150 hPa generates enhanced upper-level ageostrophic northerly winds to the north of the entrance region of the jet, leading to intensified vertical circulations with enhanced upper-level divergence, deep upward motion, and strengthened low-level convergence. As a result, the increased low-level vorticity associated with the monsoon trough and the decreased sea-level pressure and vertical wind shear, are all favorable conditions for TCGF over the WNP. Based on the above analyses of key GPI factor biases, we will focus on the simulation of the WP_TEJ and its role in modulating these large-scale factors to better understand the physical causes for the simulation biases in the WNP TCGF climatological distribution. Figure 9 compares the observed and simulated biases of the 150-hPa WP_TEJ and its related key environmental factors affecting TCGF over the WNP. Compared to the observation, the WP_TEJ simulated by FGOALS-f3-H is stronger and extends further eastward. This implies an overestimated zonal wind around and to the north of its entrance region, while the WP_TEJ simulated by MRI-AGCM3-2-S is much weaker.

Figure 9. Climatology distribution of the observed (ERA5) and the simulated biases of 150-hPa zonal wind (m s–1) and divergence (10–5 s–1), 500-hPa geopotential height (gpm) and upward motion (VV, Pa s–1), 600-hPa relative humidity (RH, %), 850-hPa relative vorticity (10–5 s–1), as well as the magnitude of 200–850 hPa vertical wind shear (VWS, m s–1) averaged from 1985 to 2014 during JASO from two high-resolution AGCMs (FGOALS-f3-H and MRI-AGCM3-2-S). The West and East regions of the WNP are shown in rectangular boxes.
Correspondingly, in FGOALS-f3-H, the upper-level divergence to the north of the entrance region of WP_TEJ is stronger than the observation and extends further north and east, leading to an overestimation of low-level convergence and vorticity, which contributes to a much stronger monsoon trough at 850 hPa stretching further north. This significantly enhances the water vapor transport associated with the upward motion to the north of the WP_TEJ entrance region, leading to the overestimated RH and VV, which well explains the positive GPI biases of FGOALS-f3-H in the East region.
Further, FGOALS-f3-H simulates a systematically weak and eastward retreating Western Pacific subtropical High (WPSH), consistent with the overestimated WP_TEJ intensity. As shown by Zhan et al. (2022), the intensified WP_TEJ is accompanied by the anomalous local Hadley circulation induced by the SST distribution of ENSO Modoki. That is, the positive heating source in the central and eastern tropical Pacific could force a cyclonic gyre in the North Pacific that weakens the WPSH, which is an ENSO/Gill-like response with an anomalous local Hadley circulation as the solution of the antisymmetric heating about the equator (Gill, 1980; Zhou et al., 2009). On the other hand, the stronger WP_TEJ and the associated northerly displacement of the monsoon trough in FGOALS-f3-H primarily lead to much stronger VWS and less water vapor transport (RH) in the West region. All of these factors are not conducive to TC genesis, resulting in the negative GPI bias of FGOALS-f3-H in the West region.
In MRI-AGCM3-2-S, for the West region of WNP, the upper-level divergence to the north of the weakened WP_TEJ is weaker than the observation. This leads to weaker upward motion (VV) and a largely underestimated 600-hPa RH, primarily contributing to its negative GPI bias. However, for the East region of the WNP, there exists an overestimated easterly wind component in the northeast of the WP_TEJ entrance region, leading to a southerly ageostrophic wind component further north. Together with the northerly ageostrophic wind from the weaker WP_TEJ, it creates an area of slightly stronger upper-level divergence as a consequence of the overestimated low-level vorticity (AVOR) and mid-level vertical velocity (VV). Still, these positive contributions for TC genesis are largely offset by the negative contributions of a grossly underestimated RH, leading to a small negative GPI bias. That is, in MRI-AGCM3-2-S, the underestimated 600-hPa RH contributes the most to the negative bias of GPI for both the West and East regions of the WNP, with the secondary contribution coming from the slightly overestimated VWS for the West region. Therefore, the simulation bias of the WP_TEJ intensity strongly links the bias of these key large-scale environmental factors identified in GPI analysis, which is crucial in modulating the simulation of TCGF climatological distribution over the WNP.
-
Although two models demonstrate a reasonable ability to simulate the interannual variation of WNP TCGF in Fig. 2, the amplitude of the interannual variability is obviously overestimated, especially for FGOALS-f3-H, which is also found in Li et al. (2021). The following section examines the simulation of WP_TEJ intensity and its role in contributing toward the biases in the interannual variability of TCGF over the WNP. Figure 10 first shows the interannual variations of WNP TCGF anomaly and the WP_TEJ index in the observations and further compares the interannual variation of the simulated WP_TEJ index and its correlation with pointwise GPI over the WNP from two AGCMs against the observation averaged over JASO from 1985 to 2014. The WP_TEJ intensity index is defined by the negative value of 150-hPa zonal wind anomaly averaged over (0°–10°N, 110°–150°E) followed by Zhan et al. (2022). It clearly shows that in the observations, the interannual variability of the WNP TCGF is highly correlated with the change of WP_TEJ intensity, as evidenced by a correlation coefficient of 0.66. Both models well-simulate the observed interannual variability of the WP_TEJ index, and the correlation coefficients (0.51 for FGOALS-f3-H and 0.60 for MRI_AGCM3-2-S) can largely explaining their comparable model performance in simulating the interannual variability of WNP TCGF. In observations, significant regional differences are found in the correlations of interannual variability between the WP_TEJ intensity index and the TCGF-related GPI. The two models basically capture the strong positive (negative) dependence of GPI on the WP_TEJ intensity over the WNP east (west) of 140°E.

Figure 10. (a) The comparison of the interannual variation of TCGF anomaly in CMA_BST and the WP_TEJ index derived from ERA5; (b) the WP_TEJ index from ERA5 and two high-resolution AGCMs (FGOALS-f3-H and MRI-AGCM3-2-S) during JASO from 1985 to 2014. The strong and weak years selected for the following composite analyses are denoted by red and green lines, respectively; (c) the geographical distribution of correlation coefficients for the interannual variation of the WP_TEJ index and GPI, the dotted areas indicate areas where the correlation coefficients are statistically significant at the 95% confidence level based on a Student’s t-test.
As suggested by Zhan et al. (2022), the composite difference in WNP TCGF between the strong and weak WP_TEJ years correspond well with the GPI anomalies, which are mainly attributed to the anomalies of the midlevel vertical velocity and the low-level vorticity. We select three strong WP_TEJ years (1985, 1994, 2009) and three weak WP_TEJ years (1988, 1998, 2010) from Fig. 10b and fully compare their composite differences in the simulated 150-hPa WP_TEJ and associated middle and lower tropospheric conditions. The most important factors, consisting of the 500-hPa vertical velocity and 850-hPa vorticity anomalies, are shown in Fig. 11. Generally, both models capture the characteristic that when the WP_TEJ is strong (weak), the corresponding WPSH is weak (strong) and the low-level monsoon trough is strong (weak), resulting in high (low) TCGF. However, FGOALS-f3-H overestimates the WP_TEJ intensity, regardless of the strong or weak years, and the corresponding WPSH is systematically weaker than the observation, resulting in a systematically higher TCGF. In contrast, MRI-AGCM3-2-S mainly underestimates the WP_TEJ intensity in strong years and consequently produces a weaker WPSH and monsoon trough, resulting in lower TCGF. On the other hand, both models overestimate the composite difference between strong and weak WP_TEJ years in simulating the upper-level divergence to the north of WP_TEJ as well as the associated mid-level upward motion and low-level vorticity, thereby contributing to their overestimated amplitude of the interannual variability of the WNP TCGF. Furthermore, the composite difference of these key factors between the strong and weak WP_TEJ years by FGOALS-f3-H is larger than that by MRI-AGCM3-2-S, explaining its larger interannual anomalies of TCGF over the WNP.
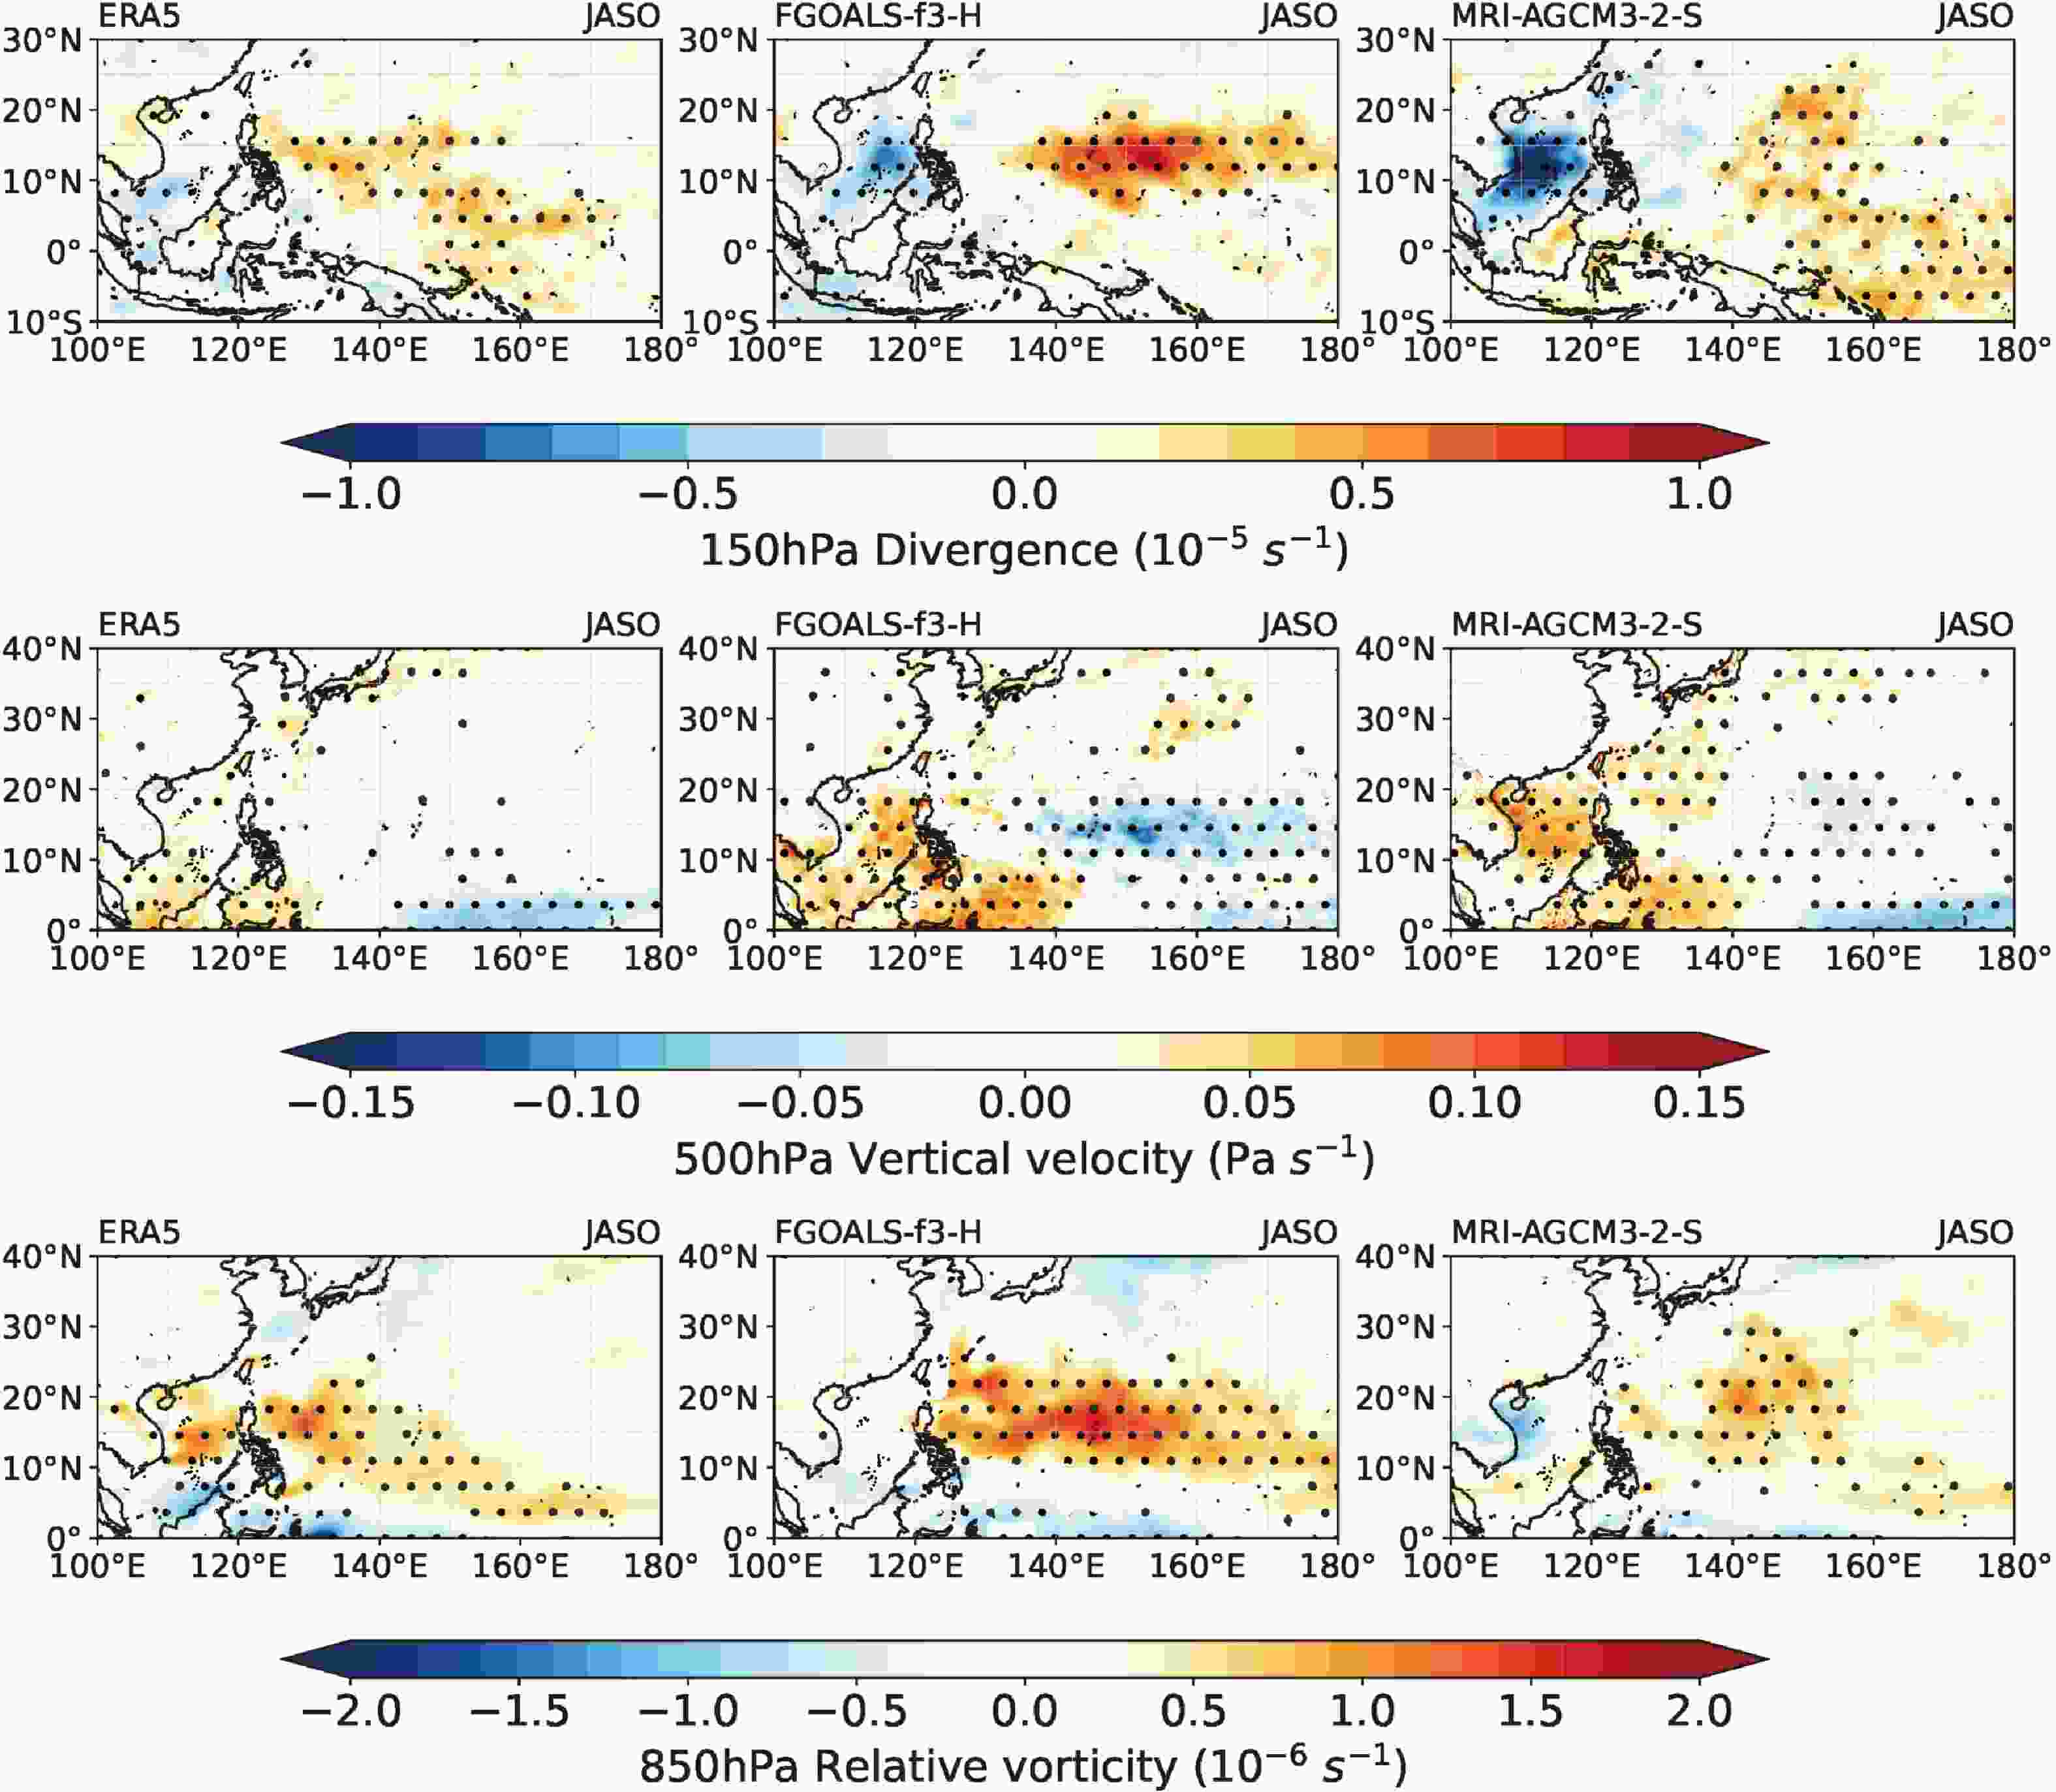
Figure 11. Composite differences of 150-hPa divergence (10–5 s–1), 500-hPa vertical velocity (Pa s–1), and 850-hPa relative vorticity (10–6 s–1) between the strong and weak WP_TEJ years during JASO of 1985 to 2014 from the ERA5 reanalysis and two high-resolution AGCMs (FGOALS-f3-H and MRI-AGCM3-2-S). The dotted areas indicate areas where the positive (negative) difference is statistically significant at the 95% confidence level based on a Student’s t-test.
-
In this study, the atmosphere-only HighResMIP simulations from FGOALS-f3-H (~25 km) and MRI-AGCM3-2-S (~20 km) are fully compared using a unified TC tracking algorithm of TempestExtremes, with respect to the TC climatological characteristics (genesis, frequency, track, intensity, thermodynamic structures, and precipitation) and seasonal-interannual variations of TC genesis frequency (TCGF) over the WNP during the peak season of July–October. The focus is on investigating the simulation of the Western Pacific Tropical Easterly Jet (WP_TEJ) and its role in modulating the simulation biases of the WNP TCGF climatological distribution and interannual variability based on the GPI analysis. The main conclusions are as follows.
First, both models essentially capture the main TC genesis locations over the South China Sea and the southern WNP, as well as the TCF maximum to the northeast of the Philippines but systematically underestimate the TCGF and TCF over the southwestern WNP. The main difference appears over the northeastern WNP, where FGOALS-f3-H largely overestimates the TCGF and TCF, with a greater track density of typhoons (TY and STY) moving northward, while MRI-AGCM3-2-S severely underestimates the TCGF but slightly overestimates the TCF due to the higher track density of stronger TCs (STY and SSTY) with northward-recurving paths. The distribution of GPI and TCGF has a strong correspondence, and the GPI bias contribution analysis shows that the common negative bias of TCGF in the southwestern WNP (West region) is mainly due to the lower RH and stronger VWS. However, in the northeastern WNP (East region), the positive bias of TCGF for FGOALS-f3-H is due to the overestimation of AVOR, RH, and VV, while the negative bias of TCGF for MRI-AGCM3-2-S is primarily due to the lower RH.
Second, the two models differ in simulating the seasonal-interannual variations of TCGF over the WNP. FGOALS-f3-H more realistically captures the peak season from July to October but systematically overestimates the TC numbers. However, MRI-AGCM3-2-S tends to produce a one-month delayed peak with underestimated TC numbers. On the other hand, they exhibit comparable capability in simulating the interannual variability of WNP TCGF, although FGOALS-f3-H shows relatively larger interannual anomalies.
Third, the simulation bias of WP_TEJ intensity strongly links the bias of key large-scale environmental factors identified in GPI analysis, which is crucial in modulating the simulation bias of TCGF climatological distribution over the WNP. The WP_TEJ simulated by FGOALS-f3-H is stronger and extends further eastward, which generates stronger upper-level divergence and enhanced vertical circulation to the north of its entrance region. Accompanied by a stronger low-level monsoon trough, middle-level upward motion, and relative humidity, it well-explains the positive GPI and TCGF bias of FGOALS-f3-H in the East region. However, MRI-AGCM3-2-S simulates a much weaker WP_TEJ, leading to a weaker vertical circulation to the north of the entrance region. Accompanied by smaller middle-level upward motion and lower relative humidity, this explains its negative GPI and TCGF bias in both the East and West regions.
Fourth, the two models well simulate the observed interannual variability of the WP_TEJ index, largely explaining their comparable model performance in simulating the interannual variability of the WNP TCGF. However, both models overestimate the composite difference between strong and weak WP_TEJ years in three ways: (1) upper-level divergence to the north of the WP_TEJ, (2) middle-level upward motion, and (3) low-level vorticity. These factors lead to overestimated amplitudes of the interannual variability of WNP TCGF in both models. Moreover, FGOALS-f3-H overestimates the differences among these factors to a greater degree than MRI-AGCM3-2-S. It thus produces a much larger interannual anomaly of TCGF, which is consistent with the results by Li et al. (2021). Consequently, optimizing the simulation of the WP_TEJ could be the focus of future model development to improve TCGF simulations over the WNP.
We further note that the WP_TEJ is a byproduct of the zonally symmetric meridional differential heating between the heat source of the Tibetan plateau and the cooler Indian Ocean, and the variation of its intensity is affected by divergent tropical circulations that include both the Hadley and Walker circulations (Zhan et al., 2022). Therefore, the simulated bias of the WP_TEJ is regulated by oceanic factors and atmospheric circulations, which can be further examined in atmosphere–ocean coupled experiments.
In addition, for the simulation of TC intensity, structure, and precipitation, the main difference between these two models is related to the intense TCs (STYs and SSTYs). Generally, MRI-AGCM3-2-S simulates a more compact inner-core wind structure, a stronger warm-core anomaly, and a more symmetrical distribution of extreme precipitation than FGOALS-f3-H. However, FGOALS-f3-H shows superiority over MRI-AGCM3-2-S in simulating the total TC precipitation distribution over the WNP. In particular, FGOALS-f3-H tends to underestimate the WPR and the proportion of SSTYs, while MRI-AGCM3-2-S better simulates the WPR but overestimates the proportion of SSTYs. This advantage of MRI-AGCM3-2-S in generating extremely intense TCs is more likely attributed to its use of the Yoshimura cumulus scheme, which combines the Arakawa-Schubert and Tiedtke cumulus schemes with the inclusion of turbulent entrainment/detrainment treatment (Mizuta et al., 2012).
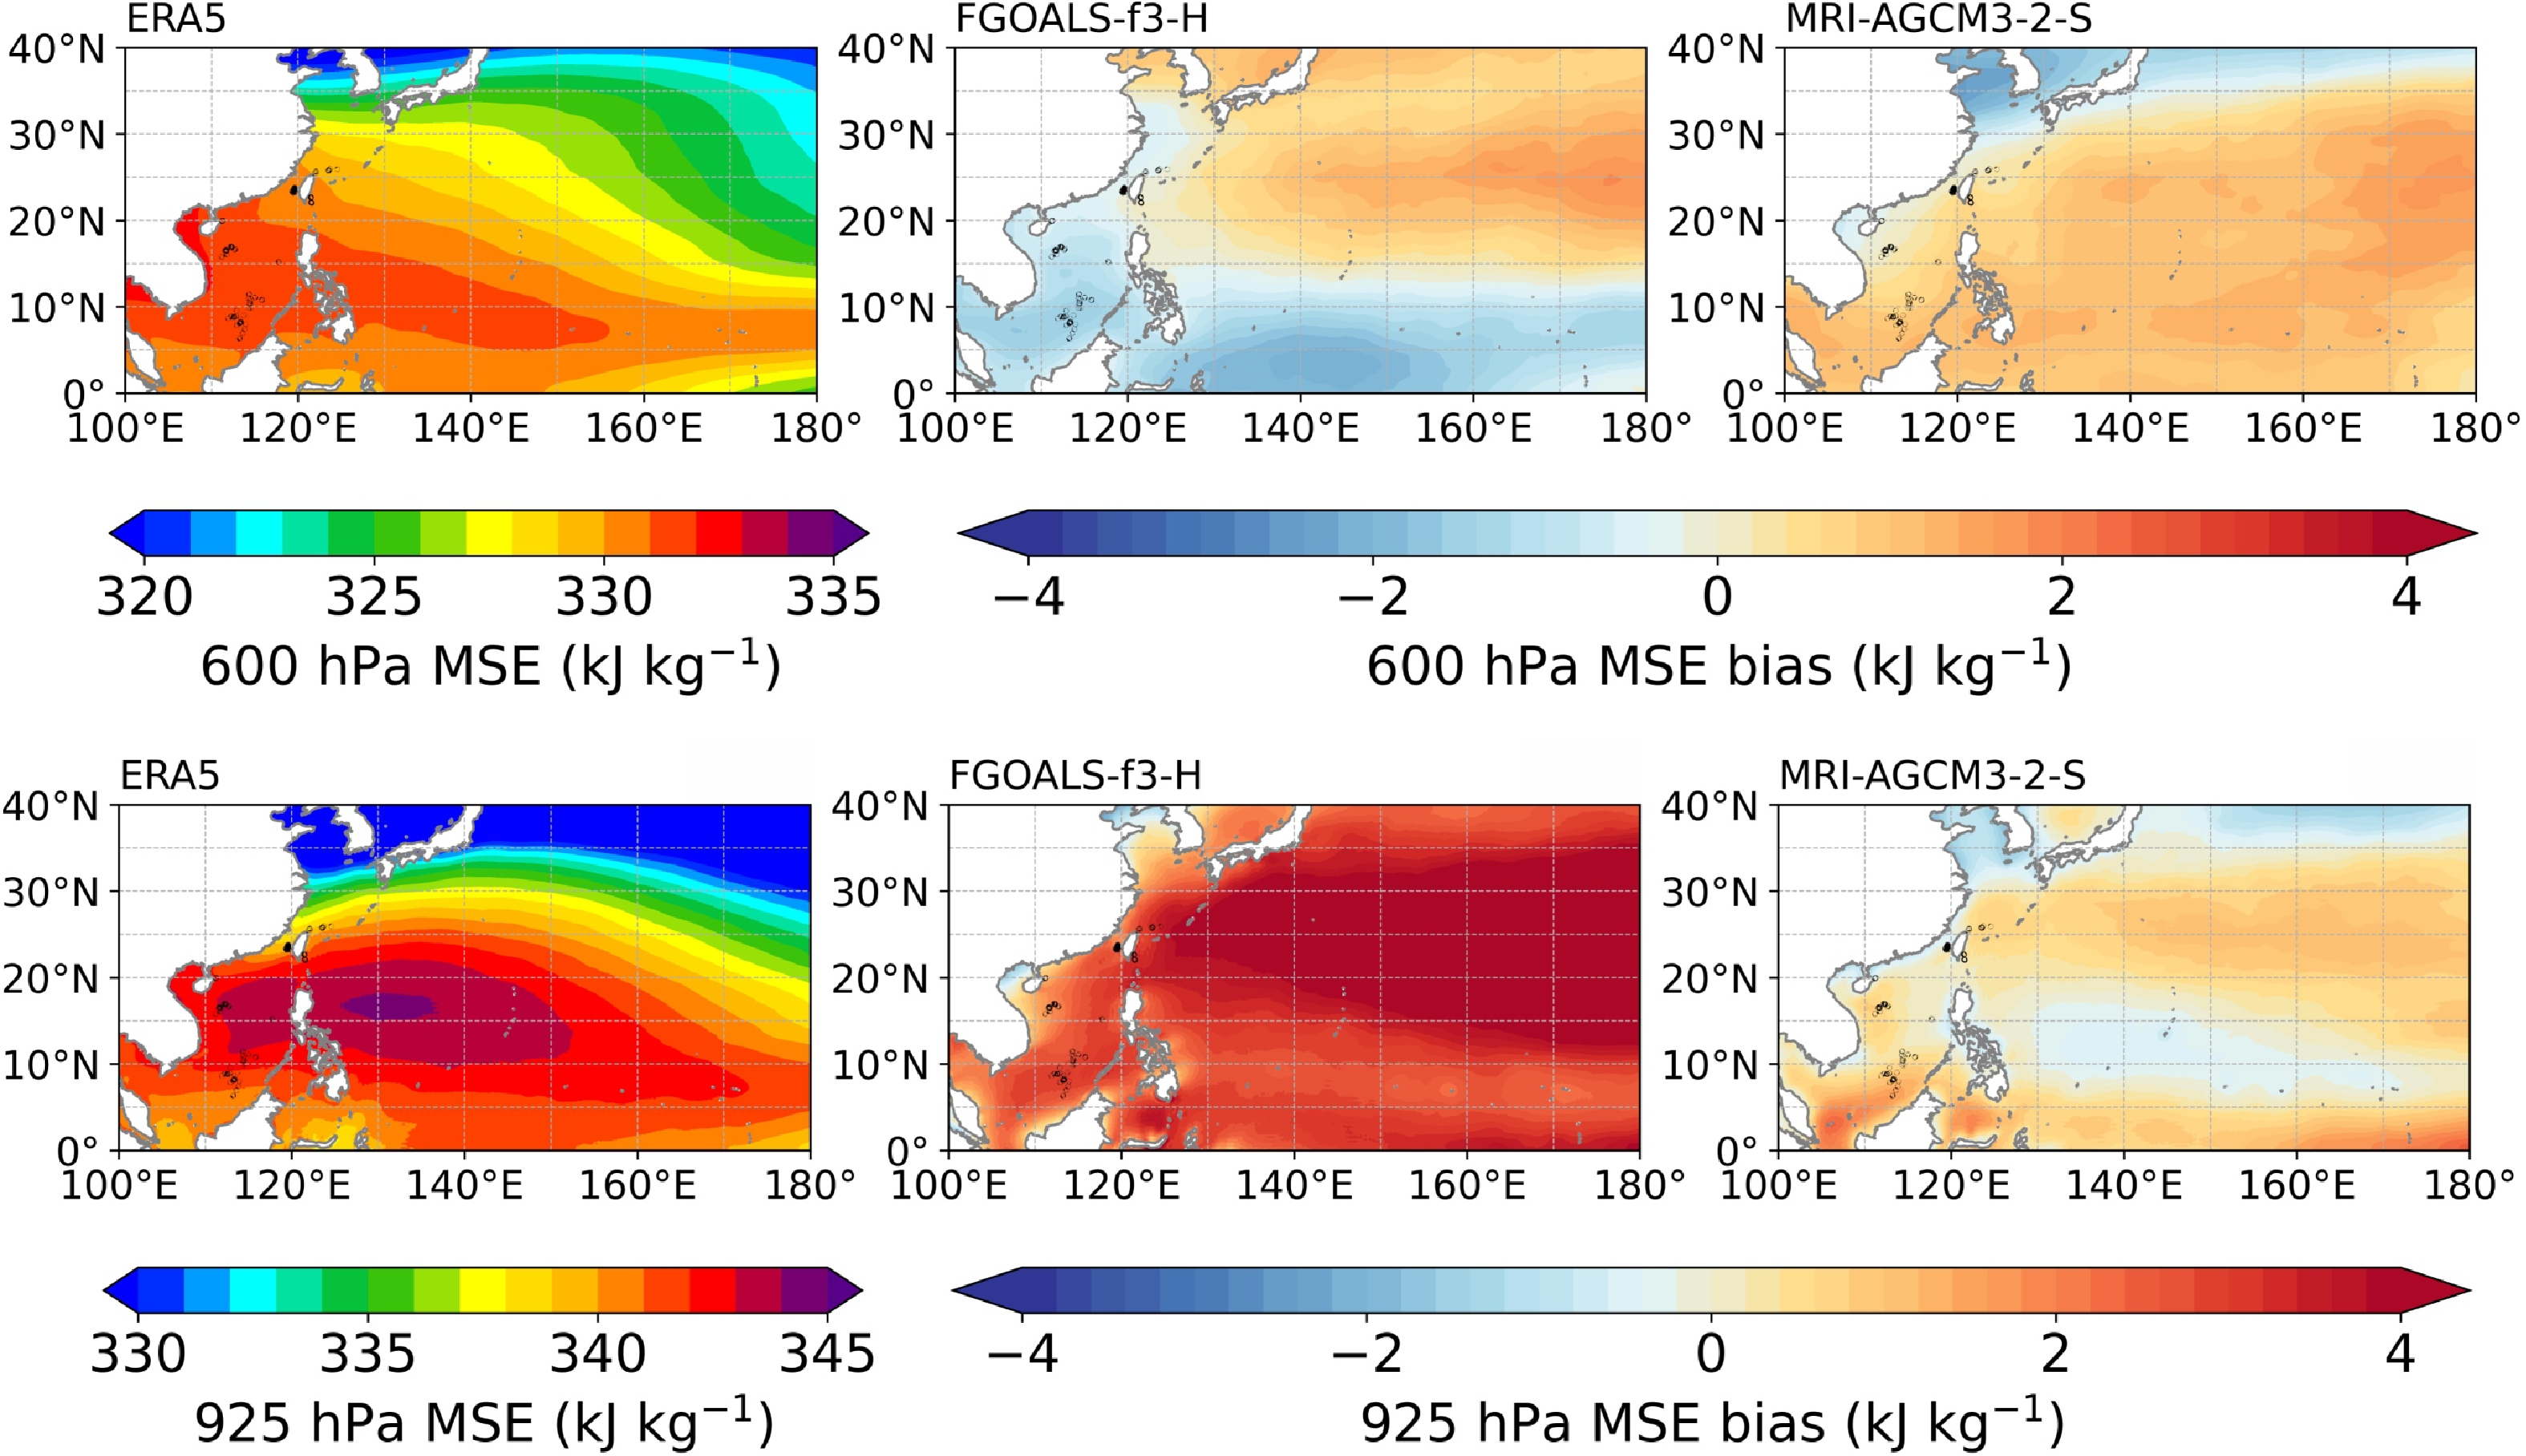
Figure 12 compares the distribution of moist static energy (MSE) at low levels (925 hPa) and at middle levels (600 hPa) to explore the difference in convective energy and atmospheric instability that affect the TC generation and intensity in both models. In FGOALS-f3-H, the 925-hPa MSE is systematically overestimated over the entire WNP, corresponding to its higher TCGF. However, the MSE decreases too quickly in the vertical direction, and the 600-hPa MSE even shows a large area of negative bias south of 20°N, implying that the convective unstable energy is released too rapidly, which is not conducive to the generation of the most intense TCs. However, in MRI- AGCM3-2-S, the 925-hPa MSE is underestimated over the southwest WNP, corresponding to its lower TCGF; however, the MSE decreases slowly with increasing height, implying that the convective unstable energy tends to be maintained, allowing for convection to become more easily to be organized into strong TCs. As such, properly representing the extremely intense TCs for FGOALS-f3-H would require further improvement to its convective parameterization.

Figure 12. Climatology distribution of the observed (ERA5) and the simulated biases of 600-hPa and 925-hPa moist static energy (MSE, KJ kg−1) averaged from 1985 to 2014 during JASO from two high-resolution AGCMs (FGOALS-f3-H and MRI-AGCM3-2-S).
Besides, air-sea interaction are also a key factor affecting the simulation of TC intensity (Mei et al., 2015; Zarzycki, 2016). Recent studies have particularly examined the changes in intense TCs (Category 4 and 5) over the WNP, such as Zhao et al. (2014) and Wu et al. (2018). Their results suggest that the change of TC tracks and the accompanied large-scale environment, such as the oceanic mixing layer, SST, and vertical wind shear, could largely alter the frequency of intense TCs on the inter-annual-to-inter-decadal time scales. Our current study is limited to the evaluation of model performance in simulating the proportion of different TC intensities; therefore, the atmosphere-ocean coupling experiments can also be used to explore the possible contributions of these atmospheric and oceanic factors to the simulation of TC intensity changes.
Acknowledgements. This study is supported by the Strategic Priority Research Program of the Chinese Academy of Sciences (Grant No. XDA19060102), Shanghai 2021 “Scientific and technological innovation action plan” Natural Science Foundation (Grant No. 21ZR1420400), National Natural Science Foundation of China (Grant No. 91958201), International Partnership Program of Chinese Academy of Sciences Grant 183311KYSB20200015, and the National Natural Science Foundation for Young Scientist of China (Grant No. 41605079). The model simulation output of CMIP6 can be accessed freely by the Earth System Grid Federation (ESGF), including six-hourly, daily, and monthly datasets. The DOI for CMIP6.HighResMIP.CAS.FGOALS-f3-H.highresSST-present is
http://doi.org/10.22033/ESGF/CMIP6.3312 (Bao and He, 2019), and for CMIP6.HighResMIP.MRI.MRI-AGCM3-2-S.highresSST-present is http://doi:10.22033/ESGF/CMIP6.1625 (Mizuta et al., 2019). The IBTrACS dataset (v03r04) was downloaded fromhttps://www.ncdc.noaa.gov/ibtracs/ . The ERA5 reanalysis dataset was downloaded fromhttps://cds.climate.copernicus.eu/ . The GPM IMERG L3 V06 data were downloaded fromhttps://disc.gsfc.nasa.gov/ . The source code for the tropical cyclone track-detecting framework, TempestExtremes, was downloaded fromhttps://github.com/ClimateGlobalChange/tempestextremes . We acknowledge the High-Performance Computing Center of Nanjing University of Information Science & Technology and the ECNU Multifunctional Platform for Innovation 001 facilities for supporting this work.
| FGOALS-f3-H | MRI-AGCM3-2-S | |
| 850-hPa wind speed (m s–1) | ≥ 15.4 | ≥ 10 |
| Absolute vorticity at 850 hPa (s–1) | ≥ 3.5×10⁻⁵ | − |
| Relative vorticity at 850 hPa (s–1) | − | ≥ 2.0×10⁻⁵ |
| Average temperature deviations between 300 and 500 hPa (K) | ≥ 1 | − |
| Sum of the temperature deviations at 300, 500, and 700 hPa (K) | − | ≥ 1 |
| Lifetime | ≥ 72 h | ≥ 72 h |


 AAS Website
 AAS WeChat