


 DownLoad:


-
Precise and timely rainfall measurements with high spatial and temporal resolutions play a significant role in many fields, such as weather monitoring and prediction, natural disaster warning, and water resource management (Berne et al., 2004; Gosset et al., 2016; Fencl et al., 2017; Zhang and Zhou, 2020). Since regional rainfall distribution varies significantly with spatial and temporal factors (Schleiss et al., 2011), existing rain gauges, weather radars, and satellites are not sufficient for the growing demands of regional rainfall monitoring with higher resolution, especially in densely populated urban areas or mountainous areas with complex terrain. While rain gauges can accurately measure the rainfall rate at a given point, and many gauge/disdrometer networks have been built, the complex spatiotemporal distribution of precipitation cannot be monitored effectively (Wang et al., 2019). Weather radar can obtain rainfall distribution at a large scale, but the quantitative precipitation estimation (QPE) has large uncertainties due to an unstable Z-R relationship, rain attenuation, and ground clutter (Zhao et al., 2019). Although dual-polarimetric weather radar can significantly improve QPE using dual-polarimetric variables (Chen et al., 2021), near-surface rainfall is still difficult to monitor accurately due to the influence of ground clutter. Satellites such as TRMM and GPM can obtain global rainfall, but these products often have a lower spatial and/or temporal resolution than weather radar (Hou et al., 2014). Although many scholars and engineers have attempted to improve regional rainfall monitoring with a high spatial and temporal resolution, a wide gap exists between the existing tools and the high need for public services, especially in basins and urban areas. For example, twenty-one people were killed by extreme weather during an ultramarathon in Gansu Province, China, on 22 May 2021 (Zhang et al., 2021). A super heavy rainfall event caused massive flooding and loss of life in Henan Province, China, during 17–22 July 2021, which was characterized by a long-duration rainfall event with excessive hourly rainfall rates that yielded extreme accumulation (Luo et al., 2023). Thus, the ability to monitor regional weather urgently needs to be improved.
With the worldwide development and popularization of wireless communications, an opportunistic method that uses commercial microwave links (CMLs) from operational telecommunication systems or cellular communication networks to measure rainfall was proposed by Messer et al. (2006). The microwave signals between the microwave towers are attenuated by the hydrometeors along their propagation paths, and the signal attenuation is related to the rainfall intensity (typically referred to as the rain rate). The signal attenuation can be calculated according to the transmitted power and received signal level (RSL), which can be recorded easily by telecommunications operators. For a single line of sight (LOS) CML, the path-average rain rate can be inverted according to the empirical relationship of attenuation and rain rate (the A-R relationship) (Atlas and Ulbrich, 1977). Compared with the random variation of rain rate and corresponding attenuation values, the other-than-rain attenuation changes very slowly with time under most conditions (fog, haze, aerosol, humidity, water vapor, and gases or is relatively constant during a short time at the beginning or end of one rainfall event (Wet Antenna effect) (Schleiss et al., 2013). The lower attenuation values in a certain interval that are classified as a clear period can be used to estimate the baseline attenuation during the rainy period (Leijnse et al., 2007a). Considering that only the minimum and the maximum values of the TSL and the RSL are recorded by most commercial network management systems at 15-min intervals (Chwala et al., 2016), the minimal attenuation of a certain time interval (31 min for the 71–76 GHz E-band CML, 15 min for the 28–38 GHz K-band CML) was used to dynamically determine the baseline (Ostrometzky and Messer, 2018). In addition, a moving median of total attenuation with a centered window (one week) over hourly intervals was used to estimate the baseline of an E-band CML (Fencl et al., 2020).
Recently, several scholars have attempted to invert more refined precipitation information using CMLs with different frequencies or polarizations, such as the path-average raindrop size distribution (Song et al., 2019) and the identification of precipitation particles (Ostrometzky et al., 2015; Pu et al., 2020c) and rainfall types (Pu et al., 2020b). This approach has shown potential in detecting more precipitation information; however, non-negligible problems still exist that limit its actual application, such as the quantization and stability of the baseline (van Leth et al., 2020), which require more in-depth study in the future.
For CML networks, the 2-dimensional rainfall field can be inverted using interpolation methods (Overeem et al., 2016), tomographic algorithms (D’Amico et al., 2016), variational approaches (Bianchi et al., 2013), or stochastic approaches (Haese et al., 2017). Furthermore, Eshel et al. (2020) applied only an interpolation but incorporated an extended version that allows for redistributing rainfall rates along an ML. Liberman et al. (2014) introduced a method for merging radar, gauges, and MLs, based on which high-resolution rainfall measurement and mapping can be improved.
Since the first attempts in Israel (Messer et al., 2006), there have been numerous studies on rainfall measurements using CMLs in tens of countries from Asia, Europe, and Africa (Leijnse et al., 2007b; Overeem et al., 2013; Doumounia et al., 2014; Chwala and Kunstmann, 2019). Considering the benefits that the rapid growth and global coverage of microwave links have to offer, there is enormous potential to improve upon large-scale and high-resolution precipitation monitoring (Alpert et al., 2016) and prediction (Tollefson, 2017), which can be used to supplement the existing precipitation measurement tools effectively. Israel (Zinevich et al., 2008), the Netherlands (Overeem et al., 2013), and Germany (Graf et al., 2020) have built country-wide CML networks for rainfall measurements incorporated with telecommunication operators. Most of the commercial microwave links from network management systems are provided as 15-minute data; therefore, the temporal resolution of rainfall inversion is only 15 min. The dedicated data acquisition of CMLs has an even finer temporal resolution of a minute or less.
Chinese scholars began their research on CML in 2010 (Liu et al., 2010). The methods and experiments of rainfall inversion using microwave links with different frequencies were investigated, and the microwave links included near-ground links with low frequencies (Song et al., 2020a) and high frequencies (He et al., 2019), along with Earth–space links within the Ku bands (Xian et al., 2020a, b). In addition, the characteristics of rain-induced attenuation of microwave links at frequency ranges of 25, 28, 38, 72, and 82 GHz were studied and used to retrieve the rainfall in Beijing (Han et al., 2019, 2020, 2021).
Since April 2019, a small CMLs network has been installed in Yuecheng town, Jiangyin city, Jiangsu Province, China. There are 8 links at 15 GHz and 23 GHz, which cover a small domain of approximately 3 km × 3 km. The classification of wet and dry periods (Song et al., 2020b) and real-time estimation of the path-averaged rain rate (Song et al., 2021) using CMLs were studied and validated. Sponsored by the Water Resources Department of Jiangsu Province and the National Natural Science Foundation of China, more CMLs were installed throughout Jiangyin city. The purpose of this paper is to present the first long-term rainfall monitoring experiment using a CML network in East China.
The remainder of this paper is organized as follows. The infrastructure and data are presented in section 2. Section 3 describes rainfall inversion methods based on CMLs. The results and a discussion of rainfall inversion are presented in section 4. Section 5 provides a summary and conclusions.
-
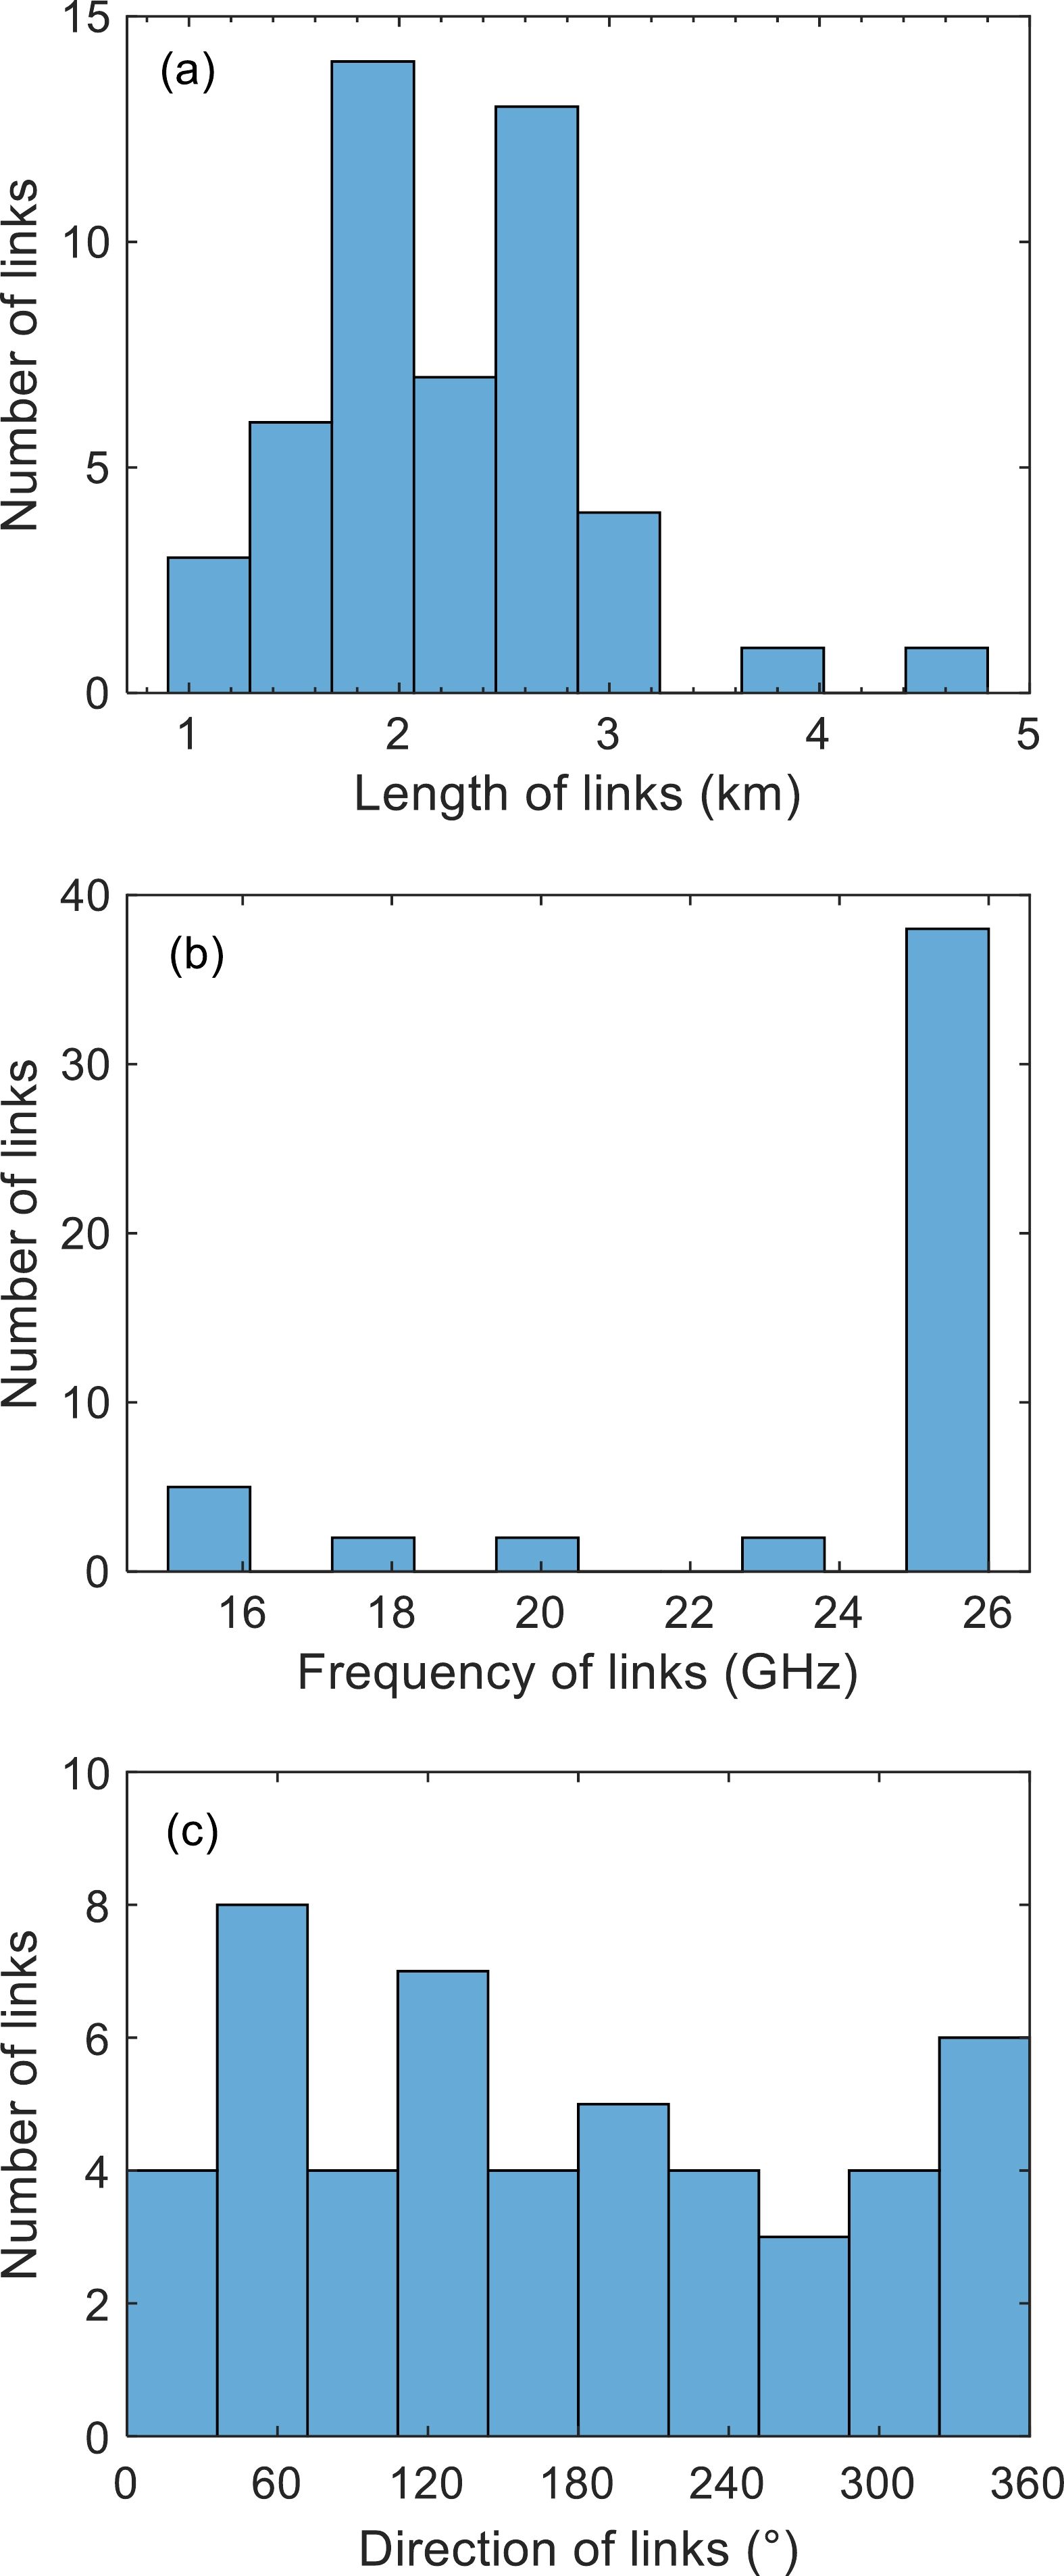
The CMLs network for rainfall monitoring is located in Jiangyin city, Jiangsu Province. The observation area covers 31.7°–32° N and 120°–120.4° E, as shown in Fig. 1. There are 49 links in the observation area, mainly distributed at the south bank of the Yangzi River and the Jiangyin section of National Expressway No. G2. The average length of all links is 2.20 km, in which most of the links have lengths between 1.5 km and 3 km, as shown in Fig. 2a; the shortest link is 1.14 km, and the longest is 4.78 km. Figure 2b shows the frequencies of the microwave links, which range from 15 GHz to 26 GHz. There are 38 links with 26 GHz, which are more sensitive to rain-induced attenuation. The direction of microwave links was distributed uniformly over all directions, as shown in Fig. 2c. There are slightly more links at 60° and 120° than in other directions, which may be related to the location of the base tower. The installed CMLs are dedicated not only for research but also for operational rainfall monitoring in the near future. Compared with rain gauges, the CMLs have better spatial representation, require little professional maintenance, and are often coincident with communications without much additional cost.
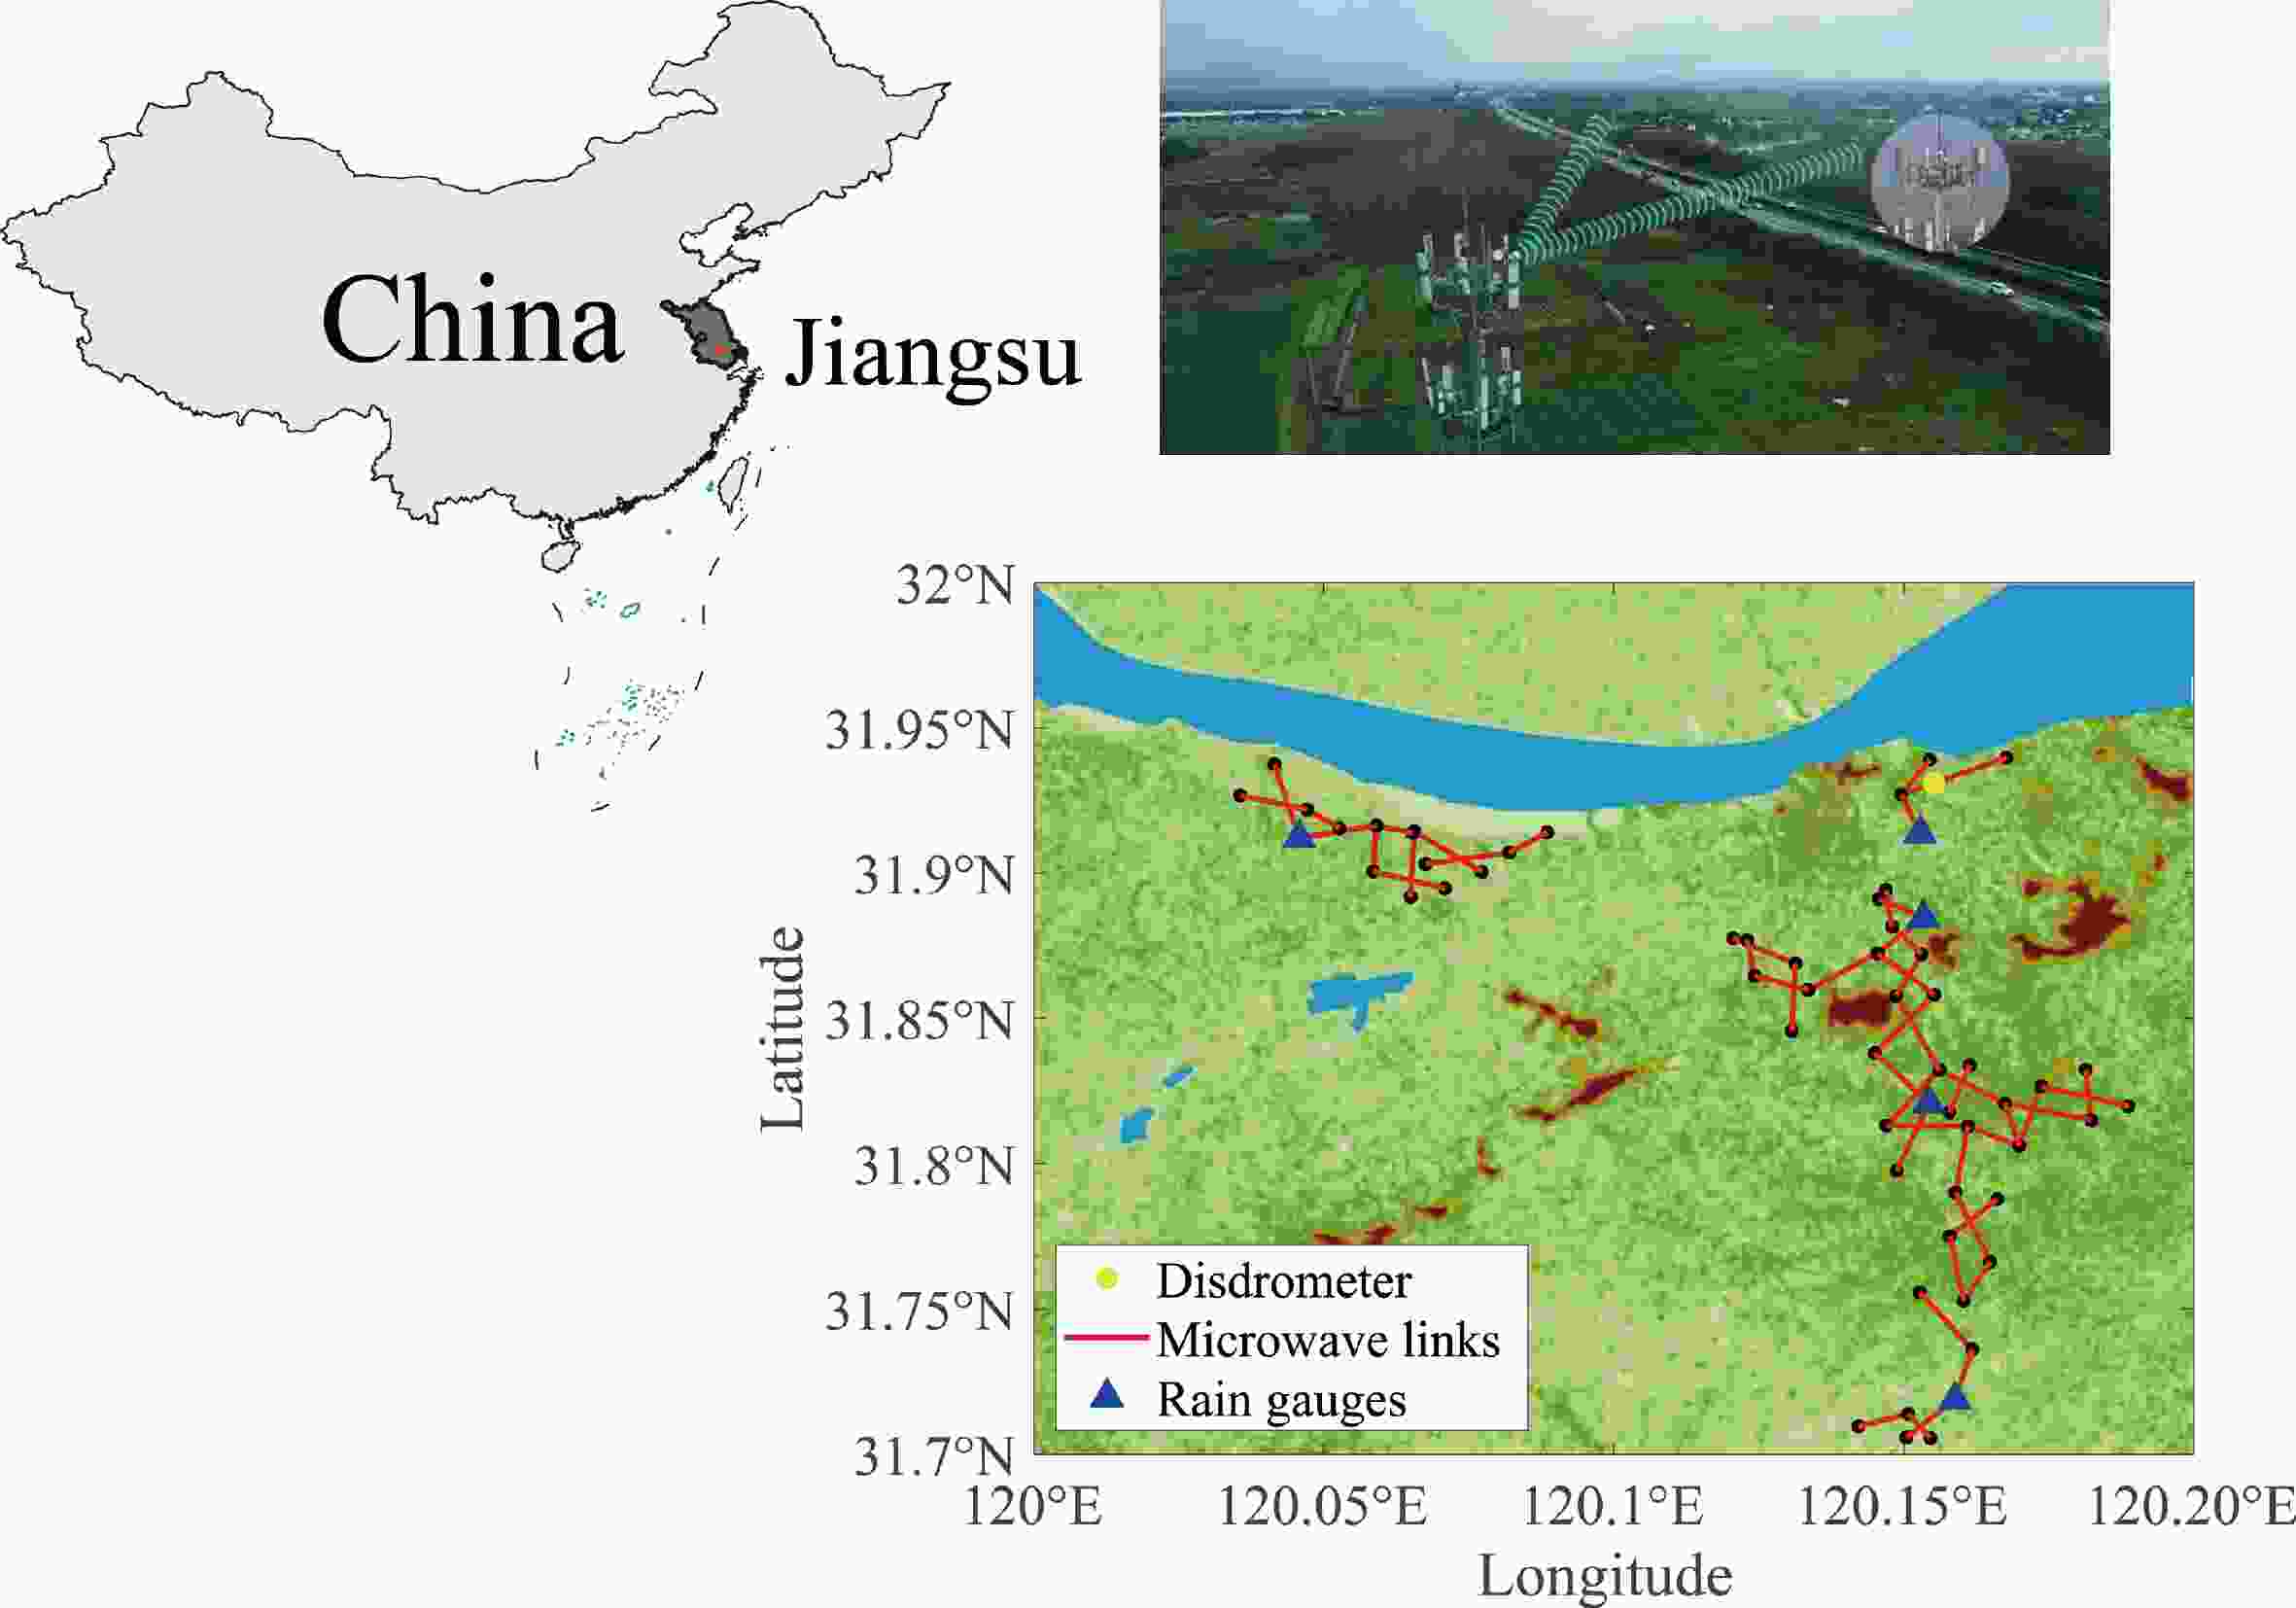
Figure 1. The Distribution of the Microwave Link Network

Figure 2. The parameter statistics of all microwave links: (a) the length of links; (b) the frequency of links; (c) the direction of links.
The microwave transmitters and receivers are installed at the top of a cellular tower that belongs to the China Mobile Communication Co., Ltd. The transmitting power of the microwave transmitter is 27 dBm, and the received signal level (RSL) of the microwave receiver is quantized to 0.1 dB and sampled once per minute; therefore, the time resolution of the RSL is 1 min.
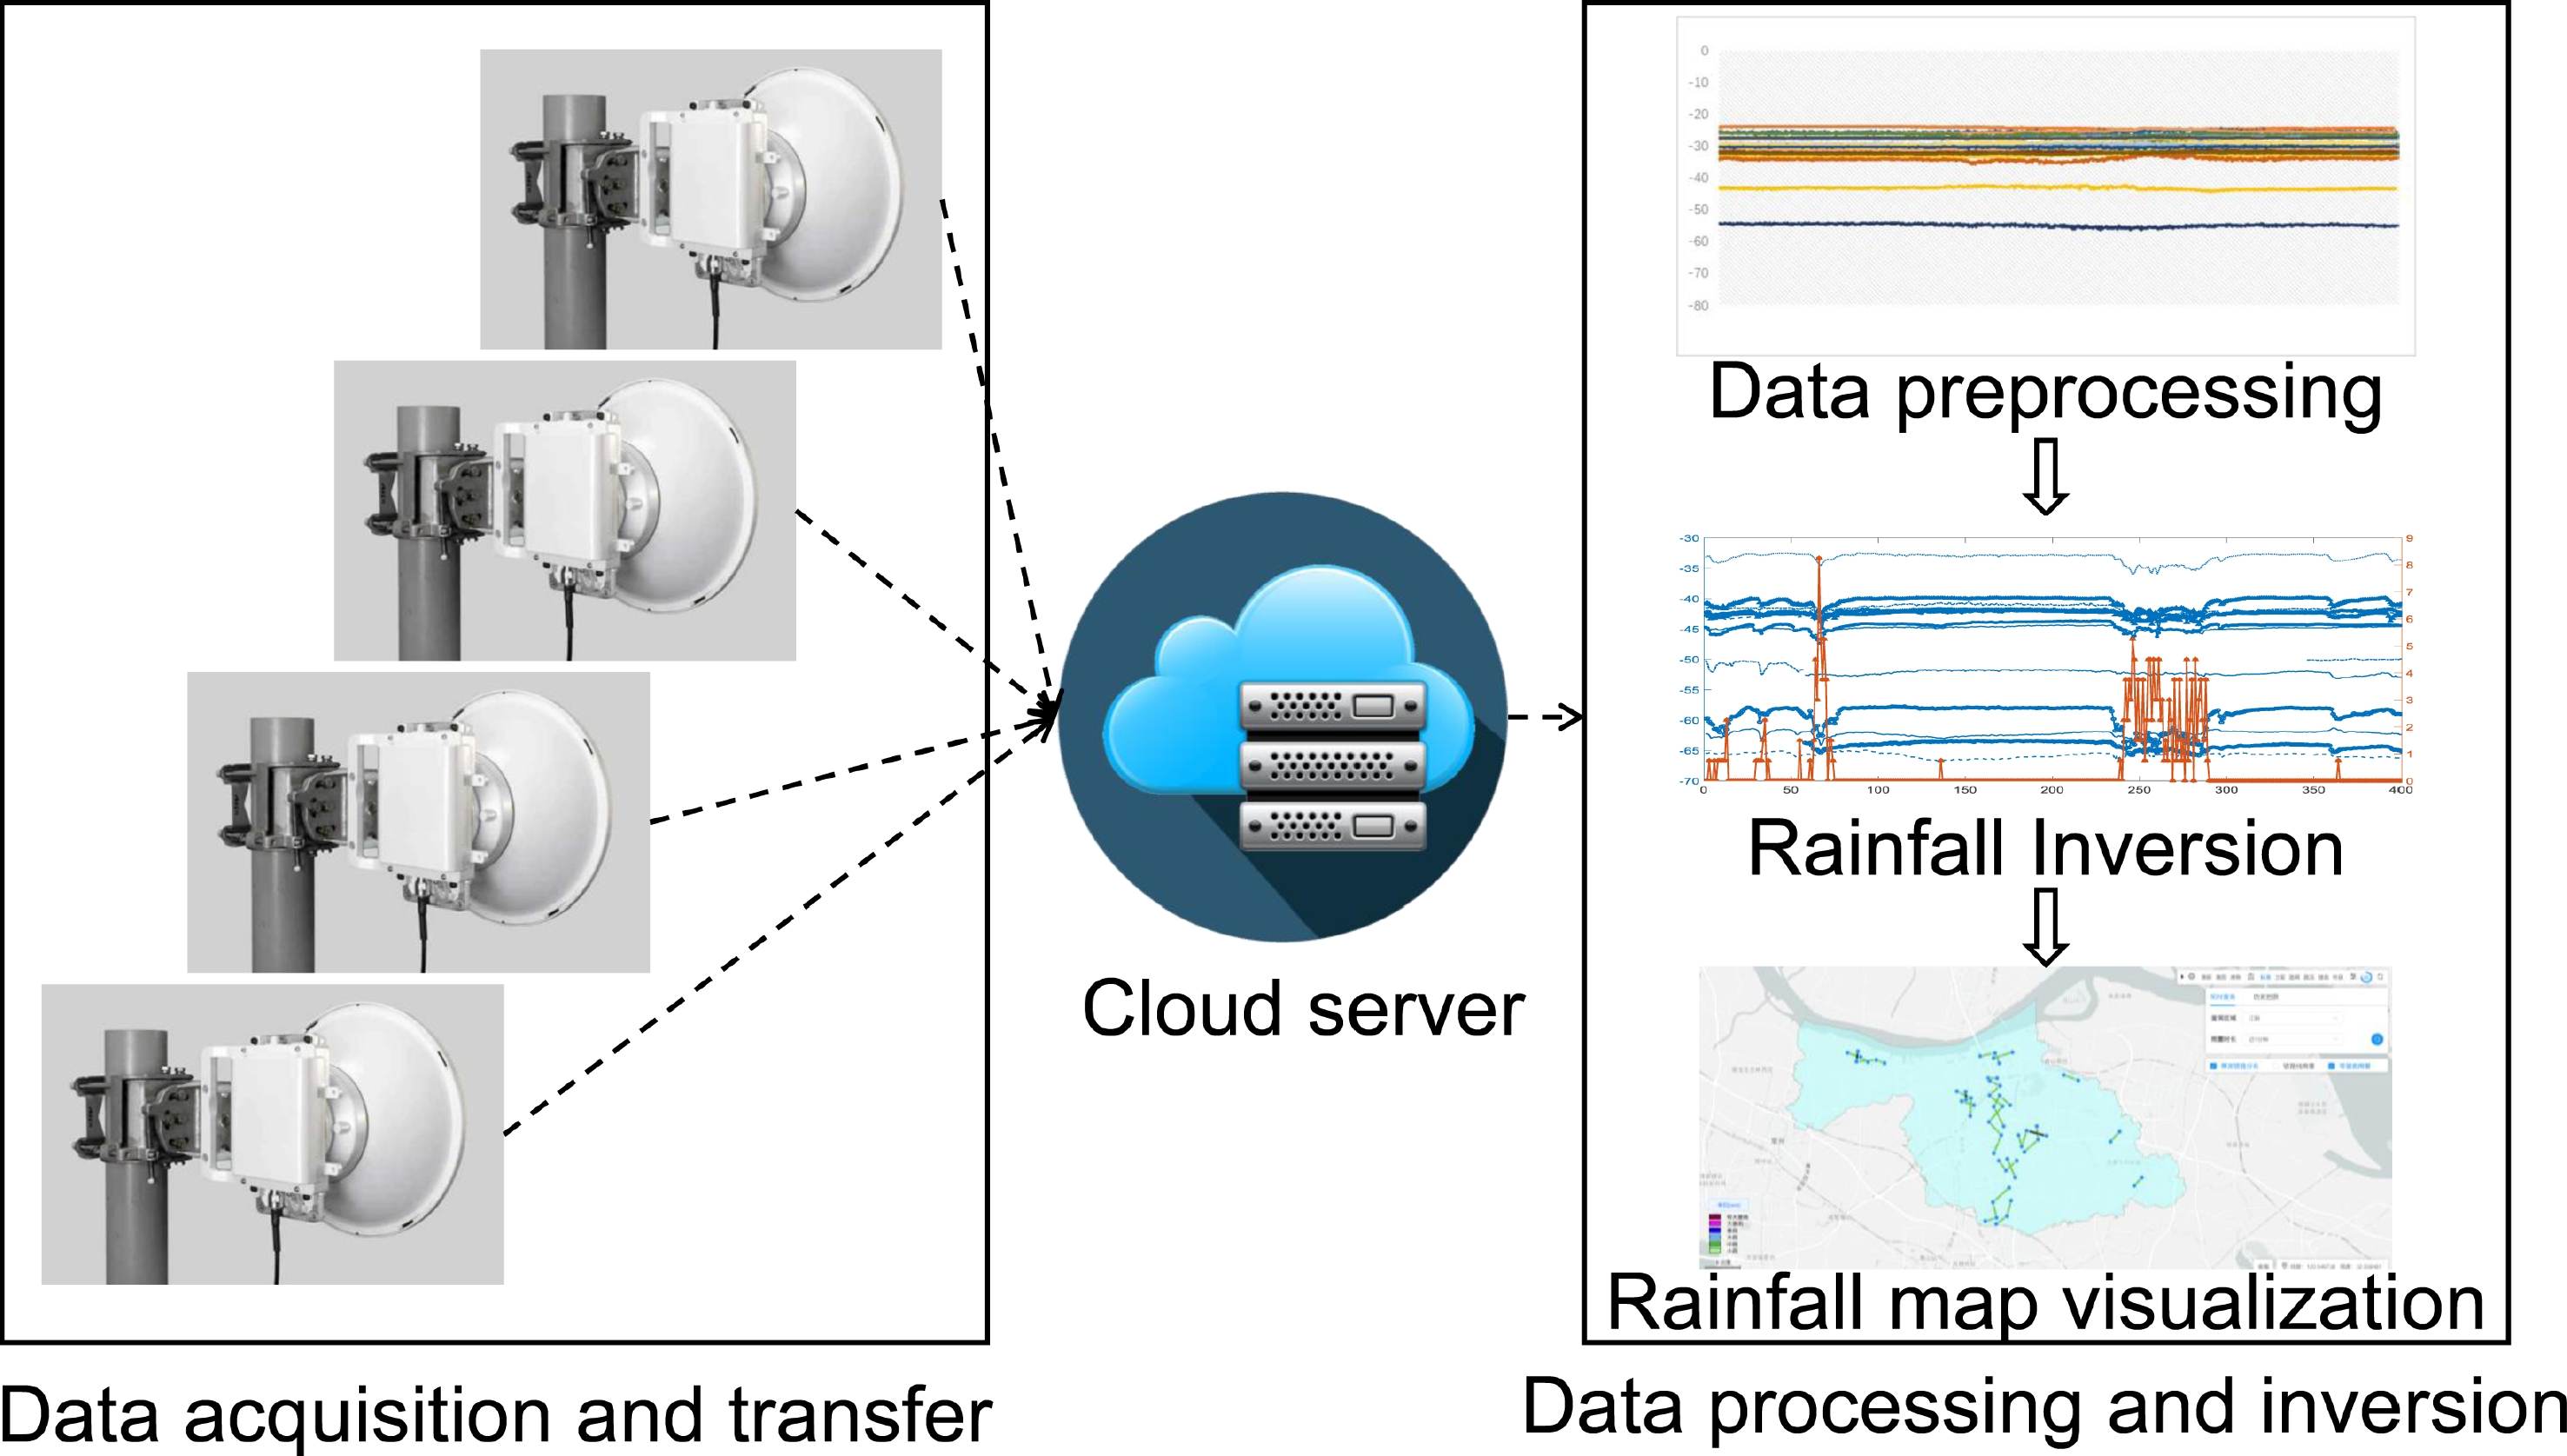
The data flow of the CML network is shown in Fig. 3, which runs in real time and is controlled by a cloud server. The data flow includes four parts:

Figure 3. Flowchart of CML data acquisition, transfer, processing, and inversion.
1. Data acquisition. The microwave frequency, time, coordinates (latitude and longitude), transmitting power, and RSL of each link are collected, packed, and transmitted to a cloud server in real-time.
2. Data processing. The CML data are sorted, processed, and stored in the database of the cloud server once per minute.
3. Rainfall Inversion. The CML data are inverted to the path-average rain rate and rainfall field by the software in the cloud server every minute.
4. Rainfall map visualization. The rainfall field is shown to the user by the website or smartphone app in real time.
-
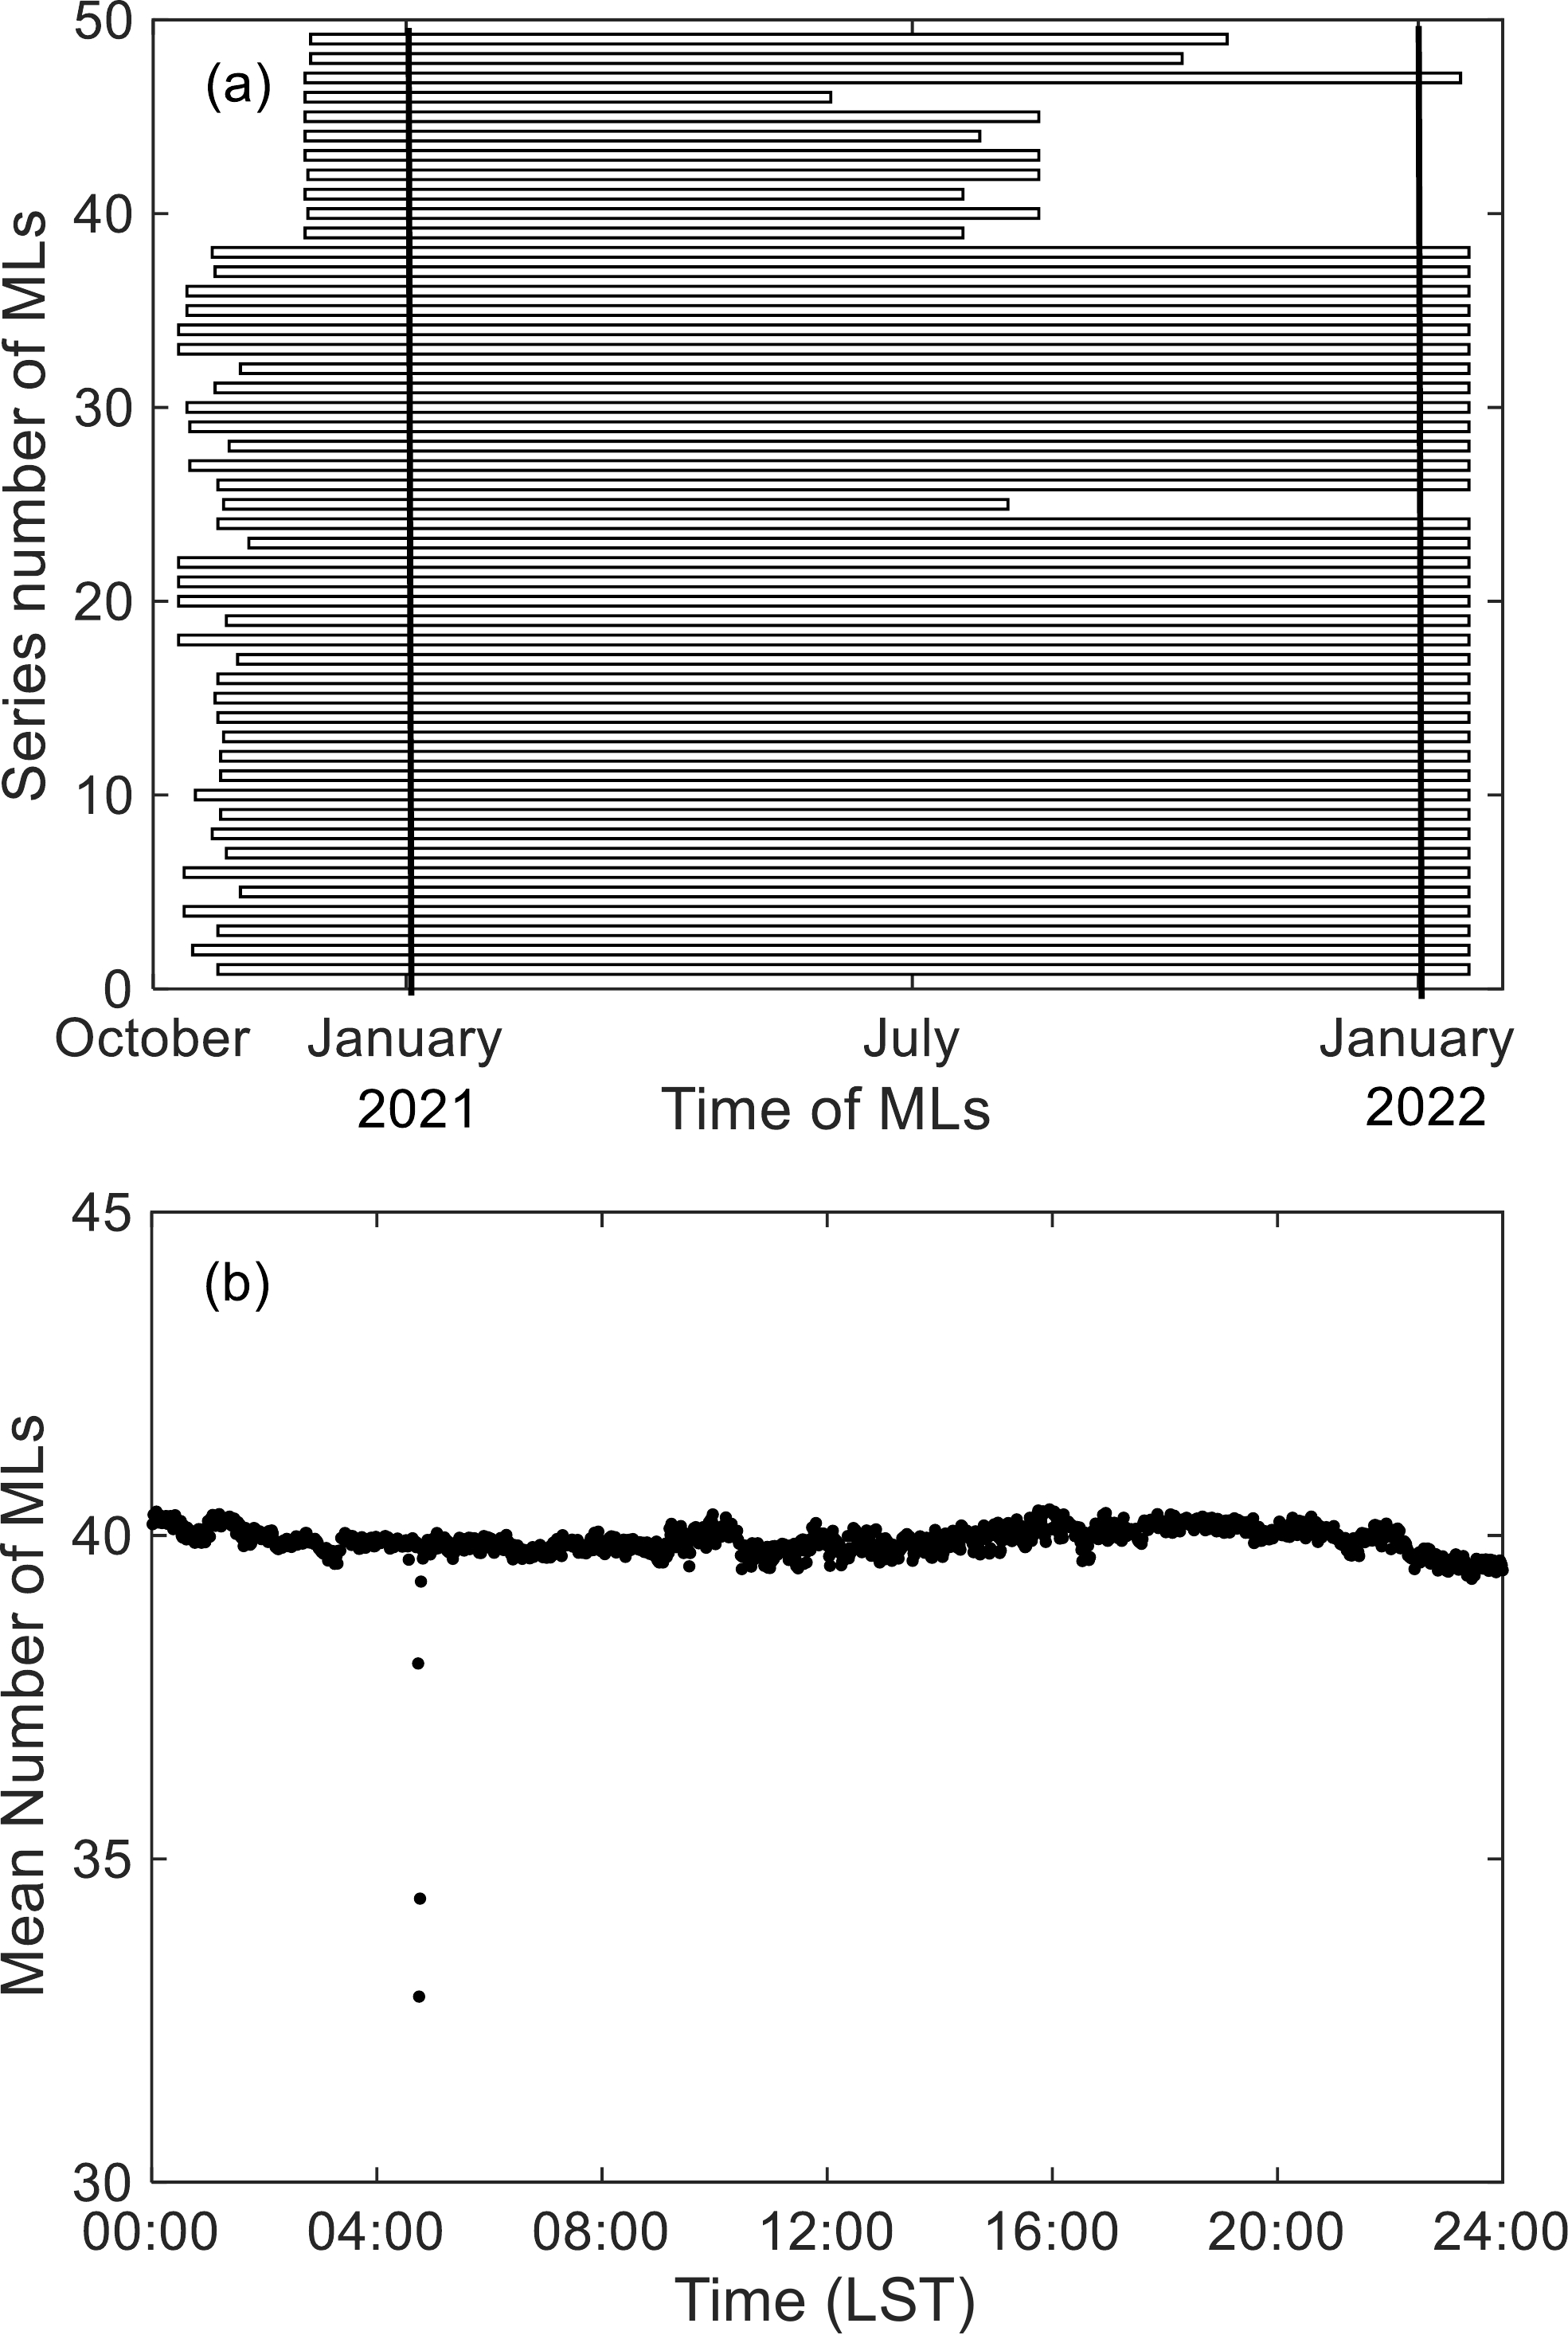
The CML network was initiated in October 2020, with 49 links that accessed the CMLs network, as shown in Fig. 4a. During the observations, several links were rejected or redeployed due to abnormal signal fluctuations or incomplete data, and there were 38 valid links until early January 2022. The average availability per minute of CMLs in one full day over the entire observation period is presented in Fig. 4b. Generally, there are about 40 links accessible, which varies very slightly with time. There are only a few minutes with fewer than 38 links, and the possible reasons are network renewal, adjustment, replacement, and data storage failure.

Figure 4. The data statistics of all microwave links: (a) start and end times of available CMLs; (b) average availability per minute of CMLs over the entire period.
-
One second-generation OTT PARSIVEL disdrometer (OTT) was installed at 31.9309°N, 120.3104°E as a reference, which is located on the propagation path of CML39. The OTT was placed approximately 1.8 m above the ground, and it was initiated on 1 February 2021. The OTT can simultaneously measure the size and fall velocity of precipitation particles (diameters between 0.2 and 25 mm, fall velocities between 0.2 and 20 m s–1) that pass through a laser light sheet (Löffler-Mang and Joss, 2000). The time interval of each drop size distribution (DSD) measurement is 1 min, based on which the rain rate and accumulation can be calculated with a temporal resolution of 1 min. A calibration was performed before the experiment, and a quality-control scheme was applied to remove raindrops with diameters exceeding 6 mm and divert them from the diameter–fall velocity relationship (Atlas et al., 1973; Jaffrain and Berne, 2011). Note that although the minimal rain rate the OTT can measure is 0.001 mm h–1, to eliminate very slight rainfall, any rain rate less than 0.1 mm h–1 is set to 0 mm h–1.
In addition to the disdrometer, five tipping bucket rain gauges were installed at the bottom of the base towers, and their locations are marked by blue triangles in Fig. 1 (assigned numbers RG1, RG2, RG3, RG4, and RG5). The rain gauge outputs a rainfall accumulation change every 5 minutes (resolution is 0.5 mm). The five rain gauges are at one end of the CMLs, where RG1 corresponds to CML40 and CML49, RG2 corresponds to CML28 and CML30, RG3 corresponds to CML33, RG4 corresponds to CML36 and CML37, and RG5 corresponds to CML7 and CML20. In this study, the accumulated rainfall observed by various rain gauges was used as the true value of the corresponding CML measurements.
-
The physical foundation of rainfall inversion using CML is governed by attenuation due to atmospheric factors. According to atmospheric scattering theory, the microwave signal can be attenuated by the absorption and scattering of raindrops along its propagation path. The rain-induced specific attenuation
$ {\gamma _{{\text{rain}}}} $ (dB km–1) can be calculated as follows:where
$ {Q_{{\text{ext}}}}(D) $ (mm2) is the extinction cross-section of the raindrop with diameter D (mm) (volume equivalent diameter for the nonspherical raindrop), which can be calculated by Mie theory or the T-matrix method, and N(D) (m–3 mm–1) is the drop-size-distribution (DSD) function.The rain rate R (mm h–1) can be calculated by the following integration:
where v(D) (m s–1) is the fall velocity of a raindrop with diameter D (mm).
Both the rain-induced specific attenuation γrain and the rain rate R are functions of N(D), and their relationship can be obtained by numerical calculations according to the measured data or statistical data. However, to simplify the calculations, an empirical power-law relationship between γrain (dB km–1) and R (mm h–1) is usually applied in the wireless communication field (ITU-R, 2005):
where k and α are frequency-dependent coefficients.
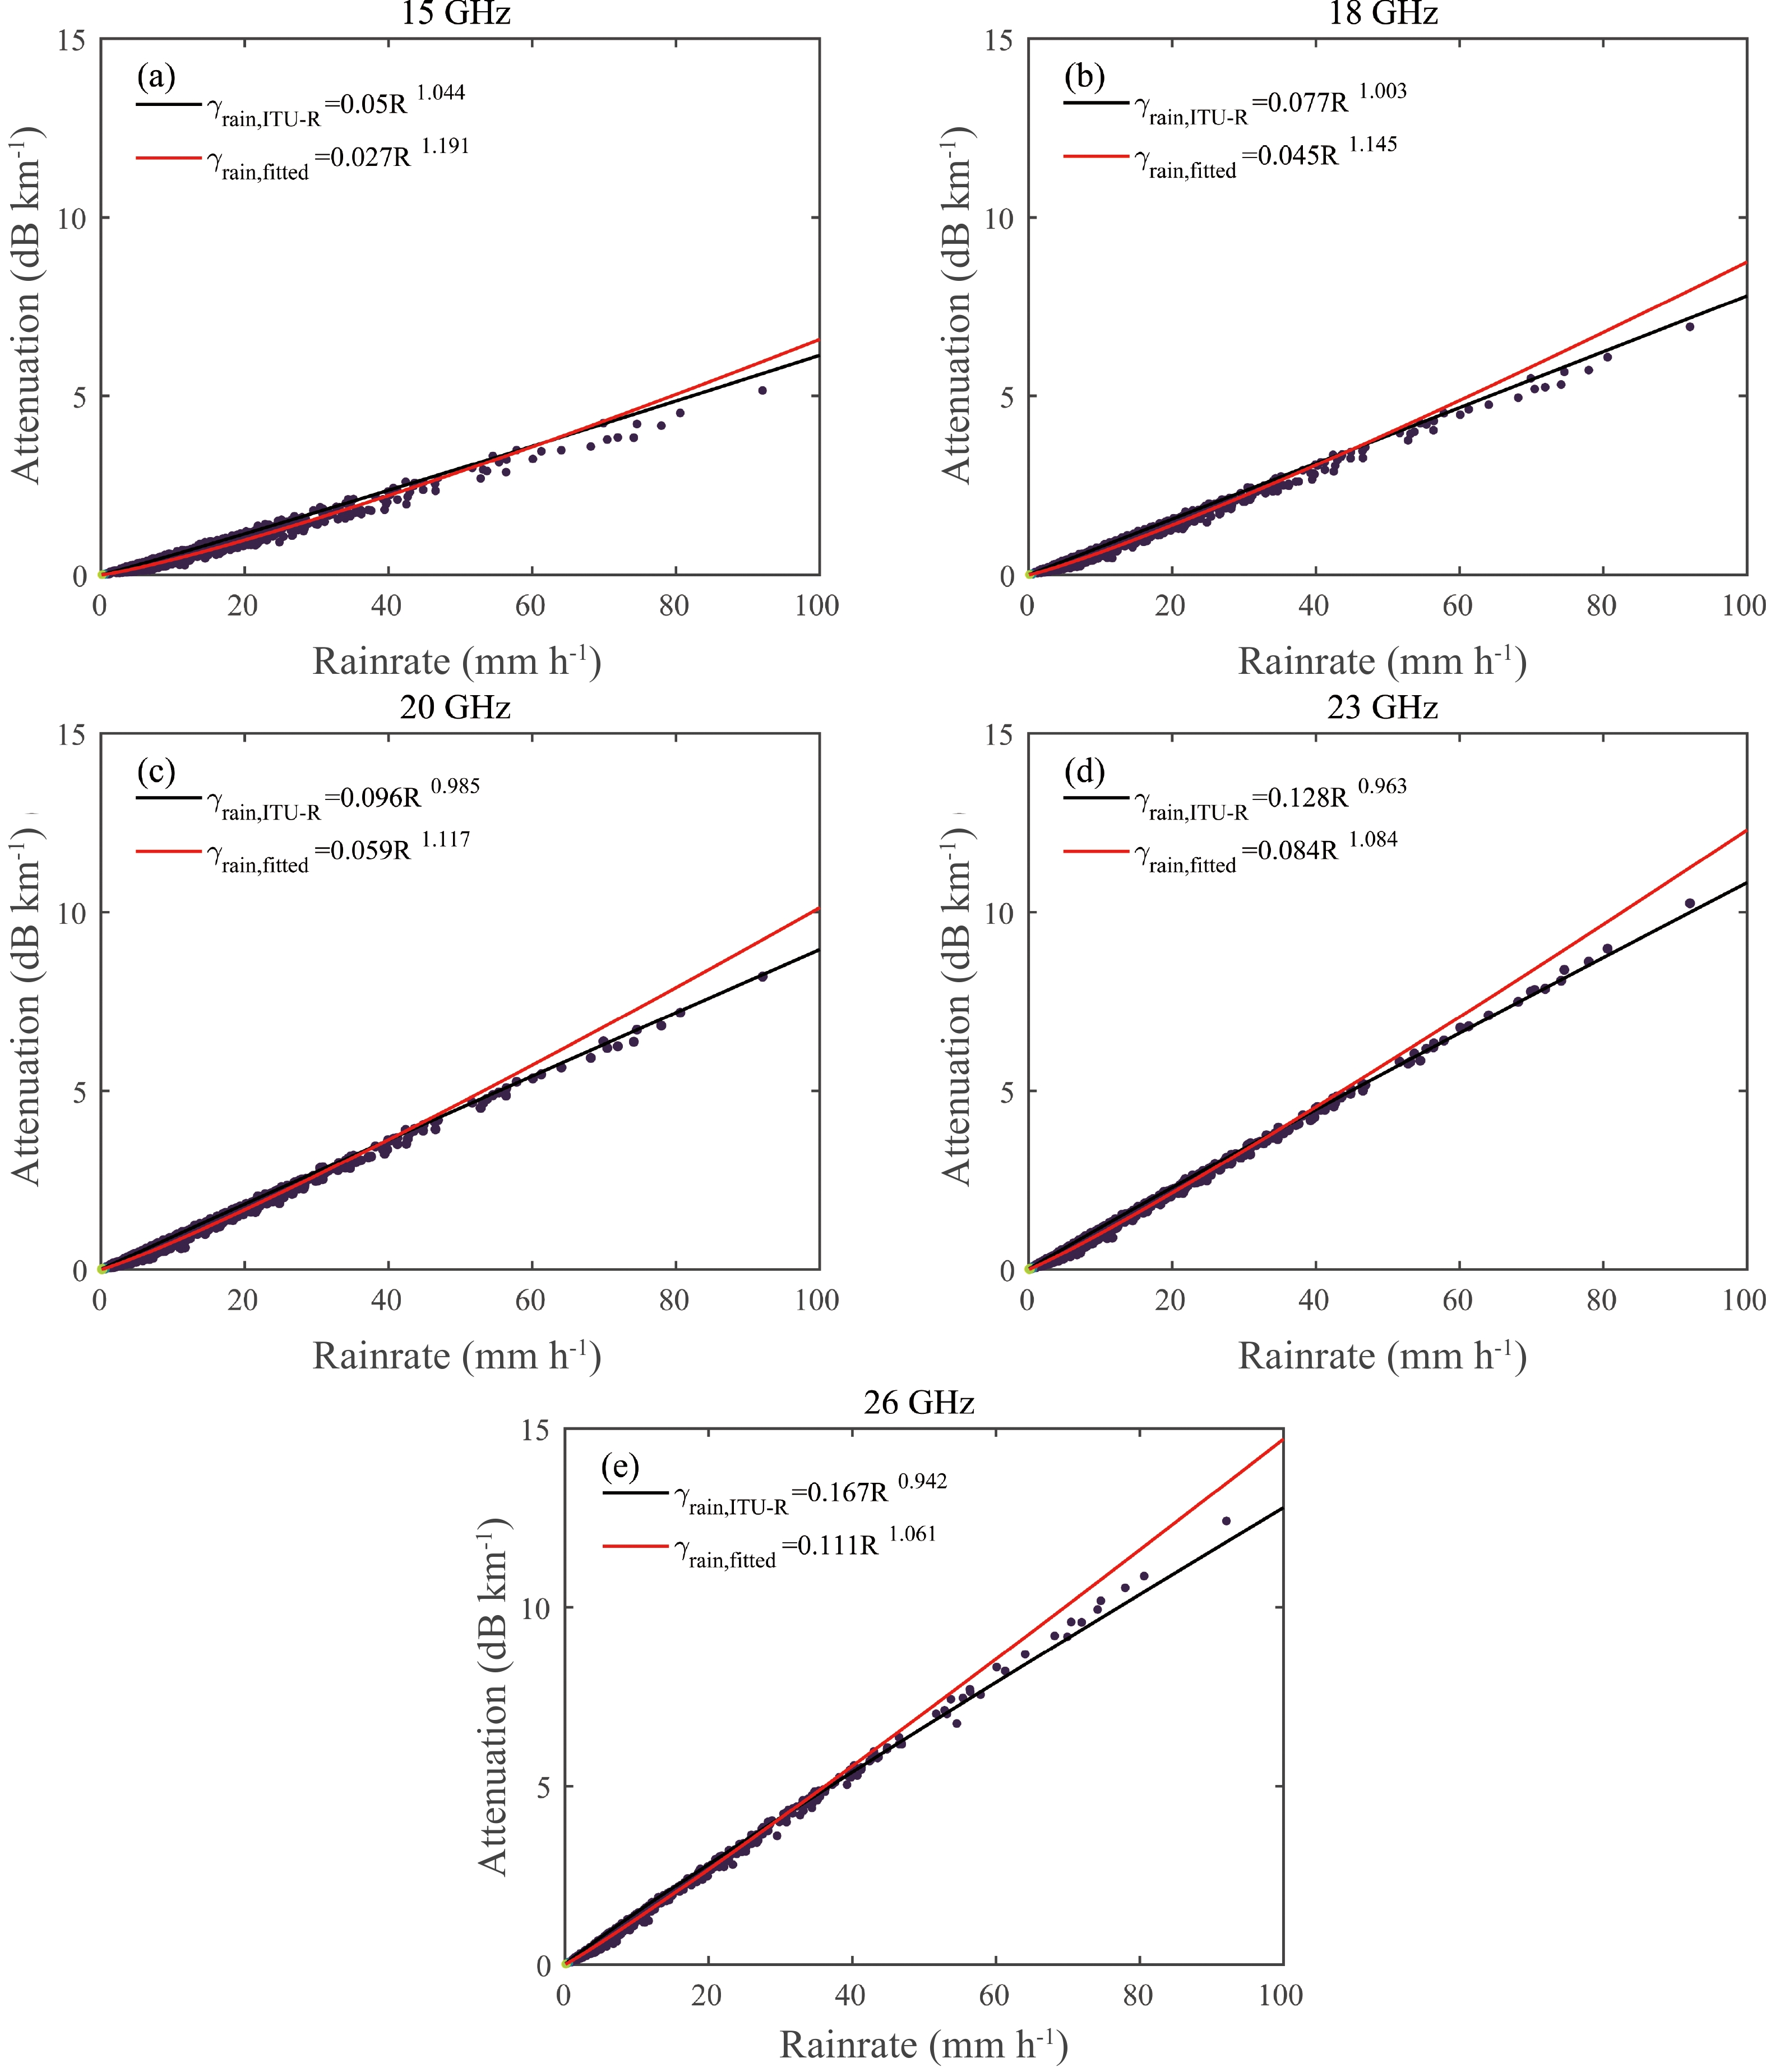
Figure 5 shows the power-law relations for three microwave frequencies (15 GHz, 18 GHz, 20 GHz, 23 GHz, and 26 GHz). The k and α values are obtained from two approaches, (1) The nonlinear fitting of the scattering calculation results using T-matrix theory (Mishchenko et al., 2004). Here, the rainfall data of interest are the raindrop size distribution (DSD) data (temporal resolution is 1 min) as measured by the OTT disdrometer located in Jiangyin from late January to early September 2021, which is the valid time of the disdrometer data (the possible presence of non-liquid rainfall was excluded by quality control, such as retaining only particles within the 60% variation range of the empirical falling velocity and removing particles larger than 6 mm). (2) The recommendation of P. 838-3 of the International Telecommunication Union (ITU-R, 2005). The specific attenuation increases with both the rain rate and the frequency, and the difference between different frequencies increases with the rain rate. Compared with the ITU-R relationship, the fitted relationship is close to the ITU-R relationship at 15 GHz and slightly higher than the ITU-R relationship at 26 GHz; therefore, the localized relationships were used to invert the path-average rain rate.

Figure 5. Variation in specific attenuation with rain rate at (a) 15 GHz, (b) 18 GHz, (c) 20 GHz, (d) 23 GHz, and (e) 26 GHz. The rain rate (1-min temporal resolution) is obtained by the OTT disdrometer located in Jiangyin from late January to early September 2021.
The path-average rain rate R of CML can be calculated from the attenuation based on Eq. (3) (Song et al., 2019):
where
$ {\gamma }_{\text{rain}} $ can be calculated according to the transmitting power and receiving signal level; and:where
$ {P}_{t} $ is the power of the transmitter,$ {P_r} $ is the received signal power,$ {A_{{\text{path}}}} $ is the path loss of free space,$ {A_{{\text{norain}}}} $ is the attenuation loss due to other-than-rain factors, such as atmospheric fog, haze, aerosol, humidity, water vapor, and gases, and$ L $ is the length of CMLs. Together,$ {A_{{\text{path}}}} $ and$ {A_{{\text{norain}}}} $ , form the attenuation baseline Abaseline.Previous studies have shown that the CML signal is affected not only by rainfall but also by other factors, including the absorption of atmospheric gases, the attenuation of humidity and fog (David et al., 2015), free-space fade, and multiple pathways of signal propagation. These other-than-rain attenuation components exist in different magnitudes, which can cause obvious overestimations of rainfall rate if the other-than-rain attenuation components cannot be eliminated properly. Usually, a series of processing algorithms based on spectral analysis or statistical analysis is used to classify clear and rainy (or dry and wet) periods (Song et al., 2020b), and then the other-than-rain attenuation components at clear periods can be determined (called baseline) and eliminated during rainy periods. The skill in distinguishing between dry and rainy periods is usually not ideal; existing models can hardly achieve the correct recognition rate of dry and rainy periods at the same time up to 90% (Schleiss and Berne, 2010; Wang et al., 2012; Polz et al., 2020), and taking the level of dry periods as the baseline also causes great uncertainty for long-term rainfall.
In this study, a dynamic baseline determination method is used, which does not need to be implemented based on the determination of rainy and dry periods, and the method directly takes the minimum Atotal value in a time window Δt (min) as the baseline:
Wet antenna attenuation (WAA) is defined as the attenuation caused by water on the cover of a CML antenna. With this additional attenuation, the inverted rain rate tends to overestimate the actual rain rate (Zinevich et al., 2008; Schleiss et al., 2013). Therefore, the influence of WAA on rain-induced attenuation extraction should also be considered. The rain-induced specific attenuation is calculated as:
Based on the results of the path-averaged rain rate inverted by each CML, the two-dimensional rainfall fields are generated using the inverse distance-weighted (IDW) algorithm with an exponential parameter of 2 (Eshel et al., 2020). In addition, considering the spatial variability of rainfall and the distribution of samples near different interpolation locations, a variable influence radius is adopted. We set distance thresholds to 2, 5, and 10 km, and the final influence radius was determined by the distance between the nearest sample point and the interpolation point. Hence, the rain rate R of interpolation points can be calculated by Eqs. (10–13):
where (X,Y) is the interpolation point, (Xi,Yi) is the sample point, and hi is the distance between them; r is the influence radius, and N is the sample set whose h is less than r. Wm and Rm are the weight and rain rate of the samples, respectively.
-
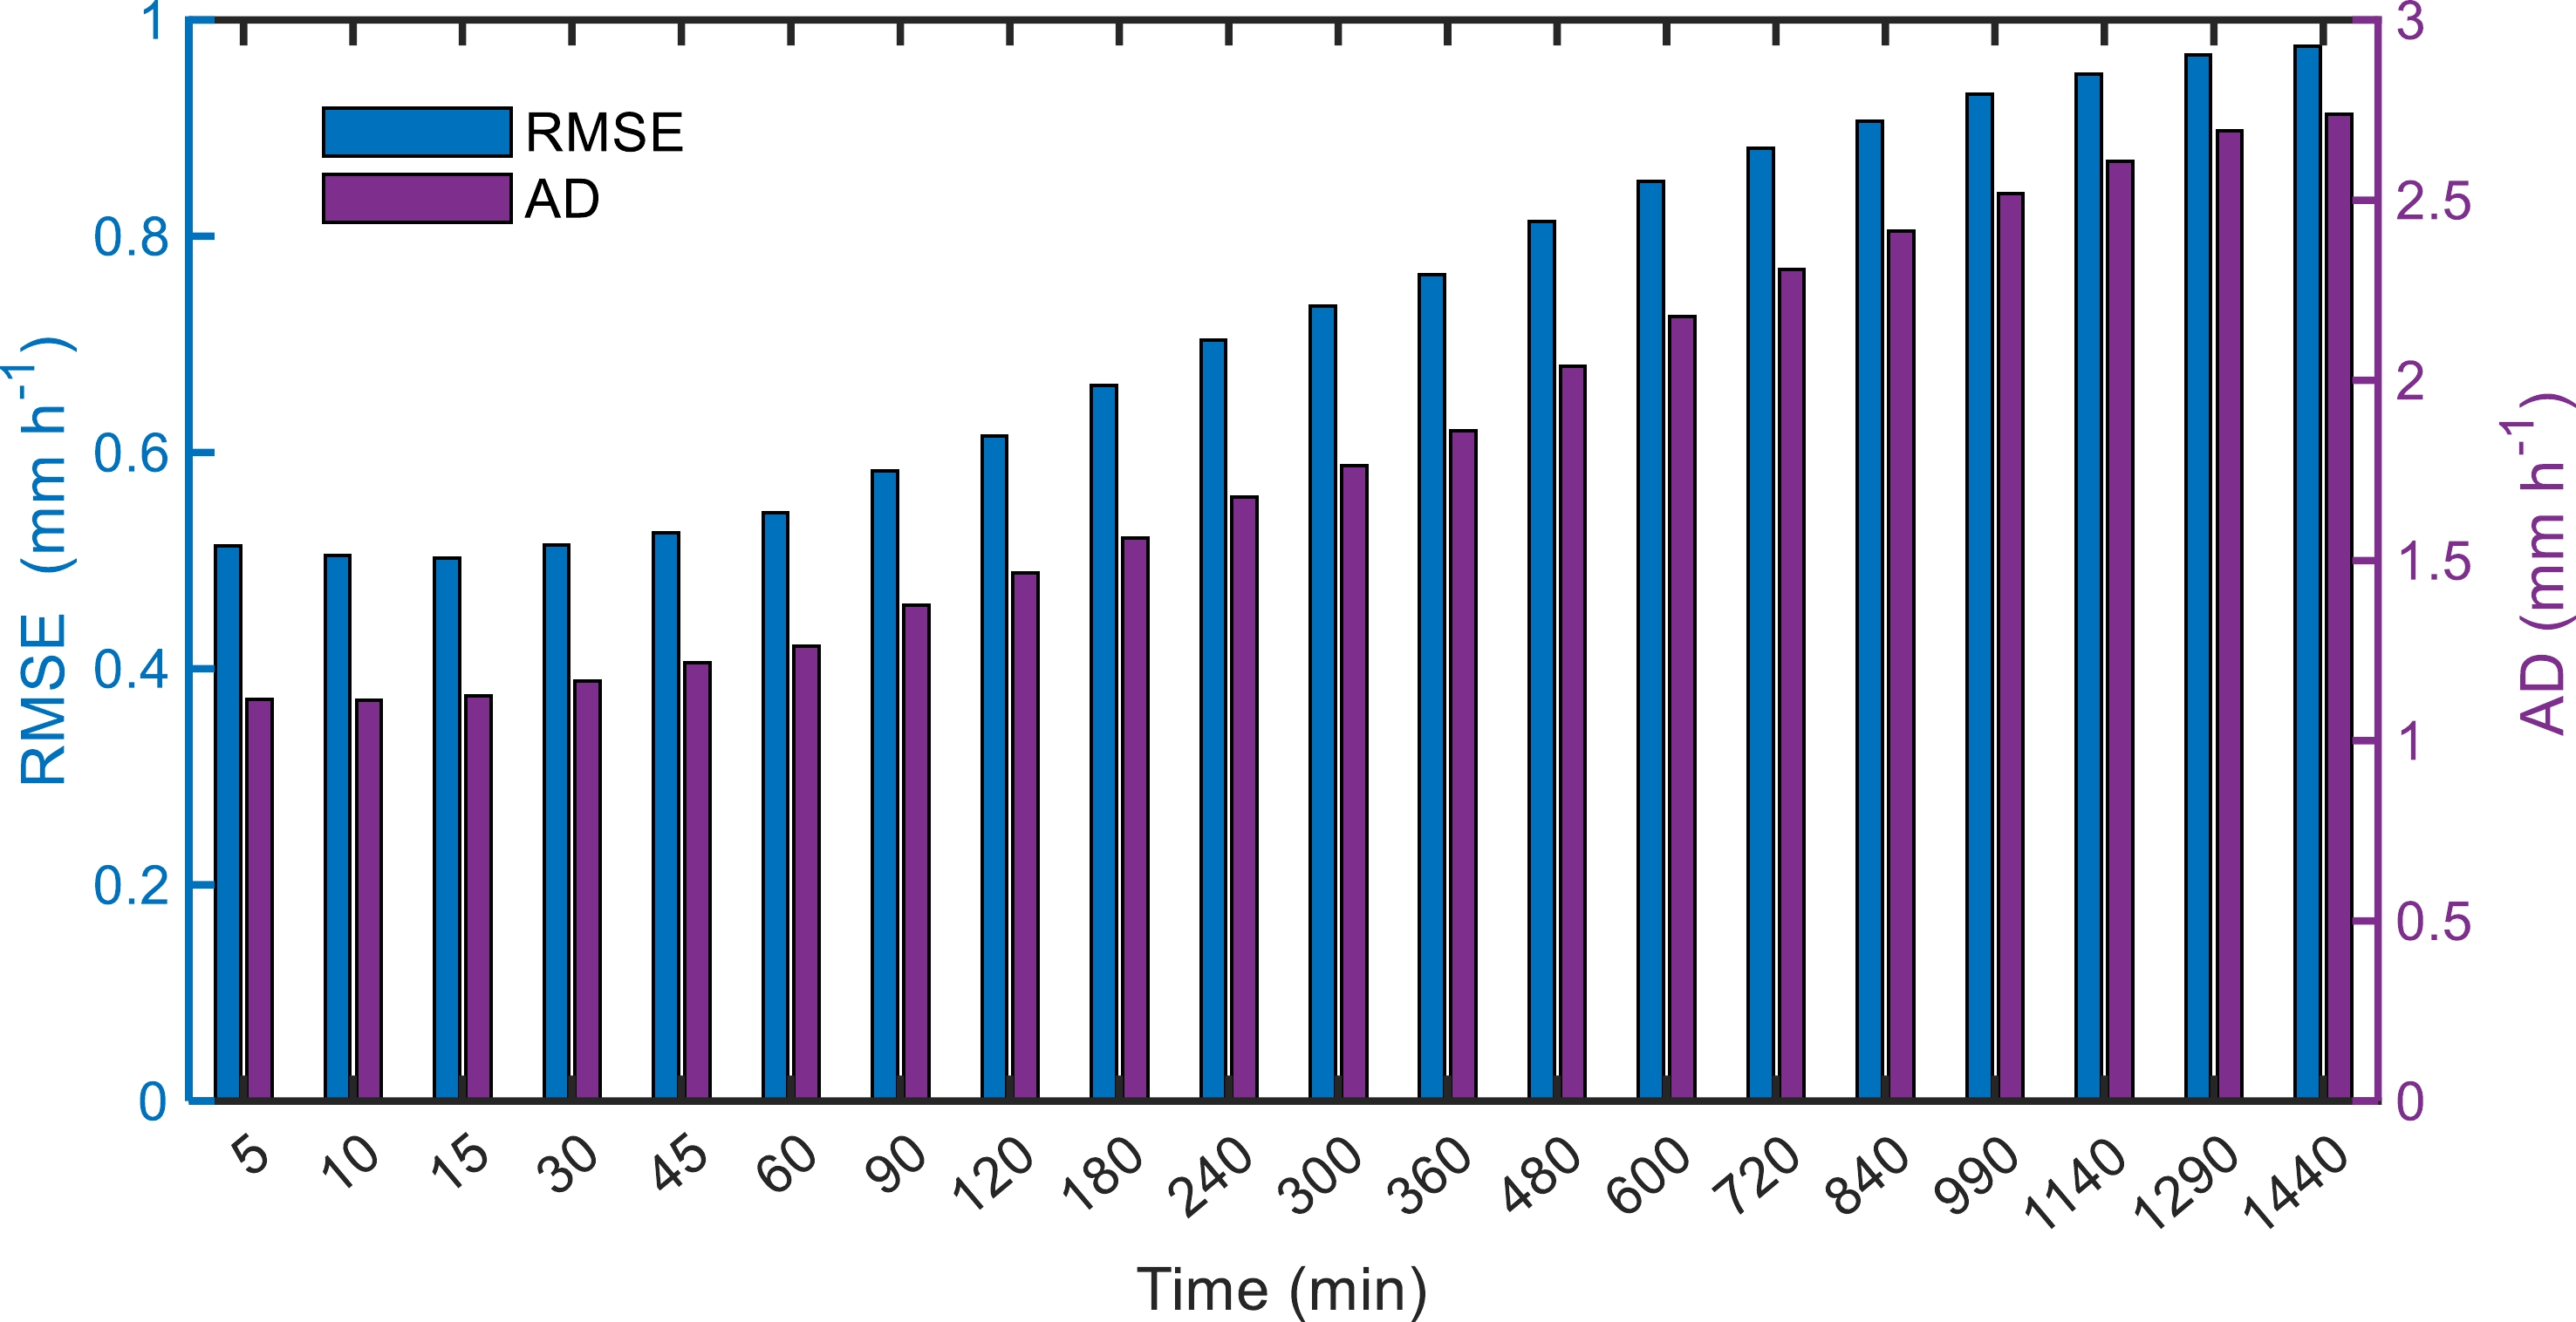
To obtain a proper value of Δt, an evaluation experiment is performed based on CML39 data (length: 1.5 km, frequency: 26 GHz, polarization: vertical) and OTT disdrometer data deployed on the link here, including 17 days with rainfall in June. Root mean square error (RMSE, mm h–1) and absolute deviation (AD, mm h–1) were used as evaluation indices to evaluate the consistency between the retrieved values and the measured values:
where
${r_{{\text{inv}}}}$ is the rain rate retrieved CML,${r_{{\text{ott}}}}$ is the rain rate recorded by the OTT PARSIVEL disdrometer, and m is the number of rainfall samples.As shown in Fig. 6, the RMSE and the AD both decrease and then increase with increasing window length and have a minimum at 15 min. Therefore, a window length Δt of 15 min was chosen to calculate the rainfall attenuation in this study.
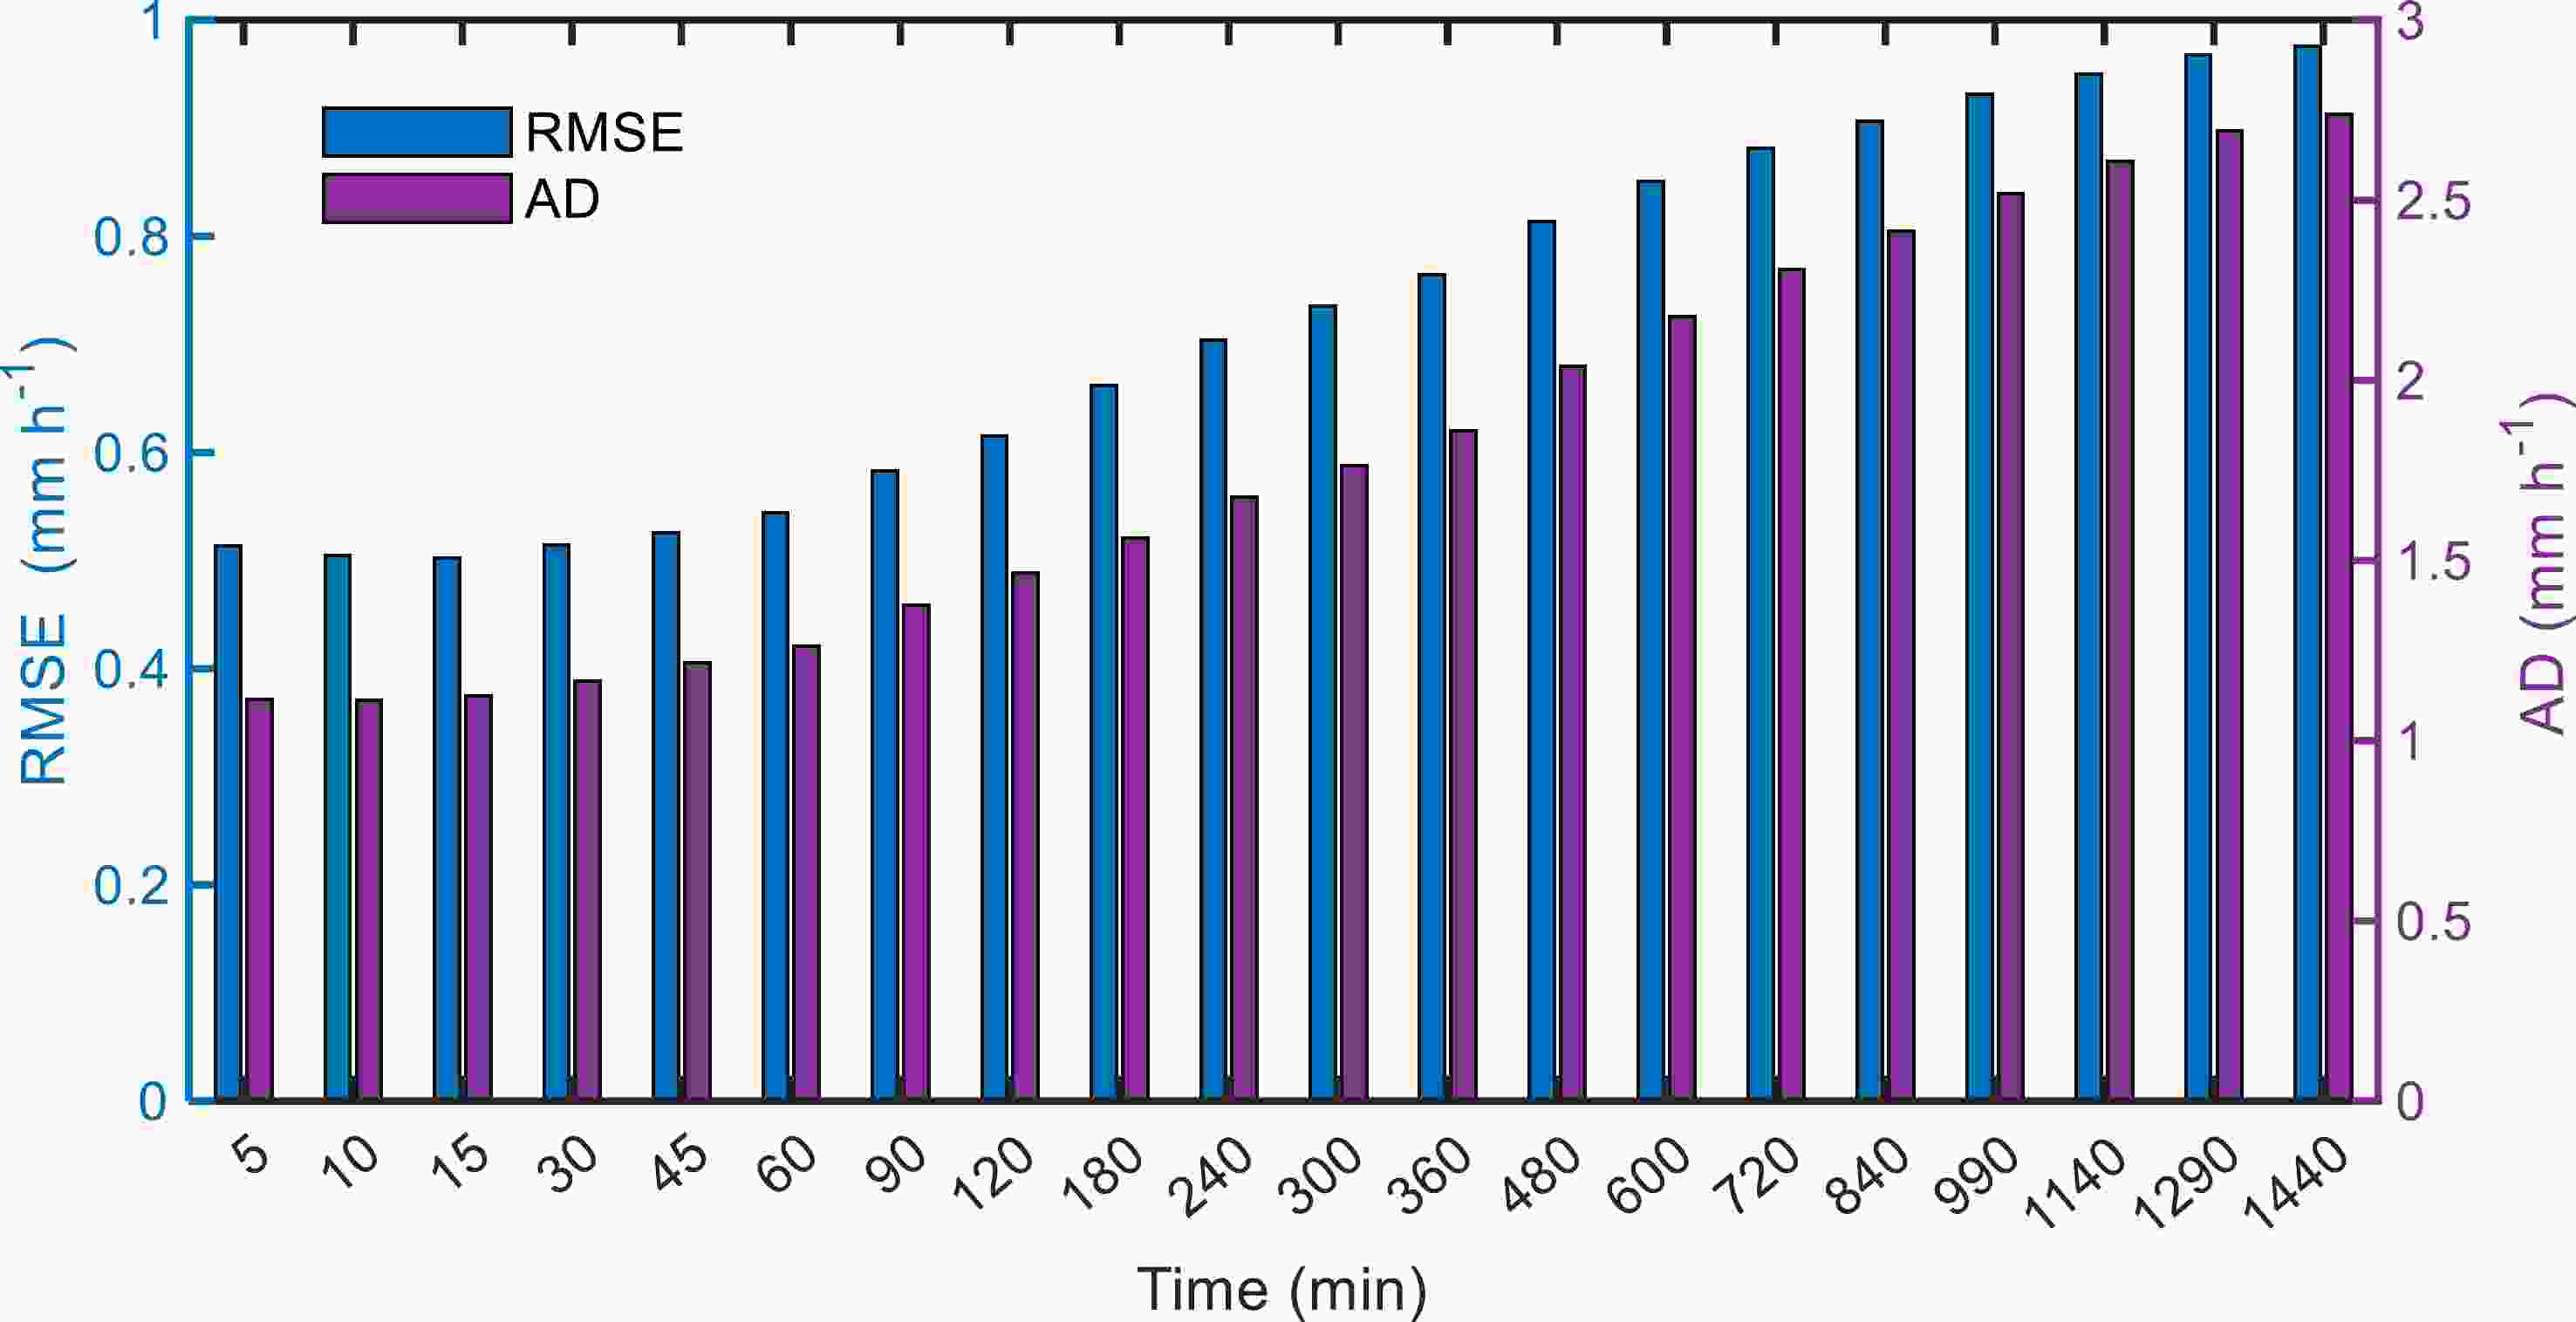
Figure 6. Evaluation indices of rainfall inversion performance under different time windows.
In addition, a typical value is used to simplify the representation of WAA based on the average of the difference between Am and real rain-induced attenuation (Arain) at all rainfall moments in a certain period of time. The WAA value is calculated based on CML39 data:
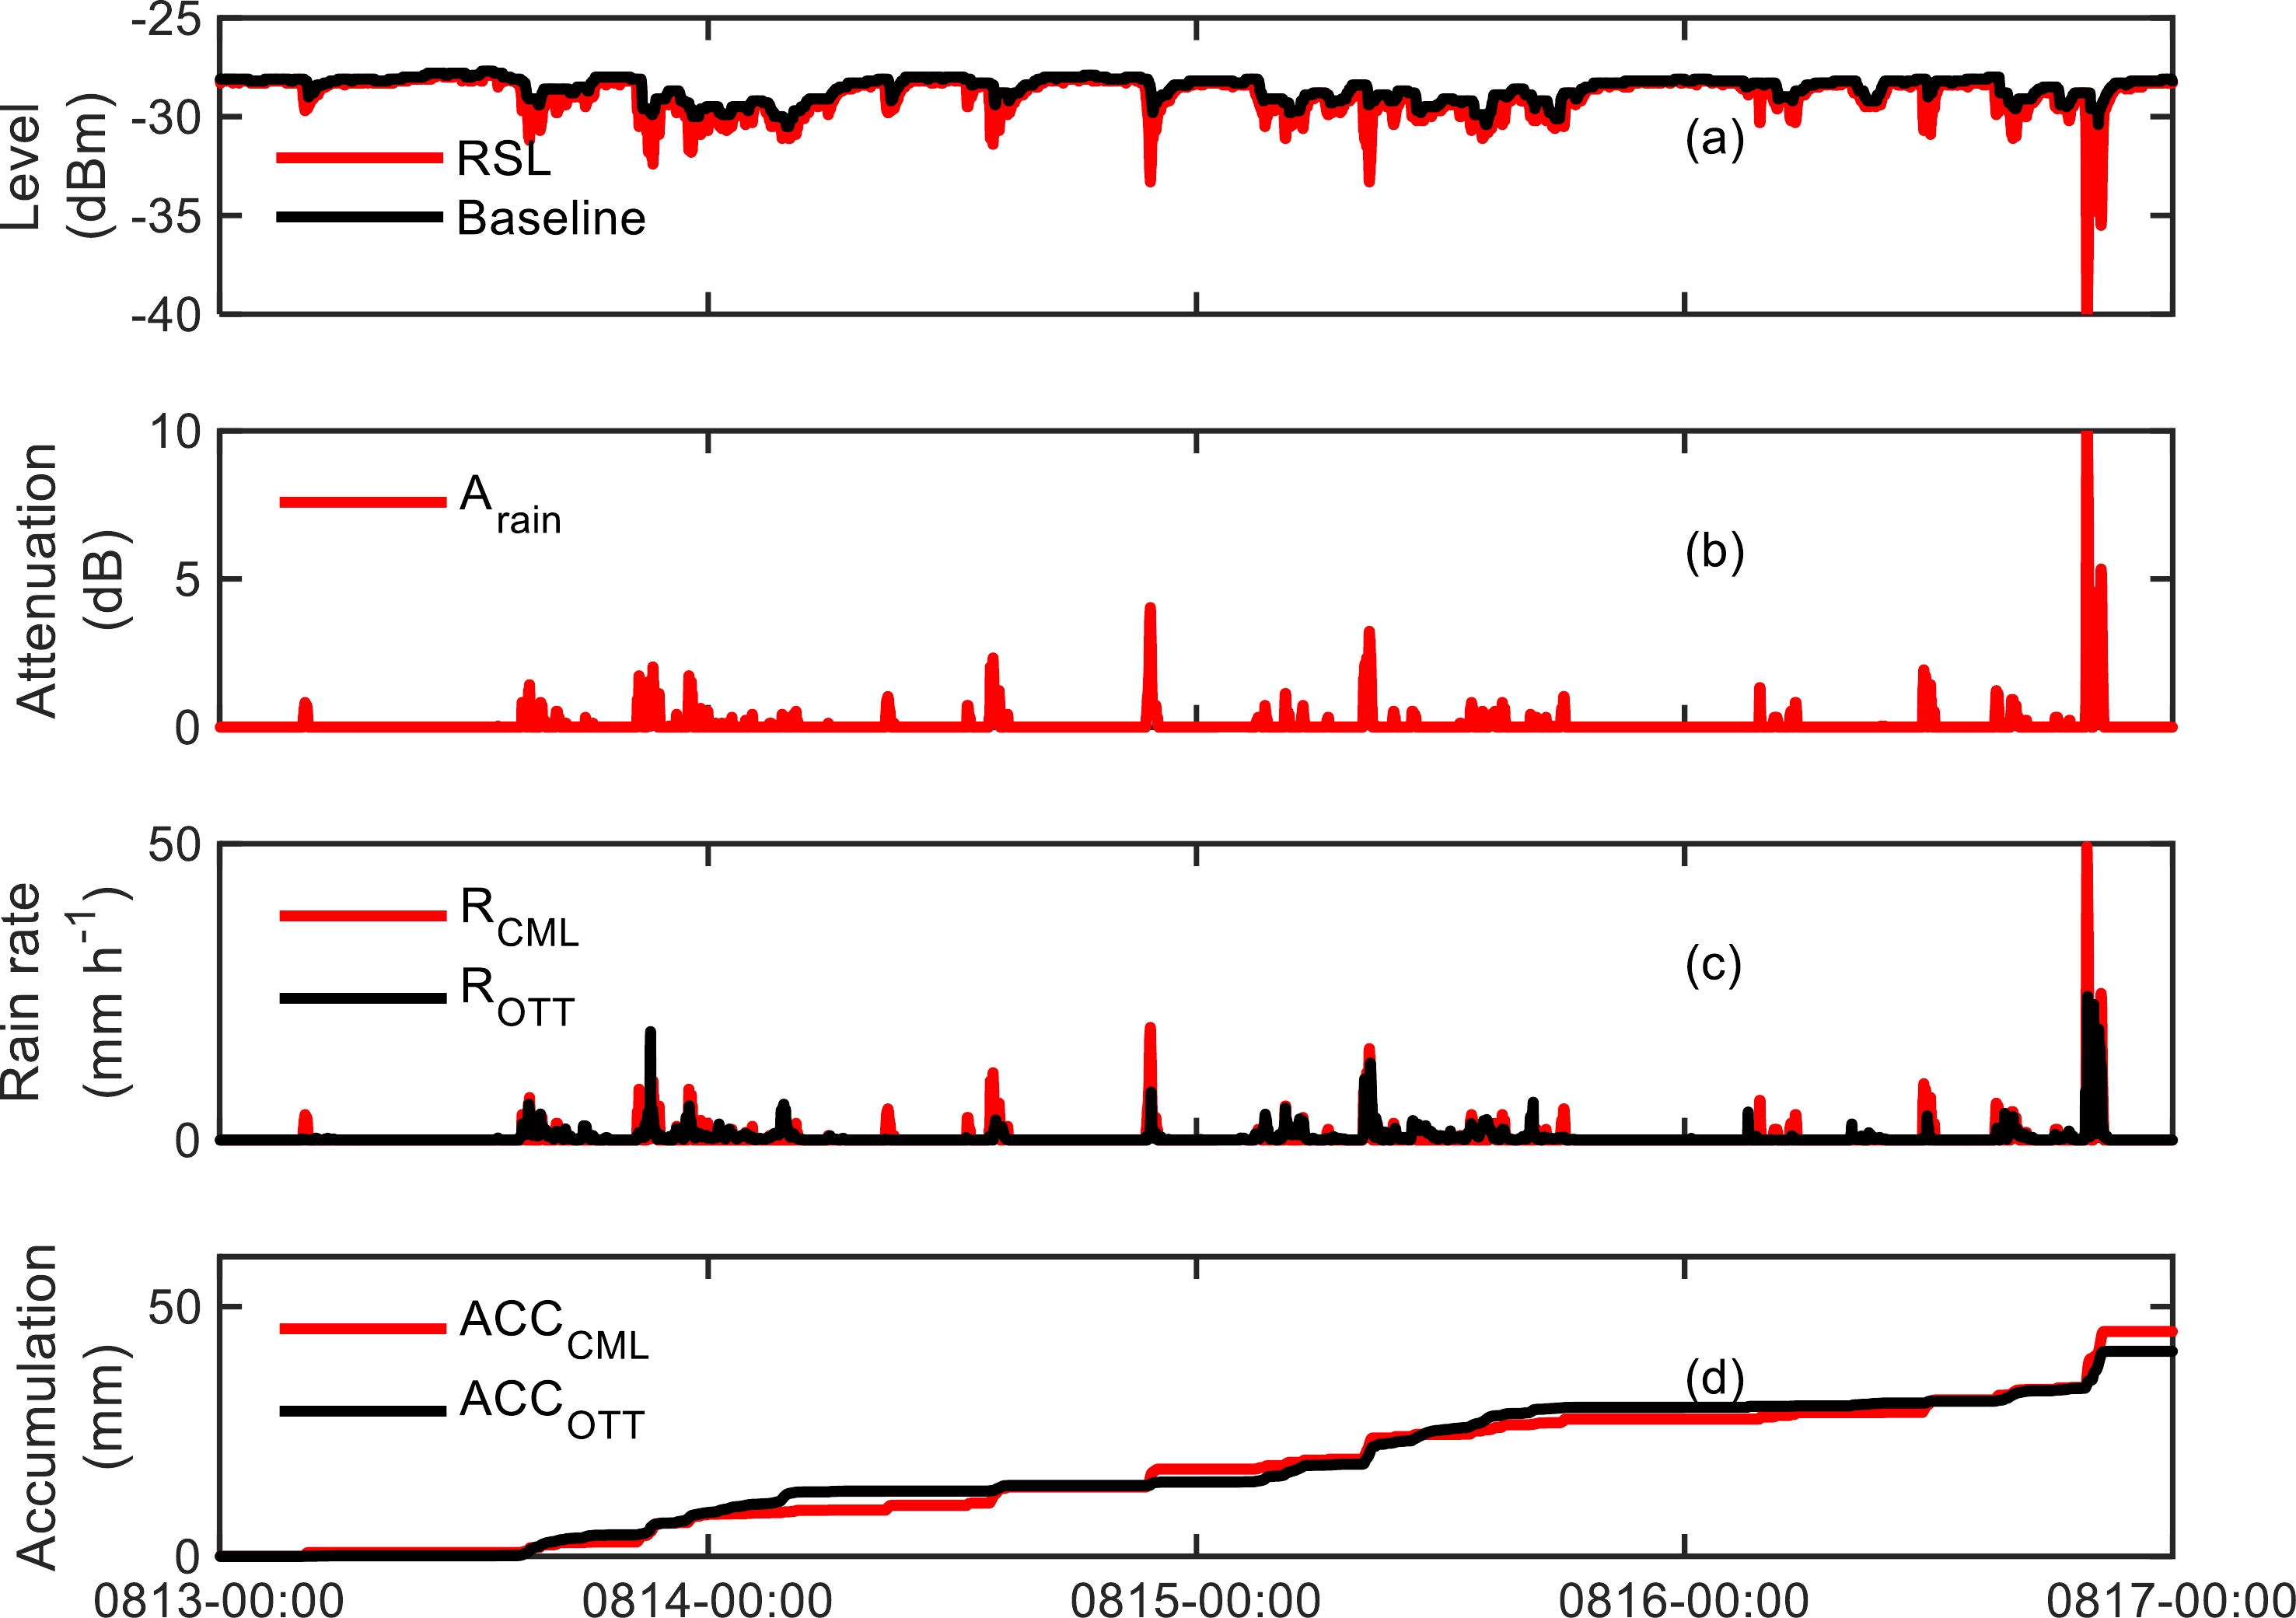
where Am,i and Arain,i are the Am value [calculated according to Eq. (9) with CML data] and rain-induced attenuation value [γrain (calculated according to Eq. (1) with disdrometer data) multiplied by L] corresponding to the i-th rainfall minute from March to August 2020, respectively, and no is the number of positive waai values. The calculated result of WAA is 0.667 dB. Figure 7 shows the inversion process of the rain rate and accumulation for a period of consecutive rainfall days (13 to 16 August) using CML39. The rain rate and accumulation, as calculated through CML inversion, agree well with the rain rate and accumulation calculated by the disdrometer.
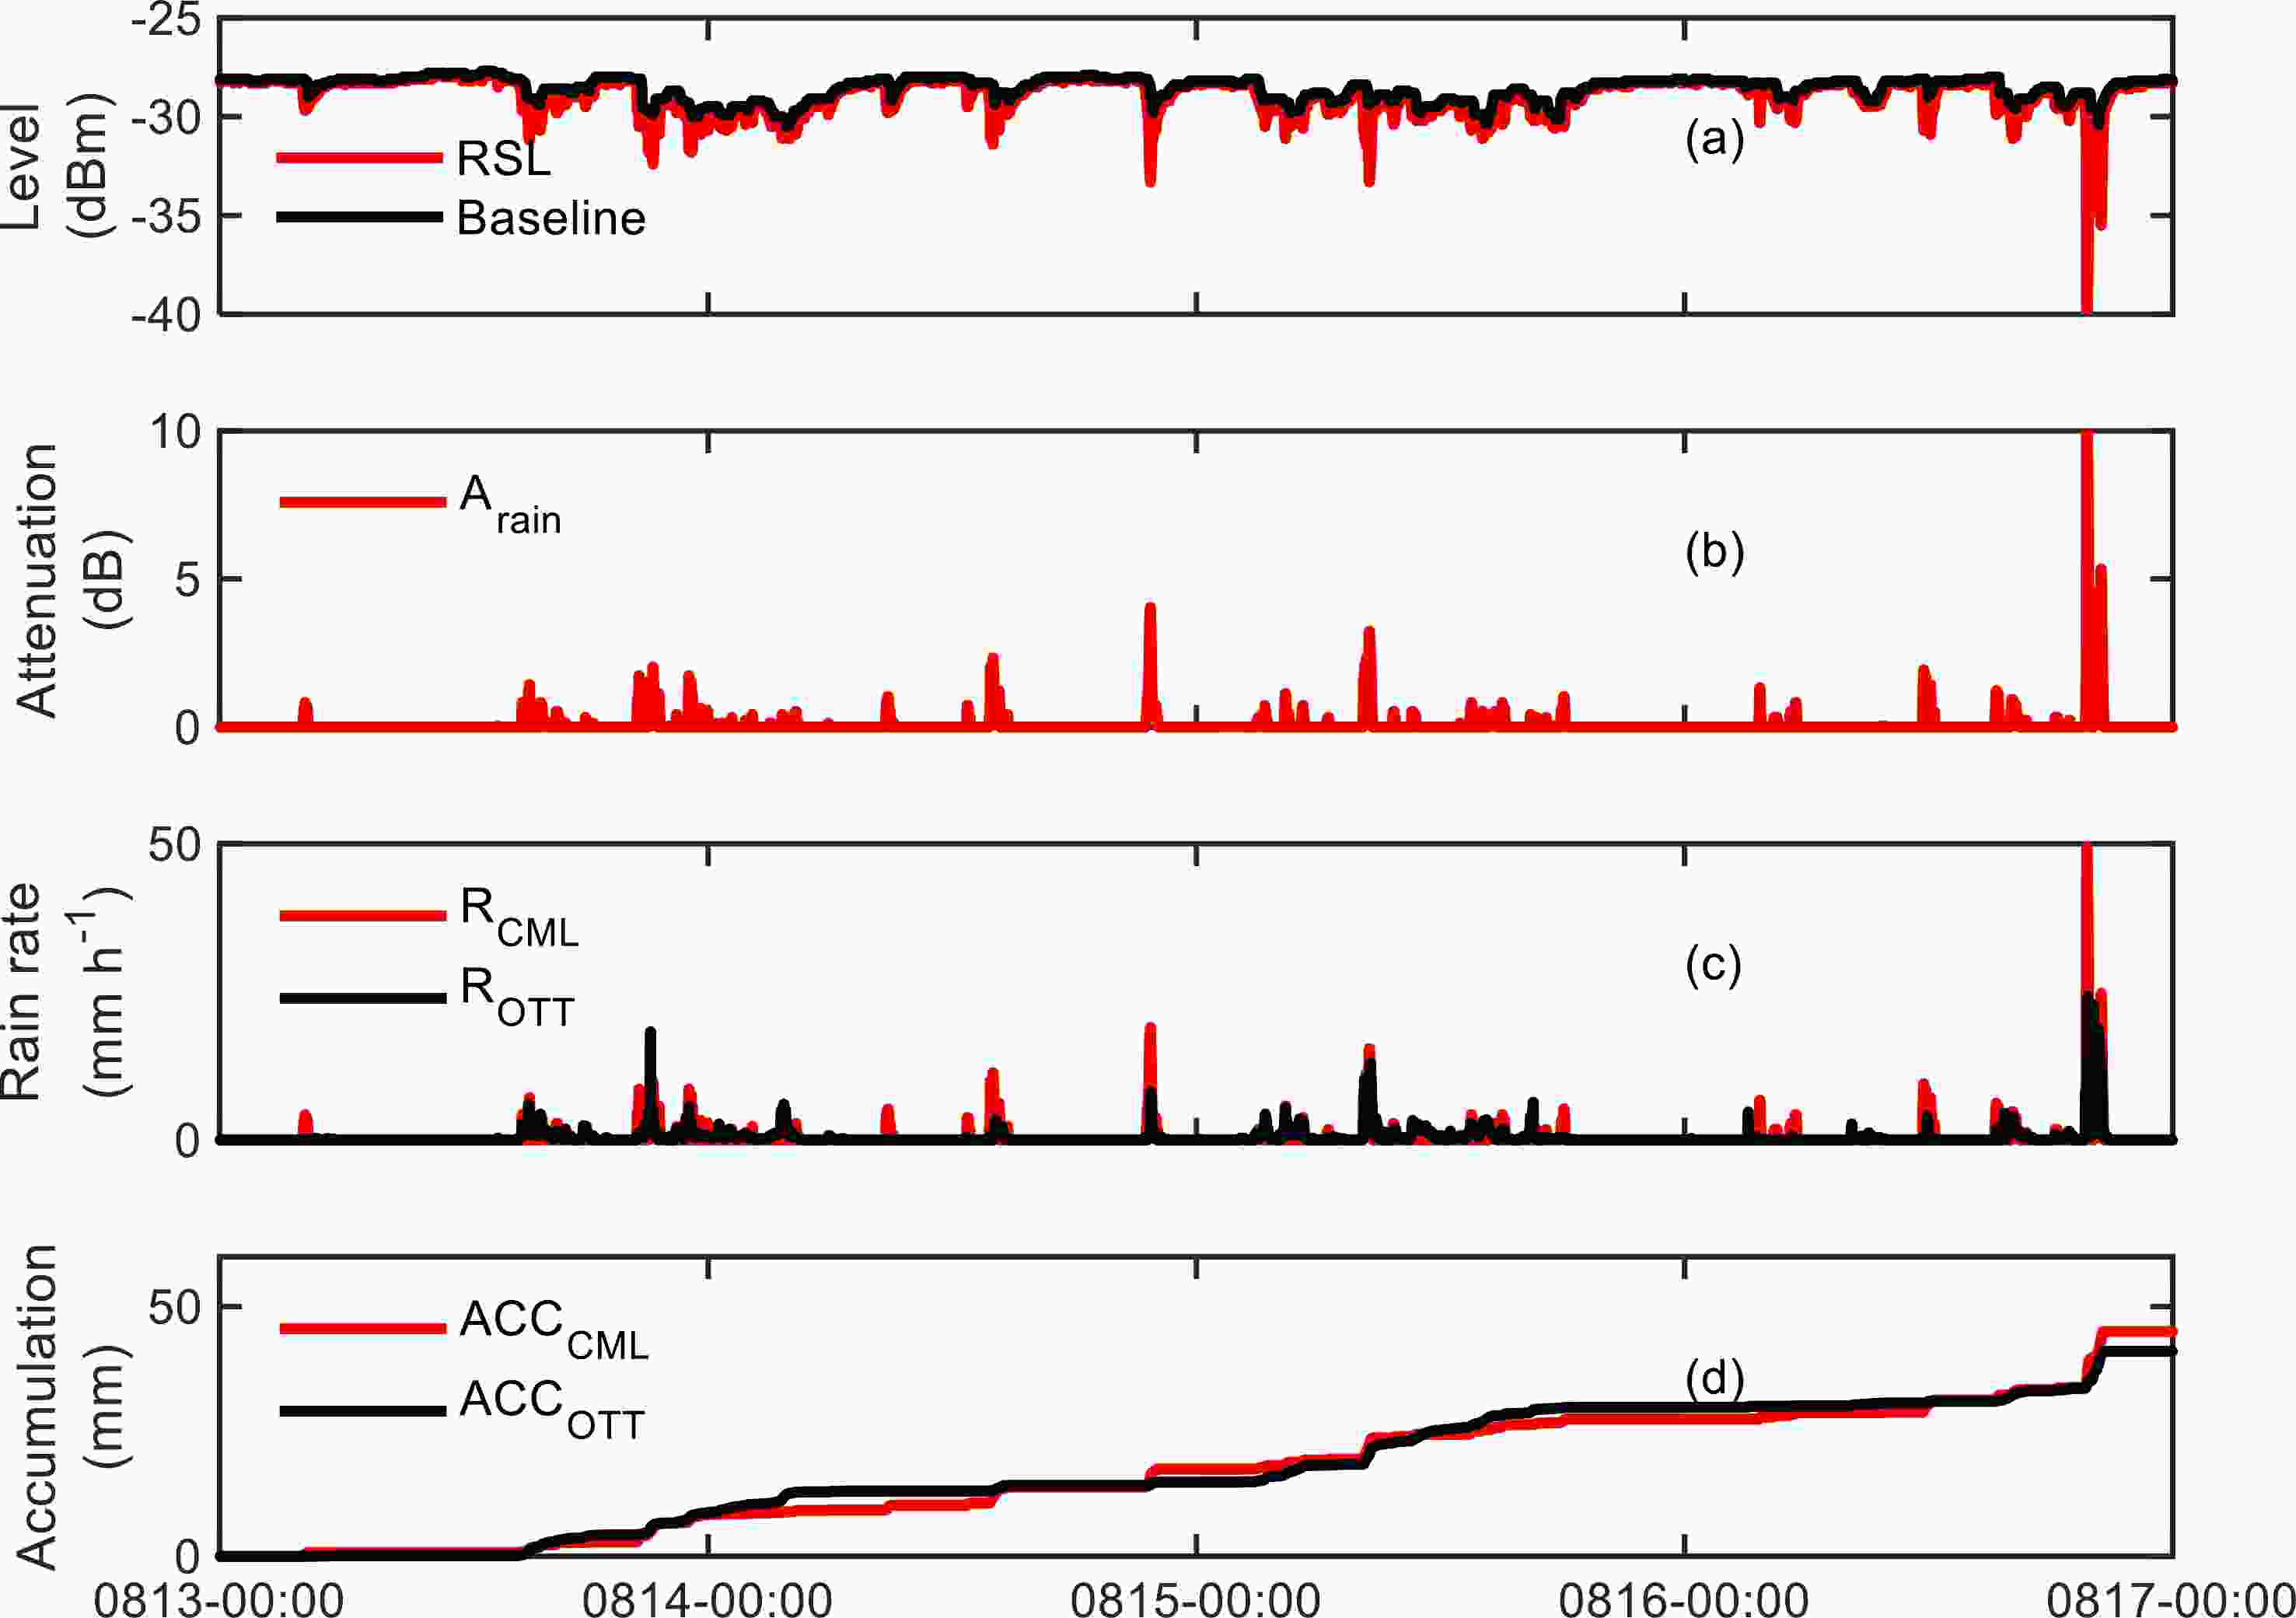
Figure 7. Schematic diagram of rain rate and accumulation inversion using CML39 based on the dynamic baseline method compared with the OTT PARSIVEL disdrometer
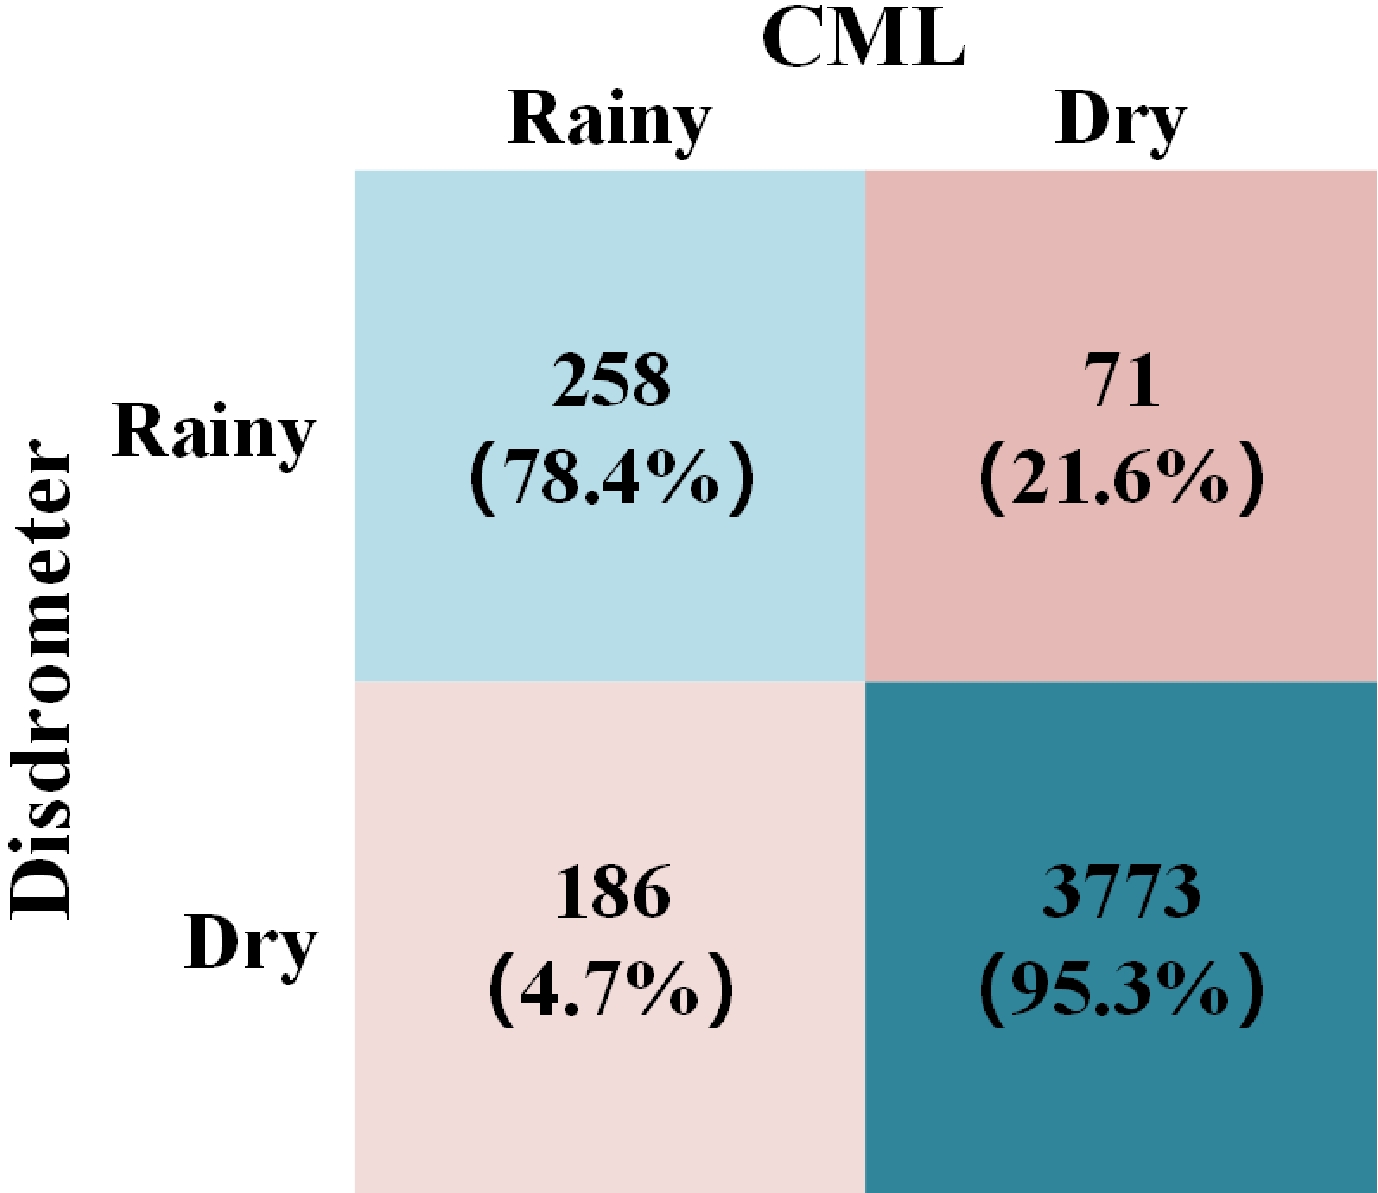
Furthermore, to explore the effectiveness of the above method in distinguishing rainy periods from dry periods, a confusion matrix is shown in Fig. 8. The standard for dividing the dry and rainy periods is to take the whole hour of Beijing time as the basic unit. If the average rain rate within the hour is less than 0.1 mm h–1, then the hour is considered the dry period; otherwise, it is regarded as a rainy period (a total of 4440 hours, 152 of which no recorded data exist). As seen in the figure, the true positive and true negative rates are 78.4% and 95.3%, respectively, which indicates that dry periods are well identified, but there is a relatively lower skill in correctly identifying the rainy periods. Figure 9 further shows the sampling distribution of rainfall rates for the rainy periods. Most of the false-negative samples are concentrated in the range of average rain rates less than 1 mm h–1, while the rain rate of true positive samples is significantly higher in the larger value area. In addition, the CML inversion of the rain rate is also shown in Fig. 9 (blue line), from which it can be seen that there is a certain number of samples that are identified as a rainy period by the CML that are actually dry periods according to the OTT PARSIVEL disdrometer.

Figure 8. Confusion matrix between the rainy and dry periods at a 1-h time resolution retrieved by CML39 and observed by the OTT PARSIVEL disdrometer.
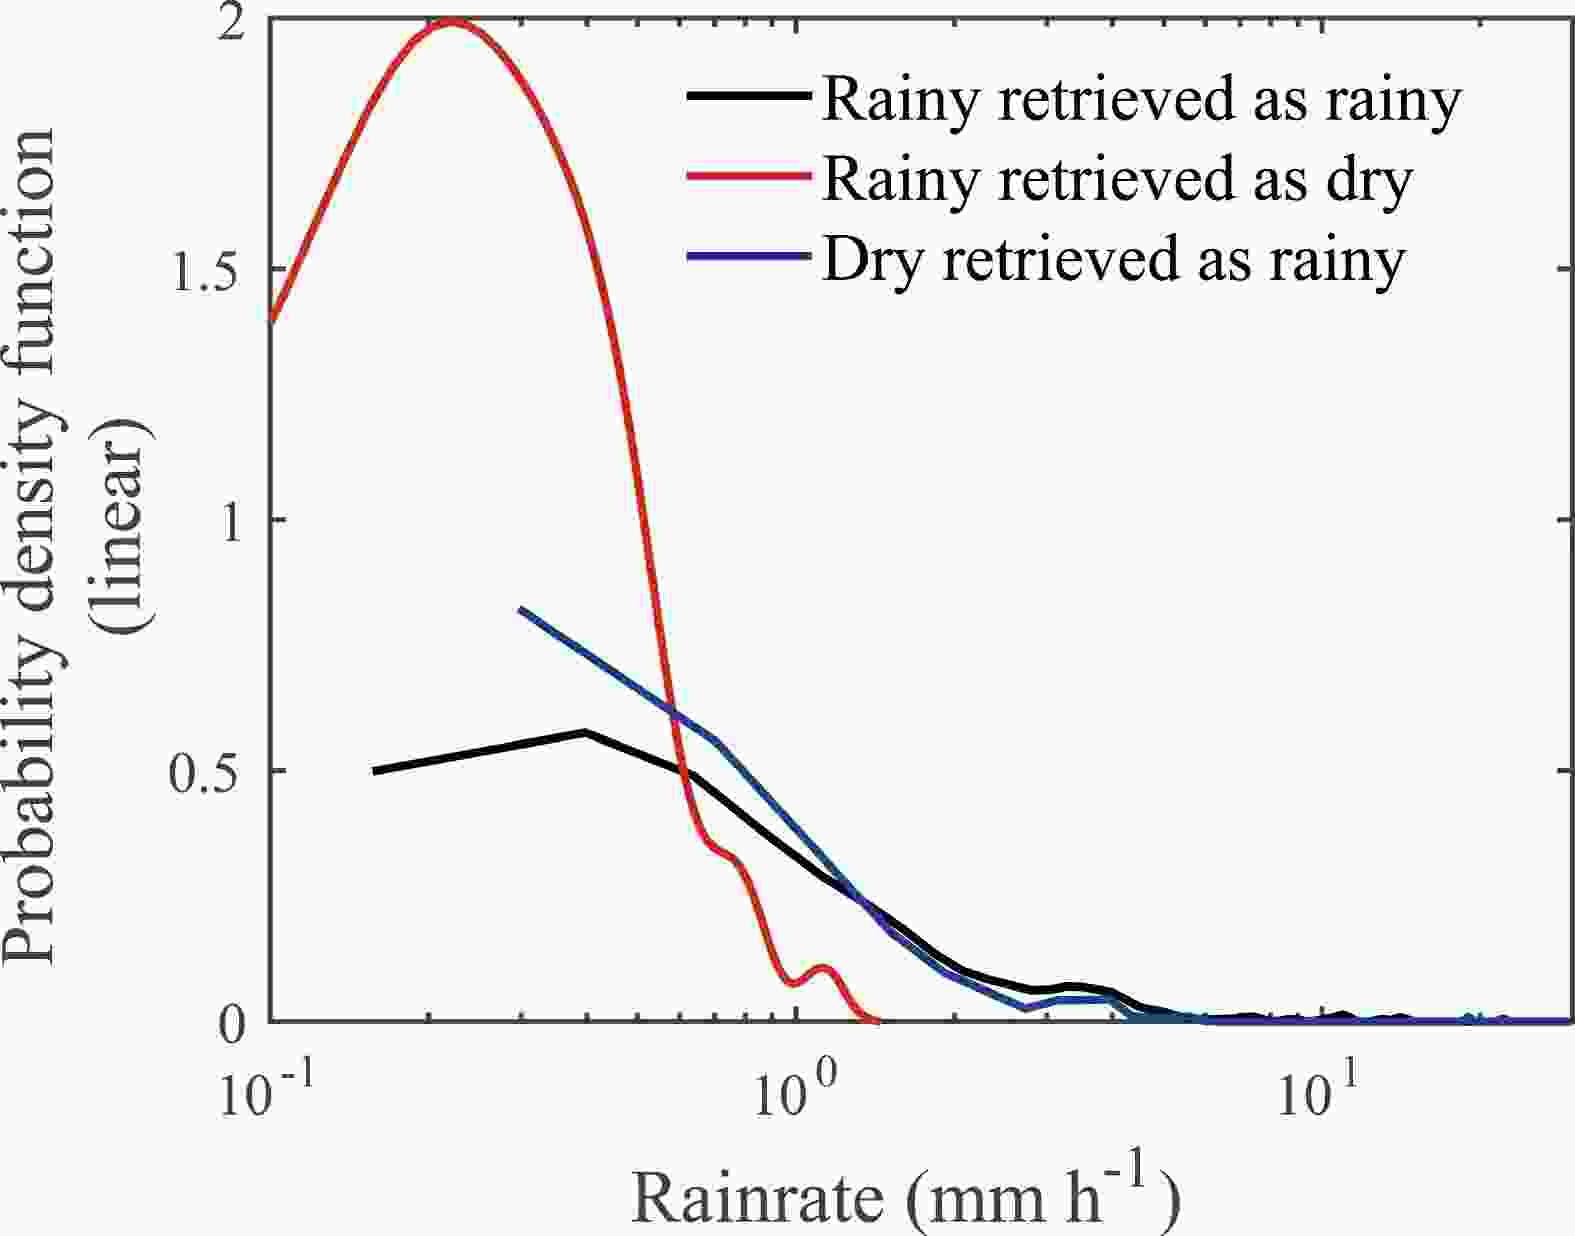
Figure 9. The probability density function of the rain rate of the rainy period (OTT PARSIVEL disdrometer) retrieved as a rainy period (black line) and as a dry period (red line) by CML, and the probability density function (blue) of the rain rate retrieved by CML as a rainy period during actual dry periods (OTT PARSIVEL disdrometer).
The distribution of the rain rate retrieved by CML as a rainy period during actual dry period is similar to that retrieved by CML as a rainy period during actual rainy period, there might be also relatively higher rain rate. The analysis of the rainfall aggregations for each curve is given in Fig. 9, which reveals that the cumulative rainfall from the disdrometer is 452.7 mm. The cumulative rainfall of rainy and dry periods inversed by CML is 427.7 mm and 25.0 mm, respectively. However, dry period samples identified by CML as rainy periods corresponded to 230.8 mm of false cumulative rainfall. This indicates that although CMLs rarely miss rainfall events, there are obvious false alarms for rainfall accumulation, which may be related to the instability of received signal levels in non-rain periods.
-
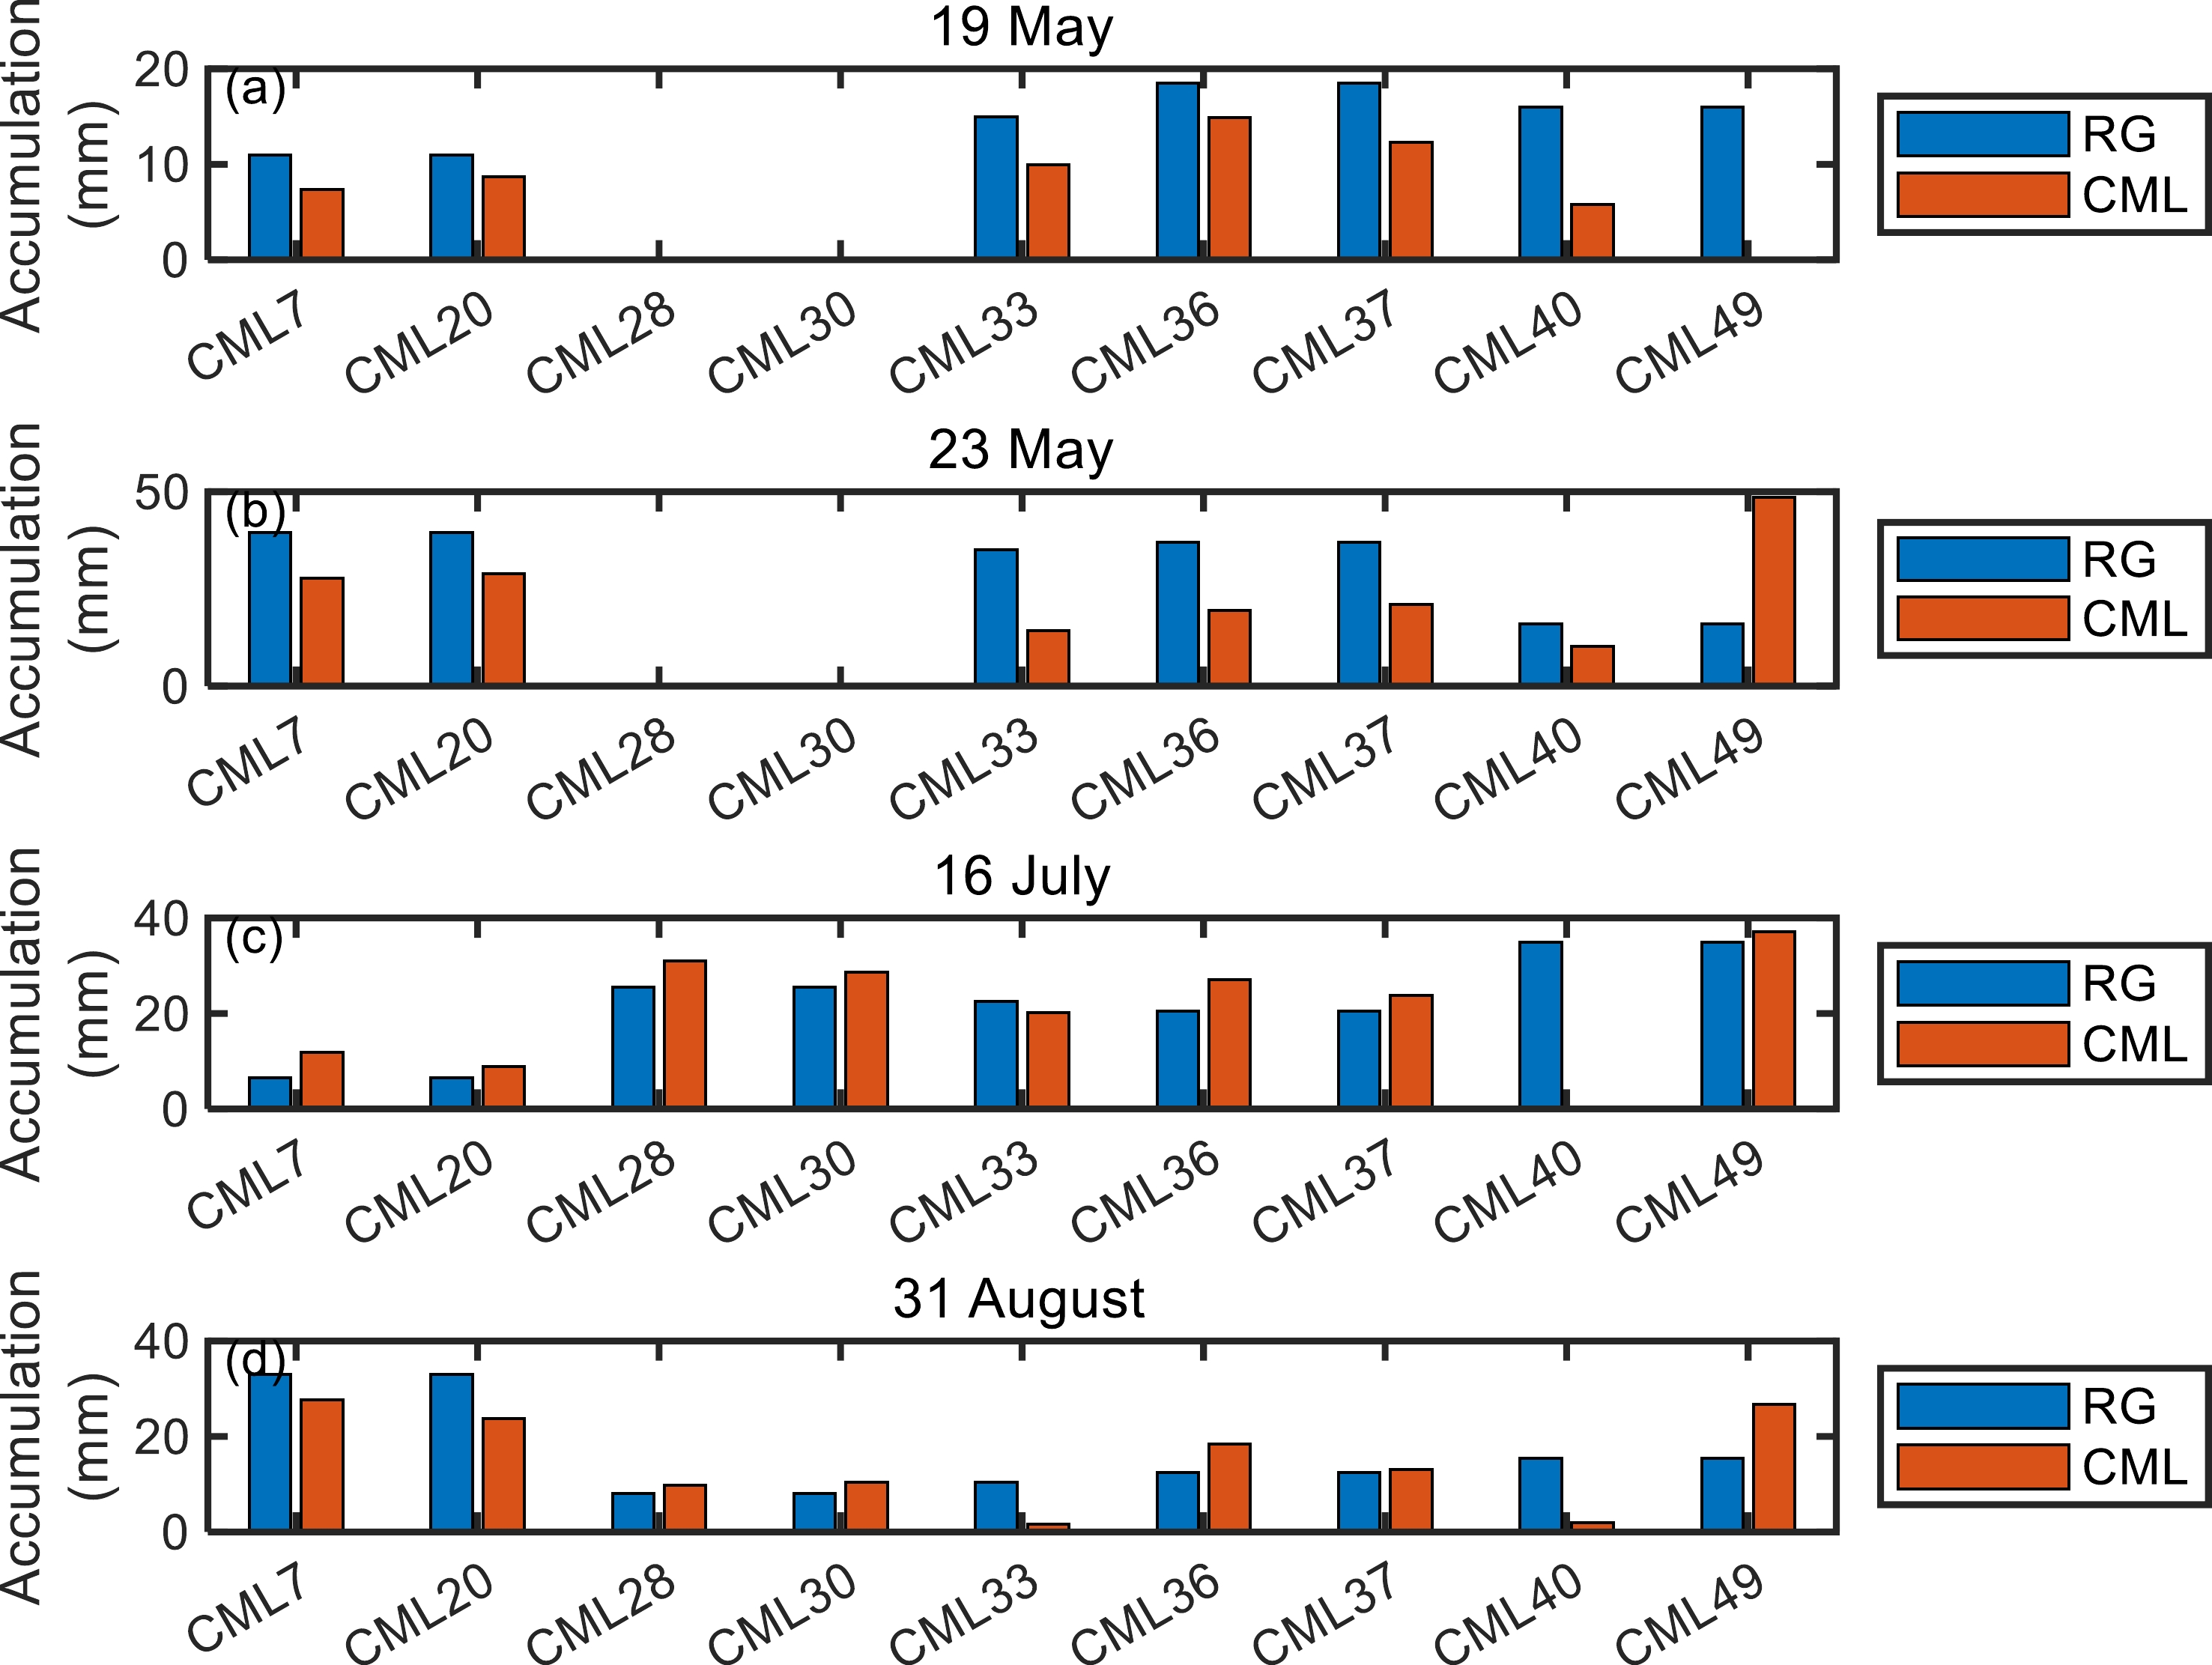
A total of 9 CMLs (CML7, CML20, CML28, CML30, CML33, CML36, CML37, CML40, and CML49) are selected for analysis, considering that there is an RG at one end of each CML to verify the inversion results. Here, CML40 and CML49 correspond to RG1, CML28 and CML30 correspond to RG2, CML33 corresponds to RG3, CML36 and CML37 corresponds to RG4, CML7 and CML20 corresponds to RG5. Based on the inversion method described in the previous section, the inversion of four typical heavy rainfall days is shown in Fig. 10 for 9 CMLs. Figures 10a, 10b, 10c, and 10d show the daily accumulation as recorded by the rain gauges and as computed by CML inversion on 19 May, 23 May, 16 July, and 29 August, respectively. The high false positive rate in Fig. 8 seems to correspond to an underestimation of cumulative rainfall, but the results in Fig. 10 do not always agree with this assertion. The accuracy of the daily accumulation by CML inversions was not stable, which could be related to different rainfall events with differing rain rate distributions. For example, as shown in Fig. 10, daily accumulation based on ML was always underestimated relative to RG on 19 May and 23 May, and the opposite was true on 16 July.
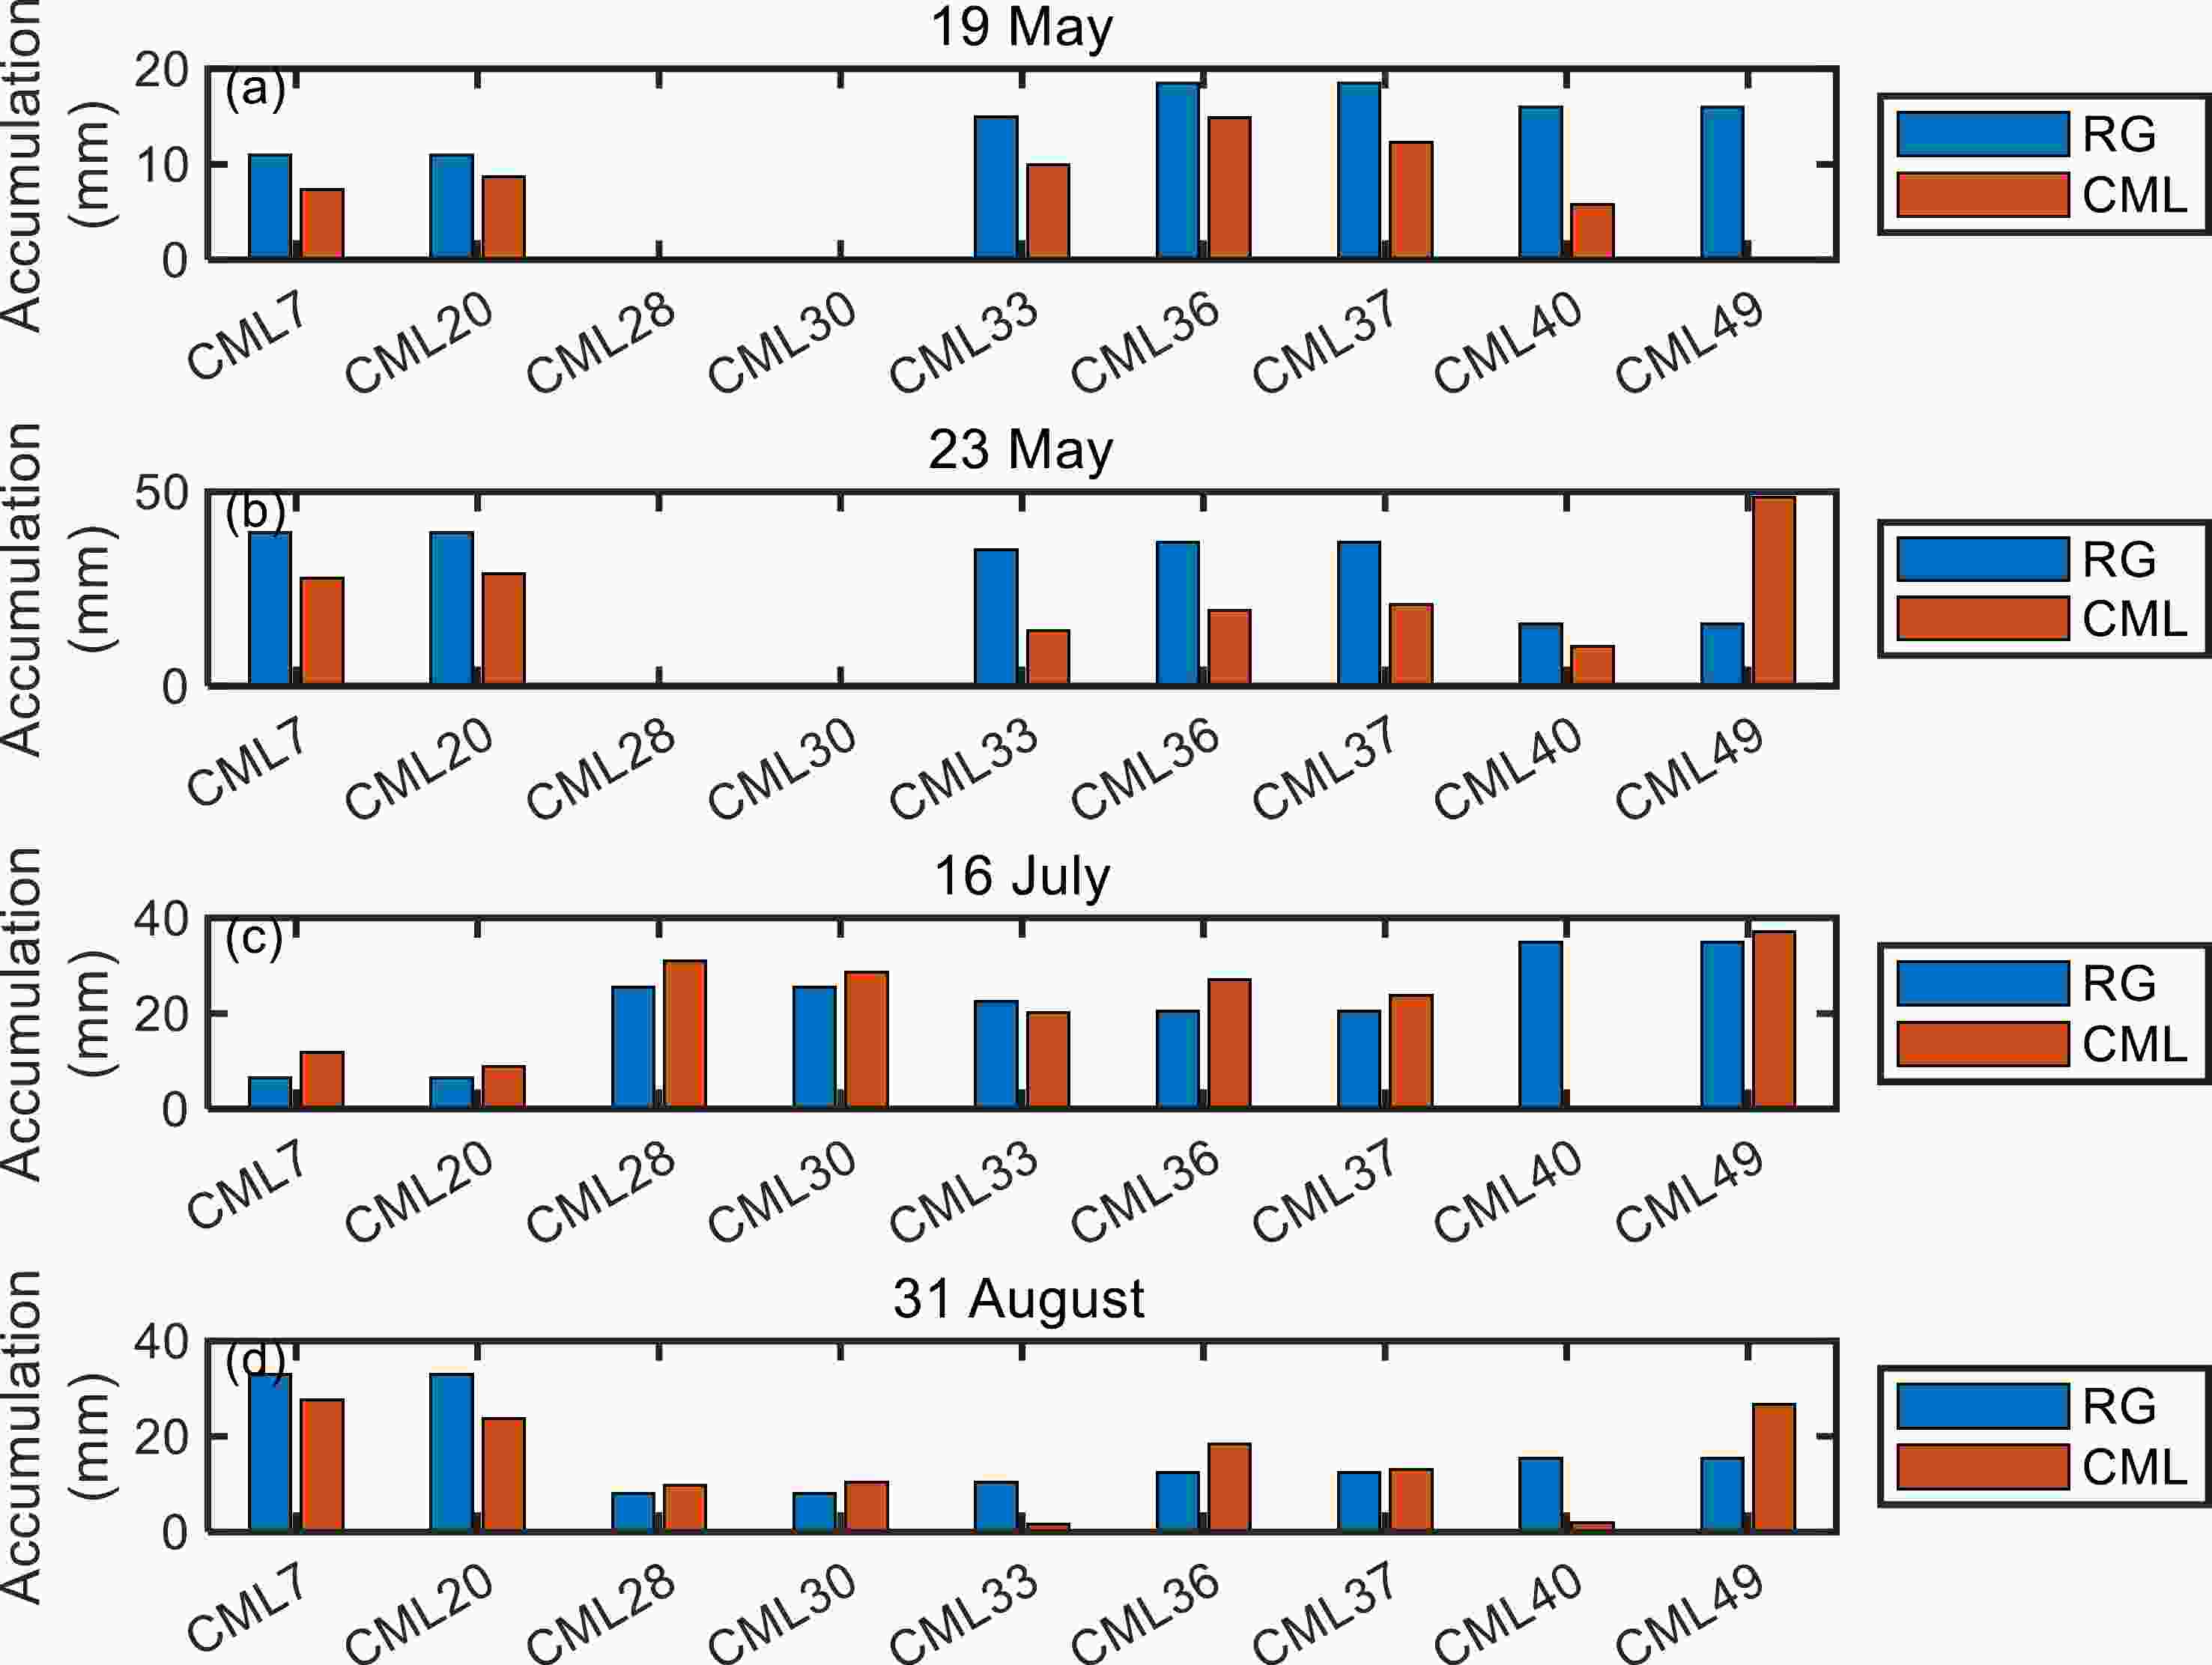
Figure 10. Rainfall accumulation inverted by 9 CMLs compared with that of the corresponding RGs for four rainfall days.
However, it should not be ignored that there is still underestimation or overestimation. There may be several reasons. First, we have assumed that wet antenna attenuation is a fixed constant, but it is actually a complex dynamic value. Therefore, for a specific rainfall event, the value of the path rain-induced attenuation can be overestimated or underestimated. A real-time dynamic correction method proposed for wet antenna attenuation based on the LSTM algorithm can alleviate this problem (Pu et al., 2020a). However, due to the amount of data, it is still difficult to apply to this test area; consequently, this is one of the areas targeted for improvement in the next stage. Additionally, rain gauge observations represent rainfall information over a very limited spatial range. Yet, the CMLs reflect the rainfall information of the average path, which may induce obvious error sources along spatial ranges of several kilometers. Perhaps a higher density of rain gauges along the links in the future could alleviate the problem. Furthermore, CMLs are not intended to be stable professional rainfall measuring instruments; they are mainly designed for microwave relay communication. The influence of environmental attributes (such as temperature and humidity) on circuit performance may also cause the recording intensity of electrical signals to fluctuate. In the next stage, establishing statistical correlations between temperature, pressure, humidity, and other meteorological elements and CML signal fluctuations may be helpful to advance a more refined model to correct the errors caused by the above factors. A scatter diagram of rainfall accumulation for all rainfall events obtained by comparing RG and CML measurements is shown in Fig. 11. The classification criteria of rainfall events are as follows with RG data. There is a period of no rain for 3 hours before and after the event, the interval of rainfall in the middle is for no more than 3 hours, and the accumulative rainfall time is more than 30 minutes. According to the criteria, the rainfall minutes vary from 35 to 270 minutes. Overall, the rainfall accumulation obtained by CML inversion is consistent with the RG observations.
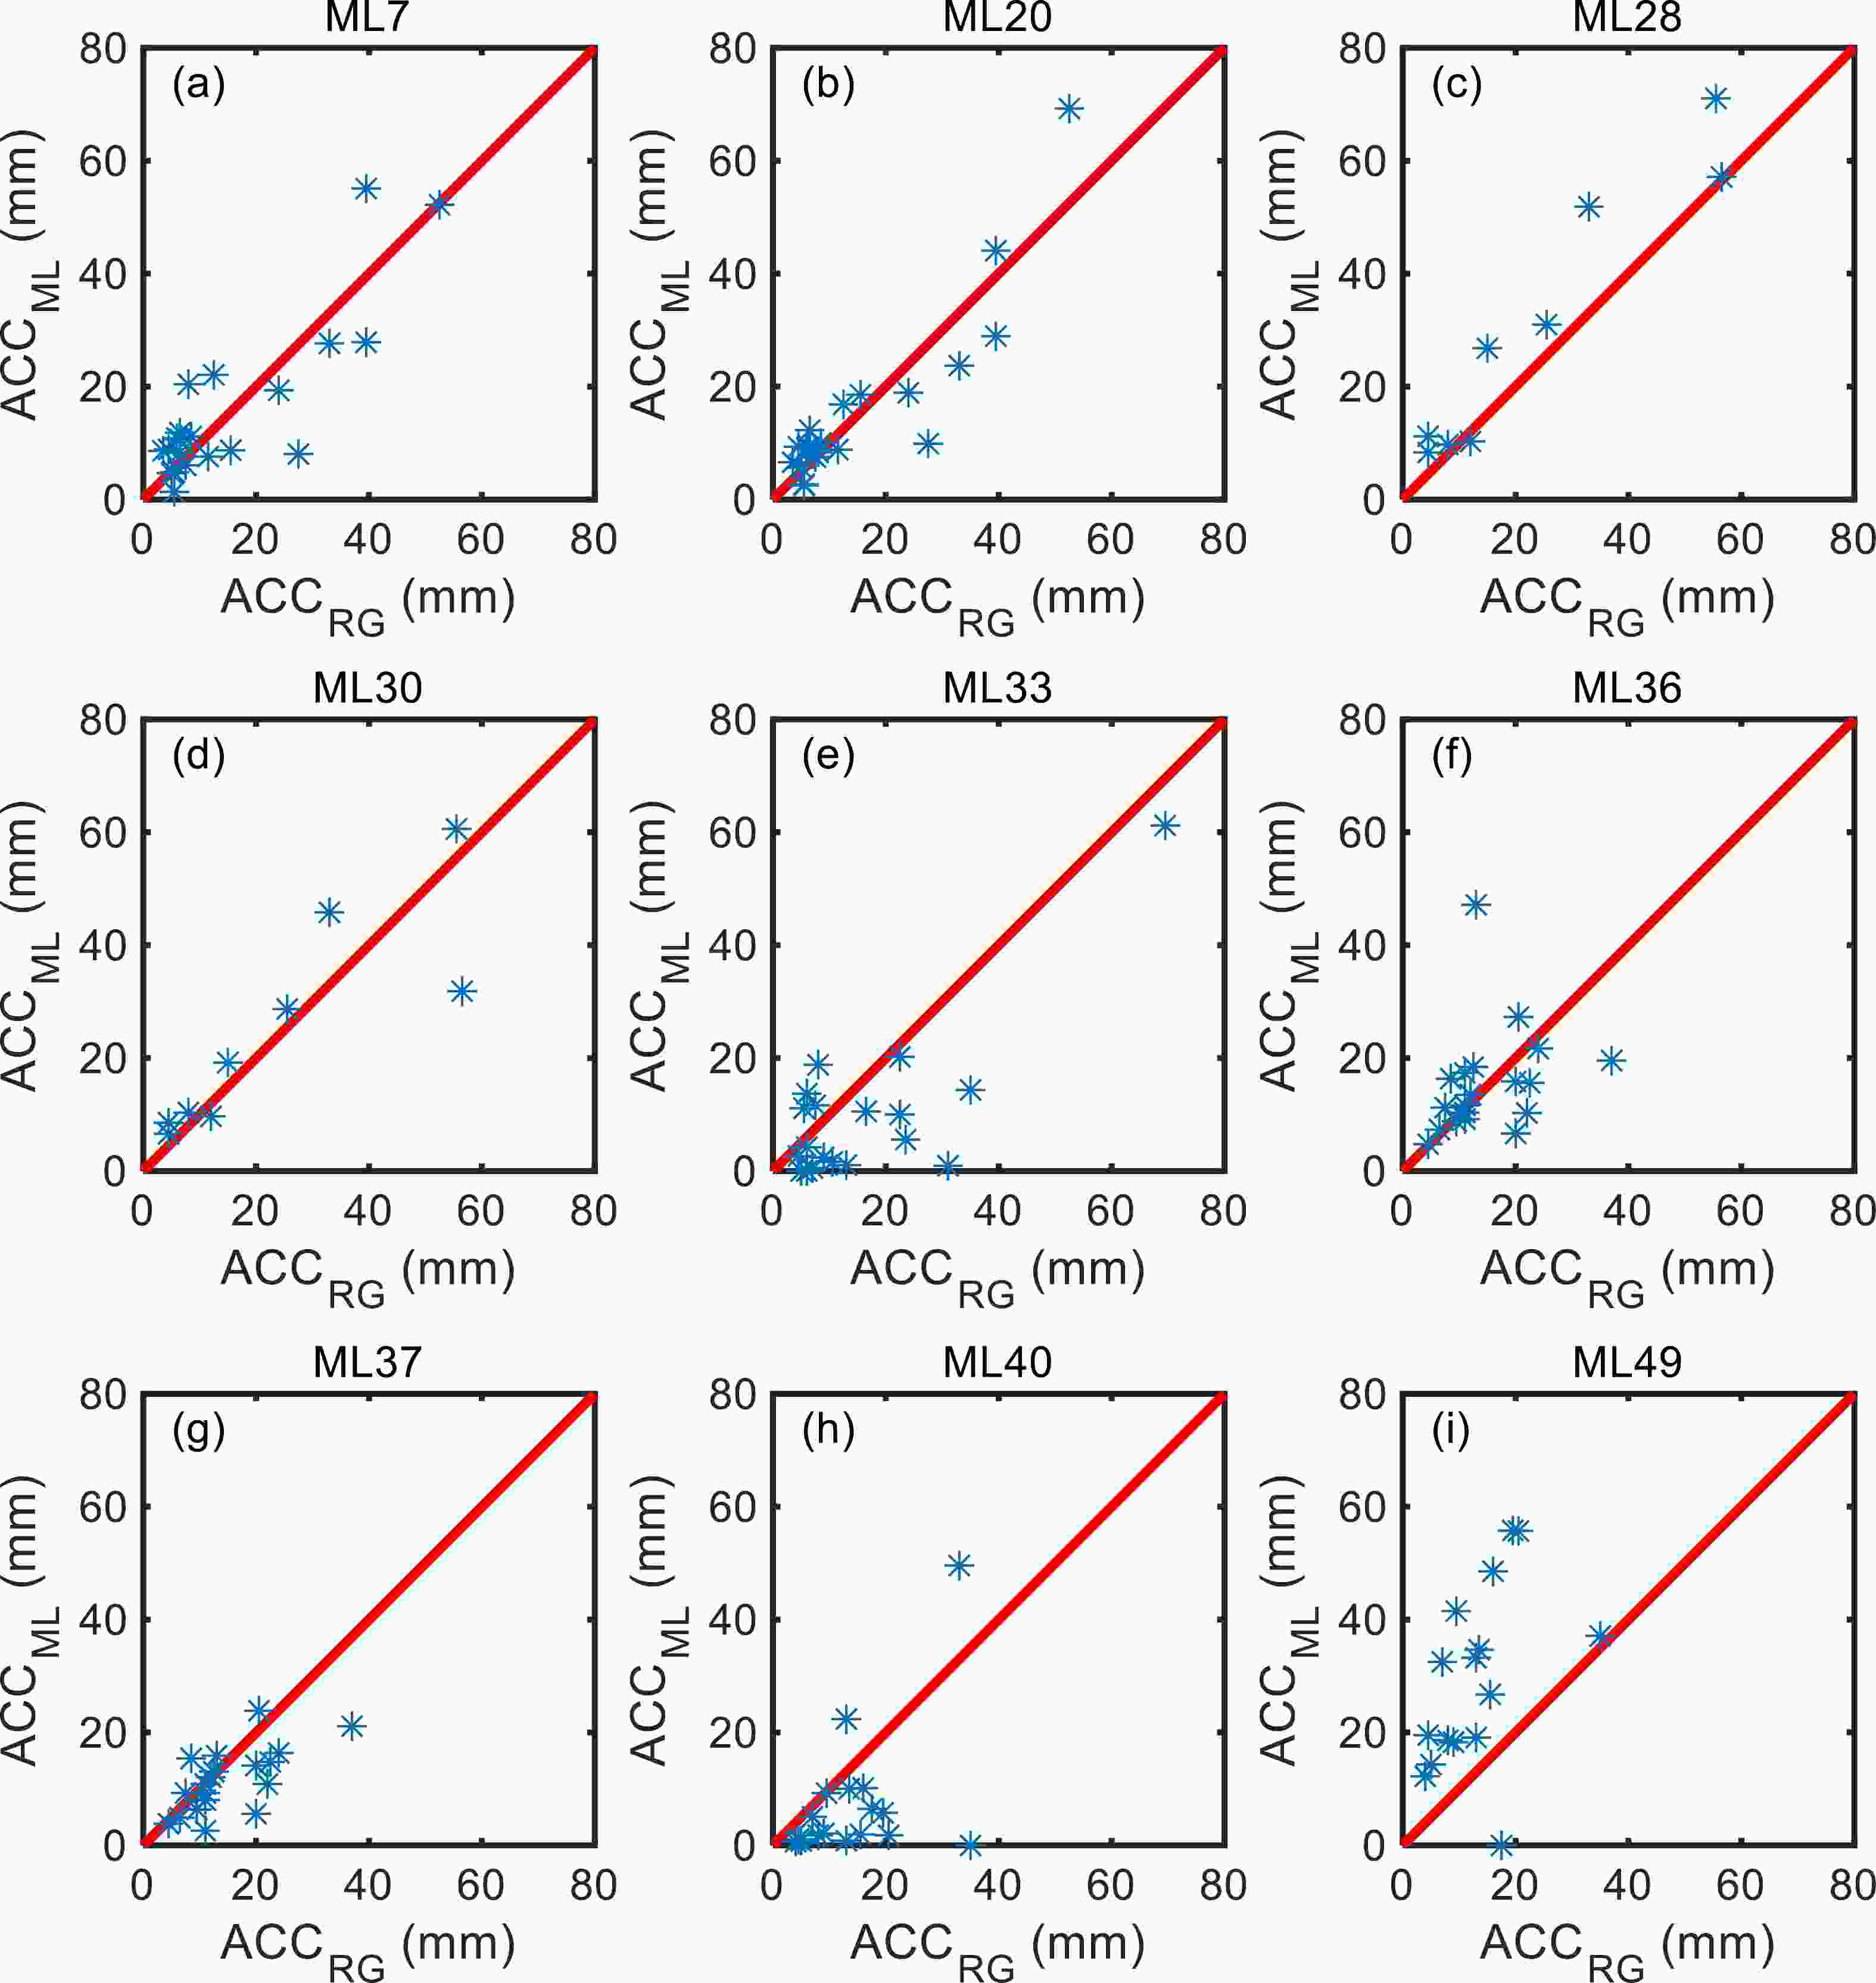
Figure 11. Scatter diagram of rainfall accumulation inverted by CMLs [(a) CML7, (b) CML20, (c) CML28, (d) CML30, (e) CML33, (f) CML36, (g) CML37, (h) CML40, (i) CML49] compared with that of the corresponding RGs for all rainfall events.
-
Considering that most of the CMLs are located in eastern Jiangyin city, only the rainfall field between 31.7°−32.0°N and 120.2°−120.4°E is reconstructed. Figure 12 shows the reconstruction of the two-dimensional rainfall field using the CMLs network in a time sequence. Here, we only display nine continuous results (0811 to 0819 LST) on 15 August 2021. The temporal and spatial variations in the rainfall field are inverted effectively, and the motion of rain cells and the fluctuation in peak/weak rain rates can be monitored successfully, which is of great significance for regional rainfall monitoring and alerts.
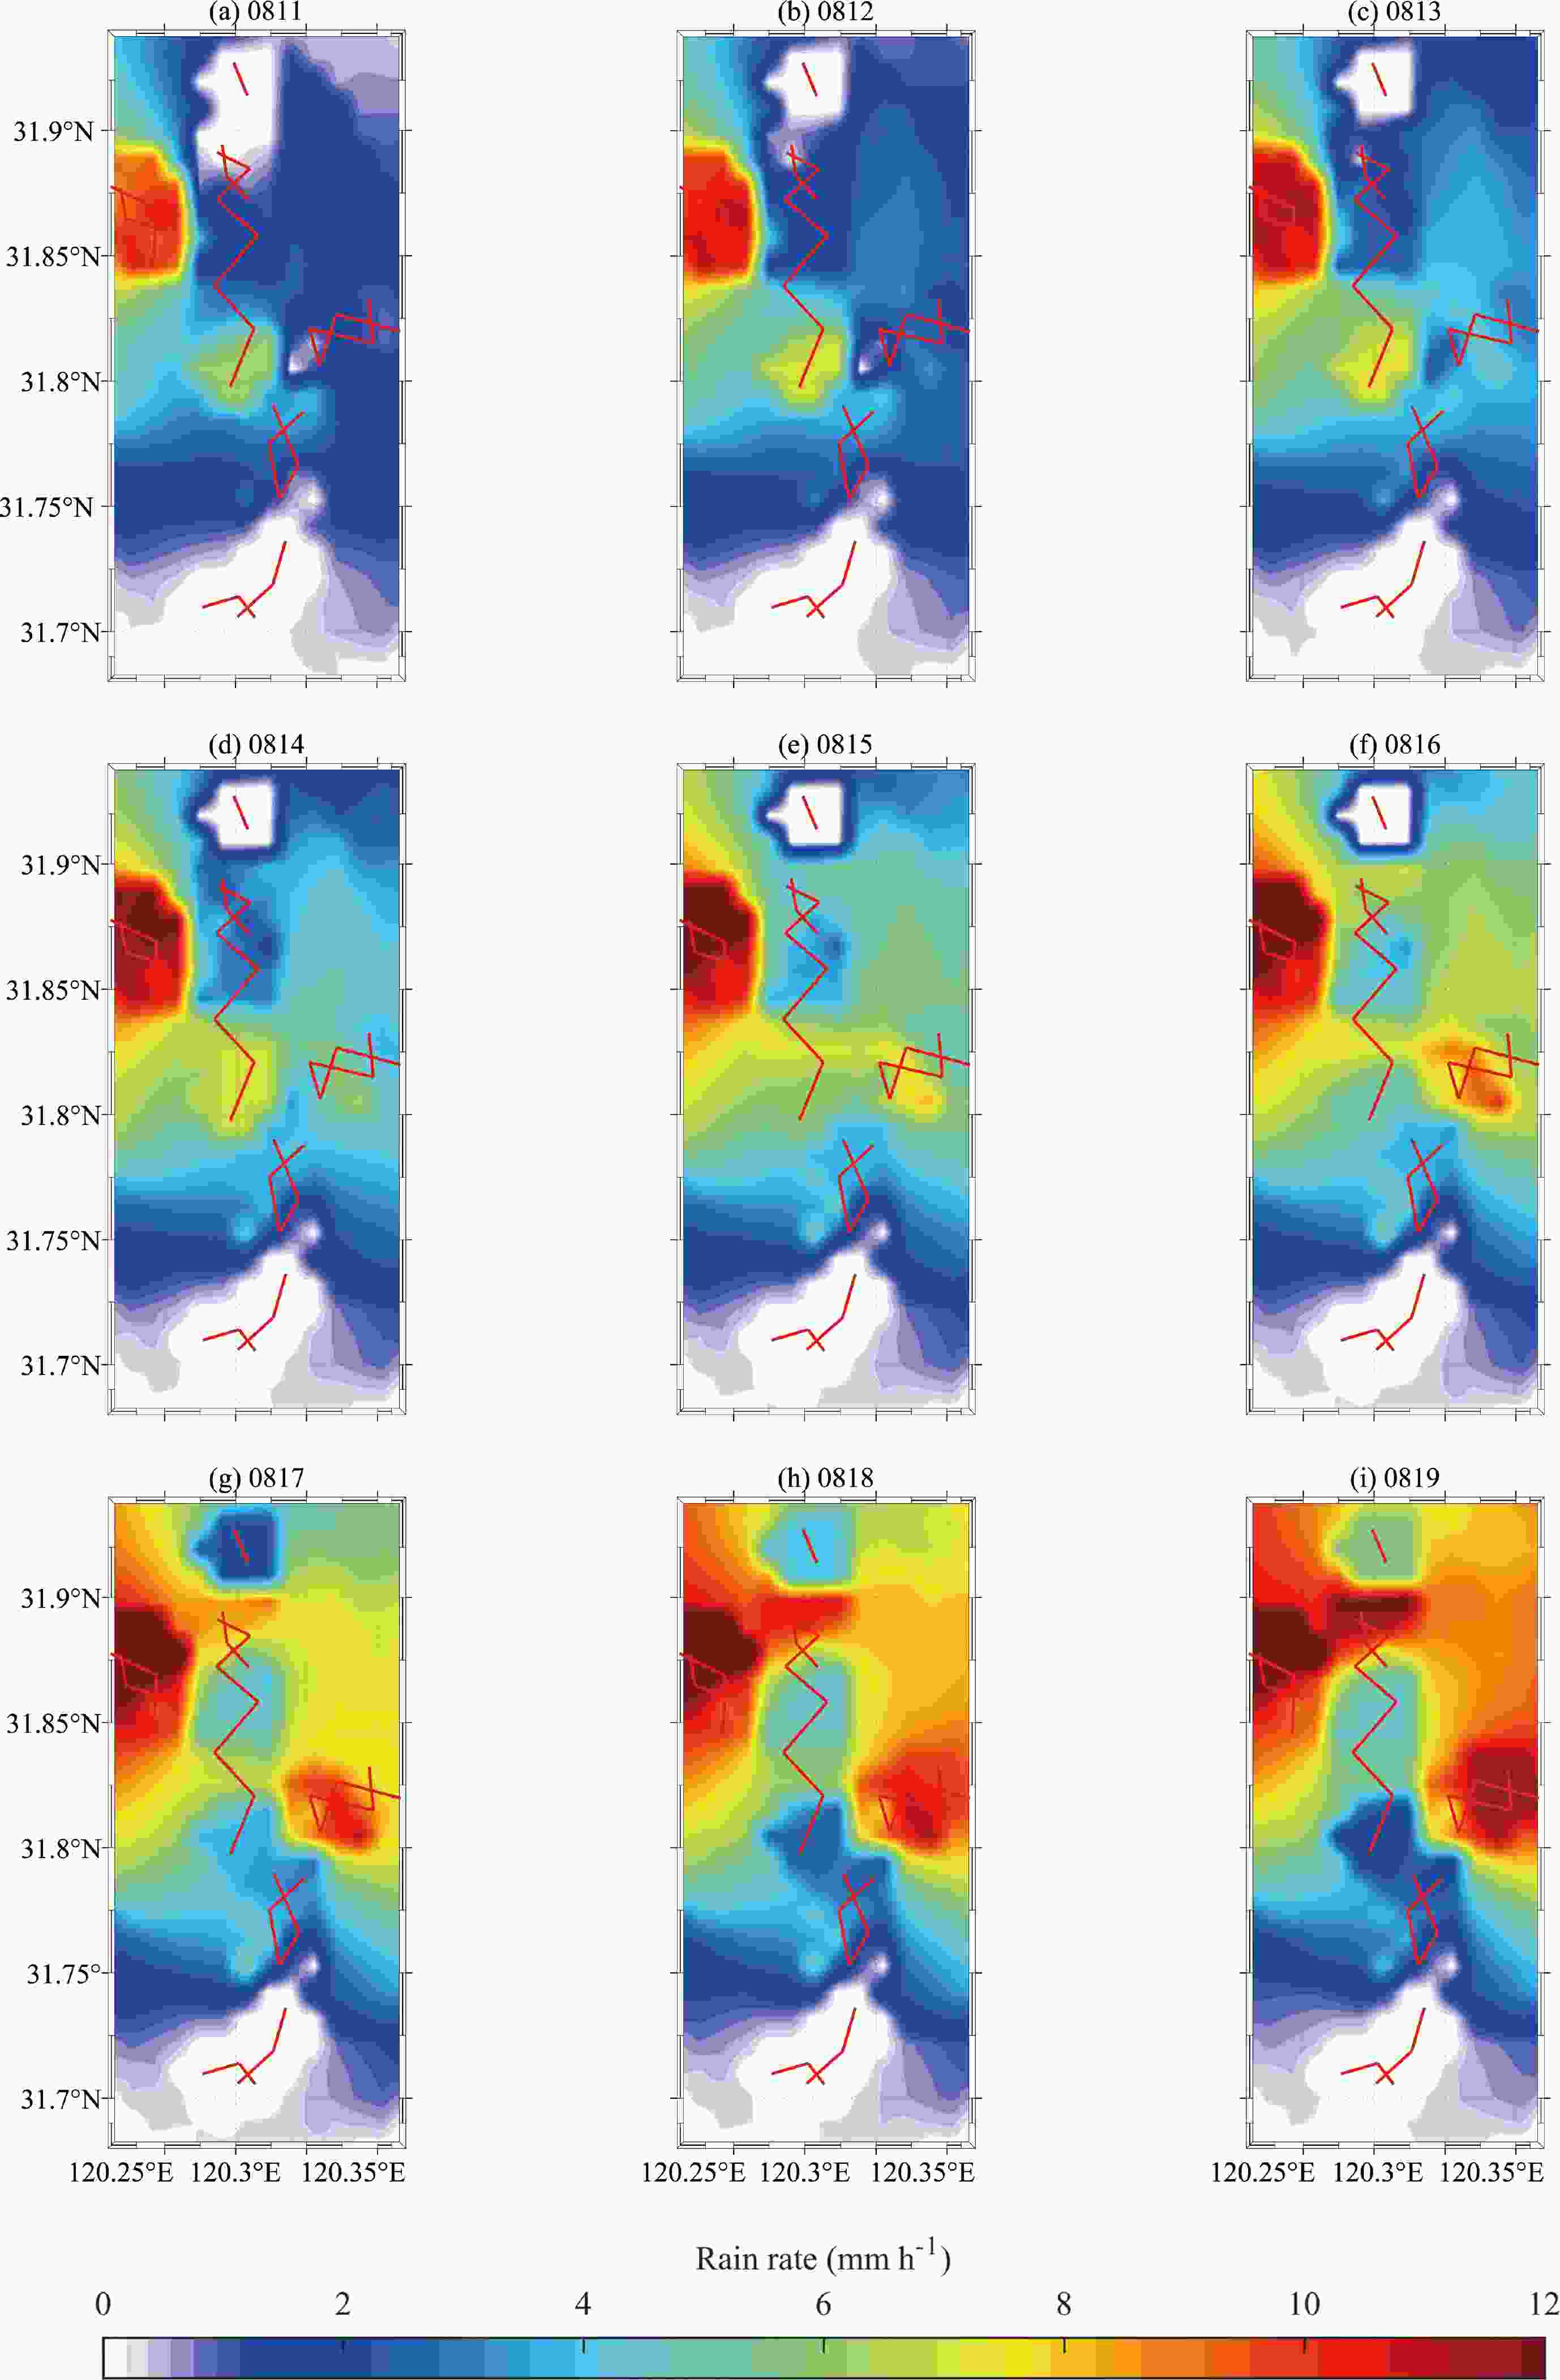
Figure 12. Reconstruction results of the two-dimensional rainfall field by the CML network from 0811 to 0819 LST on 15 August 2021.
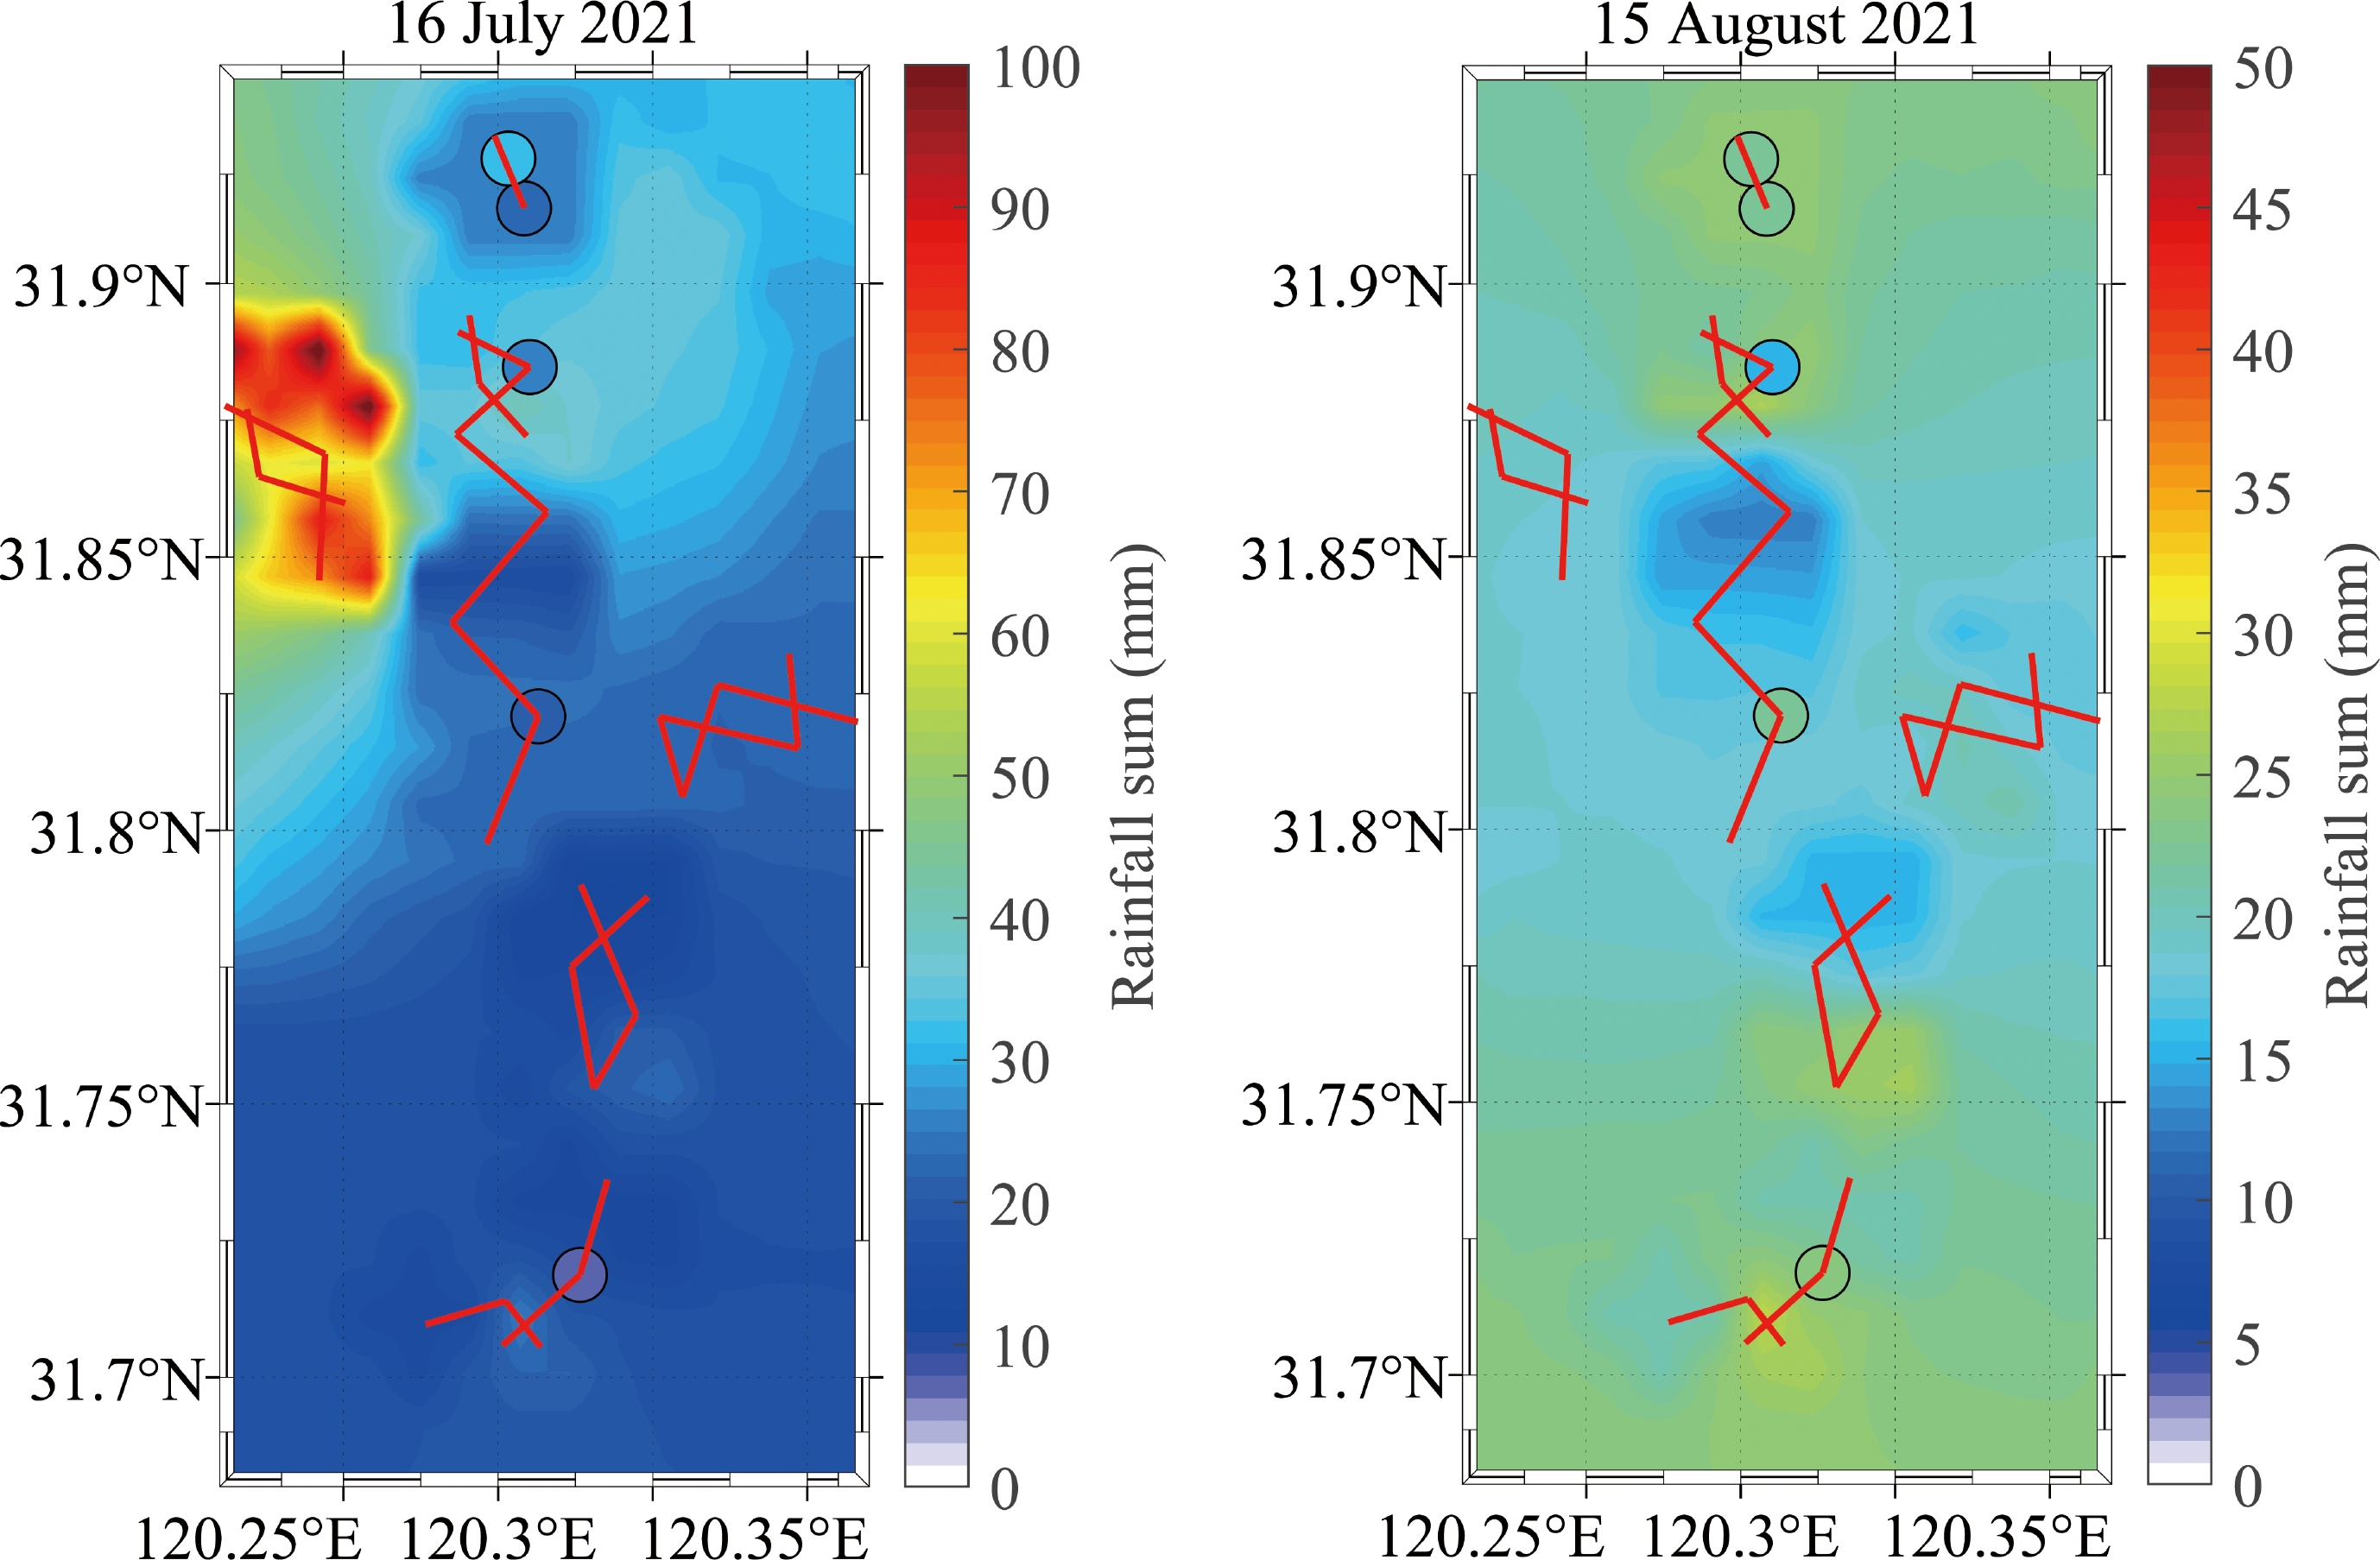
Figure 13 shows the comparison of the rainfall map of daily accumulation with the rain gauge results. Overall, the rain gauge data agree well with the rainfall map. The RMSEs between the reconstructed rainfall field and rain gauge data were 9.594 mm on 16 July and 5.749 mm on 15 August. The possible reason might be the sampling error of the tipping bucket rain gauge. Considering that the minimum rainfall amount it can measure is 0.5 mm, it follows that rainfall with rates < 6 mm h−1 cannot be measured precisely by this type of gauge; furthermore, heavy rainfall might be underestimated due to the water loss when the bucket turns over (Liu et al., 2019).
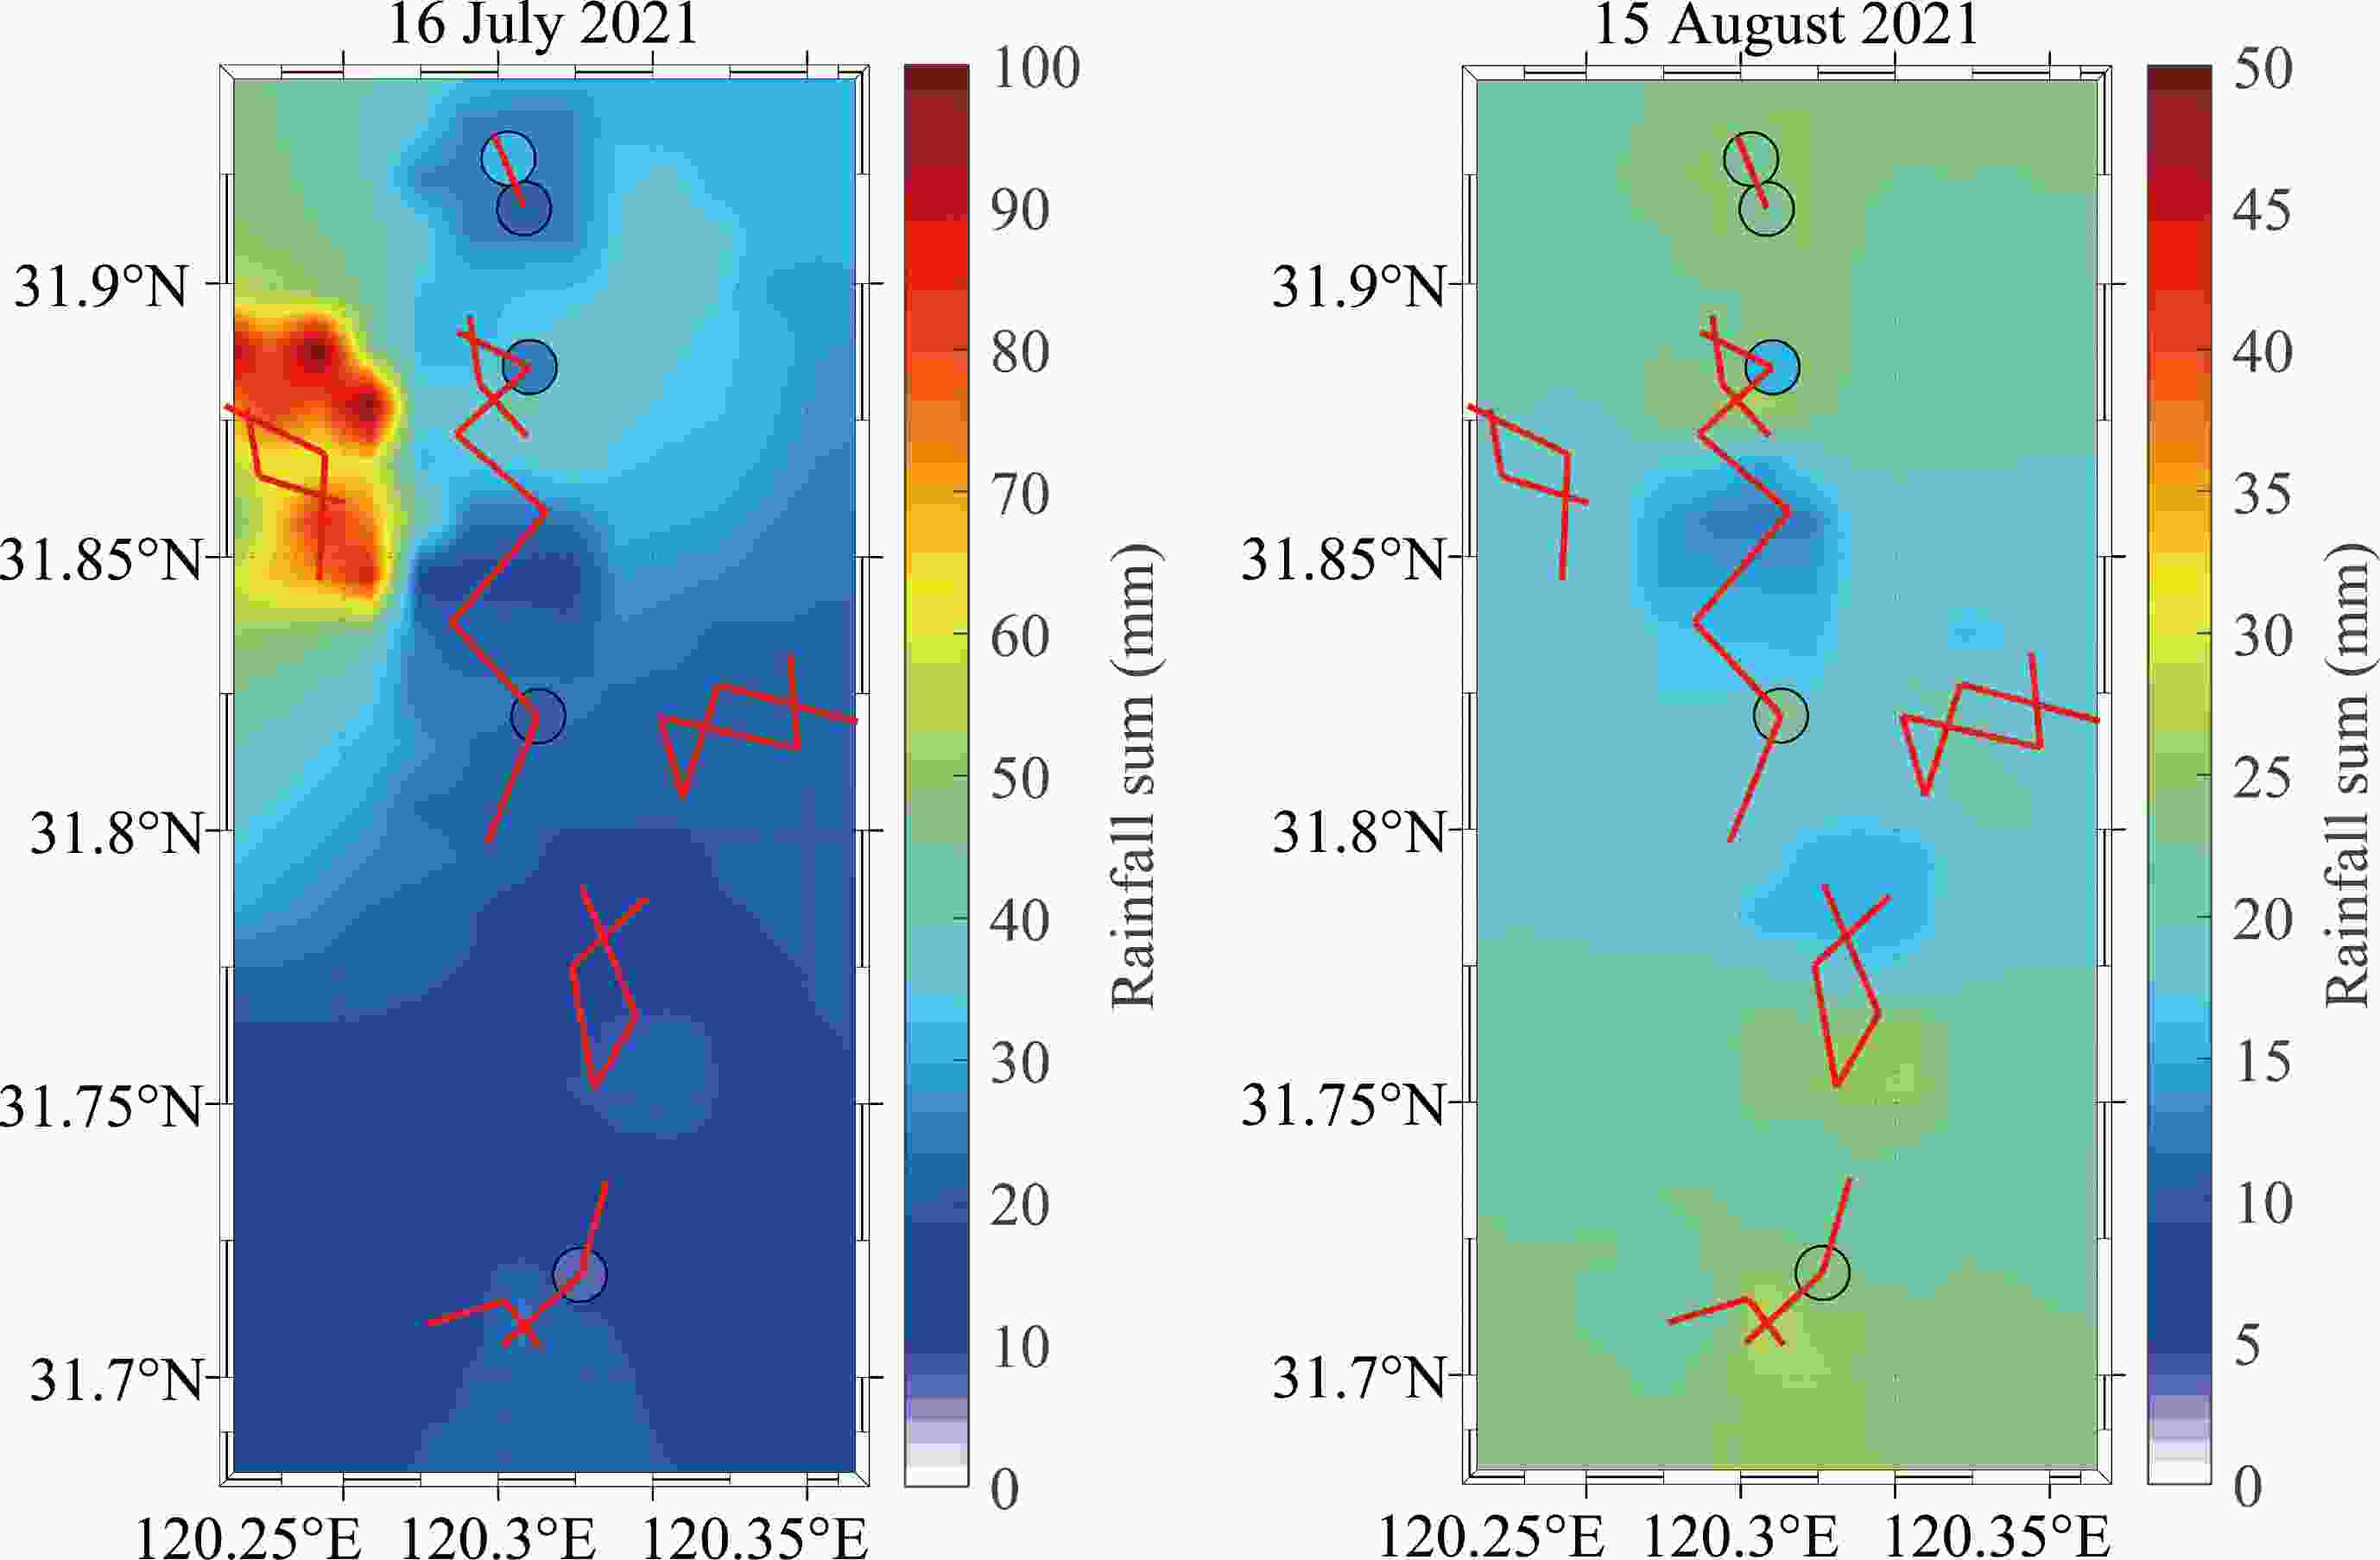
Figure 13. Daily accumulation rainfall map including rain gauge data and CML locations on 16 July 2021 and 15 August 2021. The color in the black circle denotes the rain rate, as measured by rain gauges.
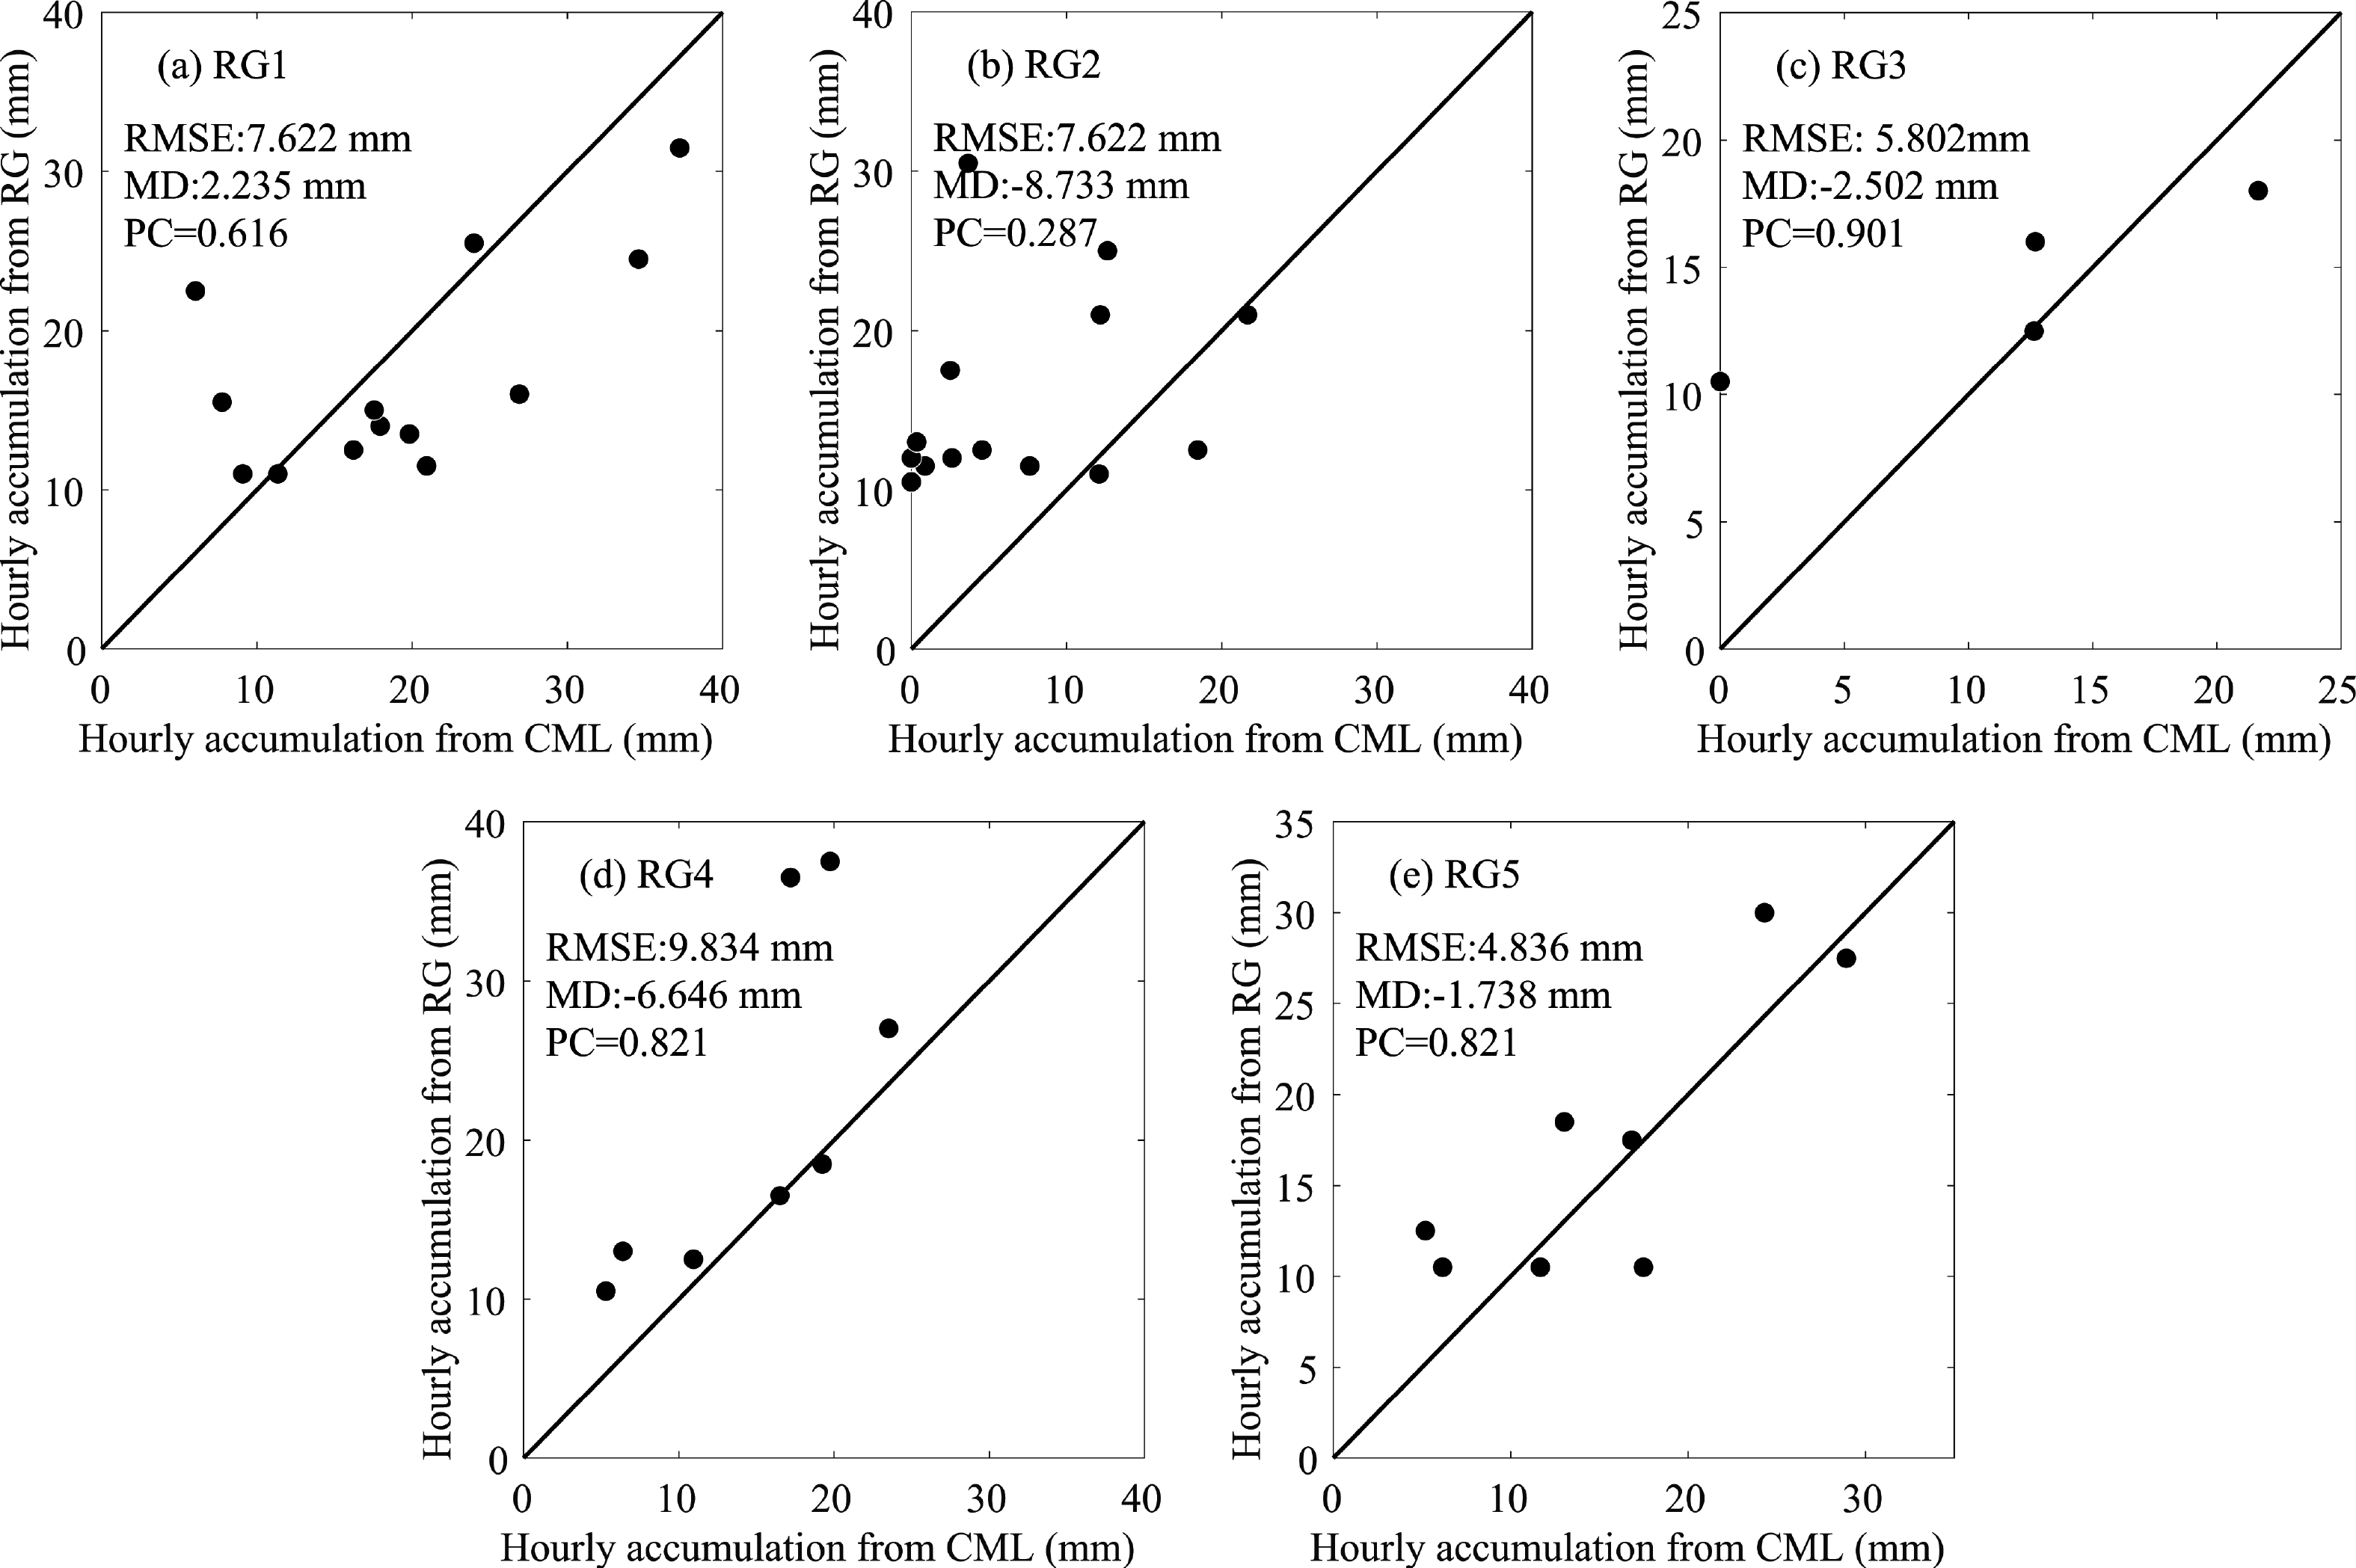
Figures 14 and 15 show the comparison of hourly rainfall accumulation between rain gauges (RG1 to RG5) and the rainfall field from CML at corresponding positions. When the rain rate does not exceed 10 mm h–1, the RMSE of the hourly rainfall accumulation between RG and CML is below 1.3 mm, the AD of the hourly rainfall accumulation between RG and CML ranges from –0.02 mm to 0.18 mm, and the Pearson correlation coefficient (PC) is higher than 0.43. When rain rates exceed 10 mm h–1, the RMSE is below 9.84 mm, and the AD ranges from –8.73 mm to 2.24 mm.

Figure 14. The comparison of hourly rainfall accumulation between rain gauges (RG1 to RG5) and the rainfall field from CML at corresponding positions with a rain rate below 10 mm h–1.
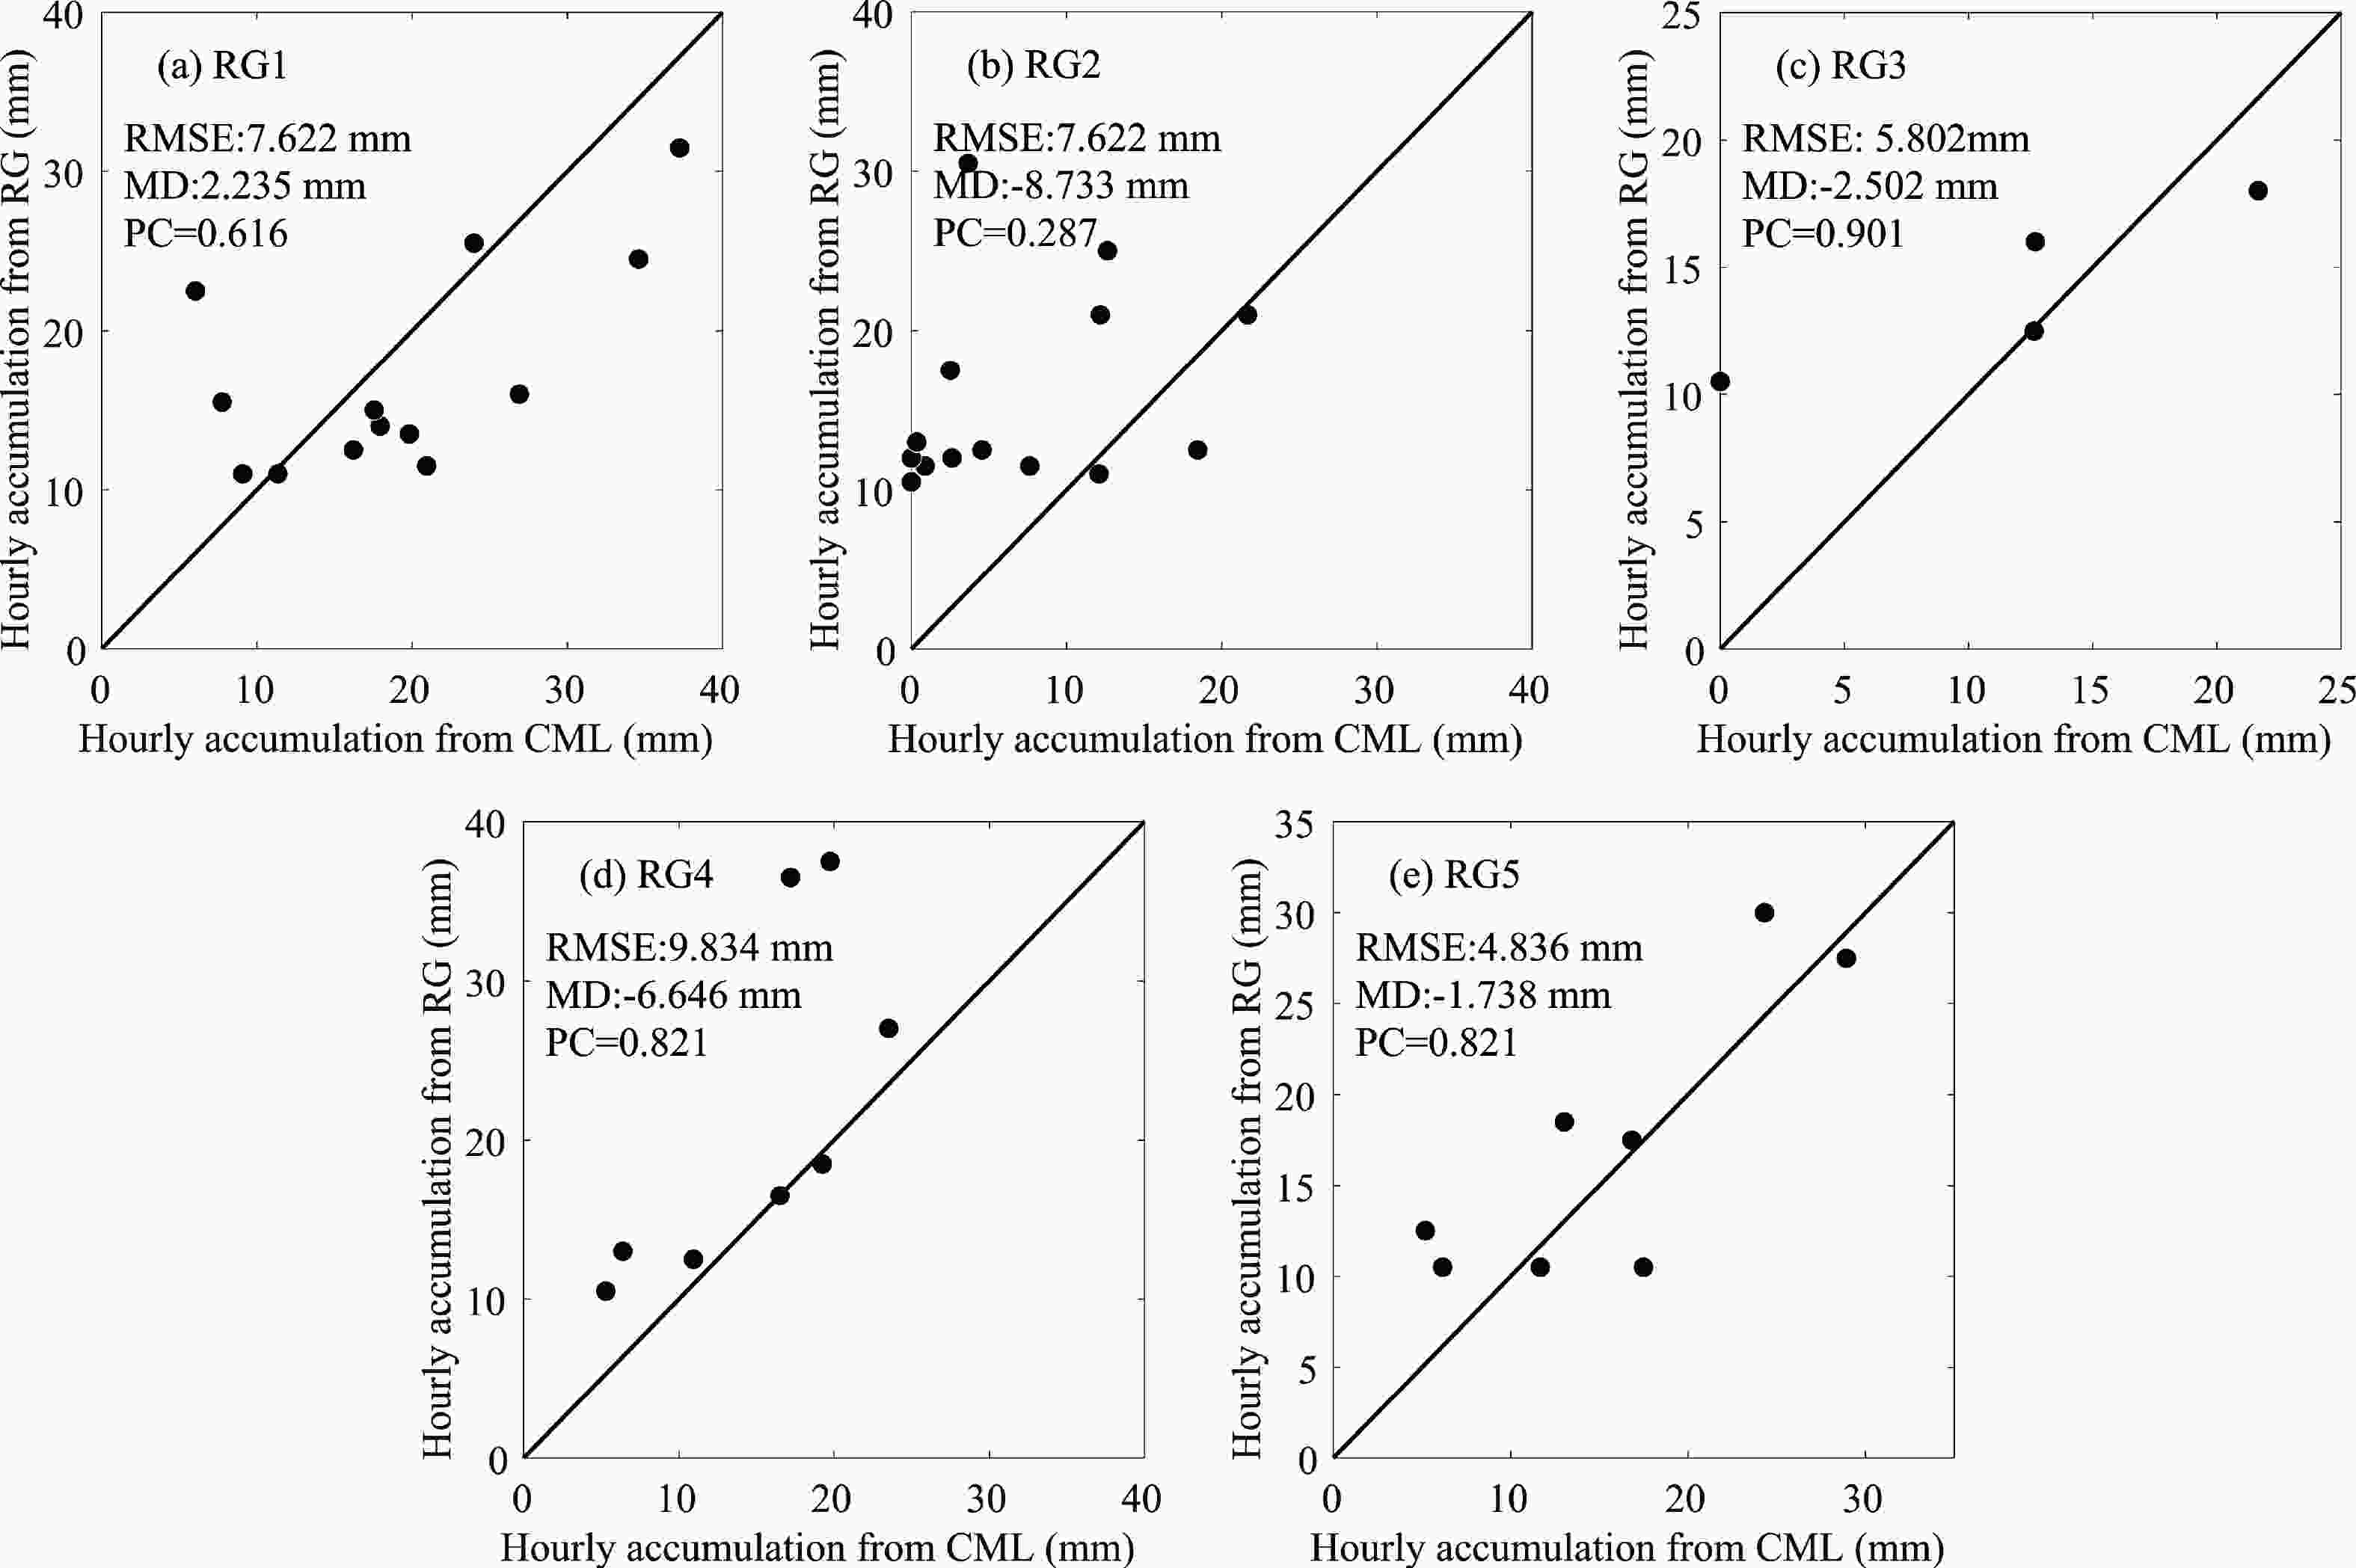
Figure 15. The comparison of hourly rainfall accumulation between rain gauges (RG1 to RG5) and the rainfall field from CML at corresponding positions with rain rates exceeding 10 mm h–1.
Figure 14 shows that many false positives and false negatives appear in the hourly rainfall when the rainfall is less than 10 mm, and this phenomenon is significantly reduced after the rainfall exceeds 10 mm. Such phenomena might be associated with inversion errors, the interpolation technique, and the variability in the spatial distribution of rainfall fields. Although there are a certain number of underestimated or overestimated samples due to the variability in the spatial distribution of rainfall fields, this reconstruction method can be accepted as a large-scale rainfall monitoring method.
-
This paper introduces the first long-term rainfall monitoring experiment using a CML network in East China. Using an array of rain gauges and one disdrometer, the rainfall monitoring capability of CMLs is tested and discussed. The parameters of the A-R relationship for rain rate inversion are optimized by minimizing the rainfall accumulation error of historically observed rainfall events. The results show that the inversion results of rainfall accumulation by CMLs agree well with the observation results of rain gauges. It should be noted that there are still some unneglectable discrepancies in some rainfall events. The possible reasons and further improvements can be summarized as follows.
(1) There are inevitable differences between the pointwise rain rate obtained by rain gauges and the path-averaged rain rate inverted by microwave links, which can be attributed to the different spatial representations of the two sampling methods. The rain rate inversion by CMLs can be further improved by optimizing the attenuation baseline determination and A-R relationship parameters.
(2) Based on the path-average rain rate inverted by each microwave link, the rainfall field (also called the grid rain rate) can be reconstructed using interpolation algorithms, which can fill the void where there is no CML coverage and further improve the spatial representation of CML measurements. Future work will investigate and verify the reconstruction and nowcasting algorithms using CML networks.
(3) As an opportunistic approach to rainfall measurement, the CMLs network can provide a low-cost solution for near-ground rainfall monitoring over a wide range of regions. This approach can be used to supplement operational rainfall instruments, which can also be applied where conventional meteorological instruments are either not available or where widespread deployment proves difficult.
Acknowledgements. This research was funded by the China Postdoctoral Science Foundation (2021M701650), the Excellent Youth Scholars of the Natural Science Foundation of Hunan Province of China (2021JJ20046), the Open Grants of the State Key Laboratory of Severe Weather (Grant 2021LASW-A01), and the National Natural Science Foundation of China (Grant No. 42222505). The authors would like to thank the anonymous reviewers for providing helpful advice. The authors also thank Jiangsu M&R Intelligent Technology Co., Ltd, China, for constructing and maintaining the CMLs network.
Rainfall Monitoring Using a Microwave Links Network: A Long-Term Experiment in East China
- Manuscript received: 2022-04-25
- Manuscript revised: 2023-01-05
- Manuscript accepted: 2023-01-28
Abstract: The first long-term rainfall monitoring experiment using the commercial microwave links (CMLs) network in East China is introduced. The network, located in Jiangyin, Jiangsu Province, consists of 49 links with frequencies ranging from 15 GHz to 26 GHz and lengths from 1.14 km to 4.78 km. An OTT PARSIVEL disdrometer is deployed to refine the local rain-induced attenuation relationship, and the CML observations are compared simultaneously with five rain gauges. The inversion parameters of the CML are optimized by minimizing the error of the accumulated rainfall of historical rainfall events. The inversion results show that the daily accumulated rainfall retrieved by the CMLs agrees well with the rain gauge measurements. As an opportunistic approach to monitor near-surface rainfall with high spatiotemporal representativeness and accuracy, the CML network can be used to monitor and forecast urban flood disasters, especially in regions where the widepread deployment of conventional meteorological instruments is impractical.
-
Keywords:
- rainfall monitoring,
- microwave links,
- rain rate inversion,
- path-average rainfall accumulation,
- rainfall field
摘要: 本文介绍了我国华东地区首次利用微波链路网络进行的长期降雨监测实验。该网络位于江苏省江阴市,由49条链路组成,频率范围为15 GHz至26 GHz,长度为1.14 km至4.78 km。此外,还部署了一台OTT PARSIVEL雨滴谱仪来修正局地雨衰关系(微波链路衰减系数与雨强的关系),并将微波链路反演结果与五个雨量计进行了比较,通过反演误差的最小化来优化微波链路的反演参数。反演结果表明,微波链路反演的日累积降雨量与雨量计测量结果具有良好的一致性。微波链路网作为一种具有高时空代表性和准确性的监测近地表降雨的潜在方法,在城市洪涝灾害监测与预警,尤其是在常规气象仪器难以广泛部署的地区具有广泛的应用前景。


 AAS Website
 AAS WeChat