


 DownLoad:


-
The accurate representation of microphysical processes in atmospheric models is key for quantitative precipitation forecasting and climate change assessment (Stoelinga et al., 2003; Khain et al., 2015; Morrison et al., 2020). Bulk microphysics schemes have been considerably improved over the past several decades. Parameterizations of hydrometeors and physical processes have advanced from early one-moment schemes [e.g., Lin et al. (1983) and Rutledge and Hobbs (1984)] to more sophisticated two-moment schemes (Reisner et al., 1998; Morrison et al., 2005; Thompson and Eidhammer, 2014). Previous studies have also developed detailed multimoment schemes (Milbrandt and Yau, 2005; Chen and Tsai, 2016; Tsai and Chen, 2020). Two-moment schemes provide advantages in simulating the ice water content and precipitation over one-moment schemes (Molthan and Colle, 2012; Han et al., 2019). The inclusion of a third moment, such as the spectral shape parameter, could further improve the gradual growth of ice particles but is more computationally expensive (Milbrandt and Yau, 2006; Chen and Tsai, 2016).
Uncertainties in the parameterization of ice microphysics remain due to the complex ice particle shapes and variable densities. Techniques related to the treatment of graupel from rimed snow in bulk microphysics schemes are usually ad hoc approaches, which may cause high uncertainties (Thompson et al., 2008). To resolve this problem, Morrison et al. (Morrison and Milbrandt, 2015; Milbrandt and Morrison, 2016; Milbrandt et al., 2021) developed a novel Predicted Particle Properties (P3) scheme by providing more predictive information on particle properties. The P3 scheme provides a user-specified number of free ice-phase categories to allow for a smooth transition of particle properties. The most notable advantage of the P3 scheme is the removal of the need for arbitrary conversion between categories, which is a significant improvement over traditional bulk microphysics schemes.
Comparisons of P3 to other microphysical schemes (Morrison and Milbrandt, 2015) suggest that the scheme could produce reasonable results at a reduced computational cost in squall line and orographic precipitation cases. Naeger et al. (2017) reported that P3 well reproduced a warm frontal snowband, which was confirmed via aircraft and radar observations. Compared to the Morrison and Thompson schemes, the P3 scheme produced the lowest underpredictions of precipitation for two atmospheric river events in November 2015 (Naeger et al., 2020). We simulated a stratiform rainfall event during April 2010 (Hou et al., 2020) and found that the single-ice category version of P3 (P3-1ice) indicated slower rainfall than the Morrison scheme by shifting the precipitation pattern eastward toward the observed rainfall conditions. As described by Milbrandt and Morrison (2016), the single-category P3 scheme exhibited the limitation of only representing two or more modes of ice particles with different bulk properties. To facilitate a better representation of multiple growth modes, the multicategory version of the P3 scheme was introduced.
In this study, we investigated the ability of the two versions of P3 in the Weather Research and Forecasting (WRF) model to simulate a stratiform cloud case on 22 May 2017. The two P3 versions are the single-ice category version plus double-moment cloud water (P3-nc) and the two-ice category version plus double-moment cloud water (P3-2ice). In the P3-1ice version, a fixed cloud droplet number concentration was used. In contrast, the P3-nc and P3-2ice versions used a prognostic number concentration of cloud droplets instead of a fixed value. A stratiform cloud case [the same 22 May 2017 case as described in Hou et al. (2021)] that occurred over northern China was simulated. In Hou et al. (2021), supercooled liquid water measurements and particle size distributions were presented to characterize cloud phase conditions and determine particle size distribution variations from convective to stratiform regions. We extended previous observational studies by focusing on the evaluation of the P3 scheme in simulating this stratiform rainfall event. The results were verified against rain gauge, radar, and aircraft data. We also conducted sensitivity experiments with different ice-cloud droplet collection efficiencies to examine the impact of riming on ice particle properties and surface precipitation.
The remainder of this paper is organized as follows. Section 2 briefly describes the cloud case and aircraft observations. Section 3 presents the model configuration and an overview of the P3 scheme. In section 4, the results of the numerical experiments are provided. Finally, conclusions are outlined in section 5.
-
The large-scale stratiform precipitation event moving over central and northern China on 22 May 2017 was associated with the passage of a cold frontal system interacting with wind shifts at lower levels. Hou et al. (2021) presented synoptic features of the stratiform cloud case. The mixed-phase cloud system was characterized by the existence of embedded convective cells with enhanced reflectivity. This paper focused on the model investigation of this rainfall event. Here, we briefly describe cloud development and aircraft measurements.
Observations for this study were obtained from airborne cloud microphysical probes, surface Doppler radars, and rain gauge measurements. Two S-band Doppler radars at Shijiazhuang and Cangzhou and one C-band Doppler radar at Changzhi provided information on cloud development. A King-350 aircraft from the Weather Modification Office of Hebei Province was used to conduct aircraft observations. Detailed descriptions of the instrumentation used in the aircraft measurements have been given by Hou et al. (2021).
Figure 1 shows the composite reflectivity at 0800 and 0900 UTC as well as the flight track. At 0800 UTC, reflectivities of 20–40 dBZ were observed (Fig. 1a). Enhanced composite reflectivity with a maximum value of 59 dBZ was observed in the region east of 113°E, corresponding to the embedded convective region within the stratiform cloud system. The cloud system then shifted south. The clouds were more organized at 0900 UTC, transitioning from a narrow band into one large echo region (Fig. 1b). To clearly visualize the flight track, Fig. 1 also shows the composite reflectivity in a zoomed-in subdomain with the flight track overlaid at 0800 and 0900 UTC.
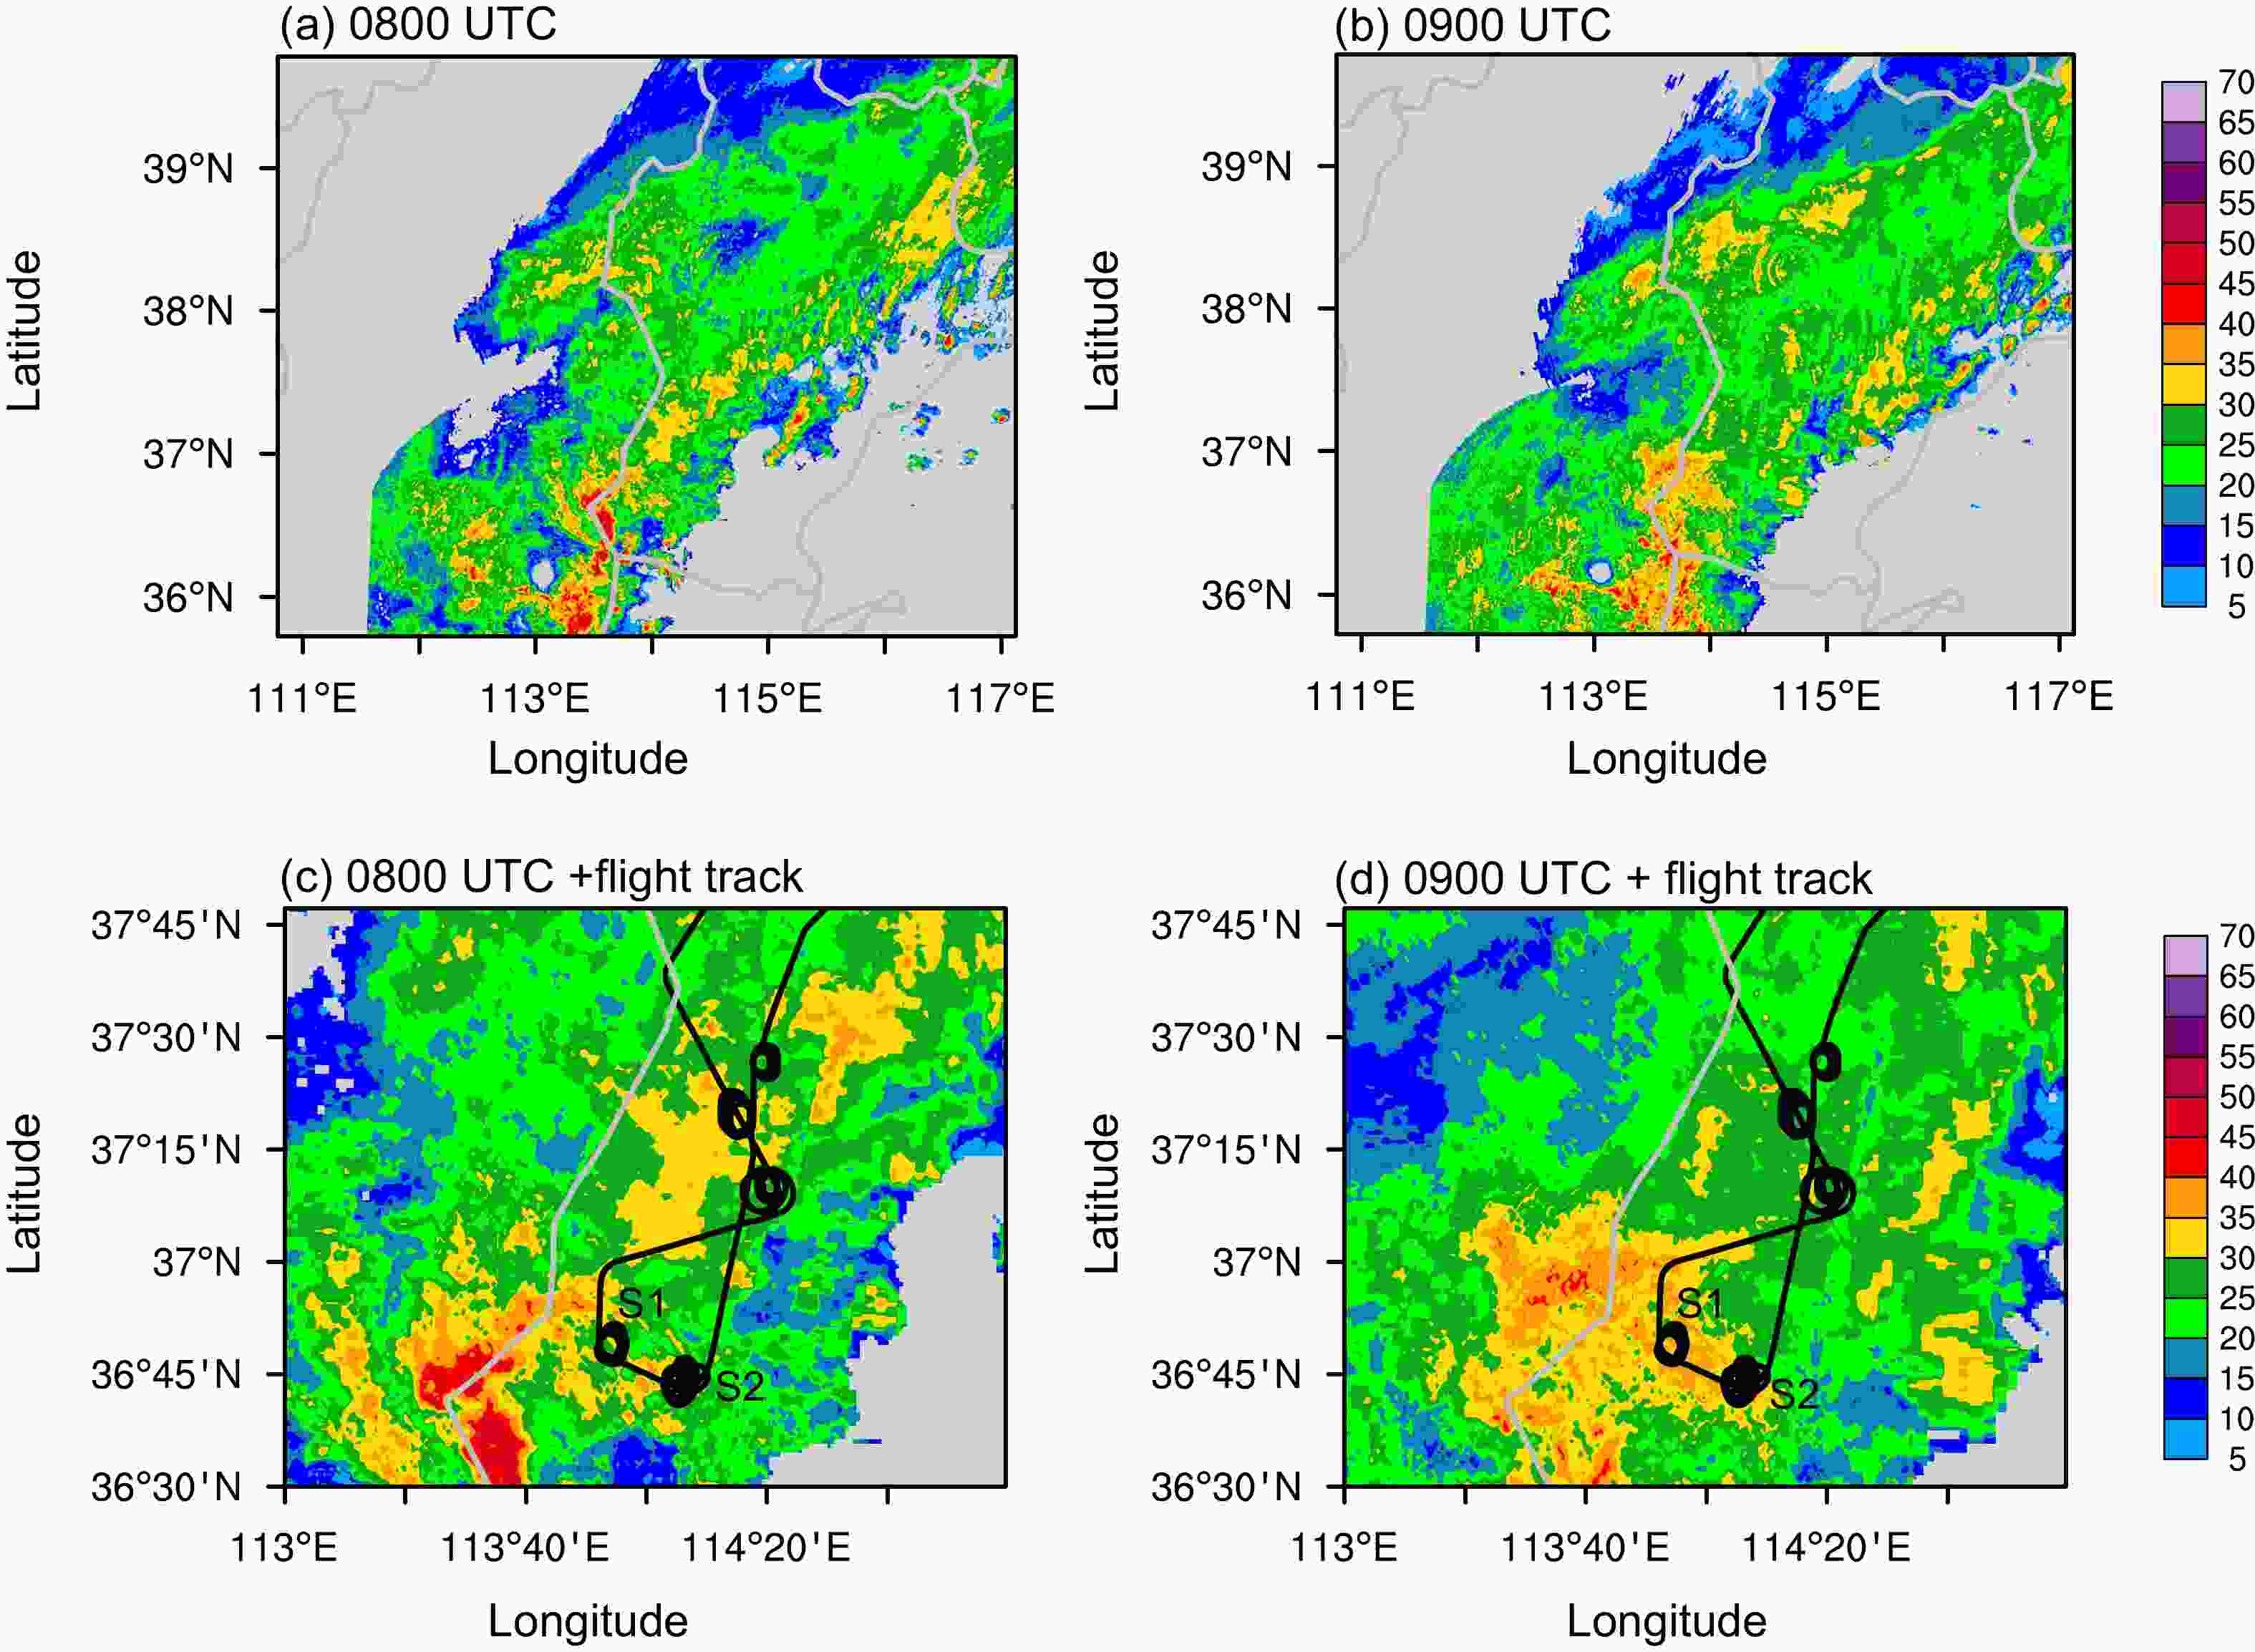
Figure 1. Composite reflectivity (units: dBZ) at (a) 0800 UTC and (b) 0900 UTC. Composite reflectivity in a zoomed-in subdomain with the flight track overlaid at (c) 0800 UTC and (d) 0900 UTC. S1 and S2 denote Spirals 1 and 2, respectively.
The aircraft performed a flight track comprising three upward spirals, two downward spirals, and one horizontal penetration (Fig. 1c). As shown in Figs. 1c and 1d, one spiral descent (S1) was conducted in the embedded convective region, and one spiral ascent (S2) was near the embedded convective region, while the other three spirals were performed in more homogeneous stratiform regions. Only data obtained during Spirals 1 and 2 were used to examine microphysical quantities within the embedded convective region.
A summary of Spirals 1 and 2 is provided in Table 1. The aircraft location in Table 1 represents the mean latitude and longitude values along one spiral.
No. Time (UTC) Altitude (km) Temperature (°C) Aircraft location Spiral 1 08:08:31–08:23:40 7.26–2.1 –16.5 to 10 (36.8°N, 113.9°E) Spiral 2 08:30:31–08:48:00 2.1–7.26 10.5 to –16.4 (36.7°N, 114.0°E) Note: time is denoted in hh:mm:ss. Table 1. Summary of Spirals 1 and 2.
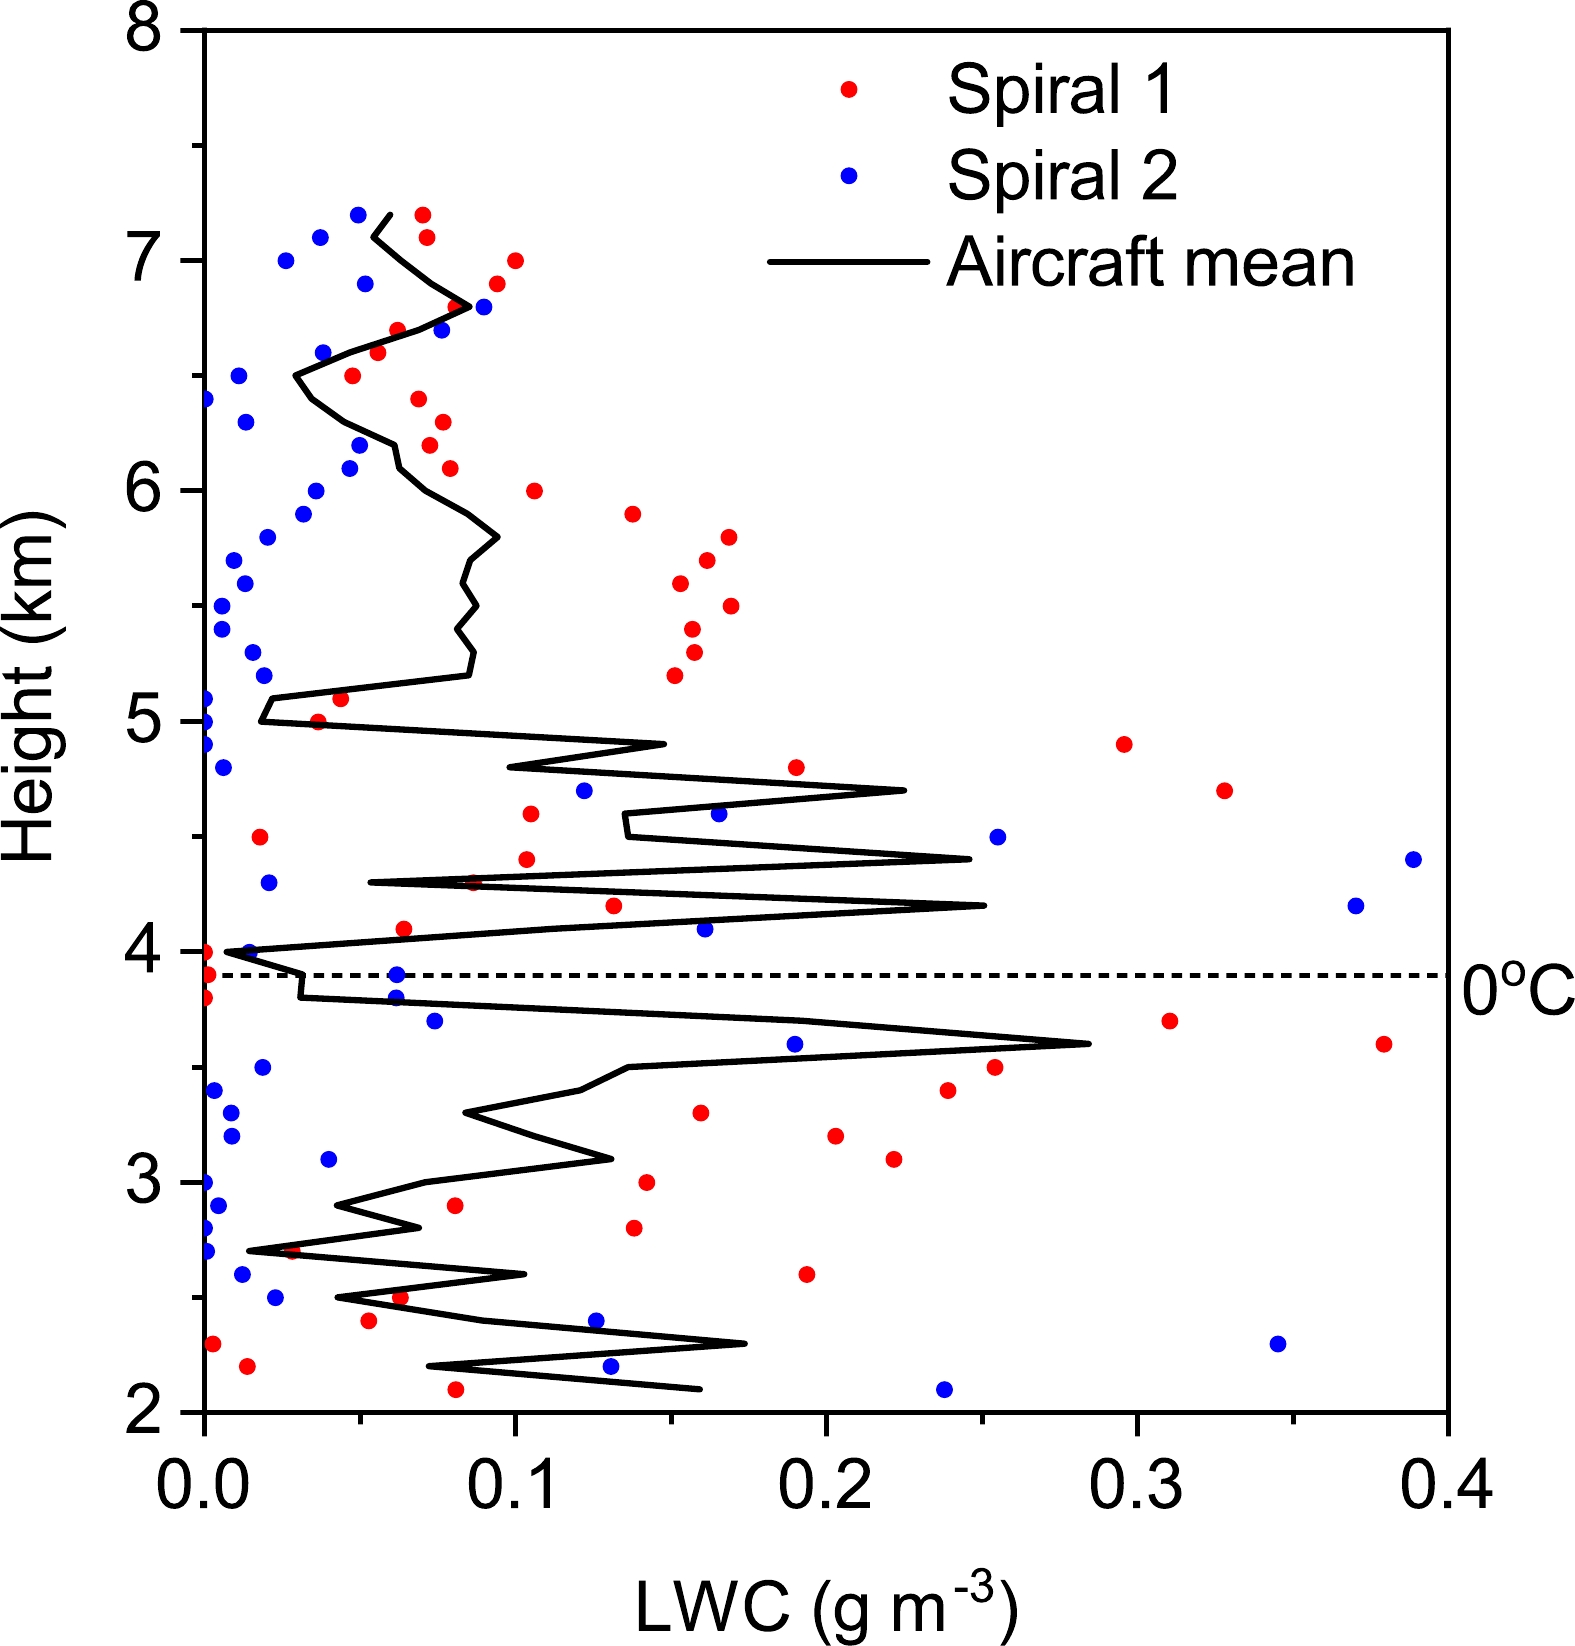
Figure 2 shows the vertical distribution of the observed cloud liquid water involving a King hotwire probe along the two spirals. Each data point represents the average over 100 m along the vertical direction. The observed liquid water content (LWC) values substantially varied between 0 and 0.4 g m–3. Along Spiral 1, the maximum LWC reached 0.38 g m–3 at 3.6 km. Along Spiral 2, the maximum LWC approached 0.39 g m–3 at 4.4 km. The mean LWC values decreased with height from 0.22 g m–3 at 4.7 km to approximately 0.05 g m–3 at 7.2 km. Therefore, large amounts of supercooled liquid water were observed at heights below 5 km (–5°C), which substantially decreased at lower temperatures. According to aircraft observations, rimed particles were observed at temperatures warmer than –10°C. Moderately to heavily rimed particles predominantly occurred at temperatures warmer than –6°C and contributed significantly to ice particle growth in the embedded convective region (Hou et al., 2021).
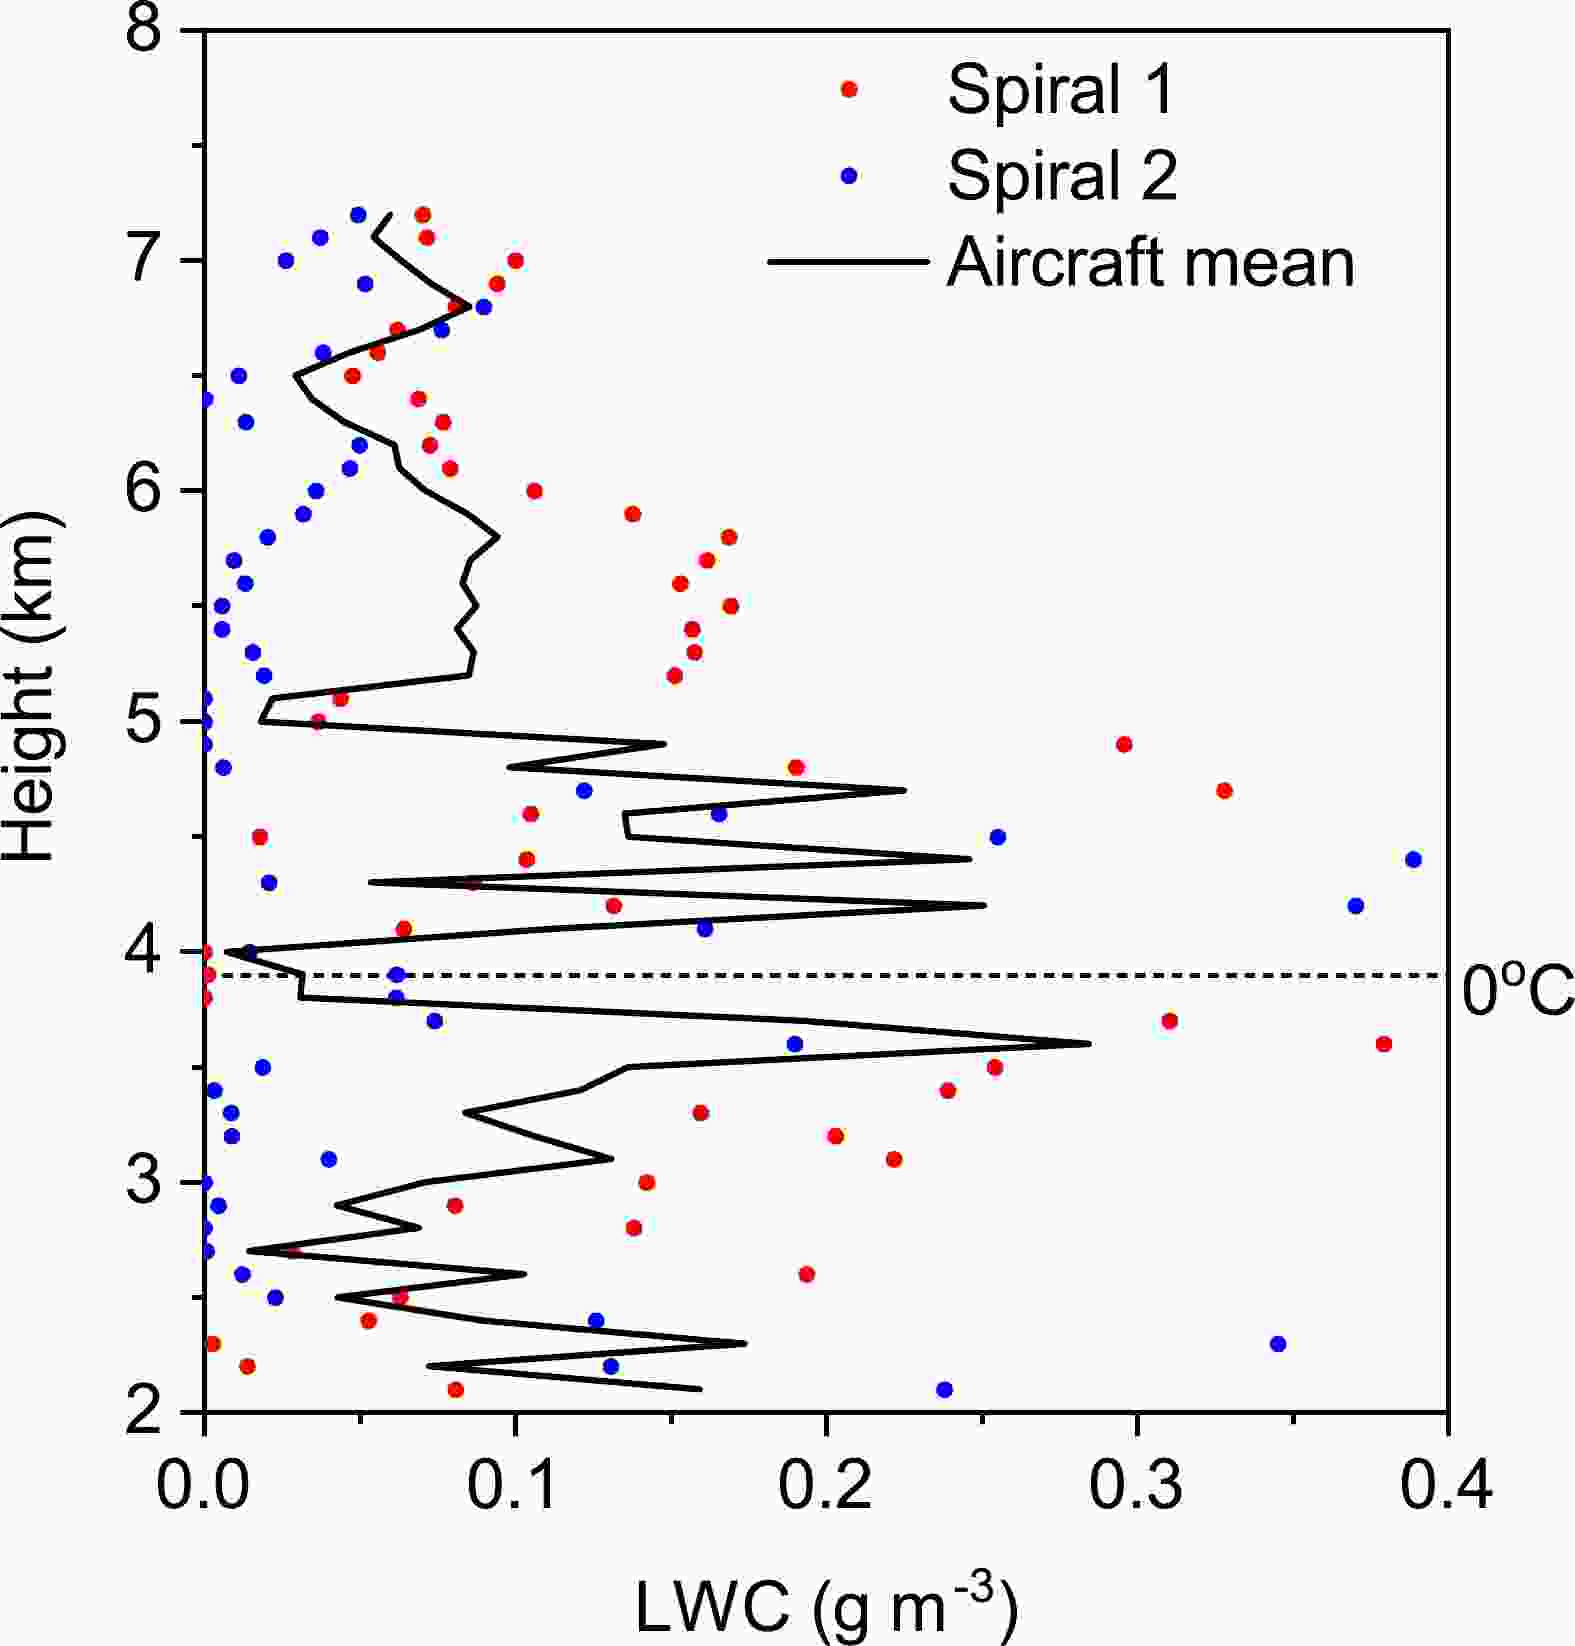
Figure 2. Vertical distribution of the King probe-measured LWC along Spirals 1 and 2 and the mean values for the two spirals. The dotted horizontal line denotes the 0°C layer.
The 2D-S and high-volume precipitation spectrometer (HVPS) particle data were combined to form ice particle size distributions. Due to the measurement limitations, the phase of particles smaller than 100 μm was uncertain. This study only uses particles larger than 105 μm for calculating ice water content (IWC). The IWC estimation was based on combined measurements with particles smaller than 1105 μm by the 2D-S and particles larger than 1125 μm by the HVPS. The data were averaged over 5 s to reduce spurious variability.
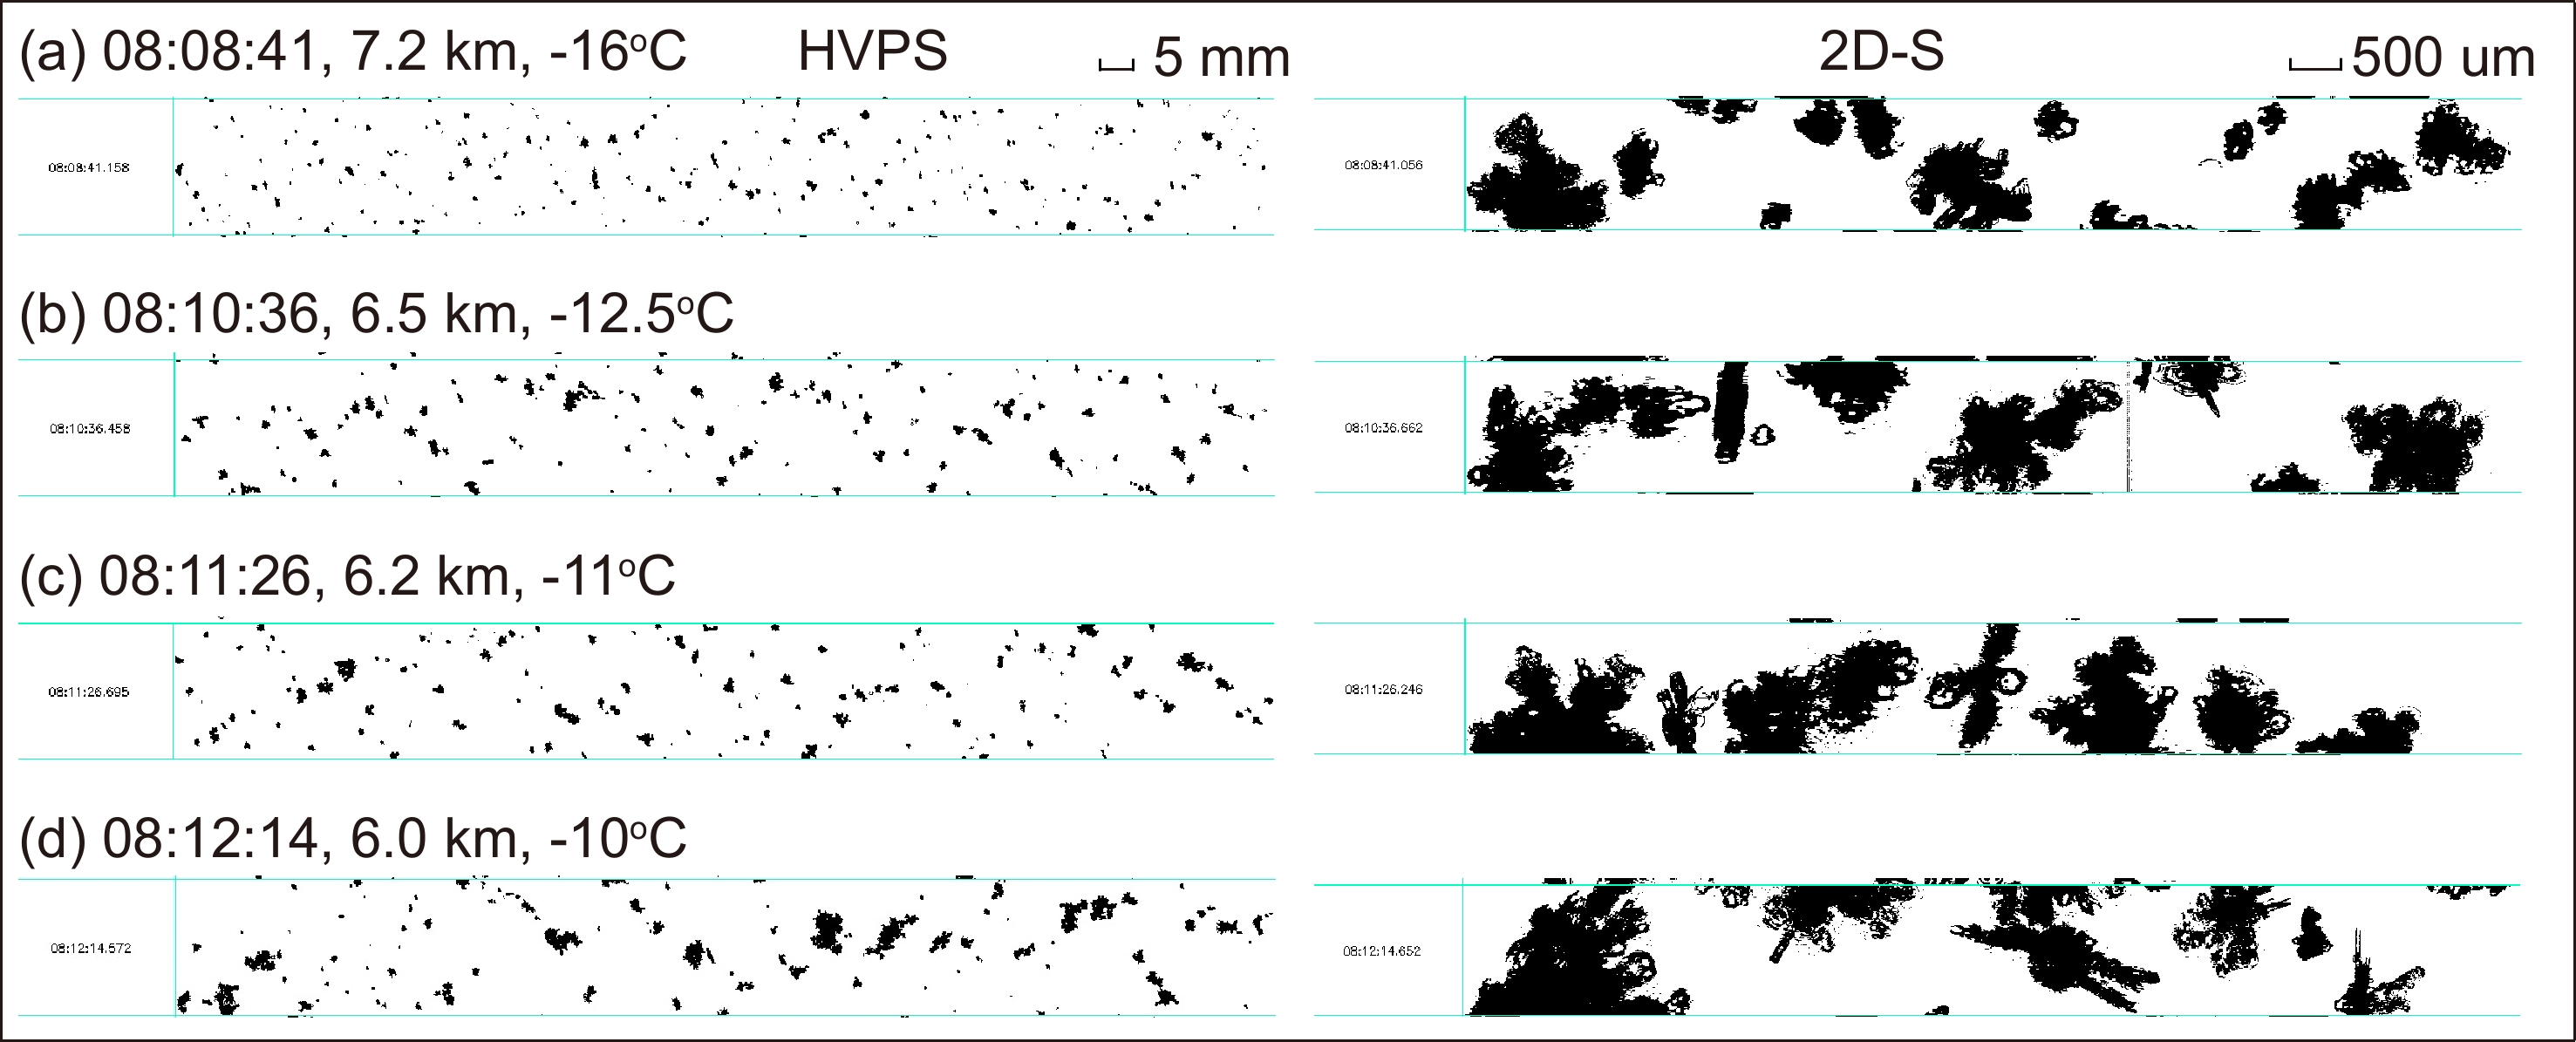
Figure 3 shows the combined particle size distributions at selected temperatures between –10°C and –16°C along Spirals 1 and 2. For the embedded convective region (Fig. 3a), ice particle concentrations decreased at maximum sizes smaller than 1000 μm but increased at sizes greater than 1000 μm from –16°C to –12.4°C. One noticeable feature was that the ice particle size spectra became broader with increasing temperature from –16°C to –10°C. For the edge of the convective region (Fig. 3b), the particle size spectra became narrower, and spectral broadening was only evident from –16°C to –12.8°C. Further examination of particle habits suggested that aggregation was more evident in the vigorous convective cells than in the surrounding regions. Large particles at –16°C in the embedded convective region were predominantly broad-branched crystals and dendrites (Fig. 4a). In addition to depositional growth, these large radiating crystals efficiently aggregated as they fell. Large aggregates were commonly observed at approximately –10°C (Fig. 4d). Thus, significant aggregation from –16°C to –10°C resulted in particle size spectral broadening.
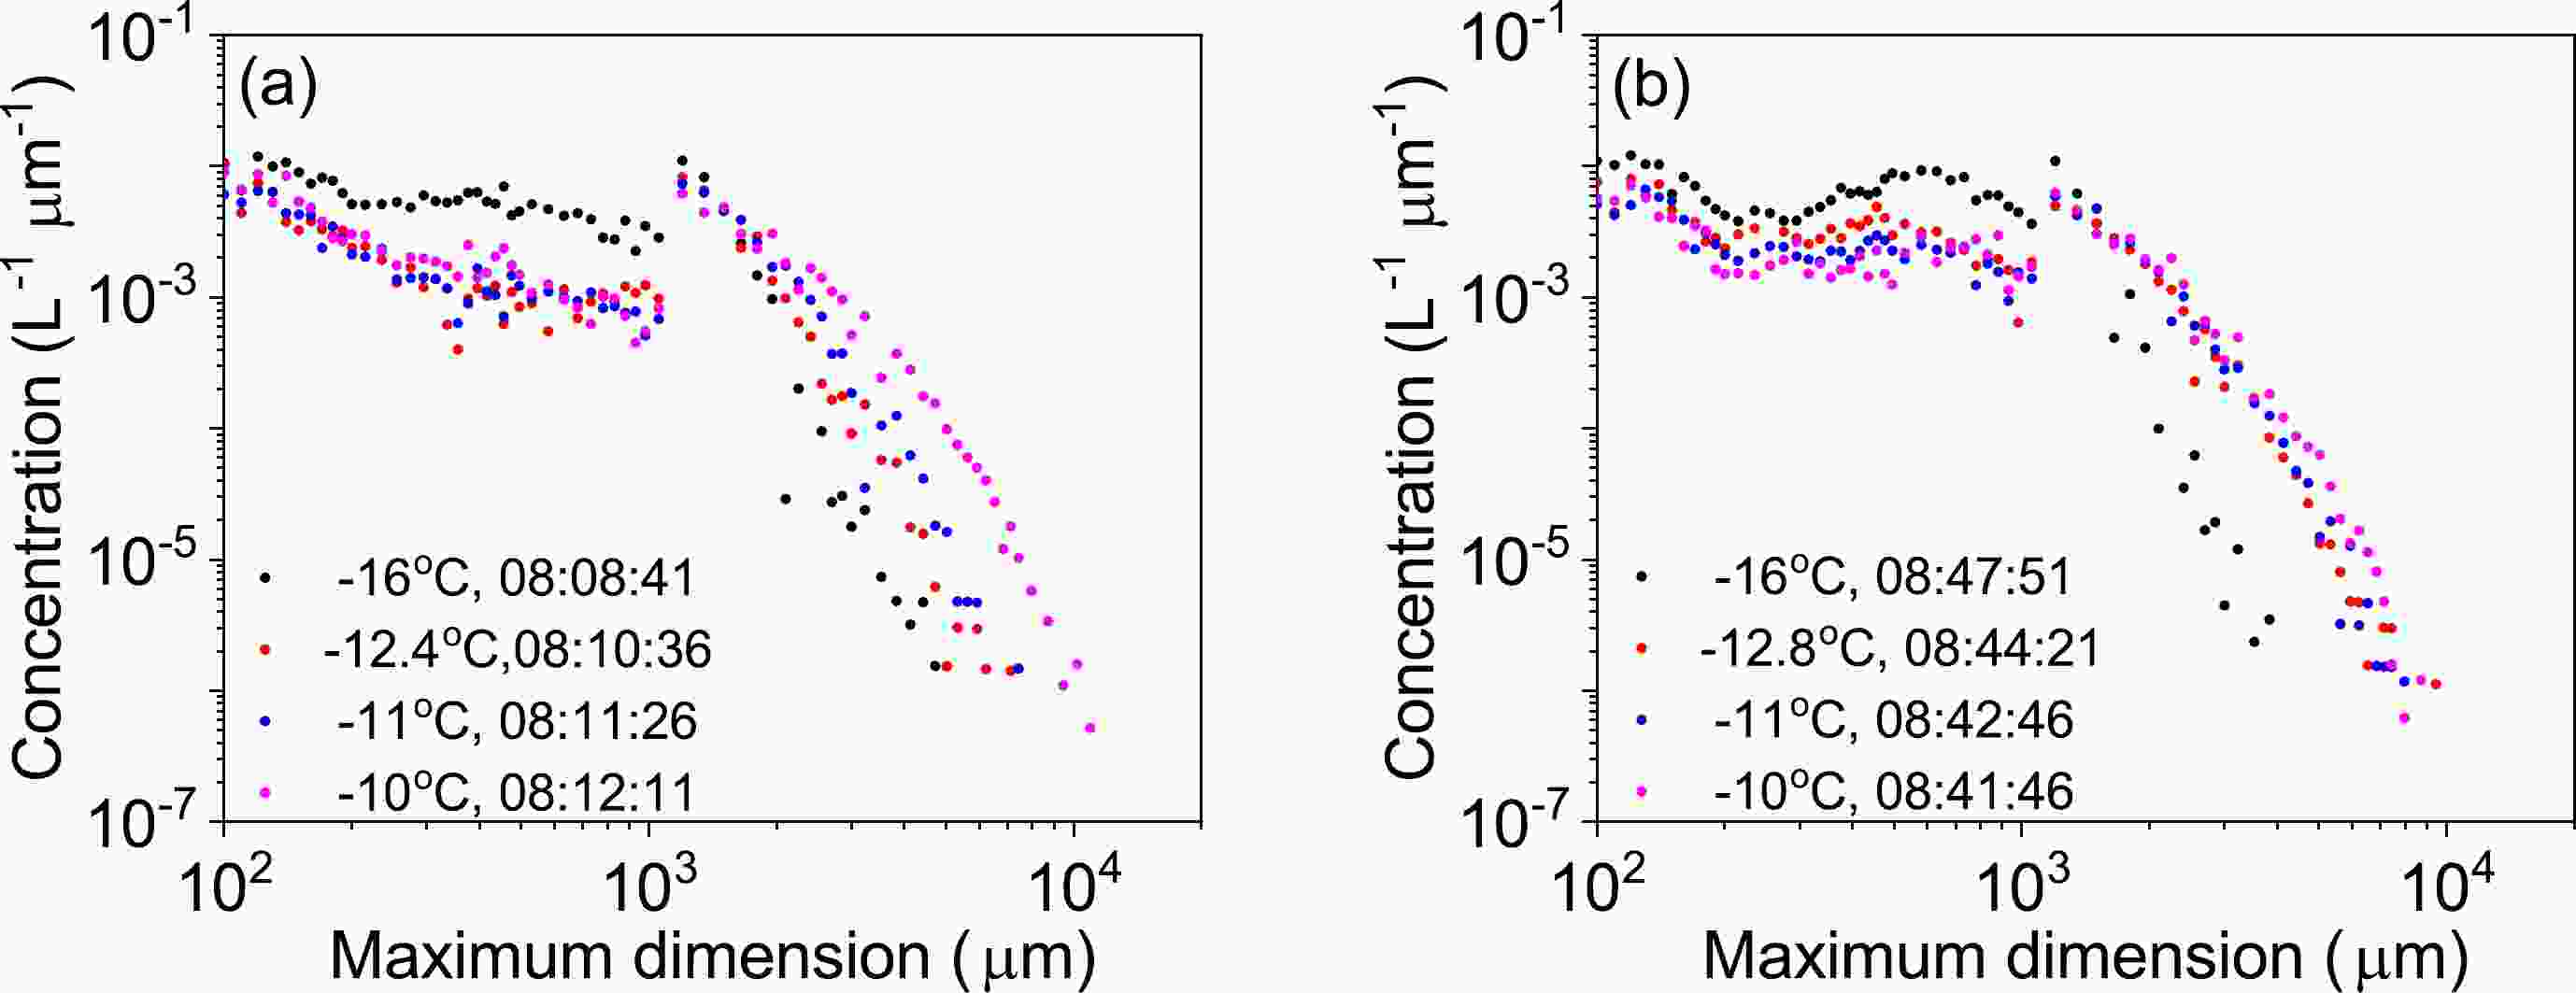
Figure 3. Combined particle size distributions at selected temperatures for (a) Spiral 1 and (b) Spiral 2.

Figure 4. Example HVPS and 2D-S images along Spiral 1.
To show the influence of aggregation on ice particles, Table 2 lists ice particle properties at selected temperatures between –10°C and –16°C in the embedded convective region. The concentrations of smaller particles in the size range of 105 to 1105 μm decreased from 4.7 L–1 at –16°C to 1.6 L–1 at –10°C, with the calculated IWC varying from 0.065 g m–3 to 0.017 g m–3. In comparison, larger particles > 1125 μm in maximum size increased from 4.51 L–1 at –16°C to 5.66 L–1 at –10°C, with much higher IWC varying from 0.413 g m–3 to 1.379 g m–3. The variation in ice particle concentrations suggested a general decrease in small particles and a slight increase in large particles. Large dendrites and aggregates contributed to the high ice water contents at temperatures between –10°C and –16°C. HVPS measurements indicated an increasing trend in mean volume diameters from 1150 μm to 3420 μm and in maximum dimensions from 4725 μm to 10 950 μm with decreasing altitude from 7.2 to 6.0 km. This corresponded to broadening particle size spectra as they descended. Field (1999) found that aggregation dominated ice crystal evolution in an altostratus cloud. Lawson and Zuidema (2009) discussed that large ice particle aggregates within the embedded convection of Arctic mixed-phase clouds resulted in IWC peaks at approximately –11°C. These aircraft observations suggested that aggregation was important in shifting particle size spectra and cloud vertical structure. Aircraft measurements in this cloud system also revealed the influence of aggregation. Enhanced aggregation in the embedded convective region produced broadened particle size spectra at approximately –10°C.
Height
(km)Temperature
(°C)N2D-S (105–1105 μm)
(L–1)IWC2D-S
(g m–3)NHVPS (>1125 μm)
(L–1)IWCHVPS
(g m–3)HVPS DMVD
(μm)HVPS Dmax
(μm)7.2 –16 4.7 0.065 4.51 0.413 1150 4725 6.5 –12.5 1.4 0.019 4.45 0.532 1550 7125 6.2 –11 1.3 0.016 5.04 0.733 1810 7425 6.0 –10 1.6 0.017 5.66 1.379 3420 10950 Table 2. Ice particle properties at selected temperatures between –10°C and –16°C from Spiral 1. DMVD = mean volume diameter.
Thus, aircraft measurements in the embedded convective region suggested pronounced amounts of supercooled liquid water and vigorous ice particle growth. Moderately to heavily rimed particles were observed primarily at temperatures warmer than –6°C, and dendritic aggregation was dominant at temperatures between –10°C and –16°C. High IWC values and broadened particle size spectra at –10°C were attributed to large dendrites and aggregates.
-
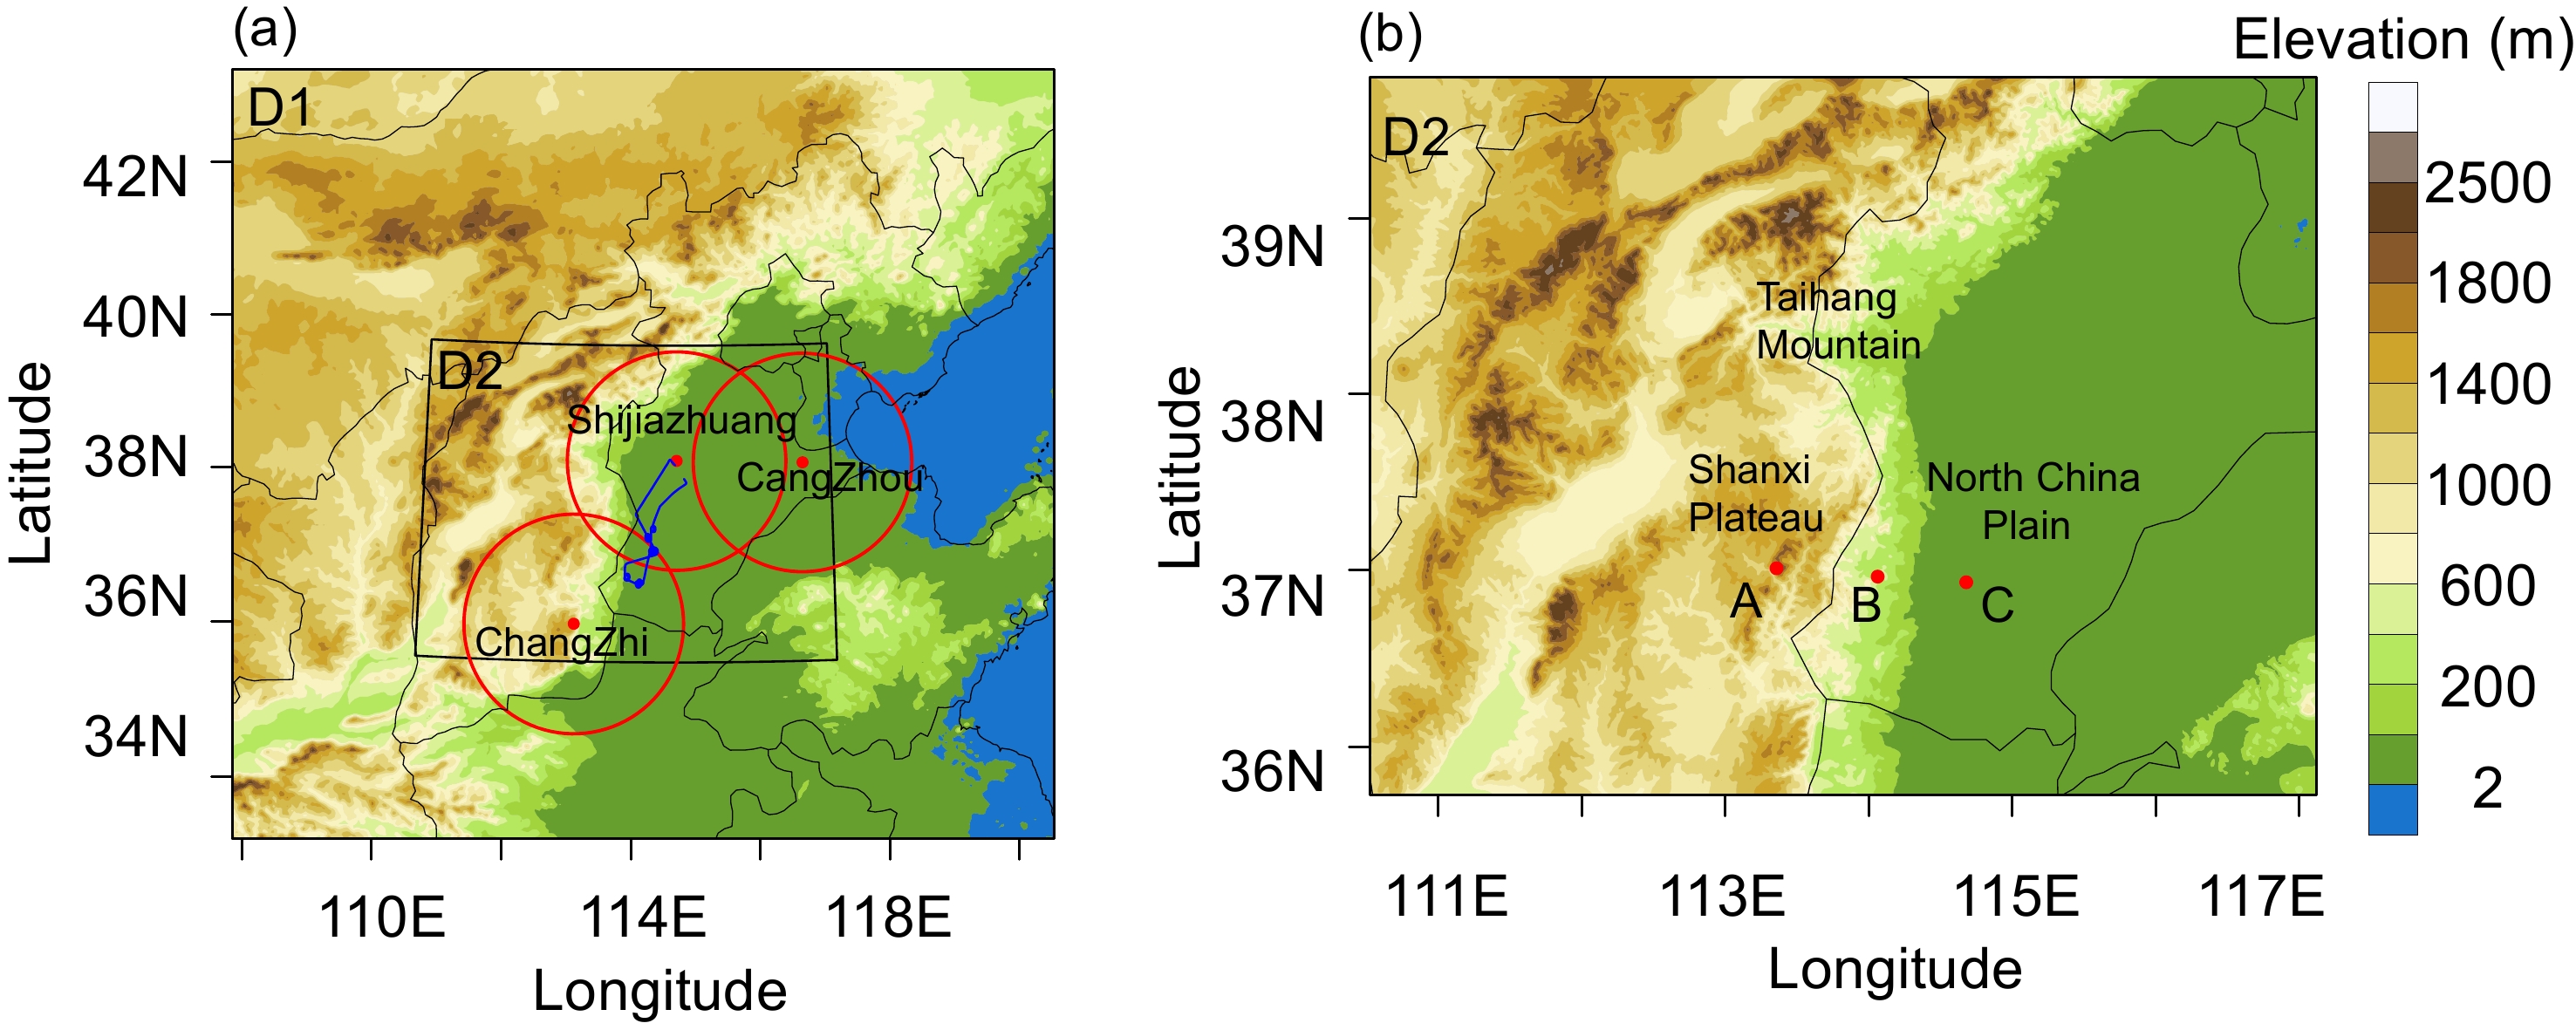
In this study, we employed the Advanced Research WRF (V4.3) model and two model domains (Fig. 5a) with two-way nesting and grid spacings of 3 and 1 km. The number of grid points was 360 × 360 and 562 × 442 for the outer and inner domains, respectively. The outer domain covers part of northern China, and the inner domain covers the rainfall region, including the central part of Shanxi Province and southern Hebei Province. As shown in Fig. 5b, complex terrain is evident in northern China. The Taihang Mountains constitute a long and narrow mountain range, with the Shanxi Plateau along the western edge and the North China Plain in the eastern region.

Figure 5. (a) Model domain coverage and terrain elevation (shaded) of (a) the outer domain and (b) the inner domain. D1 and D2 denote the outer and inner domains, respectively. The blue trace in (a) indicates the flight track. The radar site locations are marked by red dots in (a), and the red circles indicate the 150-km range of the Doppler radars. The three red dots, A, B, and C in (b), are the three precipitation sites at different elevations.
European Centre for Medium-Range Weather Forecasts (ECMWF) Reanalysis v5 (ERA5) pressure level data with a 0.25° × 0.25° resolution (Vitart et al., 2019) were used for the initial and boundary conditions. The outer domain was integrated over 24 h from 1800 UTC on 21 May to 1800 UTC on 22 May 2017. The inner domain started 6 h later and ran for 18 h from 0000 UTC on 22 May to 1800 UTC on 22 May 2017.
Lei et al. (2020) used the WRF v3.6 model with physics options, including the Rapid Radiative Transfer Model (RRTM) longwave scheme (Mlawer et al., 1997), Dudhia shortwave scheme (Dudhia, 1989), Noah land surface model (Ek et al., 2003), Yonsei University planetary boundary layer scheme (Hong et al., 2006) and WDM6 microphysics scheme (Hong et al., 2010), to recreate the same rainfall event. We performed numerical tests with different configuration options and found that model options with the Rapid Radiative Transfer Model for General Circulation Models (RRTMG) longwave and shortwave radiation schemes developed by Iacono et al. (2008), the Mellor–Yamada–Janjić planetary boundary layer scheme of Janjić et al. (1994) and the unified Noah land surface model produced more realistic precipitation patterns. We did not employ cumulus parameterization in the model simulations.
We conducted a comparison of P3-nc and P3-2ice in simulating this rainfall event. Then, sensitivity experiments with different collection efficiencies between ice and cloud droplets (Eci) were conducted since the collection efficiency is an important factor in modeling the riming process. The collection efficiency is assumed to remain constant in some models. Morrison and Grabowski (2008) used a collection efficiency of 0.75 for ice-droplet collisions. In the Morrison scheme of the WRF v4.3 model, the collection efficiency was 0.7. In the P3 scheme, the collection efficiency was specified at 0.5. The collection efficiency is important but difficult to retrieve from experimental measurements due to the complex ice particle shapes (Erfani and Mitchell, 2017). In light of this consideration, we performed simulations using P3-2ice with collection efficiencies of 0, 0.5, 0.7, and 0.9 in this study to examine the impact of riming on microphysical interactions and precipitation. A summary of the model simulations is provided in Table 3.
Simulation name Description P3-nc single-ice category version, Eci = 0.5 P3-2ice two-ice categories version, Eci = 0.5 Eci0 two-ice categories version, Eci = 0.0 Eci07 two-ice categories version, Eci = 0.7 Eci09 two-ice categories version, Eci = 0.9 Table 3. List of the P3 simulations.
-
A detailed description of the single-ice category version of P3 is given in Morrison and Milbrandt (2015). This section provides a brief overview of the ice-phase microphysics parameterization in P3. In P3-nc, ice evolves in both time and space by predicting various bulk particle properties of a single ice category rather than separating ice into predefined categories. Ice is represented by the four prognostic mixing ratio variables of the total ice mass, rime ice mass, total ice number, and rime ice volume. Ice microphysical processes and prognostic variables are calculated in terms of particle mass–dimension and projected area–dimension relationships. The mass–dimension relationship for partially rimed particles can be linearly interpolated between unrimed ice and graupel. Thus, more smoothly varying bulk densities and diameters, which depend on the degree of rime growth, can be obtained.
Ice is nucleated through heterogeneous nucleation based on the parameterization of Cooper (1986). Ice particles grow through deposition and riming and are reduced via sublimation and melting. The source terms for riming include immersion freezing of droplets and rain, collection of cloud droplets by ice, and collisions between rain and ice. Among the four riming source terms, the collection of cloud droplets by ice is the predominant source, and the freezing of droplets and rain exerts a limited impact on ice particle growth. In P3, the collection efficiency between cloud droplets and ice is assumed to remain constant. Thus, sensitivity experiments considering different collection efficiencies were conducted in this study.
Milbrandt and Morrison (2016) introduced the multiple free ice-phase category version of P3 in detail. The multicategory P3 version was developed to better represent different ice properties at one point and minimize dilution effects. Each category is treated the same as that in the single-ice category version. The multicategory version also considers ice multiplication and aggregation, suggesting a more realistic representation of ice microphysics. The number of ice categories can be defined by users; we chose two categories for this study.
-
To evaluate the performance of the two versions of P3, precipitation data retrieved from both rain gauge observations and numerical experiments were compared in this section. Figure 6 shows the 15-h accumulated precipitation at 1500 UTC on 22 May 2017 obtained from observations and model simulations as well as the percentage bias scores in the inner domain. The percentage bias score was defined following Garvert et al. (2005); namely, the modeled precipitation was divided by the observed precipitation and multiplied by 100. As shown in Fig. 6a, the distribution of the precipitation sites was heterogeneous, more densely distributed in eastern Hebei Province than in Shanxi Province. In the Shanxi Plain area, the precipitation amounts were mostly less than 30 mm, except for a few sites in the southern part. In comparison, enhanced precipitation was observed over the immediate lee of the Taihang Mountains. Forty-five sites recorded accumulated precipitation greater than 50 mm, and most of those observations occurred along the lee slopes of the Taihang Mountains. The highest precipitation reached 104 mm at 114°E (marked by a black star in Fig. 6a).
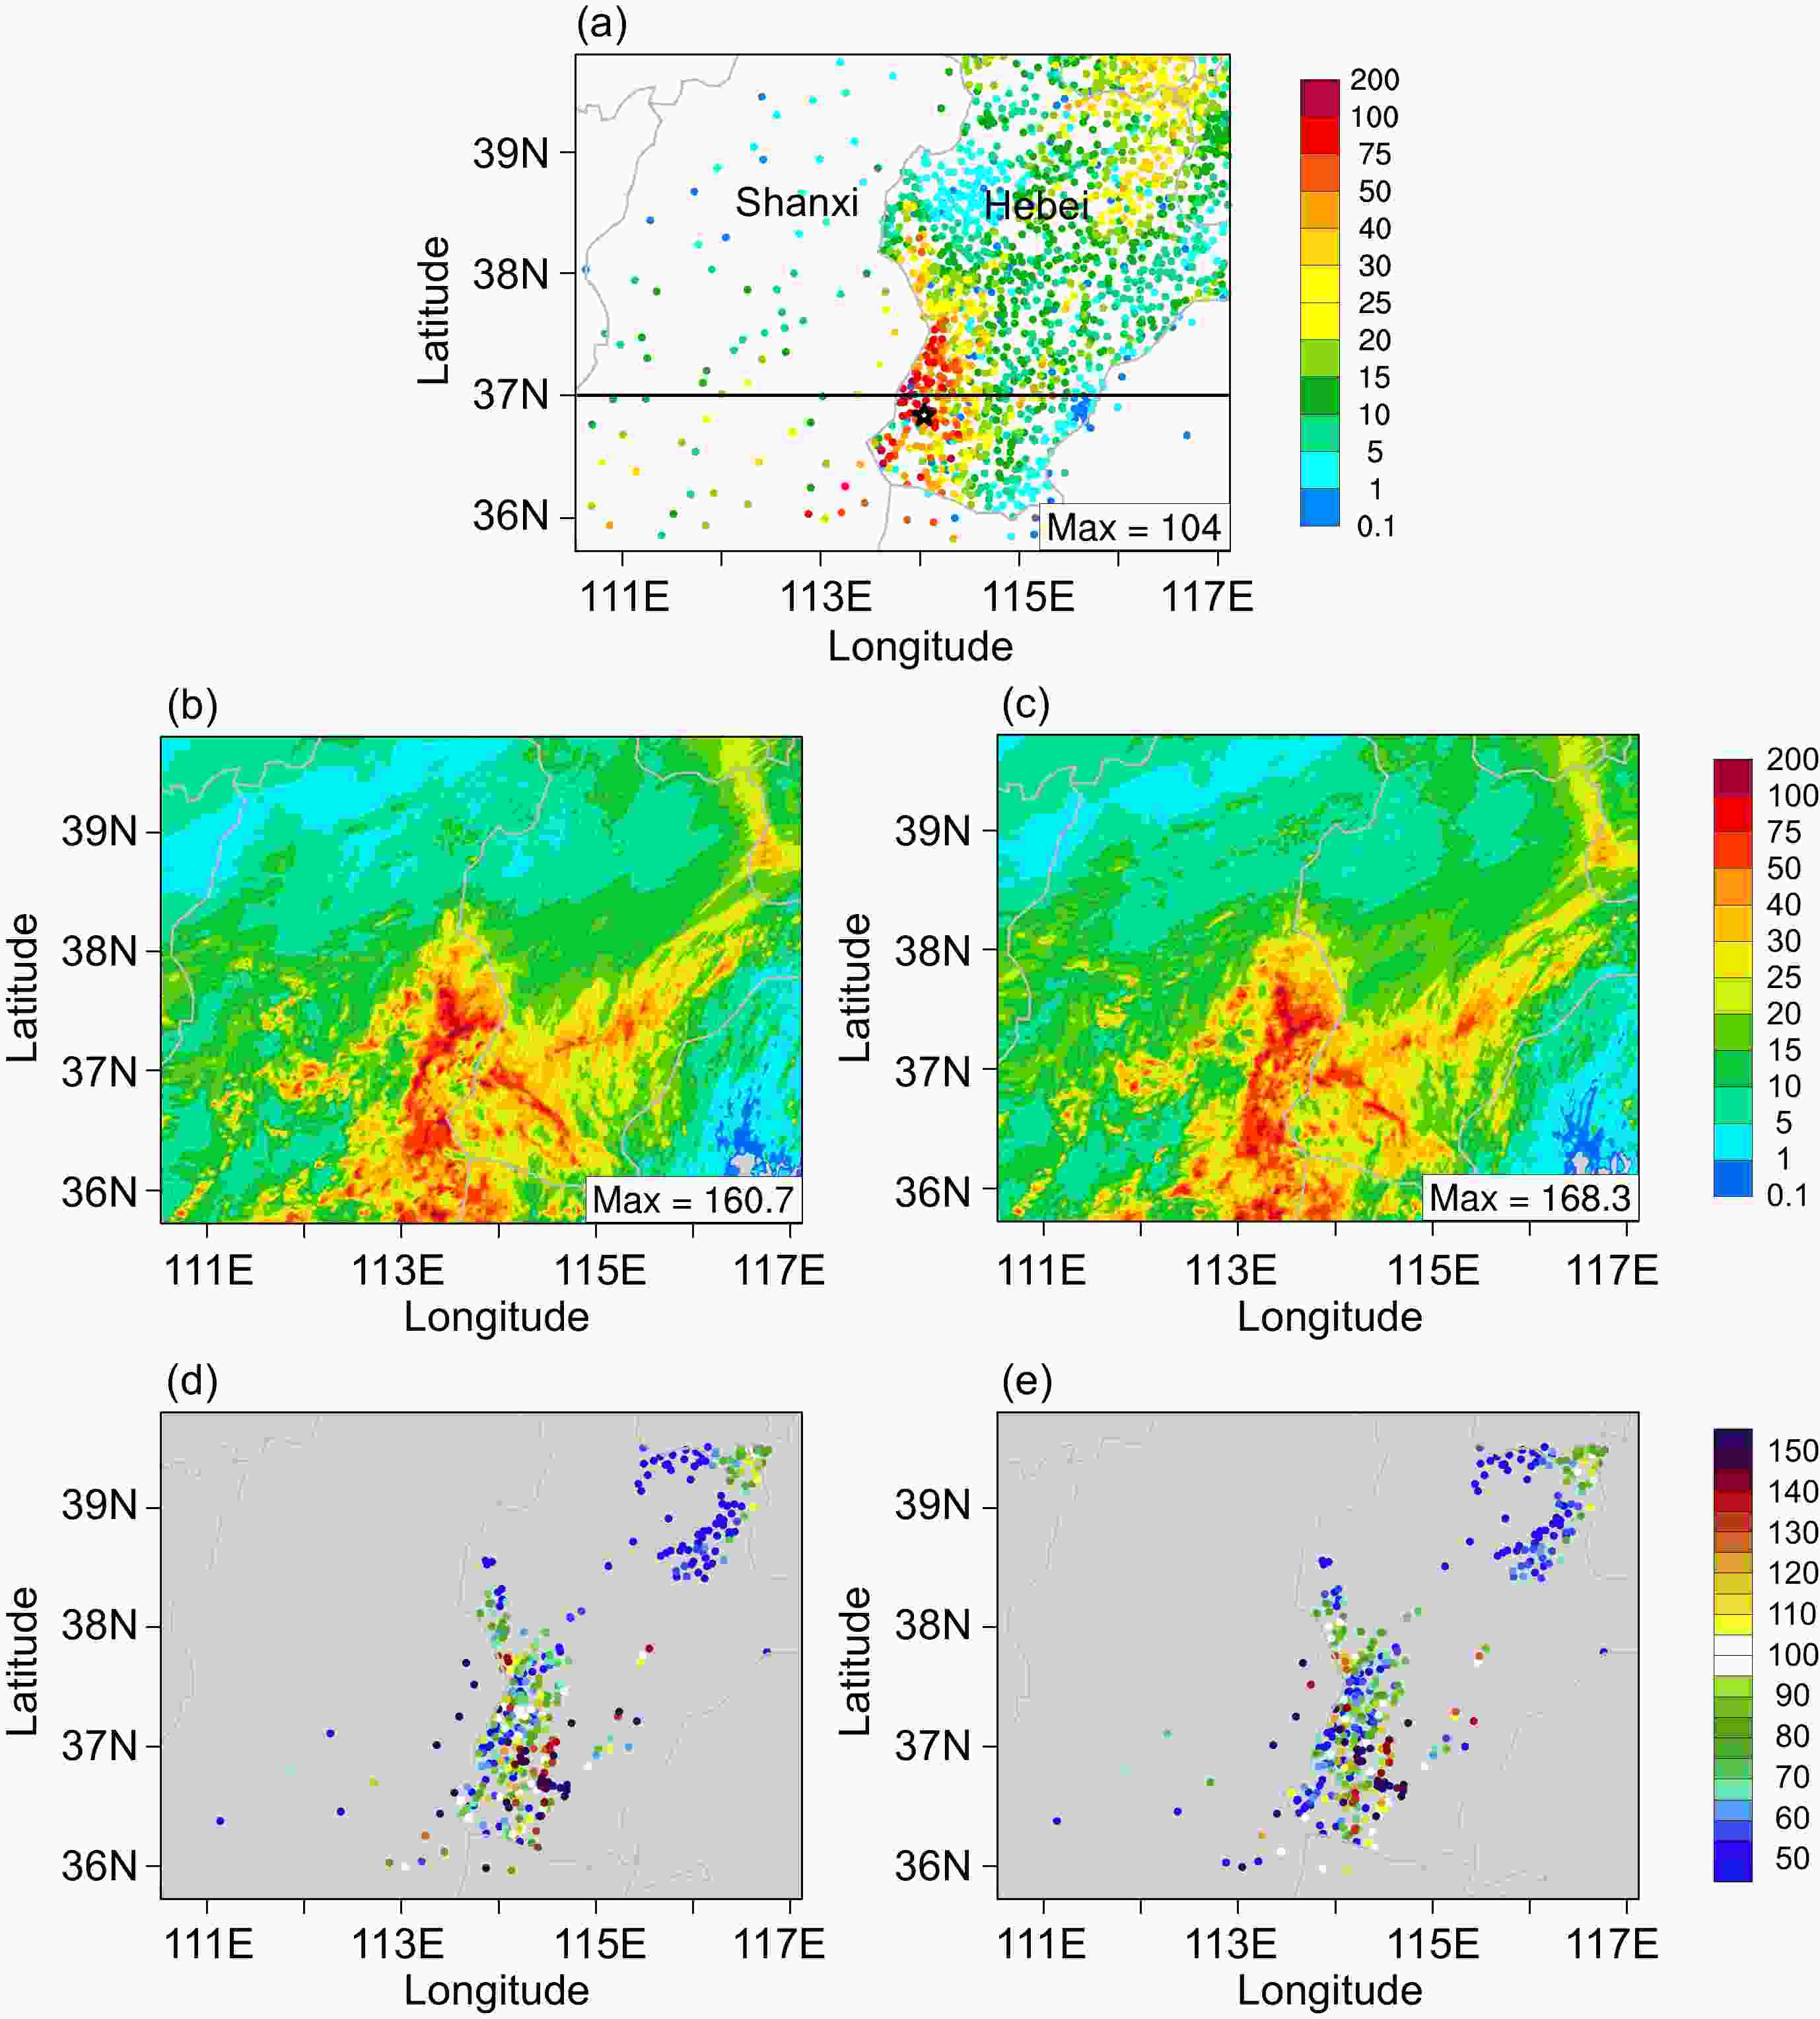
Figure 6. 15-h accumulated precipitation (units: mm) valid at 1500 UTC 22 May 2017 from (a) rain gauge observations and (b) P3-nc and (c) P3-2ice simulations in the 1-km domain. Bias scores for (d) P3-nc and (e) P3-2ice at sites with precipitation greater than 20 mm. The black line in (a) along 37°N denotes the location of the cross-section used in the following figure. The black star in (a) denotes the site location that recorded the maximum precipitation amount.
The simulated precipitation revealed a large area of overprediction along the mountains but an underprediction over the immediate lee. The peak rainfall amount was overpredicted, i.e., at approximately 160 mm, and rainfall was displaced westward. The percentage bias scores retrieved from the P3-nc simulations (Fig. 6d) indicated that overpredictions occurred along the mountains with bias scores higher than 150%. Over the immediate lee, the bias scores ranged from less than 50% to almost accurate precipitation forecasts. The model also overpredicted precipitation at approximately 114.5°E. Compared to the observations, the WRF model with the two versions of P3 produced similar spatial precipitation patterns. Compared to P3-nc, P3-2ice did not impact the overprediction of the maximum rainfall values. Hua et al. (2020) demonstrated that complex orography greatly affected the initiation and maintenance of the precipitation system. In addition, compared with the potential temperature profile from the Taiyuan sounding, the model simulated potential temperatures were 1–4 K greater than the observed values (figure not shown). These two factors contributed to rainfall overprediction. However, this paper focused on microphysical processes causing differences in precipitation.
We calculated the root-mean-square error (RMSE) values for the accumulated precipitation relative to all precipitation sites. Interpolation from model grid data to the observation sites was first performed over the 1478 sites in the inner domain before RMSE calculation. The RMSEs for the P3-nc and P3-2ice simulations were 14.5 and 14.2, respectively. Therefore, P3-2ice yielded a slightly smaller RMSE, corresponding to a smaller precipitation amount.
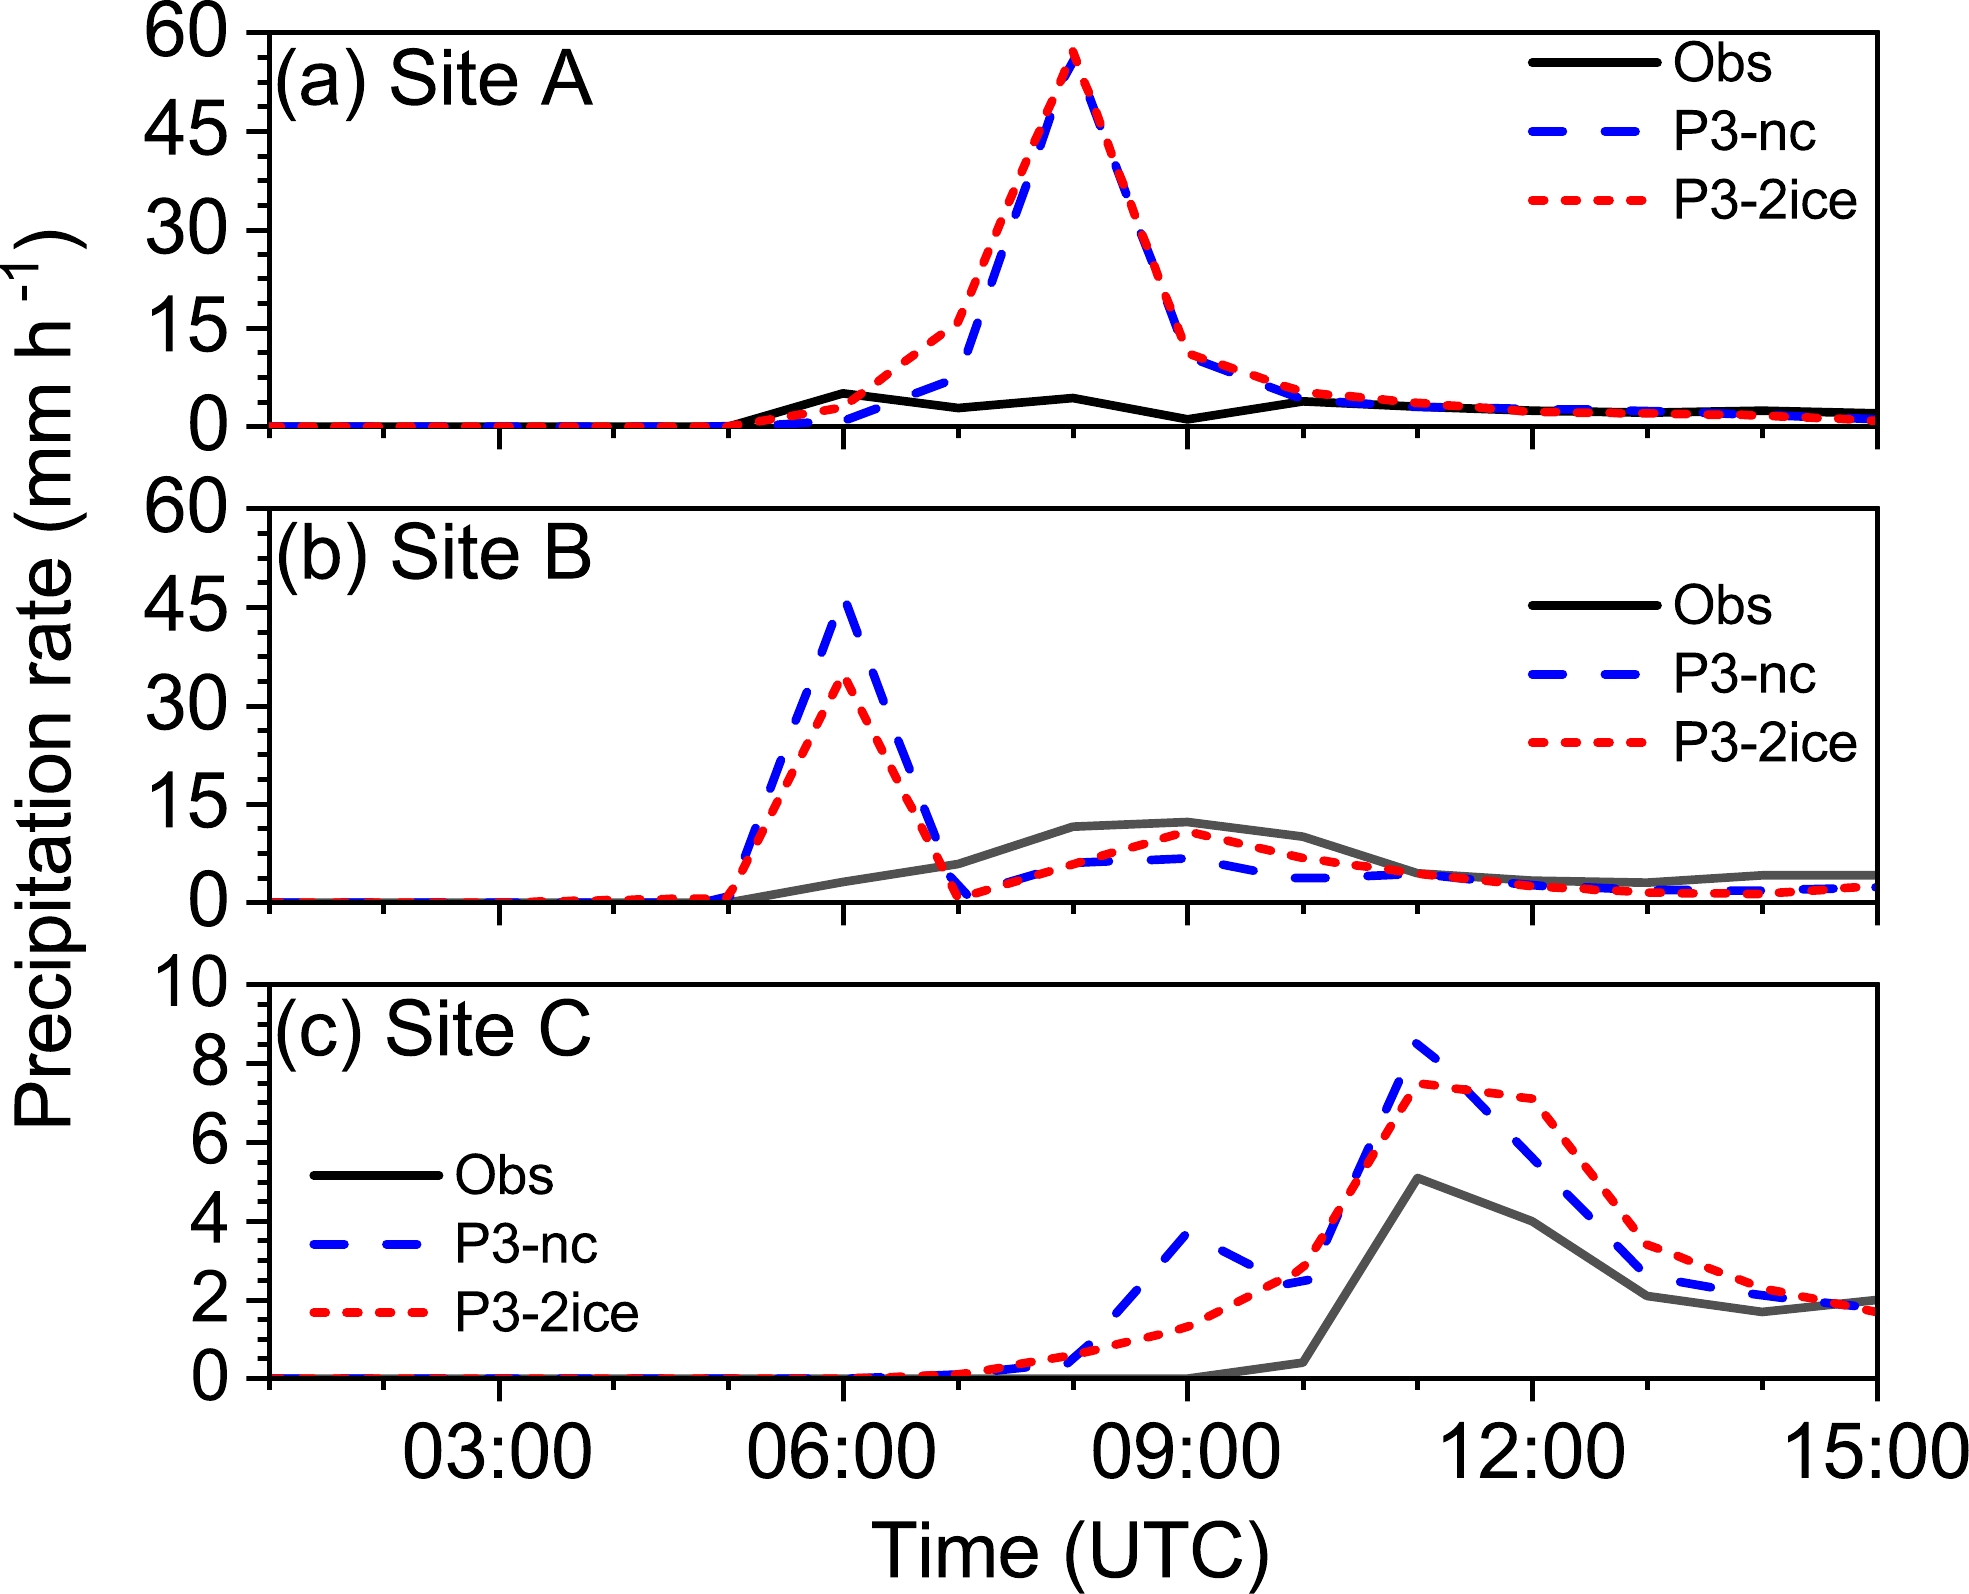
The differences between the simulated and observed hourly accumulated precipitation levels at the three selected sites are shown in Fig. 7. The locations of the precipitation sites are shown in Fig. 5b. Site A, along the mountain range at 1152 m elevation, recorded 29 mm of precipitation. Site B, located on the lee slope at 346 m elevation, recorded 62 mm of precipitation. Site C was located along the eastern plain area at 32 m elevation and recorded 15 mm of precipitation. The observed peak precipitation rates at sites A and B were 5.1 and 12.3 mm h–1, respectively. In comparison, the WRF model produced notable overprediction of precipitation rates that occurred at 0800 UTC at site A, and 0600 UTC at site B with both P3-nc and P2-2ice. At site C, the precipitation was better simulated, with P3-2ice producing a lower peak precipitation rate that was closer to the observed rate.
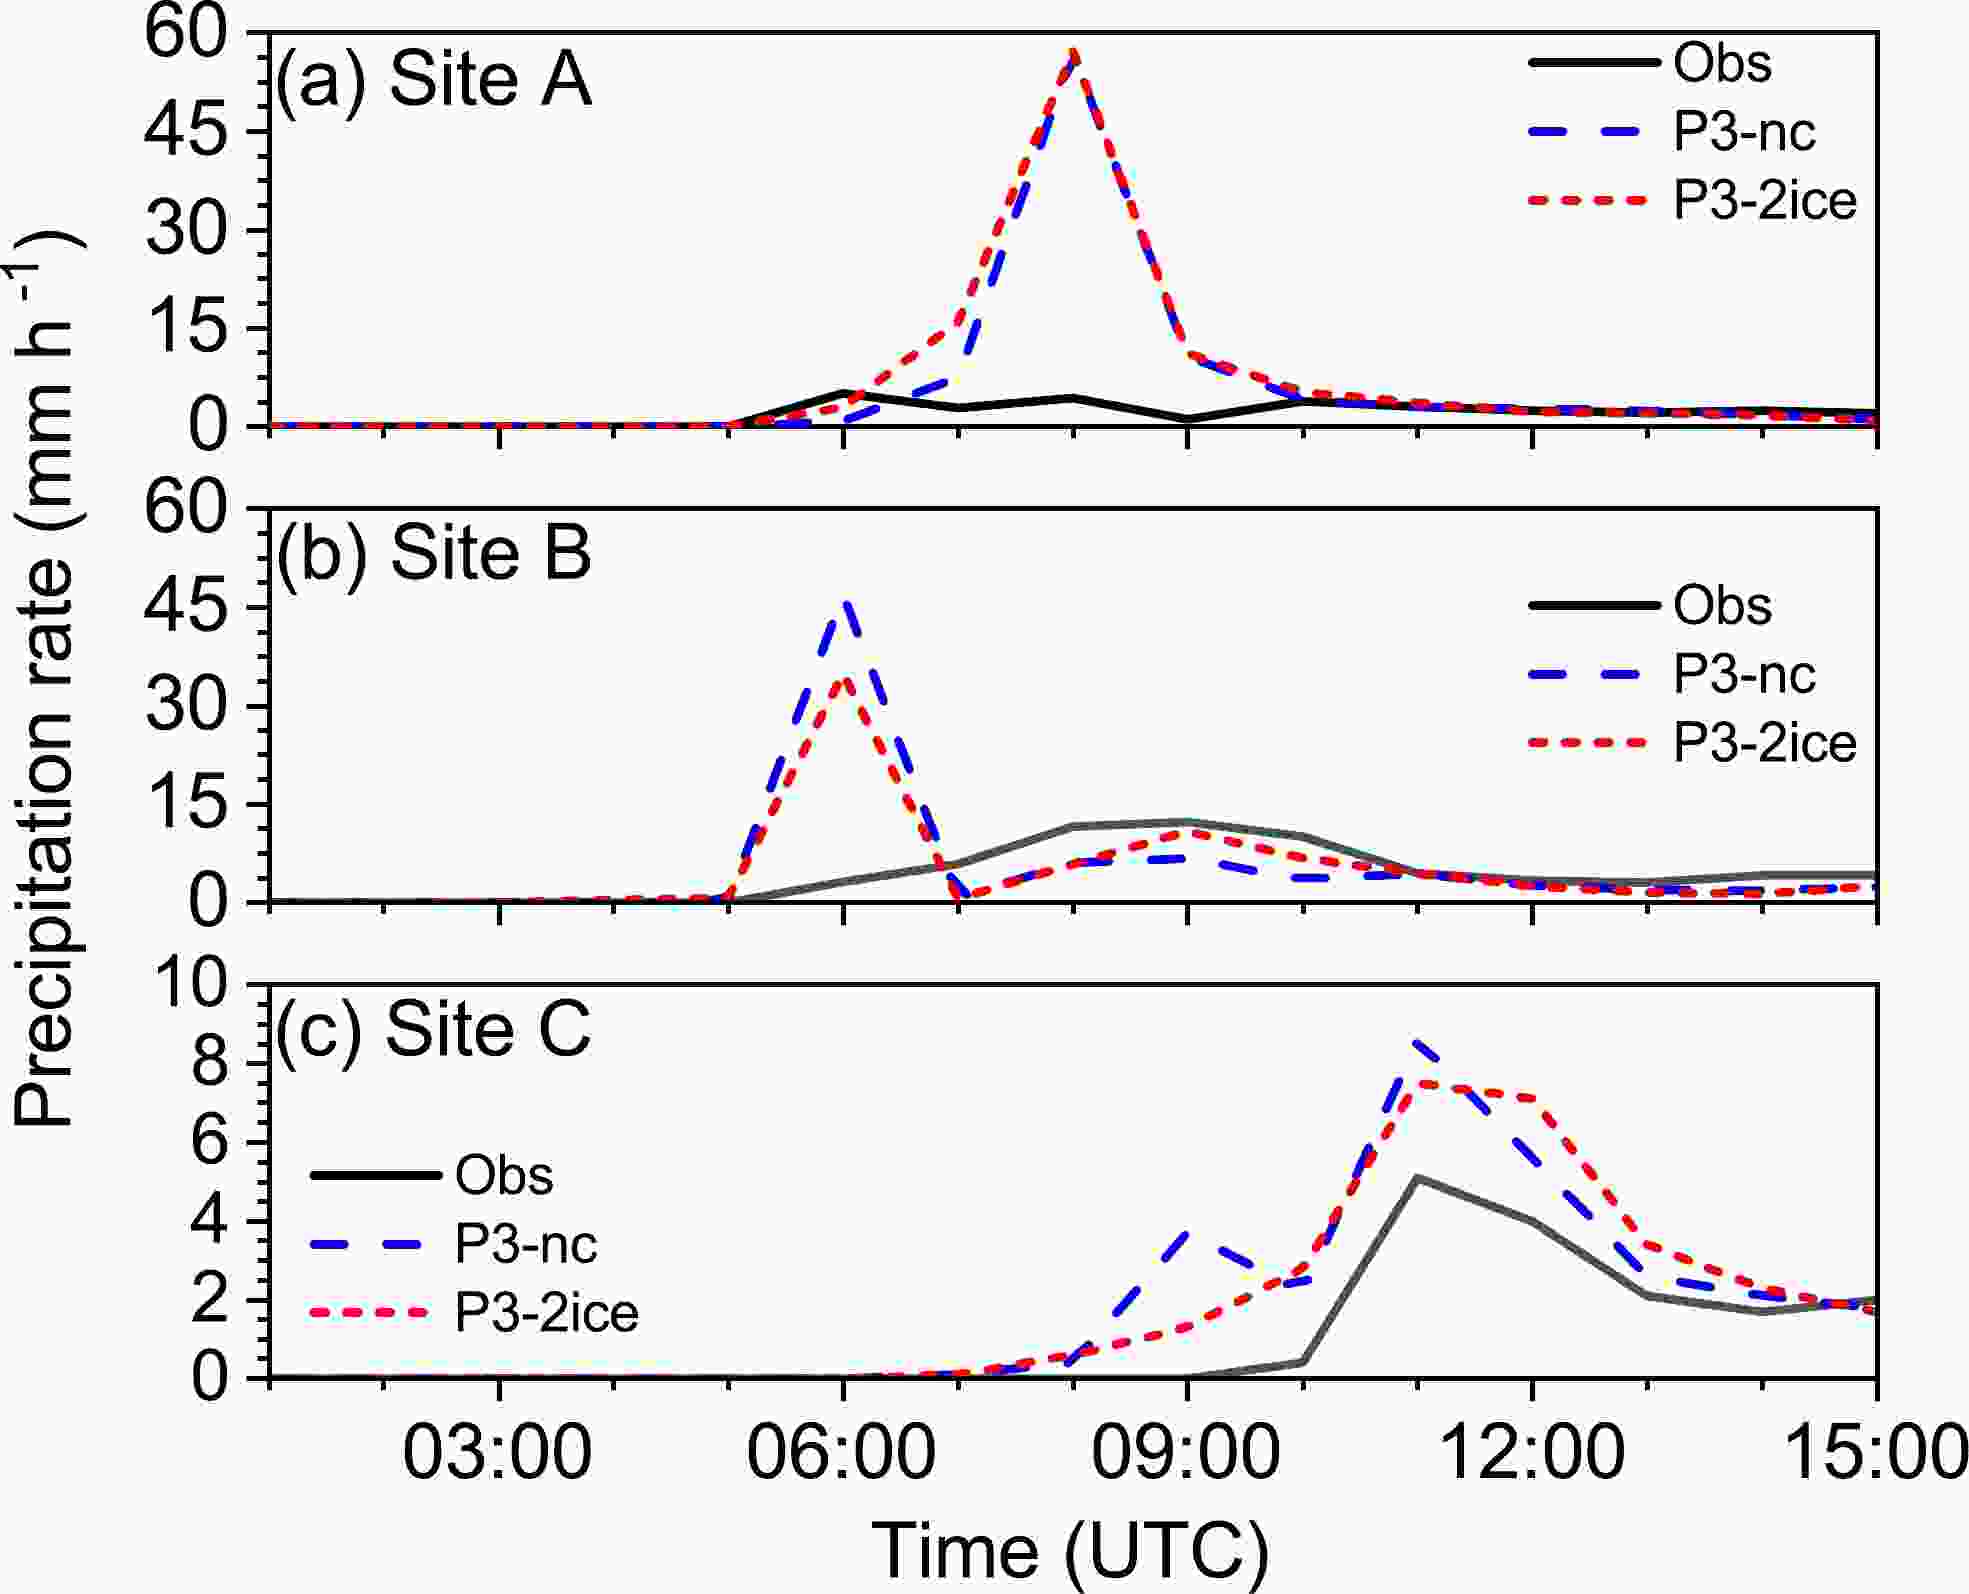
Figure 7. Precipitation rates between 0000 and 1500 UTC on 22 May 2017 retrieved from the observations and simulations at the three selected precipitation sites. The locations of the sites are shown in Fig. 3b.
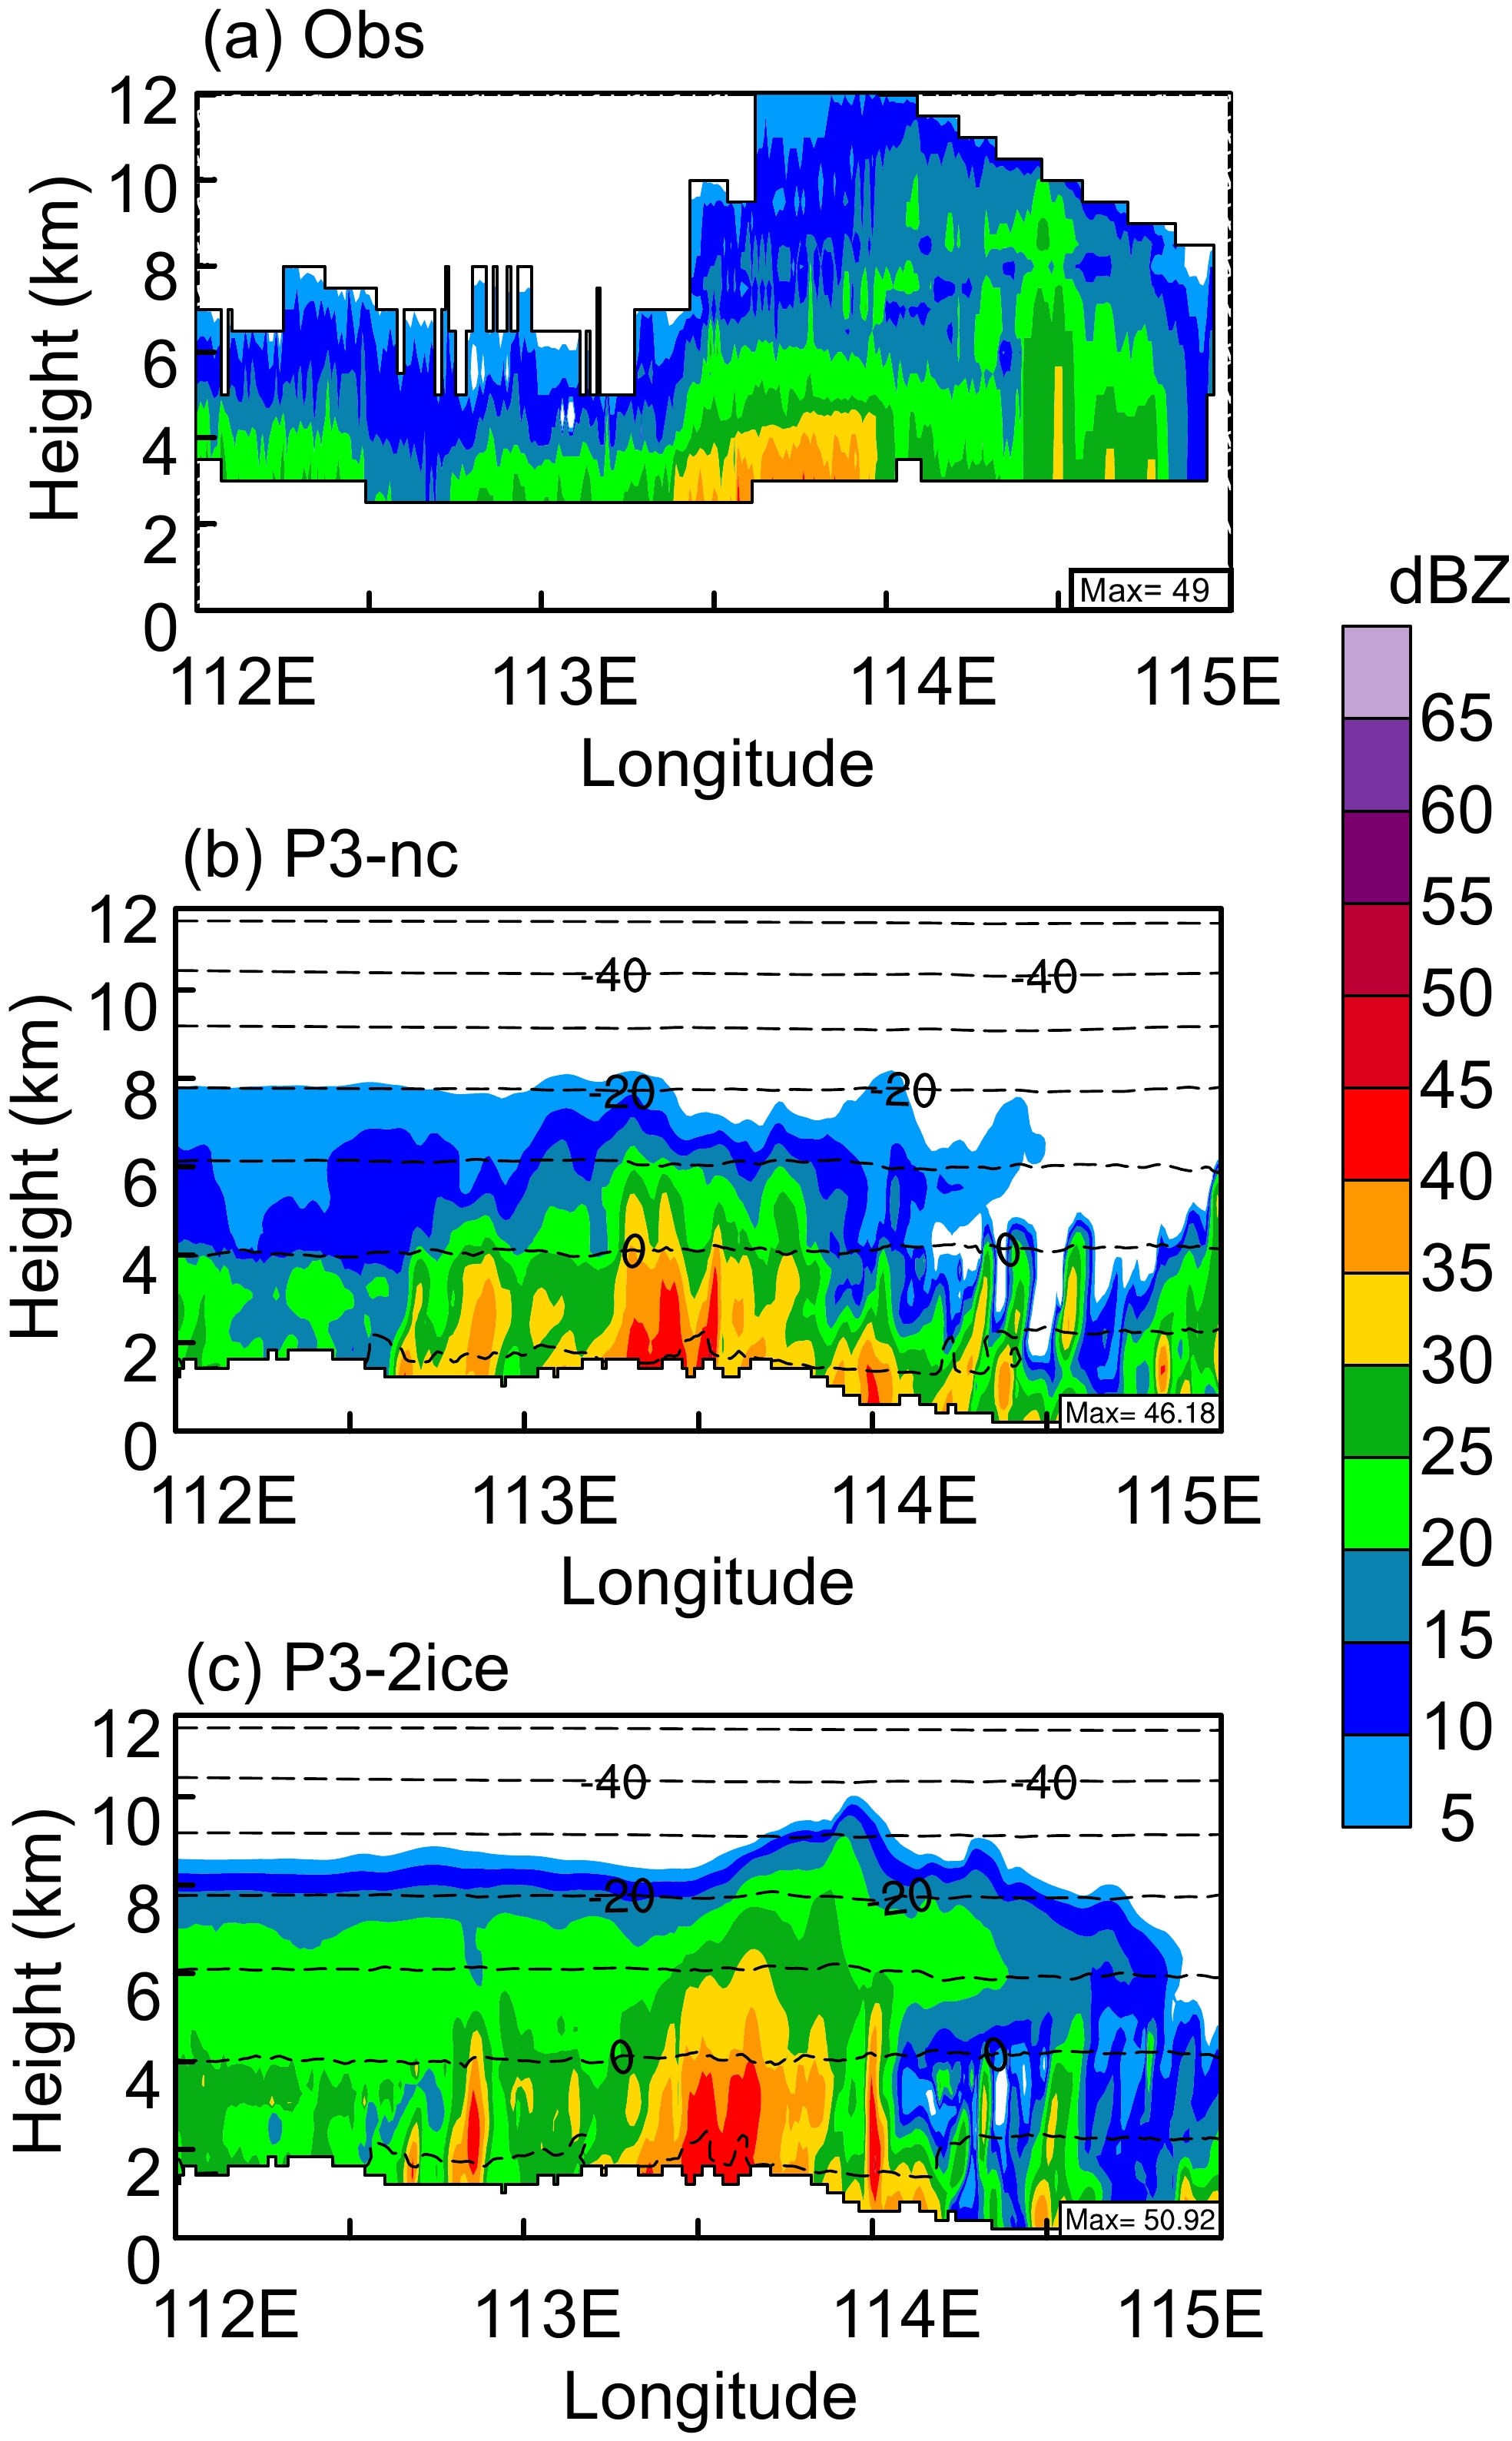
To further evaluate the P3 scheme, Fig. 8 shows the observed composite reflectivity and the equivalent model reflectivity along 37°N at 0900 UTC retrieved from the two simulations. The observed reflectivity values were mostly lower than 30 dBZ from the western plateau to the eastern plain region. There were reflectivity streaks with values between 30 and 49 dBZ within the local region (approximately 113.4°–114°E) from the mountain range to the immediate lee slopes. This area was beneath the convective region with moderately to heavily rimed ice particles in the presence of supercooled liquid water. Compared to the observations, P3-nc (Fig. 8b) produced a higher reflectivity with more cell streaks, indicating overprediction in the convective precipitation area. In comparison, P3-2ice (Fig. 8c) performed better than P3-nc, as the embedded convective region was concentrated closer to approximately 113.5°E. P3-2ice also improved the radar pattern by broadening the stratiform region (20–30 dBZ).
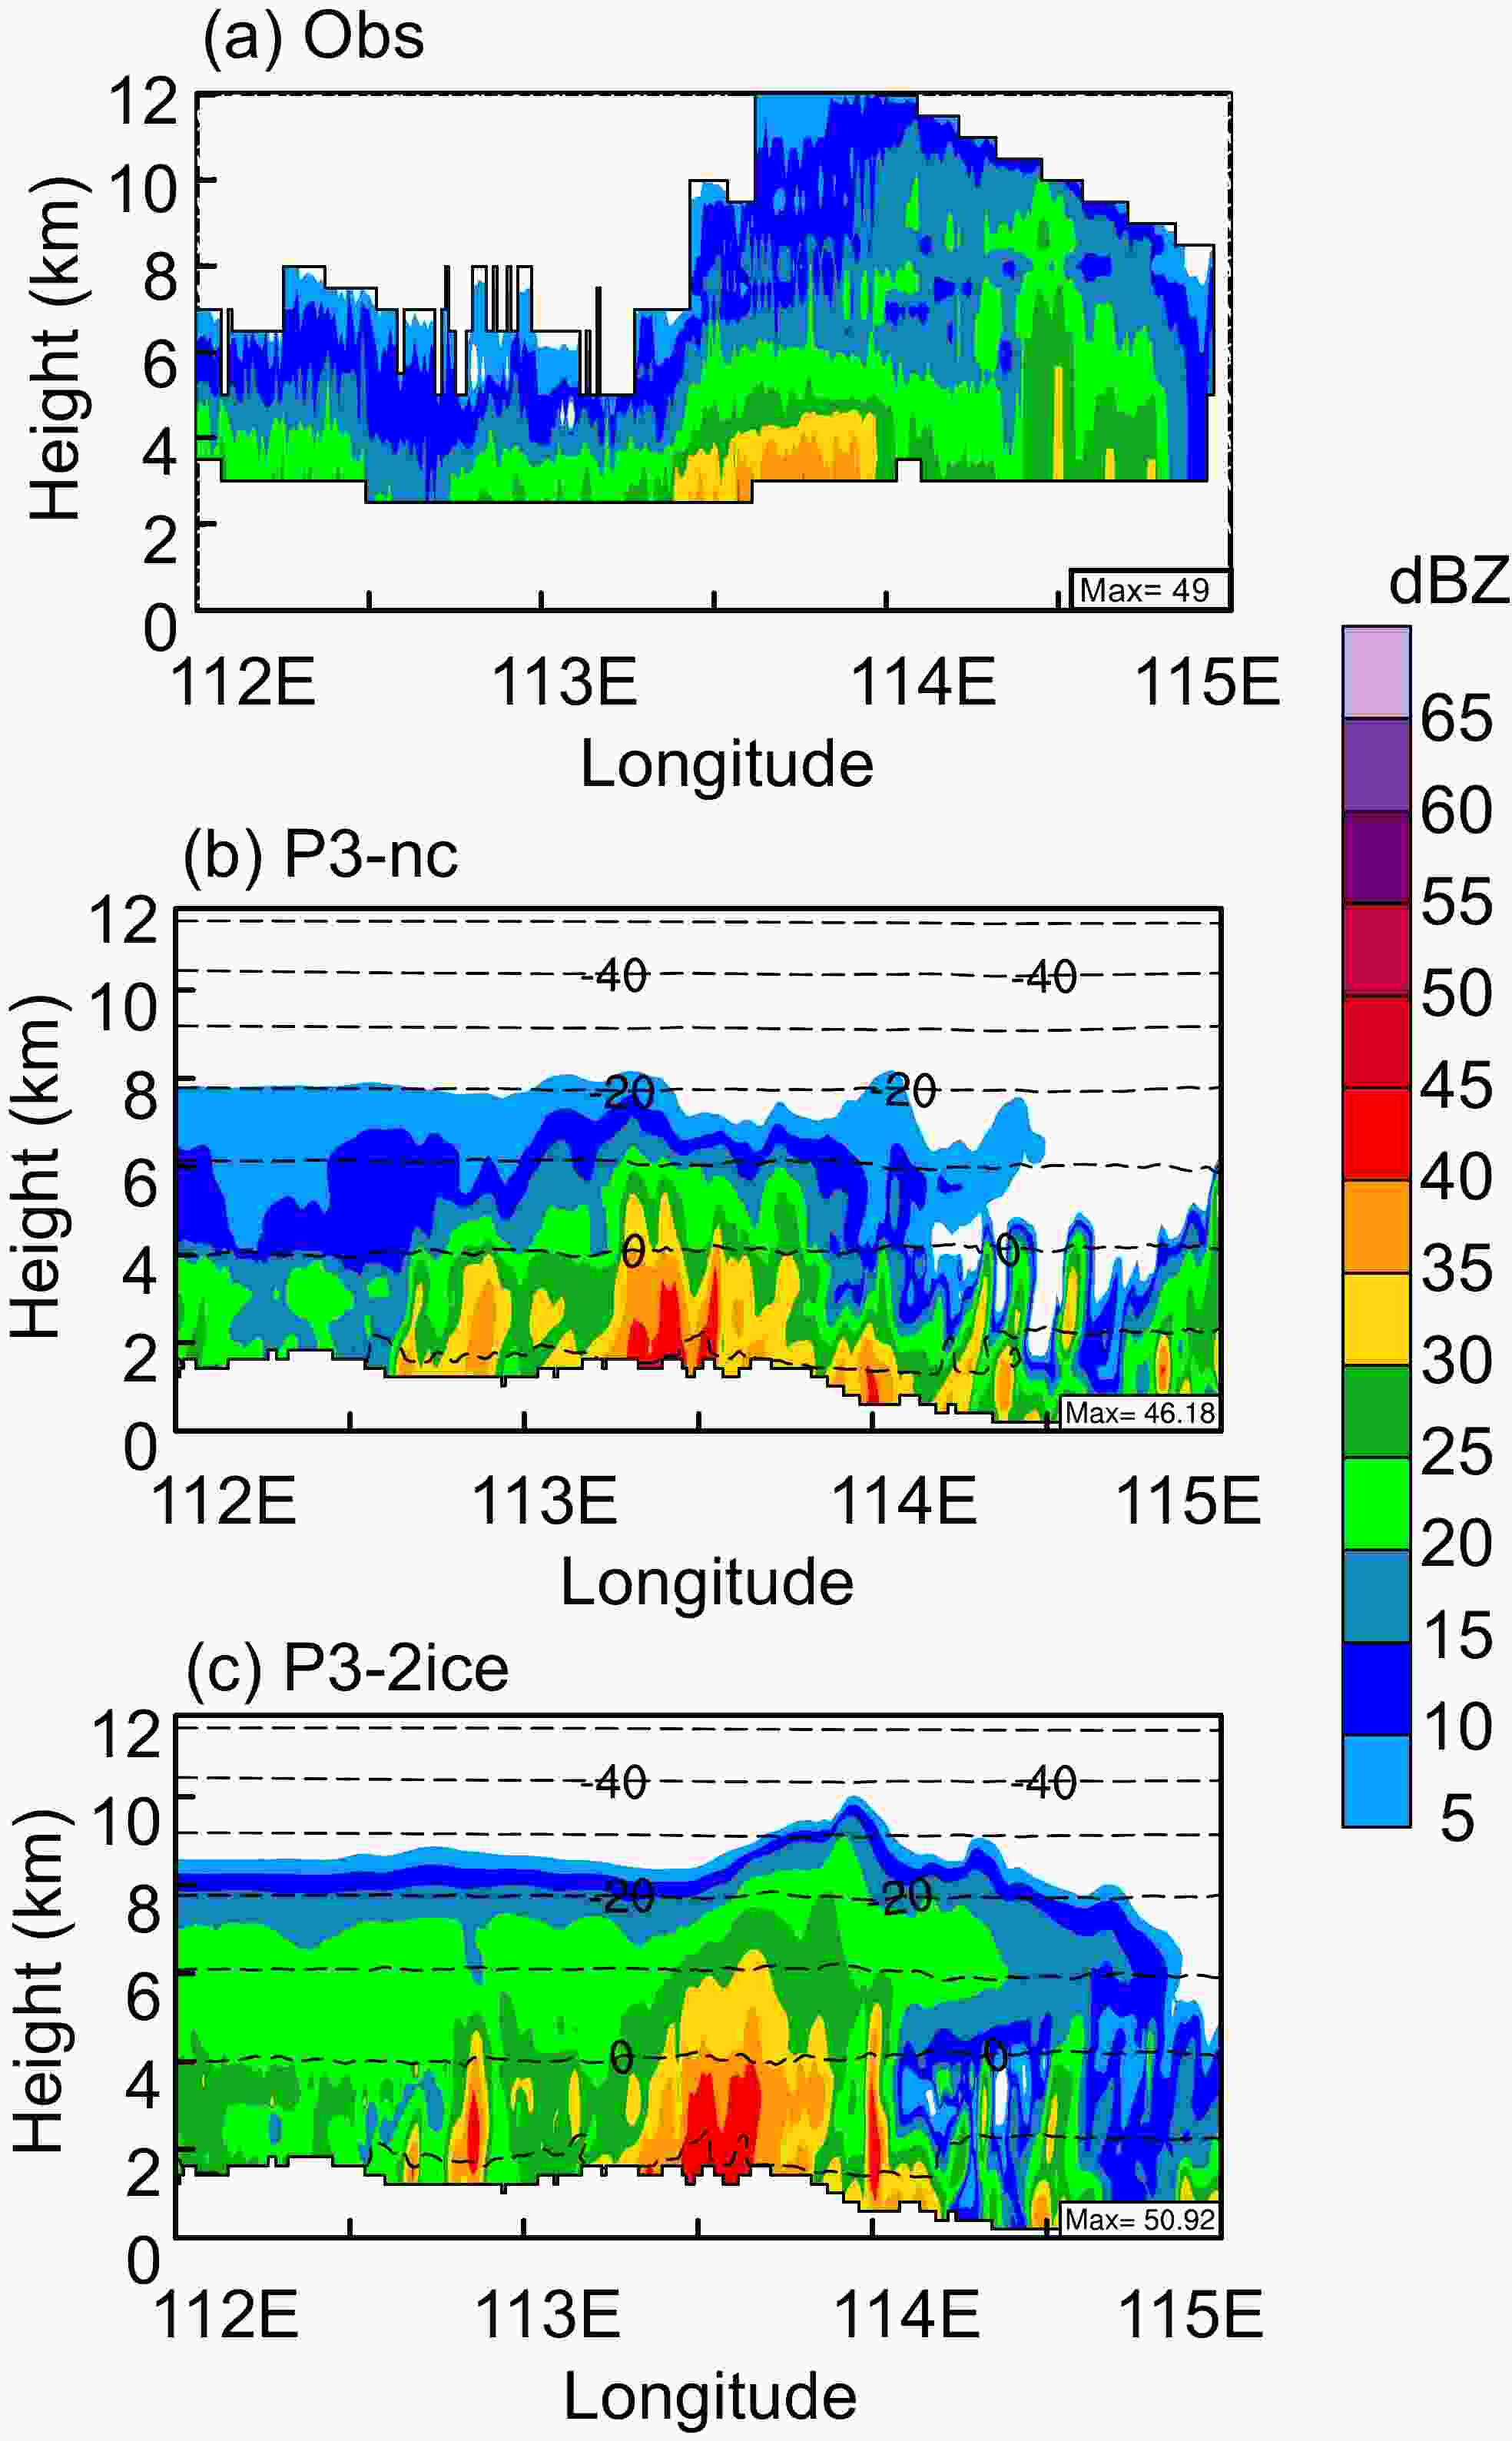
Figure 8. Composite reflectivity (units: dBZ) along 37°N at 0900 UTC on 22 May retrieved from the (a) observations and (b) P3-nc and (c) P3-2ice simulations. The quasi-horizontal dashed lines in (b) and (c) are temperature contours.
A comparison of the precipitation evolution between P3-nc and P3-2ice suggested that both P3 versions overpredicted surface precipitation along the Taihang Mountains but underpredicted precipitation in the localized region of the lee. P3-2ice produced slightly lower peak precipitation rates and smaller total precipitation amounts than P3-nc, which were closer to the observations. P3-2ice also more realistically reflected the overall reflectivity structures than P3-nc. Nevertheless, precipitation was overpredicted in the western plateau region and eastern plain area.
-
To explain the differences in precipitation distribution and radar structure, we compared microphysical variables obtained from P3-nc and P3-2ice in this section. We could not expect the model to reproduce the microphysical variations along all spirals. We focus on the degree of agreement in ice properties.
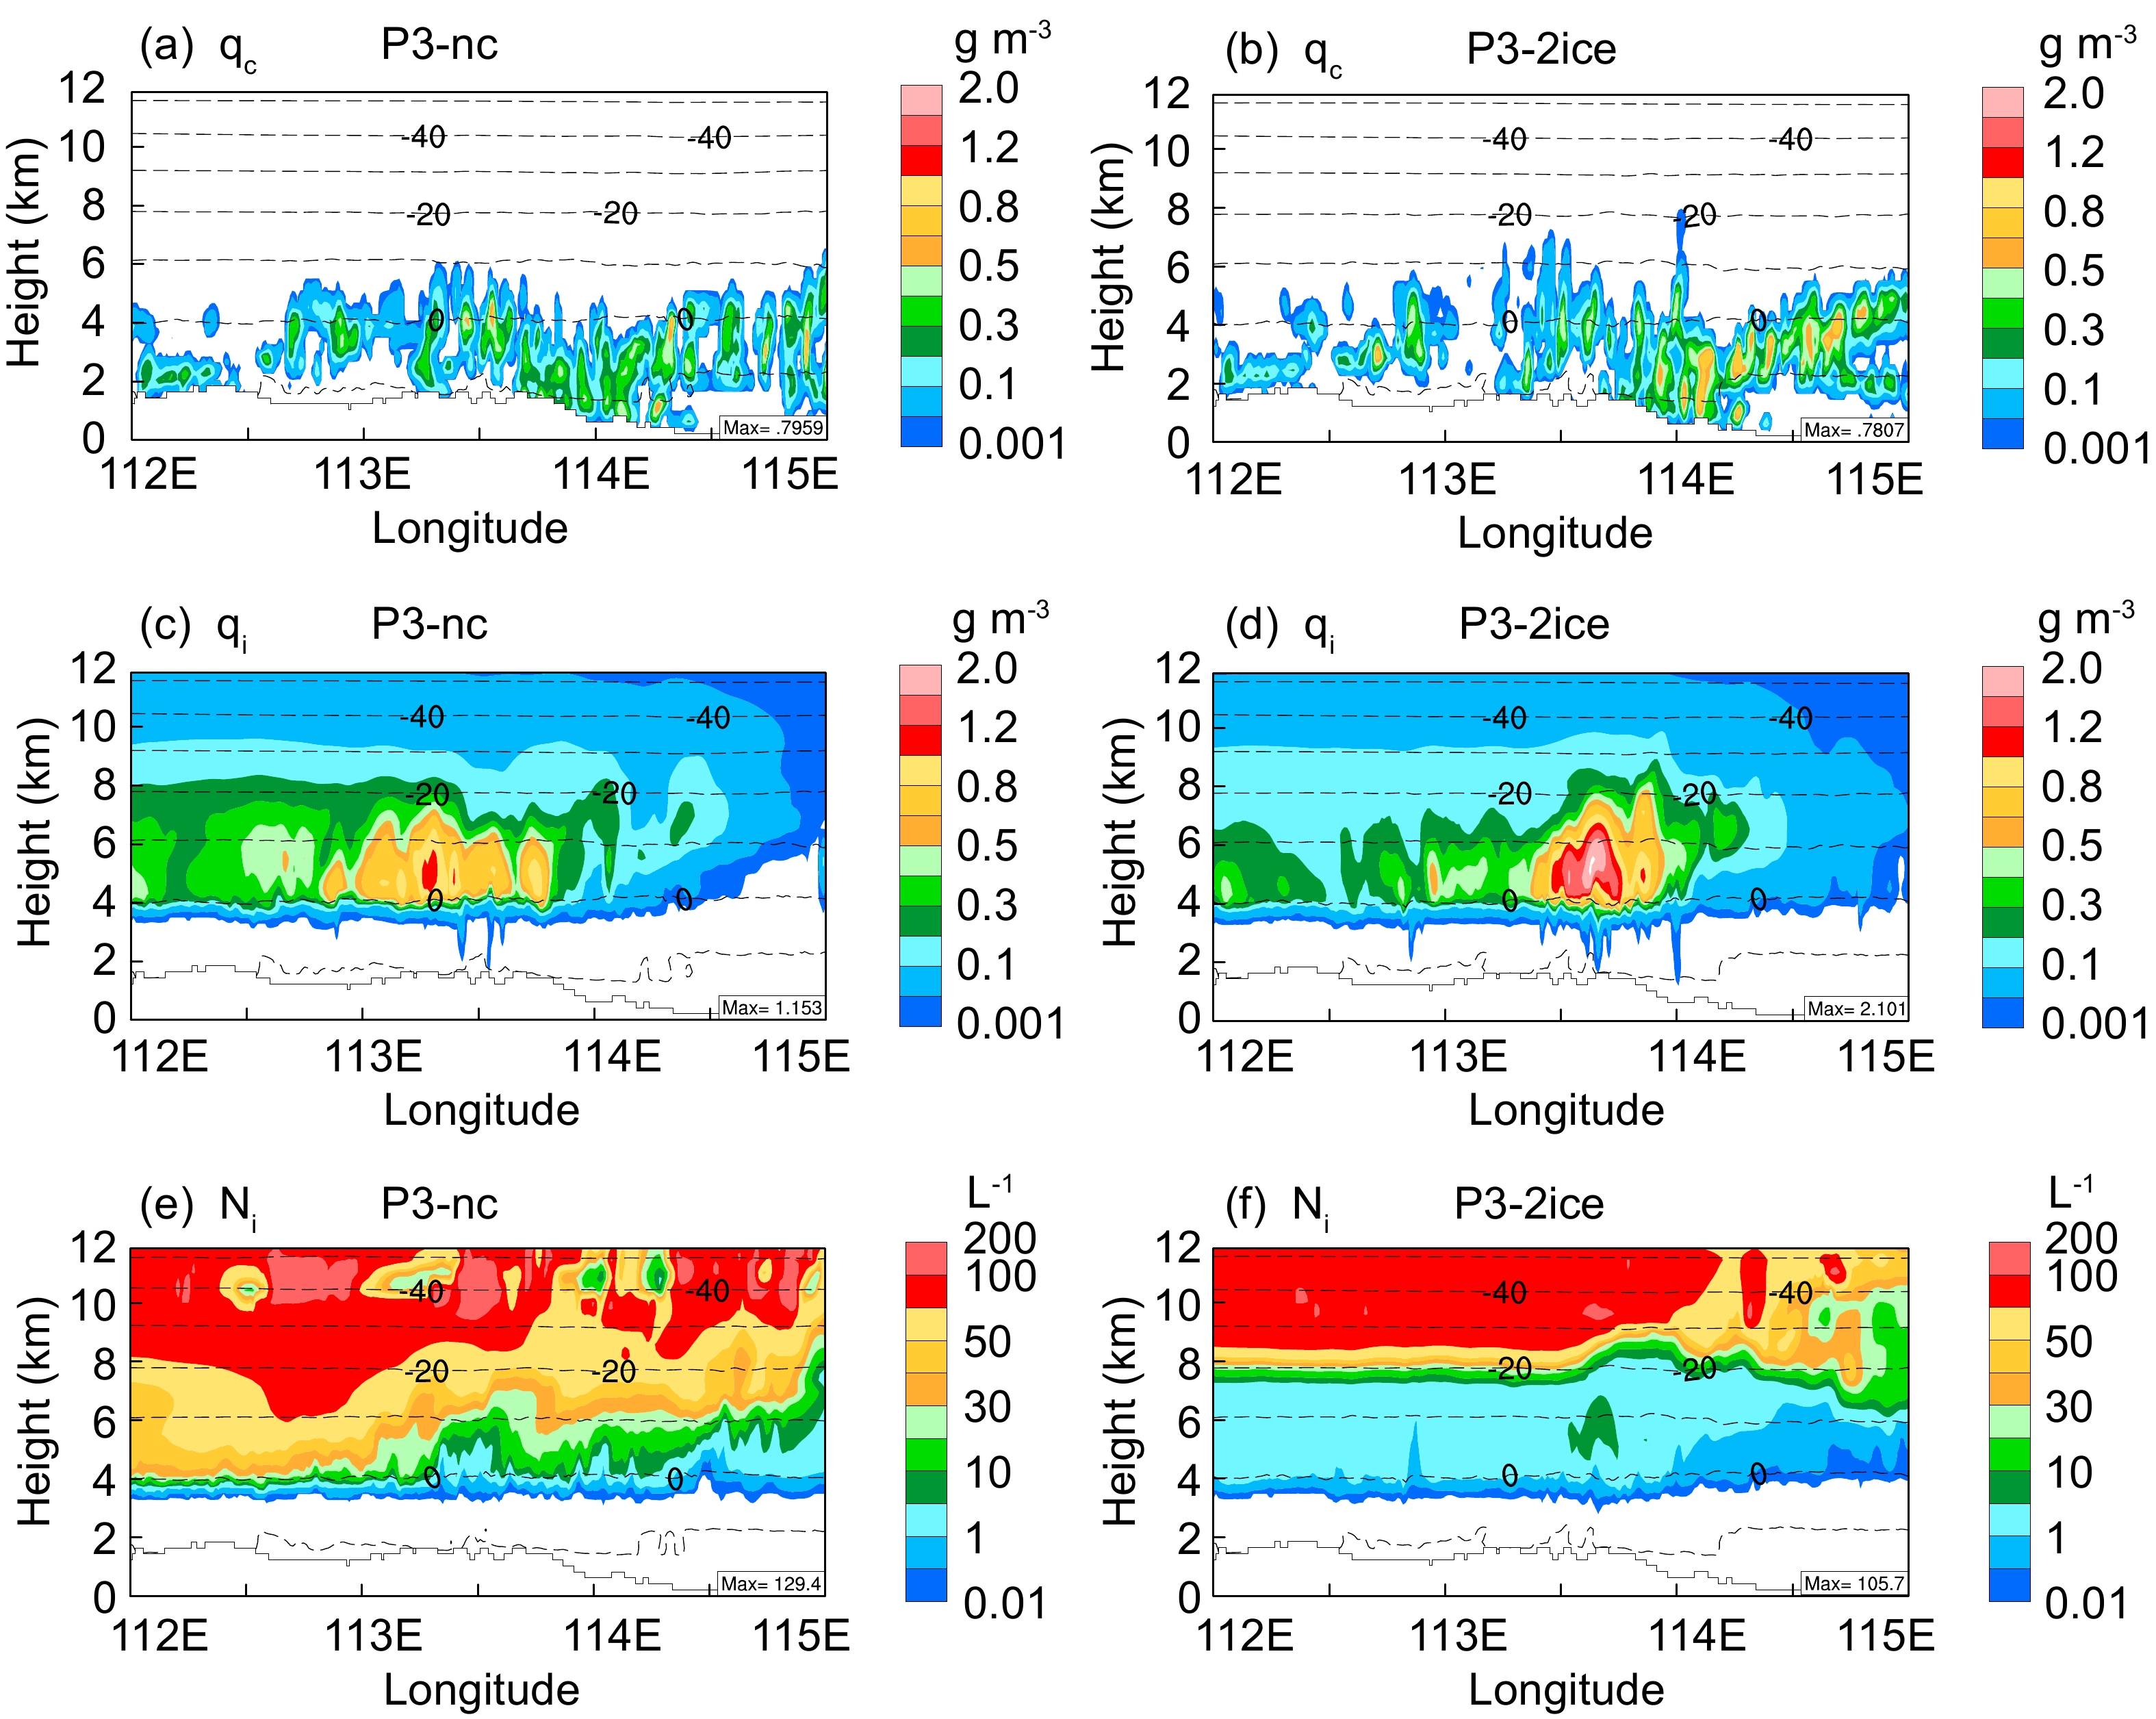
Figure 9 shows vertical cross sections of cloud water and total ice along 37°N at 0900 UTC on 22 May, as retrieved from P3-nc and P3-2ice. P3-nc produced extensive cloud water (Fig. 9a) at heights below 6 km, with a peak near 0.8 g m–3 from 4–5 km above the freezing level. The total ice (Fig. 9c) extended from the melting layer to over 12 km, with peak values exceeding 1.1 g m–3 from 4–6 km. The enhanced total ice corresponded to a rime mass fraction ranging from 0.2 to over 0.9. Cloud water in P3-2ice extended higher than that in P3-nc, up to almost the –20°C level (Fig. 9b). The cloud water content in the eastern part was also much higher, characterized by a larger cloud water mass exceeding 0.5 g m–3. P3-2ice produced an overall larger total ice mass in the 113.4°–114°E region, exceeding 2 g m–3 at approximately 5 km (Fig. 9d). The increased vertical extent of the hydrometeor mass and enhanced ice mass in the region at approximately 113.5°E resulted in a more realistic reflectivity structure, as shown in Fig. 8.

Figure 9. Vertical cross sections of cloud water (units: g m−3), total ice content (units: g m−3), and total ice concentration (L–1) along 37°N at 0900 UTC on 22 May, as retrieved from P3-nc (left) and P3-2ice (right). The quasi-horizontal dashed lines denote temperature contours.
In the P3-nc case, ice concentrations (Fig. 9e) exceeded 100 L–1 above 8 km and decreased to generally less than 75 L–1 below 8 km. This was understandable since the Cooper ice-nuclei formula was temperature dependent, predicting higher concentrations of ice crystals in cold temperatures than in warmer temperatures. P3-2ice also produced numerous ice particles at heights above 8 km but exhibited dramatic differences from P3-nc with much lower concentrations near 6 km (Fig. 9f). Ice concentrations from P3-nc between 4 km and 8 km varied significantly from 1 L–1 to approximately 70 L–1, while ice concentrations from P3-2ice were generally less than 10 L–1.
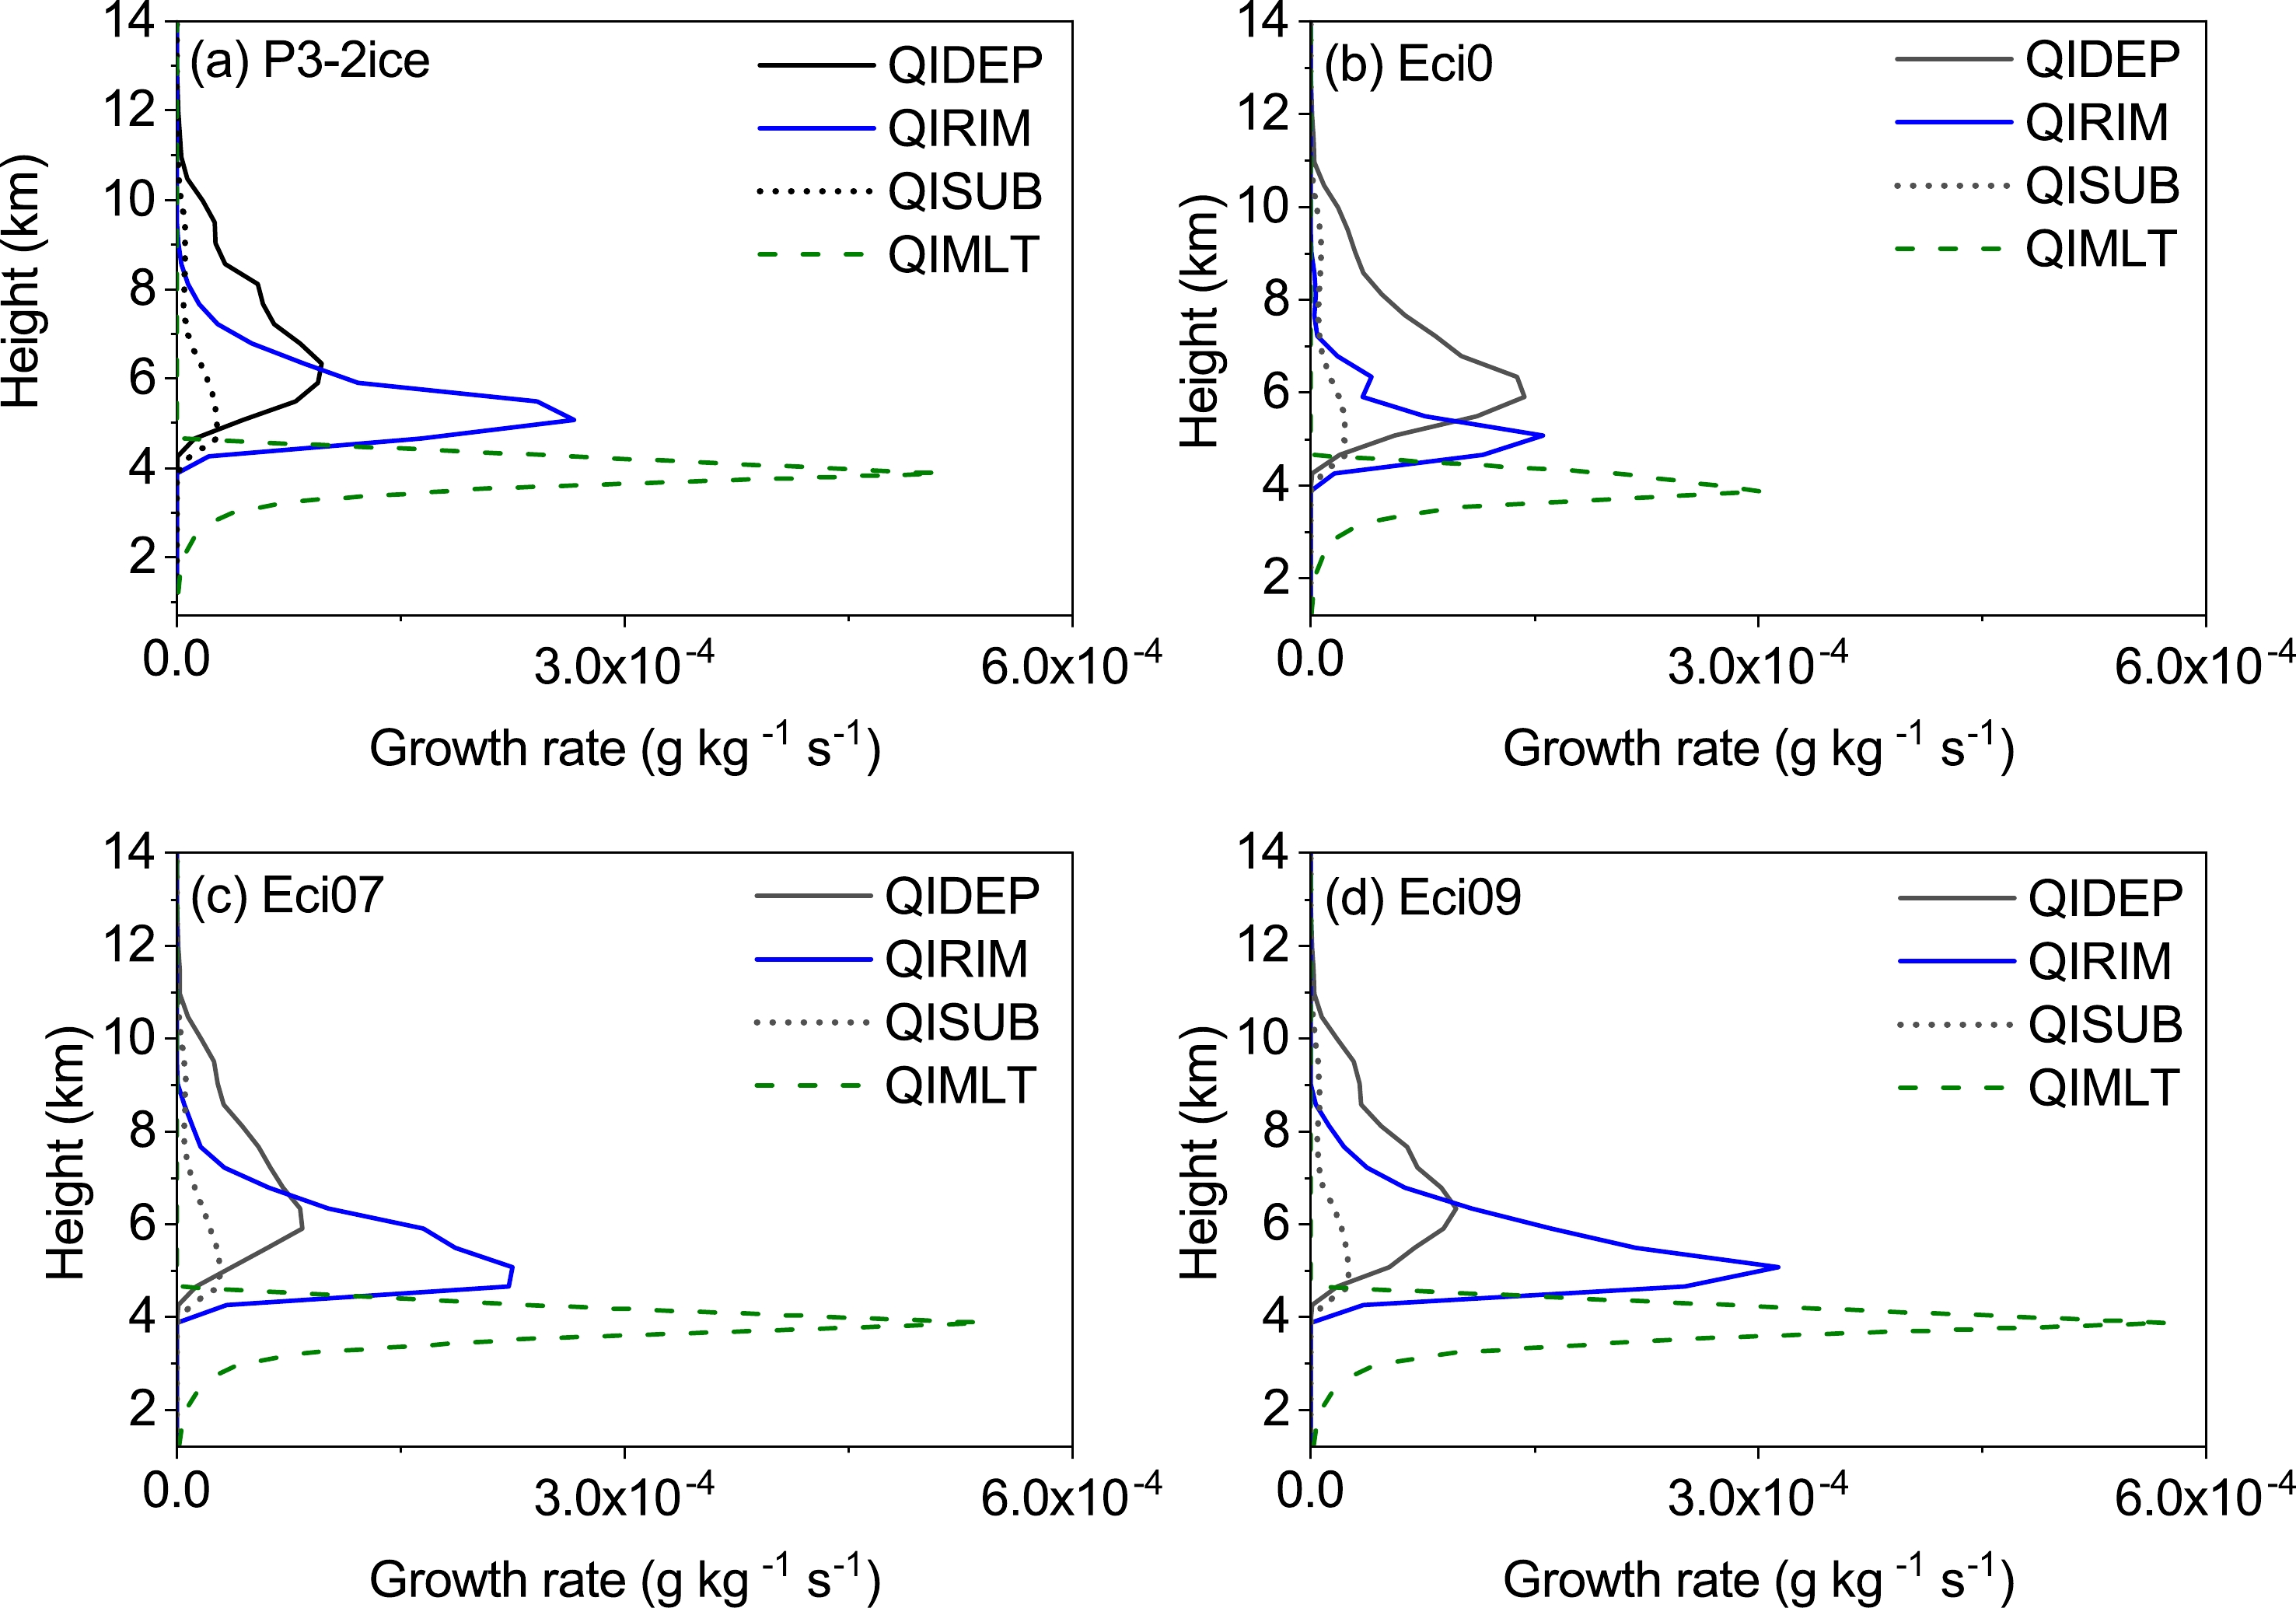
To further explore the differences in ice concentrations between the P3-nc and P3-2ice simulations, domain-averaged vertical profiles of ice concentration and major processes contributing to ice production are compared (Fig. 10). As shown in Fig. 9, the most dramatic difference was that ice concentrations in P3-nc decreased gradually below 8 km, while ice concentrations in P3-2ice decreased sharply to a magnitude of 1 L–1 at 6.5 km (Fig. 10a). The major source and sink terms for ice concentration were ice nucleation, self-collection of ice, melting of ice, and ice sublimation in both P3 versions. In addition, ice multiplication and ice-ice collisions between categories were considered in P3-2ice. An overview of the growth rates from the major processes (Figs. 10b–d) suggested that the major processes leading to the difference in ice concentrations from the two simulations were self-collection of ice and ice-ice collisions between categories. P3-2ice produced larger self-collection rates, particularly the peak of up to 1.8 L–1 at 5.7 km. The additional ice-ice collisions between categories also contributed to decreased ice concentrations between 6 and 8 km, although the growth rates were much lower, with a magnitude of 0.01 L–1. Thus, the more efficient aggregation in P3-2ice from the self-collection of ice and ice-ice collisions between categories led to decreased ice concentrations between 4 and 6 km.
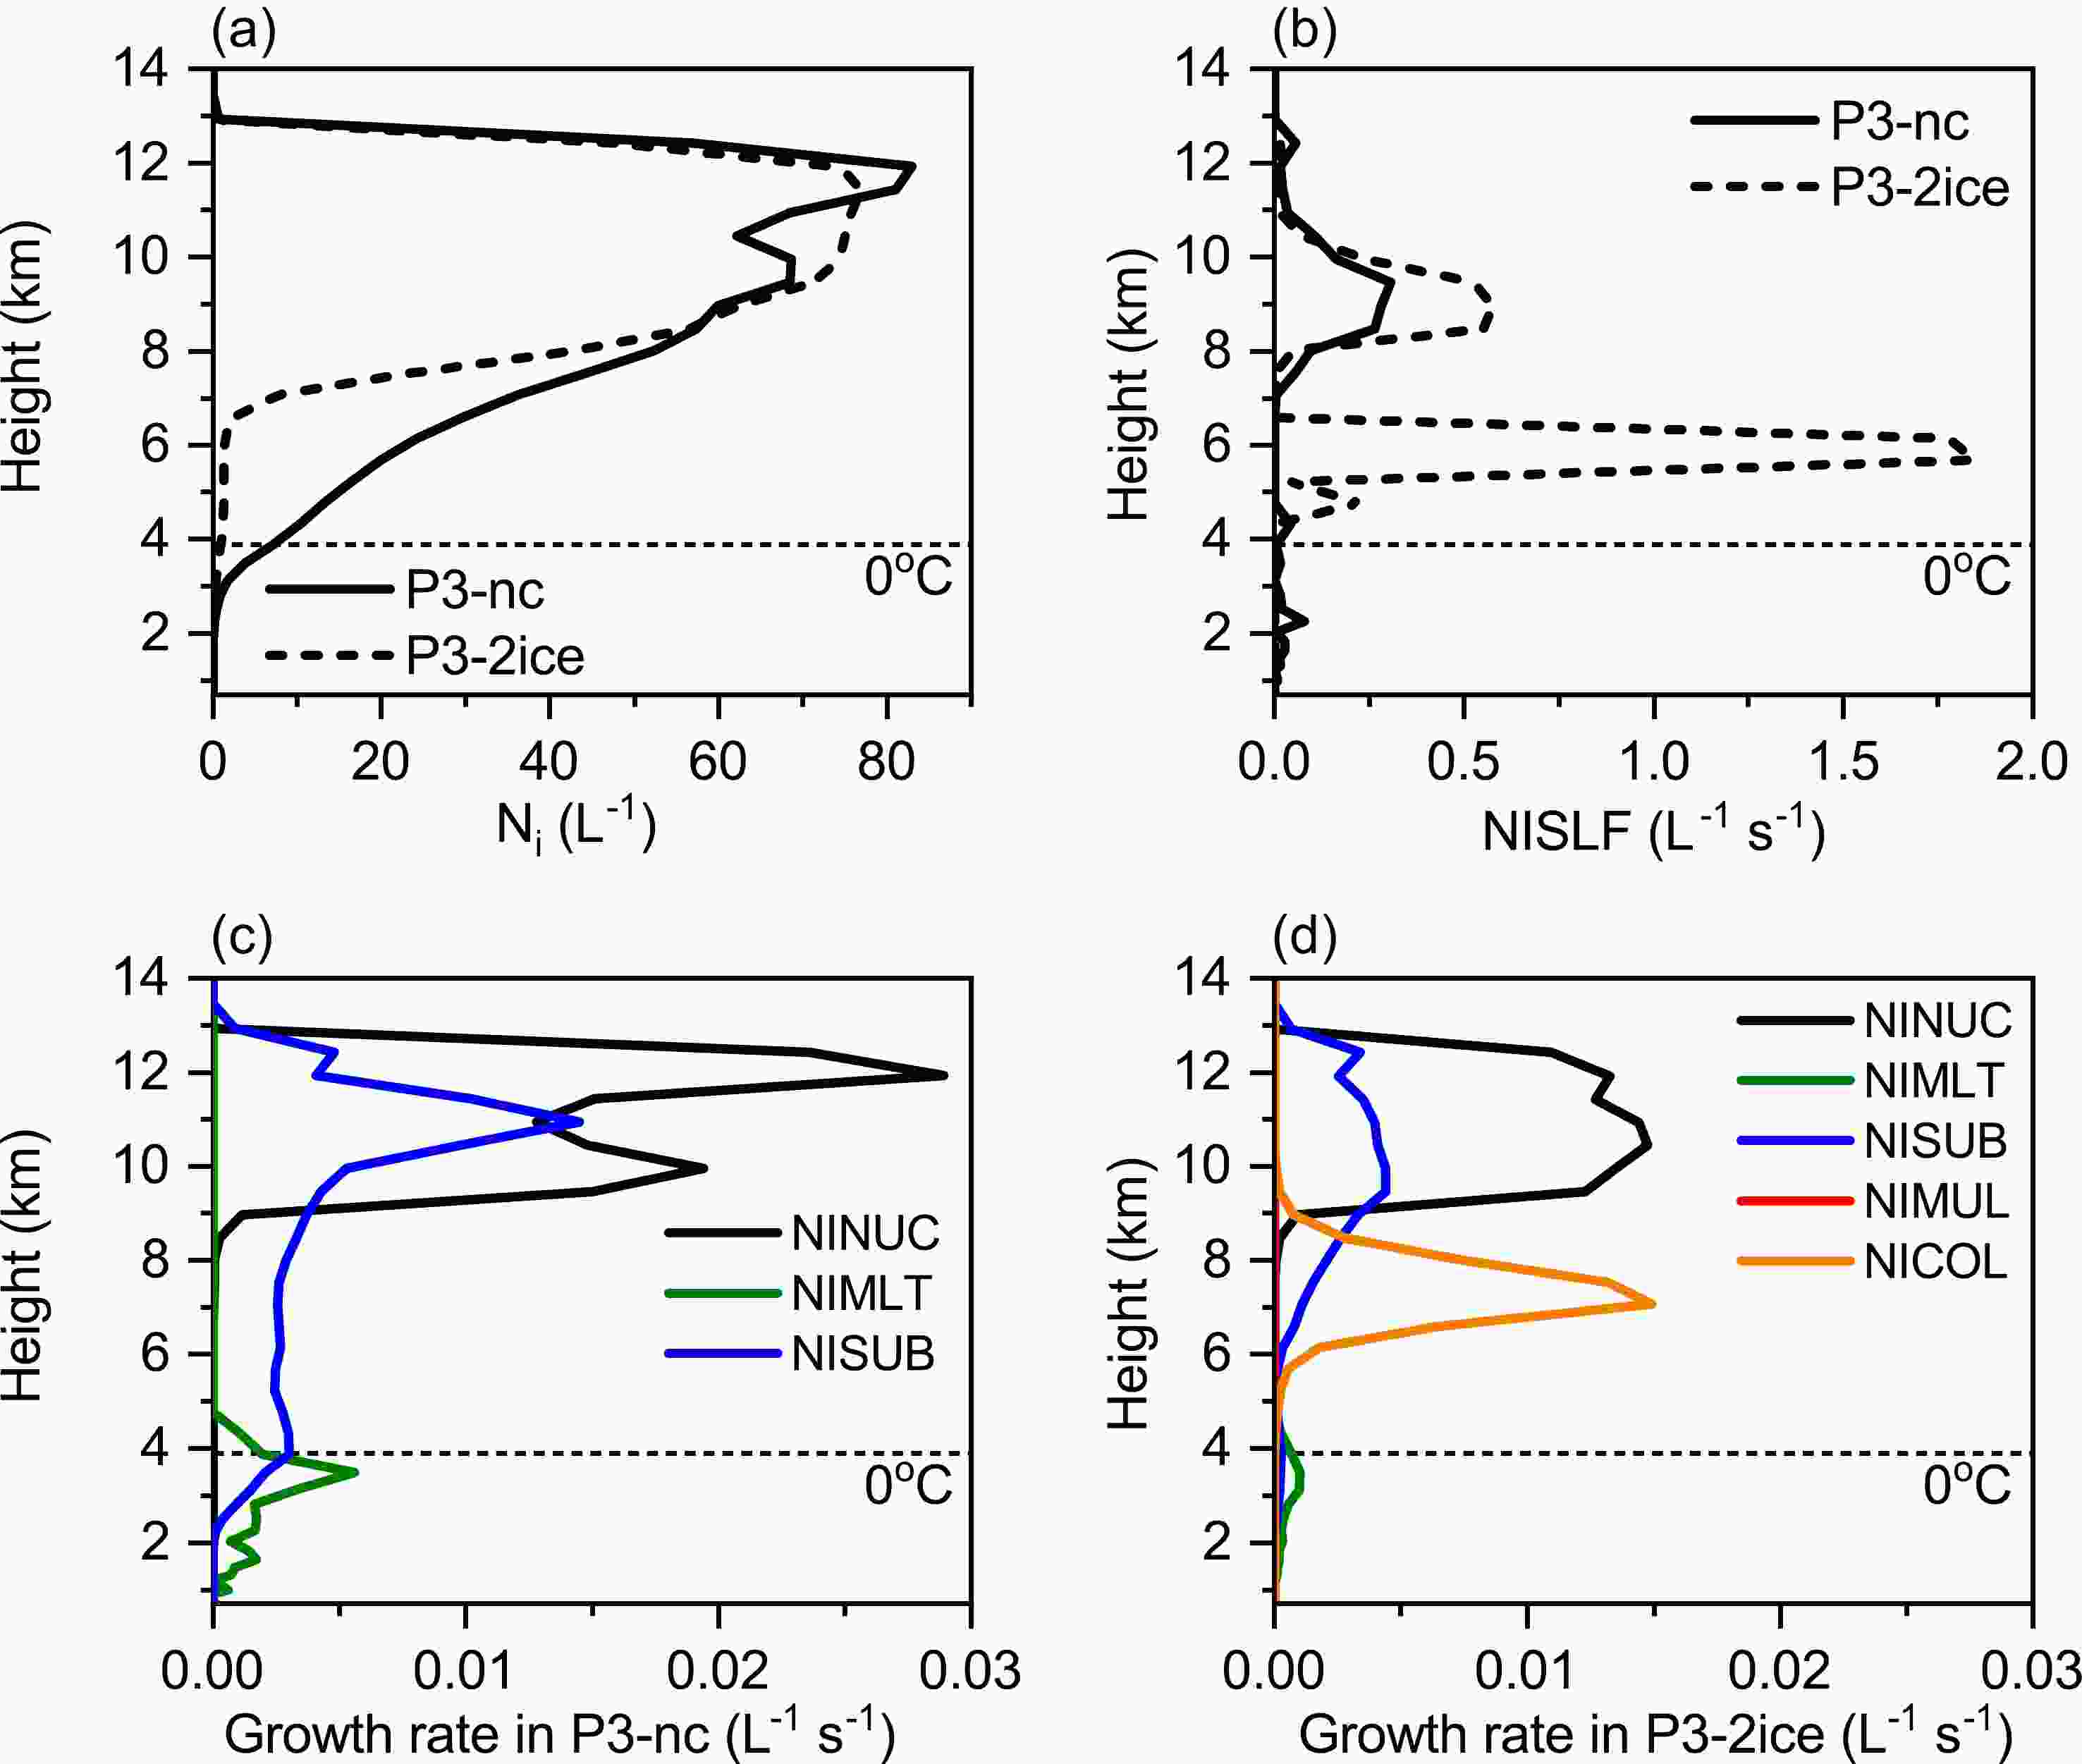
Figure 10. Vertical profiles of domain-averaged (a) ice concentration (L–1) and growth rates of ice concentration during (b) NISLF (L–1 s–1), (c) major processes to ice production in P3-nc, and (d) major processes to ice production in P3-2ice. The dotted horizontal line denotes the 0°C layer. NISLF = self-collection of ice within a category; NINUC = ice nucleation; NIMLT = melting of ice; NISUB = ice sublimation; NIMUL = ice multiplication; NICOL = ice-ice collisions between categories.
The impact of aggregation on ice particle growth should not be ignored. Aircraft observations revealed that aggregation was active over the embedded convective region, with an increasing trend from a higher –16°C level to a lower –10°C level. Considering measurements from both the 2D-S and HVPS, ice particles (>100 μm) in the temperature range from –10°C to –16°C were assumed to have concentrations of 10 L–1. P3-nc produced ice particles at concentrations of 20–50 L–1, while P3-2ice produced relatively lower total ice concentrations with values of 1–10 L–1 at those temperatures. Thus, P3-nc probably produced weaker aggregation than the observations. The more efficient aggregation and lower ice concentrations in P3-2ice compared more favorably with observations.
Molthan et al. (2016) compared four bulk microphysical schemes in the WRF model and found that aggregation was not well represented and resulted in the underestimation of large particles. Model-simulated weaker aggregation at certain levels might be responsible for the inaccurate simulation of ice water content profiles (Han et al., 2019). These previous studies suggested that aggregation was not adequately represented in numerical models. In P3, the aggregation efficiency was simply temperature dependent, linearly increasing from –20°C to –5°C. The parameterization of aggregation in P3 still needs improvement. Quantitative determination of collection efficiency from aircraft observations may be particularly important (Field et al., 2006).
The growth rate of ice multiplication is also shown in Fig. 10d. The domain-averaged ice multiplication rates were much smaller than those from other processes since ice multiplication only occurred in localized regions. The impact of ice multiplication on ice concentrations could be as high as 100 L–1 at the initiation time (0800 UTC) but decreased rapidly to 5–10 L–1 at 0900 UTC (Fig. 9d, at 113.6°E). Sensitivity experiments without ice multiplication in P3-2ice (not shown) suggested little change in surface precipitation. Therefore, ice multiplication associated with rime splintering in P3-2ice caused increases in ice concentrations in localized regions but had little impact on precipitation.
Rimed ice was produced from both P3 versions. P3-2ice produced two ice categories with different properties 1) ice with a high mass, efficient riming, and high fall speeds, and 2) ice having a much lower mass and riming degree. The ice in category two occurred only at mid-levels near –20°C with virtually no riming and was not discussed in this section.
To compare rimed ice in the two simulations, Fig. 11 shows vertical cross-sections of various microphysical variables obtained from P3-nc and the ice in category one from P3-2ice along 37°N at 0900 UTC on 22 May. The rimed mass in P3-nc (Figs. 11a, c) was located primarily near 4–6 km, with rime mass fractions varying from 0.1 to over 0.9. In comparison, rimed ice in P3-2ice (Figs. 11b, d) was more concentrated at approximately 113.5°E, relatively closer to the location of the observed embedded convective region. Subsequently, the rime mass fraction at 113.5°E had relatively higher values of 0.5–1.0. Active aggregation in P3-2ice resulted in larger ice particle sizes of 5–6 mm at heights between 4 and 6 km. Increases in riming intensity translated to increases in ice particle densities and fall speeds. In the embedded convective region, the ice above the melting level had properties characterized by moderate densities >300 kg m−3, larger sizes >5 mm, and faster fall speeds >2 m s–1 (Figs. 11f, h, and j). In situ observations confirmed the occurrence of moderate to heavy riming at temperatures warmer than –10°C in the embedded convective region, including rimed dendrites, graupel-like snow, and plate-like assemblages. Using relationships between ice particle fall speeds and maximum dimensions from Locatelli and Hobbs (1974), densely rimed dendrites from 1 to 3 mm in size have fall speeds from 0.6 to 0.9 m s–1. Graupel-like snow of the lump type between 1 and 3 mm in size has fall speeds from 1.1 to 1.5 m s–1 and lump graupel with densities of 200–450 kg m–3 and sizes of 1–3 mm has fall speeds from 1.5 to 2.3 m s–1. Thus, the model simulated riming intensity and fall speed variations were in general agreement with the observations.
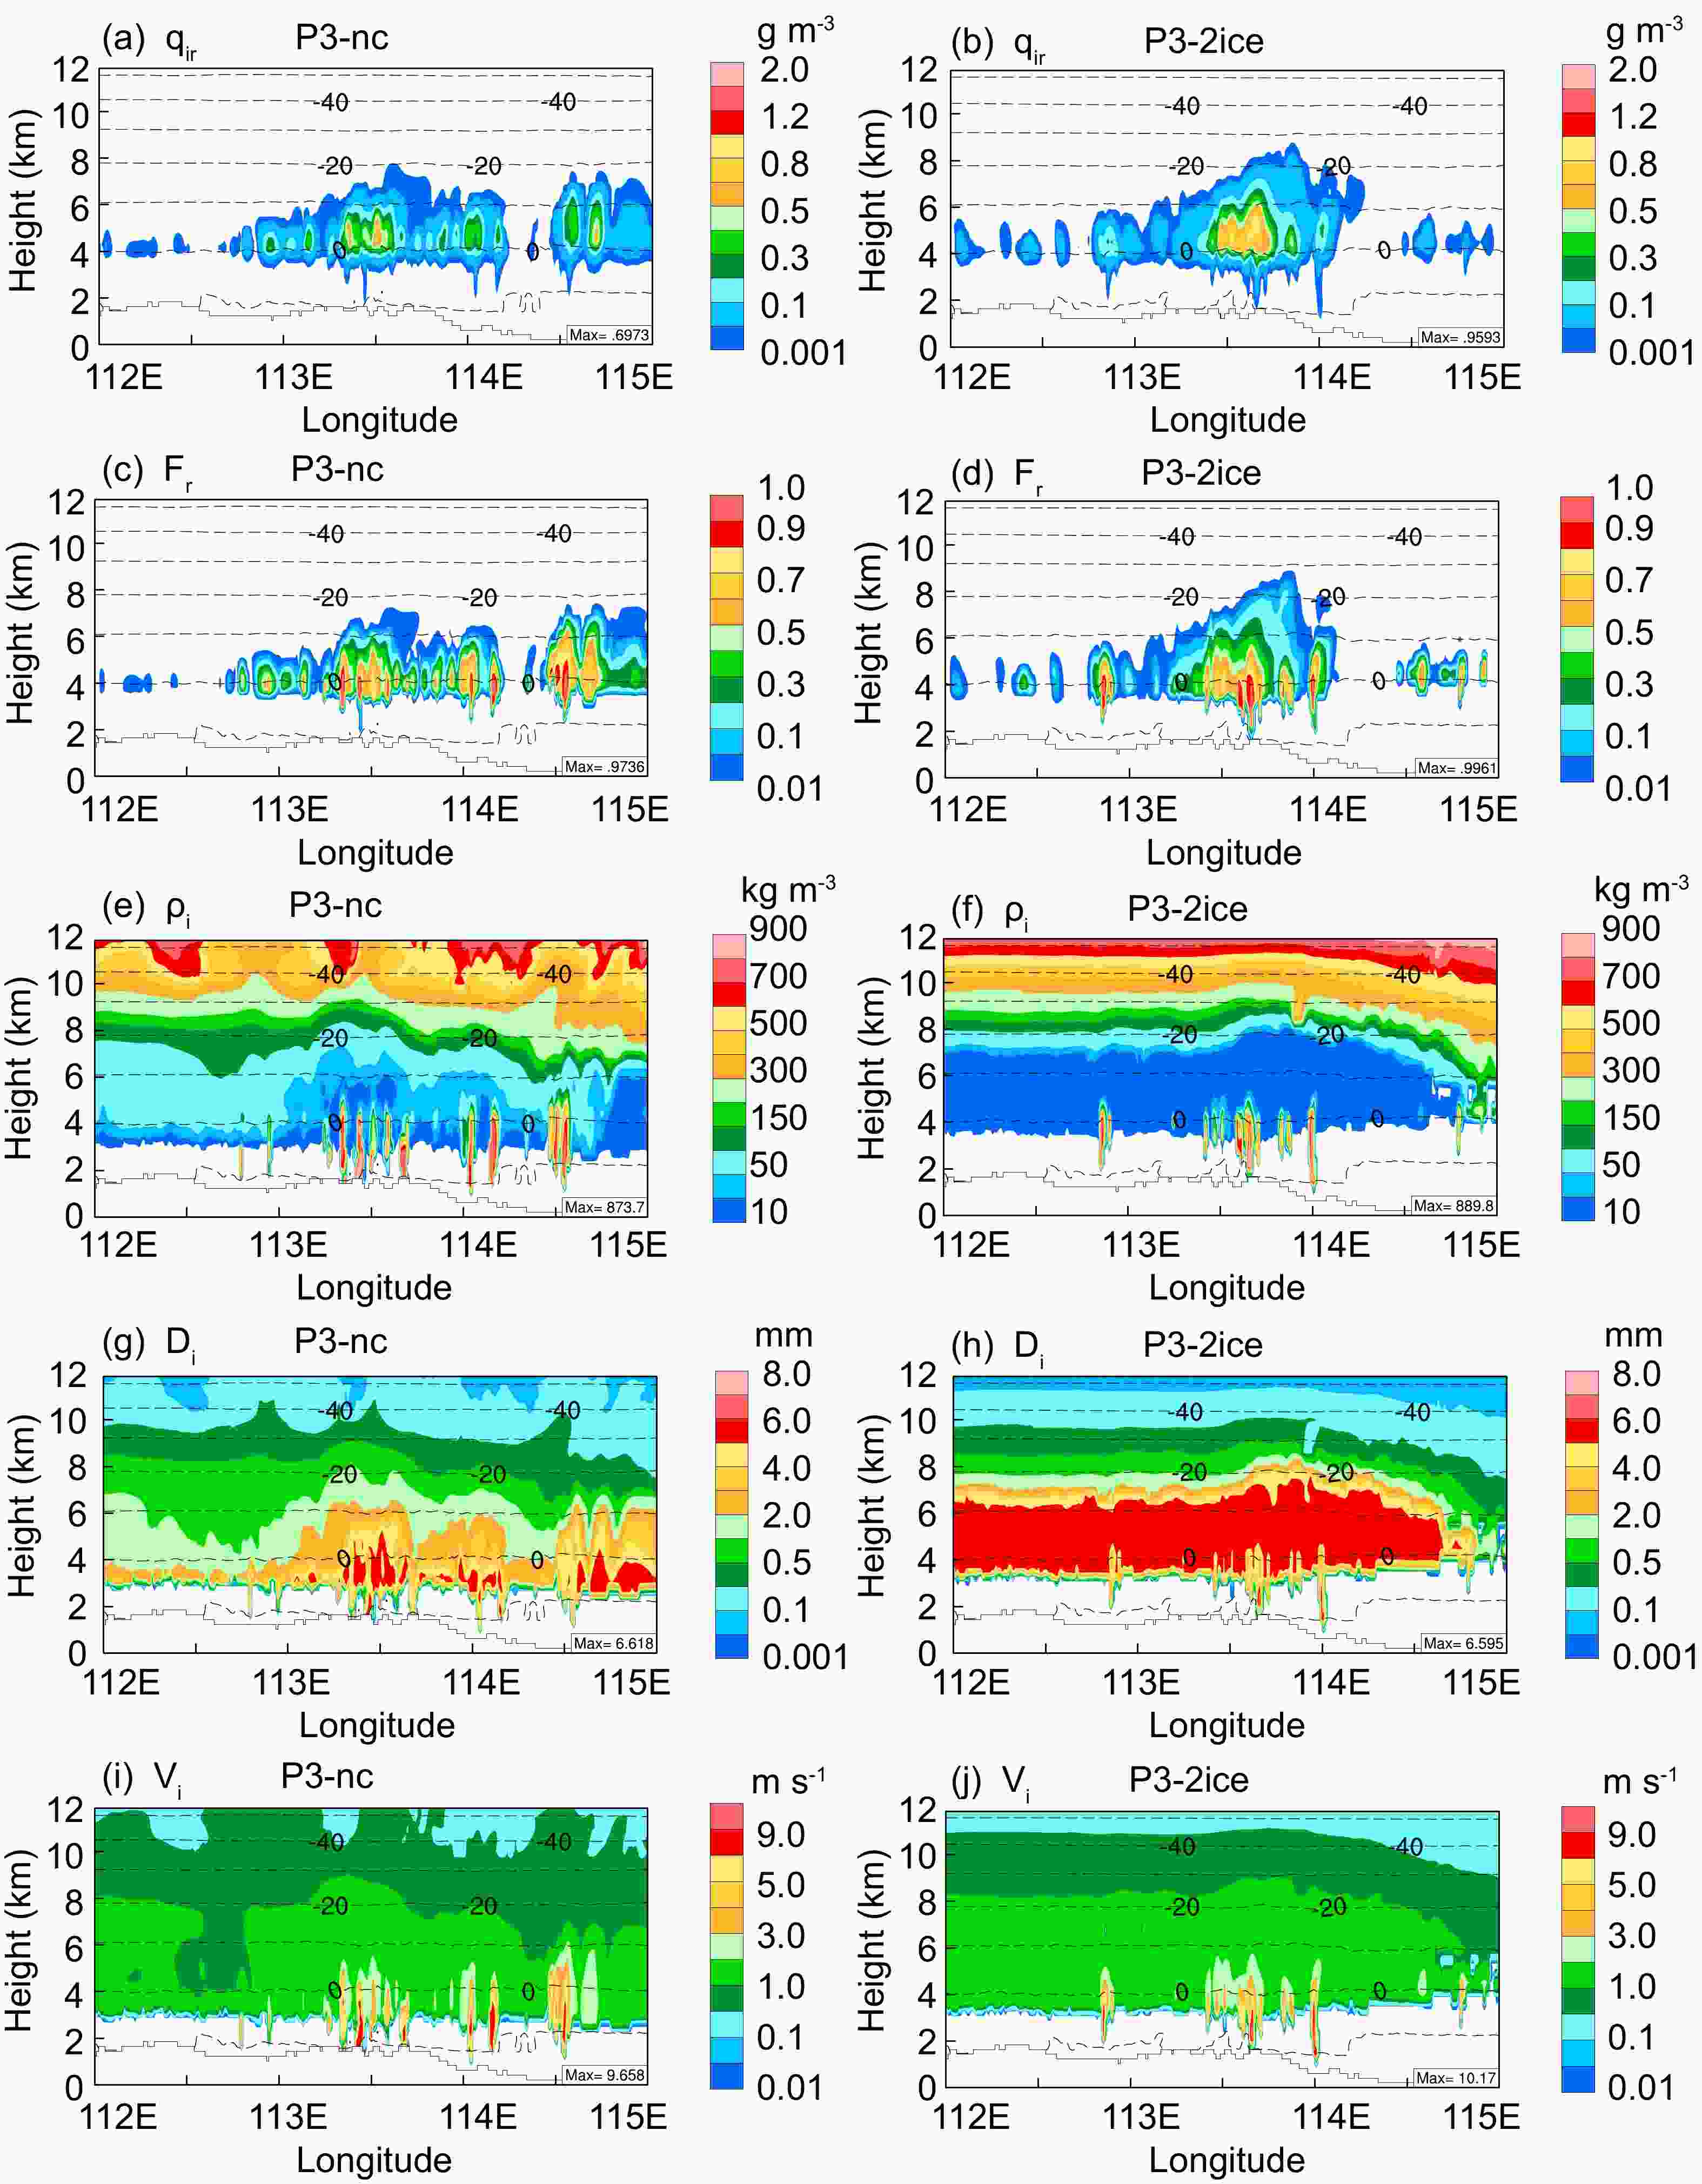
Figure 11. Vertical cross sections of rimed ice (units: g m−3), rime mass fraction, mass-weighted mean ice particle densities (units: kg m−3), mass-weighted mean ice particle sizes (units: mm), and mass-weighted mean ice particle fall speeds (units: m s−1) from P3-nc (left) and P3-2ice (right, for ice in category one) along 37°N at 0900 UTC on 22 May from P3-nc. The quasi-horizontal dashed lines denote temperature contours.
-
To explore the impact of riming on surface precipitation, we conducted a set of experiments with different collection efficiencies between ice and cloud droplets. A comparison of the maximum precipitation amount and RMSE for the 15-h accumulated precipitation is provided in Table 4. P3-2ice produced a maximum accumulated precipitation of 168.3 mm. Reduced riming (Eci0) produced a lower maximum value of 147.4 mm. There was little difference in precipitation maxima between P3-2ice and Eci07. In comparison, increased riming rates from Eci09 yielded a much higher maximum value of up to 221.5 mm. The RMSE slightly increased from 13.9 for Eci0 to 14.8 for Eci09, indicating larger precipitation amounts with increasing collection efficiency. Therefore, the total precipitation was not sensitive to changes in collection efficiencies between ice and cloud droplets. When the collection efficiency increased from 0.7 to 0.9, a significant increase in precipitation maxima was produced.
Simulation name Max precipitation (mm) RMSE P3-2ice 168.3 14.2 Eci0 147.4 13.9 Eci07 152.8 14.7 Eci09 221.5 14.8 Table 4. Comparison of the 15-h accumulated precipitation valid at 1500 UTC on 22 May 2017 retrieved from the simulations.
The time series of maximum hourly precipitation from P3-2ice and sensitivity experiments are shown in Fig. 12. The largest differences in hourly precipitation rates were at 0600 UTC when hourly precipitation maxima increased from approximately 60 mm h–1 in P3-2ice, Eci0, and Eci07 to a peak of 100 mm h–1 in Eci09. There were few differences in precipitation rates among the four runs for other times. Thus, the significant increase in the 15-h accumulated precipitation from the other three runs to Eci09 was attributed to the large increase in precipitation rates for brief periods. To show the discrepancy in precipitation more clearly, Fig. 13 shows the 1-h accumulated precipitation between 0500 and 0600 UTC from P3-2ice and Eci09. The precipitation distributions in P3-2ice and Eci09 were similar. Differences in precipitation maxima between the two simulations could be seen in the selected subdomain. Thus, the changes in collection efficiencies between ice and cloud droplets had little influence on total precipitation and precipitation distribution; however, they could result in a large increase in local precipitation rates during the early precipitation stage.

Figure 12. Time series of maximum hourly precipitation from P3-2ice and sensitivity experiments.
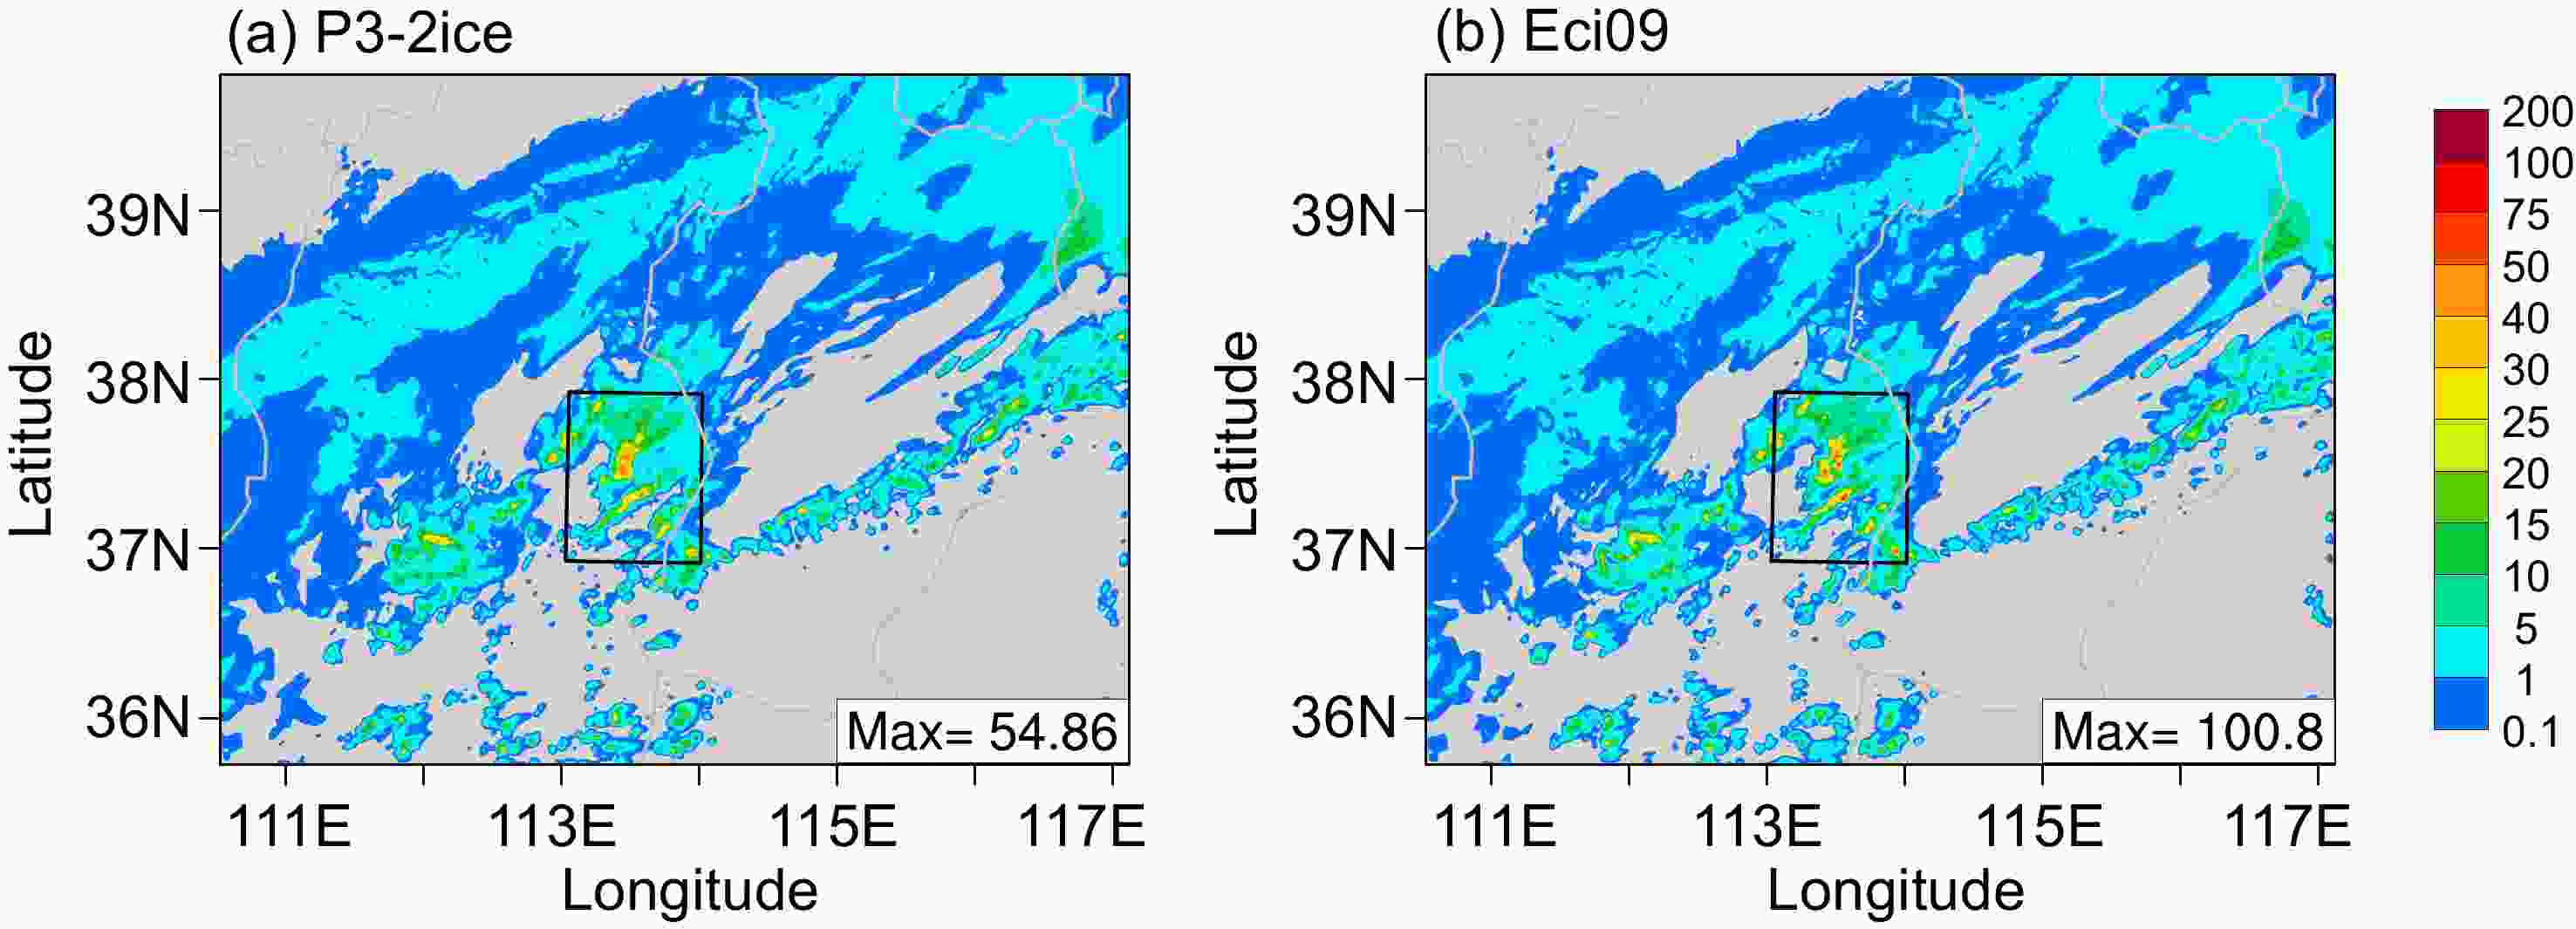
Figure 13. 1-h accumulated precipitation (units: mm) between 0500 and 0600 UTC 22 May 2017 from (a) P3-2ice and (b) Eci09. The black squares denote the selected subdomain.
Figure 14 shows vertical profiles of the domain-averaged dominant processes for ice production in the selected subdomain at 0500 UTC retrieved from the four simulations. The riming of ice in Fig. 14 includes immersion freezing of droplets and rain, collection of cloud droplets by ice, and collisions between rain and ice. Ice predominantly grew via deposition at heights above 4 km and secondarily by riming at lower levels (Fig. 14a). Riming occurred below 8 km and peaked at 2.7 × 10⁻⁴ g kg–1 s–1 near 5 km. The peak riming rate was larger than the depositional growth rate, indicating that riming played a significant role in depleting cloud water at heights below 7 km. Sublimation and melting were major sink terms for ice. Ice melting was the most important producer of rain in stratiform clouds over northern China.
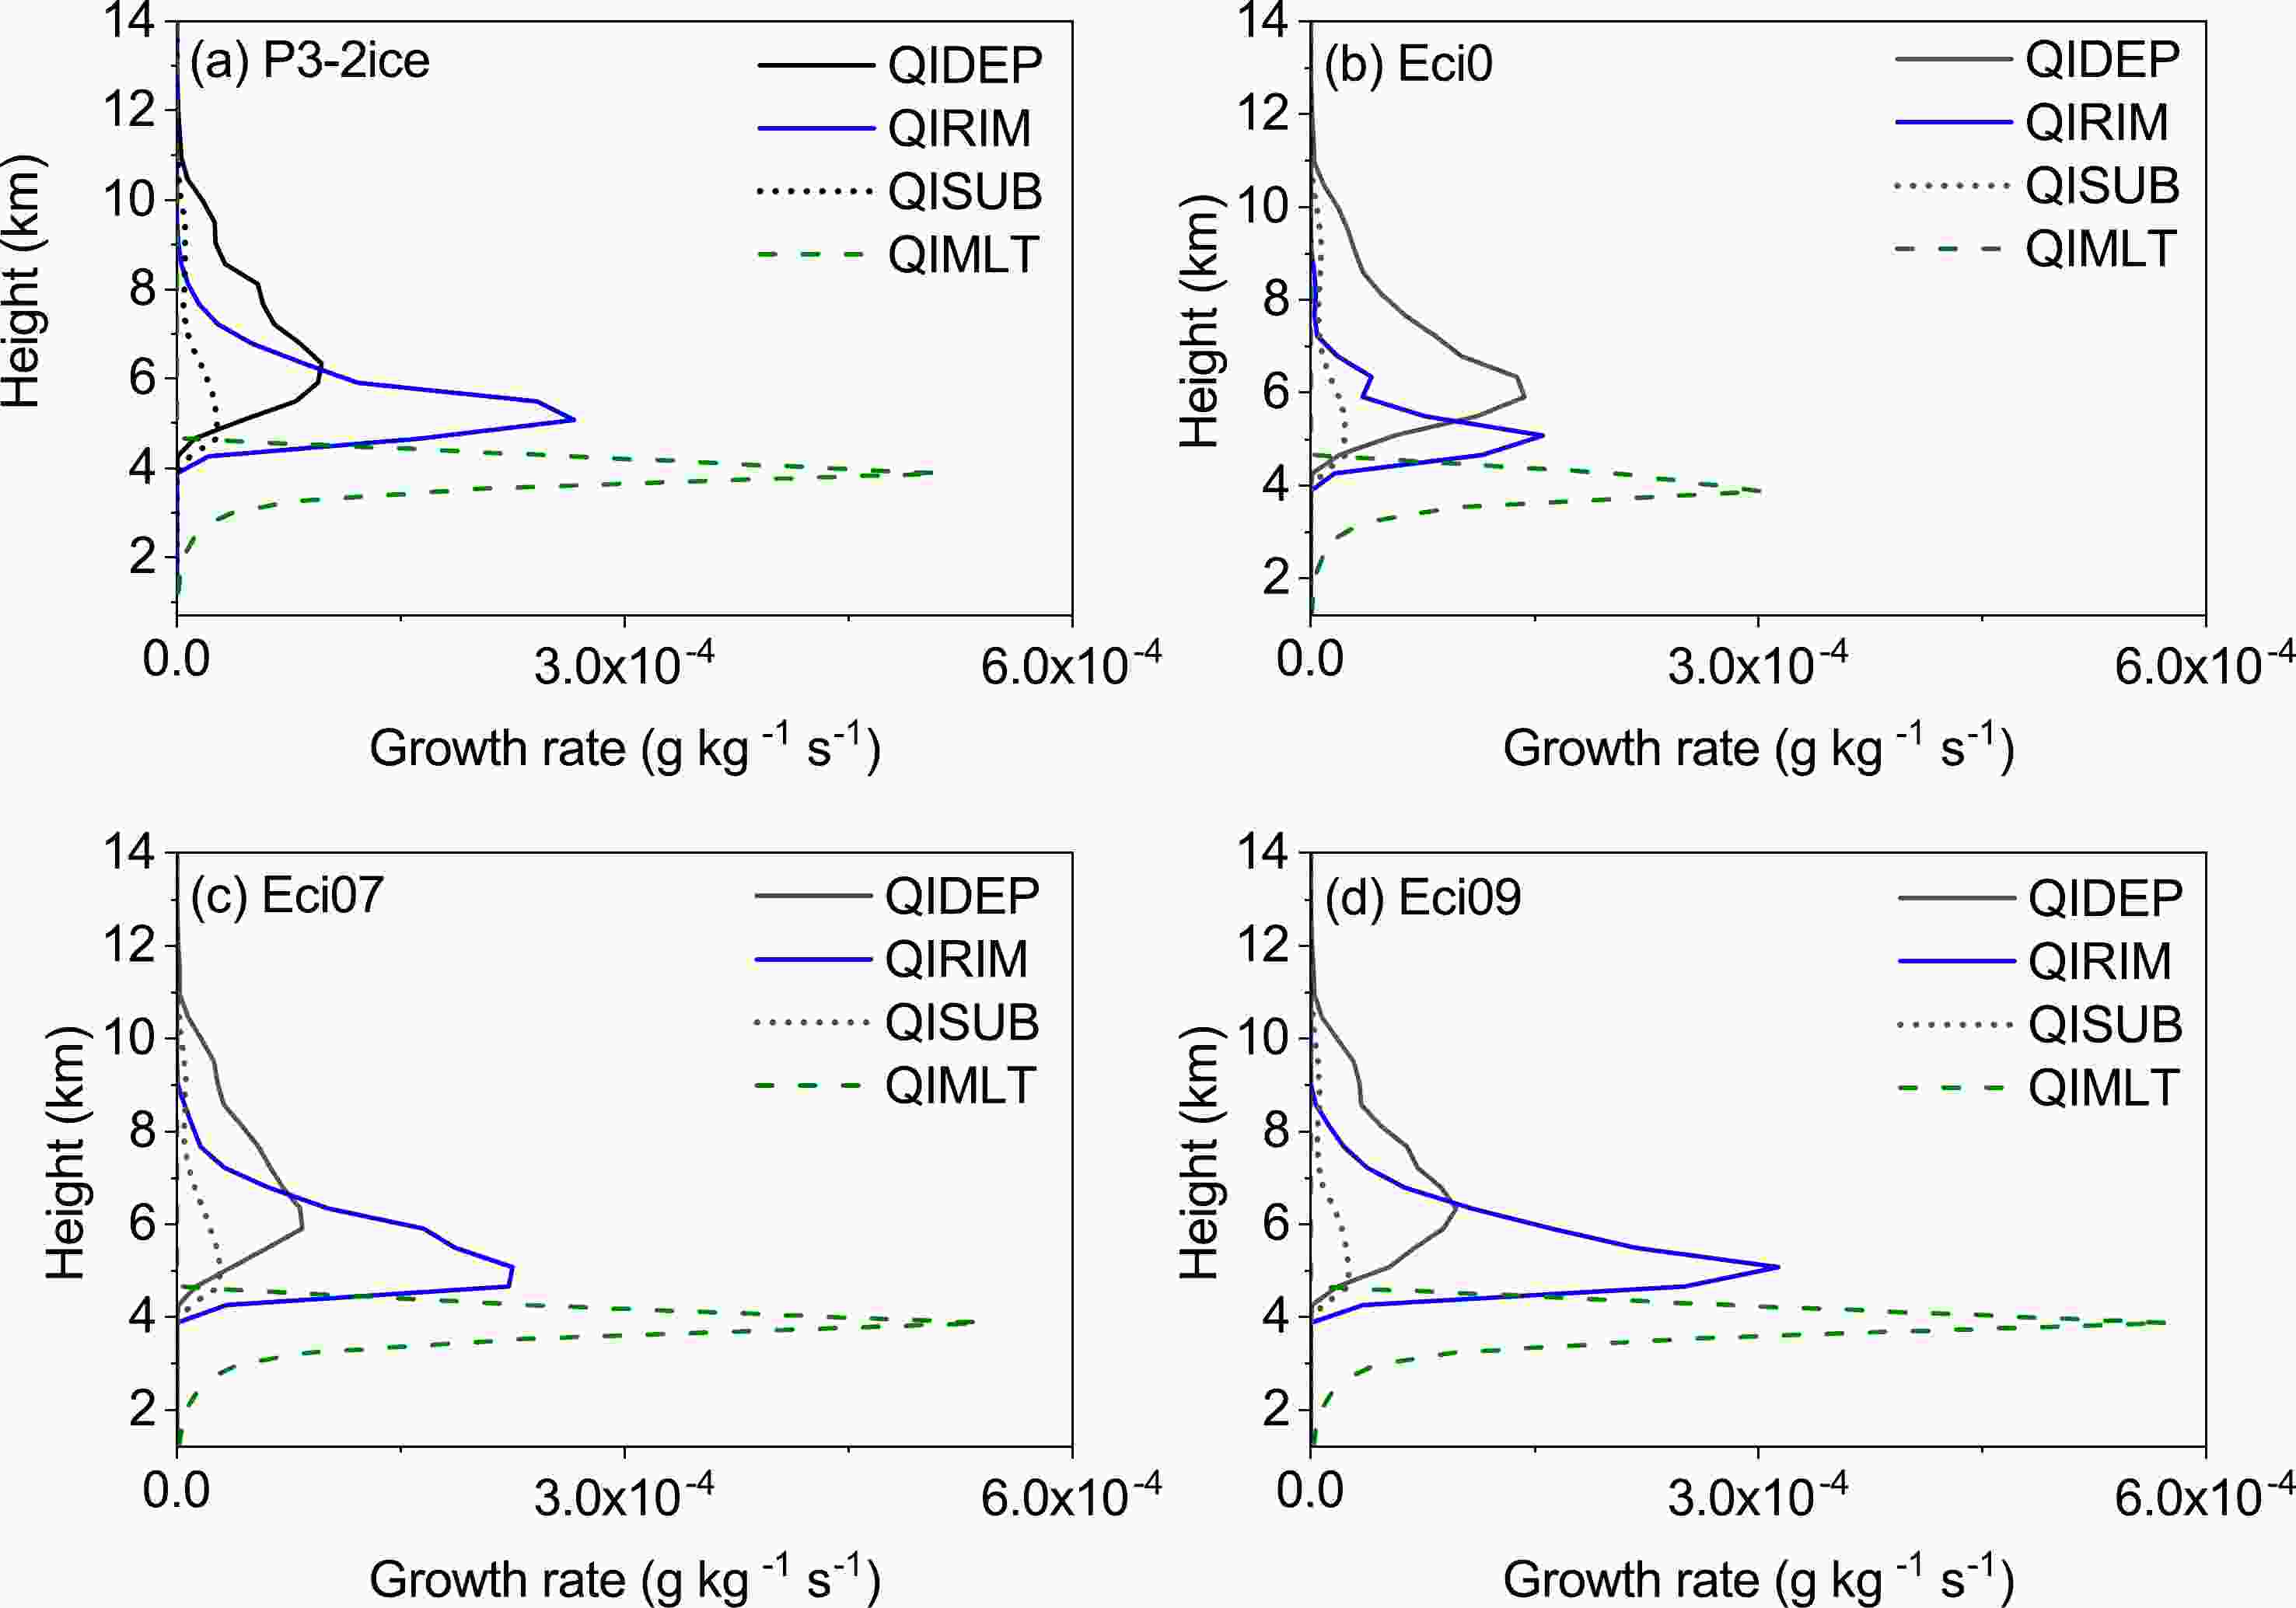
Figure 14. Vertical profiles of the domain-averaged dominant processes to ice production in (a) P3-2ice, (b) Eci0, (c) Eci07, and (d) Eci09 at 0500 UTC. The selected subdomain is shown in Fig. 13. QIDEP = ice deposition; QIRIM = riming of ice; QISUB = ice sublimation; QIMLT = melting of ice.
In the case of no collection between ice and cloud droplets (Fig. 14b), the peak riming rate decreased to 1.6 × 10⁻⁴ g kg–1 s–1, whereas the depositional growth rate increased to 1.4 × 10⁻⁴ g kg–1 s–1. The increase in vapor deposition was due to the competition for vapor between liquid and ice particles; in the case of lower riming rates, more cloud water evaporated, and deposition was more efficient. The combined responses of riming and deposition led to decreased melting rates of less than 3.1 × 10⁻⁴ g kg–1 s–1, corresponding to a slight decrease in total precipitation.
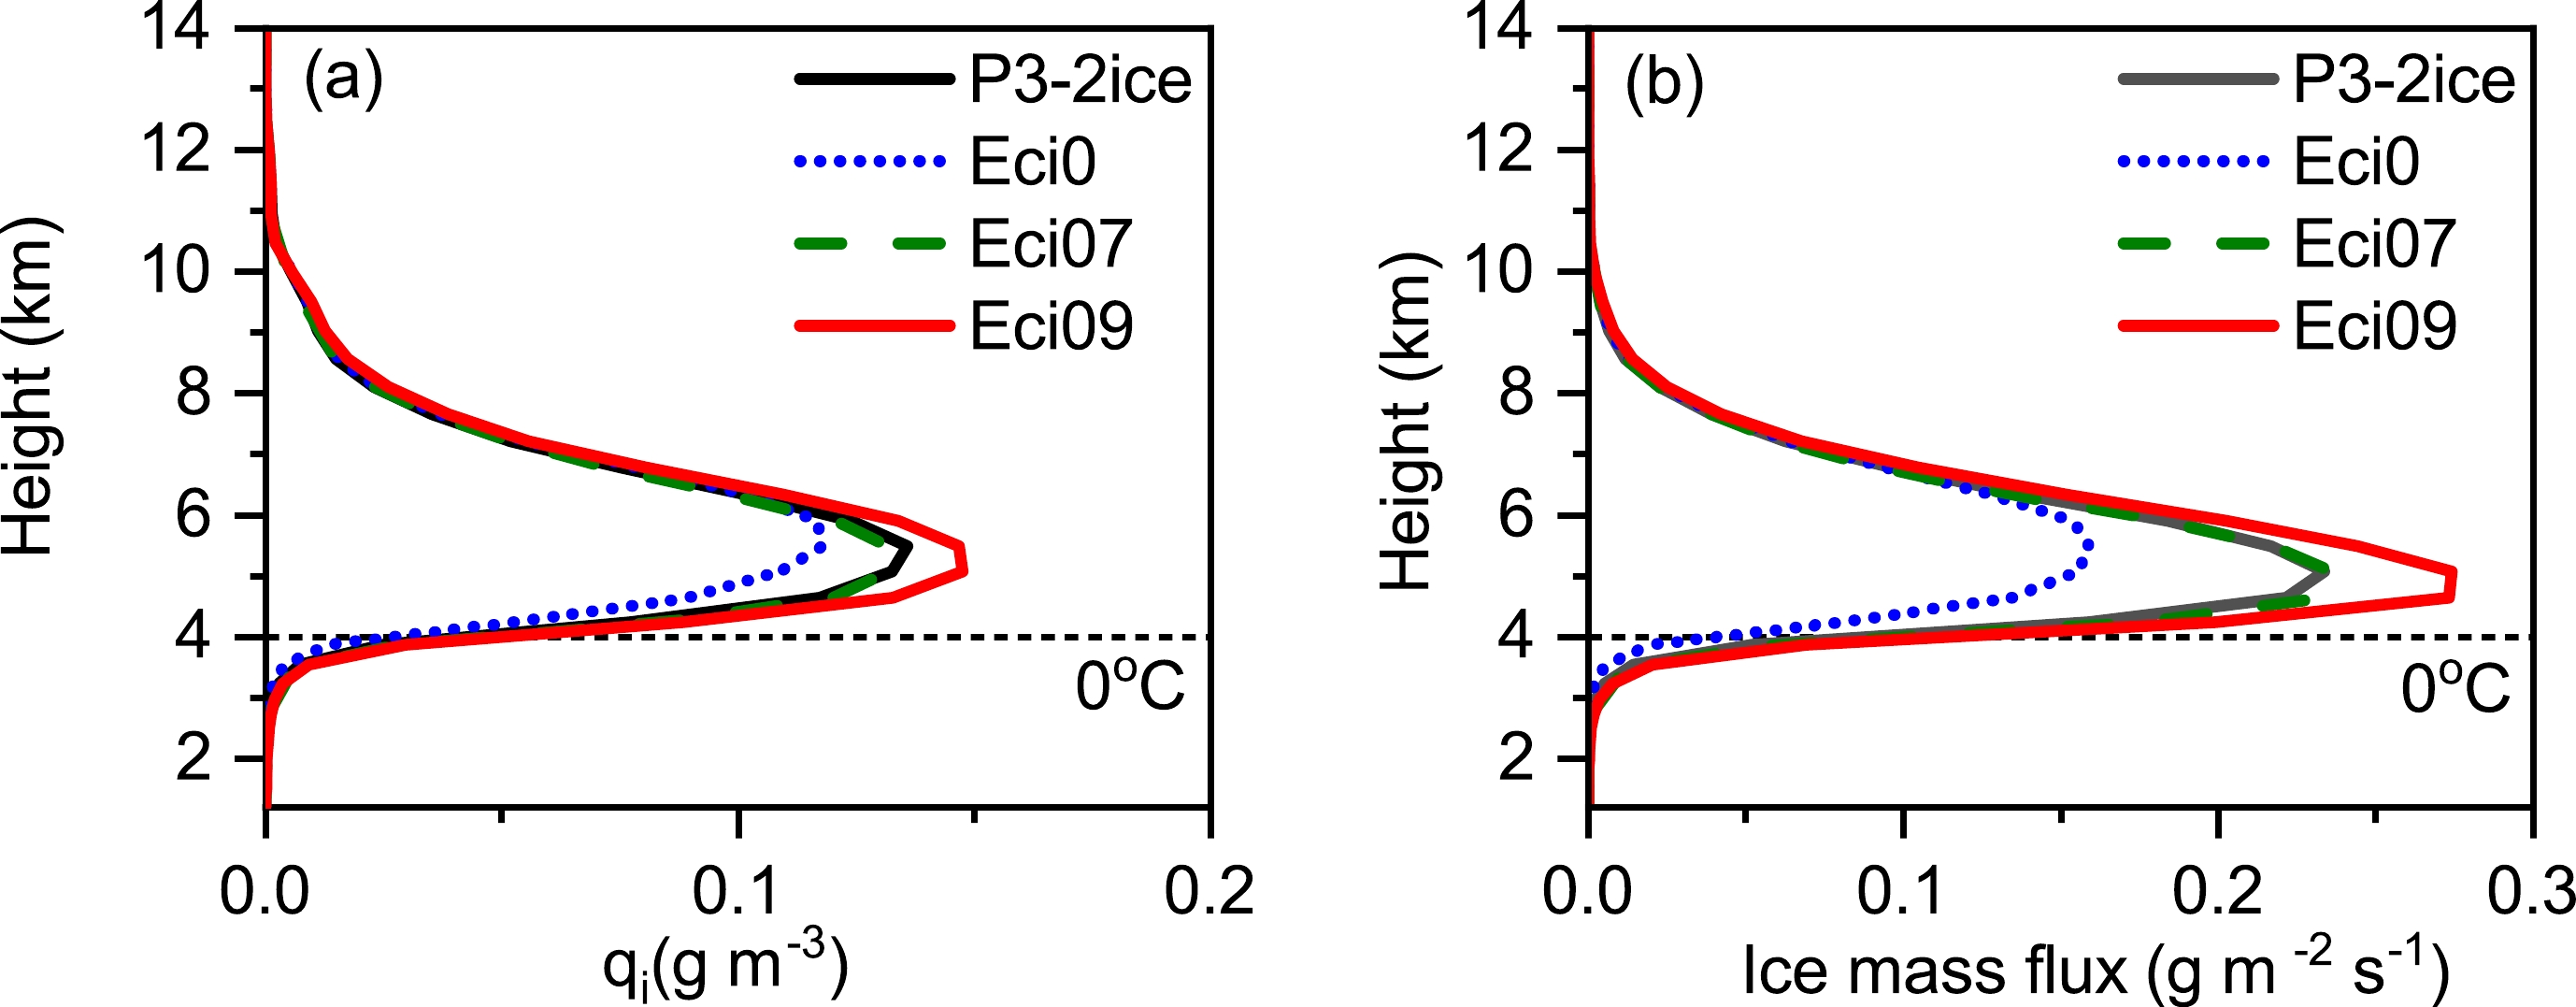
There were few differences in microphysical processes between P3-2ice and Eci07 (Fig. 14c) and, subsequently, very small changes were seen in the time evolution of precipitation, while differences between P3-2ice and Eci09 (Fig. 14d) became larger as the peak melting rate increased significantly to 5.7 × 10⁻⁴ g kg–1 s–1. The increased sensitivity of precipitation to collection efficiency of 0.9 was due to substantial increases in ice mass flux above the melting level (Fig. 15). Among the four simulations, Eci09 produced the largest total ice mass (Fig. 15a) and the fastest ice fall speeds, which resulted in the largest ice mass flux with a peak of 0.27 g m–2 s–1 above the melting level (Fig. 15b). Thus, more efficient ice melting into rain led to significantly increased local precipitation rates for short periods of time.

Figure 15. Vertical profiles of the domain-averaged (a) total ice and (b) total ice mass flux at 0500 UTC from the four simulations. The selected subdomain is shown in Fig. 13.
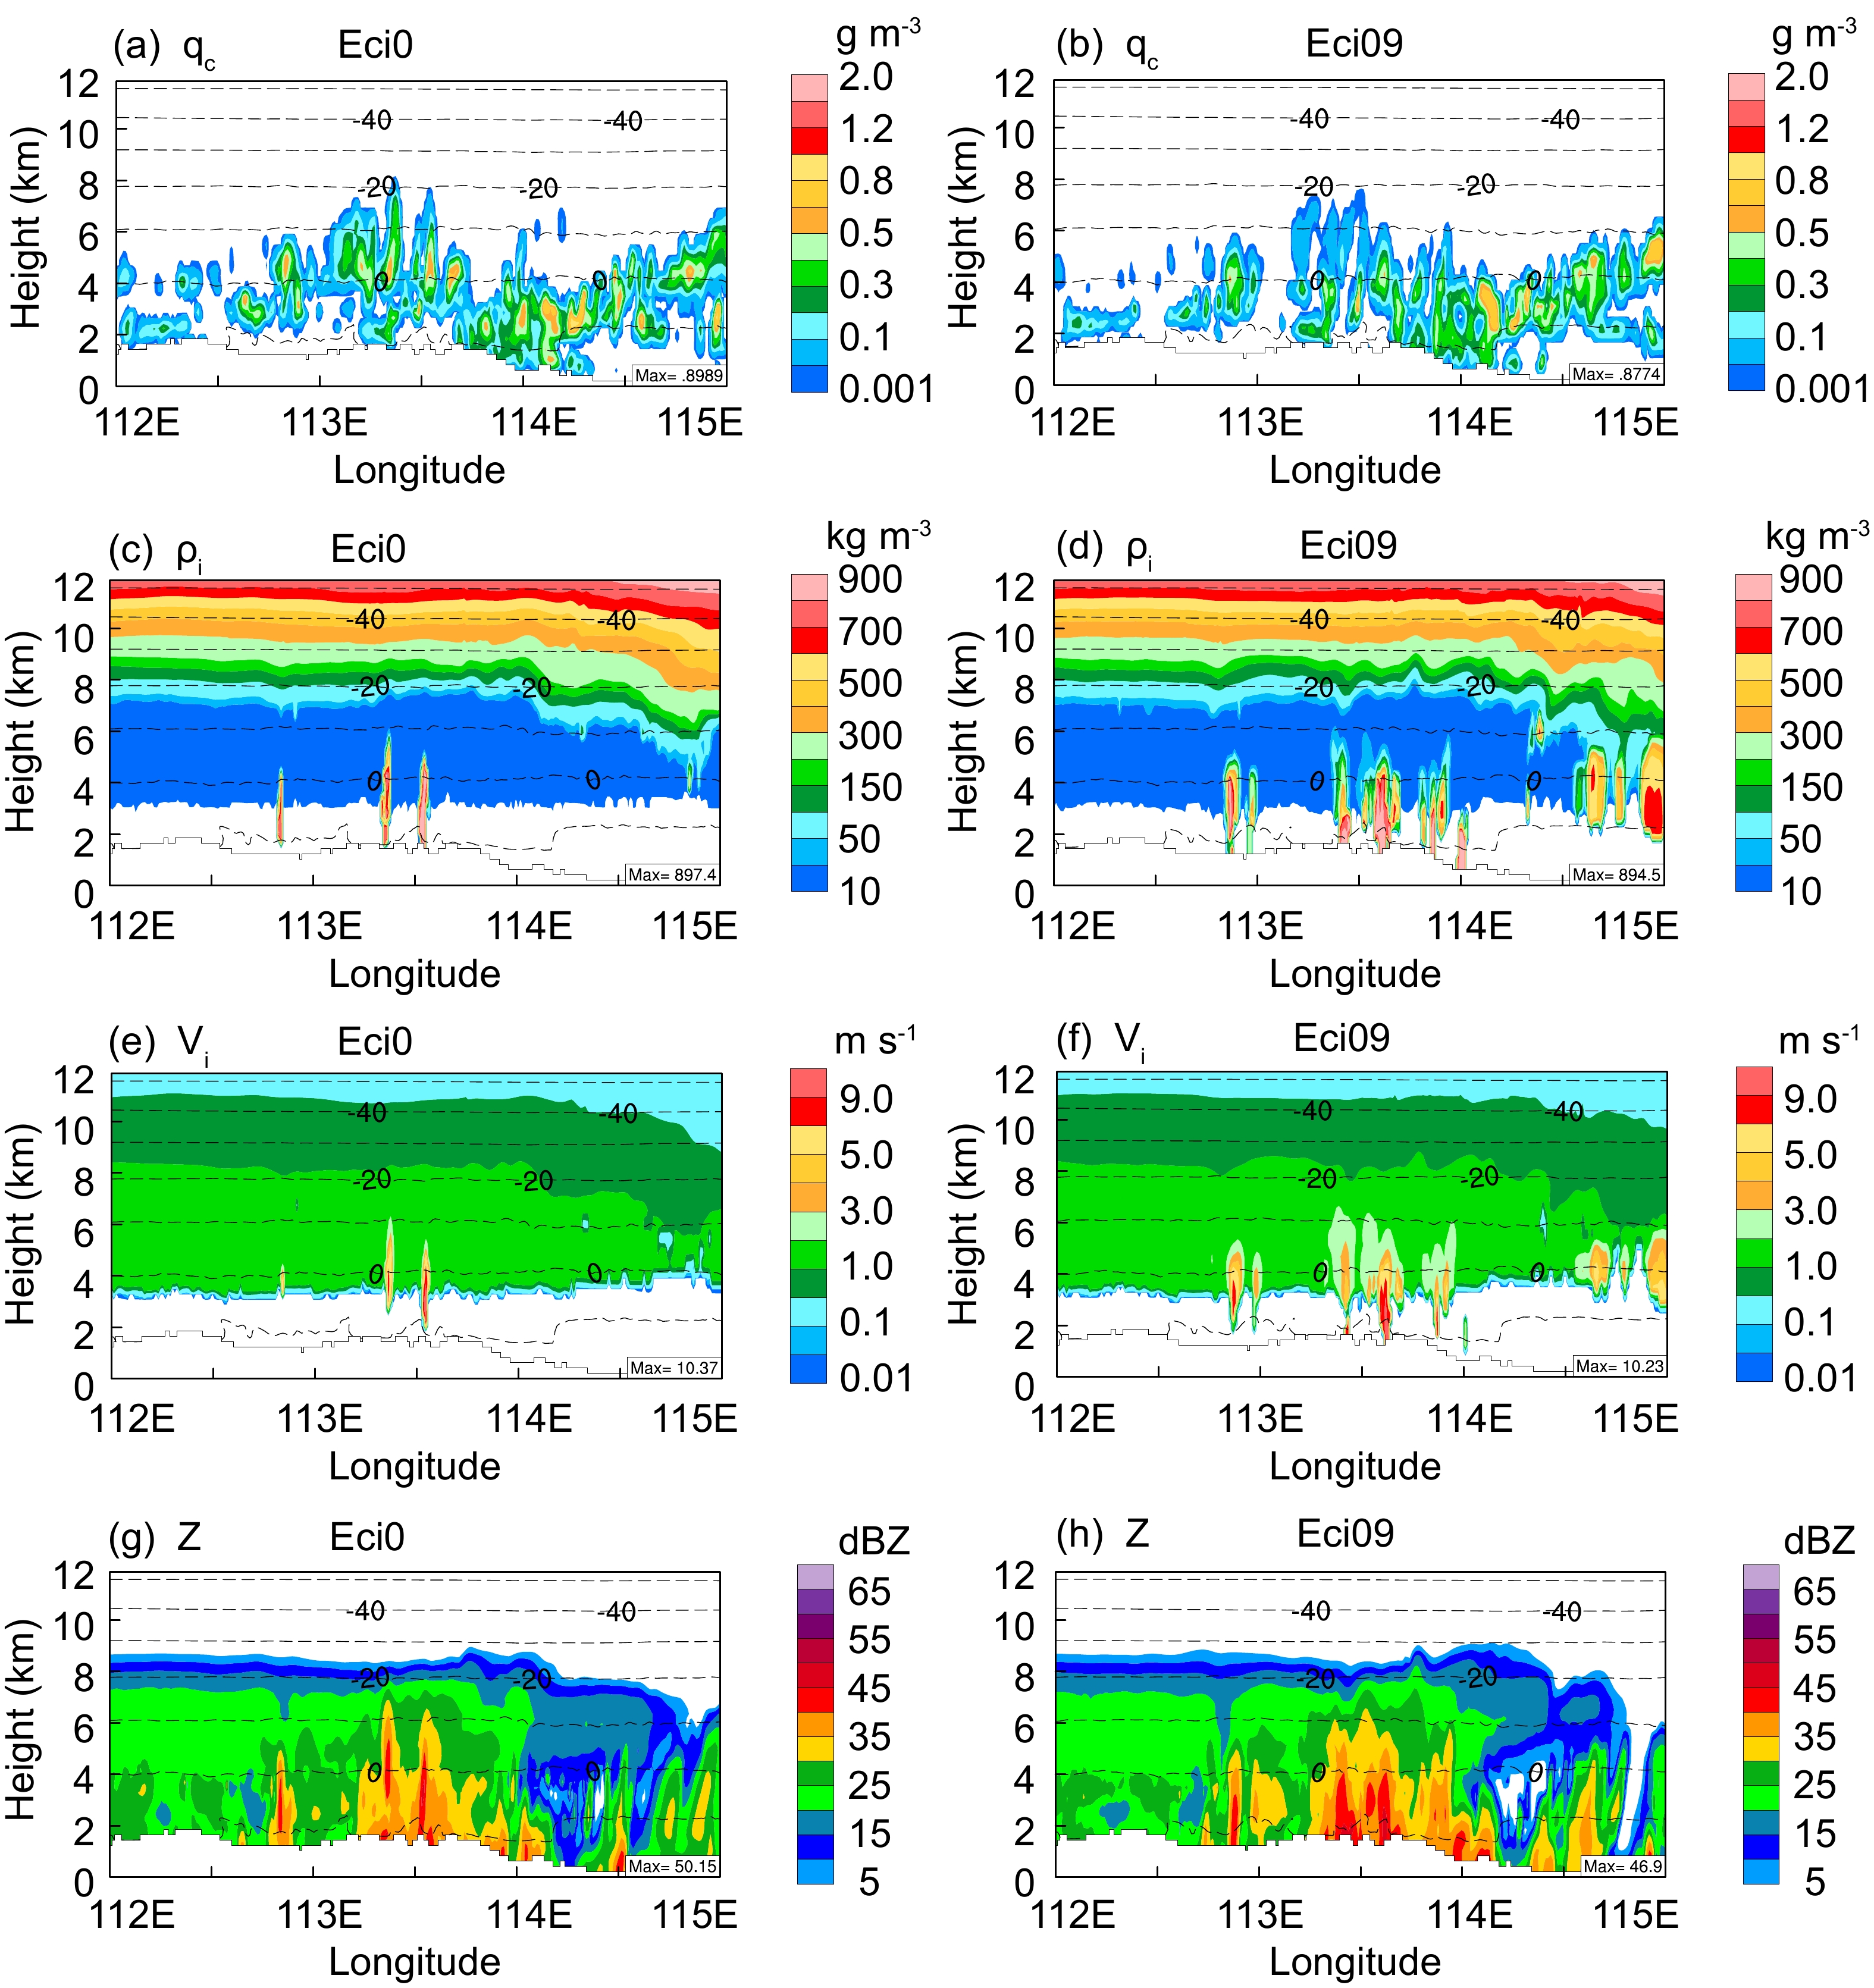
Among the sensitivity runs, the differences between Eci0 and Eci09 were the largest. Therefore, Fig. 16 shows the vertical cross-sections of cloud water, ice particle densities and fall speeds and composite reflectivity along 37°N at 0900 UTC on 22 May, as retrieved from Eci0 and Eci09. Cloud water in Eci0 (Fig. 16a) extended from the cloud base to approximately 8 km, with a peak of 0.9 g m–3 at 4 km. Compared to Eci0, Eci09 produced a lower cloud water content (Fig. 16b). The cloud water content at 113.5°E above the melting level decreased from 0.5 g m–3 in Eci0 to approximately 0.1 g m–3 in Eci09. The reduction in the cloud water mass was due to the efficient depletion of cloud droplets in the riming process. The differences in ice particle densities and fall speeds between the two runs were large. Without riming associated with ice–cloud droplet collisions in Eci0 (Figs. 6c and 16e), ice particles had relatively lower densities and fall speeds of mostly 1–2 m s–1 above the melting level. In comparison, with the increase in collection efficiency in Eci09, a large area of riming characterized by ice particle densities of more than 300 kg m–3 and fall speeds of more than 2 m s–1 above the melting level was produced at 113.5°E (Figs. 16d, f).

Figure 16. Vertical cross sections of cloud water (units: g m−3), mass-weighted mean ice particle densities (units: kg m−3), mass-weighted mean ice particle fall speeds (units: m s−1), and composite reflectivity (units: dBZ) along 37°N at 0900 UTC on 22 May from Eci0 (left) and Eci09 (right). The quasi-horizontal dashed lines are temperature contours. Ice particle densities and fall speeds are for ice in category one.
The changes in ice properties affected the retrieved reflectivity field in the embedded convective region. Compared with observations, Eci0 shifted the embedded convective region westward, whereas overdominance of riming in Eci09 produced a convective region that was too intense and too broad (Figs. 16g, h). Overall, the reflectivity field from P3-2ice was in better agreement with the observations. Hou et al. (2016) demonstrated that the presence or absence of riming significantly influenced the precipitation distribution in a mixed-phase stratiform cloud case; however, the precipitation distribution was not sensitive to riming for this specific case. Sensitivity experiments suggested riming was still important since it affected ice particle fall speeds and caused changes in reflectivity structure. Consideration of partial rimed ice was significant in reproducing the location of the embedded convective region.
-
The P3 bulk microphysics scheme represents ice-phase hydrometeors with a user-specified number of free ice-phase categories to allow for a smooth transition of particle properties. To evaluate the ability of the P3 scheme in the WRF model, we simulated a stratiform rainfall event that occurred in the northern China region on 22 May 2017. WRF simulations with two P3 versions, P3-nc and P3-2ice, were evaluated against rain gauge, radar, and aircraft observations. A series of sensitivity experiments were conducted with different collection efficiencies between ice and cloud droplets.
A comparison of the reflectivity structure and precipitation distribution suggested that the WRF model with P3 realistically simulated the overall evolution of the embedded convection and the primary precipitation area. However, both simulations with P3 in the two versions overpredicted precipitation amounts. P3-2ice produced slightly lower peak precipitation rates and smaller total precipitation amounts than P3-nc, which was closer to the observations. The increase in ice categories yielded a lower propagation speed of the cloud system, resulting in a more reasonable radar structure in stratiform regions with values between 20 and 30 dBZ.
Aircraft measurements suggested increasing dendritic aggregation from upper –16°C to lower –10°C in the embedded convective region, which contributed to broader particle size spectra than the surrounding regions. A comparison of ice concentrations with observations indicated that P3-nc underestimated aggregation, whereas P3-2ice produced more efficient aggregation from the self-collection of ice and ice-ice collisions between categories. Active aggregation in P3-2ice resulted in lower ice concentrations at heights between 4 and 6 km, which was closer to the observations.
Moderately to heavily rimed particles were also observed at temperatures warmer than –6°C in the embedded convective region. The model simulated riming intensity and fall speed variations generally agreed with the observations. The sensitivity experiments with different collection efficiencies between ice and cloud droplets suggested that riming had little impact on total precipitation and precipitation distribution for this specific case, but it could result in largely increased precipitation rates locally during the early stage of precipitation due to increased ice mass flux. The riming process alone could not address the problem of precipitation overprediction from the WRF model; however, it was important in reproducing the location and strength of the embedded convective region through its impact on ice particle fall speeds.
The inclusion of the rime mass fraction in the P3 scheme was important to study the riming process and its impact on the cloud microphysical structure. Microphysical processes such as ice multiplication and aggregation still need improvement in future studies. Additional aircraft measurements are required to further evaluate model performance to provide comprehensive and quantitative information on particle habits and growth modes.
Acknowledgements. The authors thank the anonymous reviewers for their constructive comments that helped strengthen the manuscript. This work was supported by the National Key R&D Program of China (2019YFC1510305) and the National Natural Science Foundation of China (Grant Nos. 41705119 and 41575131). Baojun CHEN also acknowledges support from the CMA Key Innovation Team (CMA2022ZD10). Qiujuan FENG was supported by the General Project of Natural Science Research in Shanxi Province (20210302123358) and the Key Projects of Shanxi Meteorological Bureau (SXKZDDW20217104). The airborne data were obtained from Hebei Provincial Weather Modification Centre.
Data availability. Airborne and radar data will be available on request. The ERA5 reanalysis data came from the European Centre for Medium-Range Weather Forecasts (ECMWF) and are available at
https://www.ecmwf.int/en/forecasts/datasets .
| No. | Time (UTC) | Altitude (km) | Temperature (°C) | Aircraft location |
| Spiral 1 | 08:08:31–08:23:40 | 7.26–2.1 | –16.5 to 10 | (36.8°N, 113.9°E) |
| Spiral 2 | 08:30:31–08:48:00 | 2.1–7.26 | 10.5 to –16.4 | (36.7°N, 114.0°E) |
| Note: time is denoted in hh:mm:ss. | ||||
 AAS Website
 AAS WeChat