


 DownLoad:


-
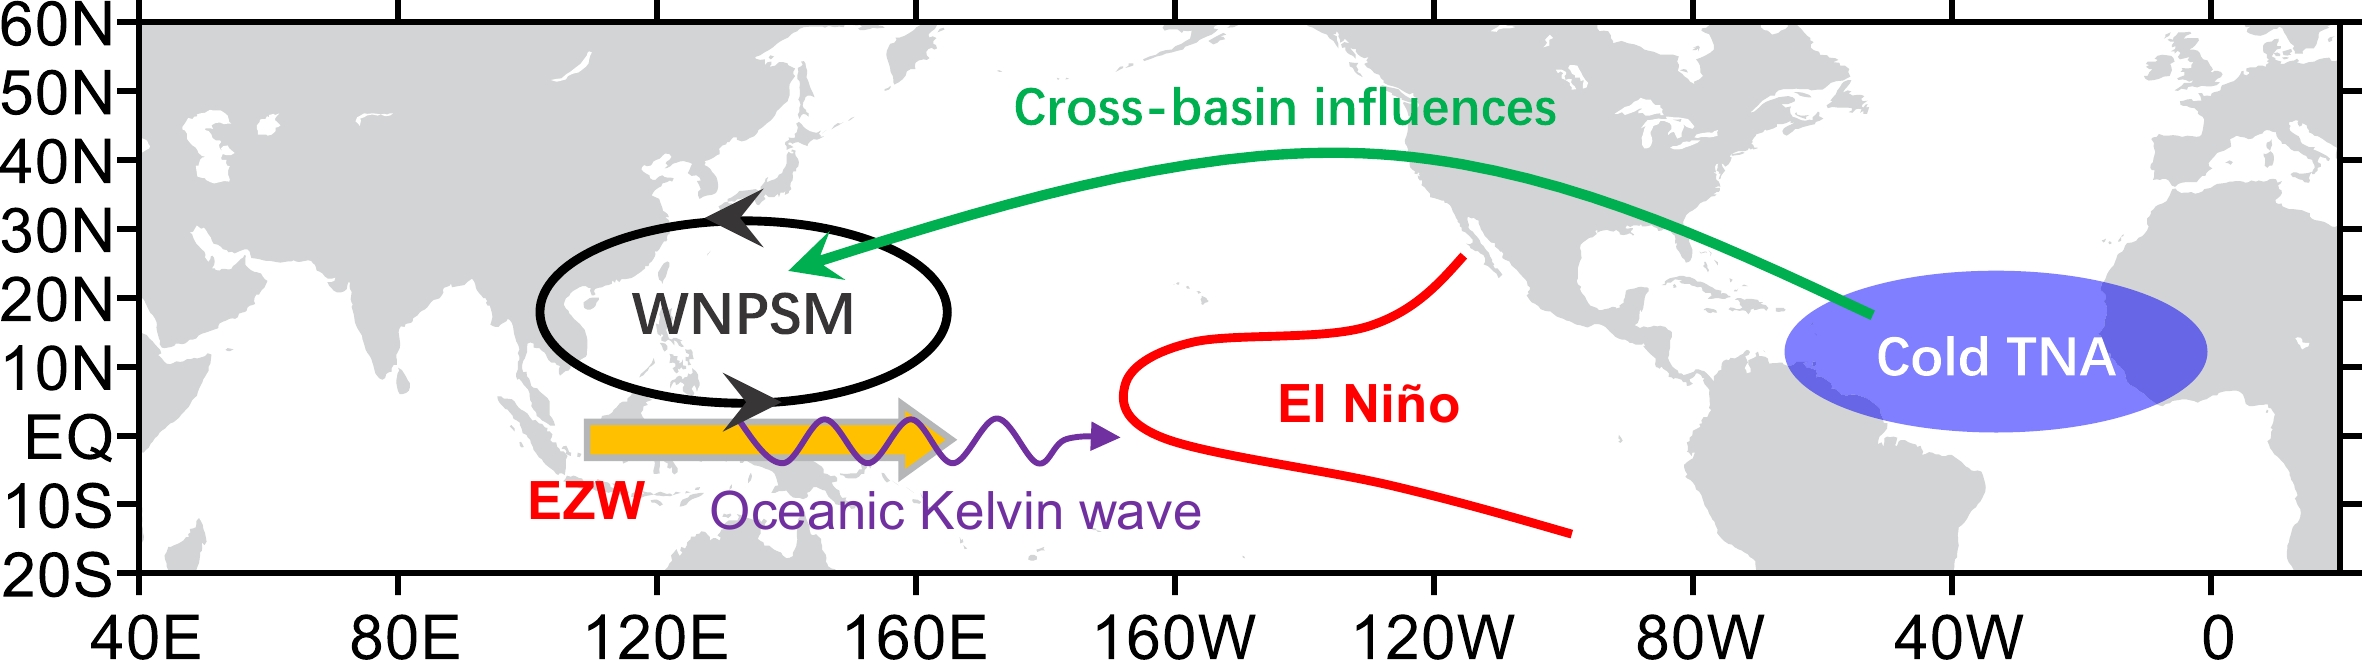
The western North Pacific summer monsoon (WNPSM) is an important subcomponent of the Asian summer monsoon (Wang et al., 2001; Li and Wang, 2005). The WNPSM has a distinct feature of an oceanic monsoon, which differs from that of continental monsoon for the other two monsoon subsystems in Asia, namely, the east Asian summer monsoon and the Indian summer monsoon. A strong (weak) WNPSM is characterized by low-level cyclonic (anticyclonic) circulation anomalies, low (high) sea surface pressure anomalies, and enhanced (suppressed) rainfall anomalies over the subtropical western North Pacific (Chou et al., 2003; Li and Wang, 2005). The interannual variation of the WNPSM is closely related to the El Niño-Southern Oscillation (ENSO), accompanied by the anomalies of the western North Pacific anticyclone and the western North Pacific subtropical high during El Niño (Li and Wang, 2005).
The interdecadal changes of the WNPSM around the early 1990s have attracted much attention (e.g., Kwon et al., 2005; Lee et al., 2014; Wang and Yu, 2018; Wu and Wang, 2019). Kwon et al. (2005) suggested that the relationship between the WNPSM and the east Asian summer monsoon exhibited a significant decadal change around 1993. Lee et al. (2014) revealed that the WNPSM-related variability has become dominant over the Asian monsoon region after 1993, likely related to the more frequent occurrence of the central Pacific (CP) type of ENSO. Wang and Yu (2018) found that the WNPSM has replaced the Indian summer monsoon as the active Northern Hemisphere monsoon center associated with the tropospheric biennial oscillation (TBO) after the early 1990s, which was suggested to be triggered by the stronger tropical Pacific–Atlantic coupling and the enhanced influences of the tropical Atlantic Ocean sea surface temperature (SST) anomalies on the WNPSM during recent decades. Wu and Wang (2019) showed that the correlation between the WNPSM index and summertime Niño-3.4 index has strikingly strengthened since the early 1990s, which was associated with interdecadal changes in ENSO-associated SST anomalies across the tropical oceans (including tropical Atlantic and Indian Ocean SST anomalies). In addition, the relationship between the WNPSM and tropical cyclone frequency over the western North Pacific during the boreal summer has also strengthened in recent decades (Zhao et al., 2019).
The equatorial zonal wind (EZW) in the lower troposphere over the western Pacific may play a critical role in the ENSO phase transition (Weisberg and Wang, 1997; Huang et al., 1998; Wang et al., 1999; Kim and Lau, 2001; Huang et al., 2001; Kug and Kang, 2006; Chen et al., 2018), by triggering equatorial oceanic Kelvin waves and consequent thermocline adjustments. The equatorial easterly (westerly) wind anomalies over the western Pacific may trigger upwelling (downwelling) oceanic Kelvin waves, contributing to the rapid termination of El Niño (La Niña) (Wang et al., 1999; Kim and Lau, 2001). The EZW over the western Pacific is suggested to be possibly associated with off-equatorial winds from the western North Pacific cyclonic/anticyclonic wind circulation anomalies (Wang et al., 1999) or the monsoonal winds (Kim and Lau, 2001). The possible linkage between the EZW over the western Pacific and the off-equatorial monsoonal winds associated with the WNPSM and its possible decadal changes deserve further detailed investigations, especially considering that the WNPSM has experienced a prominent interdecadal change since the early 1990s.
The quasi-biennial variability is one dominant frequency band for the interannual variability of the ENSO and Asian-Australian monsoons (Rasmusson et al., 1990; Meehl and Arblaster, 2002; Loschnigg et al., 2003). The WNPSM is known to be modulated by ENSO, with a weak (strong) WNPSM tending to occur during the summer of the El Niño decaying (developing) year (Chou et al., 2003). Therefore, the WNPSM could show a remarkable biennial tendency in association with the ENSO turnabout (Li and Wang, 2005), with a strengthened WNPSM in the El Niño developing phase during the previous boreal summer but a weakened WNPSM in the El Niño decaying phase during the following boreal summer. The biennial tendency is suggested to be a fundamental timescale involved in monsoon–ENSO interactions (Yasunari, 1990; Yasunari and Seki, 1992; Shen and Lau, 1995; Chung and Nigam, 1999; Kirtman and Shukla, 2000; Kim and Lau, 2001; Wu and Kirtman, 2003, 2004). Kim and Lau (2001) elucidated the dynamics of monsoon-induced biennial variability in ENSO with a strong coupling between ENSO and the monsoonal wind forcing over the western Pacific, indicating that strong boreal summer monsoonal winds over the western Pacific could trigger the oceanic Kelvin waves to initiate the ENSO phase transition in the subsequent boreal winter. In addition, the biennial variations tended to intensify greatly after the 1990s for ENSO (Wang et al., 2017), the western North Pacific subtropical high (Sui et al., 2007; Gan et al., 2022), and the WNPSM (Wang and Yu, 2018). The possible influence of decadal changes in the WNPSM–EZW relationship on the biennial tendency of the WNPSM–ENSO coupled system needs to be further clarified.
In this study, we examine the decadal changes in the relationship between the WNPSM and the western Pacific EZW, the results of which reveal a recent intensification of the WNPSM–EZW co-variability. Possible underlying physical mechanisms and climatic consequences of this observed unique phenomenon are also examined and discussed. The remainder of this paper is organized as follows. The data and methods used in this study are introduced in section 2. The recent decadal changes in the WNPSM–EZW relationship are presented in section 3. Section 4 illustrates possible reasons and underlying mechanisms for the observed recent intensification in the WNPSM–EZW relationship. Possible climatic consequences of a strengthening WNPSM–EZW co-variability during recent decades are discussed in section 5, including the changes in the feedback from the WNPSM on the subsequent ENSO evolution and the biennial tendency of the WNPSM–ENSO coupled system. The conclusions and discussion are given in section 6.
-
This study uses the monthly-mean atmospheric fields derived from the National Center for Environmental Prediction/National Center for Atmospheric Research (NCEP/NCAR) reanalysis product (Kalnay et al., 1996). The monthly-mean SST data employed in this analysis are acquired from the National Oceanic and Atmospheric Administration (NOAA) Extended Reconstructed SST dataset version 5 (ERSSTv5; Huang et al., 2017).
This study employs monthly outputs of historical simulations from 20 global coupled climate models that participated in the phase six of the Coupled Model Intercomparison Project (CMIP6). The observed natural (e.g., solar radiation and volcanic eruption) and anthropogenic (e.g., greenhouse gas, anthropogenic aerosols, and land utilization) are used to force the historical simulations for 1850–2014 (Eyring et al., 2016). Only the first ensemble member of the historical simulations is used in this analysis. Detailed descriptions of the models employed in this study are given in Table S1.
To document the temporal evolution of the WNPSM and the western Pacific EZW, both the WNPSM and EZW indexes are used in the analysis. The WNPSM index is defined, following Wang et al. (2001), as the difference in 850-hPa zonal wind anomalies between regions of (5°–15°N, 100°–130°E) and (20°–30°N, 110°–140°E) during boreal summer (June-July-August, JJA), to depict the intensity of the WNPSM. Another monsoon index, defined by Li and Zeng (2002) according to the dynamic normalized seasonality (DNS), is also used to confirm that the main conclusions of this study are not index-dependent results. According to Huang et al. (2001), the EZW index is defined as the 850-hPa zonal wind anomaly averaged over the equatorial western Pacific (5°S–5°N, 120°–160°E), to depict and quantify the intensity of the EZW in the lower troposphere over the western Pacific.
Several SST indices, which could depict and quantify the time evolution of the SST anomalies in some key regions, are also utilized to facilitate our analysis. The Niño-3.4 index, a proxy to represent the ENSO, is defined by the SST anomalies averaged over (5°S–5°N, 170°–120°W). Following Ham et al. (2013), the springtime tropical North Atlantic SST index is defined by the SST anomalies averaged over (0°–15°N, 80°W–20°E). According to Xie et al. (2016), the north Indian Ocean SST index, to depict the intensity of the tropical North Indian Ocean warming or cooling, is defined by the SST anomalies averaged over (5°–25°N, 40°–100°E). According to Chen et al. (2019), The maritime continent SST index is defined by the SST anomalies averaged over (20°S–10°N, 110°–150°E). The subtropical central Pacific SST index, following Xie et al. (2016), is defined by the SST anomalies averaged over (10°–20°N, 150°–170°E). The summertime tropical Atlantic SST index, following Jin and Huo (2018), is defined as the SST anomalies averaged over (20°S–20°N, 80°W–10°E). The Atlantic multidecadal oscillation (AMO) index is obtained at
https://psl.noaa.gov/gcos_wgsp/Timeseries/AMO/ . The Pacific decadal oscillation (PDO) index is obtained athttps://psl.noaa.gov/gcos_wgsp/Timeseries/PDO/ .The equatorial oceanic Kelvin wave forcing function (KWF) is calculated in this study to characterize and compare the dynamic responses of tropical ocean to the different wind stress anomalies before and after the late 1980s/early 1990s, according to previous studies (Battisti, 1988; Vimont et al., 2003; Chen et al., 2020b). Following these previous studies, the equatorial oceanic KWF is defined as follows:
Here, x and y represent longitude and latitude, λ denotes the time lag,
$ {\tau _x}(x,y,\lambda ) $ denotes surface zonal wind stress anomalies at a lag time λ, and$ {\psi _0}(y) $ represents the meridional equatorial Kelvin wave structure obtained by solving the dynamic equation of the upper layer ocean in the equatorial$ \beta $ plane (Gill, 1980; Battisti, 1988; Vimont et al., 2003). The amplitudes of the eastward propagating equatorial Kelvin waves tend to decay exponentially away from the equator, allowing these waves to exist and be trapped in a region near the equator. When the KWF value is positive (negative), it means that the forcing from surface zonal wind stress anomalies may trigger downwelling (upwelling) oceanic equatorial Kelvin waves, further prompting warm (cold) SST anomalies (Battisti, 1988; Vimont et al., 2003; Chen et al., 2020b).To obtain the signal of the time series on the interannual time scale, we remove the long-term trend and the interdecadal signals from the original time series. A 9-yr high-pass filter is applied to the anomalies, which are obtained by subtracting the long-term trend and mean seasonal cycle from the original time series, to obtain the signal of interannual variability. The effective degrees of freedom are estimated according to Metz (1991). A two-tailed Student's t-test determines the statistical significance levels of correlation and regression analyses.
-
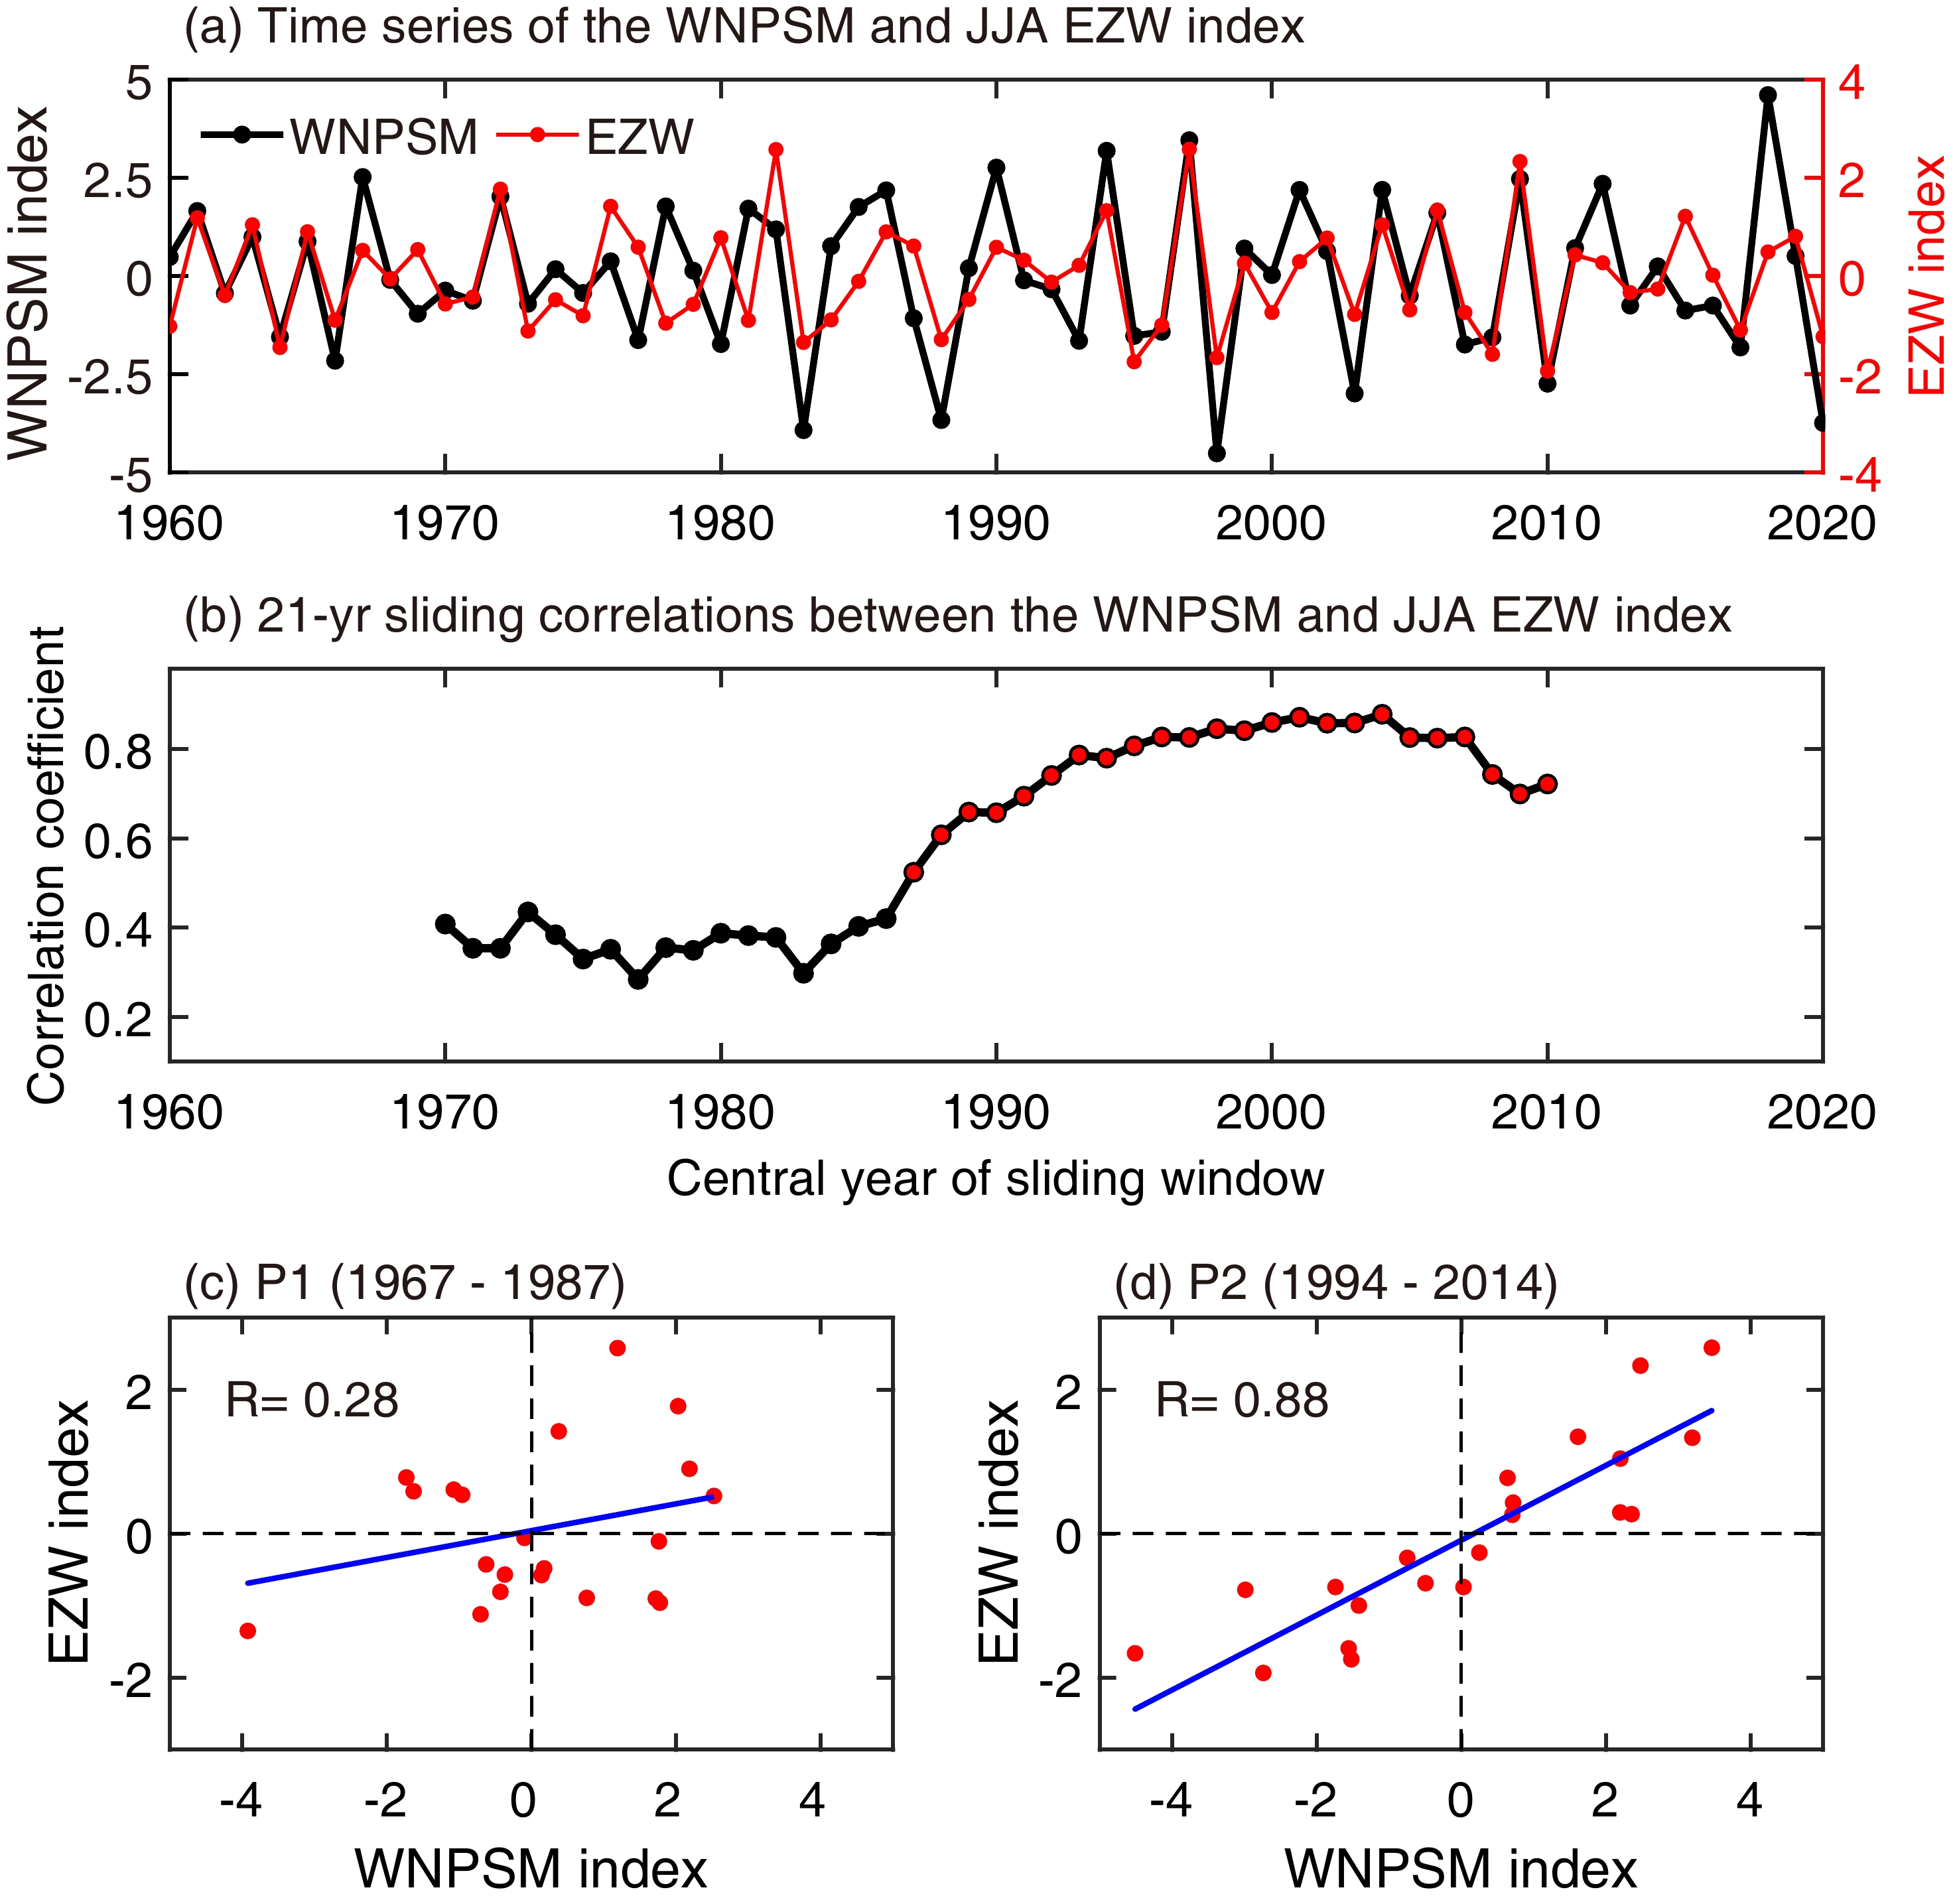
To elucidate possible decadal changes in the relationship between the WNPSM and the western Pacific EZW, we initially performed a 21-yr sliding correlation analysis between the WNPSM index according to Wang et al. (2001) and the EZW index spanning 1960–2020 (Fig. 1). The results reveal that the correlation coefficients of these two indexes have undergone a remarkable decadal shift around the late 1980s/early 1990s (Fig. 1b). We also tested the results using the original time series without removing the trend and very similar results could be obtained, indicating that the conclusions of this study are independent of the trend. Very similar results could also be obtained using the monsoon index from Li and Zeng (2002), which indicates that the main conclusions of our study do not rely on the definition of the WNPSM index. Before the late 1980s, the correlation coefficients between the two indexes were small and insignificant. In comparison, after the late 1980s/early 1990s, the correlation coefficients increased substantially, providing a boost to their statistical significance (Fig. 1b). The significant positive correlation coefficient indicates that a stronger (weaker) WNPSM could be accompanied by significant equatorial westerly (easterly) wind anomalies over the western Pacific at the same time after the early 1990s, with the obvious synchronization and co-variability of the WNPSM and the western Pacific EZW. However, before the late 1980s/early 1990s, the WNPSM–EZW linkage was relatively weak and poorly synchronized.
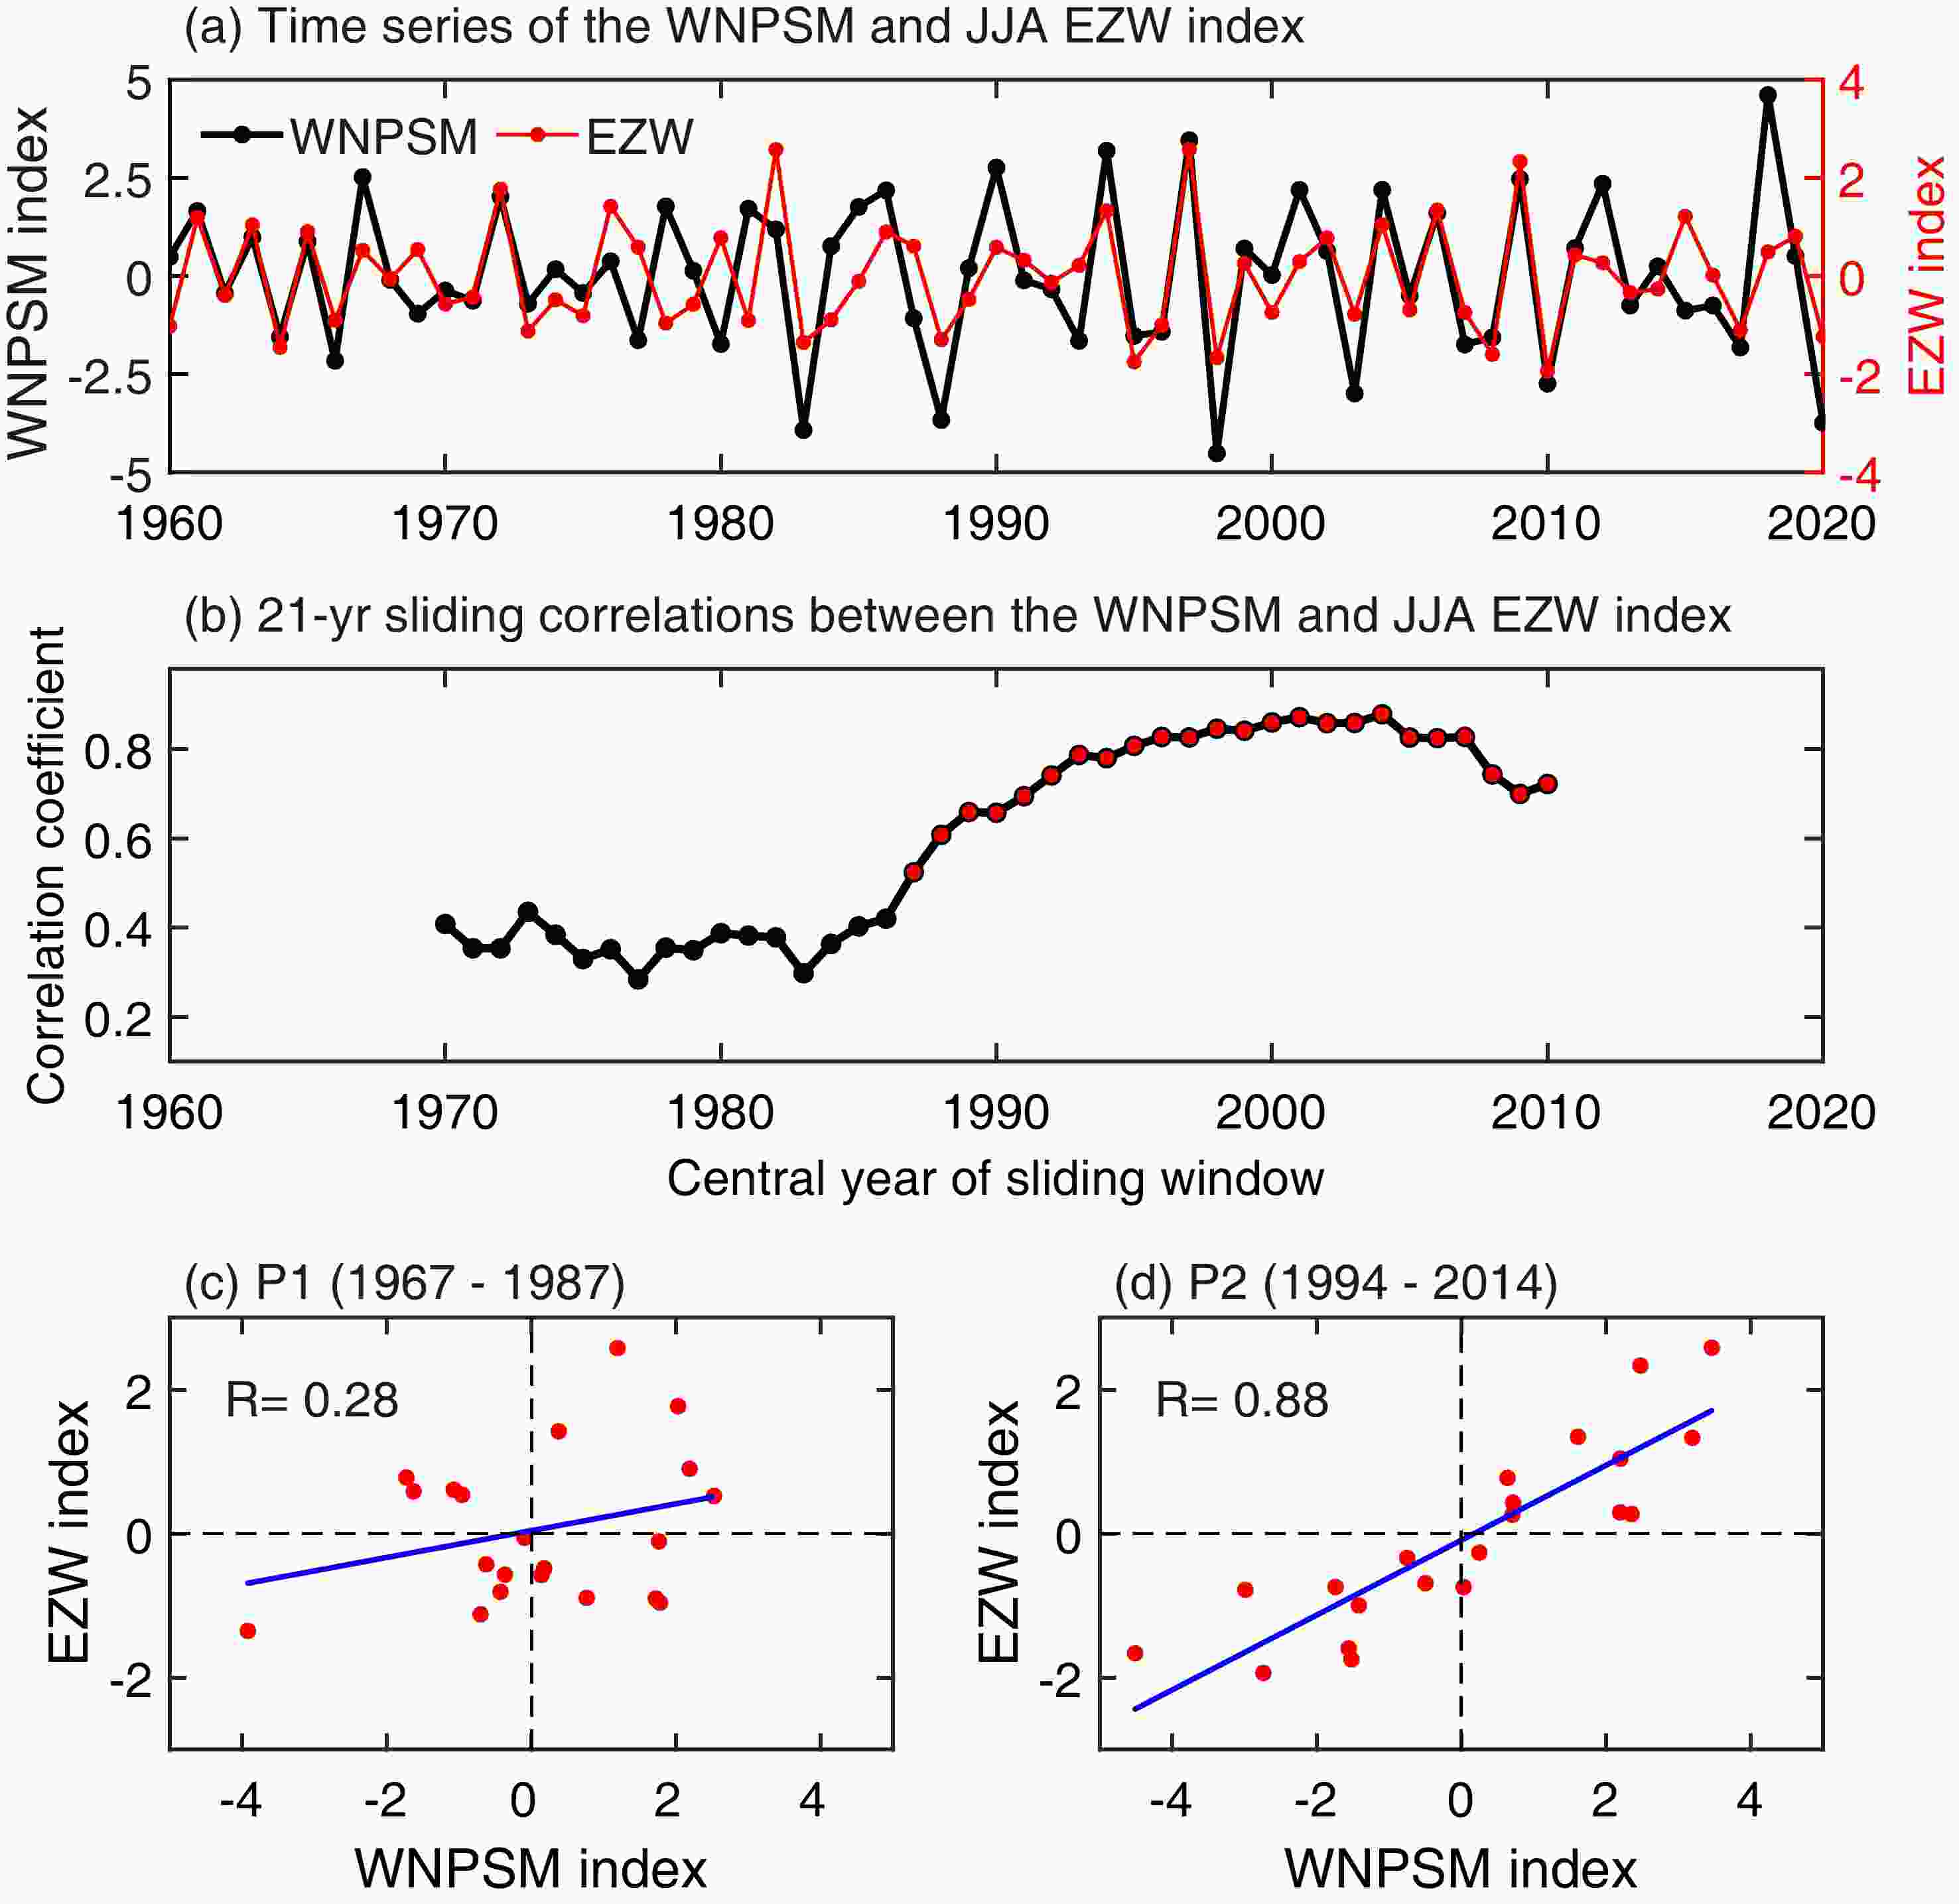
Figure 1. (a) Time series of the WNPSM index and the western Pacific EZW index during the boreal summer (JJA) on the interannual timescale during 1960–2020. (b) Twenty-one-year sliding correlation coefficients between the WNPSM index and the western Pacific EZW index. The red dots in (b) indicate that the correlation is significant at the 95% confidence level. Scatterplots of the WNPSM index versus the JJA western Pacific EZW index for years during (c) P1 (1967–87) and (d) P2 (1994–2014).
Next, we selected the former and latter periods for comparative analysis according to the period with the maximum and minimum 21-year sliding correlations. According to Fig. 1b, the smallest (largest) correlation coefficient appeared in 1977 (2004). Thus, two periods were selected in this study: P1 (1967–87, centered in 1977) and P2 (1994–2014, centered in 2004), to represent the period before and after the late 1980s/early 1990s, respectively. We further compared the differences between the two periods of P1 and P2. Scatterplots (Figs. 1c, d) support a closer connection between the WNPSM index and the JJA EZW index during the latter period. During P2, the WNPSM–EZW relationship was strong, with a correlation coefficient as high as 0.88 (Fig. 1d). In contrast, these two indexes were not closely related during P1, with a much weaker correlation coefficient of 0.28 (Fig. 1c).
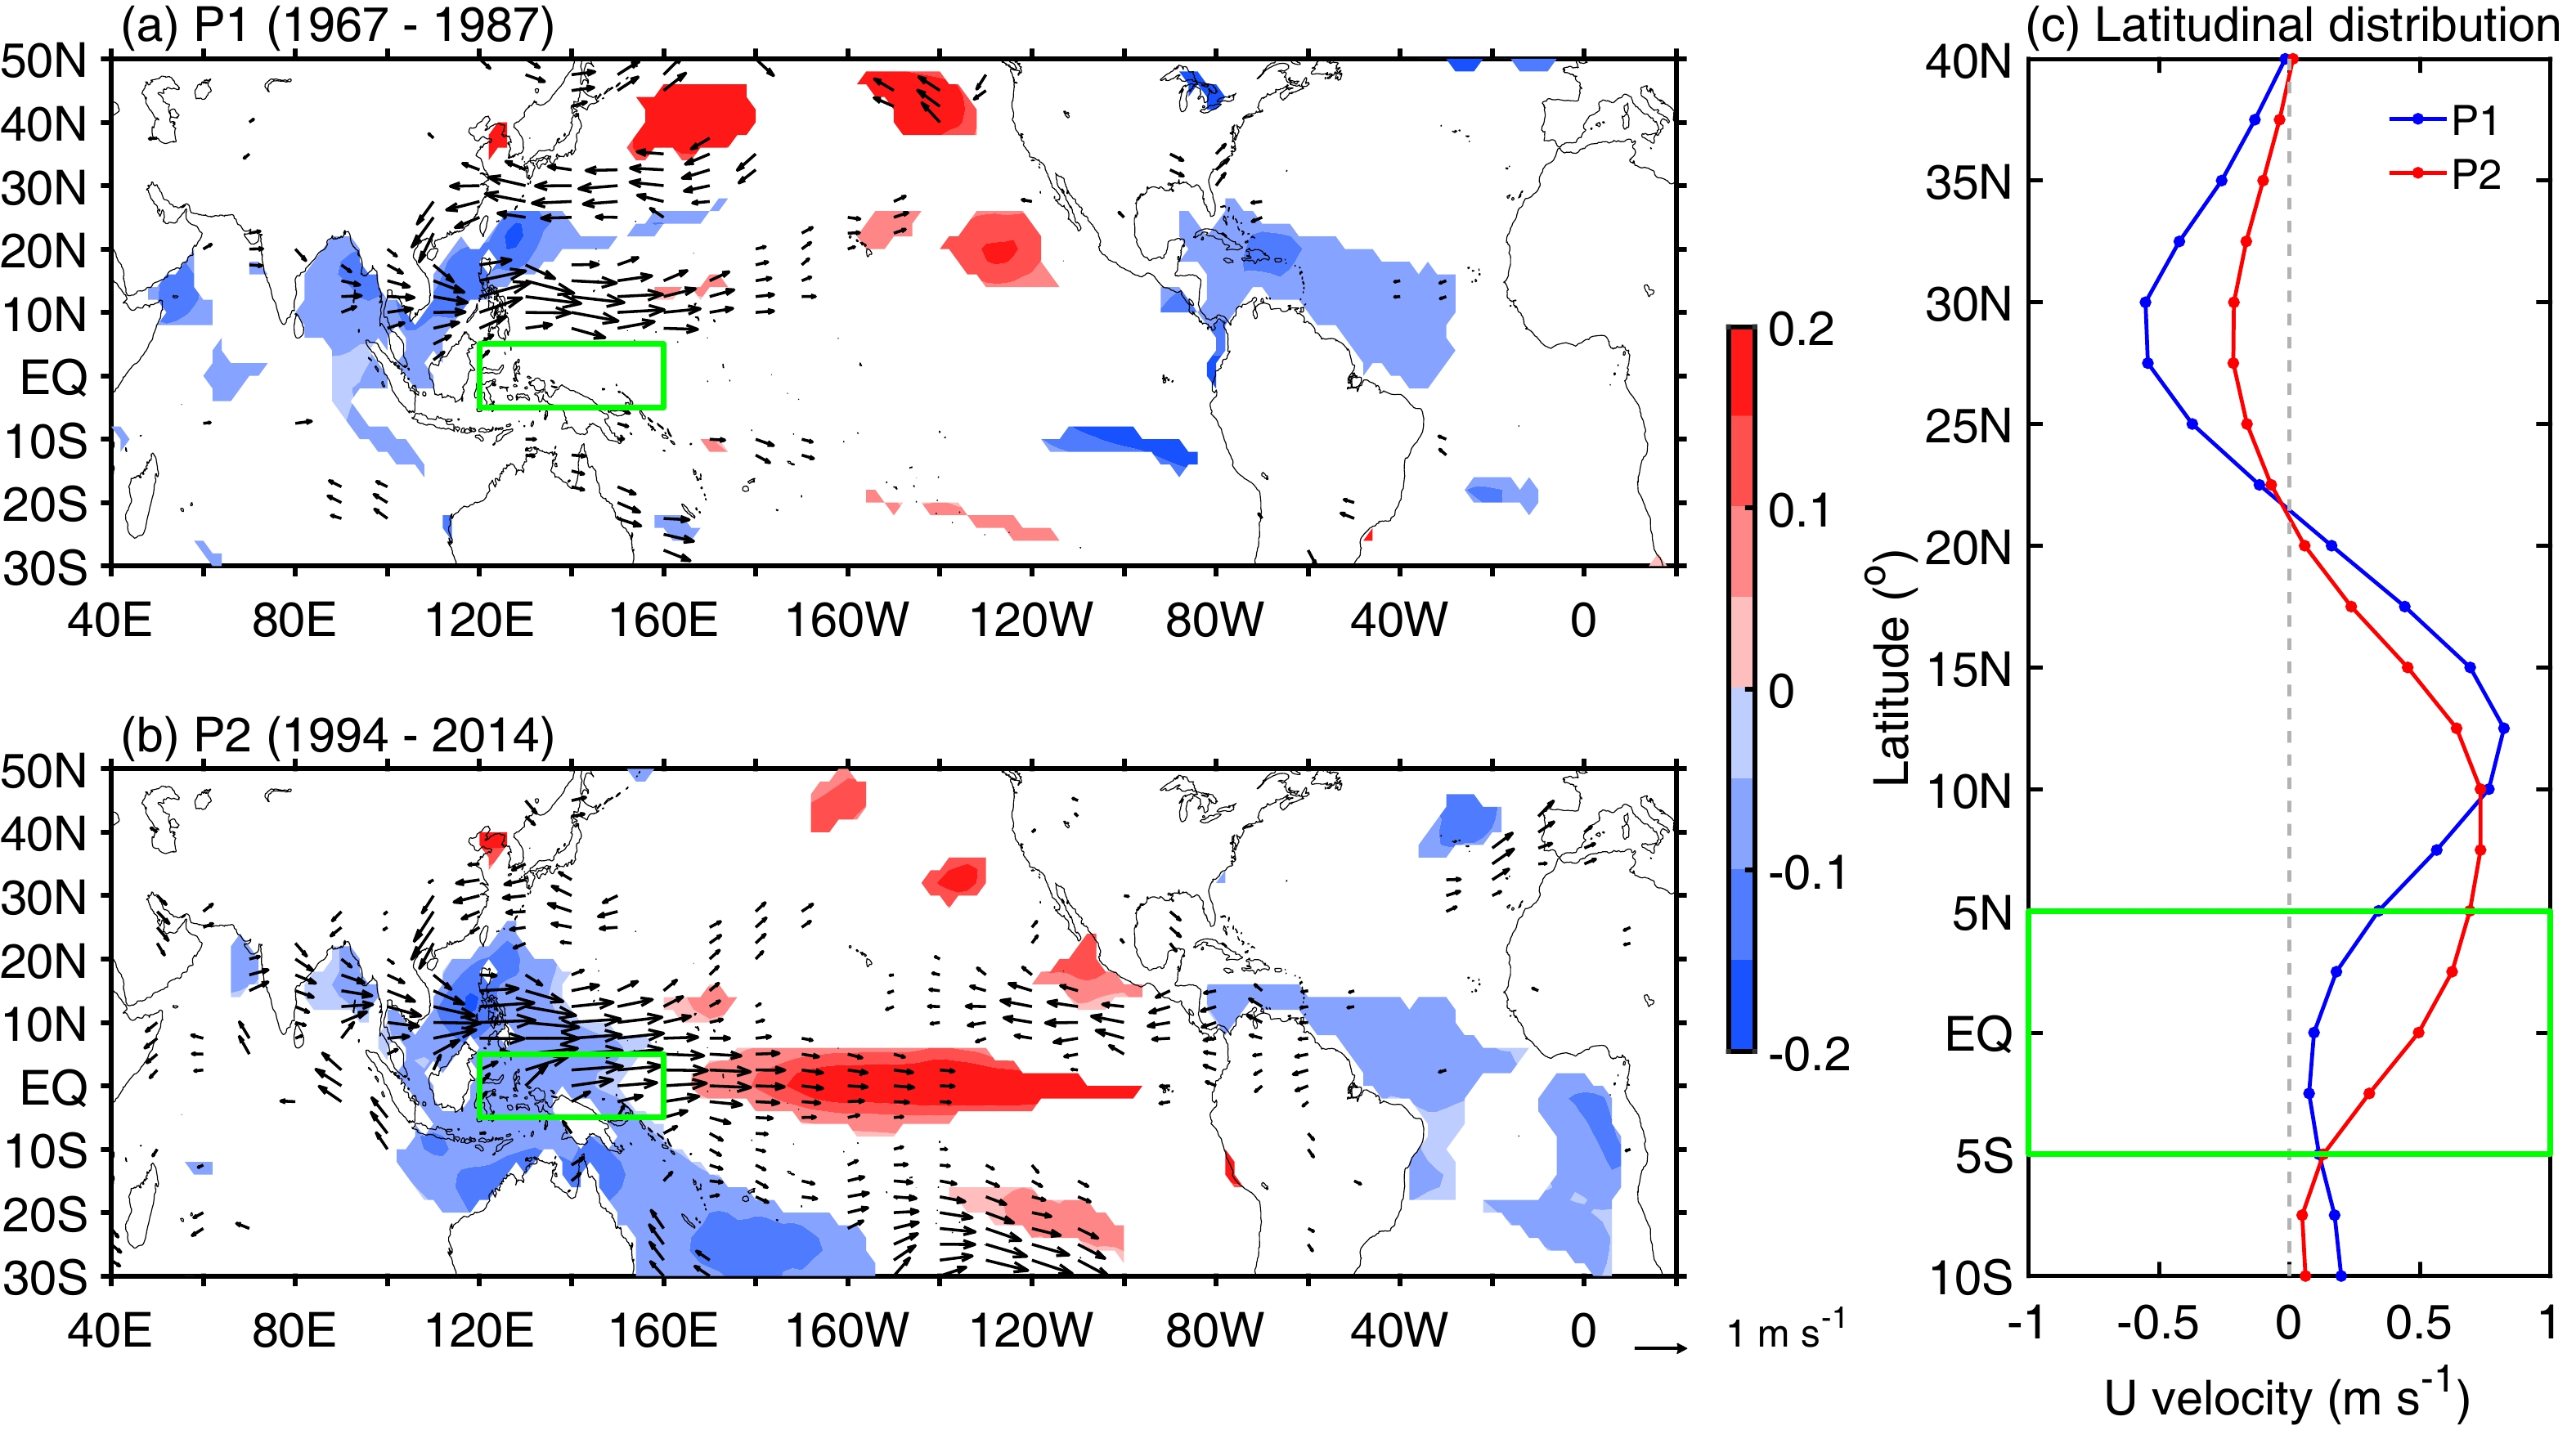
There were also significant differences in the spatial distribution of the 850-hPa wind anomalies associated with the WNPSM between two periods (Fig. 2). During both P1 and P2, cyclonic circulation anomalies could be observed over the subtropical and tropical western Pacific associated with the WNPSM, with obvious westerlies (easterlies) between 5°–15°N (20°–30°N) (Figs. 2a, b). However, the wind anomalies in the equatorial region over the western Pacific were very different in these two periods. During P1, no significant wind anomalies were identified in the equatorial region of the western Pacific (Fig. 2a). In contrast, strong westerly wind anomalies prevailed in the western Pacific equatorial region during P2 (Fig. 2b). These observed changes in the north-south spatial distribution of 850-hPa wind anomalies were consistent with correlation changes between the WNPSM index and the EZW index, which were significantly positively correlated during P2 (Fig. 1d), but not significantly correlated during P1 (Fig. 1c). The latitudinal distribution of regressed 850-hPa zonal wind anomalies further highlight the contrast in the north-south distribution of the 850-hPa wind anomalies associated with the WNPSM between P1 and P2 (Fig. 2c). During P2, larger positive zonal wind anomalies were evident in the equatorial region between 5°S–5°N. However, during P1, the zonal wind anomalies in the equatorial region were substantially weaker. In addition, the zonal wind anomalies during P2 tended to be shifted southward and expanded towards the equator (Fig. 2c), compared with those during P1. During P1, the maximum positive zonal wind anomalies occurred near the latitude of 12.5°N. In contrast, during P2, the maximum positive zonal wind anomalies shifted southward to the latitude of 7.5°N, accompanied by stronger positive zonal wind anomalies in the equatorial region (Fig. 2c).
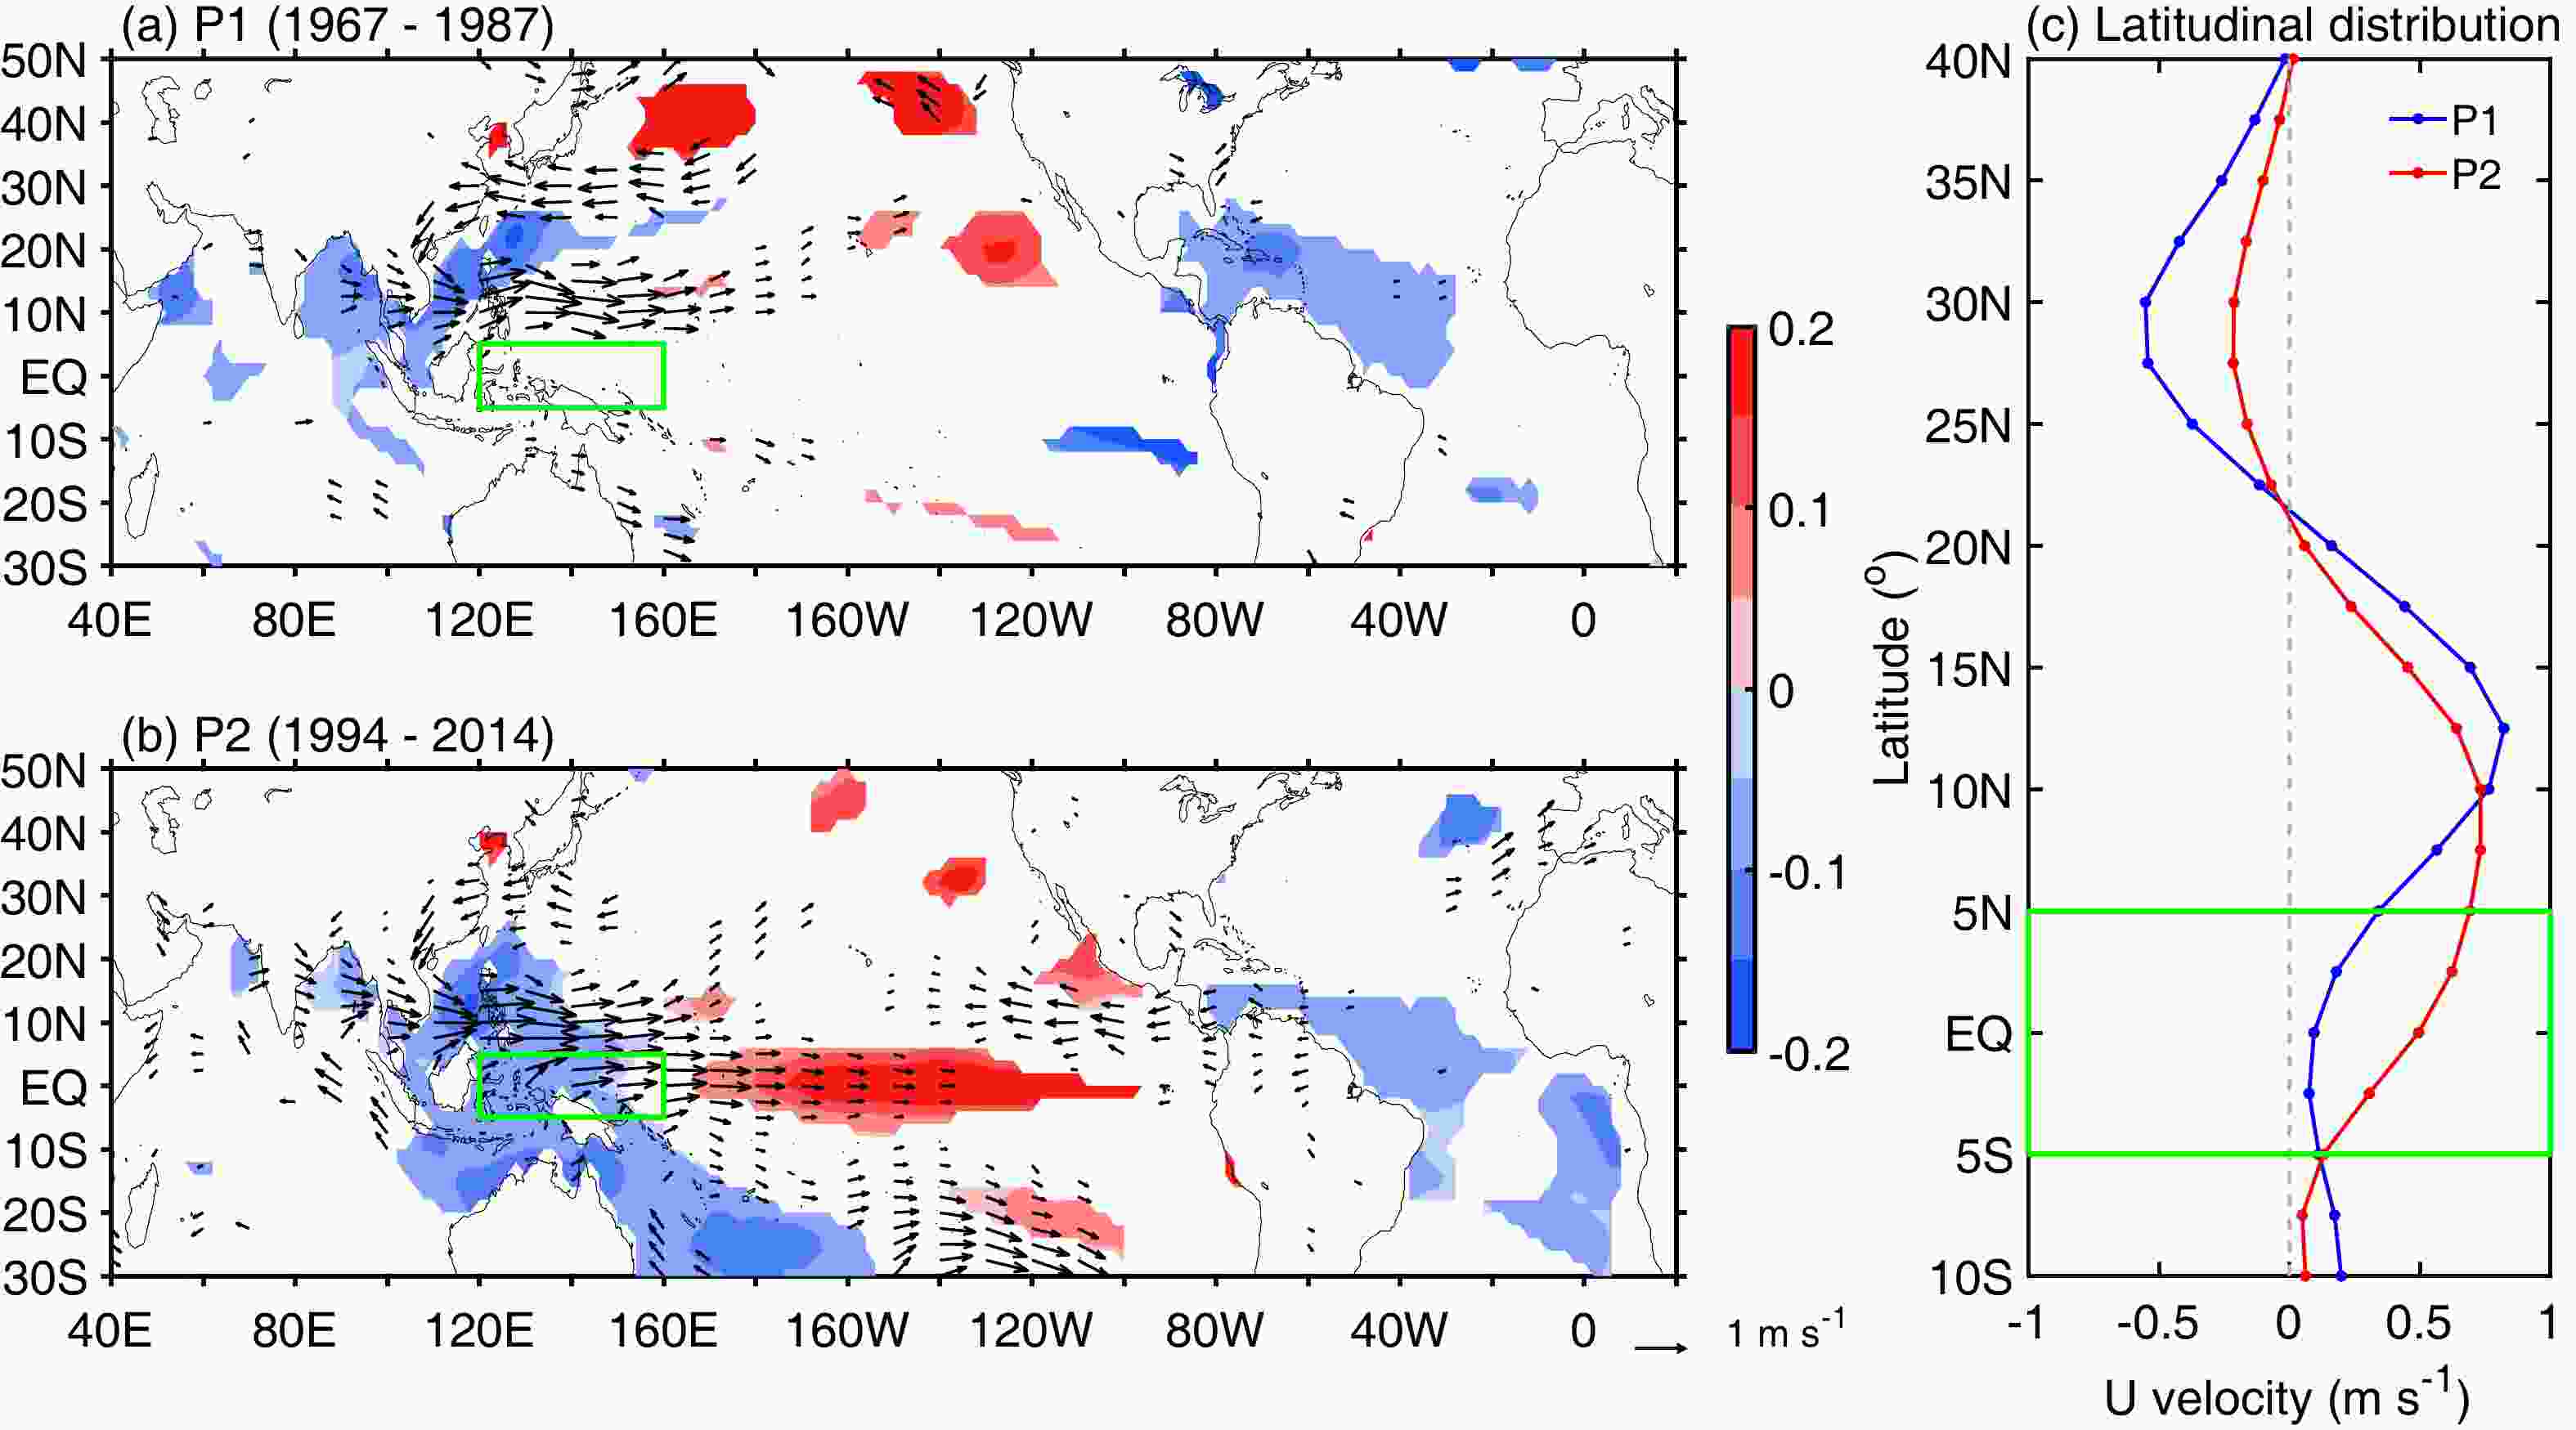
Figure 2. Regressions with respect to the WNPSM index for 850-hPa wind anomalies [vector; m s−1 (m s–1)−1] and SST anomalies [shading; °C (m s−1)−1] during (a) P1 and (b) P2. (c) Latitudinal distributions of regressed 850-hPa zonal wind anomalies with respect to the WNPSM index averaged between 120°–160°E during P1 (blue) and P2 (red). The green boxes encompass the region that defines the western Pacific EZW index. Only values significant at or above the 95% confidence level are shown in (a) and (b).
Similarly, we further conducted the regression analysis with respect to the western Pacific EZW index during two periods (Fig. 3). The regressed 850-hPa winds over the subtropical western Pacific (i.e., the two green boxes regions in the figure which are used to define the WNPSM index) were obviously different during two periods. Obvious cyclonic circulation anomalies could be identified over the subtropical and tropical western North Pacific during P2 (Fig. 3b), which were absent during P1 (Fig. 3a). Stronger westerly (easterly) wind anomalies were present between 5°–15°N (20°–30°N) during P2 (Fig. 3c), indicating a stronger WNPSM. These collective results suggest a closer interconnection between western Pacific EZW and the WNPSM for P2 compared to P1.

Figure 3. Regressions with respect to the western Pacific EZW index for 850-hPa wind anomalies [vector; m s−1 (m s−1)−1] and SST anomalies [shading; °C (m s−1)−1] during (a) P1 and (b) P2. (c) Latitudinal distributions of regressed 850-hPa zonal wind anomalies with respect to the western Pacific EZW index averaged between 120°–160°E during P1 (blue) and P2 (red). The green boxes encompass the region that defines the WNPSM index. Only values at or above the 95% confidence level are shown in (a) and (b).
-
Why are different relationships observed between the WNPSM and the western Pacific EZW during P1 and P2? It is possible that decadal changes in the related SST configurations in the tropical oceans may be the main driver. Different SST configurations across the tropical oceans may trigger different atmospheric circulation anomalies over the western Pacific, thus leading to the obviously different WNPSM–EZW relationship during P1 and P2.
-
Prominent changes could be observed in the spatial distribution of regressed simultaneous summer (JJA) SST anomalies with respect to the WNPSM index during two periods (Fig. 2). During P1, there was no obvious SST anomaly signal in the equatorial central and eastern Pacific (Fig. 2a). However, during P2, the situation has undergone a significant change, with pronounced warm SST anomalies becoming evident in the equatorial central and eastern Pacific (Fig. 2b). During P1, cold SST anomalies were present from the tropical north Indian Ocean to the South China Sea, roughly in a southwest-northeast orientation (Fig. 2a). In contrast, during P2, cold SST anomalies tended to extend from the South China Sea to the east of Australia in a northwest-southeast orientation (Fig. 2b). The SST anomalies in the tropical north Indian Ocean have weakened substantially during P2. In addition, the tropical Atlantic cold SST anomalies tended to enlarge and expand (Fig. 2b).
We further compared the spatial distribution of regressed simultaneous JJA SST anomalies with respect to the western Pacific EZW index during two periods (Fig. 3). In the two periods, changes in the spatial distribution of the SST anomalies in the tropical Pacific, which affected the western Pacific EZW, were relatively small. Noticeable warm SST anomalies occurred in the equatorial central and eastern Pacific, and cold SST anomalies emerged in the maritime continent extending southeastward to the east of Australia during both P1 (Fig. 3a) and P2 (Fig. 3b). The zonal SST gradient due to warm SST anomalies in the equatorial central Pacific and cold SST anomalies in the maritime continent was conducive to the formation of westerly anomalies over the western Pacific equatorial region in both periods. At the same time, cold SST anomalies were evident in the tropical Atlantic, especially in the P2 period. The area of the tropical Atlantic cold SST anomalies was much larger in P2 than in P1.
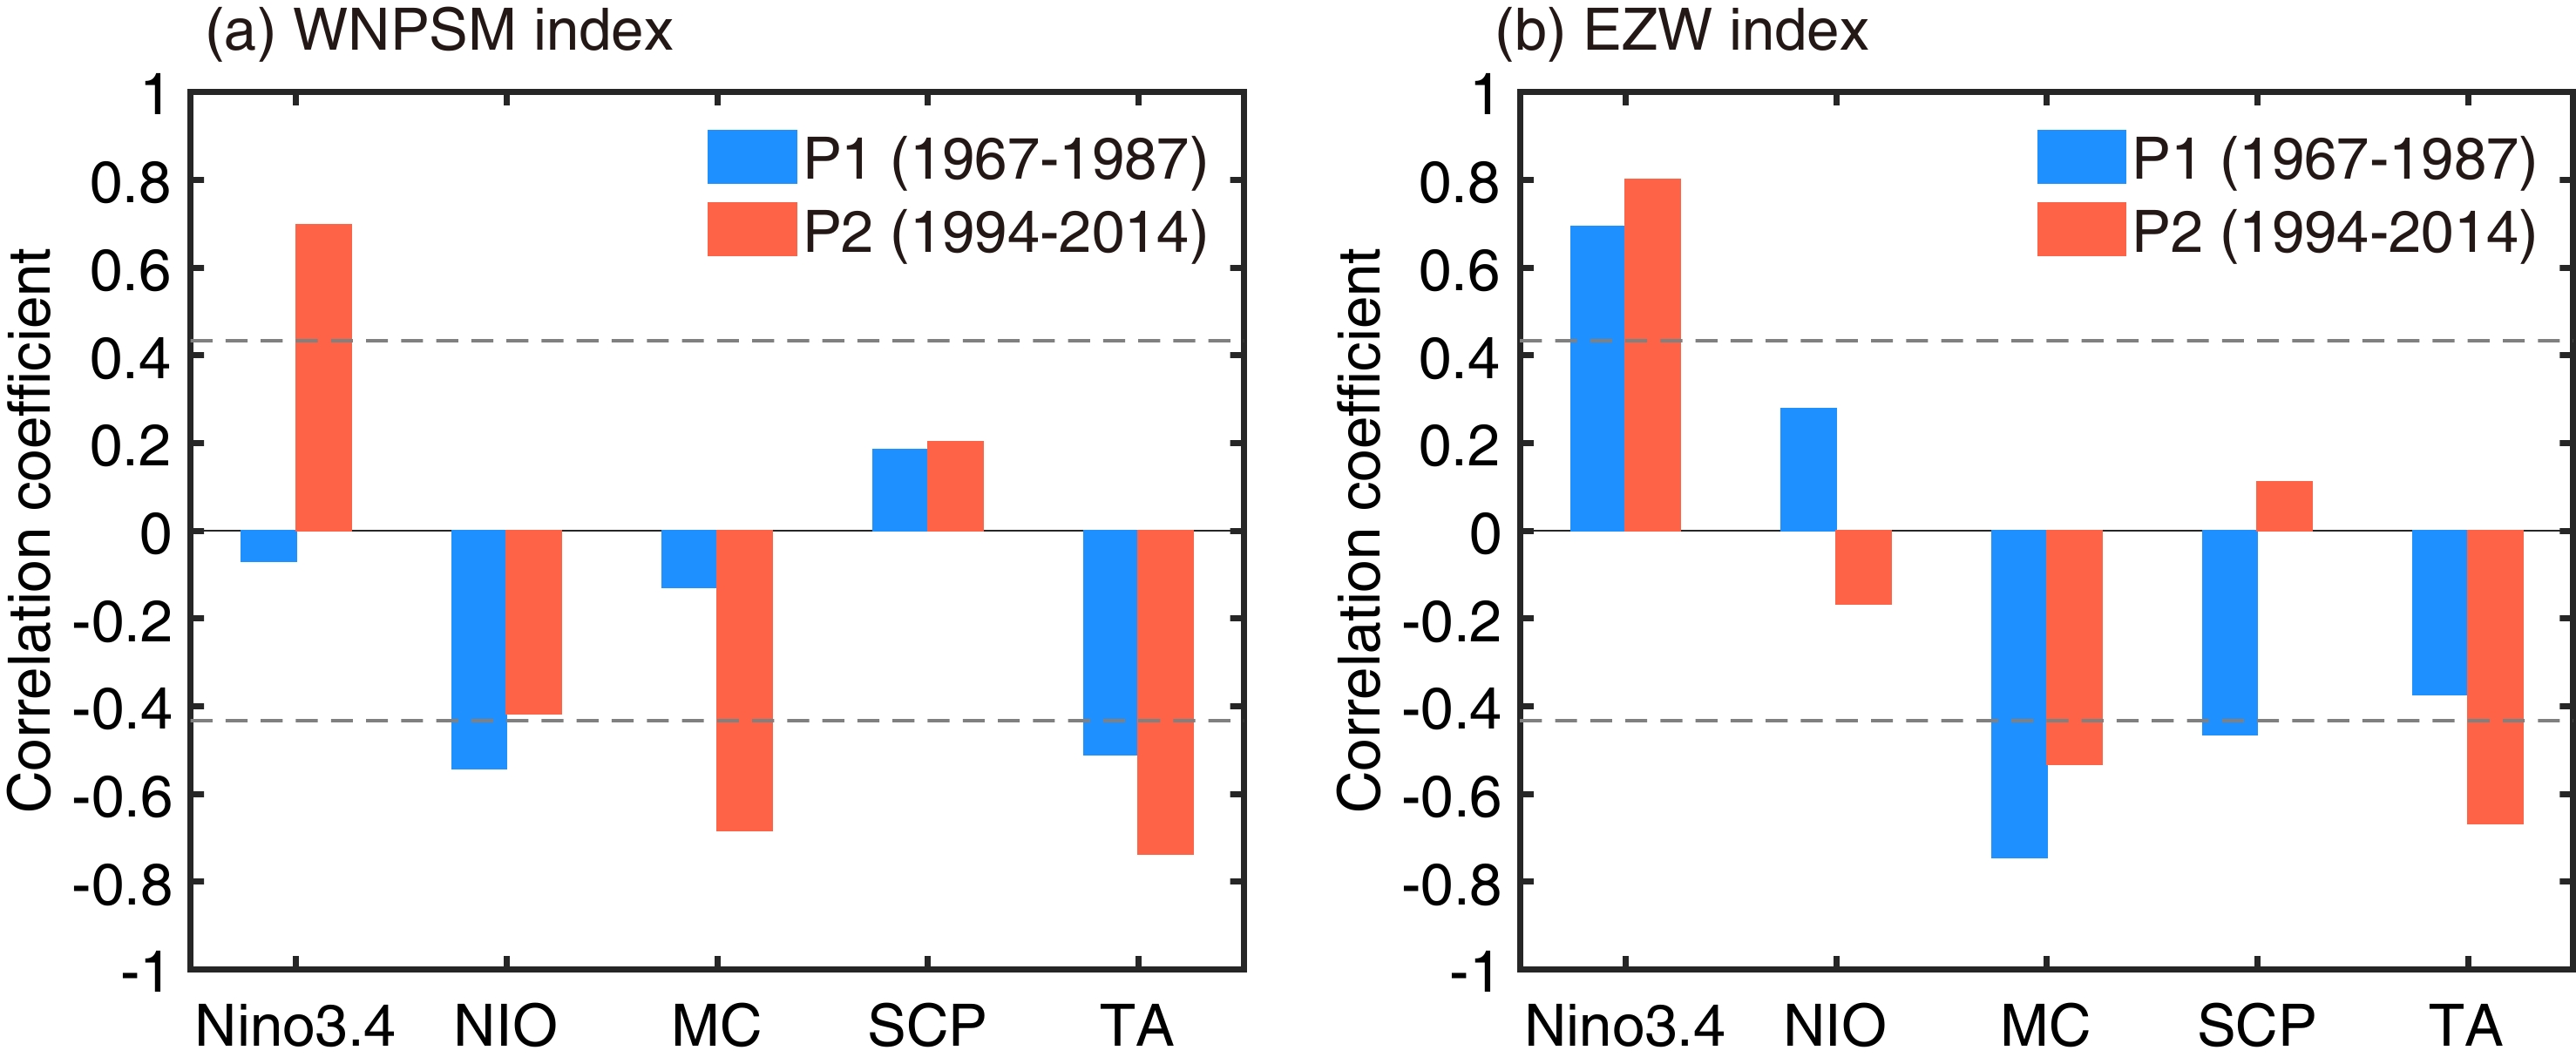
Based on the above analysis, the observed decadal changes in the related SST configurations of the tropical oceans, as they have modulated the variations of the WNPSM and EZW, may explain the different WNPSM–EZW relationships during P1 and P2. During P2, the WNPSM and the western Pacific EZW could be affected by the common SST anomalies in the equatorial central Pacific and the maritime continent (Figs. 2b and 3b). Therefore, a strongly positive WNPSM–EZW correlation could be observed in this period (Fig. 1d). In contrast, during P1, the WNPSM and the western Pacific EZW may be modulated by different SST anomalies (Figs. 2a and 3a). Although the western Pacific EZW was still modulated by SST anomalies in the equatorial central Pacific and the maritime continent during P1 (Fig. 3a), the WNPSM was changed to be mainly influenced by SST anomalies in the tropical Indian Ocean (Fig. 2a). These inconsistent SST configurations in the tropical oceans could thus lead to the weakening of the WNPSM–EZW correlation during P1 (Fig. 1c). Comparisons of correlation coefficients between JJA SST anomalies in key regions and two wind indexes (Fig. 4) could also support these conclusions. During P1, the WNPSM index was negatively correlated with the tropical Indian Ocean SST anomaly with a correlation coefficient of –0.54 (Fig. 4a). During P2, the WNPSM index changed to be positively correlated with the Niño-3.4 SST (with a correlation coefficient of 0.70) and negatively correlated with the maritime continent SST (with a correlation coefficient of –0.68) (Fig. 4a). The increased influence of maritime continent SST anomalies on the western North Pacific climate after the 1990s is also supported by previous studies (Wu and Zhou, 2008; Chen and Zhou, 2014; He and Zhou, 2015). The western Pacific EZW index was positively correlated with the Niño-3.4 SST and negatively correlated with the maritime continent SST during both periods (Fig. 4b). Thus, the common influences from the summertime tropical central Pacific and maritime continent SST anomalies may contribute to the recently intensified WNPSM–EZW co-variability.
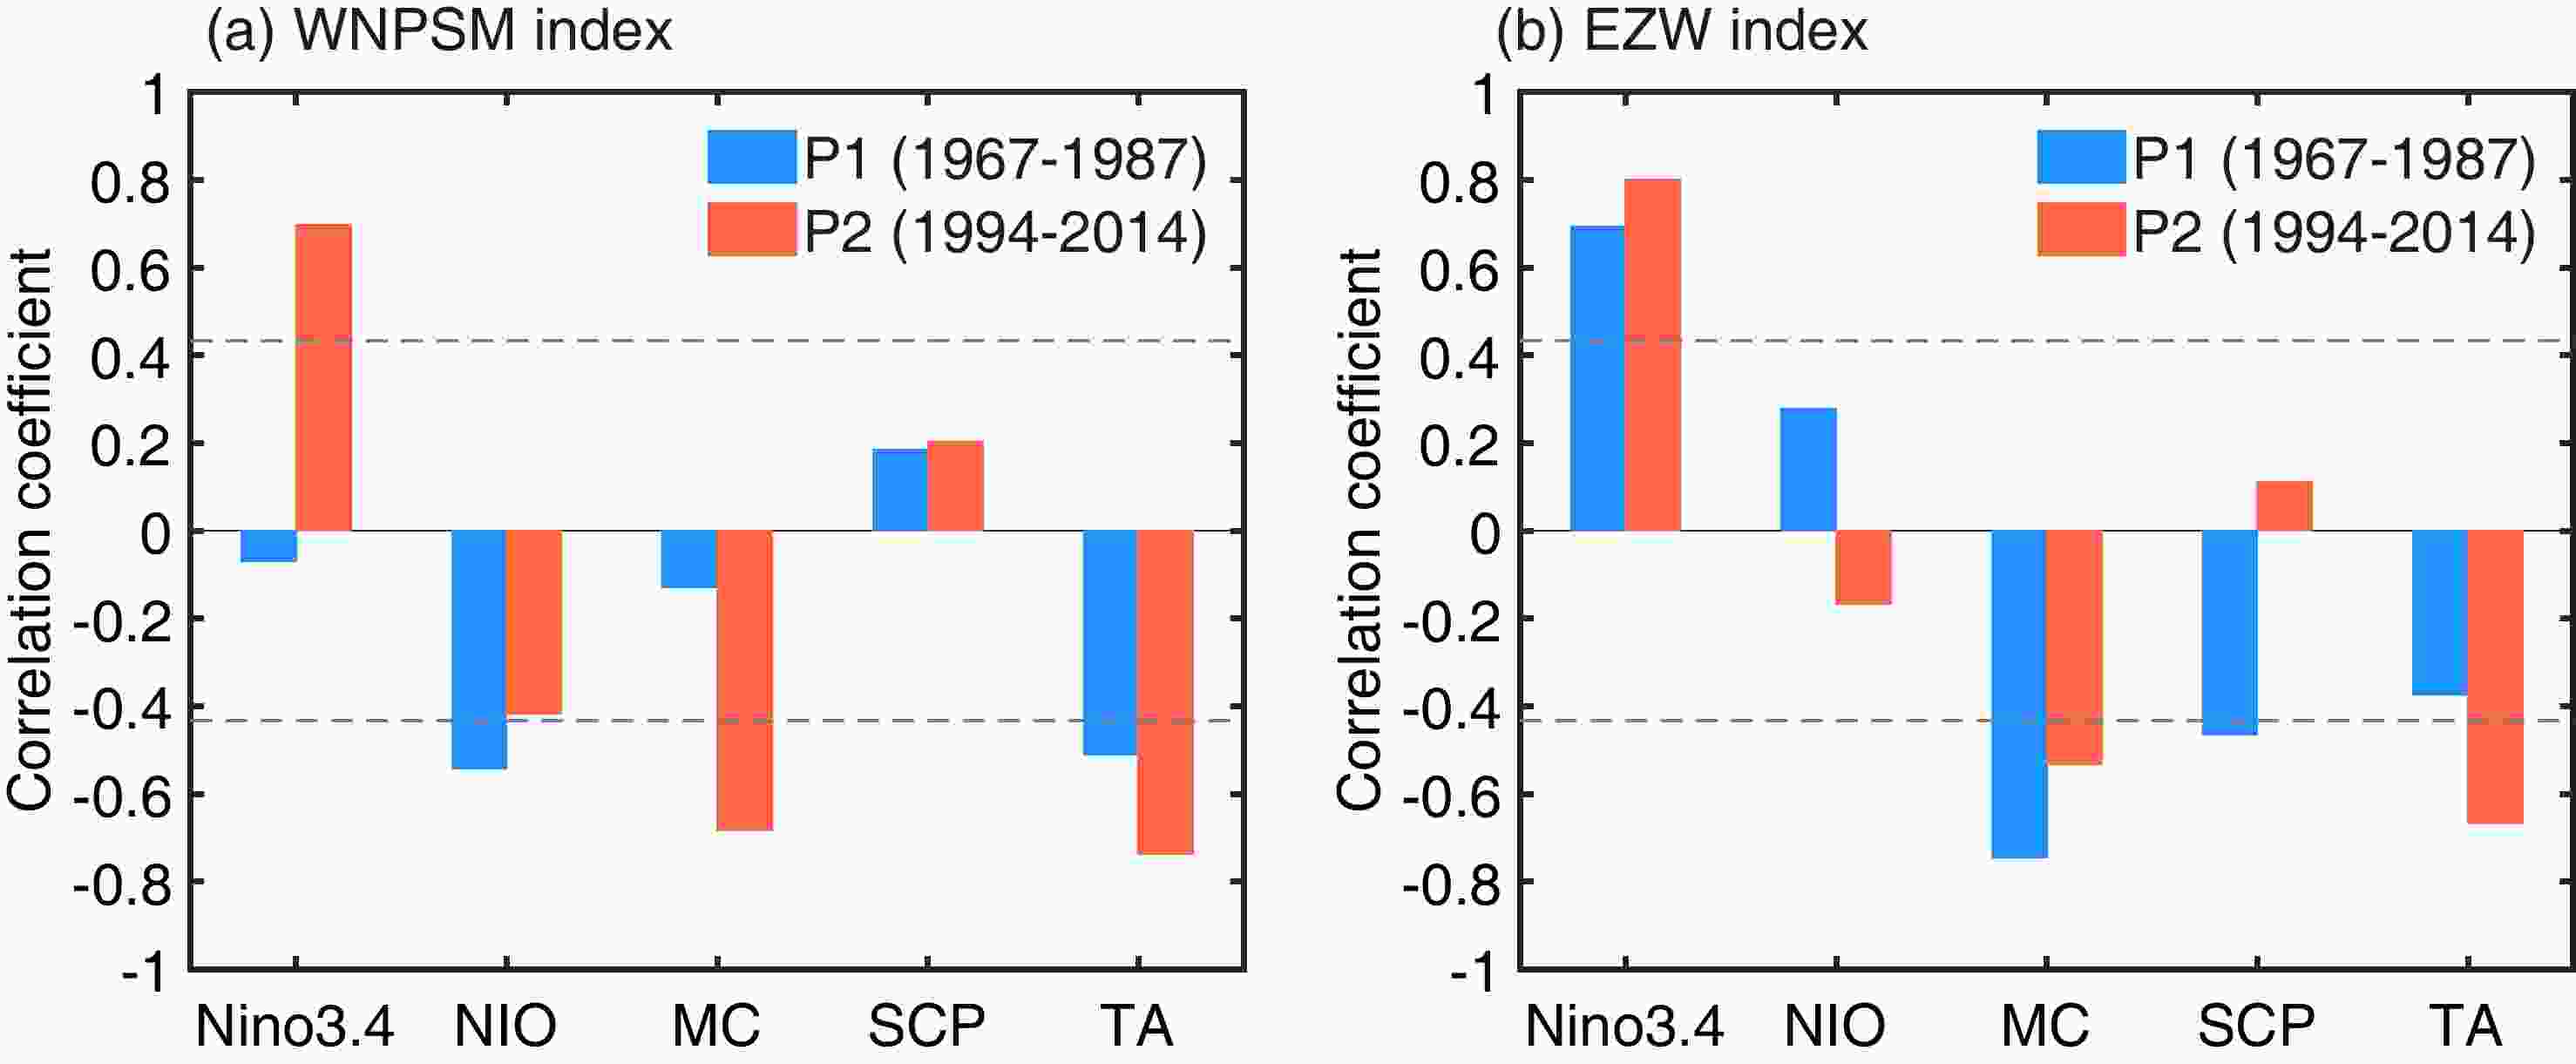
Figure 4. Comparisons of correlation coefficients between simultaneous JJA SST anomalies in key regions and two wind indexes during P1 (blue) and P2 (red): (a) the WNPSM index and (b) the western Pacific EZW index. The SST anomalies in five key regions [including the Niño-3.4 region, north Indian Ocean (NIO), maritime continent (MC), subtropical central Pacific (SCP), and tropical Atlantic (TA)] are shown. The dashed line represents statistical significance at the 95% confidence level.
-
The WNPSM and the western Pacific EZW are not only modulated by the simultaneous summer SST anomalies but may also be affected by the memory of the SST anomalies from the previous winter (December−January−February, DJF) and spring (March−April−May, MAM). In the following development, the potential for changes induced by the influence of SST anomalies from the previous winter and spring are examined (Figs. 5 and 6).

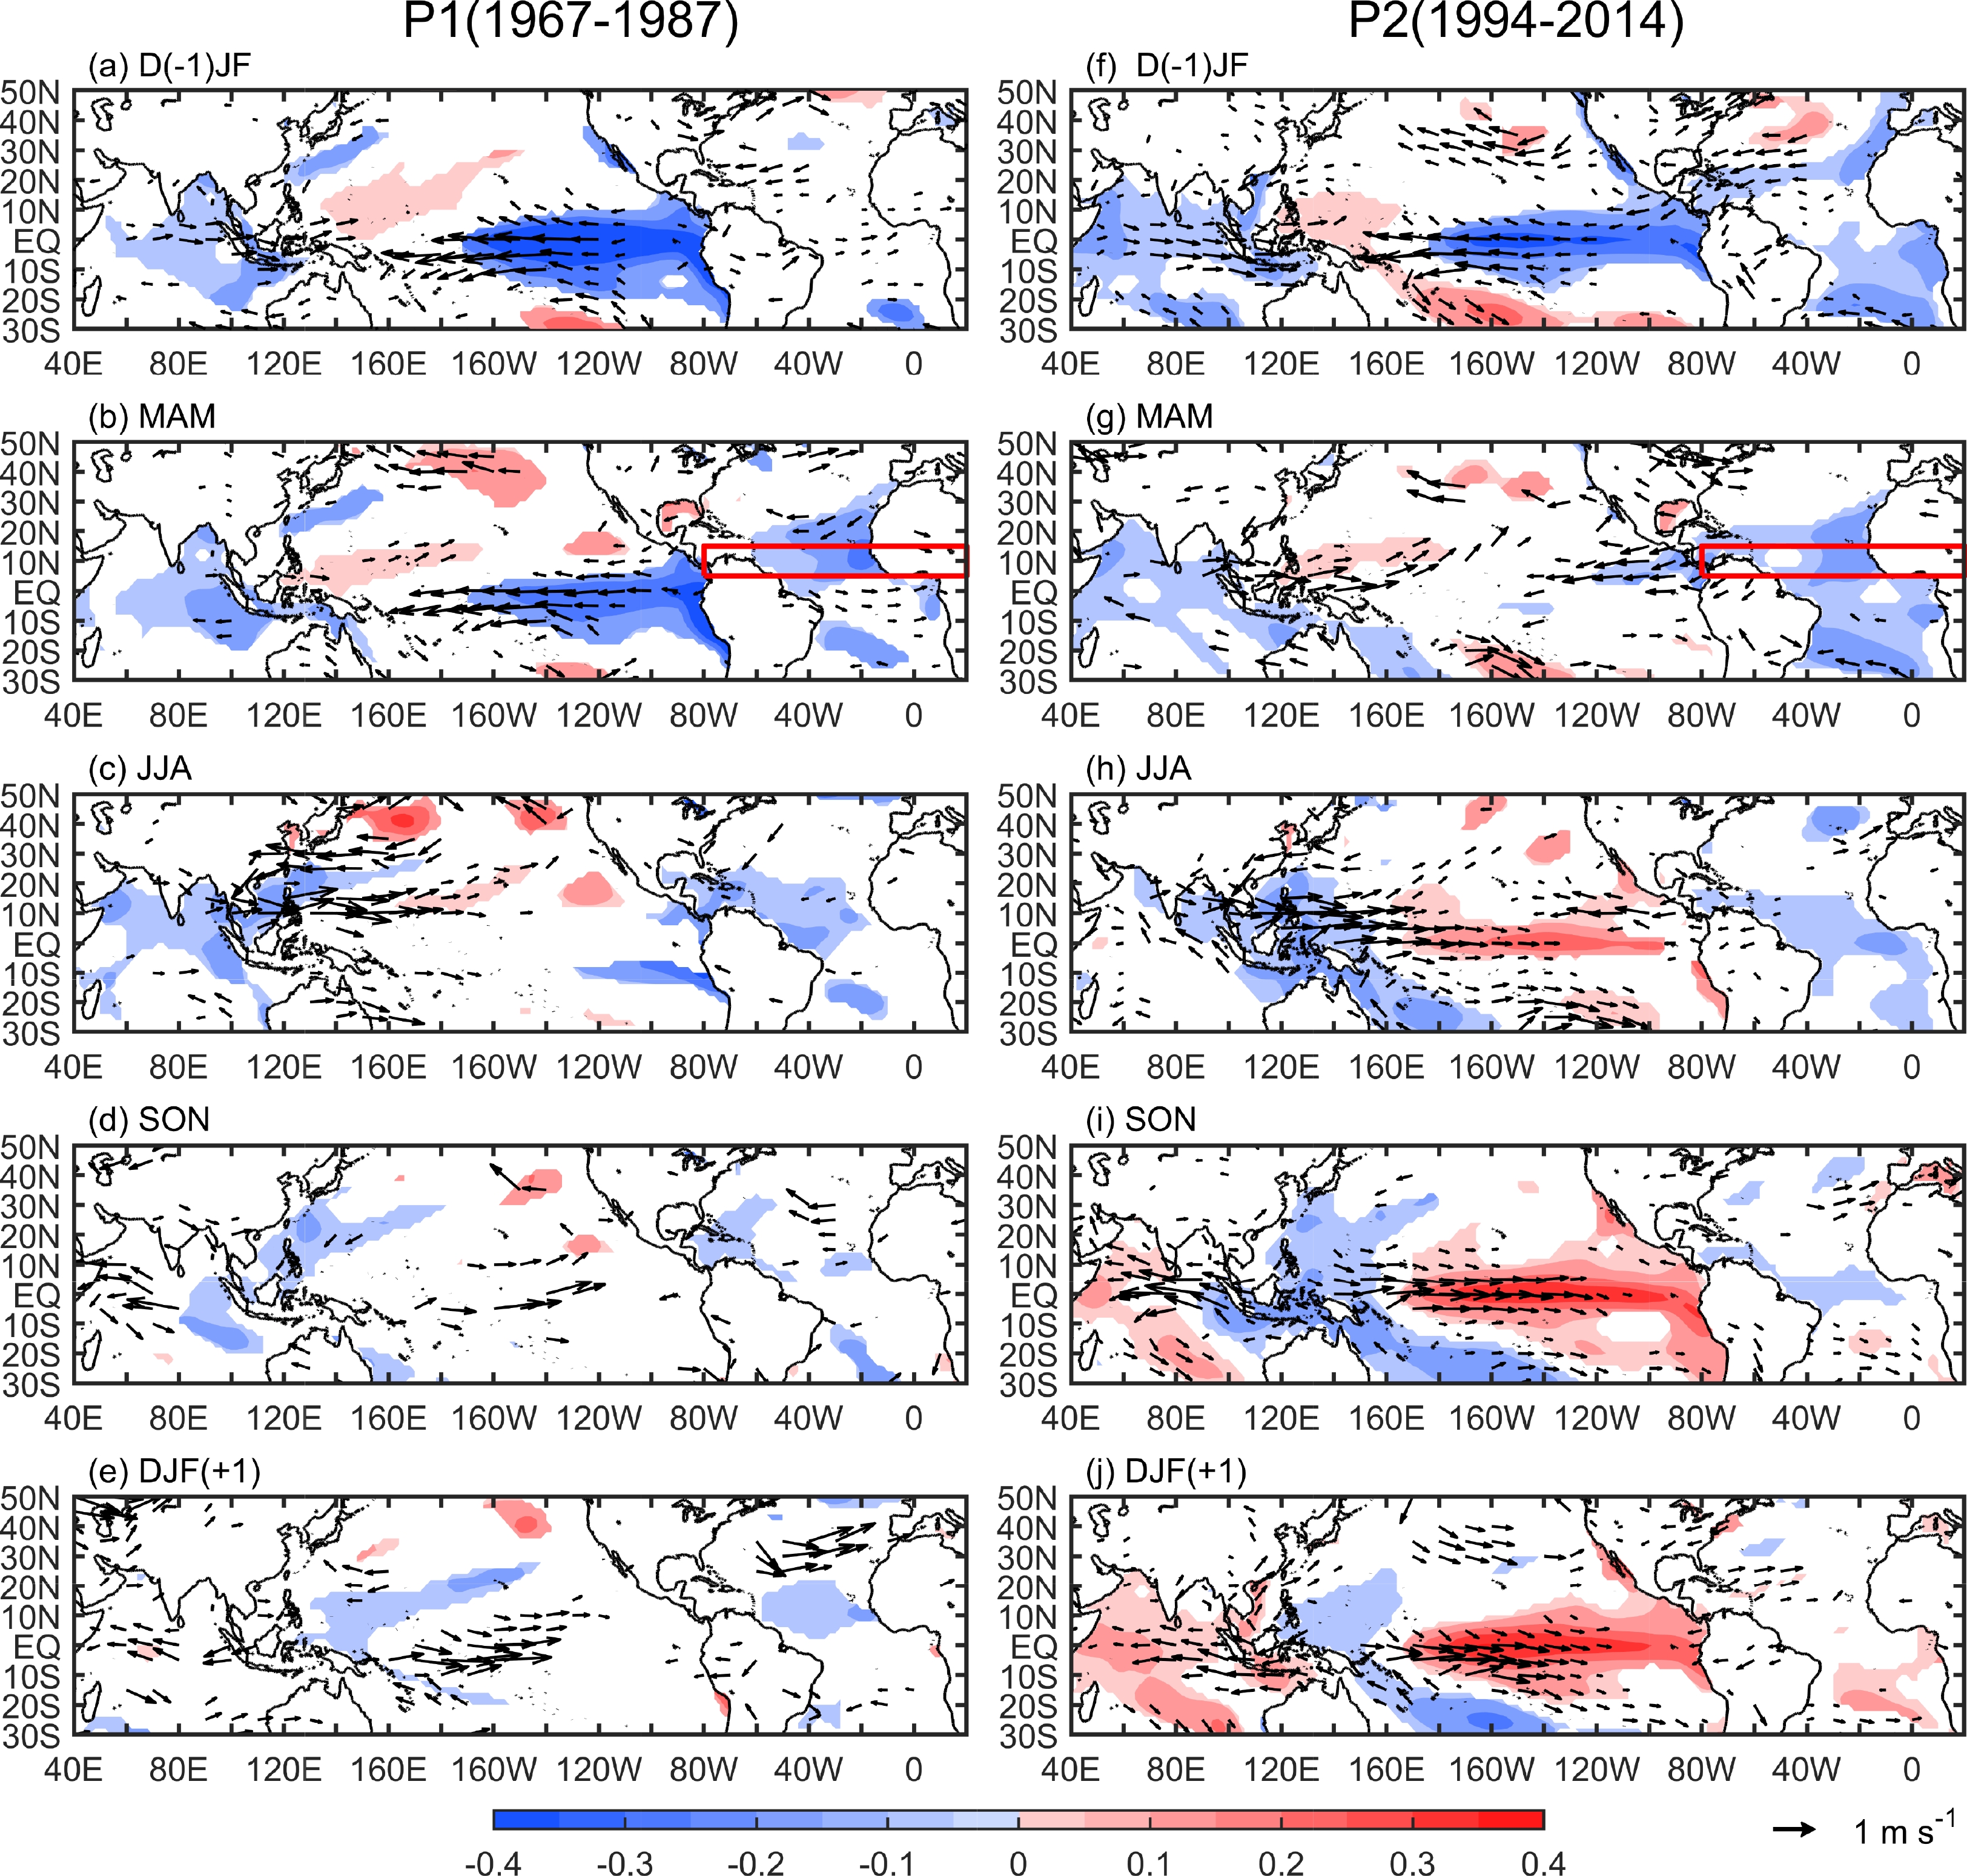
Figure 5. Regressions for 850-hPa wind anomalies [vector; m s–1 (m s–1)-1] and SST anomalies [shading; °C (m s–1)-1] with respect to the WNPSM index from the previous boreal winter [D(–1)JF] to the subsequent boreal winter [DJF(+1)] during (a–e) P1 and (f–j) P2. Only the values significant at the 90% confidence level or higher are shown. The red boxes in (b) and (g) represent the domain for the tropical North Atlantic.
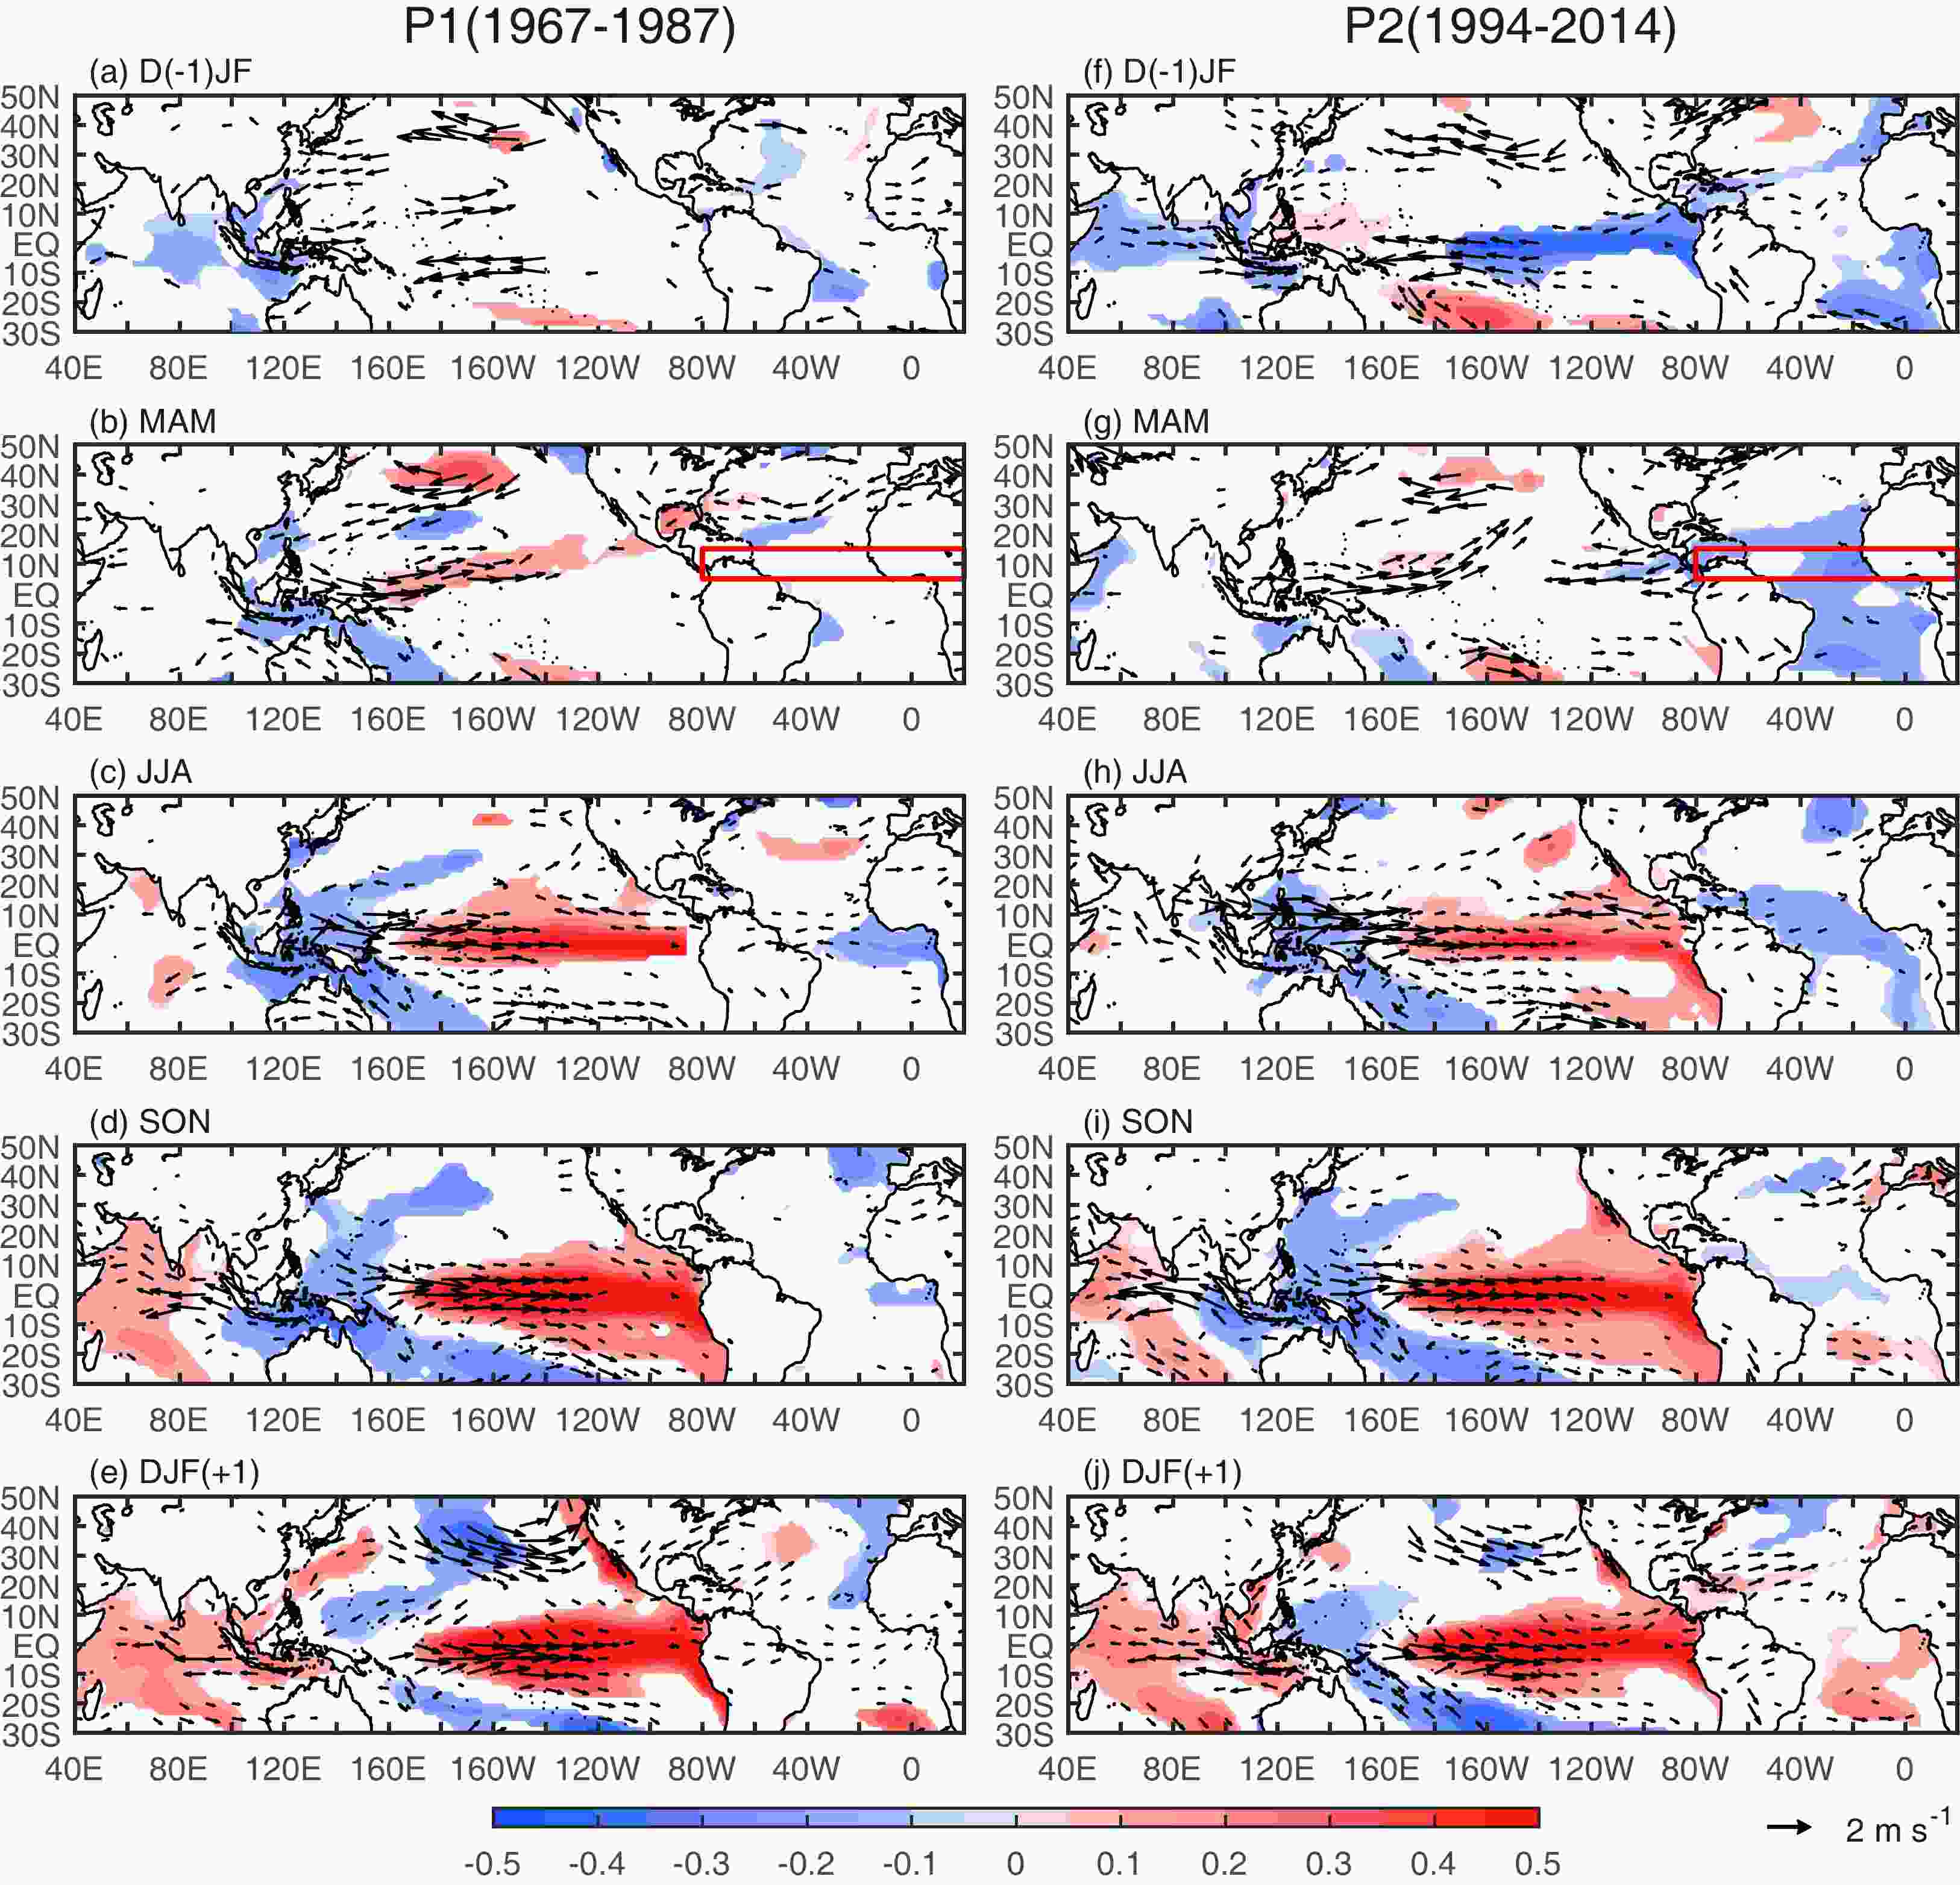
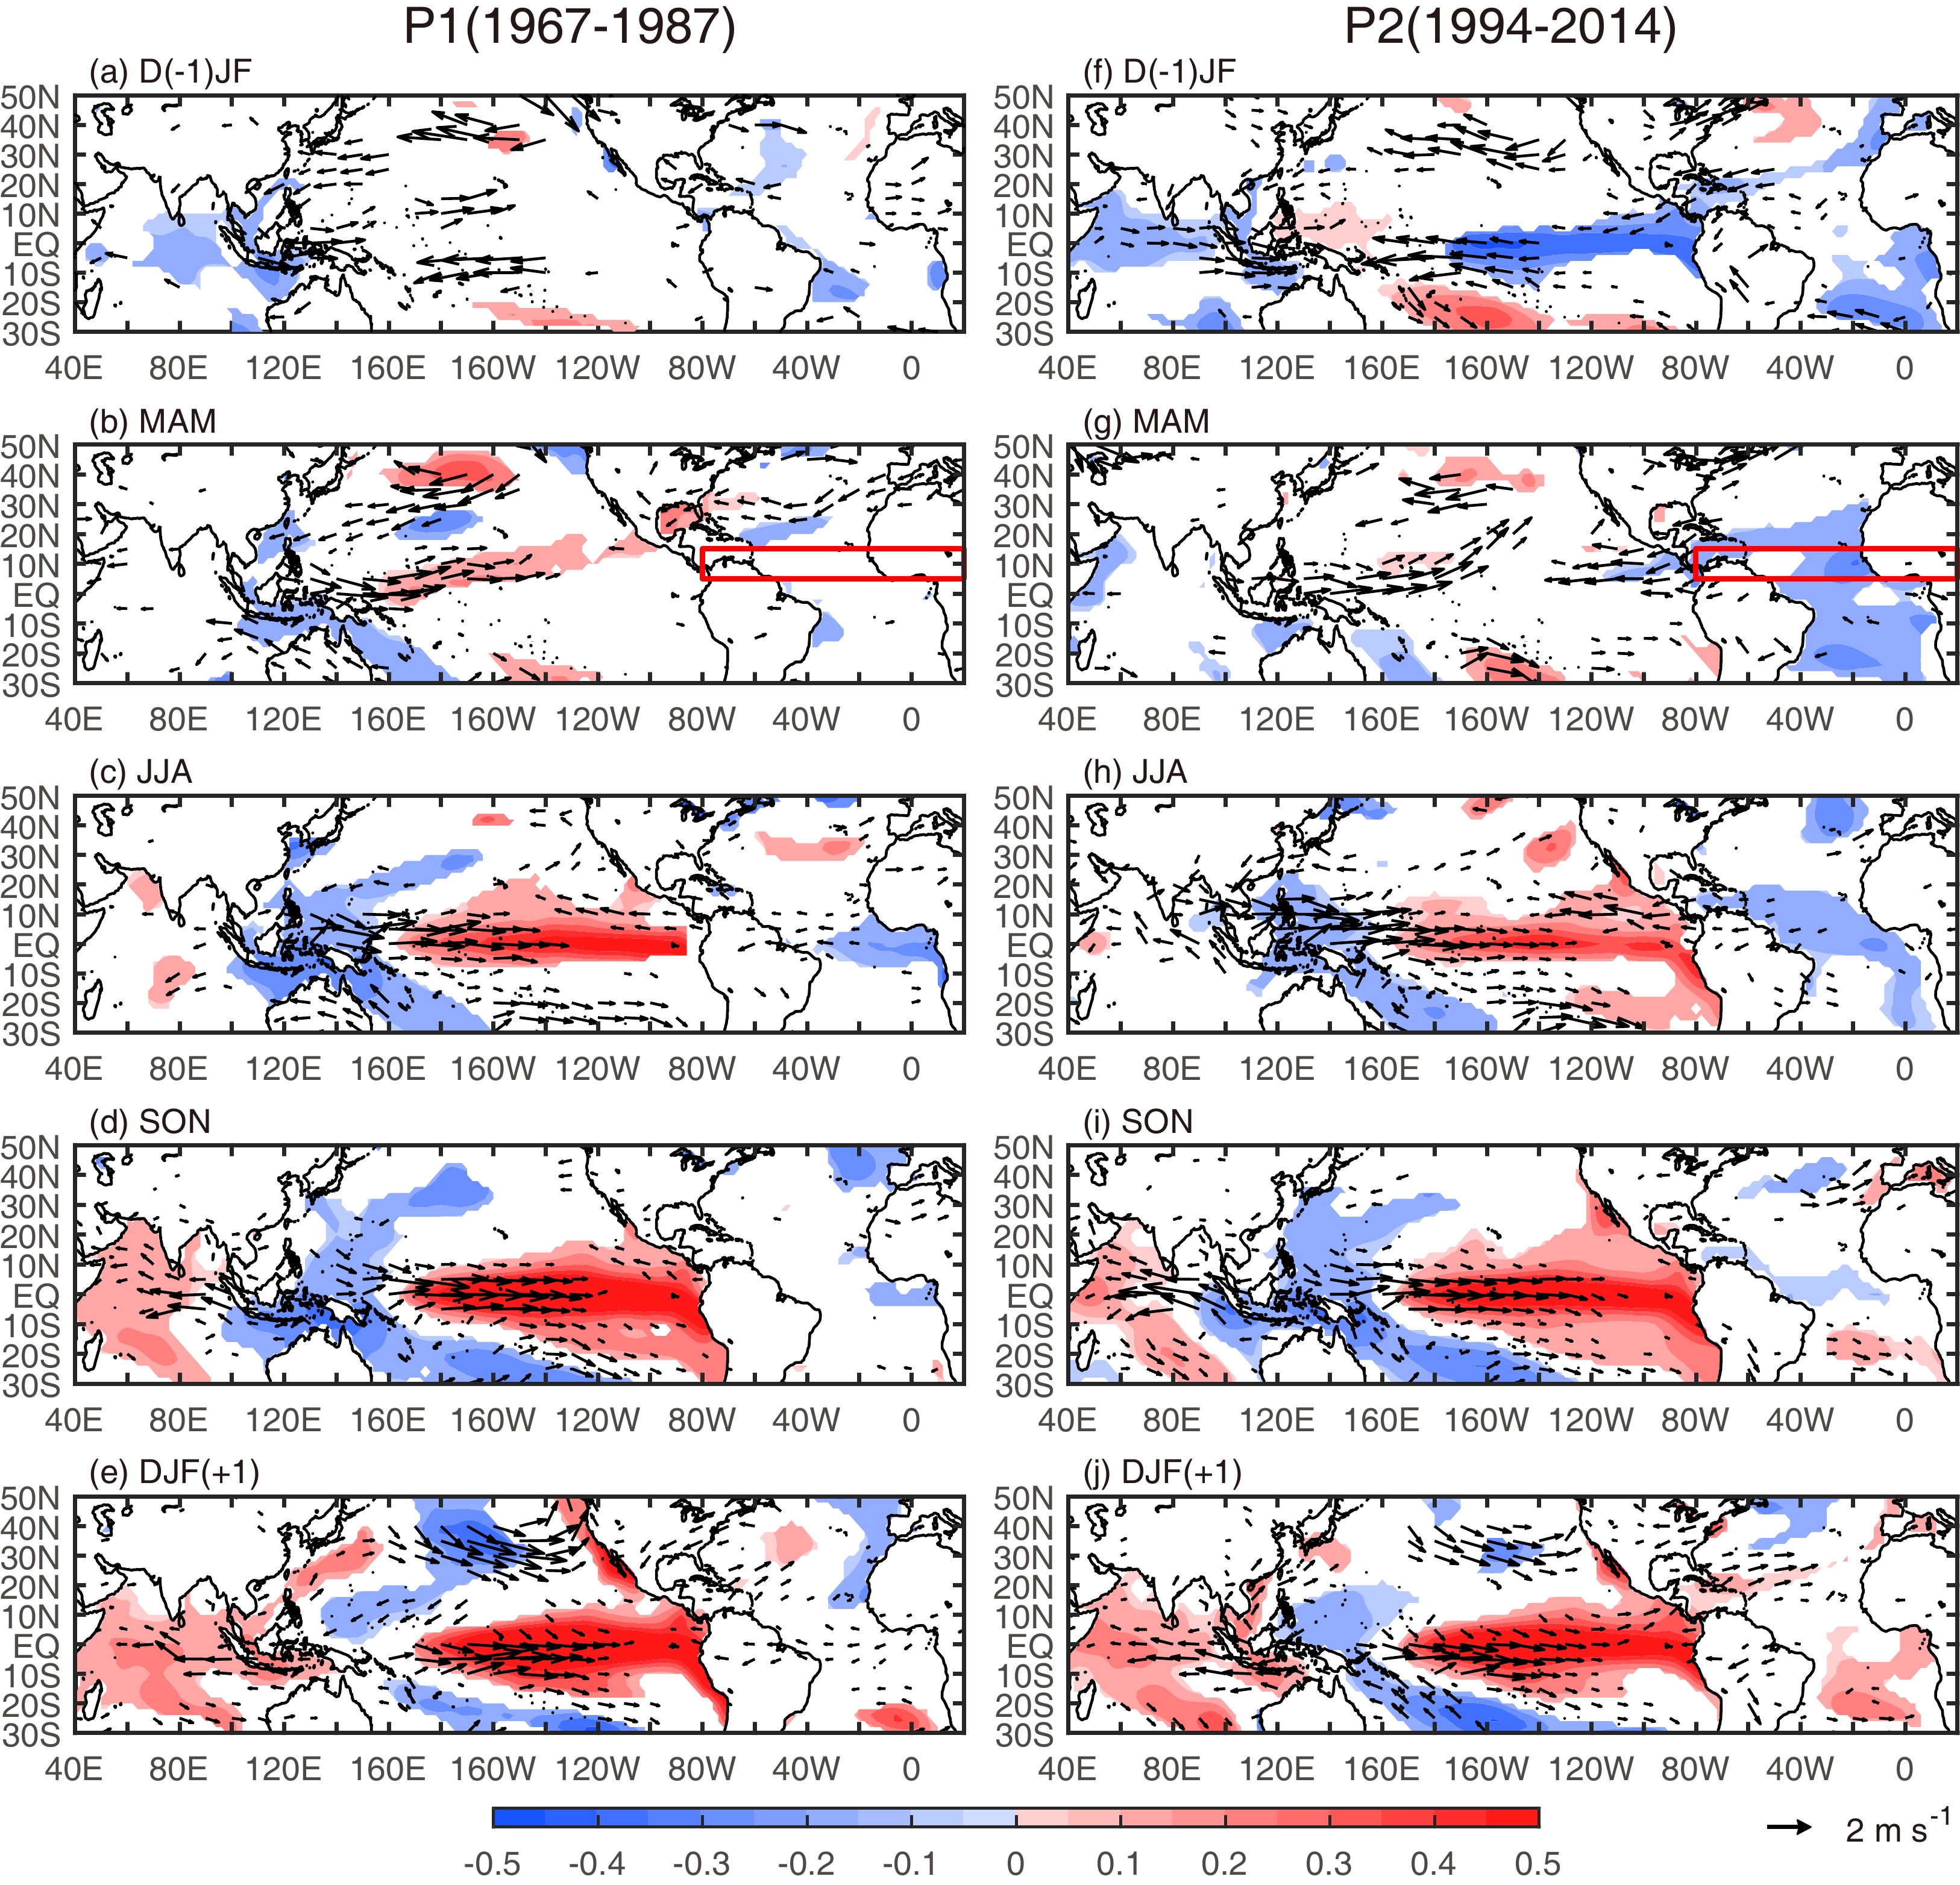
Figure 6. As in Fig. 5, but for regressions with respect to the JJA western Pacific EZW index.
For the regressed SST anomalies of the previous winter with respect to the WNPSM index, La Niña-like SST anomalies are observed during both P1 (Fig. 5a) and P2 (Fig. 5f), with cold SST anomalies emerging in the equatorial eastern and central Pacific. Notably, there are significant cold SST anomalies in the tropical North Atlantic during the spring (Figs. 5b, g). The cross-basin effects of springtime tropical North Atlantic SST anomalies on Pacific climate in the subsequent summer and winter have attracted much attention in previous studies (e.g., Ham et al., 2013; Huo et al., 2015; Wang et al., 2017). Wang et al. (2017) suggested that the Atlantic capacitor effect may have been enhanced greatly since the early 1990s, supporting an intensified influence from the springtime tropical North Atlantic SST anomalies on ENSO and the Pacific subtropical high-pressure systems in the subsequent summer and winter during recent decades. The decadal changes in the climatic influences from the springtime tropical North Atlantic SST anomalies may also modulate the WNPSM–EZW relationship. In addition, it is notable that the cold SST anomalies in the equatorial eastern Pacific tended to decline greatly in spring for P2 (Fig. 5g), which were much weaker than those for P1 (Fig. 5b). This indicated that the La Niña event in the previous winter tended to have a faster decay in the following spring during P2. A faster ENSO phase transition to El Niño-like SST anomalies could be observed in the summer during P2, with warm SST anomalies emerging in the equatorial eastern and central Pacific (Fig. 5h). This type of faster ENSO phase transition could not be found during P1, without noticeable warm SST anomalies emerging in the equatorial eastern and central Pacific (Fig. 5c). As suggested in Wang et al. (2017), the enhanced influence from the springtime tropical North Atlantic SST anomalies may be a main driver for a faster ENSO phase transition during P2.
Cold SST anomalies in the tropical North Atlantic during the spring were evident in the SST regressions with respect to the western Pacific EZW index in P2 (Fig. 6g), which were absent in P1 (Fig. 6b). These results suggest that the influences of springtime tropical North Atlantic SST anomalies on the western Pacific EZW may also be enhanced during P2. During P2, the joint modulation of springtime tropical North Atlantic SST anomalies (Figs. 5g and 6g) on the WNPSM and EZW could cause a strengthening of the WNPSM–EZW relationship (Fig. 1d). In contrast, for P1, the western Pacific EZW may not be influenced by the springtime tropical North Atlantic SST anomalies (Fig. 6b), consistent with a weak WNPSM–EZW correlation (Fig. 1c).
In addition, there were also obvious differences in the regressed SST anomalies in the previous winter with respect to the western Pacific EZW index for both periods (Fig. 6). In P2, La Niña-like cold SST anomalies were present in the equatorial eastern and central Pacific (Fig. 6f), which were absent in P1 (Fig. 6a). It is also noted that northeast wind anomalies appeared in the East China Sea during P1 (Fig. 6a), which may represent a stronger East Asian winter monsoon. At the same time, cold SST anomalies could be observed in the South China Sea and East China Sea (Fig. 6a), which may be due to the SST cooling effects caused by the increase in wind speed associated with the strong East Asian winter monsoon. In P1, cold SST anomalies in the South China Sea could be maintained in the following spring (Fig. 6b) and summer (Fig. 6c). However, these cold SST anomalies in the South China Sea and East China Sea were absent in P2 (Fig. 6g). The cold SST anomalies in the South China Sea, together with cold SST anomalies in the maritime continent, could help drive westerly EZW anomalies over the western Pacific during the summer (Fig. 6c).
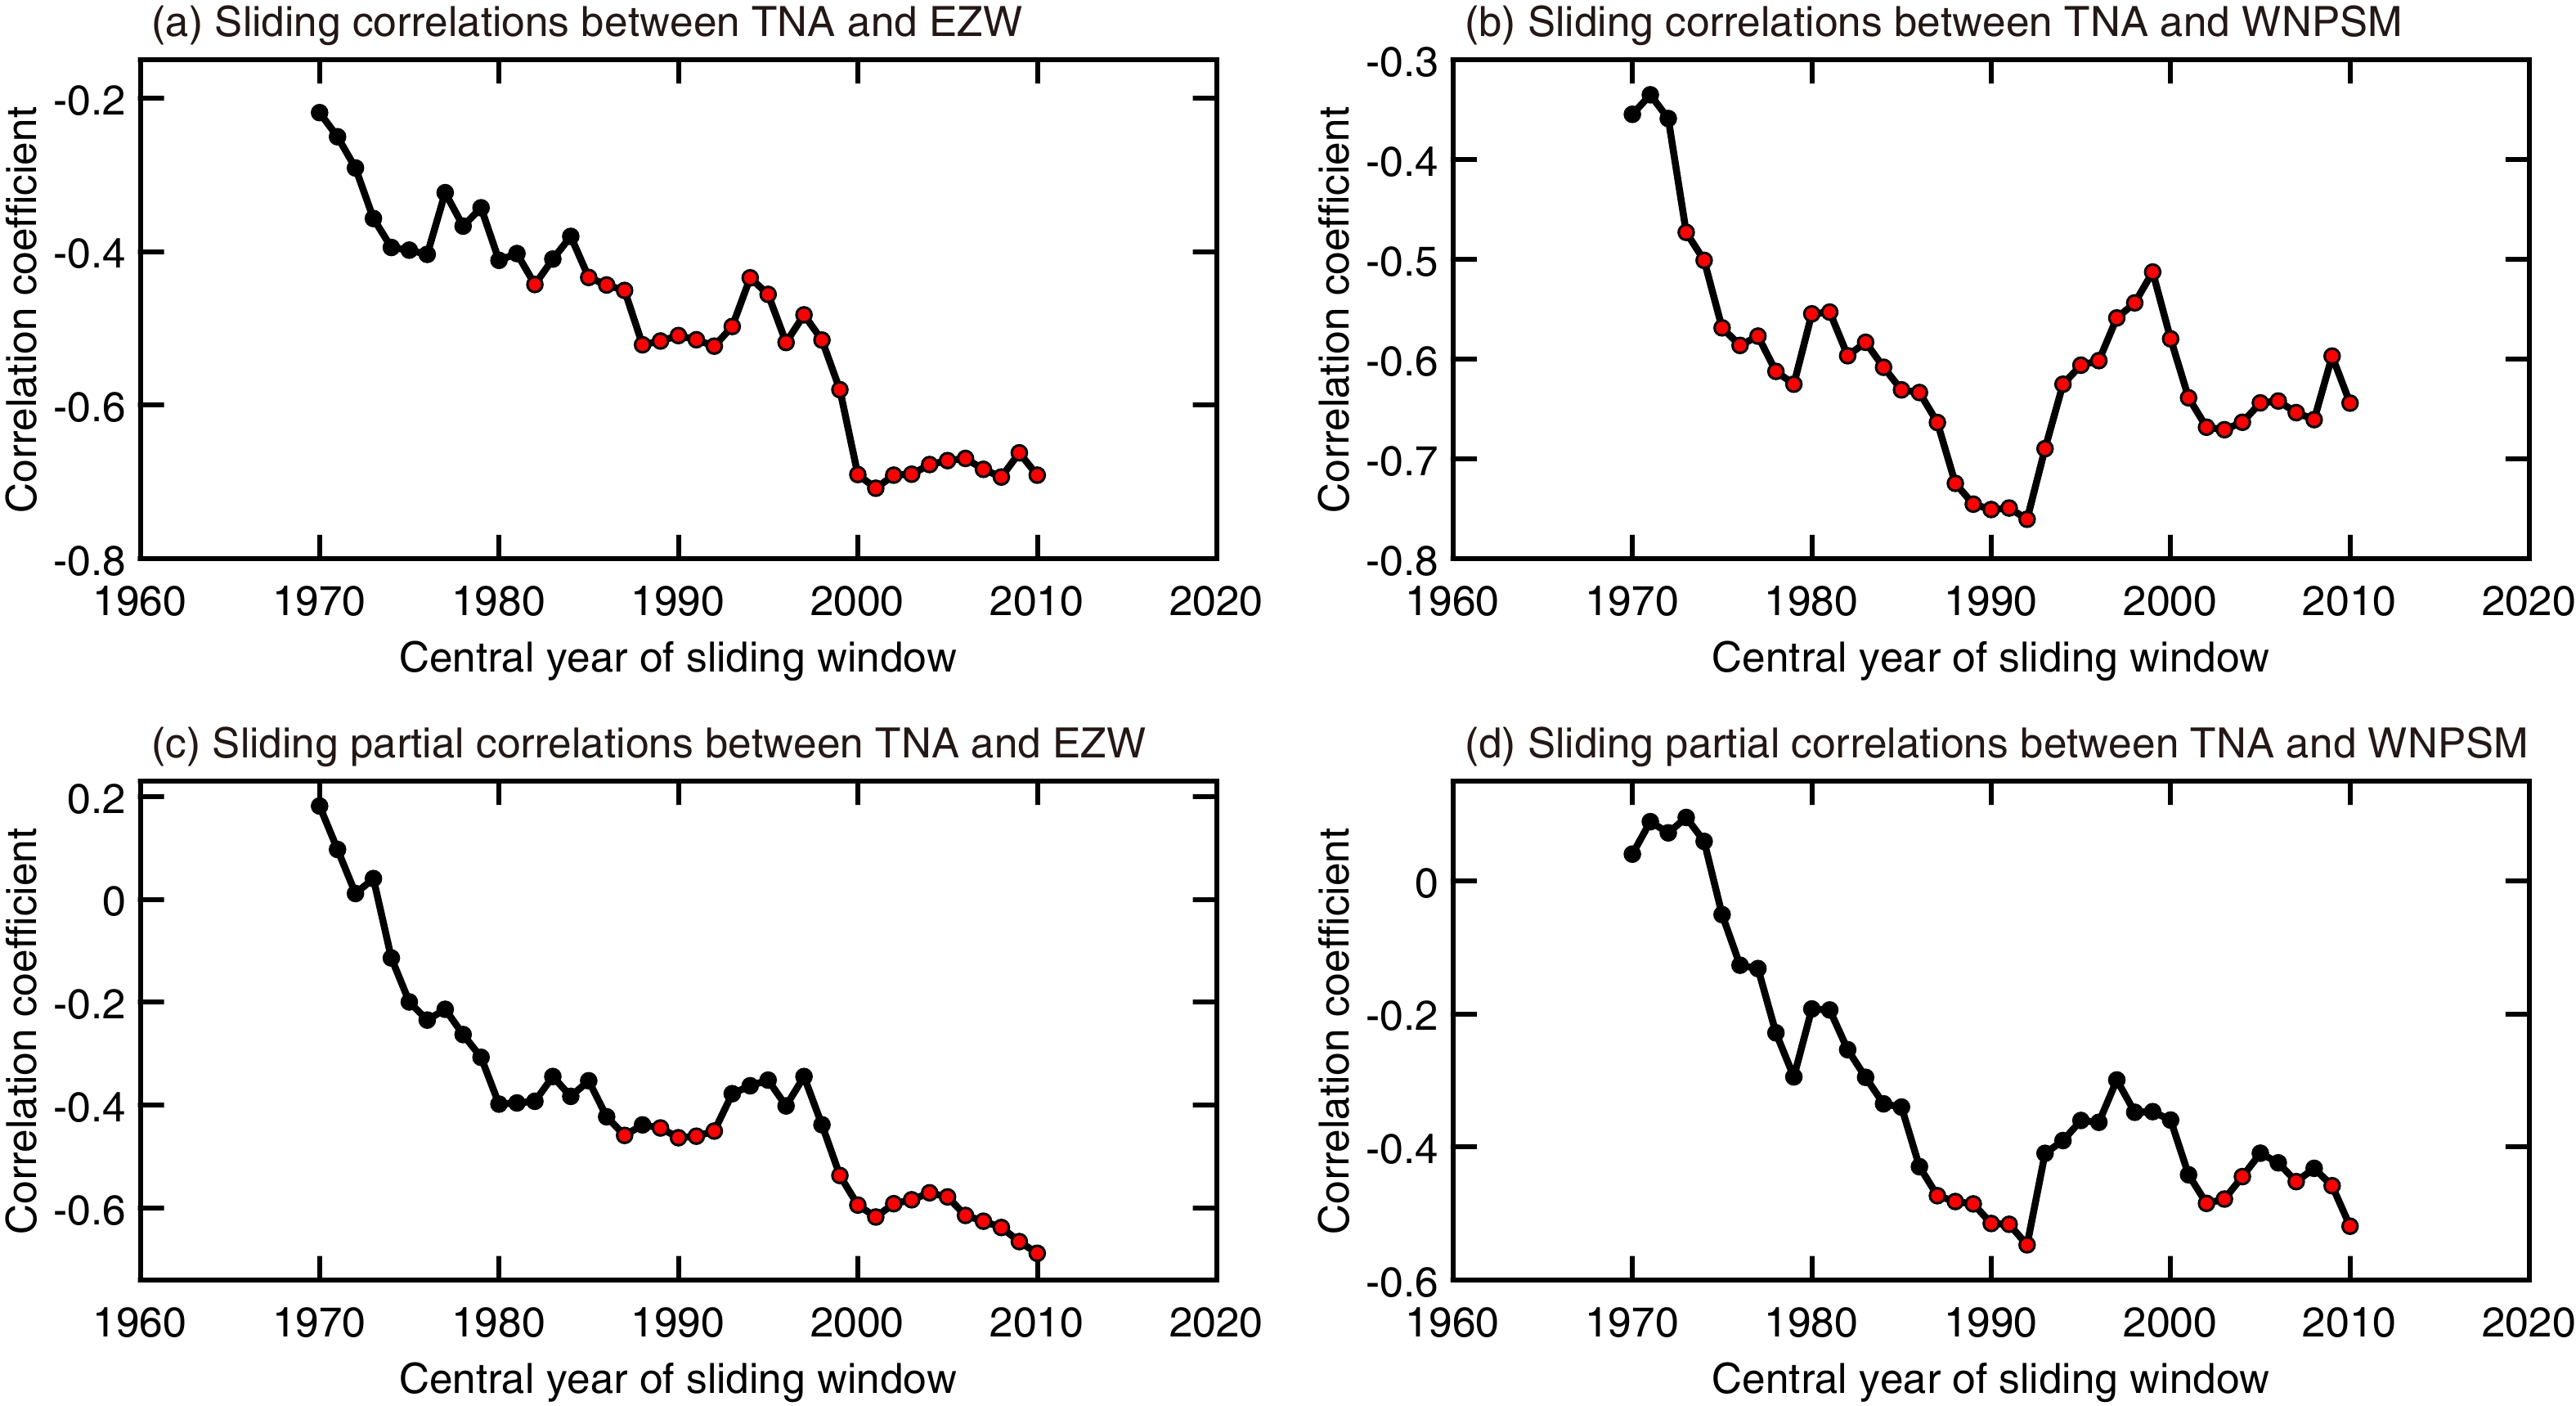
Sliding correlations between the springtime north tropical Atlantic SST and western Pacific EZW index showed a trend that gradually strengthened over time (Fig. 7a), indicating that impacts from the springtime tropical north Atlantic SST on the western Pacific EZW may have been greatly enhanced during recent decades. In P2, significant negative correlations with the springtime tropical north Atlantic SST could be identified for both the EZW index (with a value of –0.68) and the WNPSM index (with a value of –0.66). In contrast, in P1, the correlation between the springtime tropical north Atlantic SST and the EZW index was not significant at a 95% confidence level, with a correlation coefficient of –0.32 (Fig. 7a). Considering that the springtime tropical north Atlantic SST may be influenced by the previous winter’s ENSO (Klein et al., 1999), we conducted partial correlation analyses to remove the ENSO influence from the previous winter (Figs. 7c, d). In P2, significant negative correlations were still observed between the springtime tropical north Atlantic SST and the EZW and WNPSM indexes, even with the removal of influences of the previous winter’s Niño-3.4 index (Figs. 7c, d). These results support that the springtime tropical North Atlantic SST could jointly modulate the western Pacific EZW and the WNPSM in P2, likely independent of ENSO in the previous winter. According to the above analyses, the cross-basin influence from the springtime tropical North Atlantic SST anomalies may have significantly contributed to the recent enhancement of the WNPSM–EZW relationship.
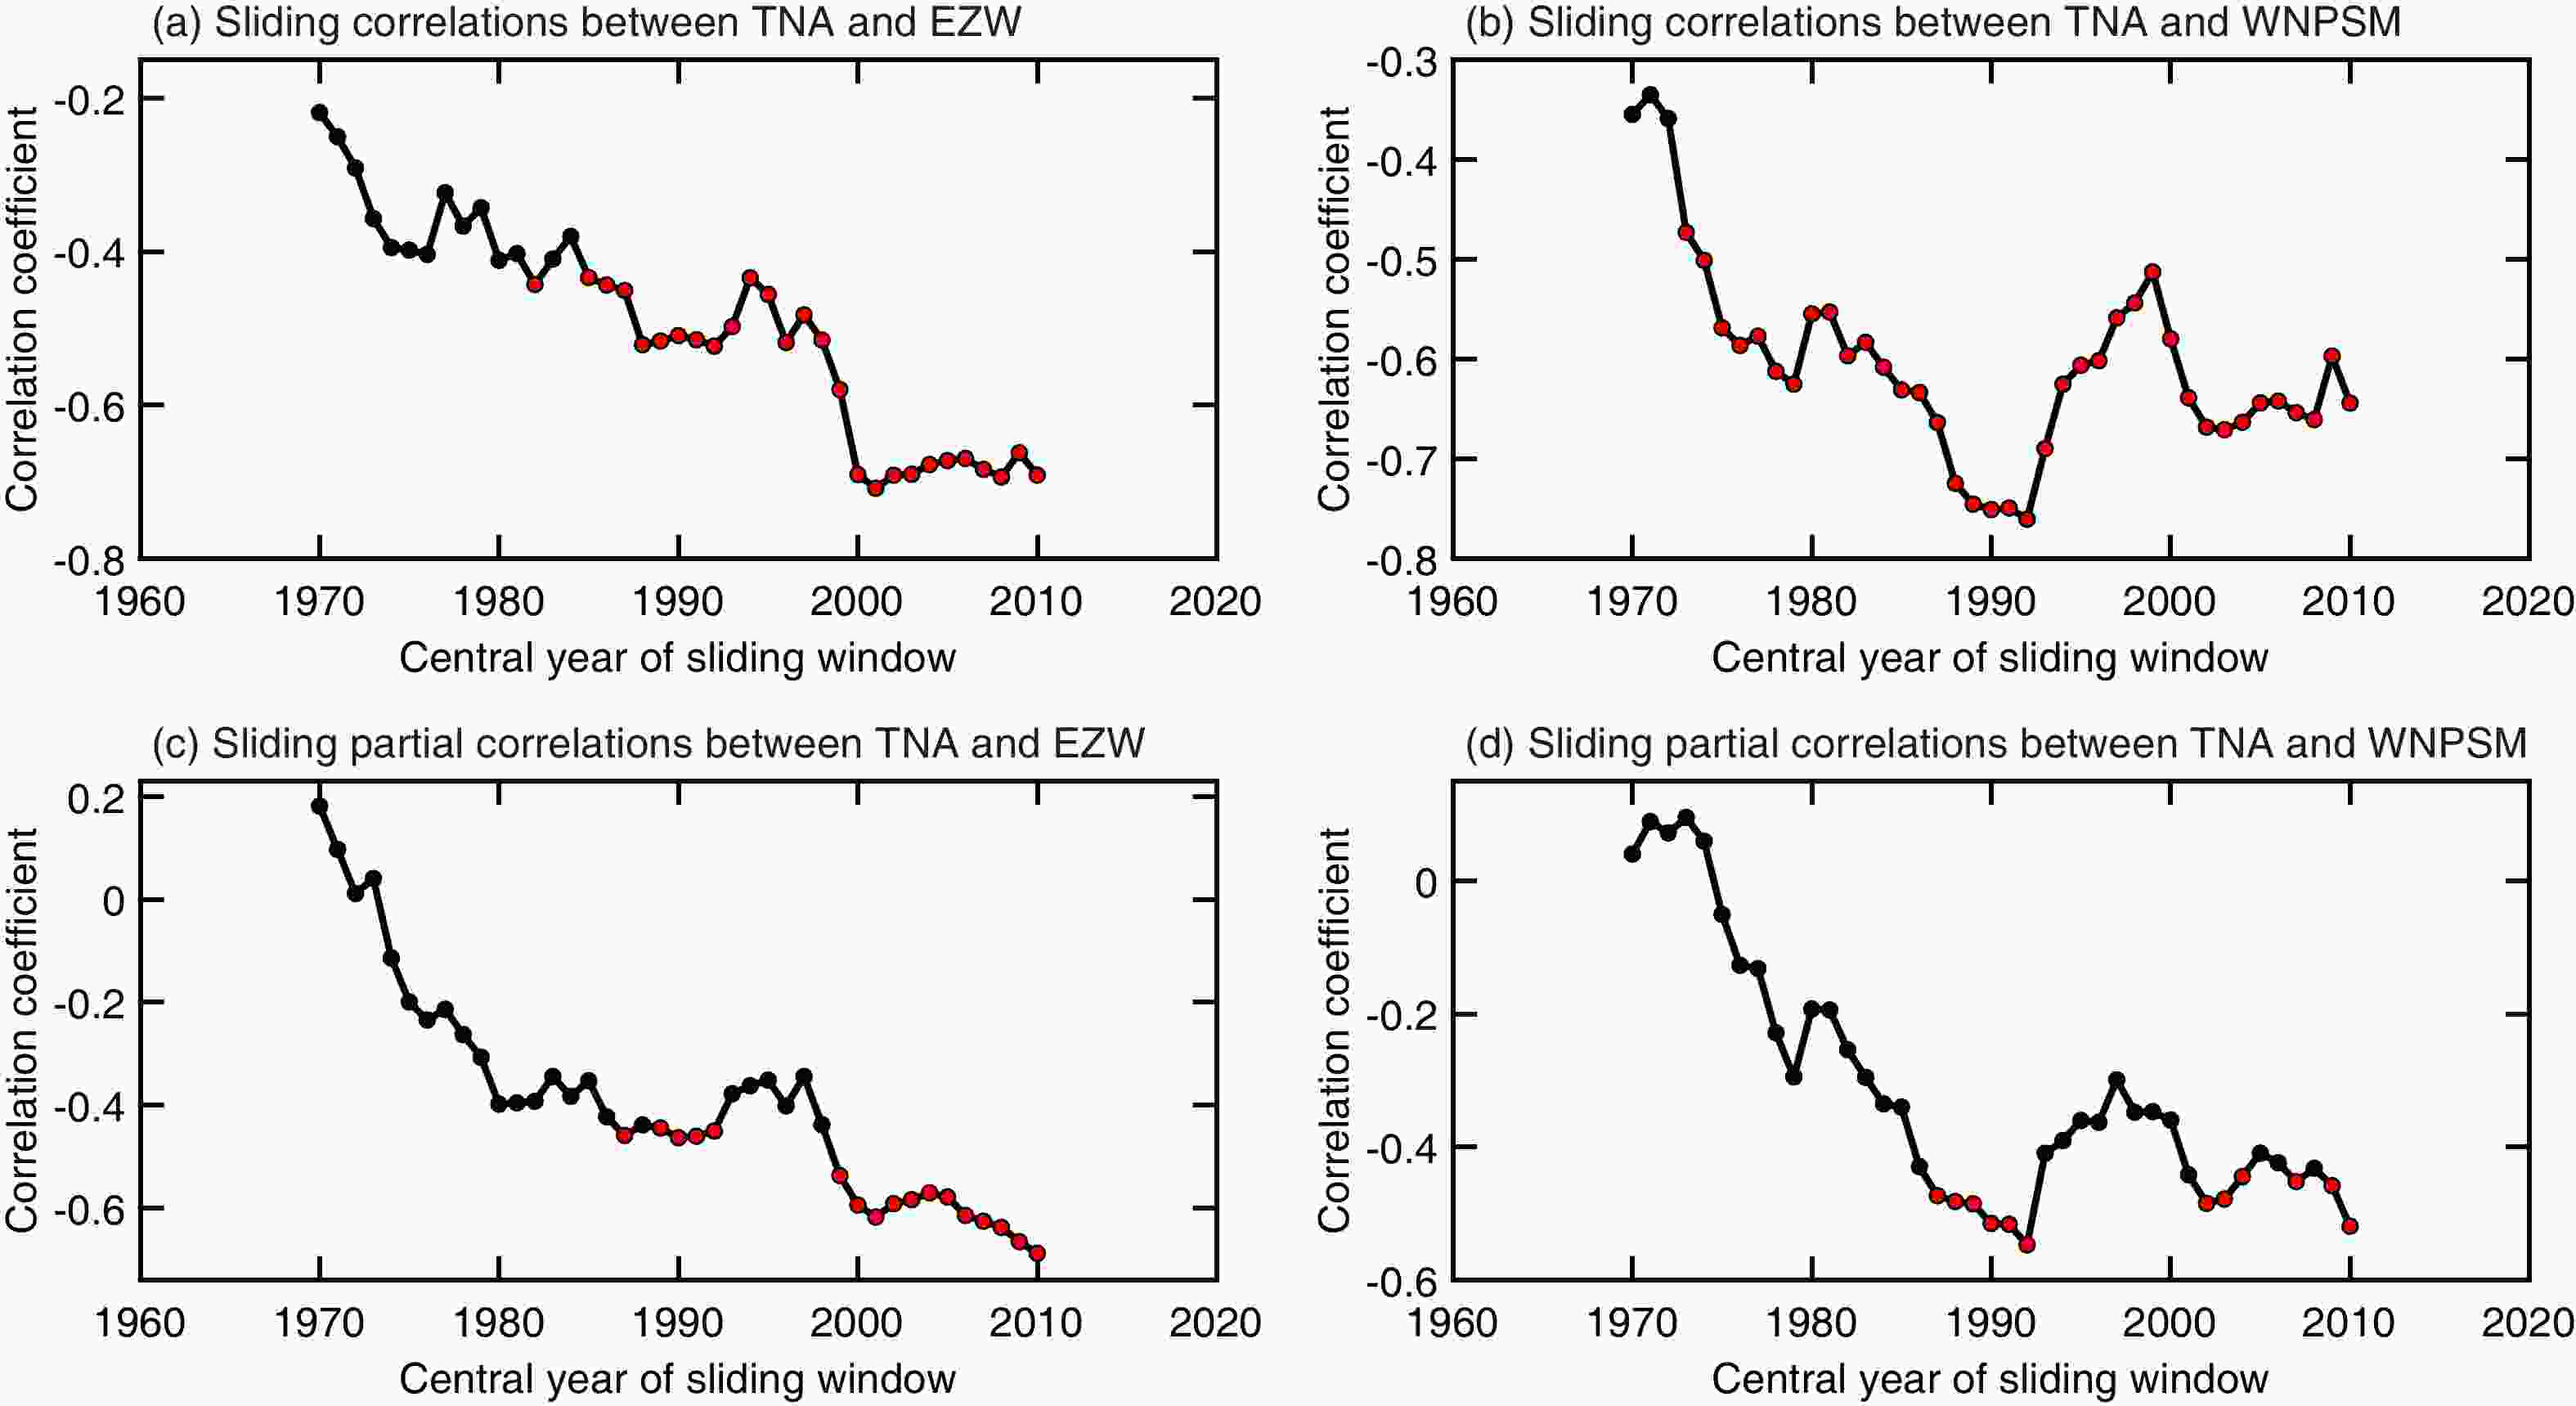
Figure 7. Possible influences of the springtime tropical North Atlantic SST anomalies on the WNPSM and the western Pacific EZW. Twenty-one-year sliding correlation coefficients with the springtime tropical North Atlantic SST are shown for (a) the western Pacific EZW index and (b) the WNPSM index. Twenty-one-year sliding partial correlations (with the influences of the previous winter Niño-3.4 index being removed) with the springtime tropical North Atlantic SST are shown for (c) the western Pacific EZW index and (d) the WNPSM index. The red dots indicate that the correlation is significant at the 95% confidence level.
How could the springtime tropical North Atlantic SST anomalies affect wind anomalies over the western Pacific? The cross-basin mechanism, via a subtropical teleconnection along the Intertropical Convergence Zone (ITCZ), may provide a way to relay the Atlantic signal to the Pacific (Ham et al., 2013; Wang et al., 2017), which is also supported by the results in Fig. 8. This subtropical teleconnection mechanism could only be at work during P2 (Figs. 8c, d) but not during P1 (Figs. 8a, b), a premise that is consistent with the results of Wang et al. (2017). During the spring, warm tropical North Atlantic SST anomalies could enhance the convection over the Atlantic ITCZ and thus initiate a Gill-type Rossby-wave response over the subtropical eastern Pacific (Fig. 8c), which then can trigger the following sequential evolution of subtropical and tropical Pacific air-sea coupled interactions. The cold SST anomalies in the subtropical eastern Pacific spreading southwestward toward the equatorial central Pacific could suppress the convection along the Pacific ITCZ and further excite a Gill-type Rossby-wave response over the western Pacific during the following summer (Fig. 8d). Through the above processes, both the anticyclonic circulation anomalies over the subtropical western Pacific and easterly equatorial anomalies over the western Pacific could be simultaneously triggered in the summer during P2 (Fig. 8d), thus giving rise to enhanced WNPSM–EZW co-variability.
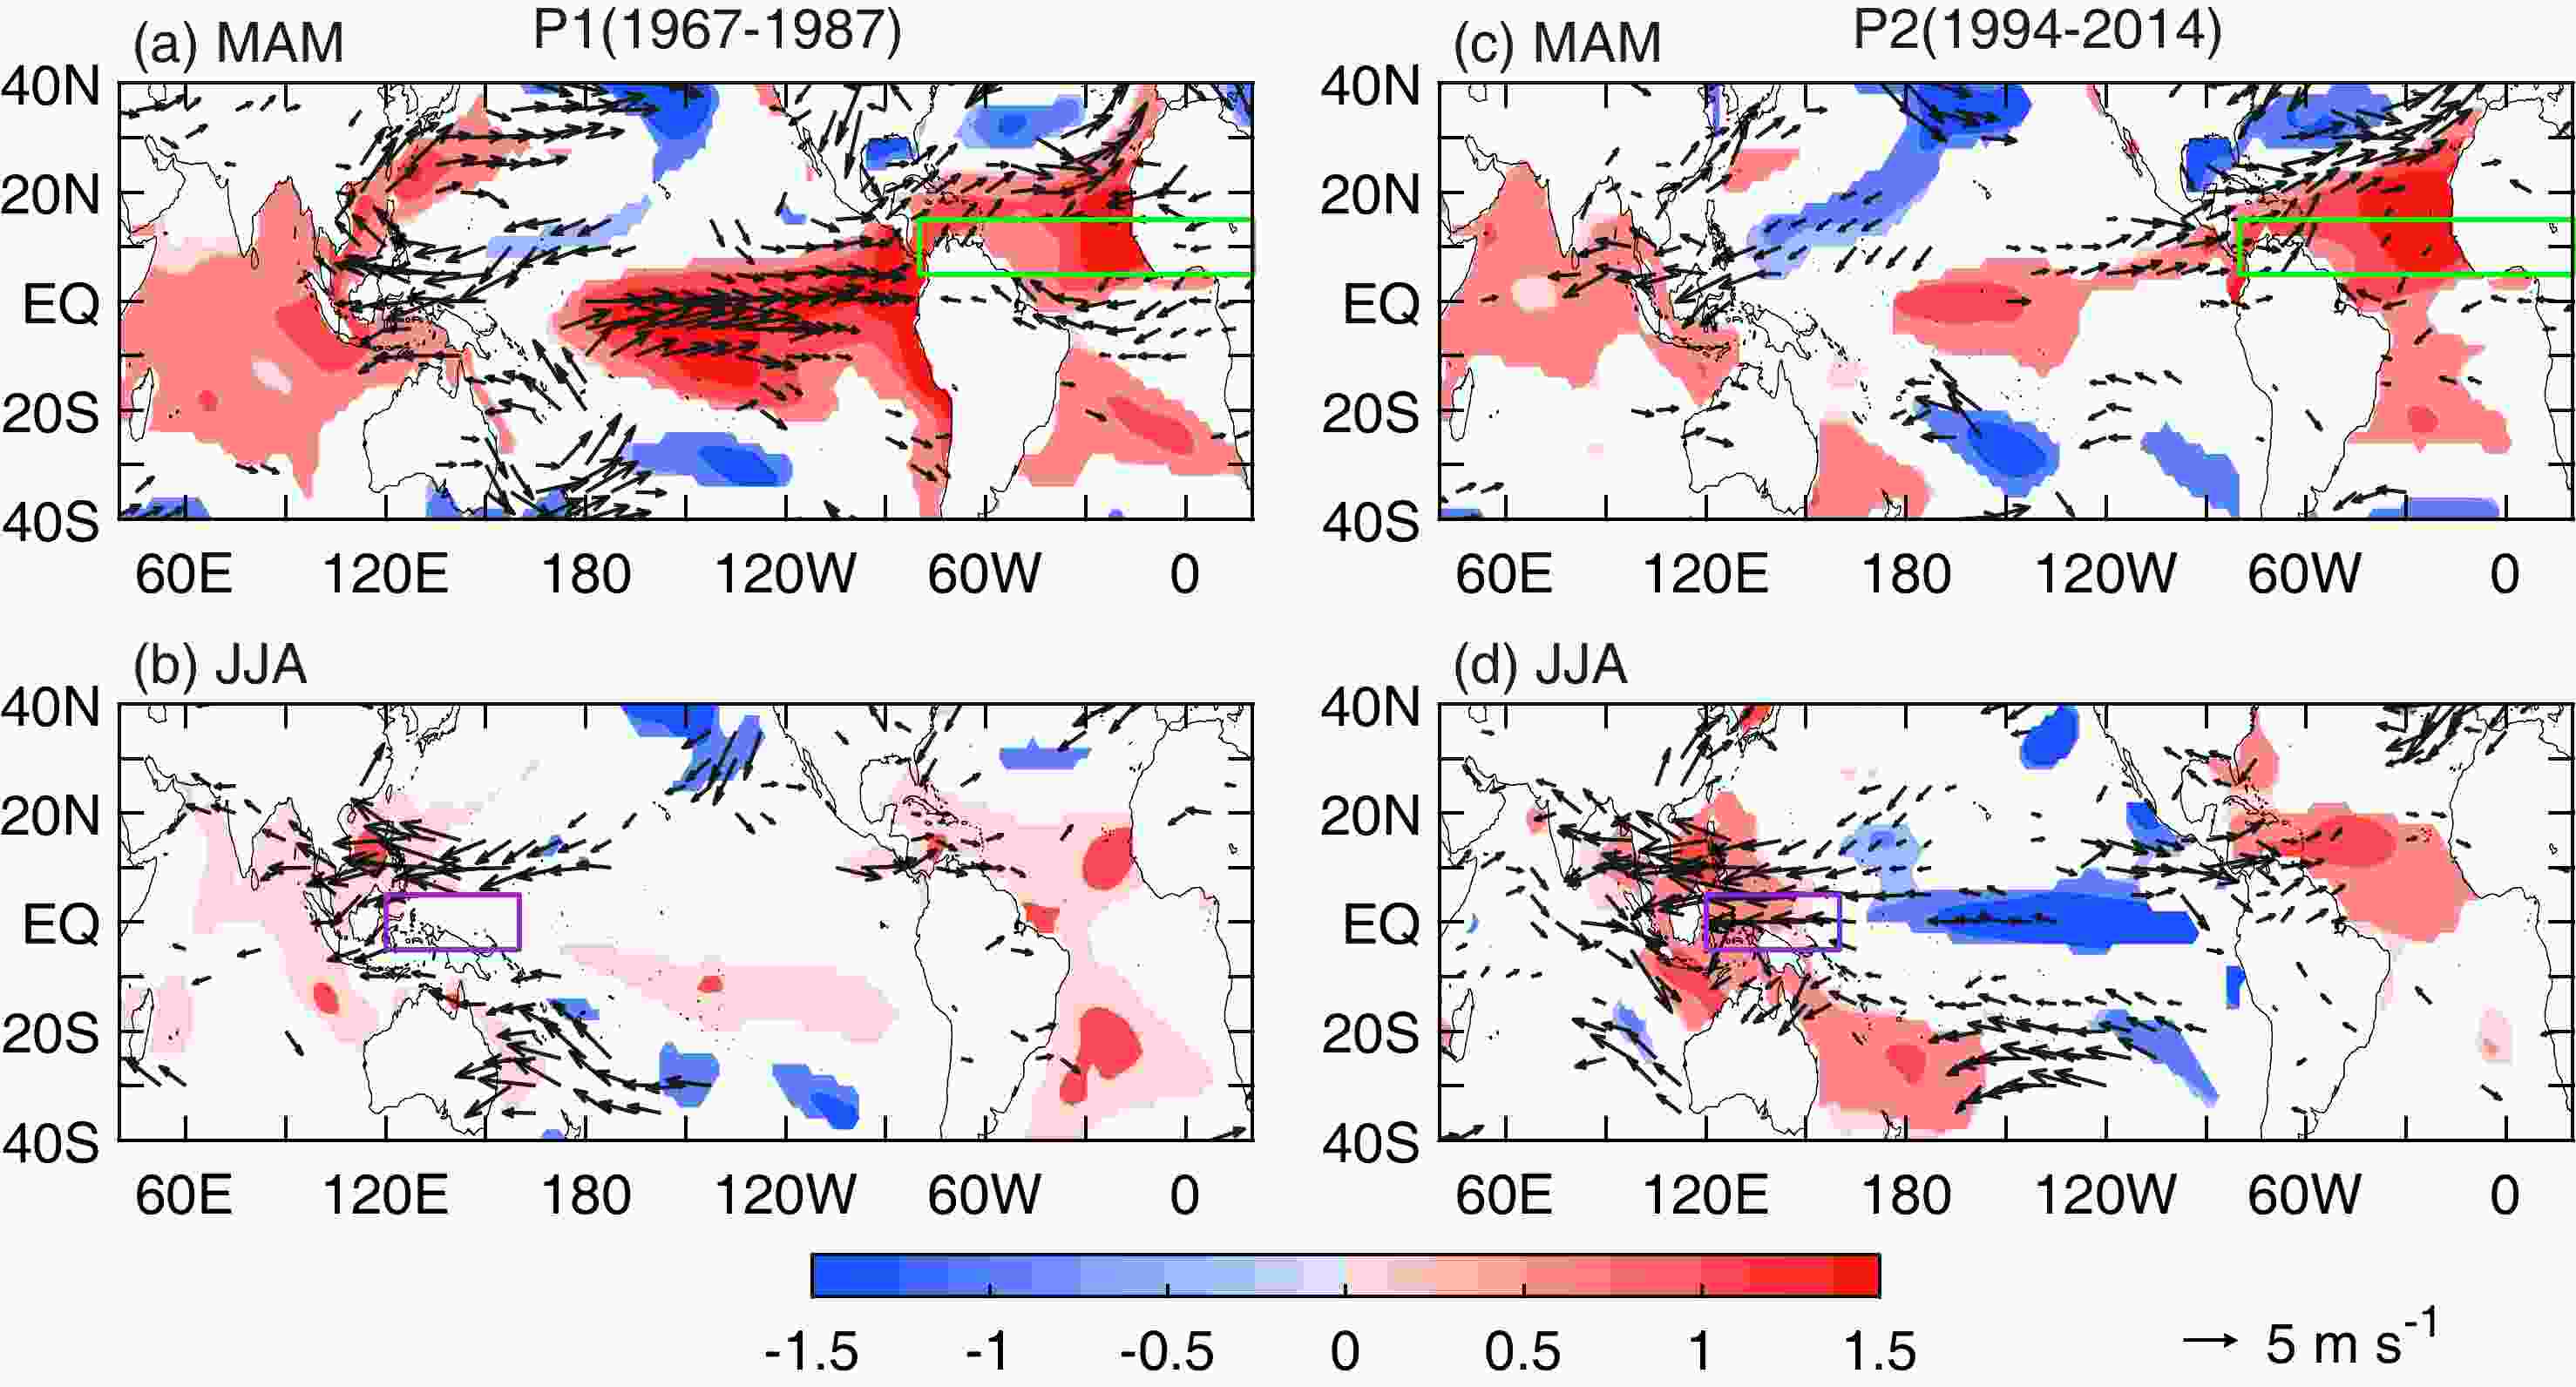
Figure 8. Regression with respect to the springtime tropical North Atlantic SST for 850-hPa wind anomalies [vector; m s–1 (°C)−1] and SST anomalies [shading; °C (°C)−1] during (a) MAM of P1, (b) JJA of P1, (c) MAM of P2, and (d) JJA of P2. Only values at or above the 90% confidence level are shown. The green boxes in (a) and (c) encompass the region that defines the tropical North Atlantic SST. The purple boxes in (b) and (d) encompass the region that defines the western Pacific EZW index.
How could the influences of the springtime tropical North Atlantic SST anomalies on wind anomalies over the western Pacific be at work only during P2 (Fig. 8d) but not during P1 (Fig. 8b)? Wang et al. (2017) suggested that the mean background changes in the tropical North Atlantic SST with the warmer SST after the early 1990s, due to the combined effect of the positive phase of AMO and the global warming trend, may provide a more favorable condition for relaying the Atlantic signal to the Pacific. The mean spring tropical North Atlantic SST was 0.38°C warmer in P2 than P1, which is also a possible reason for the differences in their cross-basin influences on wind anomalies over the western Pacific observed during these two periods.
Significant interdecadal changes could also be observed in the distribution of regressed JJA SST anomalies with respect to the springtime tropical North Atlantic SST (Figs. 8b, d). During P1, warm SST anomalies were evident from the tropical north Indian Ocean to the South China Sea roughly along the southwest-northeast direction (Fig. 8b). In contrast, during P2, cold SST anomalies occupied the equatorial central Pacific accompanied by warm SST anomalies in the maritime continent extending southeastward to the east of Australia (Fig. 8d). These observed changes in SST anomalies are very similar with the regressed SST anomalies with respect with the WNPSM as shown in Fig. 2, but with the opposite sign. According to these results, we believe that the faster decay of ENSO in the preceding winter triggered by the springtime north tropical Atlantic SST anomalies may be the reason for the obvious interdecadal transition of the JJA SST anomalies that influence the WNPSM, with stronger influences coming from SST anomalies in the tropical Indian Ocean (the equatorial central Pacific and maritime continent) during P1 (P2). The decadal fluctuation of the springtime tropical North Atlantic SST could be closely associated with the AMO (Wang et al., 2017). The springtime tropical North Atlantic SST may be the potential driver for the decadal shift of the influences from the summertime tropical central Pacific and maritime continent SST anomalies, as shown in Fig. 4.
We further examined the simulated WNPSM–EZW relationship in the CMIP6 models (Fig. 9). Based on Fig. 9a, the correlation coefficients between the JJA WNPSM index and the JJA EZW index range from 0.40 to 0.81 among the 20 models, which are all lower than the observed value (0.88). This suggests a large spread in the simulated WNPSM–EZW connection in these CMIP6 models. In addition, a model's ability to simulate the WNPSM–EZW connection is closely related to its ability to capture the relationship between the MAM tropical North Atlantic SST and the JJA WNPSM index (Fig. 9b), between the JJA maritime continent SST and the JJA WNPSM index (Fig. 9c), and between the JJA Niño-3.4 SST and the JJA WNPSM index (Fig. 9d). This suggests that a model with stronger influences from the MAM tropical North Atlantic, JJA maritime continent, and Niño-3.4 SST anomalies on the WNPSM index tends to produce a closer WNPSM–EZW connection. These conclusions based on CMIP6 models are consistent with the observed results during P2.
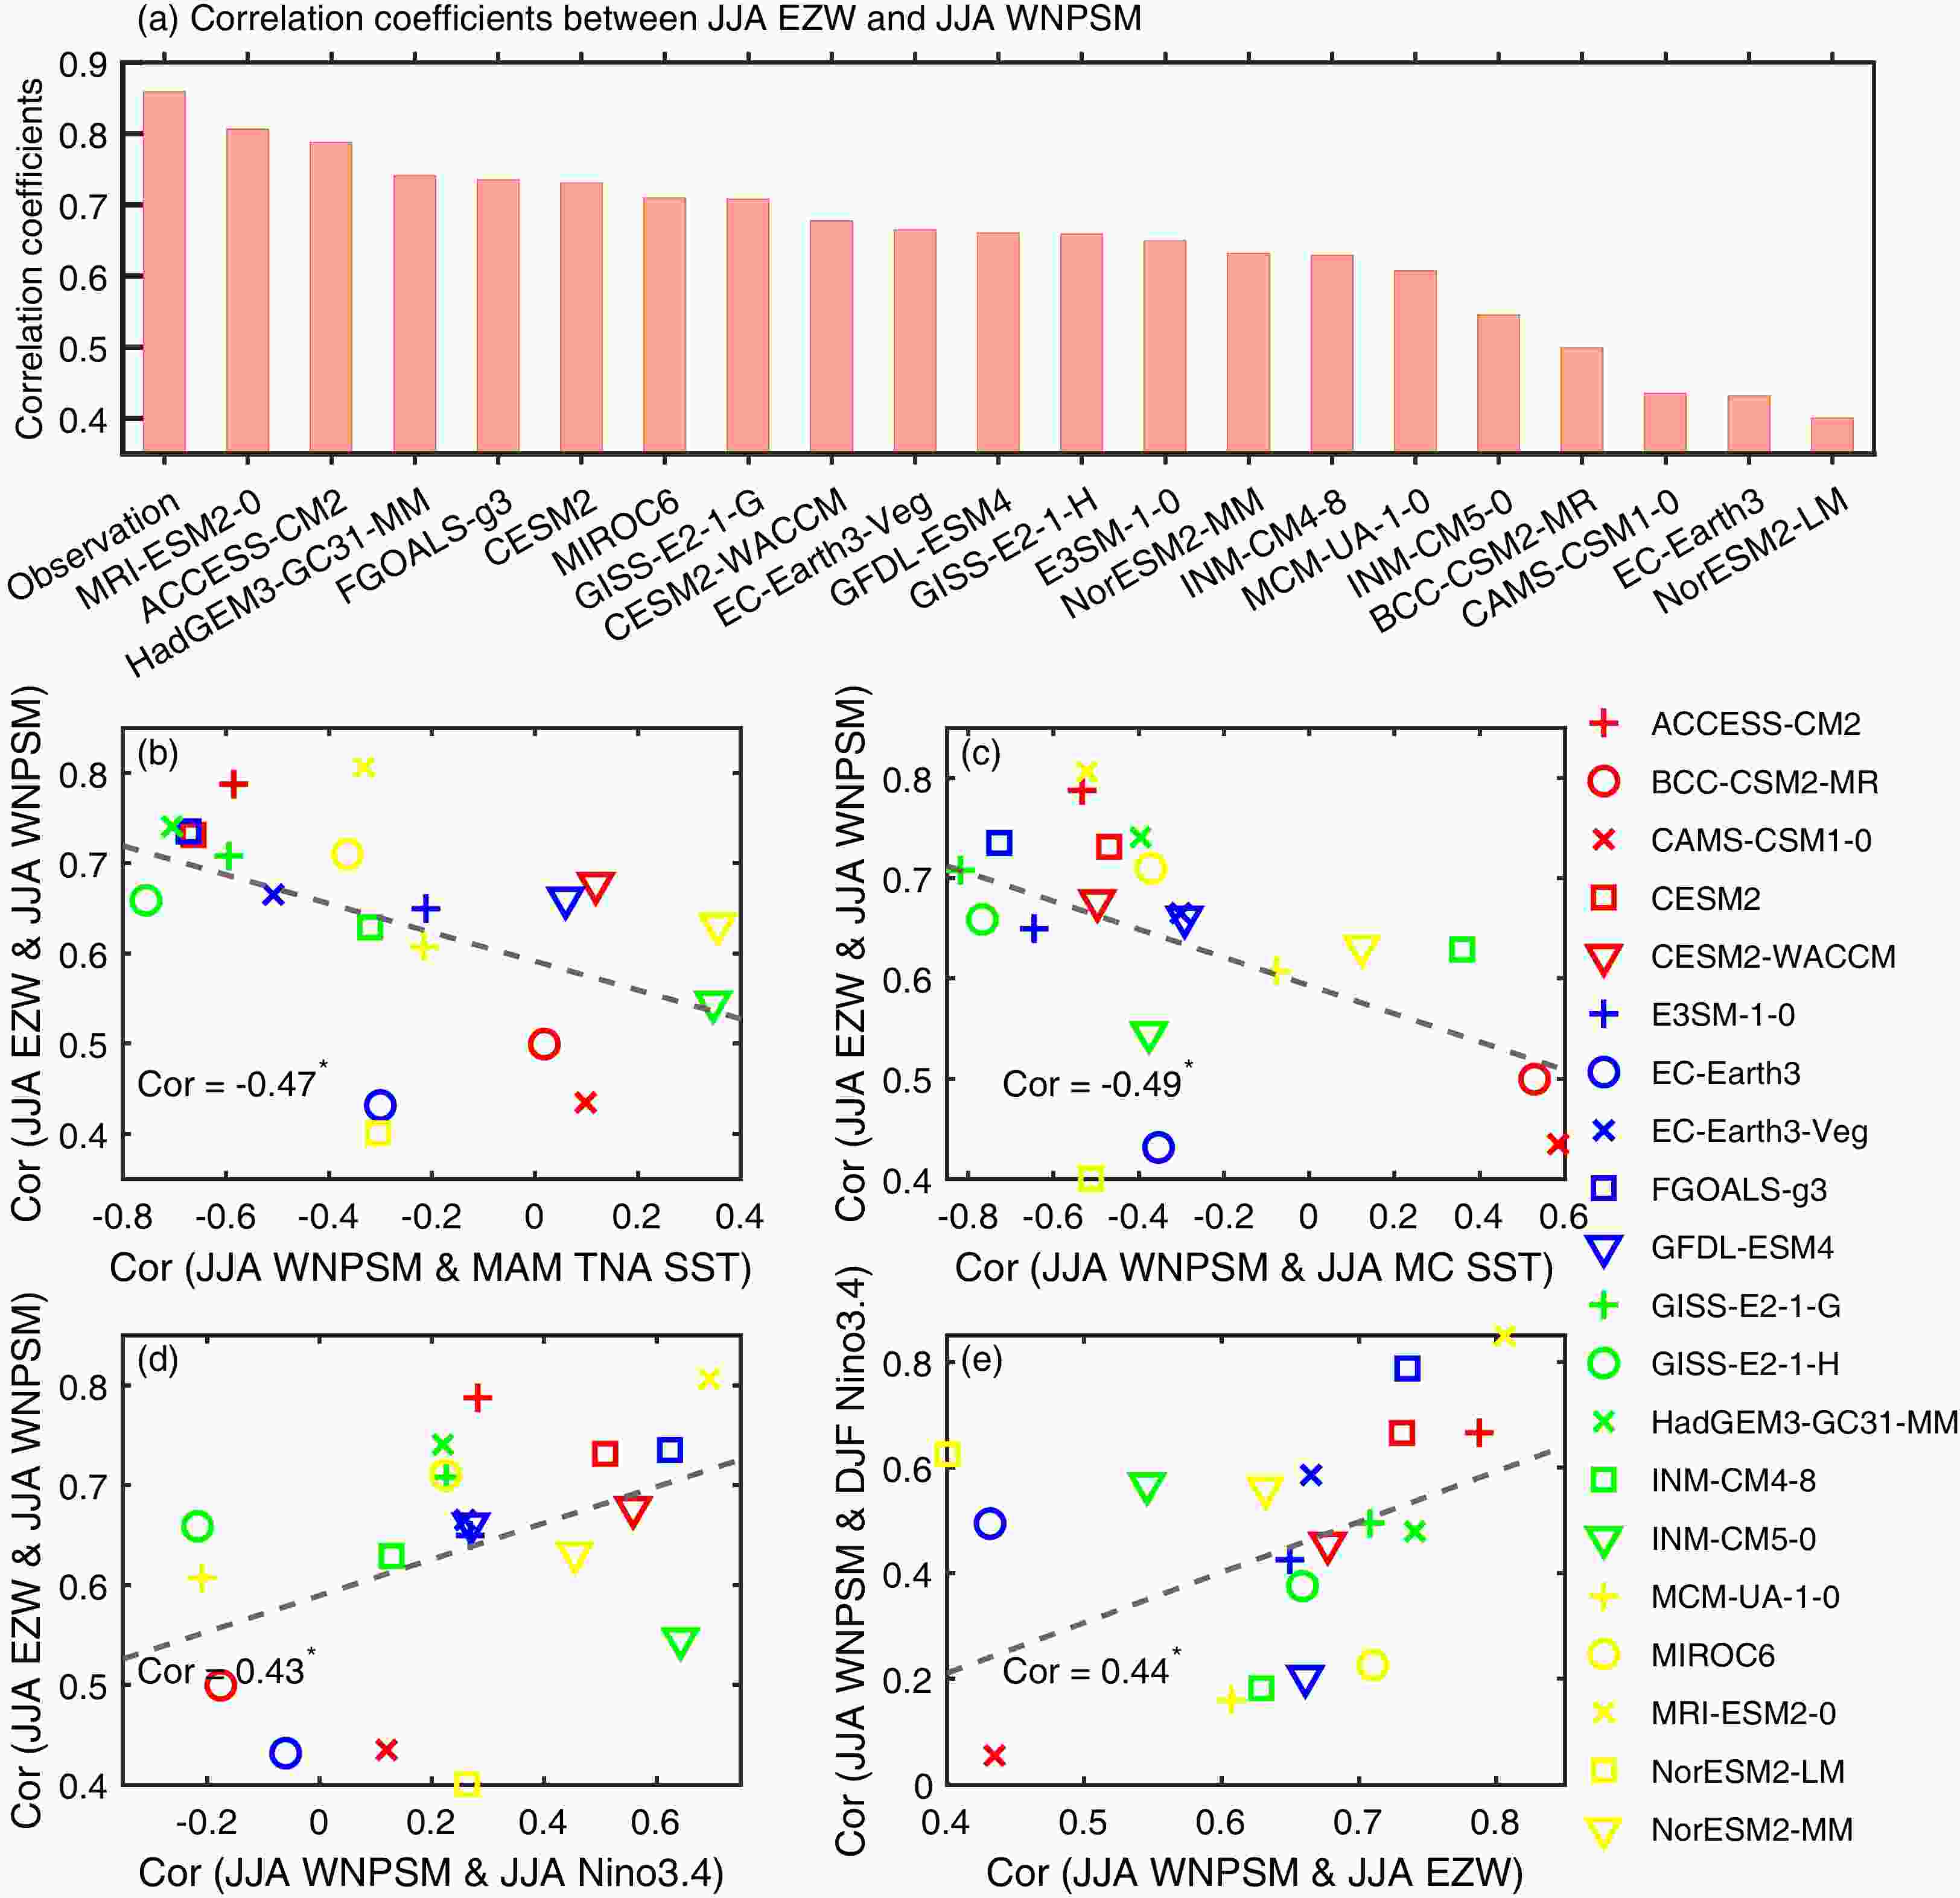
Figure 9. (a) Correlation coefficients between the JJA WNPSM index and the JJA EZW index in the observation and the 20 individual CMIP6 models over 1994–2014. Scatterplots of the correlation coefficients between the JJA WNPSM index and the JJA EZW index against (b) the correlation coefficients between the JJA WNPSM index and the MAM tropical North Atlantic SST, (c) the correlation coefficients between the JJA WNPSM index and the JJA maritime continent SST, (d) the correlation coefficients between the JJA WNPSM index and the JJA Niño-3.4 SST, and (e) the correlation coefficients between the JJA WNPSM index and the following DJF Niño-3.4 SST.
Based on the above results, the changes in SST configurations across the tropical oceans were considered able to contribute to the recent WNPSM–EZW synchronization. The enhanced influence from the springtime tropical North Atlantic, summertime tropical central Pacific, and maritime continent SST anomalies have the potential to work together to contribute to the recently intensified WNPSM–EZW co-variability.
-
The observed strengthening of WNPSM–EZW co-variability may profoundly impact the climate system. In this section, some possible climatic consequences due to the recent enhancement of the WNPSM–EZW co-variability are demonstrated, including the prompting of more effective feedback from the WNPSM on subsequent ENSO evolution and the boosting of a stronger biennial tendency for the WNPSM–ENSO coupled system.
-
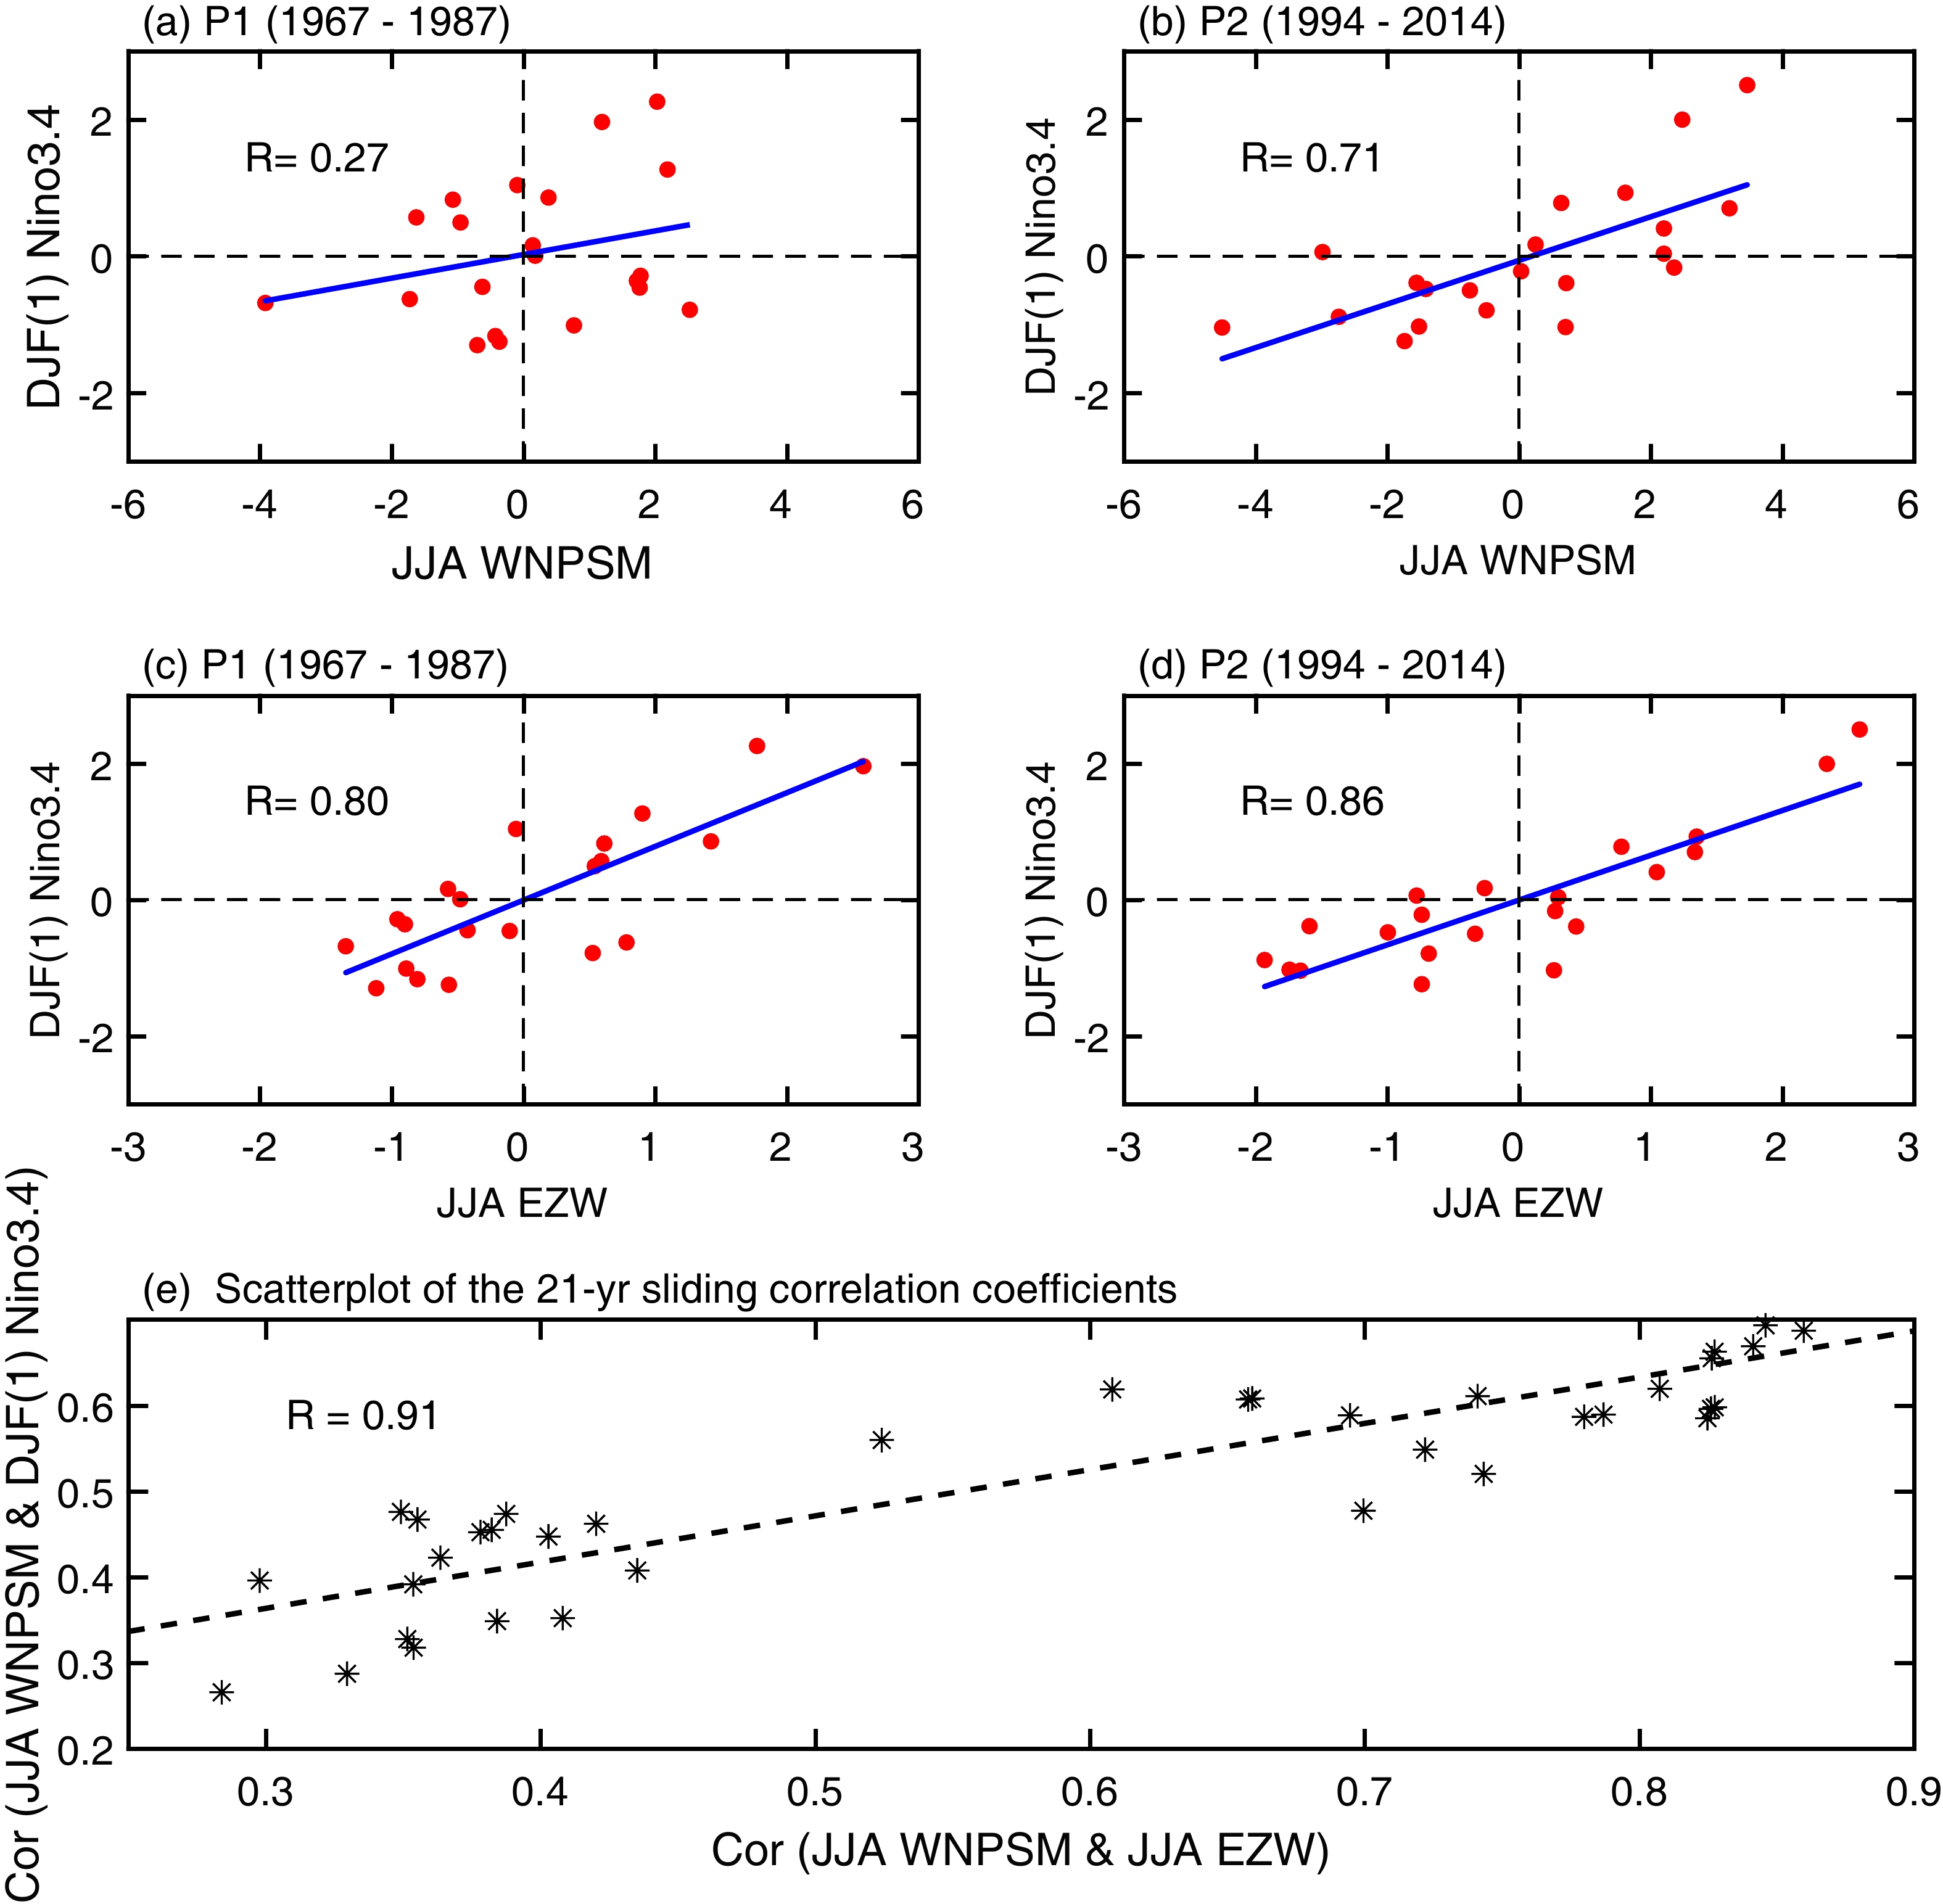
There were obvious differences in the relationship between the WNPSM index and the Niño-3.4 index in the following winter in P1 (Fig. 10a) and P2 (Fig. 10b). The correlation coefficient between the WNPSM index and the subsequent winter Niño-3.4 index was not significant at a 90% confidence level (with a value of 0.27) in P1, but was boosted into significance with a value as high as 0.71 in P2. These results indicate that a strong (weak) WNPSM tended to be followed by a warm (cold) anomaly of the ENSO in the subsequent winter in P2.
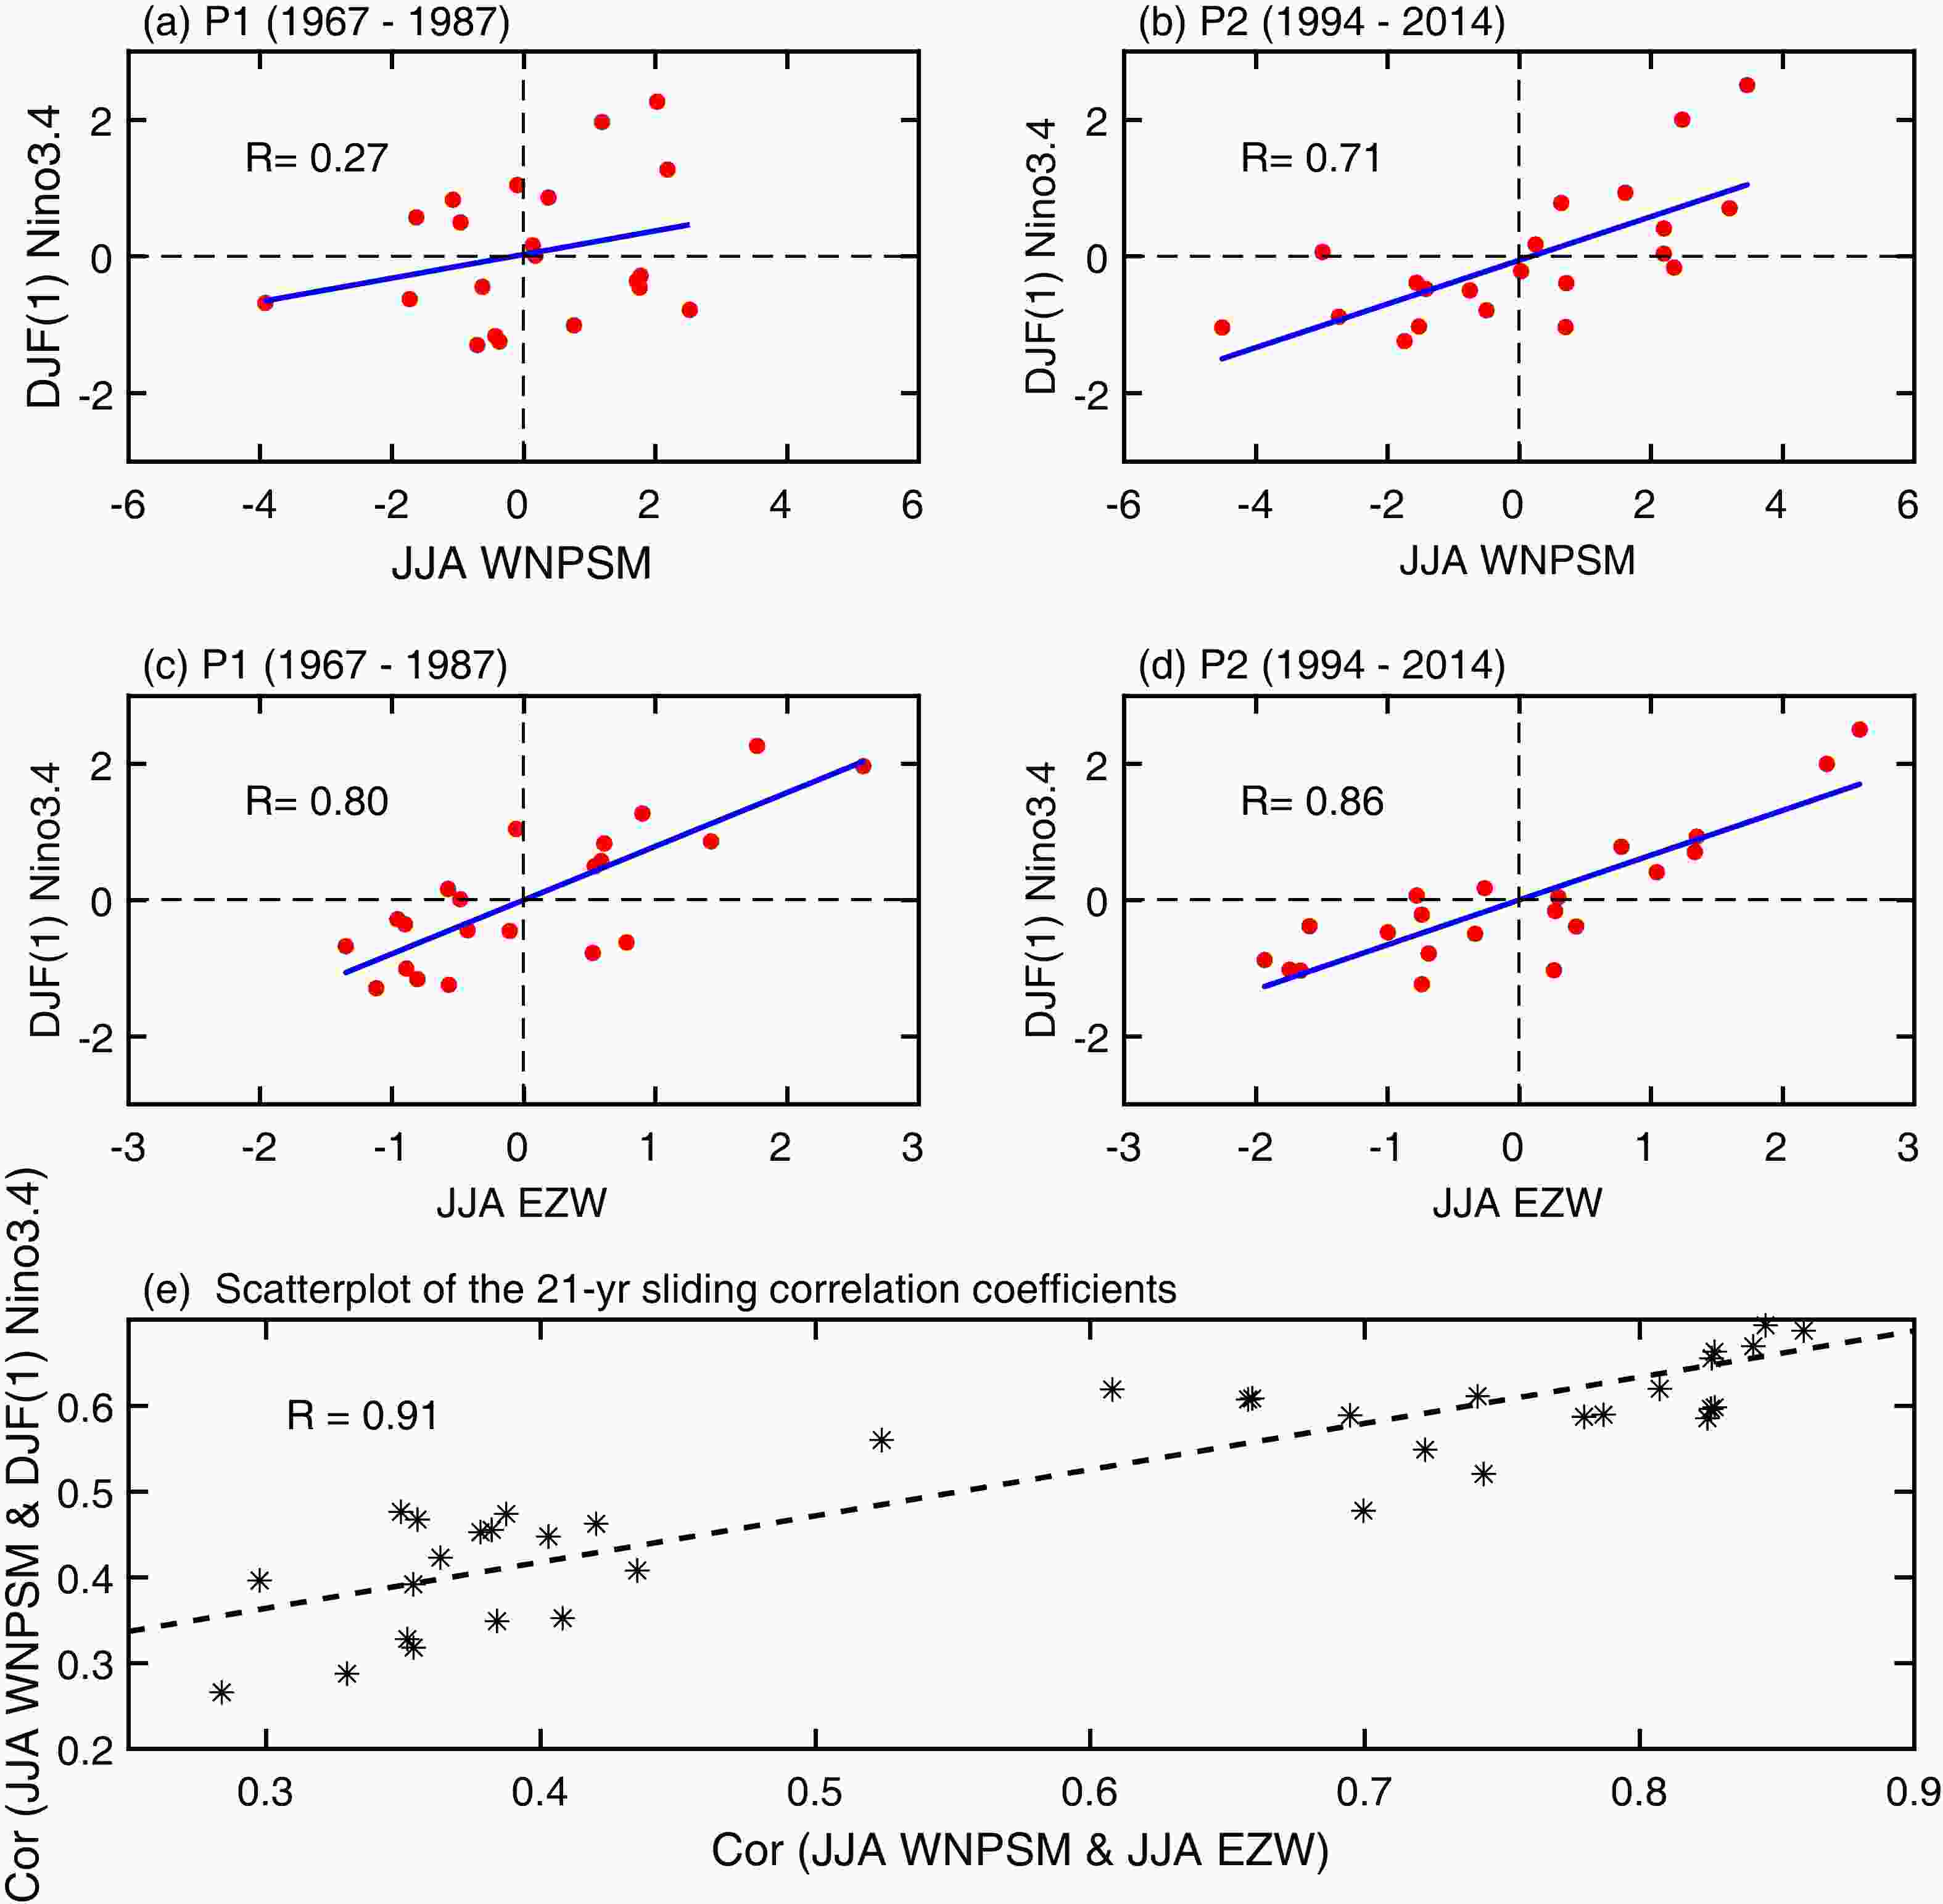
Figure 10. Scatterplots of the JJA WNPSM index versus the subsequent DJF Niño-3.4 index for the years in (a) P1 (1967–87) and (b) P2 (1994–2014). Scatterplots of the JJA western Pacific EZW index versus the subsequent DJF Niño-3.4 index for the years in (c) P1 (1967–87) and (d) P2 (1994–2014). (e) Scatterplot of the 21-yr sliding correlation coefficients between the WNPSM index and the western Pacific EZW index and those between the WNPSM index and the subsequent winter Niño-3.4 index.
Why were different relationships between the WNPSM and the subsequent ENSO in the following winter observed? The WNPSM–EZW linkage may affect the feedback of the monsoon upon subsequent ENSO evolution, thus leading to different relationships between the WNPSM and the subsequent ENSO of the following winter for the two periods. Direct comparisons reveal a close relationship between the WNPSM–EZW correlation and the correlation between the WNPSM and the subsequent winter Niño-3.4 index (Fig. 10e). These results indicate that the relationship between the WNPSM and the subsequent winter Niño-3.4 index may largely depend on the strength of the WNPSM–EZW linkage. A stronger (weaker) correlation between the WNPSM index and the subsequent winter Niño-3.4 index tended to occur when the WNPSM and the western Pacific EZW were more (less) closely linked. Therefore, a closer WNPSM–EZW linkage may support a closer WNPSM–ENSO relationship.
The EZW in the lower troposphere over the western Pacific may play a critical role in ENSO phase transition (Weisberg and Wang, 1997; Wang et al., 1999; Kim and Lau, 2001; Huang et al., 2001; Kug and Kang, 2006), by triggering equatorial oceanic Kelvin waves and thermocline adjustment. Significant positive correlations between the JJA western Pacific EZW index and the subsequent DJF Niño-3.4 index could be identified during both P1 (Fig. 10c) and P2 (Fig. 10d), indicating that the modulating effects from the western Pacific EZW on the following ENSO evolution may be at work in both periods. Thus, the enhanced WNPSM–EZW linkage during P2 (Fig. 1d) may support an intensified relationship between the WNPSM and the Niño-3.4 index of the following winter (Fig. 10b). However, the WNPSM and western Pacific EZW were not closely linked during P1 (Fig. 1c), thus leading to the weak relationship between the WNPSM index and the following winter’s Niño-3.4 index (Fig. 10a).
Next, we further compare the characteristic differences of the equatorial oceanic Kelvin waves possibly triggered by the WNPSM wind anomalies during the two periods by calculating the regressed KWF [Eq. (1)] with respect to the WNPSM index (Fig. 11). The KWF could reflect the response of the equatorial oceanic Kelvin wave anomalies to the zonal winds and their seasonal evolutionary process. The positive (negative) value of KWF indicates that the forcing from surface zonal wind stress anomalies may trigger downwelling (upwelling) oceanic equatorial Kelvin waves and further prompt warm (cold) SST anomalies (Battisti, 1988; Vimont et al., 2003; Chen et al., 2020b). During the previous winter, the calculated results show that negative values of KWF occurred in the equatorial eastern Pacific in both P1 (Fig. 11a) and P2 (Fig. 11f). These negative values of KWF mean that upwelling oceanic Kelvin waves may be stimulated, which is conducive to the SST cooling in the equatorial eastern Pacific. These results are consistent with the La Niña event that was observed in the previous winter (Figs. 5a, f). In the following spring, the KWF began to change to positive values (Fig. 11g), which may be mainly affected by the westerly wind anomalies over the western Pacific (Fig. 5g). The positive KWF may be conducive to the excitation of eastward-propagating warm oceanic Kelvin waves. During the summer, positive KWF anomalies could be observed from the western equatorial Pacific to the central equatorial Pacific in both periods (Figs. 11c, h). However, the positive KWF anomalies during the P1 years did not persist into the following seasons, and any significant positive KWF anomalies had almost completely disappeared by the following autumn (Fig. 11d). In contrast, during the P2 years, significant positive KWF anomalies were able to persist and even be prolonged until the following winter, as they tended to gradually propagate eastward over time (Figs. 11i, j).
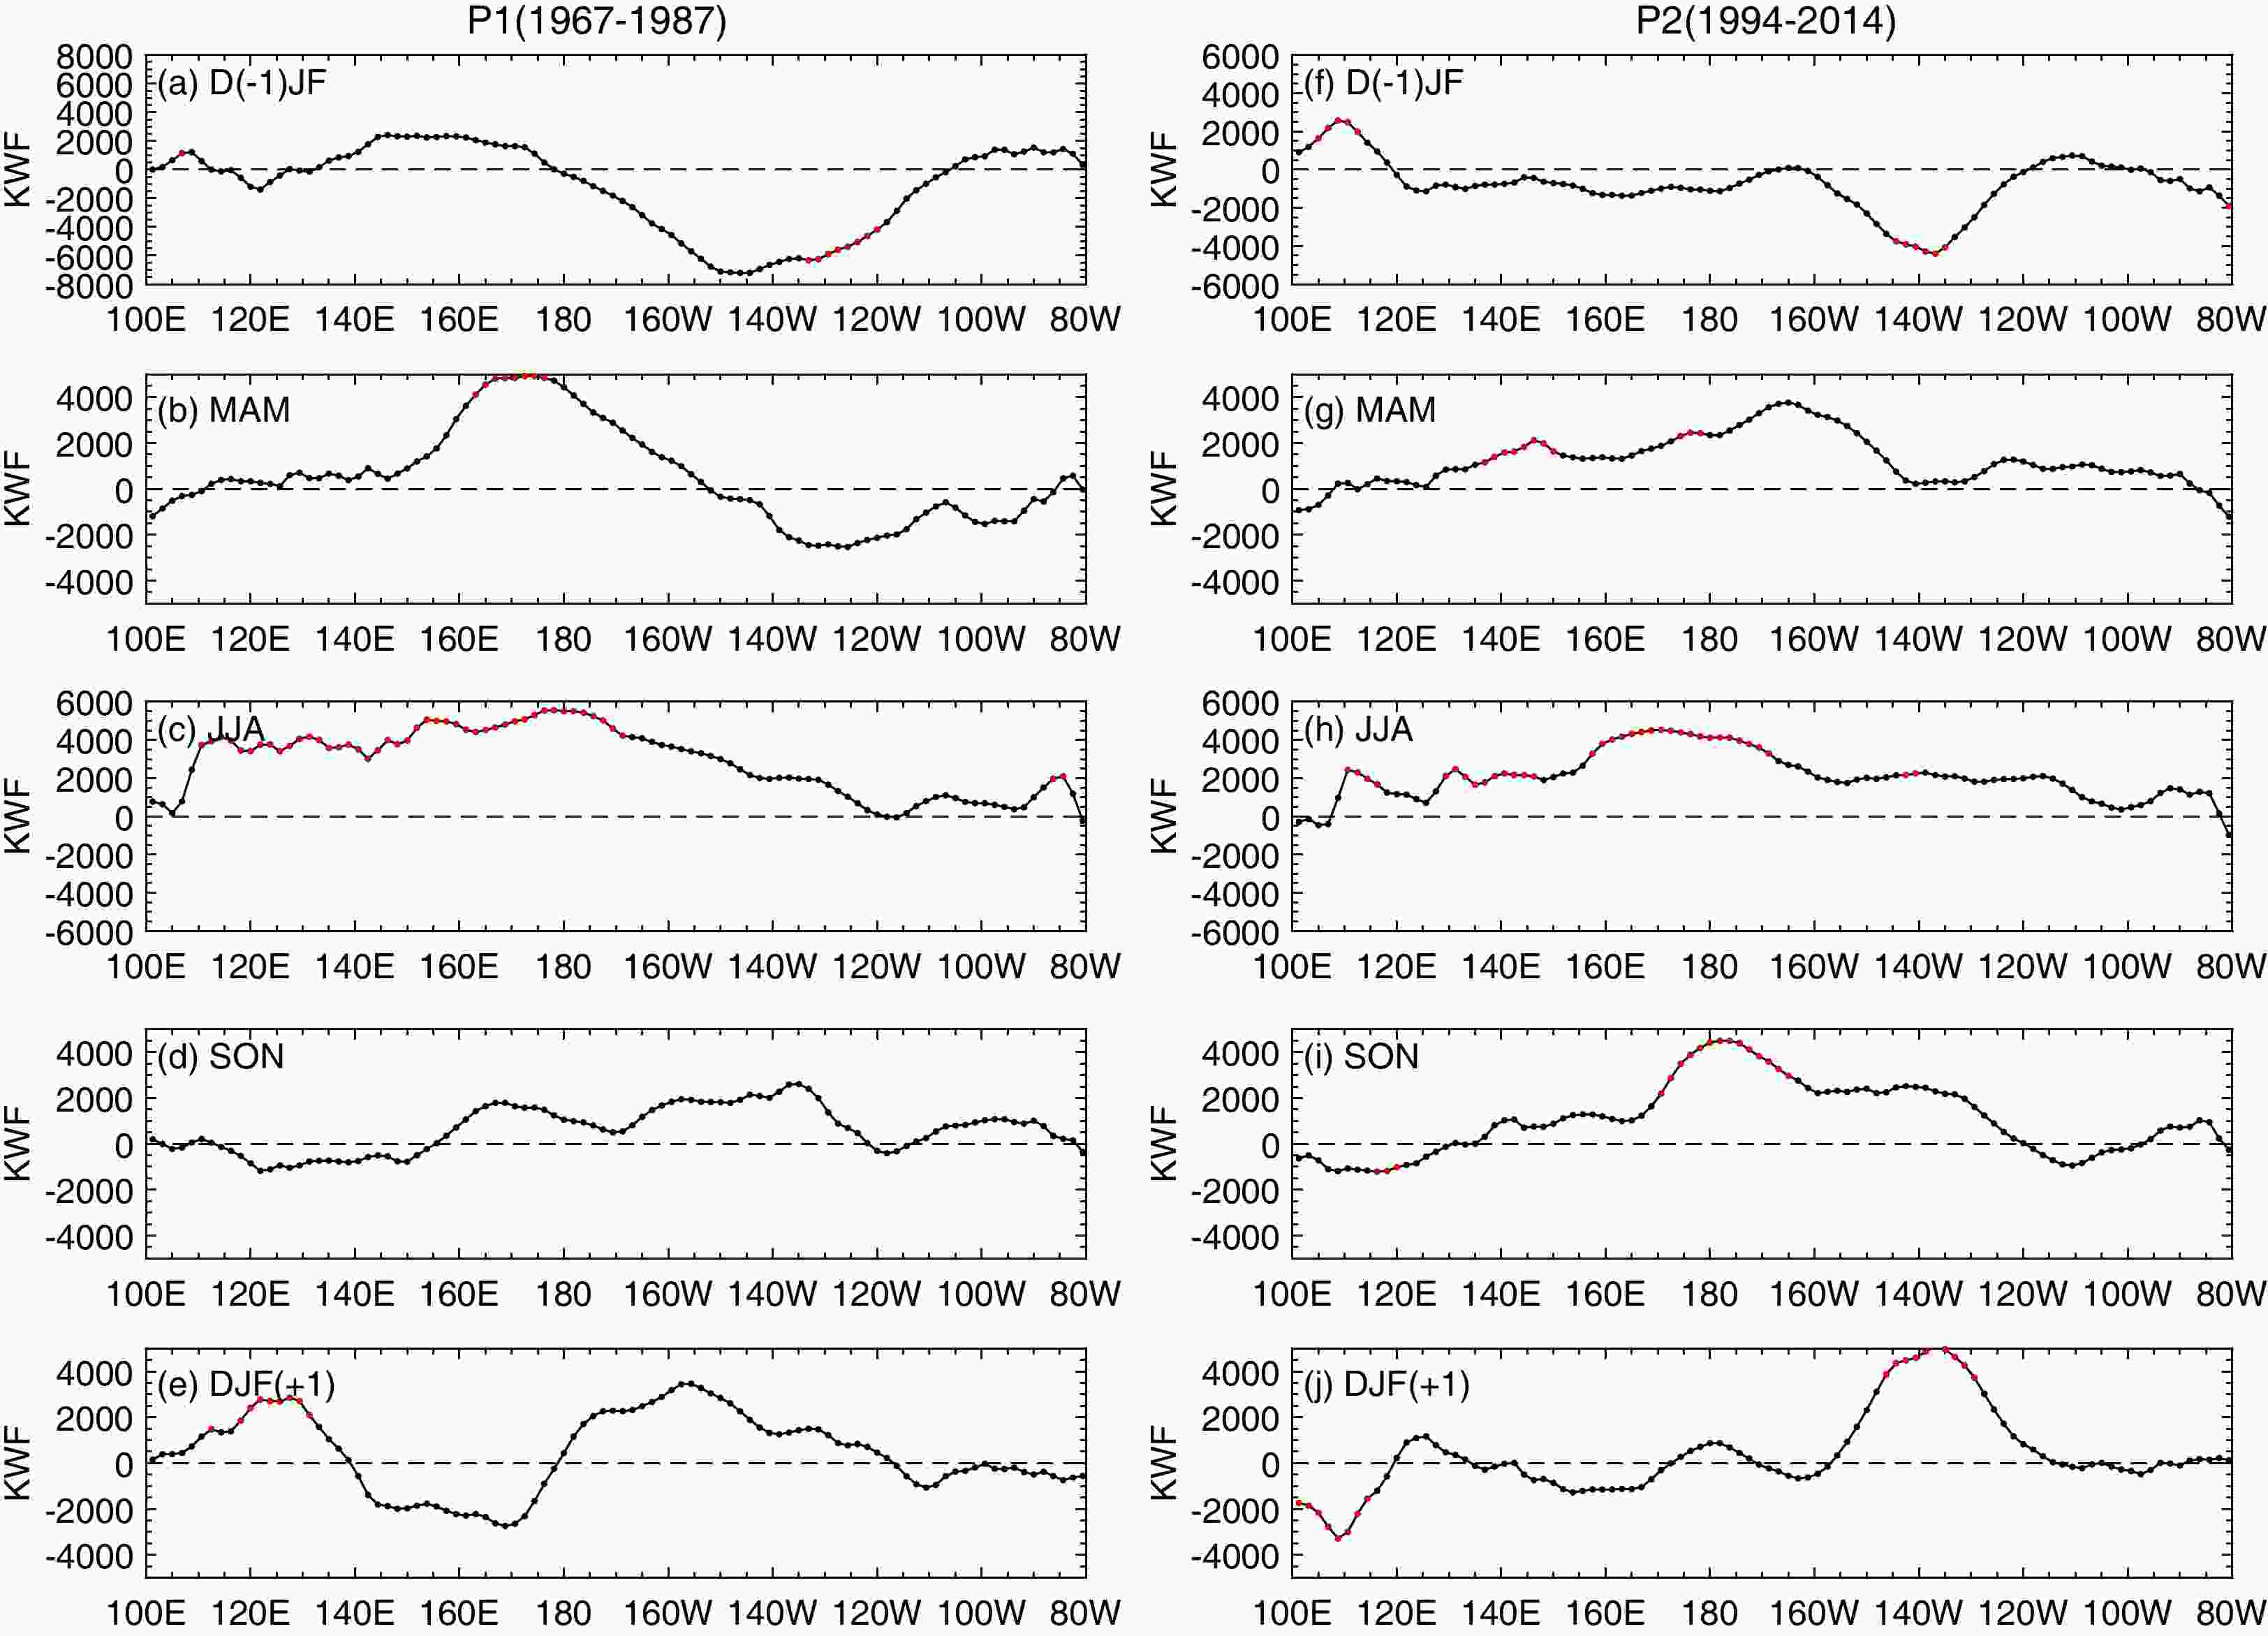
Figure 11. Zonal distributions of the regressed KWF [N m–1 (m s–1)-1] with respect to the WNPSM index from the previous boreal winter [D(–1)JF] to the subsequent boreal winter [DJF(+1)] during (a–e) P1 and (f–j) P2. The red dots denote the value exceeding the 95% confidence level.
These results show that there were no obvious propagation signals of an equatorial oceanic Kevin wave during P1, which may be due to the weak equatorial westerly anomalies associated with the WNPSM during this period (Fig. 2a). However, during the P2 period, the wind anomalies associated with the WNPSM had shifted southward and expanded to the equatorial region with obviously stronger westerly anomalies in the equatorial region (Fig. 2b), which could stimulate warm equatorial oceanic Kelvin waves to propagate eastward along the equator. The differences in the Kelvin wave propagation signals could also be observed for the typical years in P1 and P2 (Fig. S1 in the ESM). The warm oceanic Kelvin wave signal during P2 could further affect subsequent ENSO evolution and be conducive to the occurrence of an El Niño event in the following winter (Fig. 5j). This process supports a stronger positive correlation between the WNPSM index and the Niño-3.4 index in the following winter (Fig. 10b). However, during P1, the relevant ZEW anomalies failed to stimulate significant oceanic Kelvin wave signals, resulting in a much weaker correlation between the WNPSM index and the Niño-3.4 index of the following winter (Fig. 10a), during which time an El Niño event was absent (Fig. 5e). Therefore, the observed recently strengthened WNPSM–EZW co-variability may promote stronger feedback from the WNPSM onto the subsequent ENSO evolution in P2.
Based on the results of CMIP6 models, a model's ability to simulate the connection between the JJA WNPSM and the subsequent DJF Niño-3.4 index has a close relationship to its ability to capture the WNPSM–EZW connection (Fig. 9e). A model with a closer WNPSM–EZW connection tends to produce a stronger correlation between the JJA WNPSM and the subsequent DJF Niño-3.4 index (Fig. 9e). These conclusions based on CMIP6 models are consistent with the observed results for the P2 years.
-
In the following development, the possible changes in the biennial tendency and biennial variability of the WNPSM–ENSO system are compared in the two periods of P1 and P2. To quantify the strength of the biennial relationship between the WNPSM and the ENSO, we define a biennial relationship index (BRI), following Wang and Yu (2018), as follows:
Here, Cor1 (Cor2) is the 21-yr sliding correlation coefficient between the JJA WNPSM index and the subsequent DJF Niño-3.4 index (the DJF Niño-3.4 index and the following JJA WNPSM index). According to Fig. 12a, there is a negative correlation between the previous winter’s Niño-3.4 index and the WNPSM index of the following summer, which could be considered an out-of-phase transition. Meanwhile, there is a positive correlation between the summer WNPSM index and the following winter’s Niño-3.4 index, which could be considered an in-phase transition. The biennial relationship represents the combination of an out-of-phase transition (i.e., a negative correlation coefficient) and an in-phase transition (i.e., a positive correlation coefficient). When the biennial relationship is strong, Cor1 and Cor2 should tend to be of opposite signs (one is positive and the other negative). Therefore, Eq. (2) distributes a −1, to ensure that a larger positive BRI value could be obtained when the biennial relationship between the WNPSM and ENSO is stronger.
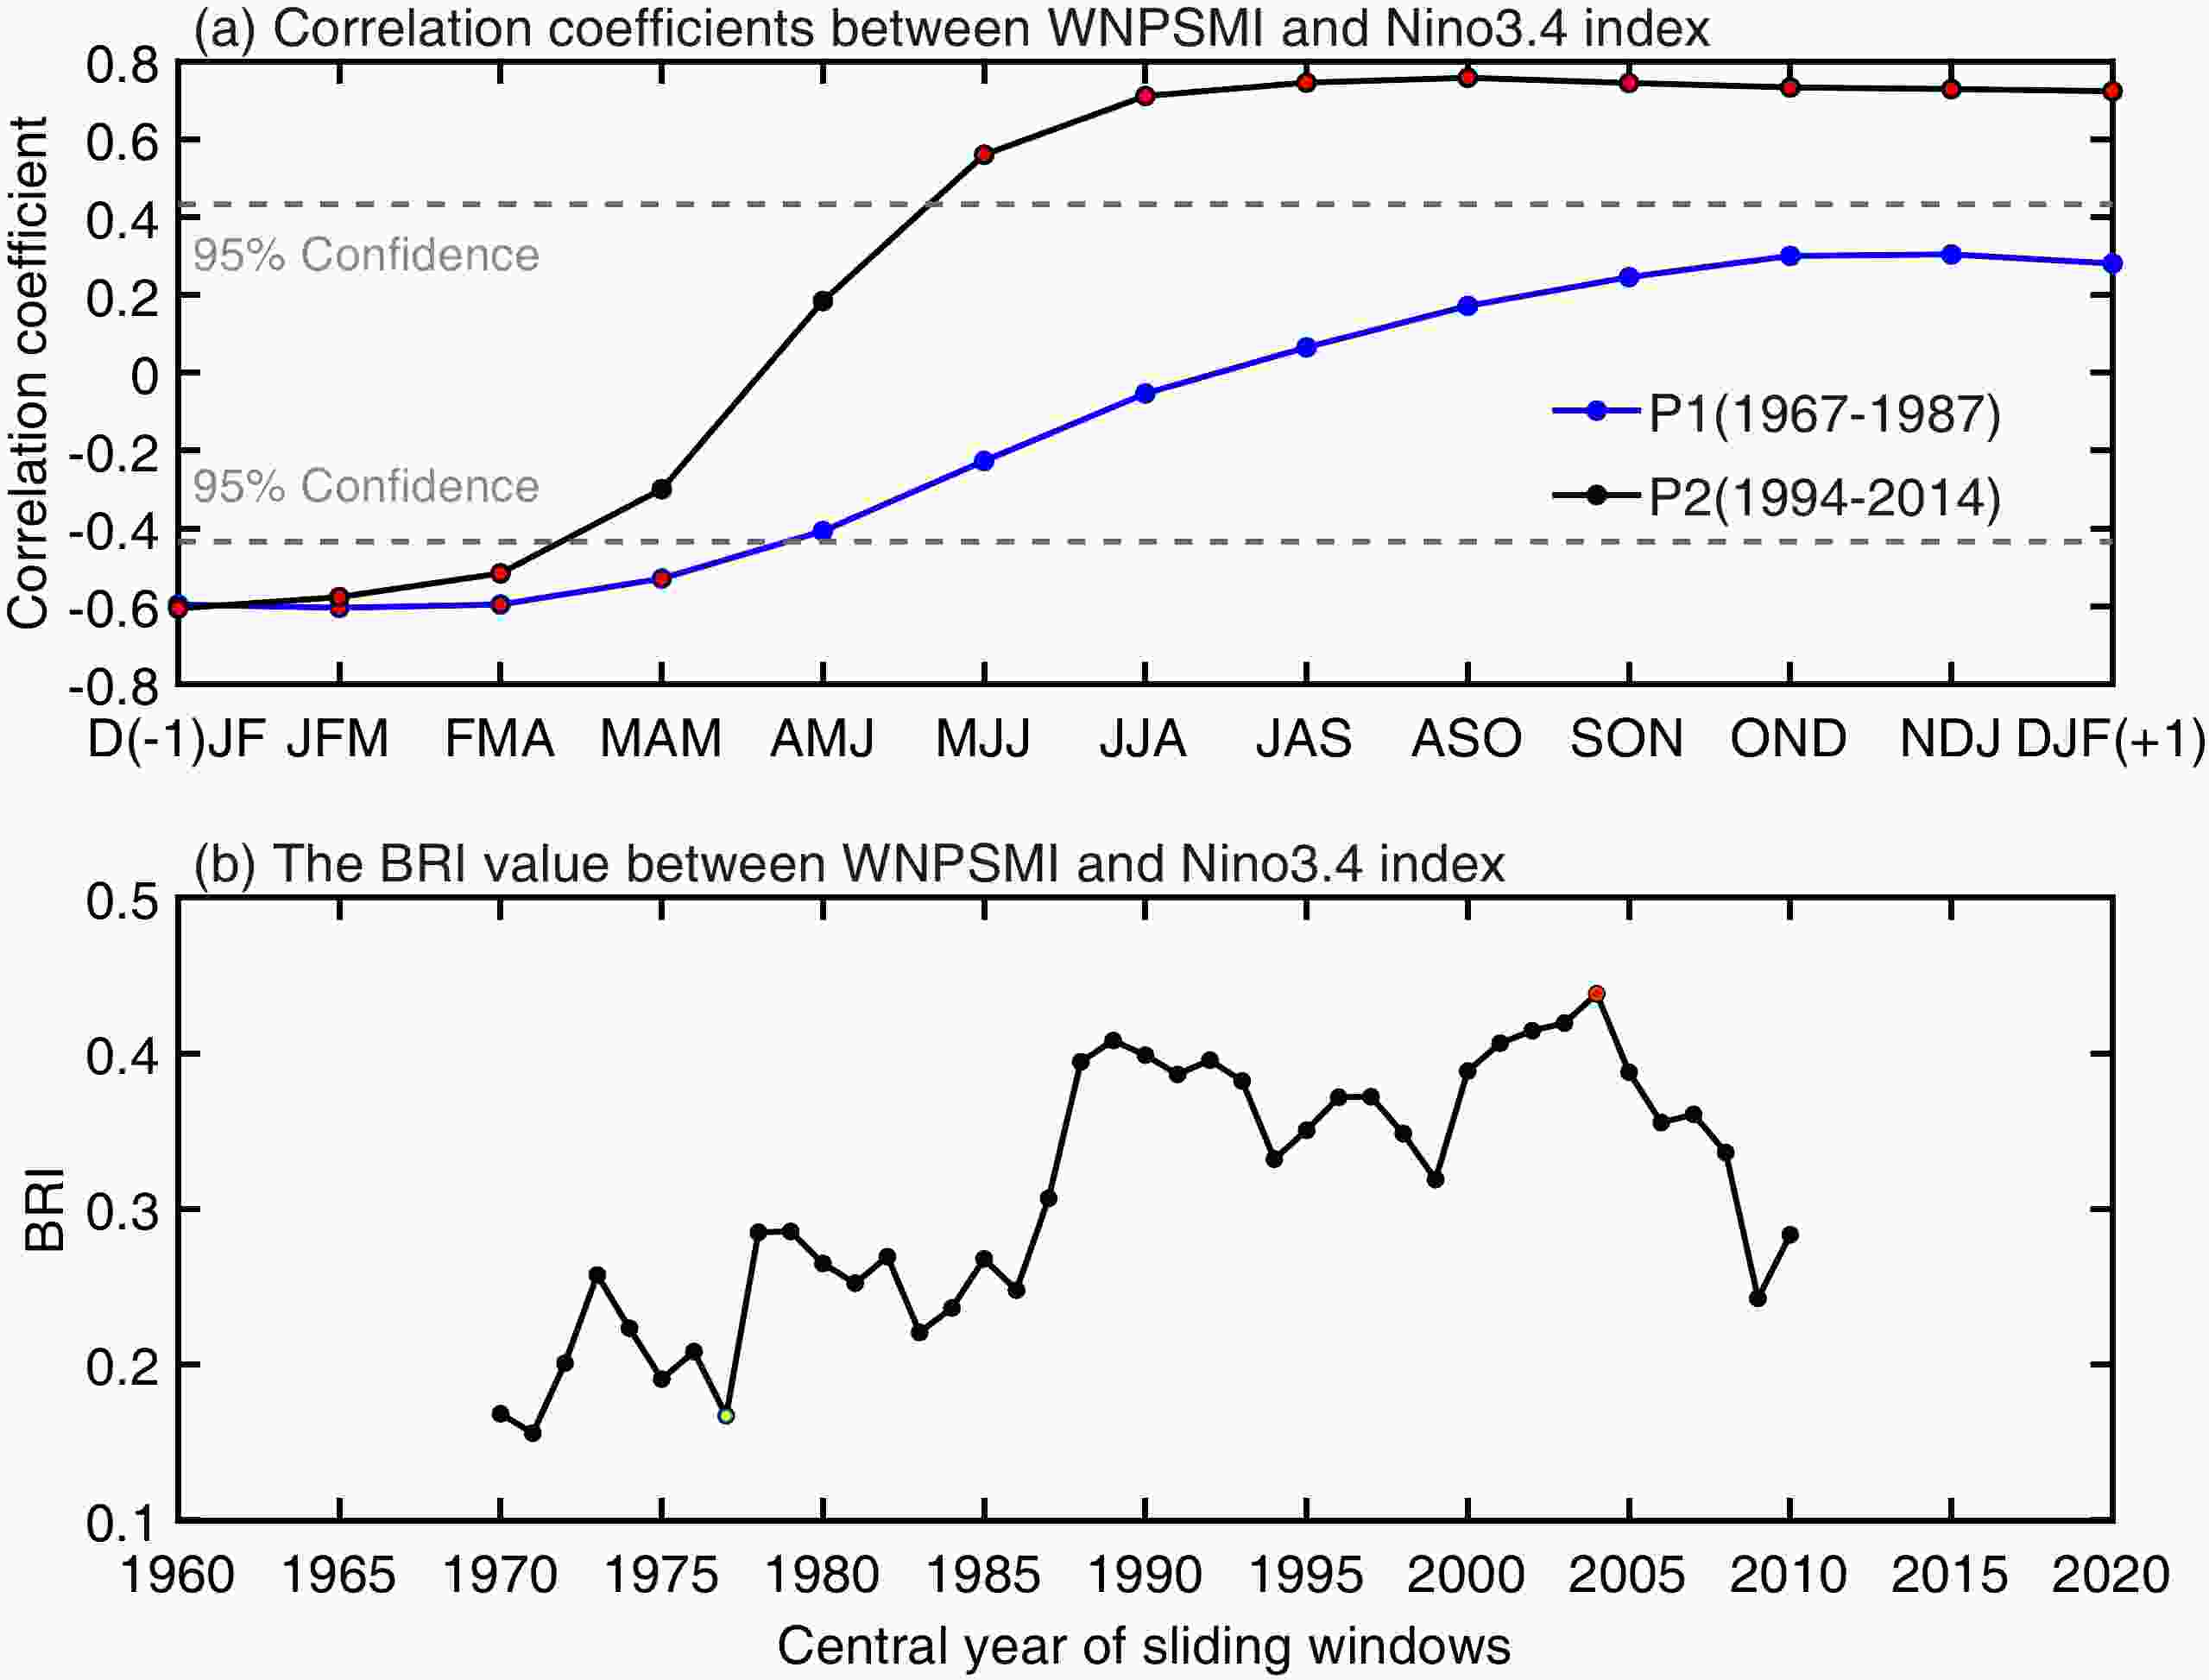
Figure 12. (a) Comparison of correlation coefficients between the WNPSM index and the Niño-3.4 index in different lead-lag seasons for P1 and P2. The red dots indicate that the correlations are significant at the 95% confidence level. (b) Time series of the calculated BRI between the WNPSM index and the Niño-3.4 index. The red (yellow) dot represents the corresponding points in P2 (P1).
As shown in section 5.1, the enhanced WNPSM–EZW co-variability may promote stronger feedback from the WNPSM on the subsequent ENSO evolution after the early 1990s. We expect that the biennial relationship between the WNPSM and ENSO may have strengthened during recent decades due to the stronger feedback from the WNPSM on ENSO development. This expectation could be confirmed and reinforced by the calculated time series of the BRI between the WNPSM index and the Niño-3.4 index (Fig. 12b), which has experienced a noteworthy increasing trend. The calculated BRI value was 0.17 in P1 and 0.44 in P2, consistent with a 158.8% increase. By further comparing the changes of Cor1 and Cor2 in Eq. (2) during the two periods, we find that the changes in the BRI were mainly associated with the changes of Cor2 (Fig. 12a). The value of Cor1 was –0.59 in P1 and –0.62 in P2, both of which were statistically significant. This shows that Cor1 has not changed significantly during these two periods, indicating that the WNPSM could be significantly modulated by the previous winter’s ENSO in both P1 and P2. In contrast, Cor2 changed dramatically over time. The value of Cor2 increased from a non-significant value of 0.27 during P1 to a highly significant value of 0.71 during P2. Consequently, the significant increase of Cor2 in P2 had the effect of enhancing the BRI. The increase of Cor2 could be understood as the intensified feedback from the WNPSM onto the subsequent evolution of ENSO, possibly due to the recent strengthening WNPSM–EZW relationship. Furthermore, the recent intensification of the WNPSM–EZW relationship may also have boosted the biennial tendency of the WNPSM–ENSO coupled system during recent decades, with more prominent lead-lag correlations between the WNPSM and the DJF Niño-3.4 index in P2 (Fig. 12a).
Consistent with the enhanced biennial tendency of the WNPSM–ENSO coupled system during P2, stronger quasi-biennial variability is found in the power spectrums of the WNPSM, EZW, ENSO, and tropical North Atlantic SST (Fig. 13). In contrast, stronger quasi-quadrennial variability could be observed in P1. These results indicate that the WNPSM, EZW, ENSO, and tropical North Atlantic SST all exhibited a decadal shift to the more dominant quasi-biennial mode after the early 1990s. Therefore, the WNPSM, EZW, ENSO, and tropical North Atlantic SST may be closely linked in a unified climate system with the quasi-biennial (~2–3 yr) rhythm in P2. Wang et al. (2017) revealed that the tropical Atlantic SST might operate as a key pacemaker of the biennial variability in the Pacific by stimulating an Atlantic capacitor effect, including tropical Pacific–Atlantic cross-basin interactions after the early 1990s. Our findings further suggest that the western Pacific EZW and the WNPSM could also be involved and intertwined in the biennial variability, possibly triggered by the enhanced tropical Pacific–Atlantic cross-basin interactions observed during recent decades.
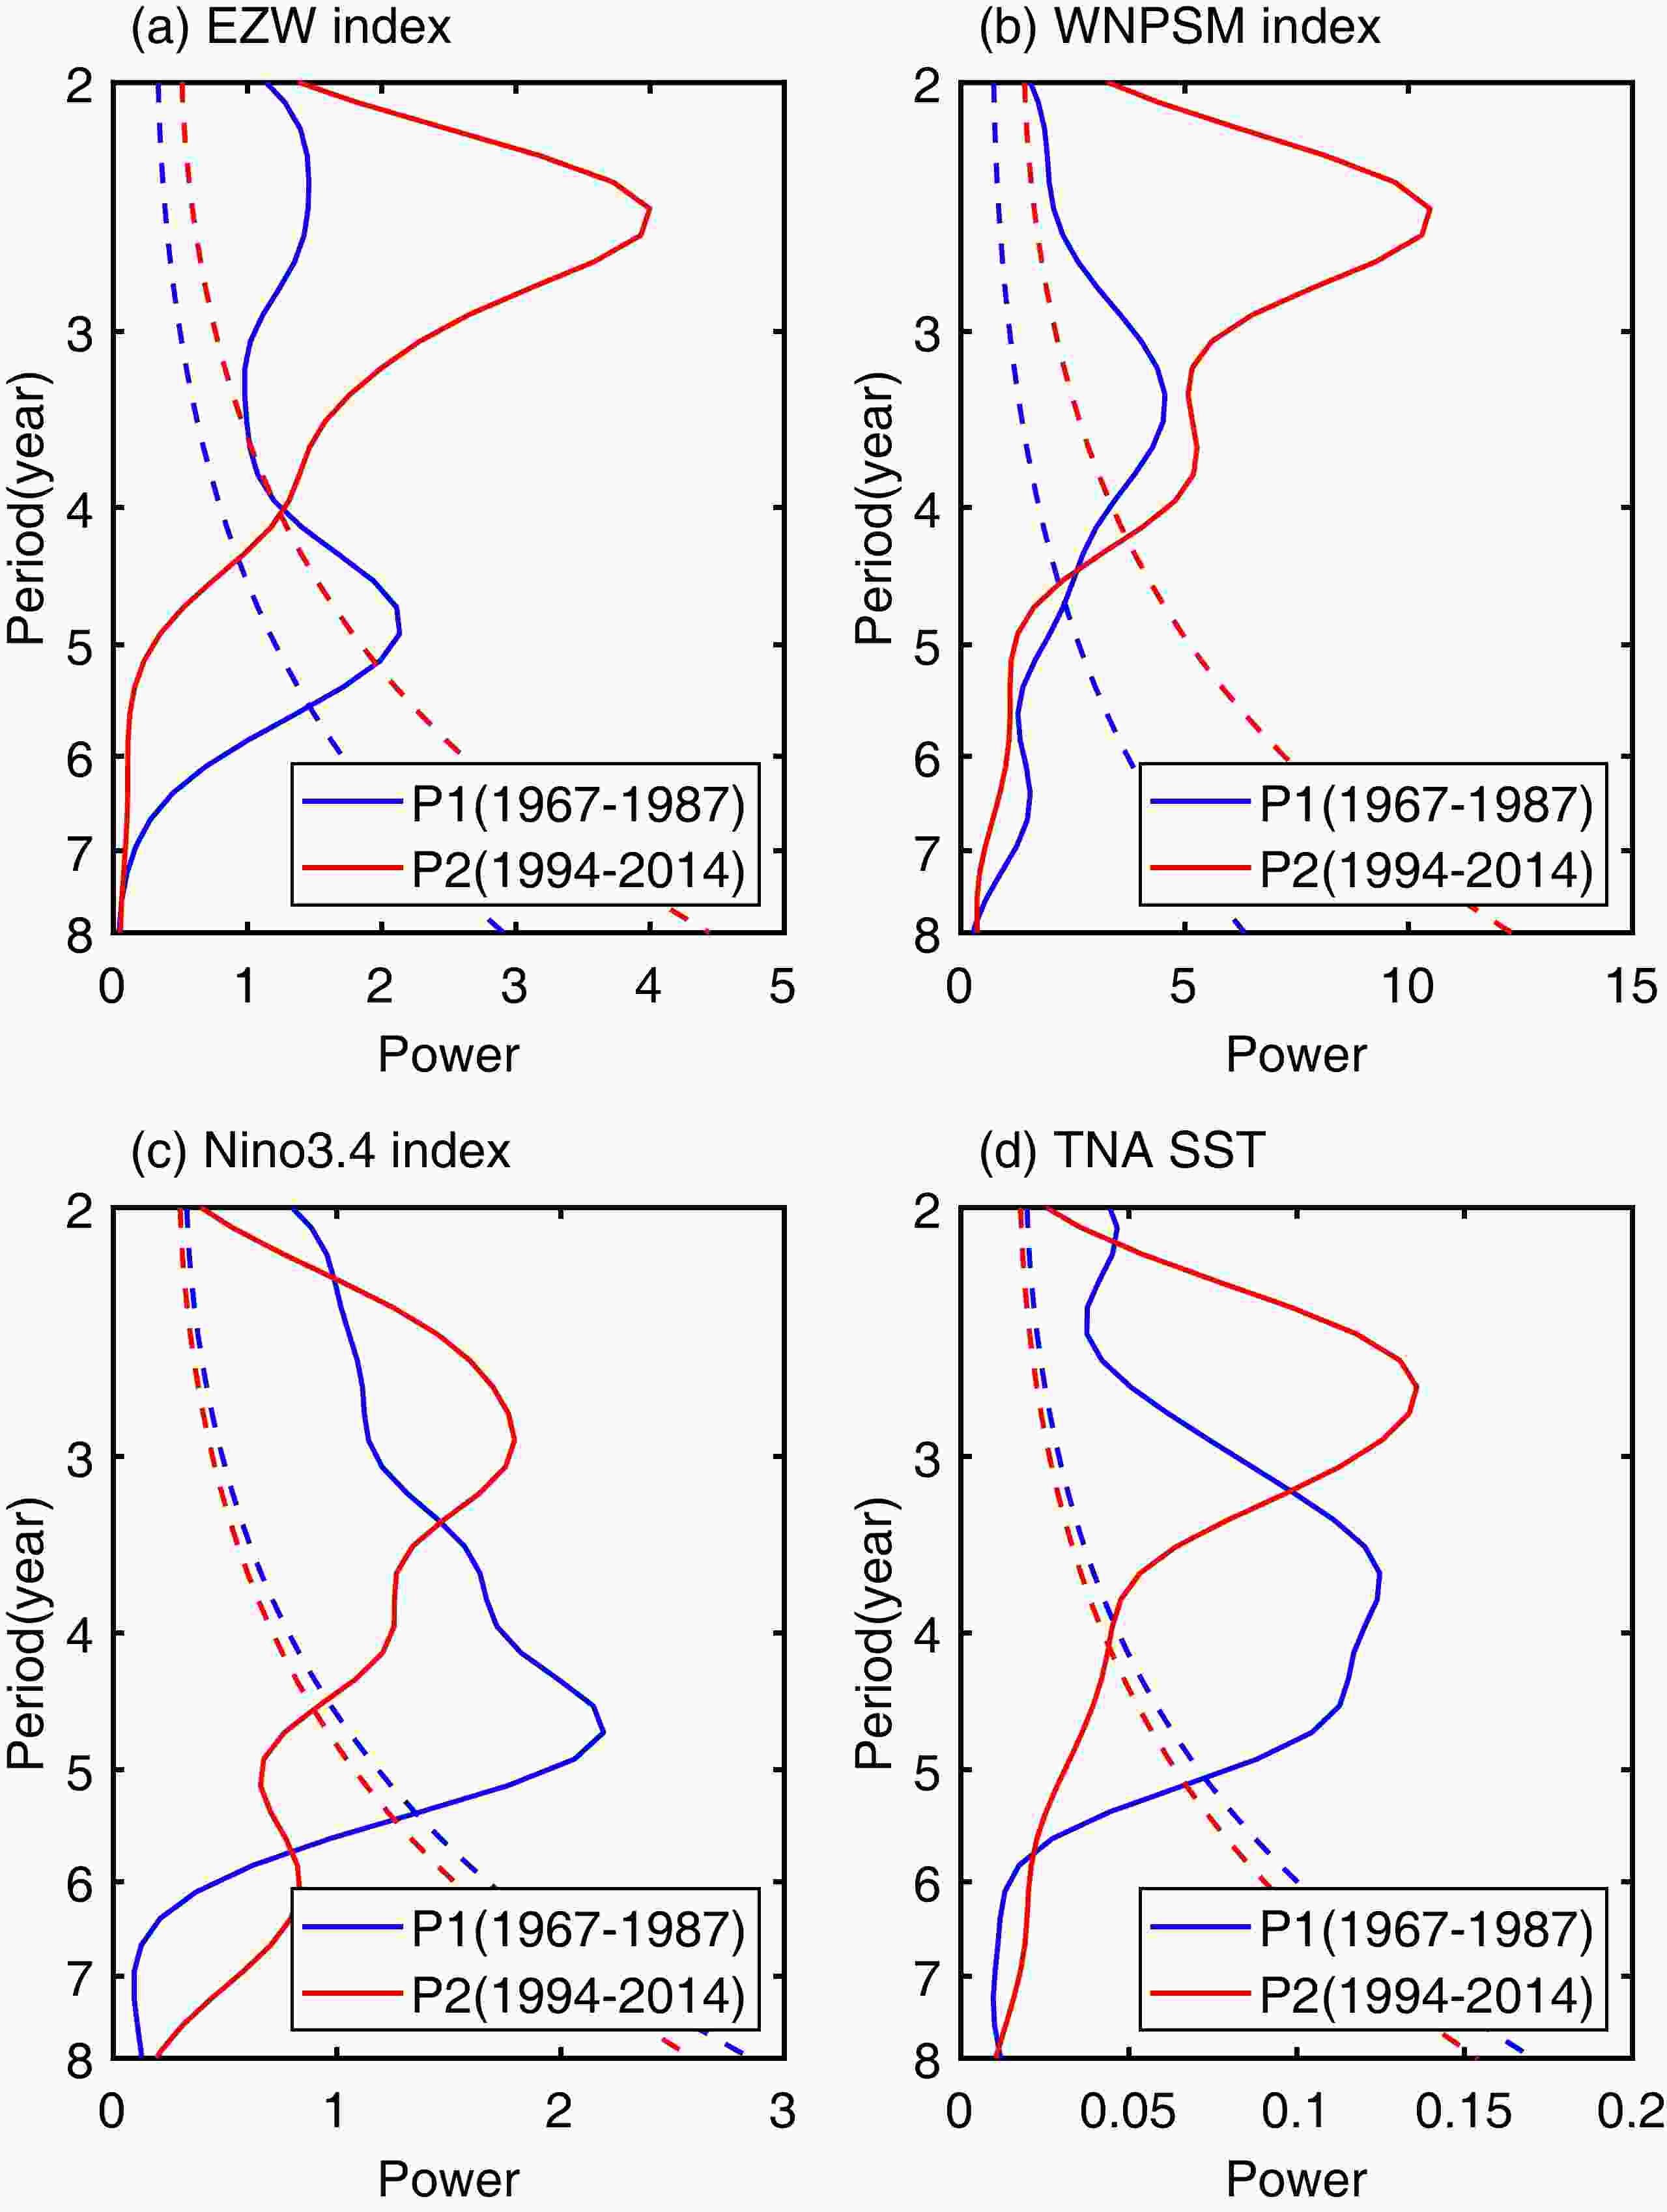
Figure 13. Comparison of power spectra in P1 and P2 for (a) the JJA EZW index, (b) the JJA WNPSM index, (c) the DJF Niño-3.4 index, and (d) the MAM tropical North Atlantic SST. The dashed line denotes significance at the 95% confidence interval against red noise.
-
In this study, we focused on the recently enhanced co-variability of the WNPSM and the EZW from three main aspects: phenomenon (section 3), mechanism (section 4), and climate impact and consequence (section 5). We found a non-stationary relationship between the WNPSM and the western Pacific EZW, with a significant intensification of the correlation between them around the late 1980s/early 1990s. The correlation coefficient between the WNPSM index and the western Pacific EZW index has greatly increased from 0.28 in 1967–87 (P1) to 0.88 in 1994–2014 (P2). There were obvious differences in the spatial distribution of the 850-hPa wind anomalies associated with the WNPSM between P1 and P2, with the zonal wind anomalies being shifted southward and expanded towards the equator, notably in P2. This observed shift in the WNPSM–EZW relationship could be explained by the changes in the related SST configurations across the tropical oceans. The enhanced influence from the springtime tropical North Atlantic, summertime tropical central Pacific, and maritime continent SST anomalies may have been working together to contribute to the intensified WNPSM–EZW co-variability after the early 1990s. The recent strengthening of the WNPSM–EZW relationship may profoundly impact the climate system, including prompting more effective feedback from the WNPSM onto subsequent ENSO evolution and contributing to a stronger biennial tendency of the WNPSM–ENSO coupled system in recent decades.
Figure 14 presents a schematic diagram highlighting the physical processes and climatic consequences of the recently strengthened WNPSM–EZW co-variability. The WNPSM–EZW co-variability can reflect the subtropical–tropical connection in the WNP to some extent. The decadal shift in the WNPSM–EZW connection could also be considered as a shift in the north-south spatial structure of the 850-hPa wind anomalies associated with the WNPSM. After the early 1990s, a stronger WNPSM–EZW co-variability indicates that the wind anomalies associated with the WNPSM have obviously shifted southward and expanded to the equatorial region along with stronger westerly anomalies in the equatorial region, which could stimulate an equatorial oceanic Kelvin wave and allow it to propagate eastward along the equator more effectively, thus prompting more effective feedback from the WNPSM onto the subsequent ENSO evolution. Before the late 1980s/early 1990s, the weaker WNPSM–EZW co-variation indicated that the wind anomalies associated with the WNPSM were mainly confined to the subtropical region and did not extend to the equator, which reduced the efficiency of exciting oceanic equatorial Kelvin waves, thus weakening the feedback from the WNPSM onto subsequent ENSO evolution. Altered SST configurations across the tropical oceans could contribute to the recent WNPSM–EZW synchronization. This is especially the case for the enhanced trans-basin influences from the springtime tropical North Atlantic SST anomalies, which may greatly contribute to the recent co-variability of the WNPSM and the western Pacific EZW. The decadal fluctuation of the springtime tropical North Atlantic SST could be closely associated with the AMO (Wang et al., 2017). The north-south spatial structure of the 850-hPa wind anomalies associated with the WNPSM may be greatly modulated by the tropical Atlantic–Pacific cross-basin interactions. The enhanced WNPSM–EZW co-variability may support a stronger biennial tendency of the WNPSM–ENSO coupled system during recent decades. The results obtained herein imply that the WNPSM, EZW, ENSO, and tropical North Atlantic SST may be closely linked in a unified climate system with a quasi-biennial rhythm during recent decades, accompanied by the reinforcement of the WNPSM–ENSO interplay, quite possibly triggered by an enhancement in tropical Atlantic–Pacific cross-basin interactions.
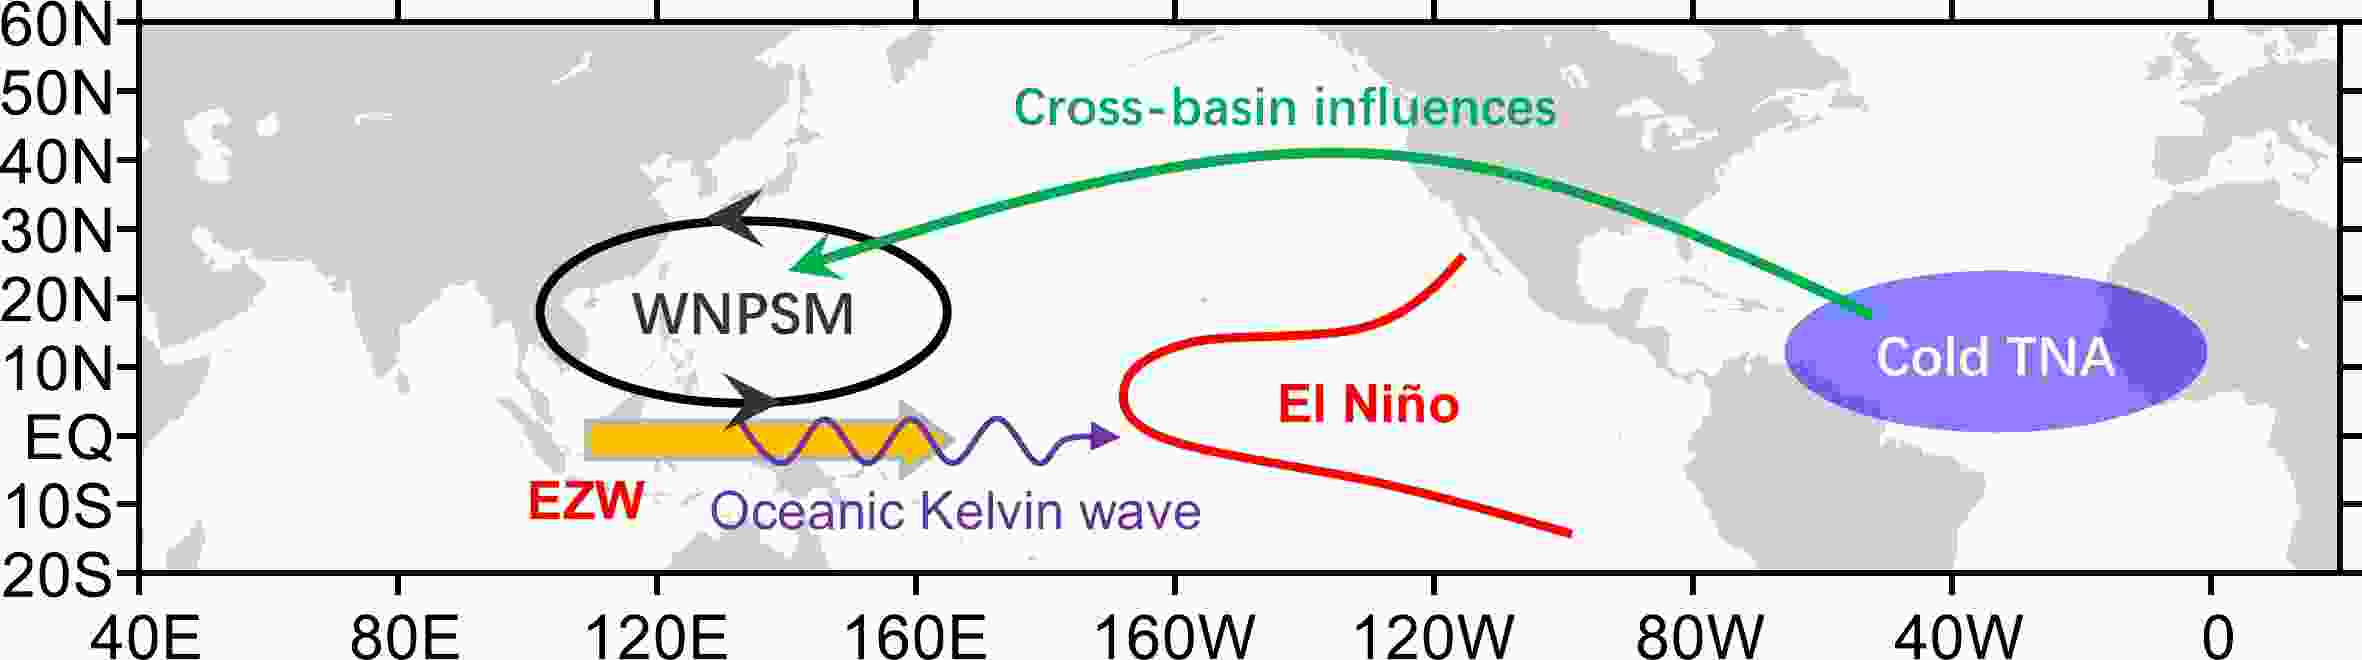
Figure 14. A schematic diagram showing the physical processes and climatic consequences of the recently strengthened WNPSM–EZW relationship after the early 1990s.
These results imply that the enhanced cross-basin influences from the tropical Atlantic ocean may reinforce the two-way interaction of the WNPSM and the ENSO during recent decades. In this study, we prefer to understand the observed facts from the perspective of monsoon–ENSO interplay and interaction. The recent strengthening WNPSM–EZW relationship was explained by the changes in the previous spring and simultaneous summer SST configurations across the tropical oceans. Furthermore, the recent strengthening WNPSM–EZW relationship may contribute to the increased association between the WNPSM and the following wintertime ENSO. Kim and Lau (2001) illustrated the dynamics of monsoon-induced biennial variability in ENSO, with the strong coupling effect of the ENSO with the monsoonal winds over the western Pacific. According to this result, the strong monsoon over the western Pacific could modulate and affect the cold and warm phase transition of the ENSO in the subsequent winter by triggering an oceanic equatorial Kelvin wave, thus contributing to the biennial variability of the ENSO. Here, our results during the P2 period are consistent with the views of Kim and Lau (2001). However, our results further found a significant interdecadal difference in the feedback effect of the monsoonal winds associated with the WNPSM on the ENSO. The physical process, significant during the P2 period, was not obvious during the P1 period. In other words, the feedback effect of the WNPSM on the subsequent ENSO could play a role in some decades (such as the P2 period after the early 1990s), while this feedback effect from the monsoonal winds was rather weak in some other decades (such as the P1 period before the late 1980s/early 1990s). This interdecadal variation may further affect the biennial tendency of the WNPSM–ENSO coupled system. As a result, the WNPSM and ENSO show different quasi-biennial variation intensities in different decades.
The cross-basin interactions among three tropical oceans have received extensive attention (Cai et al., 2019; Wang , 2019), which is considered crucial for understanding recent climate variations. The results here highlight the importance of the tropical Pacific–Atlantic cross-basin interactions in shaping the WNPSM–ENSO interplay. Different cross-basin interactions among three tropical oceans may possibly lead to different monsoon–ENSO interactions and distinct monsoon–ENSO biennial relationships (Chen et al., 2020a). The details of the monsoon–ENSO interaction need to be further elucidated from the perspective of the cross-basin interactions in future studies.
One may wonder about the possible influences of the tropical Pacific climate shift on the decadal changes in the relationship between the EZW and WNPSM. We further examined the relationship between the WNPSM–EZW connection and the PDO (AMO) index on multidecadal timescales. Multidecadal fluctuations of the WNPSM–EZW connection are much more highly correlated with those of the AMO (R = 0.83) than with those of the PDO (R = –0.02). This suggests that the AMO may exert a much stronger modulation effect on the multidecadal WNPSM–EZW connection compared with the PDO. Recent studies suggest that the interdecadal SST oscillations in the Atlantic and Pacific ocean basins may be related and interact with each other (Wu et al., 2020; Sun et al., 2021; Meehl et al., 2021). Therefore, we cannot entirely discard the possibility that the Pacific multidecadal climate shift may also play a role. Further investigations are required to better understand the possible roles of the Atlantic and Pacific multidecadal climate shifts. In addition, future changes in the WNPSM–EZW (WNPSM–ENSO) relationship under different CMIP6 scenarios are also of interest and await further investigations.
Acknowledgements. This work was supported by the National Natural Science Foundation of China (Grant No: 41776031), the National Key Research and Development Program of China (Grant 2018YFC1506903), the team project funding of scientific research innovation for universities in Guangdong province (Grant 2019KCXTF021), and the program for scientific research start-up funds of Guangdong Ocean University (Grant R17051).
Electronic supplementary material: Supplementary material is available in the online version of this article at
https://doi.org/10.1007/s00376-023-2215-6 .
Recent Enhancement in Co-Variability of the Western North Pacific Summer Monsoon and the Equatorial Zonal Wind
- Manuscript received: 2022-07-29
- Manuscript revised: 2023-01-29
- Manuscript accepted: 2023-02-06
Abstract: The western North Pacific summer monsoon (WNPSM) is an important subcomponent of the Asian summer monsoon. The equatorial zonal wind (EZW) in the lower troposphere over the western Pacific may play a critical role in the evolution of the El Niño-Southern Oscillation (ENSO). The possible linkage between the EZW over the western Pacific and the off-equatorial monsoonal winds associated with the WNPSM and its decadal changes have not yet been fully understood. Here, we find a non-stationary relationship between the WNPSM and the western Pacific EZW, significantly strengthening their correlation around the late 1980s/early 1990s. This observed shift in the WNPSM–EZW relationship could be explained by the changes in the related sea surface temperature (SST) configurations across the tropical oceans. The enhanced influence from the springtime tropical North Atlantic, summertime tropical central Pacific, and maritime continent SST anomalies may be working together in contributing to the recent intensified WNPSM–EZW co-variability. The observed recent strengthening of the WNPSM–EZW relationship may profoundly impact the climate system, including prompting more effective feedback from the WNPSM on subsequent ENSO evolution and bolstering a stronger biennial tendency of the WNPSM–ENSO coupled system. The results obtained herein imply that the WNPSM, EZW, ENSO, and the tropical North Atlantic SST may be closely linked within a unified climate system with a quasi-biennial rhythm occurring during recent decades, accompanied by a reinforcement of the WNPSM–ENSO interplay quite possibly triggered by enhanced tropical Pacific–Atlantic cross-basin interactions. These results highlight the importance of the tropical Atlantic cross-basin influences in shaping the spatial structure of WNPSM-related wind anomalies and the WNPSM–ENSO interaction.
-
Keywords:
- western North Pacific summer monsoon,
- equatorial zonal wind,
- interdecadal variability,
- monsoon–ENSO interaction,
- cross-basin interactions,
- biennial variability
摘要: 西北太平洋夏季风(western North Pacific summer monsoon;WNPSM)是亚洲夏季风的重要子系统。西太平洋大气低层的赤道纬向风(equatorial zonal wind;EZW)可能在厄尔尼诺-南方涛动(ENSO)的演化过程中发挥着关键作用。WNPSM与EZW之间的可能联系及其年代际变异还没有被完全认识和理解清楚。在本研究中,我们发现WNPSM与EZW之间的相关关系是不稳定的,二者的相关性在20世纪80年代末/90年代初显著地增强。这种WNPSM–EZW关系的年代际转变与热带大洋海表温度空间配置的变化密切相关。春季热带北大西洋、夏季热带中太平洋和海洋大陆区域海表温度异常影响的显著增强,可能共同导致了最近年代WNPSM与EZW的共变性的增强。WNPSM–EZW关系在最近年代的加强可能会对气候系统产生深远影响,包括促使WNPSM能够对随后的ENSO演变提供更有效的反馈,并支持WNPSM–ENSO耦合系统表现出更强的准两年周期变化。这些研究结果表明,热带大西洋跨洋盆影响在最近年代的增强可以加强WNPSM和ENSO之间的相互作用,并且能够将WNPSM、EZW、ENSO和热带北大西洋海温共同统一在一个具有准两年周期韵律的整体系统之中。研究结果突显出热带大西洋跨洋盆影响在调控WNPSM风场异常的空间结构以及WNPSM–ENSO相互作用的年代际变异中的重要性。


 AAS Website
 AAS WeChat