


 DownLoad:


-
With the rapid development of economic construction in recent decades, South China has become one of the regions with the highest economic level in China and experienced yearly increased losses caused by meteorological disasters. Especially during the first rainy season (FRS) from April to June (e.g., Huang, 1986; Deng and Wang, 2002; Chi et al., 2005; Ding et al., 2009; Luo, 2017), severe convective weather accompanied by hail, thunderstorms, and tornadoes occurs frequently and has caused many flood disasters, landslides, and debris flows, which endanger lives and properties in South China (e.g., Xu, 1994; Liang, 1997; Hallegatte et al., 2013). For instance, the heavy rainfall that happened in southern China during June 2022 caused a huge loss of 4 billion yuan and 32 lives (e.g., Gan and Deng, 2022). However, in the current Rainy Season Flood Outlook Consultations organized by national operational centers every year, real-time seasonal forecasts have mainly focused on abnormal summer precipitation in the middle and lower reaches of the Yangtze River (MLYR). But, little attention has been paid to the interannual variations of FRS precipitation over South China. Therefore, it is of great importance and socio-economic value to carry out seasonal predictions of precipitation during the FRS in South China. However, owing to the specific geographical location and complex terrain, interactions between large-scale circulation systems originating from the low latitudes and mid-high latitudes (e.g., Zhu et al., 2014; Lu et al., 2021), as well as the local transient mesoscale systems, could result in complicated processes for the precipitation there (e.g., Luo et al., 2013; Jiang et al., 2017; Tang et al., 2021); this leads to great difficulty in predicting FRS precipitation in South China.
FRS precipitation in South China is mainly composed of frontal rainfall and warm-sector rainfall (e.g., Chi et al., 2005; Chang et al., 2006; Zheng et al., 2006; Liu et al., 2019). The FRS can be generally divided into two stages (e.g., Chi et al., 2005): the period before the onset of the South China Sea monsoon, from about April to mid-May (e.g., Xie et al., 1998; Wang et al., 2004), and the post-monsoon-onset period, during which the precipitation increases significantly (e.g., Luo et al., 2013; Li et al., 2020). Previous studies have demonstrated that the areas of water vapor source during the FRS consist of the Indian Ocean, the Pacific Ocean, the South China Sea, and the Chinese mainland (e.g., Chi et al., 2005; Zhong et al., 2019; Chu et al., 2020; Peng et al., 2022). FRS precipitation displays significant interannual variation, which is closely related to tropical sea surface temperatures (SSTs) (e.g., Luo et al., 2020). A positive temperature gradient between the tropical eastern and western Pacific is conducive to suppressed convection in the tropical western Pacific, which could excite Rossby waves and result in an abnormal anticyclone circulation near the Philippines, thus reducing the moisture transport to South China (e.g., Gu et al., 2018).
In addition to tropical Pacific SST, anomalous SST in the tropical Indian Ocean basin may also have great impacts on precipitation in South China (e.g., Chowdary et al., 2011; Yuan et al., 2019). Southwesterly winds associated with the cold SST anomaly in the South Indian Ocean could help transport more water vapor to the subtropical western Pacific and nearby regions and induce significant low-level convergence in South China (e.g., Jia et al., 2021). Model experiment results have suggested that the tropical and North Indian Ocean warming generates Kelvin waves and induces an anticyclone in the northwestern Pacific (e.g., Xie et al., 2009), affecting the moisture transport to South China. Li et al. (2018) reported that the North Atlantic tripole-like SST variation could influence precipitation in South China by stimulating teleconnection wave trains over Eurasia in the mid-high latitudes, and tropical Atlantic SST anomalies could change the Walker Circulation and induce abnormal circulations near the Philippines and precipitation anomalies in South China. In addition, abnormal snow cover on the Tibet Plateau and the Northeast China cold vortex may also influence FRS precipitation (e.g., Wu and Qian, 2003; Miao et al., 2006; Li et al., 2014; Xiao and Duan, 2016).
It is believed that the physical basis for the seasonal predictability of precipitation lies in the external forcing, especially the anomalous SST and its related climate signals. Thus, the performance of SST anomaly prediction in climate models is important for the seasonal prediction of precipitation. The global real-time Climate Forecast System version 1.0 of Nanjing University of Information Science and Technology (NUIST-CFS1.0), developed based on the SINTEX-F model of the Japanese Marine Science and Technology Development Agency (JAMSTEC), has shown outstanding performance for predicting major tropical climate signals, such as achieving satisfactory forecasts of ENSO at lead times of up to 1.5–2 years and for the Indian Ocean dipole (IOD) up to 1–2 seasons in advance (Luo et al., 2007, 2008, 2016; He et al., 2020). In addition, NUIST-CFS1.0 also displays reasonably good skill in predicting the features of summer precipitation anomalies in the middle and lower reaches of the Yangtze River (Ying et al., 2022). However, the skill of NUIST-CFS1.0 and an inter-comparison with other international climate forecast systems in predicting the precipitation in the FRS over South China remain to be assessed.
Due to the special geographical location, the climate in East Asia is not only affected by large-scale factors, but also small-scale factors such as regional-scale topographic forcing and mesoscale eddies. The resolutions of most of the current global general circulation models (GCMs) are still too coarse to meet the needs of fine predictions and socioeconomic applications (e.g., Wehner et al., 2010; White et al., 2013; Bao et al., 2015). A dynamical downscaling method using higher-resolution regional climate models (RCMs), in which the initial and boundary conditions are provided by GCMs, is often employed to derive finer predictions and to improve the prediction of regional climate (e.g., Lo et al., 2008; Xu and Yang, 2015; Kitoh et al., 2016; Tang et al., 2016; Dai et al., 2020). The RCMs can not only retain the large-scale characteristics given by GCMs, but also capture more regional climate characteristics (e.g., Dickinson et al., 1989; Giorgi et al., 1994; Fu et al., 2005; Xue et al., 2007; Sato and Xue, 2013; Wang et al., 2013; Sun et al., 2018). Zhang et al. (2015) nested one RCM (i.e., Reg CM4.4) into the fourth version of the Community Climate System Model (CCSM4.0) and found that Reg CM4.4 could improve the forecast skill for precipitation, with the spatial correlation coefficient skill increasing from 0.39 to 0.53. Gao et al. (2008) compared two RCMs nested within the NASA/NCAR global model and found that one RCM can perform better in reproducing the precipitation change in China in terms of both spatial pattern and rainfall amount. The results suggest that higher resolution RCMs help better capture precipitation patterns over China, especially during the monsoon season. In addition, Ratnam et al. (2016) found that the forecast skill for austral summer precipitation over South Africa can be improved by downscaling the SINTEX-F2 global forecast with the Weather Research and Forecasting (WRF) model.
In this study, we selected Guangdong, Guangxi, Fujian, and Hainan provinces as the study area according to the Operational Monitoring of the First Rainy Season of South China (National Climate Center, 2013). The prediction skill of NUIST-CFS1.0 for precipitation in the FRS over South China is evaluated and is compared with nine international climate model forecast systems (see Table 1), and possible sources of the seasonal predictability for precipitation are also explored using the NUIST-CFS1.0 ensemble hindcasts for the period 1982–2020. Furthermore, we use WRF to dynamically downscale the global model forecasts to estimate whether this downscaling method can improve the prediction skill for precipitation in the FRS over South China. Section 2 briefly introduces the forecast model, the observational/reanalysis data, and evaluation methods. Section 3 and section 4 describe the assessments of forecast skill for FRS precipitation in South China based on NUIST-CFS1.0 hindcasts with a brief comparison with nine international models. In section 5, dynamically downscaled results are analyzed. Finally, section 6 gives a brief summary and discussion.
System
nameAtmosphere
ModelOcean
ModelSea ice
ModelHindcast
ensemble sizeECMWF
_SEAS5IFS Cycle 43r1
(Dynamics: TCO319
Physics: O320)NEMO v3.4
(ORCA 0.25L75)LIM2 25 JMA/MRI
-CPS2JMA-GSM
(TL159L60)MRI.COM v3
1°×(3°−5°)Part of
MRI.COM v310 GloSea5
-GC2Met Office UM-
Global Atmosphere
6.0(N216L85)NEMO v3.4
-Global Ocean5.0
(OCRA 0.25L75)CICE v4.1
-Global Sea
-Ice 6.028 METFRA
_System6ARPEGE v6.2
(TL359L91)NEMO v3.4
(OCRA 1L75)GELATO v6 25 METFRA
_System7ARPEGE v6.4
(TL359L91)NEMO v3.6
(OCRA 0.25L75)GELATO v6 25 CMCC
_SPS3CAM5.3
(1°L46)NEMO v3.4
(0.25°L50)CICE 4.0 40 CMCC
_SPS3.5CAM5.3
(0.5°L46)NEMO v3.4
(0.25°L50)CICE 4.0 40 GCFS2.0 ECHAM 6.3.05
(T127L95)MPIOM 1.6.3
(TP04L40)Same as
ocean model30 GCFS2.1 ECHAM 6.3.04
(T127L95)MPIOM 1.6.3
(TP04L40)Same as
ocean model30 Table 1. Nine international climate models used in this study.
-
The global Climate Forecast System version 1.0 of Nanjing University of Information Science and Technology (NUIST-CFS 1.0) is built based on the SINTEX-F model (Gualdi et al., 2003; Luo et al., 2003, 2005a, b) developed at Japan Agency for Marine-Earth Science and Technology. The atmospheric and land surface model of NUIST-CFS1.0 is based on the fourth generation of the European Centre for Medium-Range Weather Forecasting (ECMWF) general circulation model (ECHAM4) developed at Max Planck Institute for Meteorology, and the ocean model is OPA8.2 (Madec et al., 1998). The ocean and atmosphere models exchange surface momentum, heat and water fluxes as well as SST and ocean surface currents every two hours using the OASIS 2.4 coupler (Valcke et al., 2000).
NUIST-CFS1.0 adopts the coupled-SST nudging scheme to generate realistic and well-balanced initial conditions of the atmosphere and ocean models (Luo et al., 2005a, 2008). Daily SST, which is interpolated from the weekly mean observations of NOAA (Reynolds et al., 2002) with a cubic spline method, is assimilated into the ocean model by using the relaxation method in a coupled manner. In this way, the atmospheric model is forced by SST from the ocean model that is close to the observations, and generates realistic wind stress, heat and water fluxes, which in turn force the ocean model to obtain realistic initial ocean conditions, particularly in the equatorial Pacific Ocean where the air–sea coupling is the strongest.
Considering the large uncertainties in initial conditions and model physics, three different air–sea coupling schemes and three different initialization schemes for each coupling physics are adopted and are combined to produce nine members to reduce the uncertainty by using the ensemble mean approach (Luo et al., 2008; He et al., 2020). For the three initialization schemes, we adopted three negative feedback values of surface heat flux (i.e., –2400, –1200 and –800 W m–2 K–1) that tend to nudge the model-simulated temperature of the upper 50-m ocean layer towards the observed daily SST values within one day, two days, and three days, respectively. The difference among the three coupling schemes is mainly reflected in the influence of ocean surface current on atmosphere and wind stress estimation. The first coupling scheme completely ignores the influence of ocean surface current on wind stress. In the second scheme, the ocean surface is still static relative to the atmosphere, but the surface wind stress is calculated by the relative speed between the surface winds and the ocean surface currents. The third scheme is a fully coupled one, in which the momentum of the sea surface current is transferred to the atmosphere directly and hence the horizontal velocity across the air–sea interface becomes continuous. In this way, the atmosphere sees the ocean surface is moving. The external momentum source from the ocean surface will also affect the global atmospheric angular momentum balance (Luo et al., 2005b). The hindcasts from NUIST-CFS1.0 for 1982 to 2020 for the FRS (April–May–June, AMJ) in South China initiated from the 1st day of March, February, and January are employed to assess the model’s predictive skill.
The Weather Forecast and Research (WRF) (Skamarock et al., 2005) downscaled simulations with 30-km resolution are forced by the large-scale information from the NUIST-CFS1.0 predictions using a spectral nudging method. The model domain contains all of East Asia. The cumulus convection parameterization adopts the Kain–Fritsch scheme (Kain, 2004). The WRF single-moment 6-class scheme (WSM6) is selected for microphysics processes (Hong and Lim, 2006). The longwave and shortwave radiation processes both adopt the Rapid Radiative Transfer Model for GCMs (RRTMG) scheme (Iacono et al., 2008). The planetary boundary layer adopts the Yonsei University scheme (Hong et al., 2006). More detailed information can be found in Ying et al. (2022). The WRF hindcasts were integrated from 1st March every year during 1991–2020.
The re-gridded daily precipitation in China at a resolution of 0.5° × 0.5° (Zhao et al., 2014) during 1982–2020 is used as the observations. The monthly SST data from Hadley Centre Sea Ice and Sea Surface Temperature dataset (HadISST) and the daily mean reanalysis dataset from the National Centers for Environmental Prediction (NCEP)–National Center for Atmospheric Research (NCAR) during 1982–2020 are also employed.
The evaluation metrics used in this study include the signal-to-noise ratio (Ehsan et al., 2017), the temporal correlation coefficient (TCC), the spatial correlation coefficient (PCC), correlation analysis, and regression analysis. The statistical significance is tested with the two-tailed student’s t-test.
-
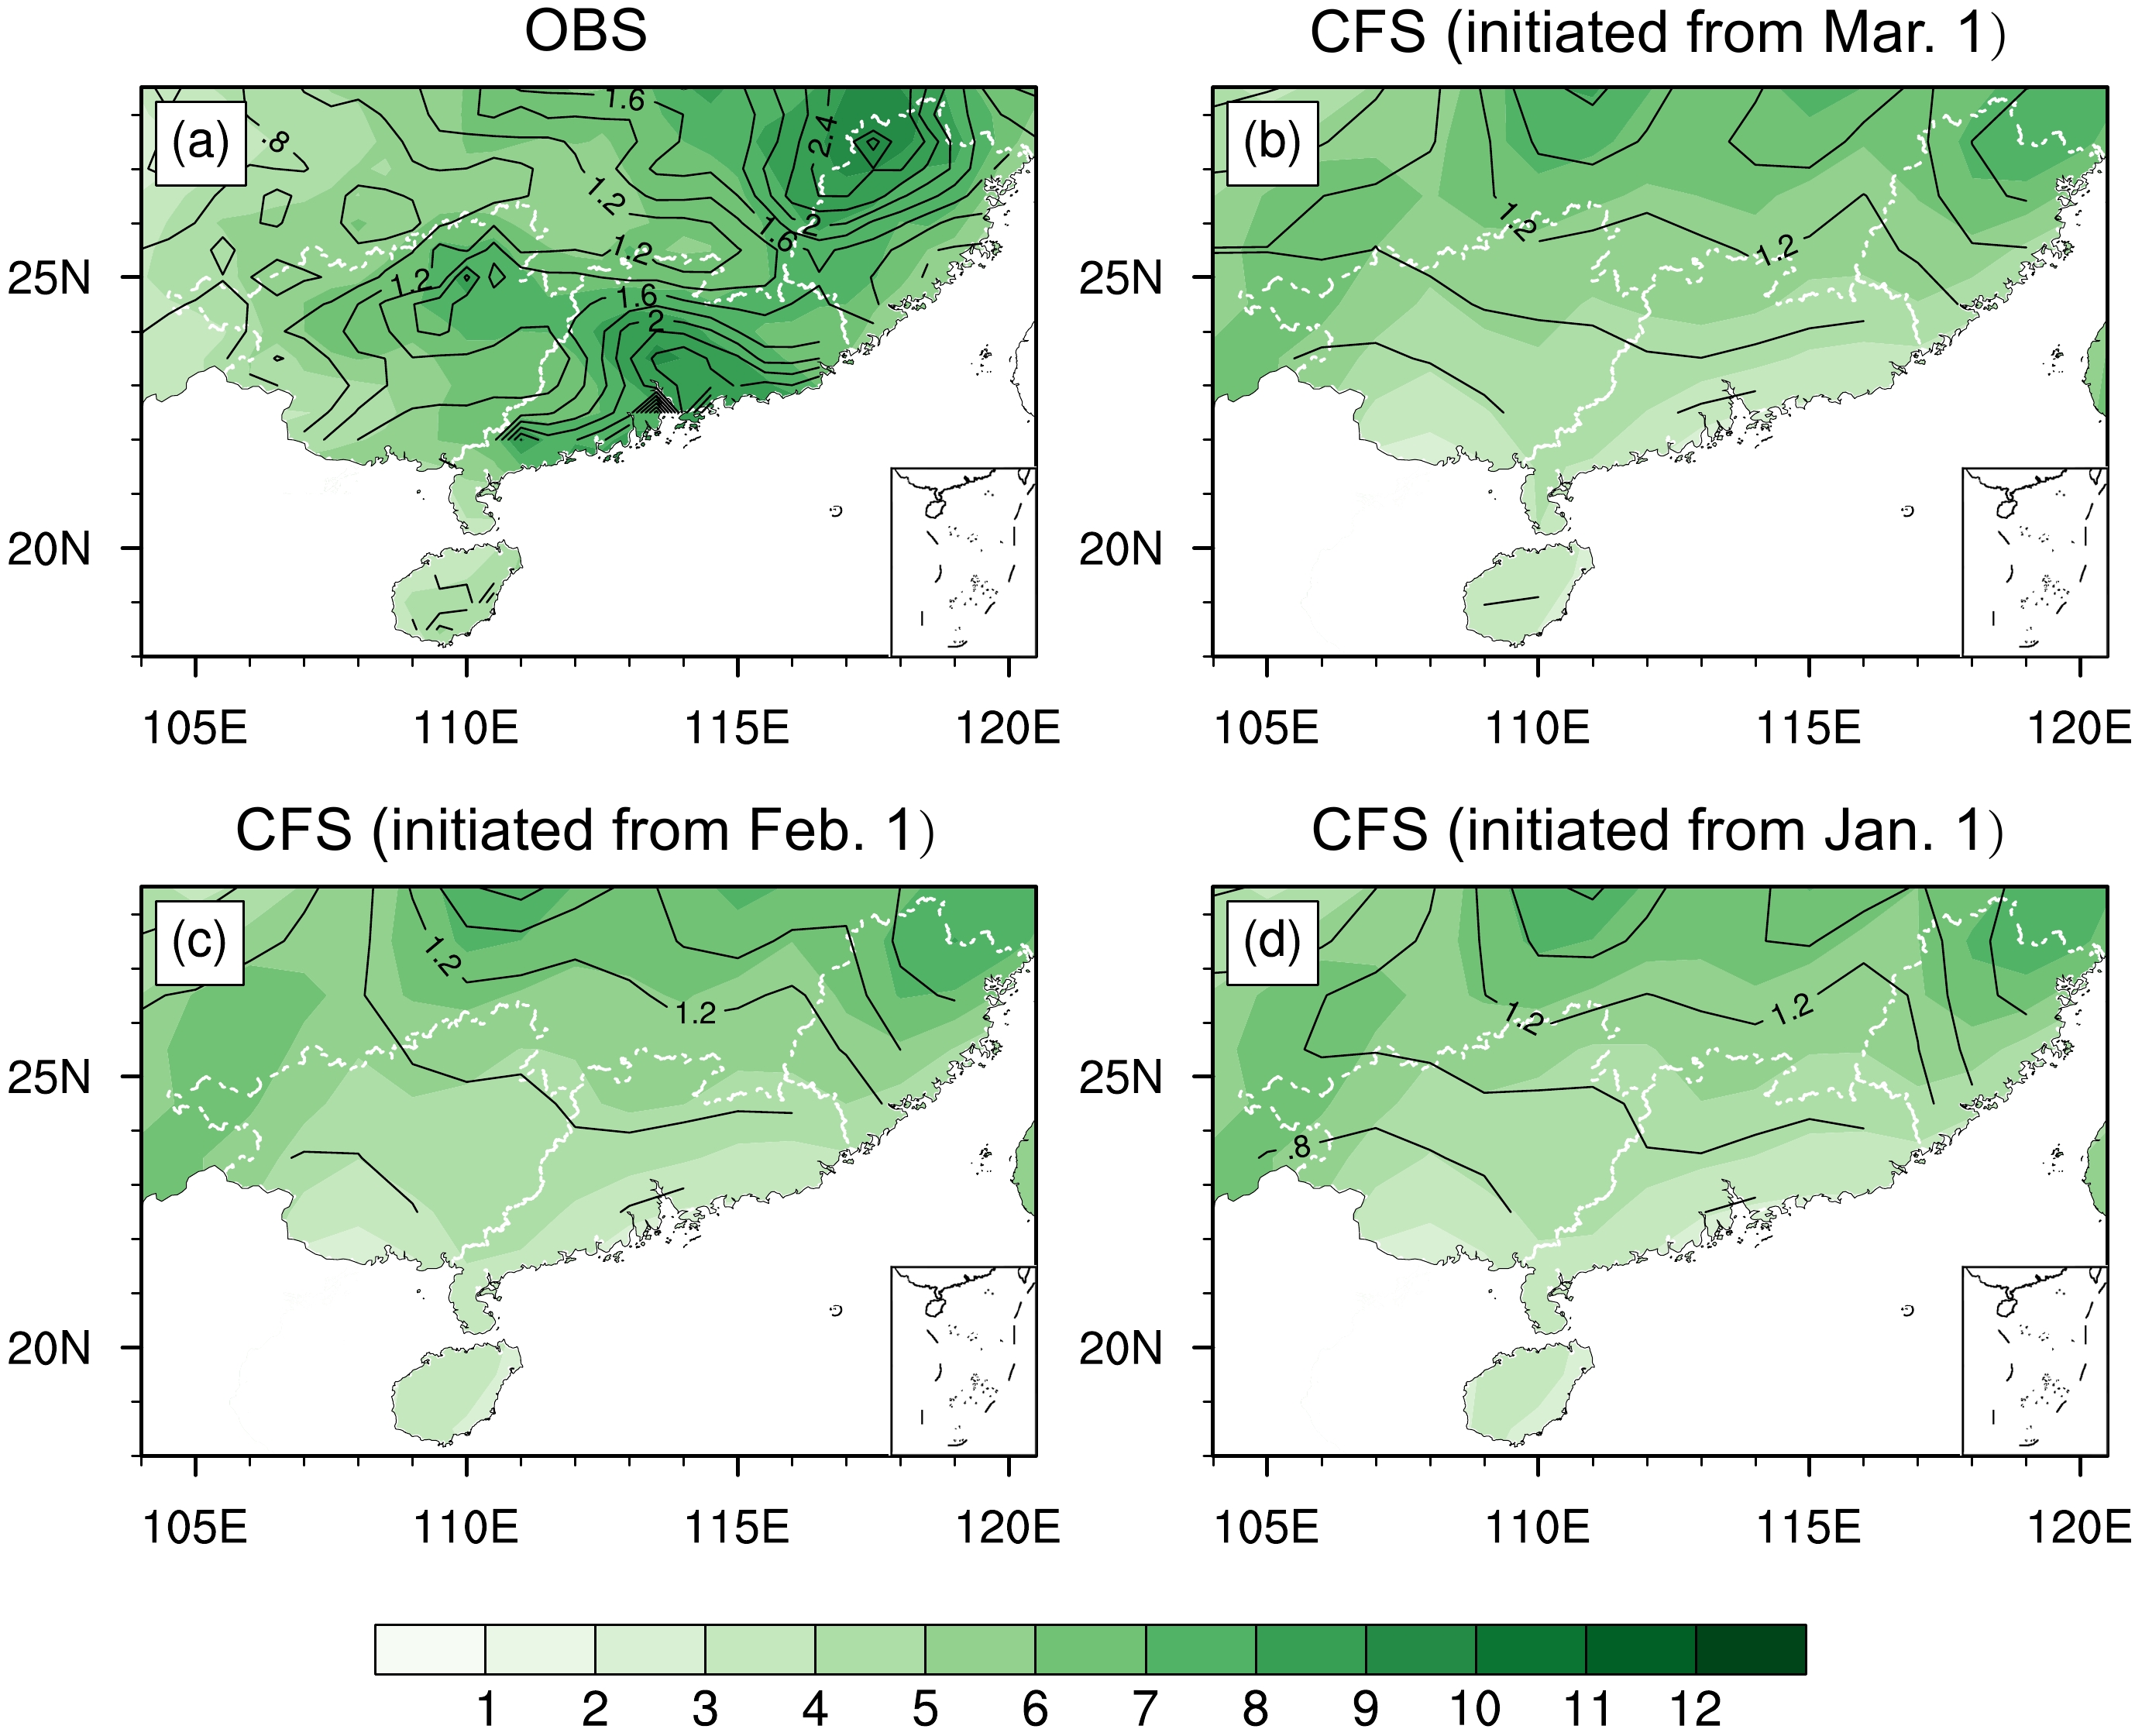
Figure 1 presents the climatological mean precipitation and standard deviation of interannual precipitation anomaly in the FRS during 1982–2020 based on the observations and NUIST-CFS1.0 ensemble mean hindcasts. The observed climatology displays two precipitation centers in north Fujian and central Guangdong province, respectively, with the maximum reaching up to 10 mm d–1. Interestingly, areas with stronger climatological mean precipitation also display larger interannual variations, indicating that these areas are also prone to flooding disasters. NUIST-CFS1.0 could predict the precipitation center in north Fujian province well, albeit with a relatively weak intensity, but the model fails to capture the other precipitation center in central Guangdong province. In addition, compared to the observations, NUIST-CFS1.0 generally underestimates the magnitude of the climatological mean precipitation and the standard deviation of interannual variations in South China. This bias is commonly found in the ensemble mean prediction of precipitation using global climate models. That is, due to the too coarse resolution of the global climate models, small- and medium-scale processes that are important to precipitation are hardly reproduced (e.g., Xu et al., 2009). Figure S1 in the electronic supplementary material (ESM) shows the climatology mean precipitation and interannual standard deviation based on the nine-member forecast initiated from the 1st day of March. The nine-member forecasts show great spread of the skill in predicting the regionally averaged precipitation anomaly. The member with the highest TCC skill of 0.38 adopts a fully coupling scheme to transfer the momentum of the sea surface current directly to the atmosphere and weakest SST nudging coefficient. The exact reasons for the skill spread among the nine-member forecasts are still unknown and warrant future investigations.
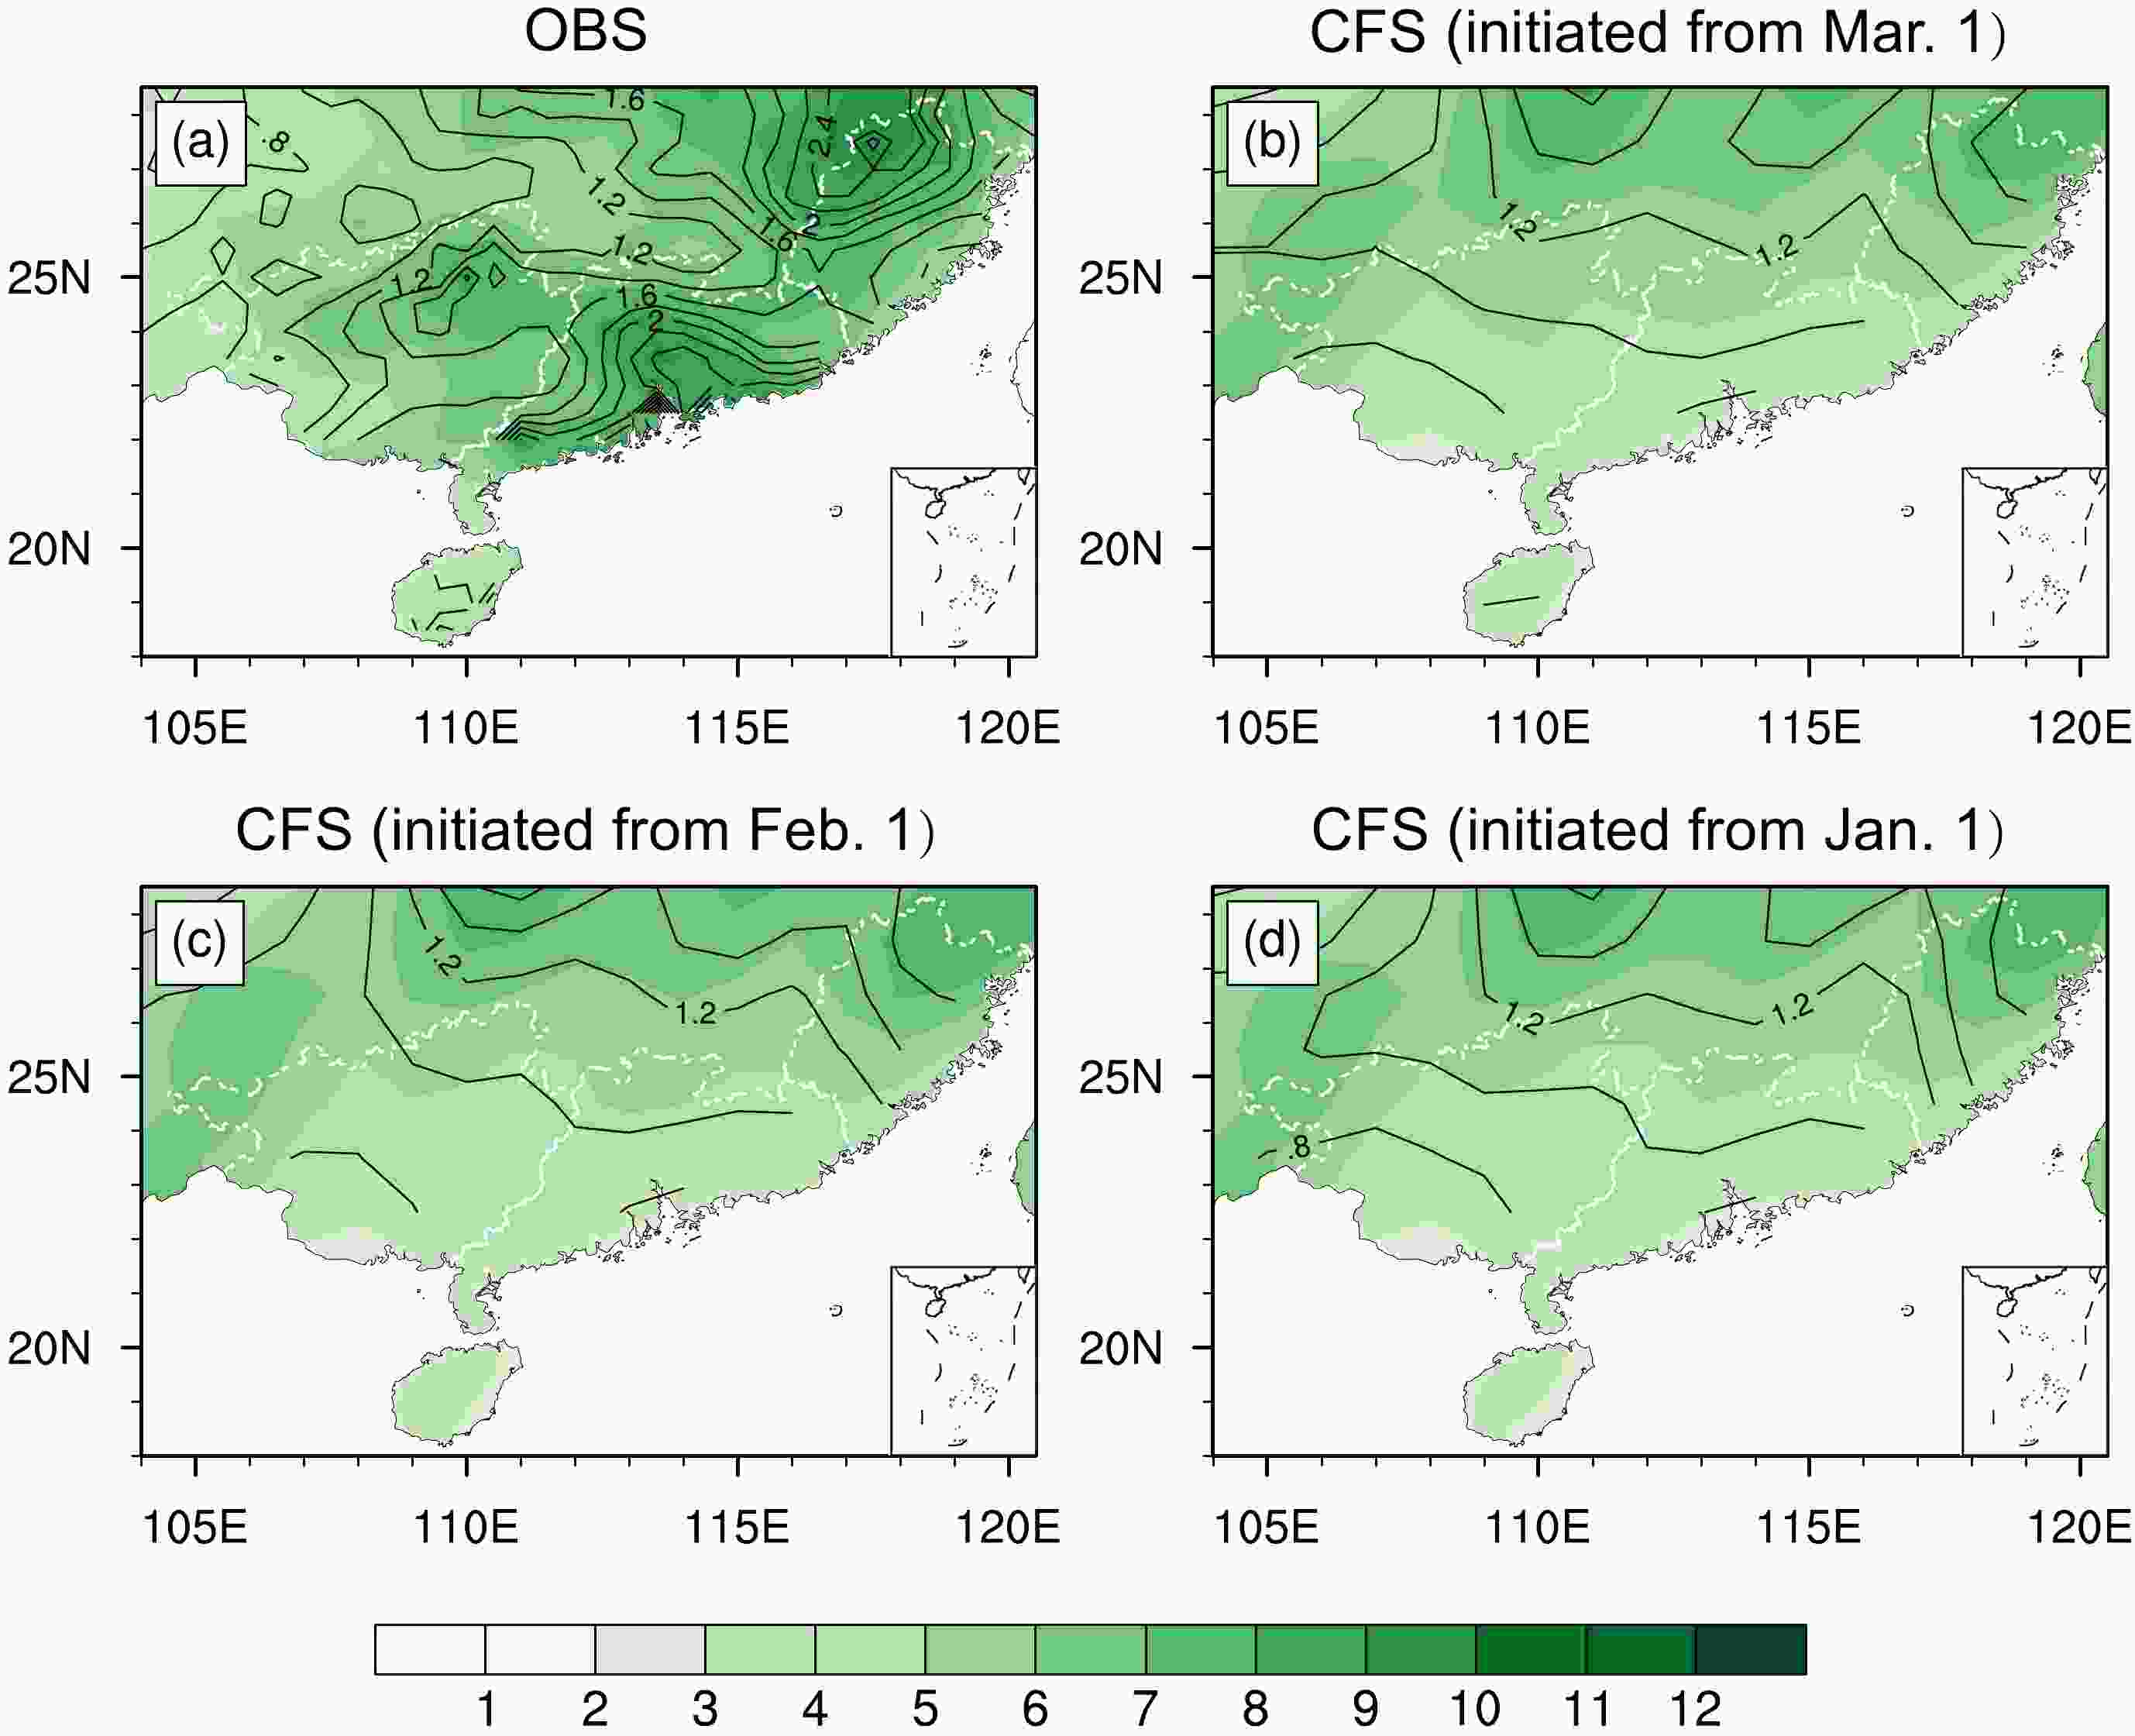
Figure 1. The spatial distribution of climatological mean precipitation (shading) and standard deviation of interannual precipitation anomaly (black line) (units: mm d−1) in the first rainy season (FRS, i.e., April–June) during 1982–2020 over South China based on (a) the observations and (b–d) NUIST-CFS1.0 nine-member ensemble mean predictions initiated from the 1st day of March, February, and January, respectively. White dashed lines denote the borders of Guangdong, Guangxi, and Fujian provinces.
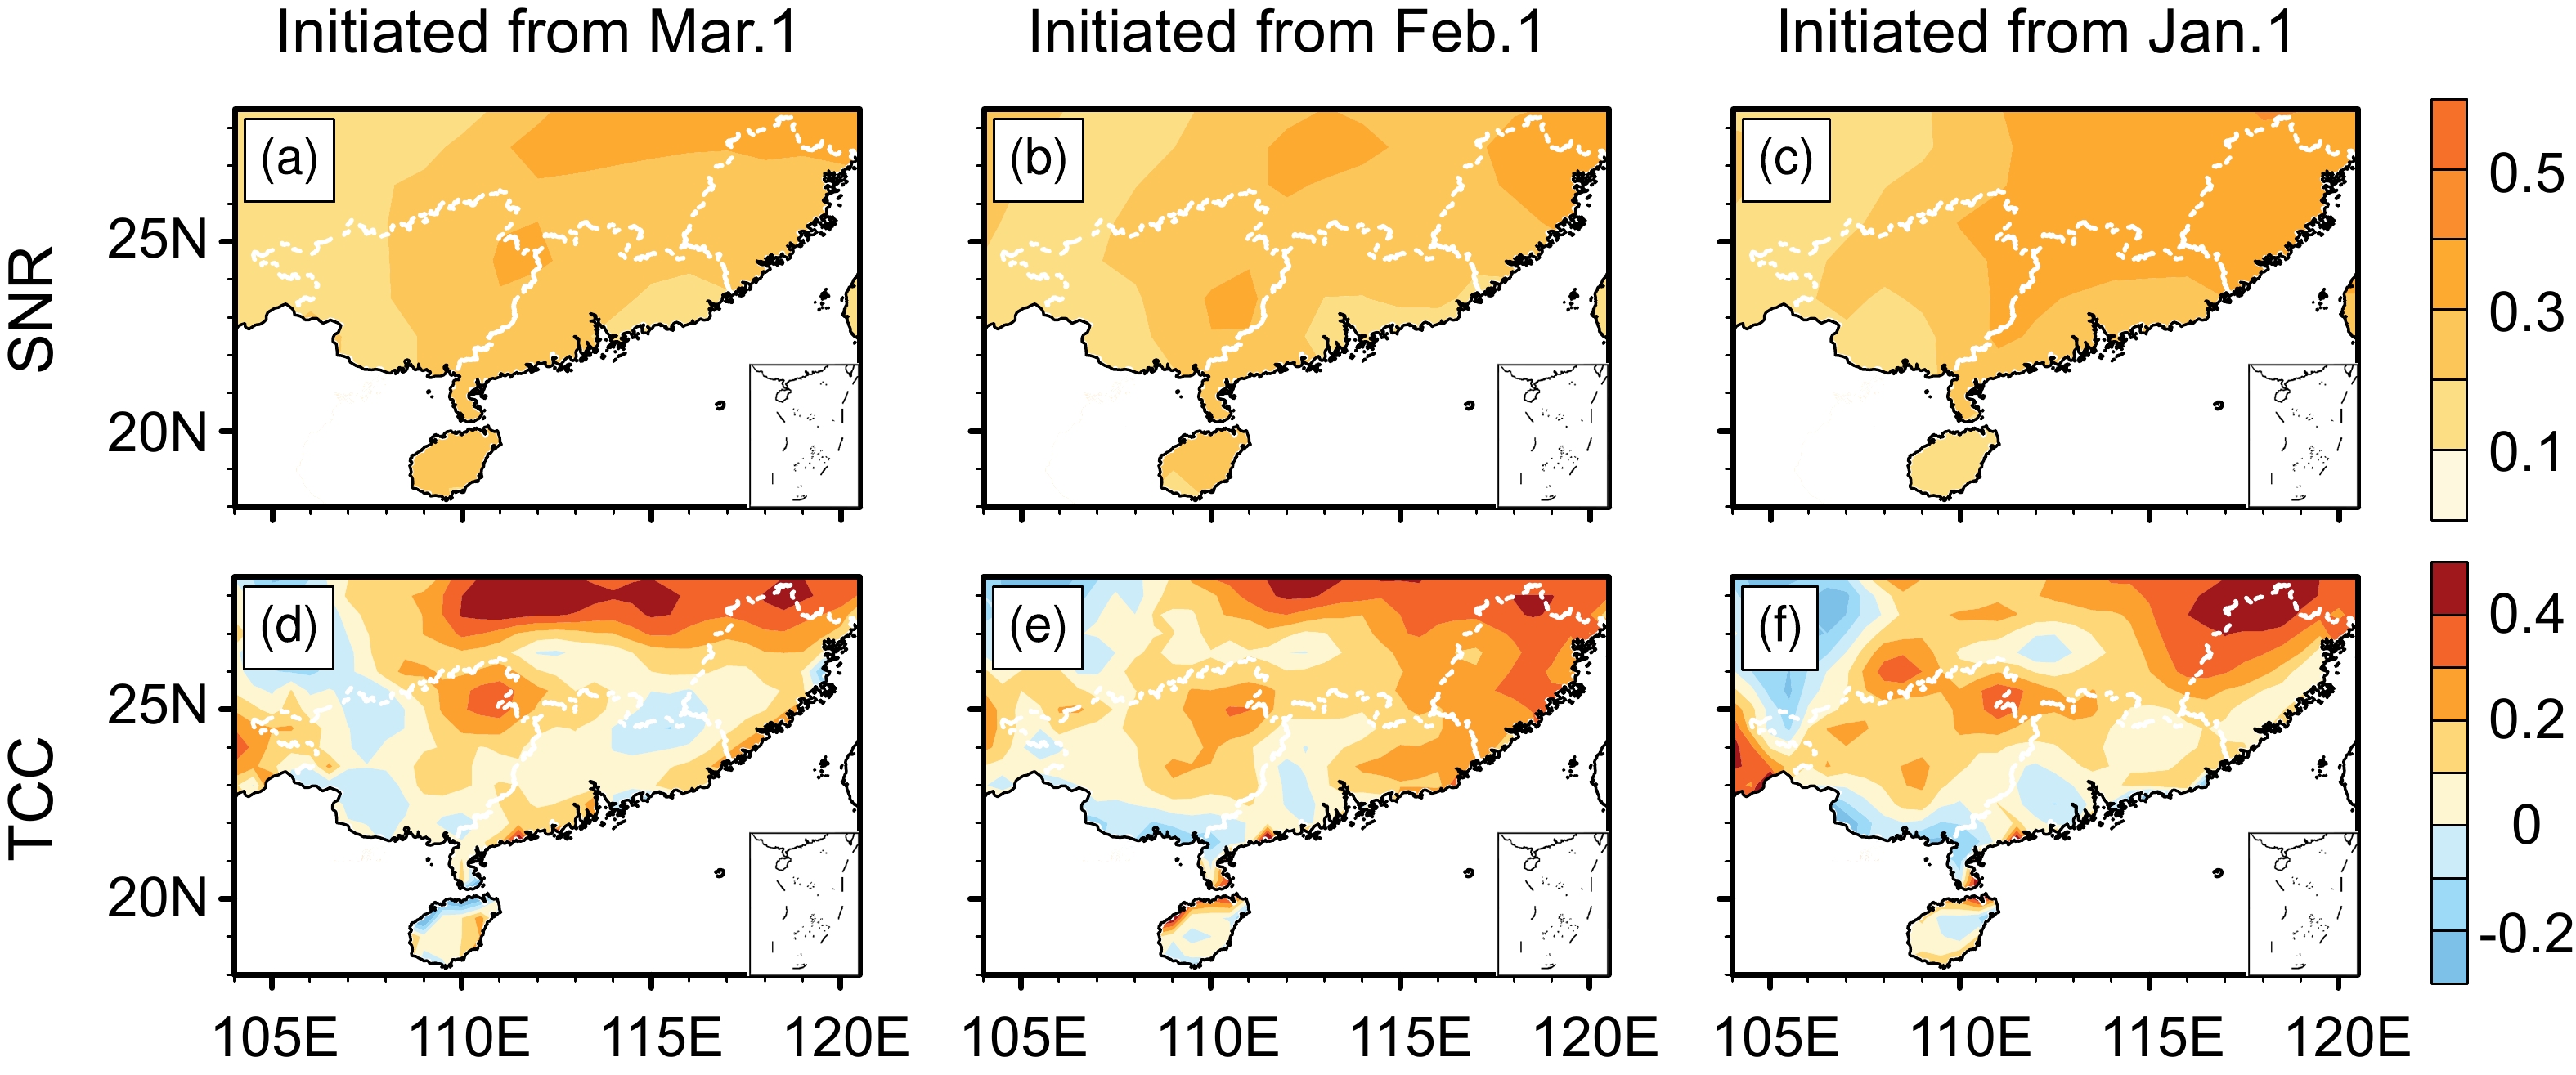
To measure the potential predictability of precipitation in the FRS over South China, we calculated the signal-to-noise ratio, which is defined as the ratio of the variance of the ensemble mean predictions to the mean ensemble spread among the nine member forecasts (Ehsan et al., 2017, 2020). The ensemble mean predictions generally represent the atmosphere response to the external forcing (such as SST), while the ensemble spreads correspond to the atmospheric internal variations induced by the strong chaotic dynamics of atmosphere. Thus, the larger the value of the signal-to-noise ratio, the higher the potential predictability of the precipitation anomaly. As shown in Figs. 2a–c, the signal-to-noise ratios of NUIST-CFS1.0 forecasts initiated from the 1st day of January, February, and March are all much smaller than 1 over South China, suggesting that the atmosphere internally driven variation of precipitation during the FRS is greater than the variation forced by the external forcing. In other words, reliable predictions of the precipitation in the FRS over South China remain difficult and fairly challenging.
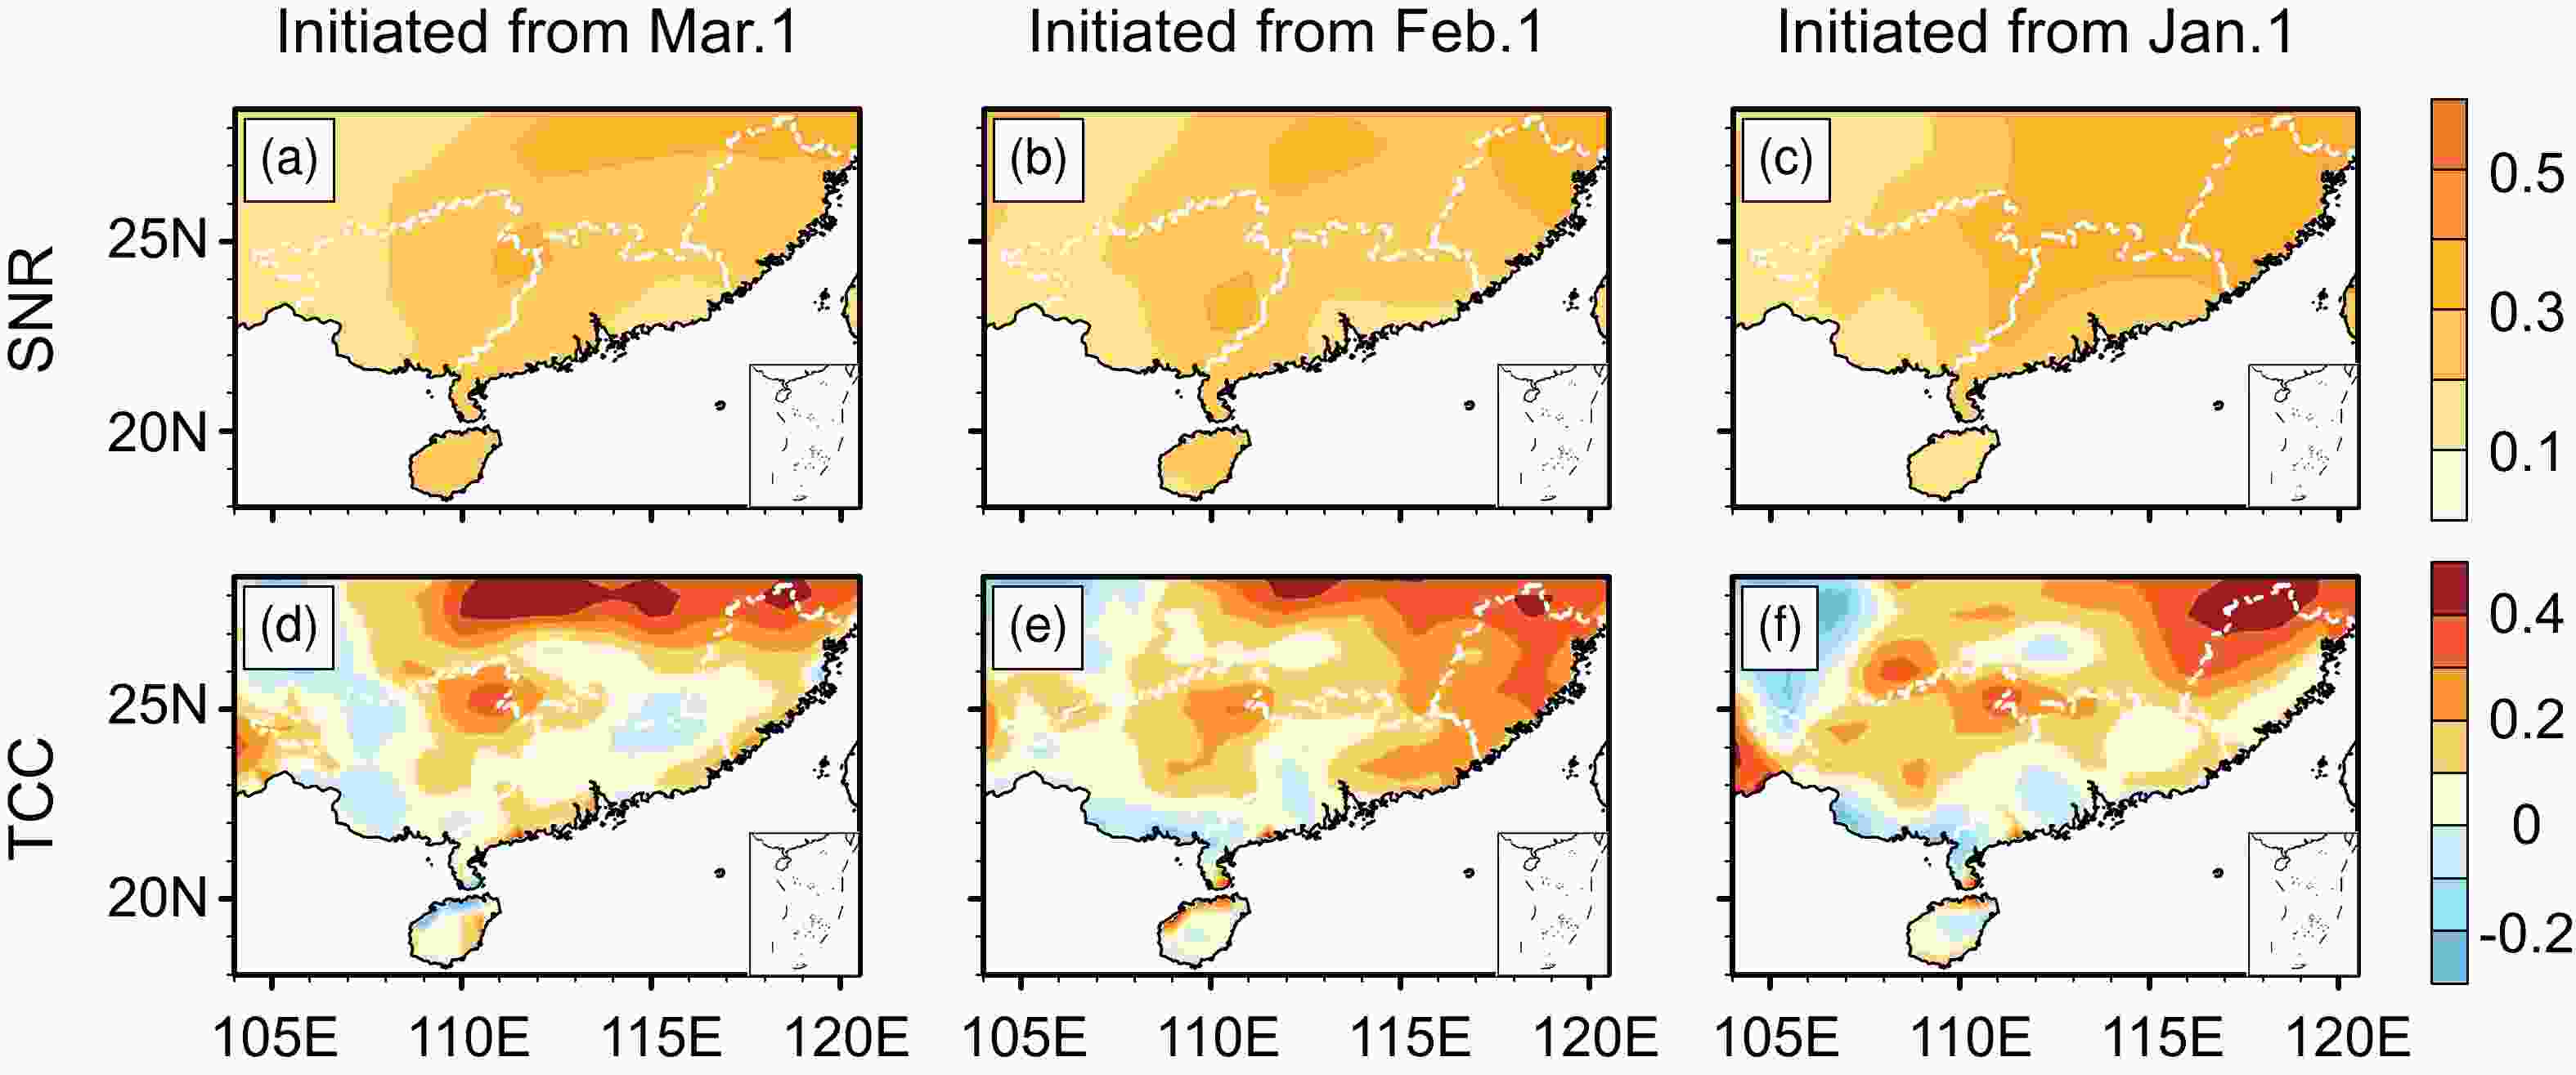
Figure 2. The spatial distribution of the signal-to-noise ratio (S/N Ratio) (top panels) and the correlation coefficients (bottom panels) of the FRS precipitation anomaly during 1982–2020 over South China based on the NUIST-CFS1.0 ensemble mean predictions initiated from the 1st day of (a) March, (b) February, (c) January. White dashed lines denote the borders of Guangdong, Guangxi, and Fujian provinces.
The TCC, PCC, and regionally averaged FRS precipitation anomaly over South China (i.e., the area of Guangdong, Guangxi, Fujian, and Hainan provinces as defined above) are calculated to evaluate the forecast skill (Figs. 2d–f and 3). The highest TCC score of up to 0.4 appears in Fujian, followed by 0.3 in Guangxi, while the lowest score of –0.2 appears in part of Hainan province. Although the TCC skill is somewhat dependent on lead time in general, forecasts from the three different initial months show a similar distribution of the prediction skill in South China (Figs. 2d–f). Interestingly, the forecasts initiated from 1 March (i.e., at one-month lead) do not outperform those initiated from 1 February and 1 January (i.e., at two- and three-month leads). This is in contrast to the forecasts of SST that usually display better skill at shorter lead times (e.g., Luo et al., 2016). This may be related to the fact that FRS precipitation is influenced by strong atmosphere internal variability, which can induce a random-type change in the prediction skill at different lead times. In addition, biases and uncertainties in model physics and initial conditions may also play a role. Another possibility is that impacts of preceding signals such as winter SST anomalies on FRS precipitation (e.g., Feng et al., 2011; Feng and Li, 2011; Cheng and Jia, 2014) may be better captured in the predictions initiated from January and February, compared to that from March. The rapidly growing monsoon and the attenuated ENSO signal in springtime may also increase uncertainty in predicting the tropical air–sea interactions in a coupled ocean–atmosphere forecast model (Webster and Yang, 1992; Yang et al., 2018). The complexity regarding FRS precipitation prediction over South China warrants thorough investigation in future studies.
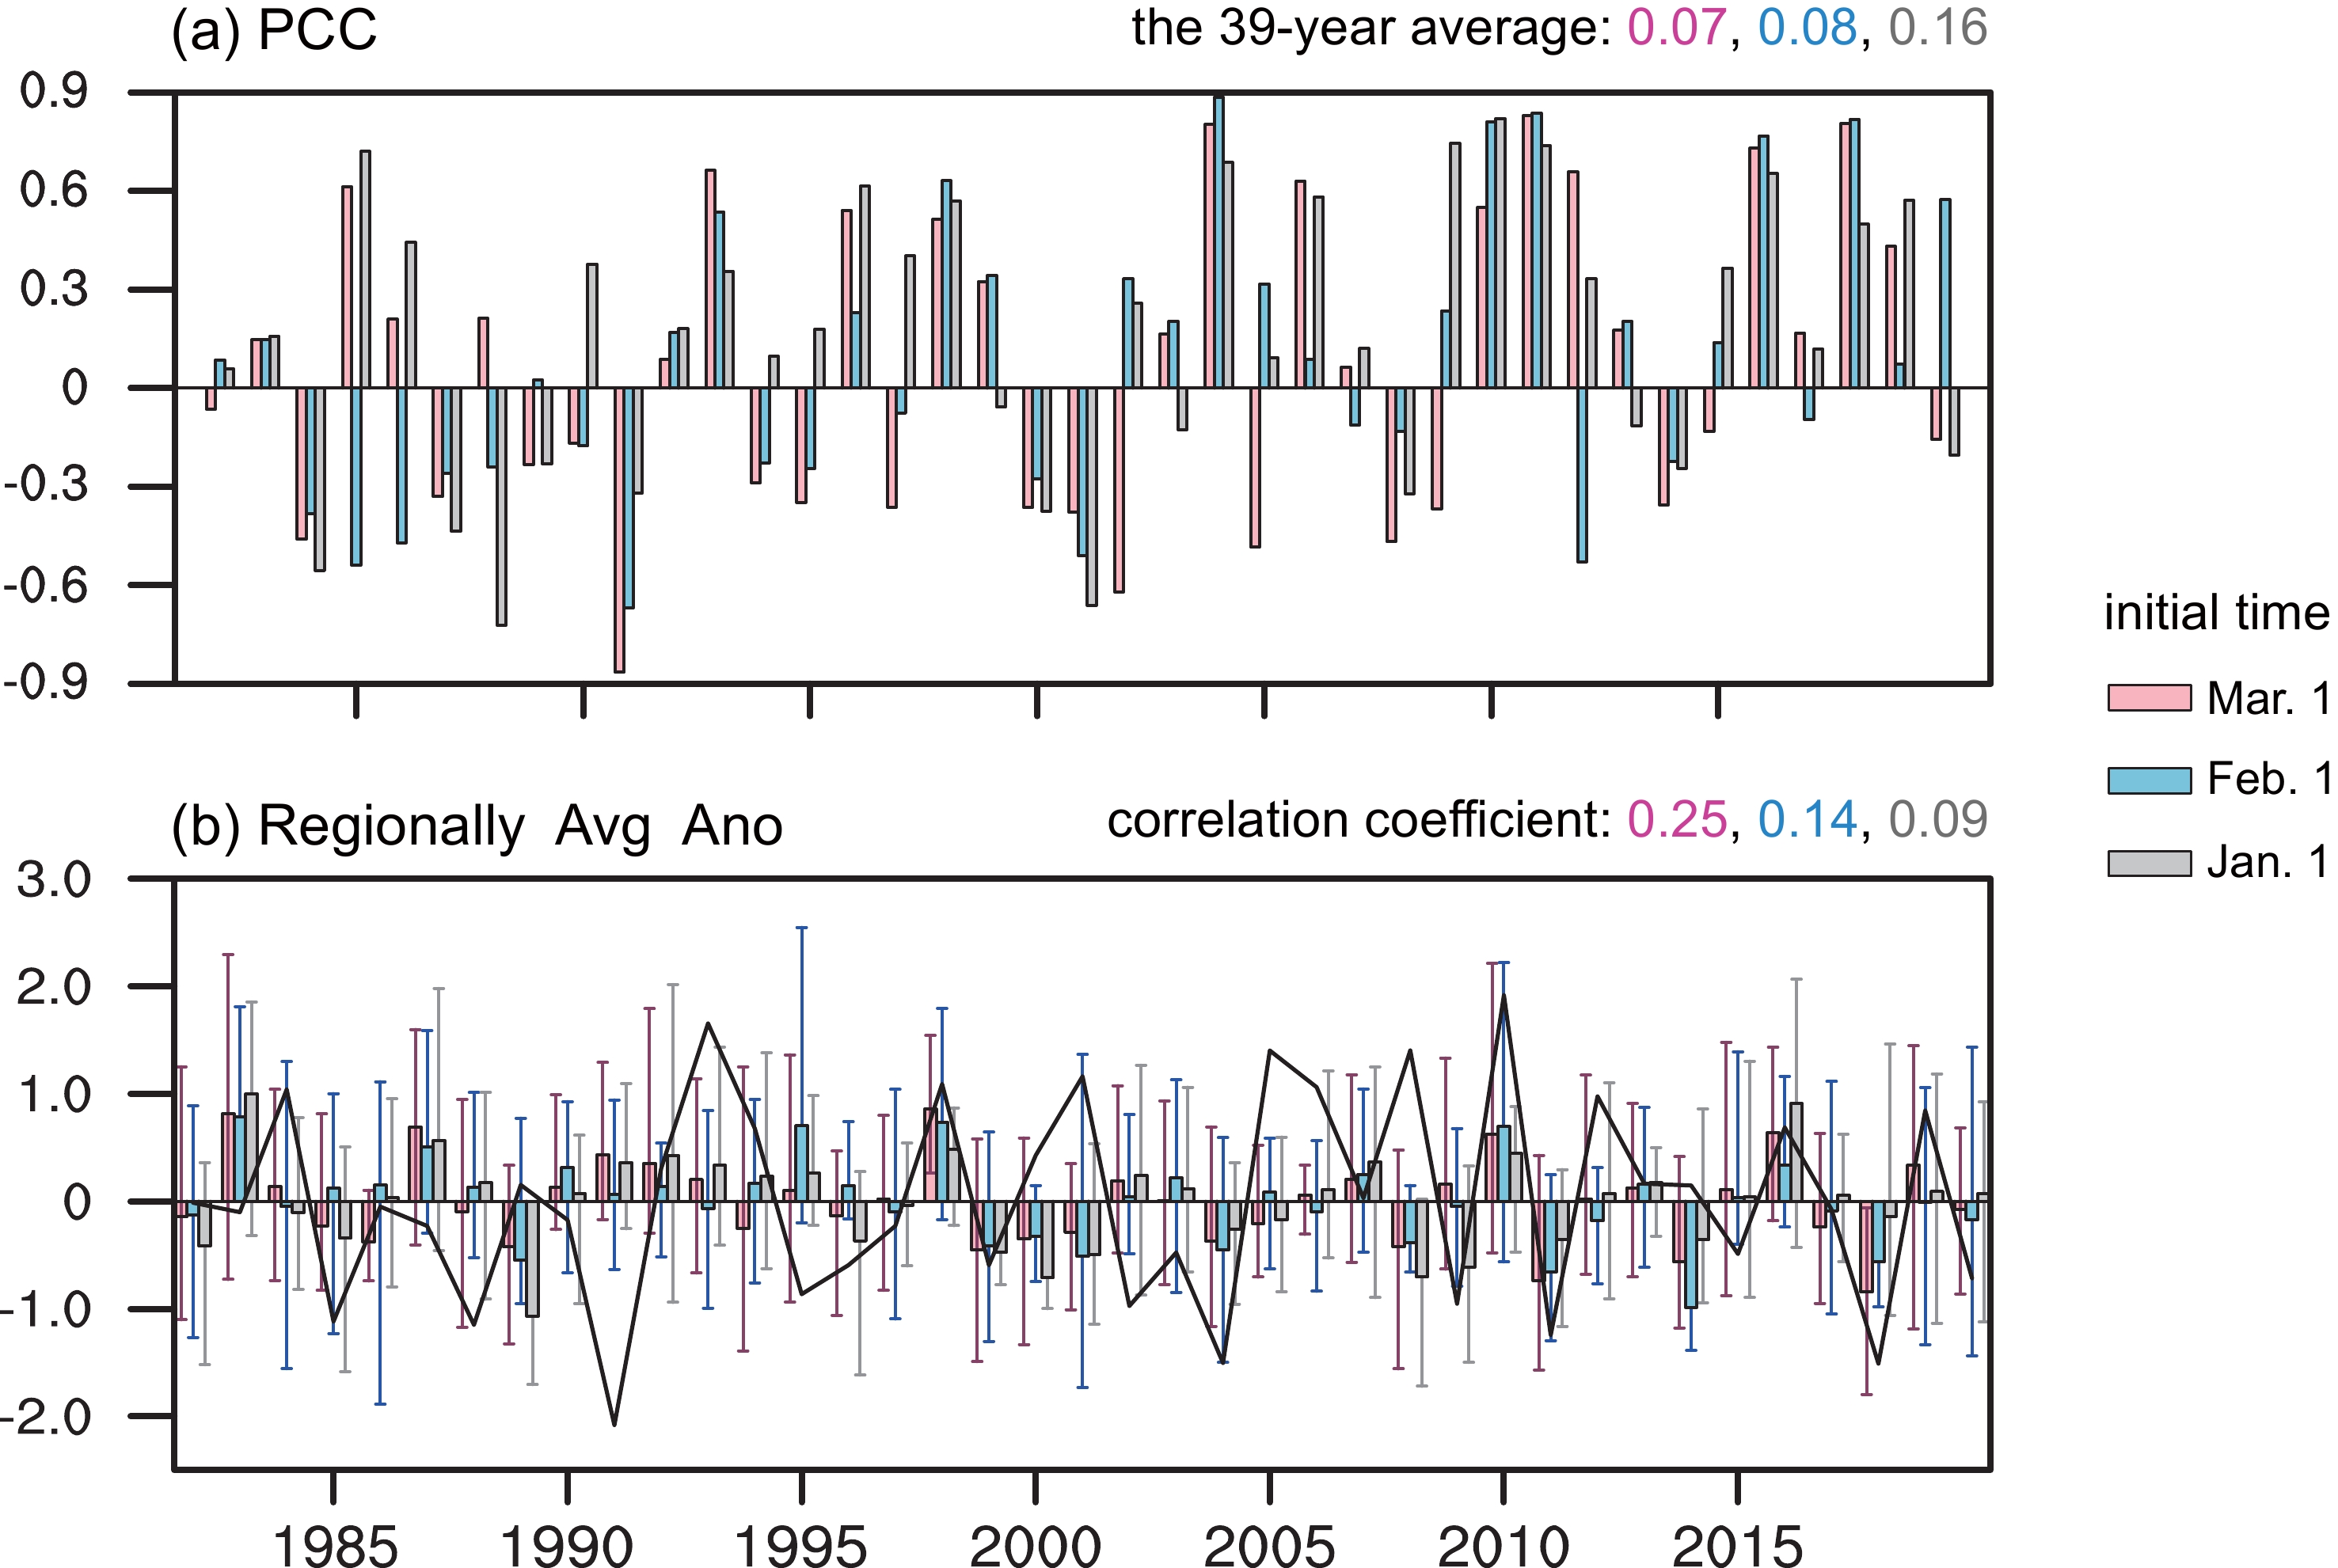
The PCC score acts to measure how well the spatial distribution of the precipitation anomalies over South China are predicted. NUIST-CFS1.0 performs well in some years such as 2004, 2010, and 2011, with the highest PCC value reaching above 0.8 (Fig. 3a). However, the PCC score can also be very poor in some other years, for instance, below –0.8 in 1991. This means that NUIST-CFS1.0 may predict almost an opposite spatial pattern of precipitation anomalies compared to the observations in some years. The large variation of the PCC from year to year indicates that the precipitation anomalies in the FRS over South China can be driven by fairly distinctive mechanisms in different cases. Figure 3b shows the interannual variation of the regionally averaged precipitation anomaly in South China during 1982–2020. The magnitudes of the predicted anomalies are generally weaker than the observations, partly because the ensemble mean acts to smooth out the atmospheric internal signals. In the years with strong El Niño events (like 1998), the predicted magnitudes at the three different lead times are close to the observations. In contrast, when the precipitation over South China during the FRS is mostly resulted from medium- and small-scale processes, such as in 2008 (e.g., Wang et al., 2011), it is difficult to be predicted by global climate models, although some members of the model ensemble forecasts could provide relatively better results. In short summary, the above results suggest that the seasonal forecast skill for FRS precipitation in South China assessed based on NUIST-CFS1.0 ensemble forecasts for 1982–2020 is relatively low, which is consistent with the low signal-to-noise ratio.

Figure 3. (a) The spatial correlation coefficients of the FRS precipitation anomaly during 1982–2020 in South China between the observations and NUIST-CFS1.0 ensemble mean predictions initiated from the 1st day of March (pink bar), February (blue bar), January (gray bar). (b) The regionally averaged precipitation anomaly (units: mm d−1) in South China based on the observations (black line), NUIST-CFS1.0 ensemble mean predictions initiated from the 1st day of March (pink bar), February (blue bar), January (gray bar). Error bars indicate the minimum-to-maximum range of the nine-member forecasts. Note that South China is defined as the area of Guangdong, Guangxi, Fujian, and Hainan provinces in this study.
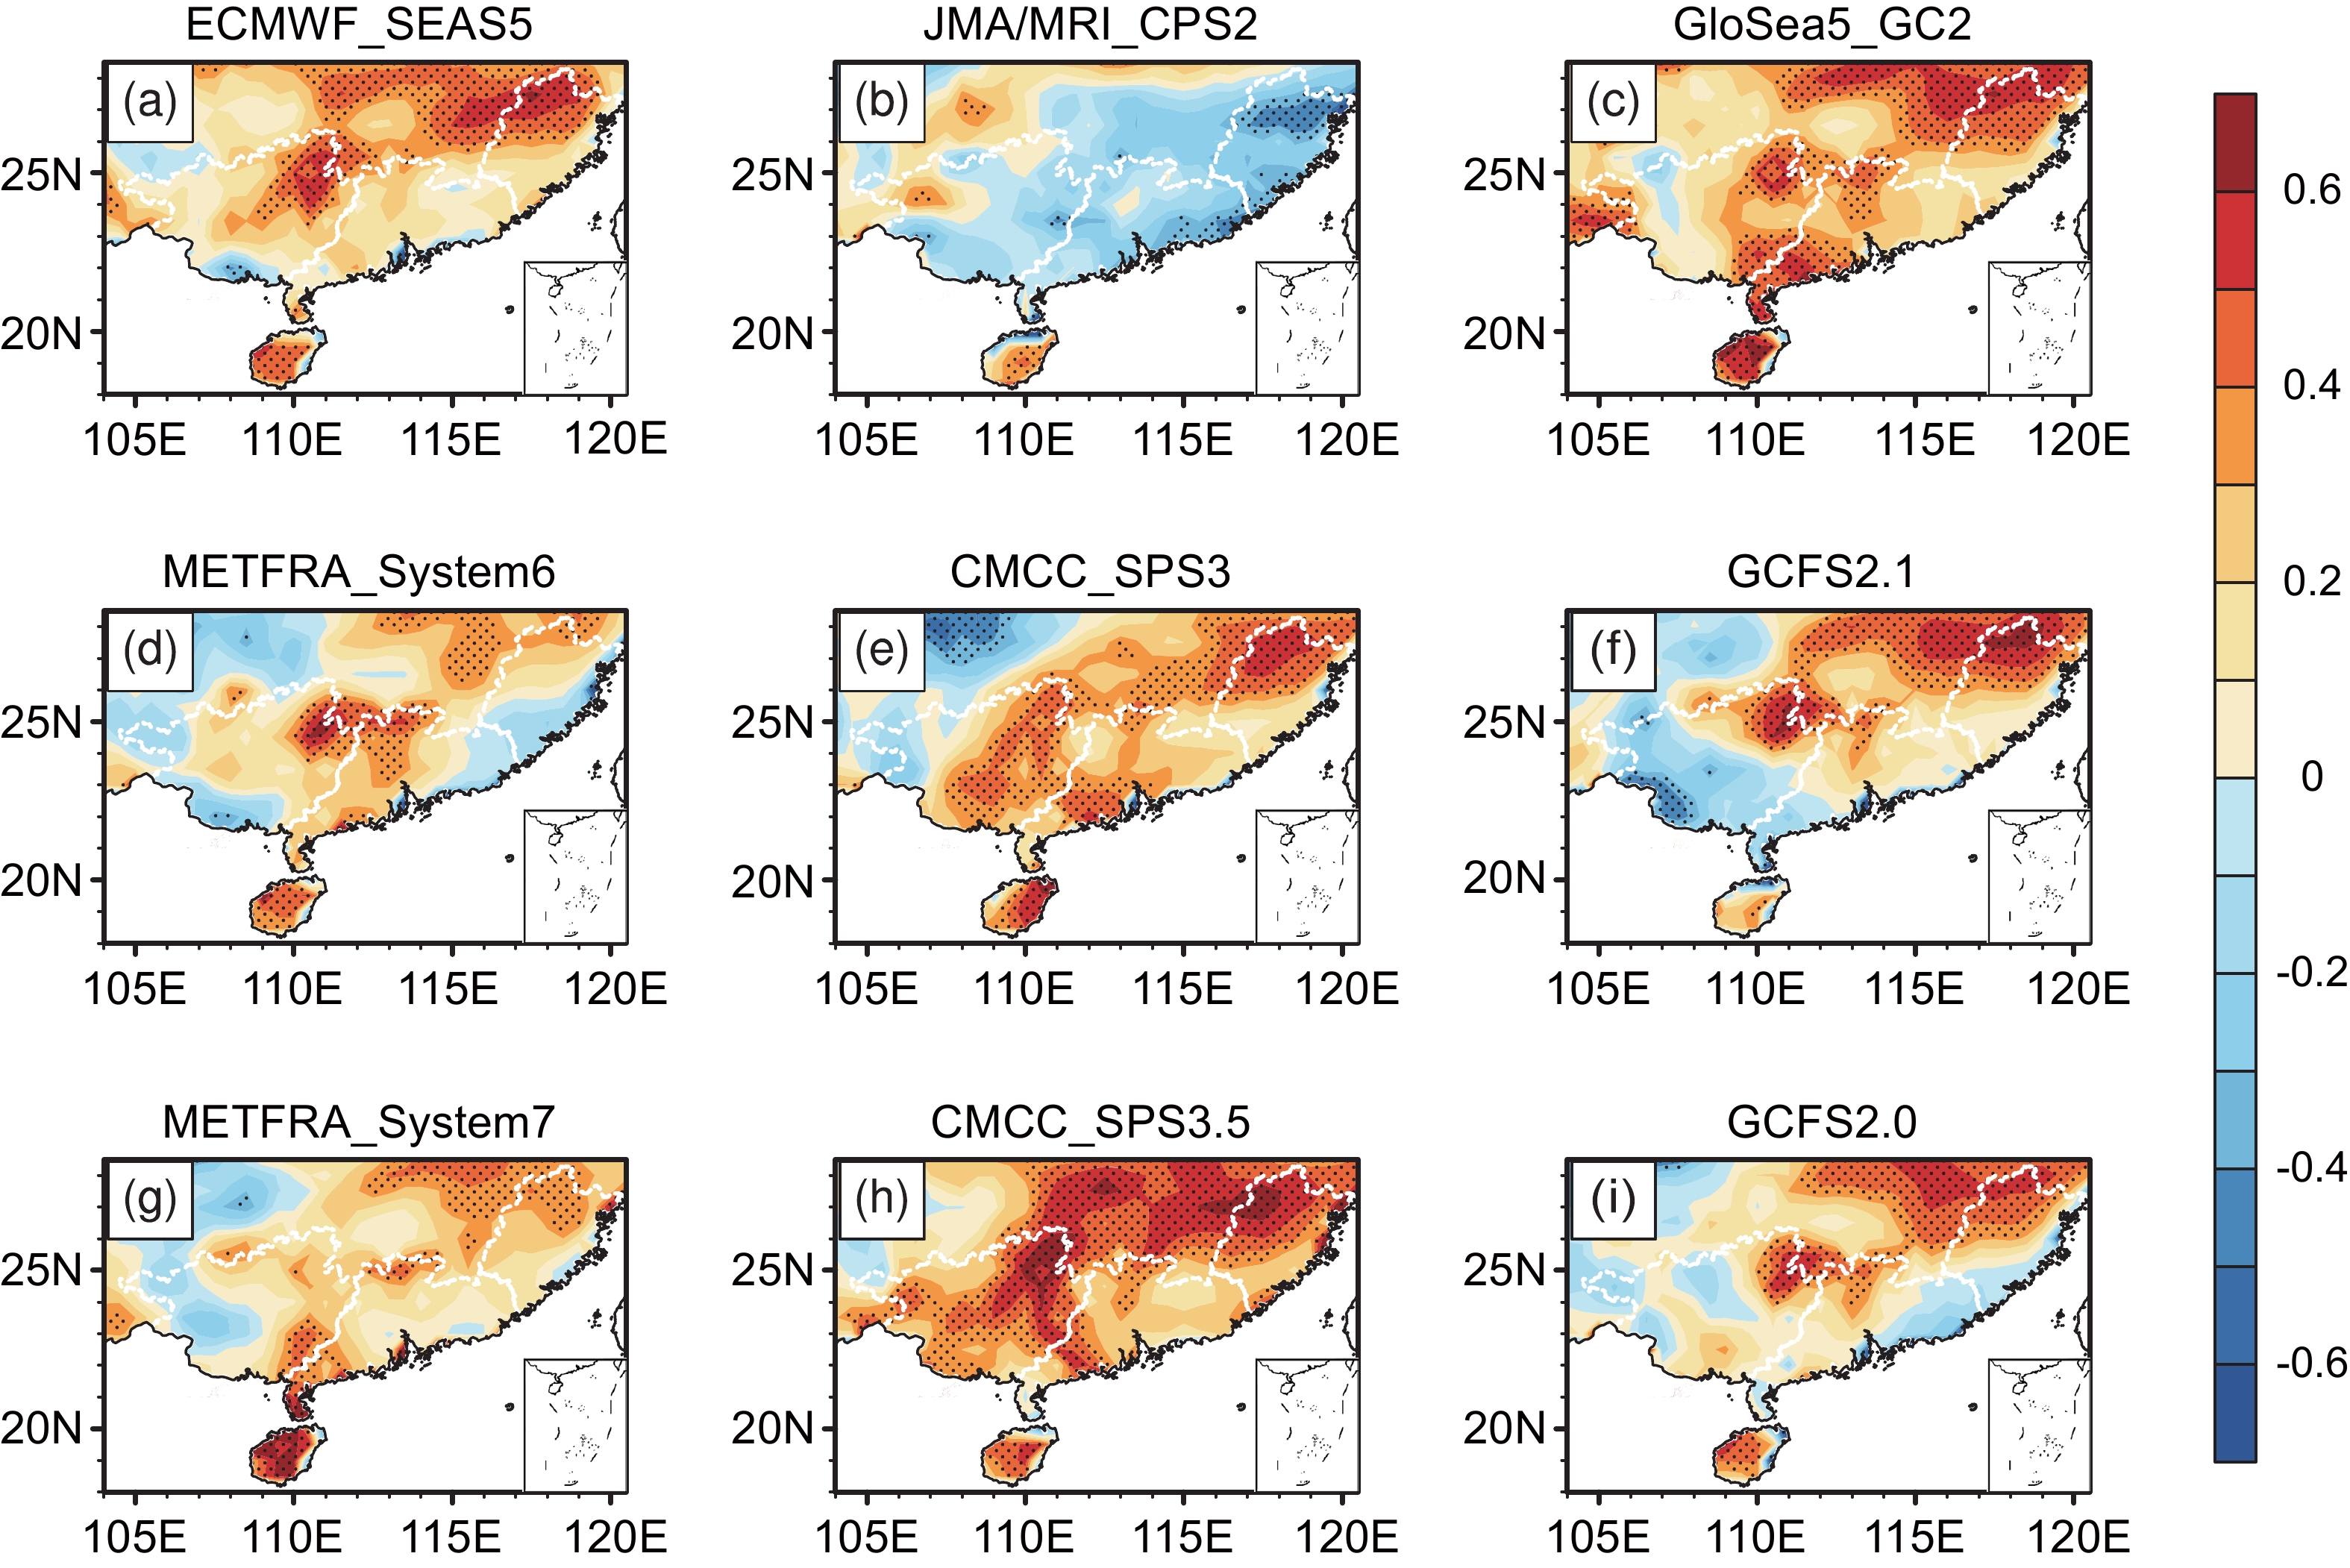
To better understand the predictability of the FRS precipitation anomaly in South China, we further assessed nine international climate models’ forecast skills. The nine models’ ensemble hindcast data was downloaded from Copernicus Climate Change Service (as shown in Table 1), and many of the models were developed by operational centers for issuing real-time forecasts. We selected their hindcast outputs for 1993–2016, which is available for all the models. Here, we briefly compare the prediction skills based on the hindcasts initiated from 1 March (i.e., one-month lead). Figure 4 shows the TCC skill in predicting FRS precipitation anomalies over South China based on nine international climate models’ hindcasts initiated from 1 March from 1993 to 2016. The results show great variation in prediction skill among the models. Some of them produce positive skill over a large part of South China, reaching as high as 0.6 in local regions (e.g., CMCC_SPS3.5). In contrast, some of the models produce weak and even negative skill in many parts of South China (e.g., JMA/MRI_CPS2). The regionally averaged TCC skill, the 24-year mean PCC skill, and the TCC skill in predicting the regionally averaged precipitation anomaly over South China for 1993–2016 based on NUIST-CFS1.0 are better than the skills of most of the nine international models (Table 2). As was discussed in Luo et al. (2008), a good dynamical model forecast system must meet the following four elements: good performance in simulating the phenomenon/predictand, realistic and well-balanced initial conditions that help reduce initial shock, good ensemble scheme that can measure uncertainties/errors in model physics and initial states, and realistic representation of external radiative forcing. The difference in the prediction skill among the different model forecast systems is generally a result of their different performance on the above four elements. Exploring detailed reasons for these results requires more data, sensitivity experiments, and future investigations. It is worth noting that the prediction skill of almost all the models is lower than 0.5, indicating the great challenge in predicting FRS precipitation in South China. In addition, the skill of NUIST-CFS1.0 for 1993–2016 is higher than that during 1982–2020, suggesting a potential decadal change in FRS precipitation predictability.
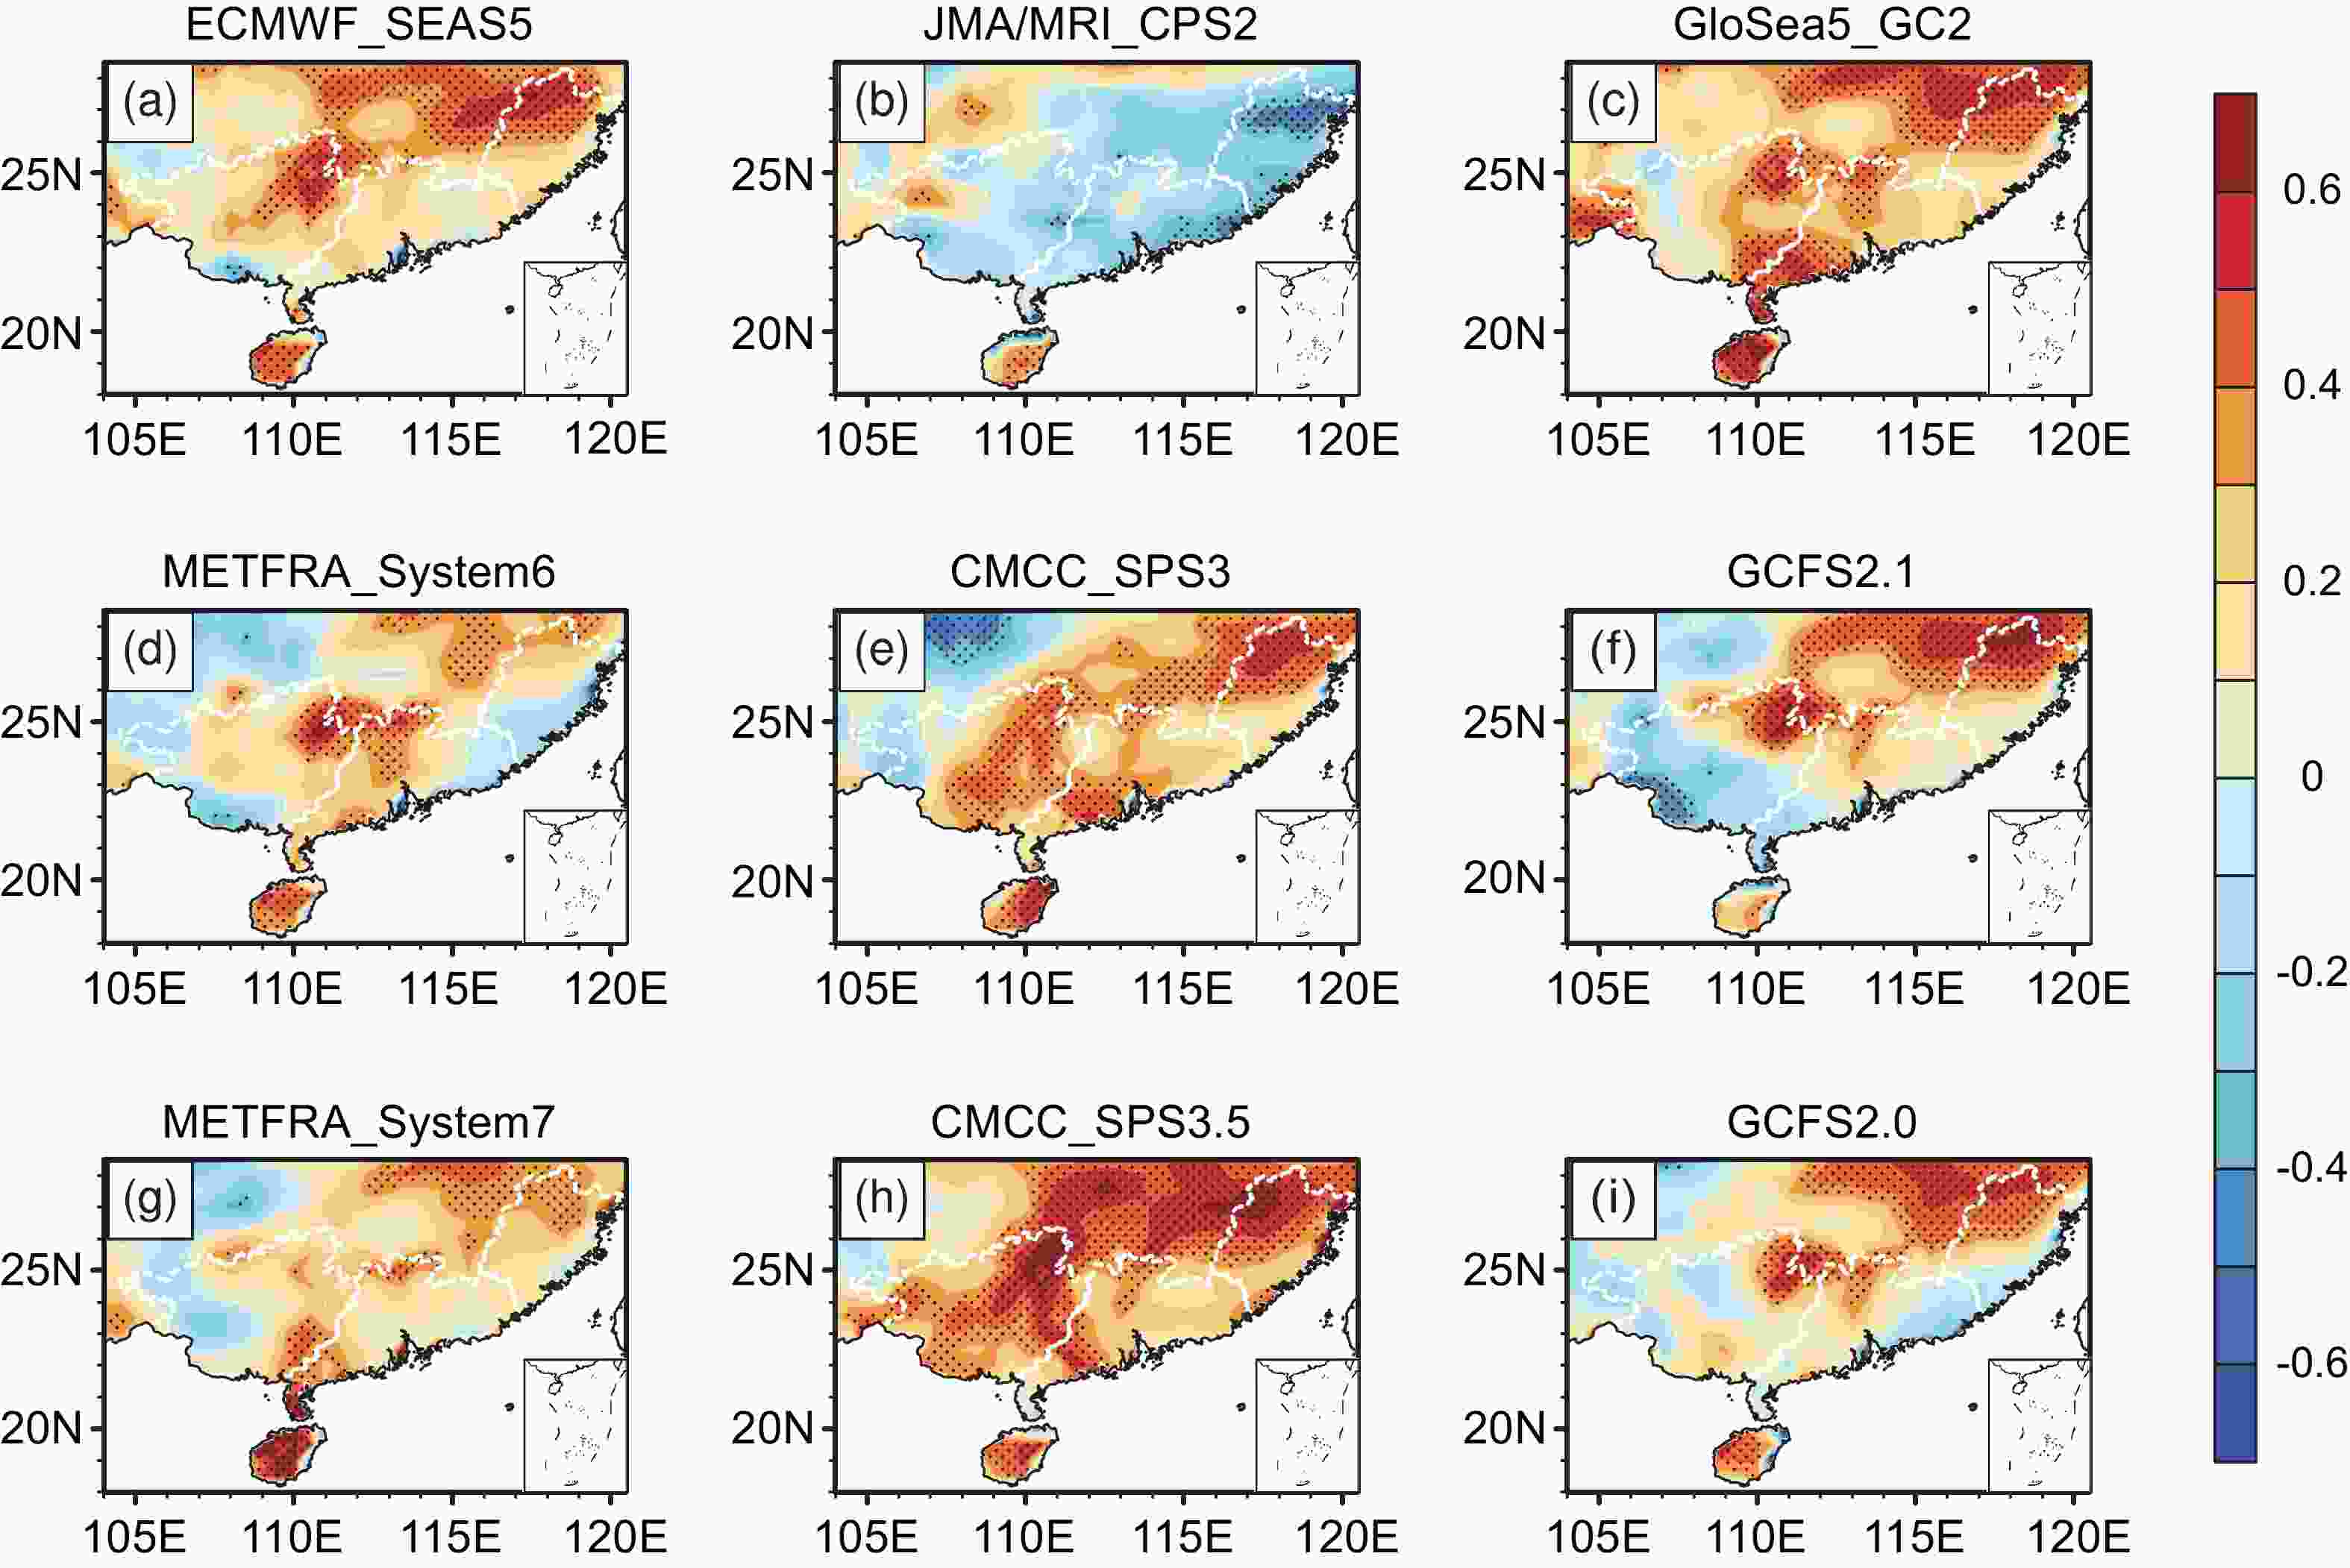
Figure 4. The correlation coefficients of the FRS precipitation anomaly during 1993–2016 over South China between the observations and ensemble mean hindcasts initiated from the 1st day of March based on (a) ECMWF_SEAS5, (b) JMA/MRI_CPS2, (c) GloSea5_GC2, (d) METFRA_System6, (e) CMCC_SPS3, (f) GCFS2.1, (g) METFRA_System7, (h) CMCC_SPS35, and (i) GCFS2.0. White dashed lines denote the borders of Guangdong, Guangxi, and Fujian provinces.
Model TCC PCC Regionally averaged anomaly The anticyclone index NUIST-CFS1.0 0.29 0.24 0.38 0.67 WRF 0.11 0.07 0.14 ECMWF_SEAS5 0.22 0.06 0.32 0.68 JMA/MRI-CPS2 −0.08 −0.03 −0.24 0.34 GloSea5-GC2 0.30 0.23 0.41 0.32 METFRA_System6 0.12 0.08 0.26 0.41 METFRA_System7 0.15 0.14 0.21 0.56 CMCC_SPS3 0.18 0.26 0.49 0.73 CMCC_SPS3.5 0.31 0.27 0.51 0.77 GCFS2.0 0.13 0.07 0.21 0.63 GCFS2.1 0.13 0.04 0.22 0.63 Table 2. List of the regionally averaged temporal correlation coefficient (TCC), and the 24-year mean pattern correlation coefficient (PCC) and the correlation coefficient of regionally averaged precipitation anomaly in the FRS over South China and the anomalous anticyclone index in the tropical northwestern Pacific between 10 global models’ forecasts and the observations during 1993–2016. The skill of WRF downscaling predictions are also listed. Note that South China is defined as the area of Guangdong, Guangxi, Fujian, and Hainan provinces in this study.
-
To explore possible causes of precipitation variation, we performed a composite analysis based on wet and dry years selected from the observational data. The wet and dry years were identified when the precipitation anomaly in the FRS over South China is one standard deviation greater/smaller than the climatological mean precipitation. The wet years include 1993, 1998, 2001, 2005, 2006, 2008, 2010, and 2012, and the dry years include 1985, 1988, 1991, 2004, 2011, and 2018. The composite difference between the wet and dry years in the low-level circulation is presented in Fig. 5a. An anomalous anticyclone can be found in the tropical northwestern Pacific (east of the Philippines). The southerly winds along the western part of this anomalous anticyclone help transport more moisture northward that converges over South China and hence induces more precipitation there. Figure 5b displays the composite circulation anomalies based on the NUIST-CFS1.0 ensemble mean predictions initialized from 1 March. The results indicate that the anomalous anticyclone in the tropical northwestern Pacific can be predicted well, albeit with an underestimated magnitude. To quantitatively present the characteristic of the anomalous anticyclone, here we define the Philippines anomalous anticyclone index as the difference between the zonal wind of 17.5°–27.5°N, 125°–165°E and that of 0°–7.5°N, 135°–170°E (i.e., the black boxes in Figs. 5a–b), a method similar to that proposed by Wang et al. (2000). The correlation coefficient of this anticyclone circulation index between the observation and the model ensemble mean prediction for 1982–2020 reaches 0.63 (Fig. 5c), which is statistically significant at the 99% confidence level. This suggests that NUIST-CFS1.0 performs well in predicting the circulation that is important to FRS precipitation over South China. In addition, most of the nine international models also show high skill in predicting the anomalous anticyclone circulation, but this is not sufficient to produce good skill in predicting precipitation (Table 2). This is because precipitation is not only affected by large-scale circulations but also influenced by small- and medium-scale signals, which are difficult to capture for GCMs.
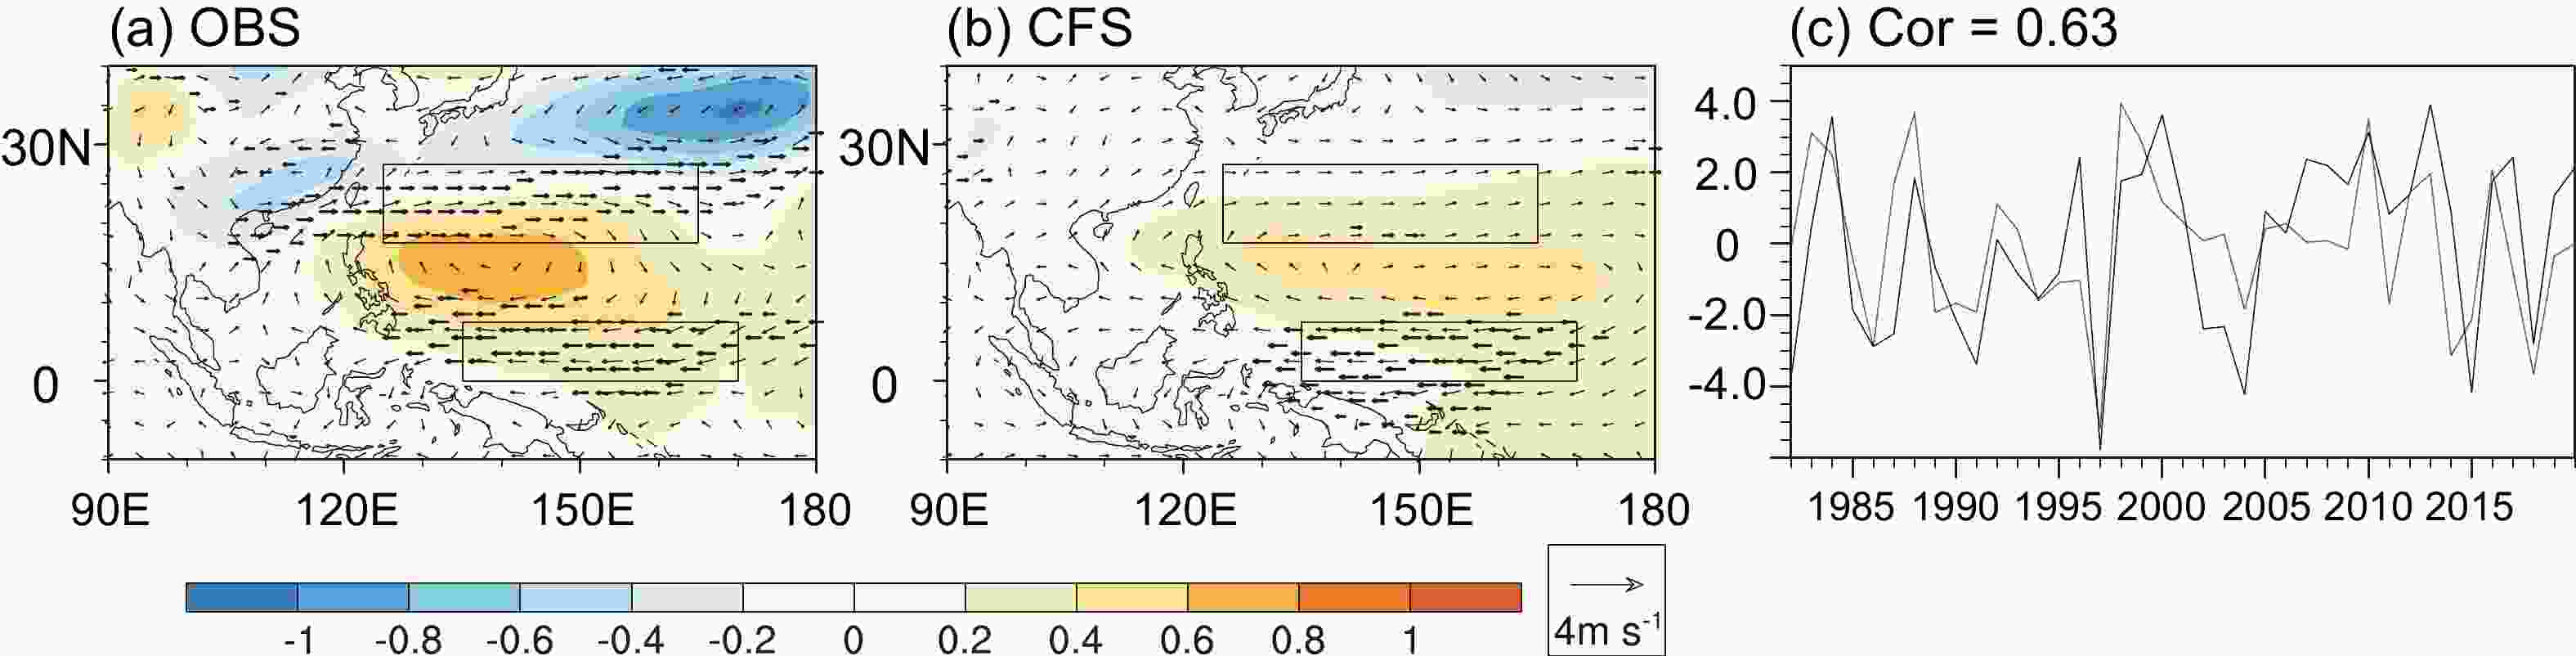
Figure 5. The composite circulation anomalies at the 850-hPa level between the wet and dry FRS years based on (a) the NCEP reanalysis and (b) NUIST-CFS1.0 ensemble mean predictions initiated from 1 March (vector denotes winds, units: m s−1; color shading denotes height, units: m). Bold vectors indicate the zonal wind anomalies are significant at the 90% confidence level based on two-tailed Student’s t-test. (c) The time series of the anticyclone index based on the observations (black line) and NUIST-CFS1.0 ensemble mean predictions initiated from 1 March (green line). The anticyclone index is defined as the zonal wind difference between the north and south box (see the black boxes in Figs. 5a and 5b).
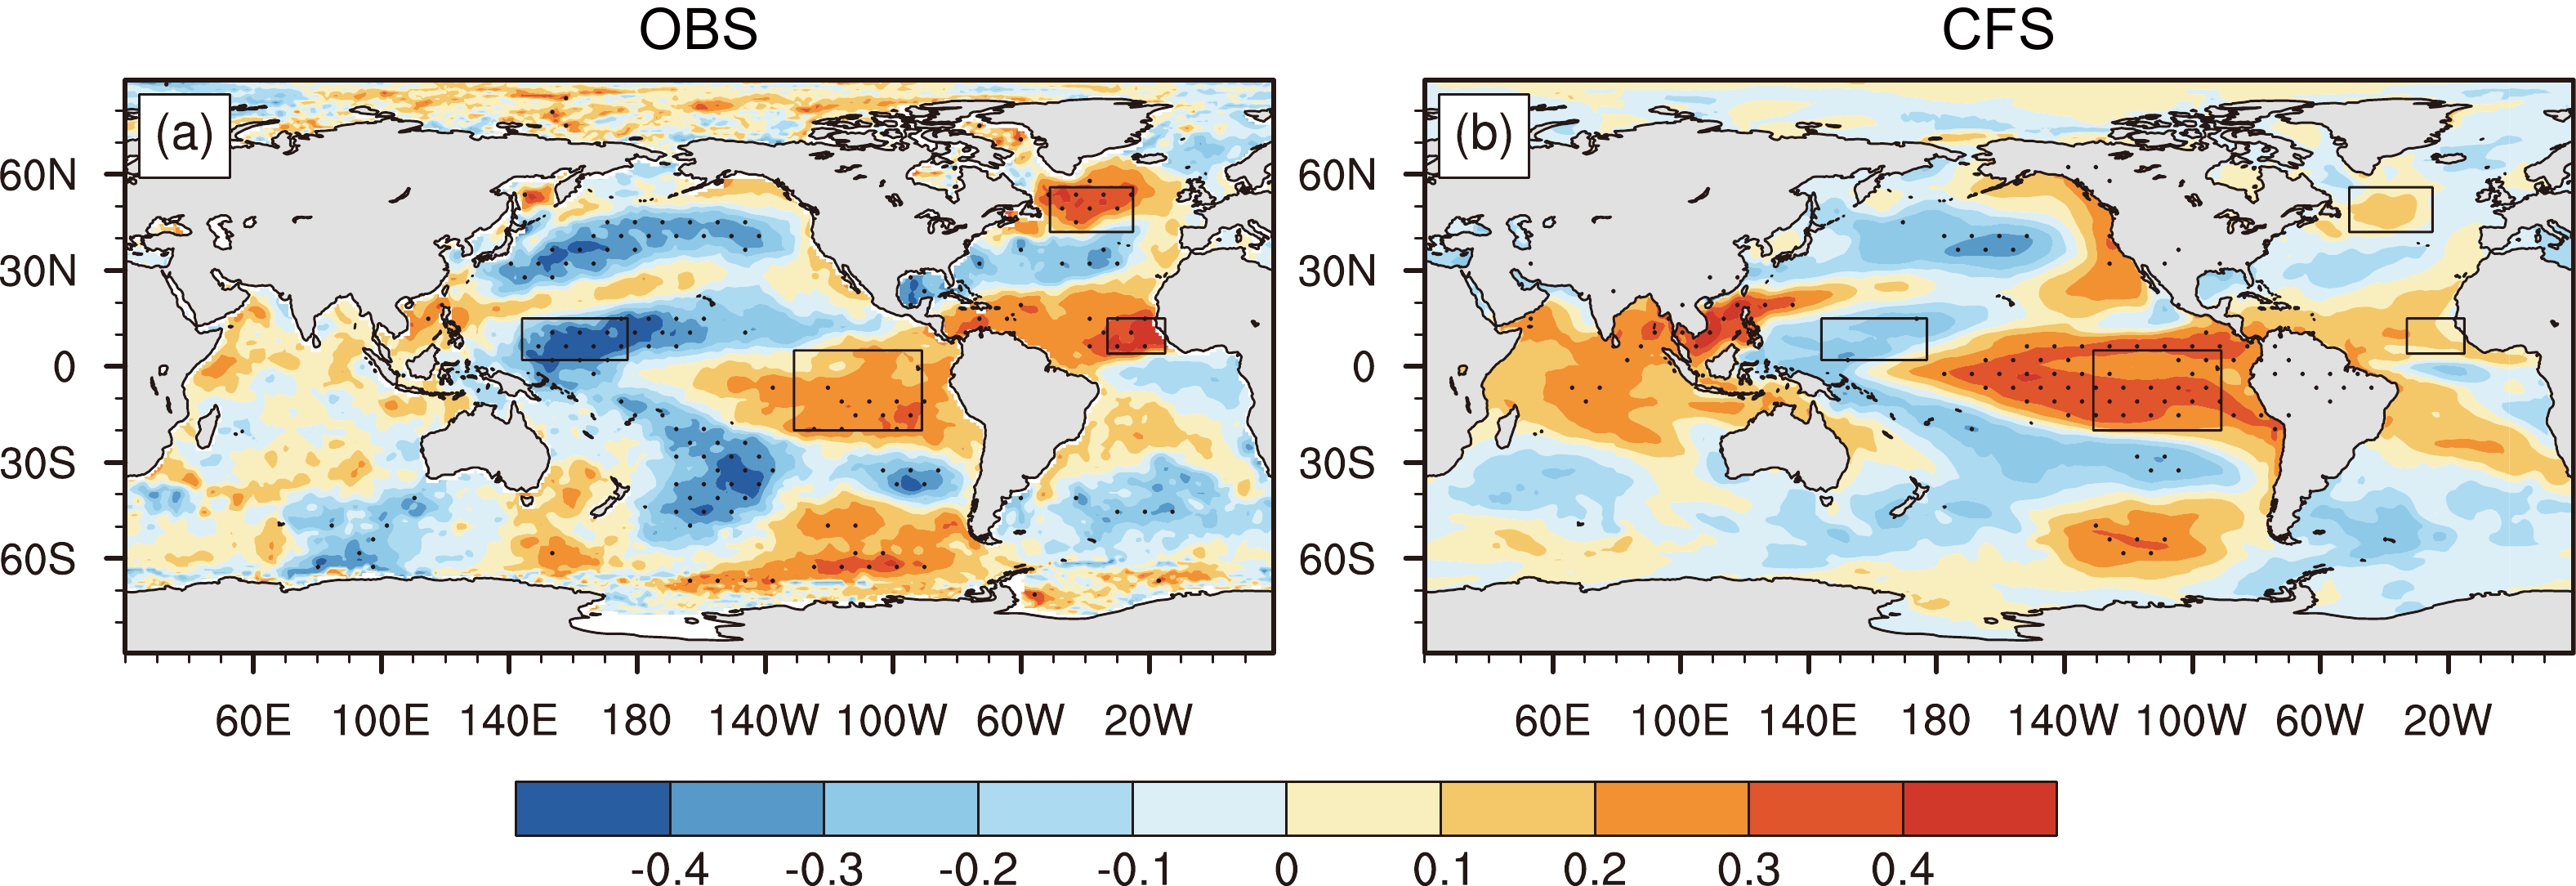
SST has been widely recognized as one of the most important external forcings and sources of predictability for precipitation in the FRS over South China (e.g., Huang and Wu, 1989; Luo et al., 2005a, 2020; Yuan et al., 2019). To explore how well NUIST-CFS1.0 can reproduce the relation between SST and precipitation variations, the correlations between global SST and the FRS precipitation anomalies during 1982–2020 are calculated (Fig. 6). Significant negative correlations are observed in the tropical western Pacific, northern North Pacific, South Pacific, and central North Atlantic, while positive relations can be found in the tropical eastern Pacific, tropical Atlantic, and northern North Atlantic. The correlations between FRS precipitation and the SST anomalies in the tropical Pacific and the Atlantic agree well with previous studies (e.g., Gu et al., 2018; Li et al., 2018), but the correlations between the Indian Ocean SST and FRS precipitation over South China (e.g., Xie et al., 2009; Jia et al., 2021) are not found to be significant in this study, possibly due to the decadal variation of the relationship (see Fig. S3 in the ESM). In general, the NUIST-CFS1.0 predictions are able to reproduce the spatial pattern of the correlations between FRS precipitation in South China and global SST, but with large local discrepancies. The correlation coefficients in many areas are weaker than what is observed, indicating that the impacts of SST on FRS precipitation in South China might be underestimated in the climate model. To better understand the influences of SST on FRS precipitation, we selected four key areas, namely the tropical western Pacific (TWP), the tropical eastern Pacific (TEP), the tropical Atlantic (TA), and the northern North Atlantic (NA) where the SST has shown significant correlations with FRS precipitation in the observation (see the boxes in Fig. 6).
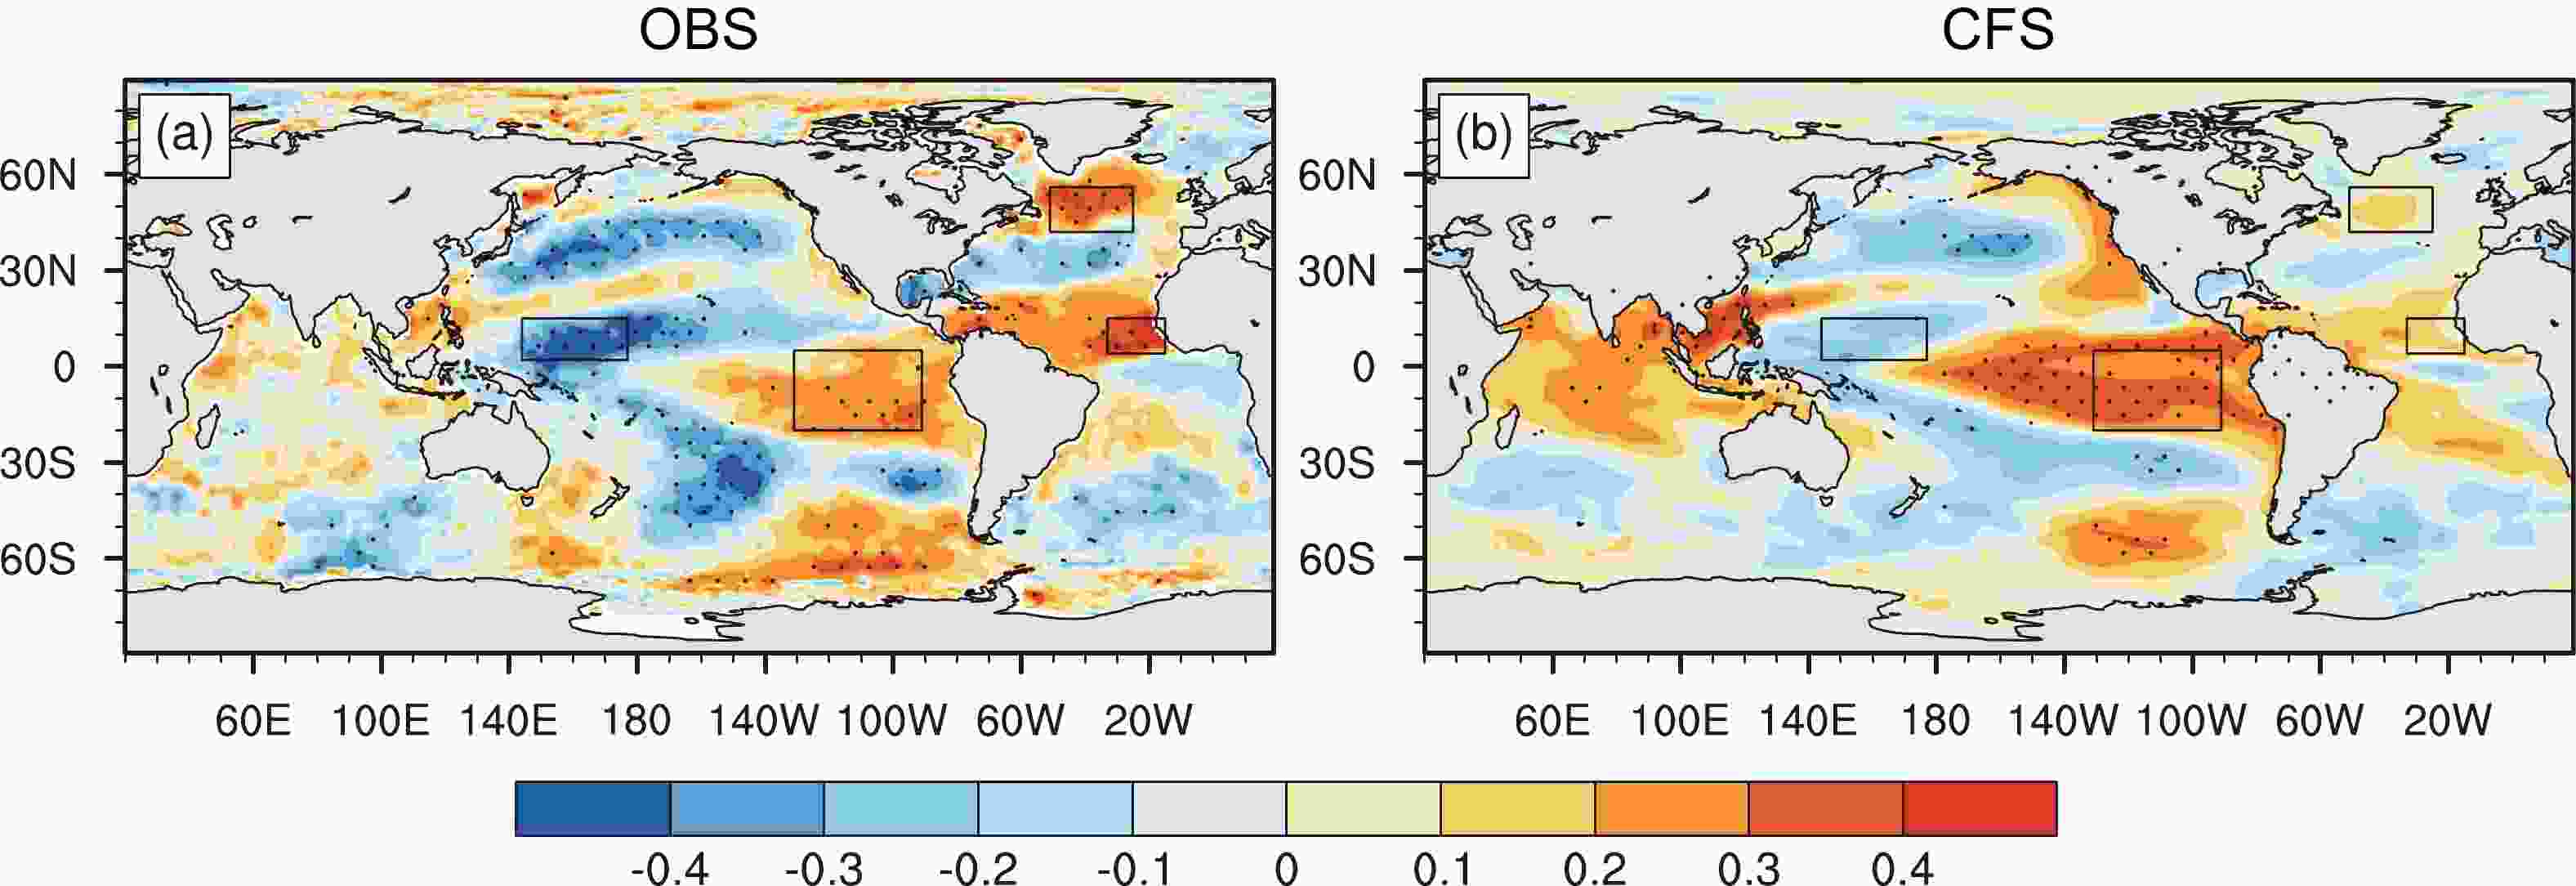
Figure 6. The correlation coefficients between the global sea surface temperature (SST) and the regionally averaged precipitation anomaly in the FRS during 1982–2020 over South China based on (a) the observations and (b) NUIST-CFS1.0 predictions initiated from 1 March. The correlations are calculated based on individual member forecasts separately and then are averaged to obtain the nine-member mean results. Dots indicate the correlations are statistically significant at 90% confidence level. Note that South China is defined as the area of Guangdong, Guangxi, Fujian, and Hainan provinces in this study.
Figure 7 displays the regressed circulation anomalies at the 850-hPa level onto the regionally averaged SST of the four areas based on the observations and NUIST-CFS1.0 predictions. Related to a warm SST anomaly in the TWP, an anomalous cyclone appears around the Philippines (Fig. 7a), which could reduce the moisture transport to South China and induce dry conditions there. In contrast, a warm SST anomaly in the TEP tends to induce an anomalous anticyclone around the Philippines (Fig. 7b), which could increase FRS precipitation in South China as discussed above. The Philippines anticyclone could be induced by the SST anomaly in the tropical western and eastern Pacific through Rossby waves (e.g., Gu et al., 2018). In addition, the warm SST anomaly of the TA and NA may change the Walker circulation and the teleconnection of the temperate atmosphere, which can stimulate a Eurasian wave train that points from the mid-high latitudes of the Atlantic Ocean across the Eurasian continent to East Asia (Figs. 7c–d, see also Li et al., 2018). The geopotential height field in China's southeast coastal areas and the Northwest Pacific Ocean is abnormally high, inducing an anomalous anticyclone circulation near the Philippines. The above results suggest that the Philippines anticyclone is an essential element that delivers influences of the SST anomalies in the four regions to FRS precipitation in South China. The Philippines anomalous anticyclones linked with the SST anomalies in the four regions are reasonably well captured by NUIST-CFS1.0 predictions, except that the impacts of the NA SST anomaly are underestimated to some extent (bottom panels in Fig. 7).
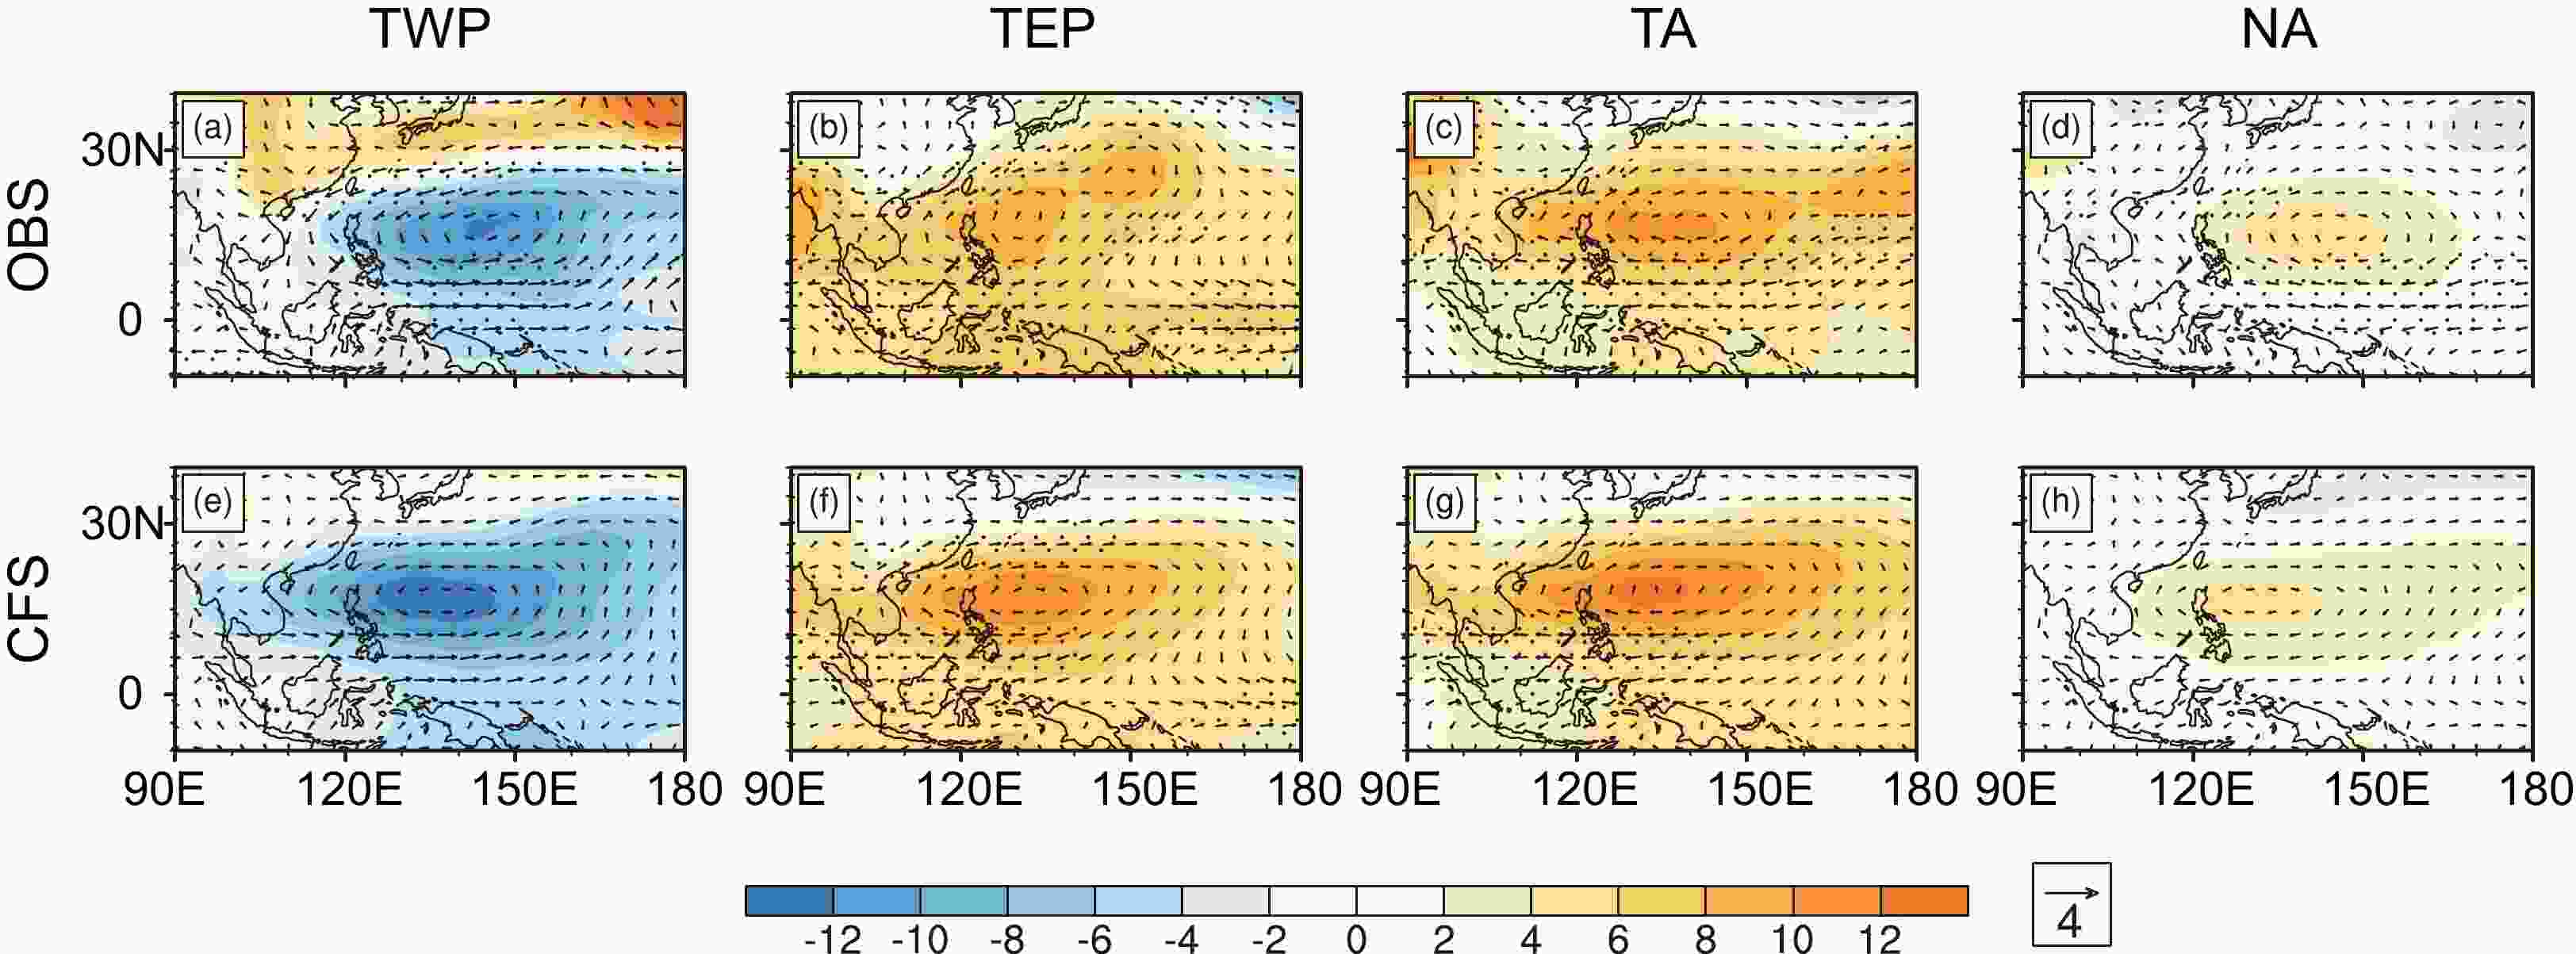
Figure 7. As in Fig. 6, but for the regressed circulation anomalies at the 850-hPa level (vector denotes winds, units: m s−1; color shading denotes height, units: m) onto the regionally averaged SST anomalies in (a, e) the tropical western Pacific, (b, f) the tropical eastern Pacific, (c, g) the tropical Atlantic, and (d, h) the northern North Atlantic based on (upper panels) the observations and (bottom panels) NUIST-CFS1.0 predictions initiated from 1 March. The black boxes in Fig. 6 denote the above four regions for calculating the SST indices. Dots indicate the correlation coefficients are statistically significant at 90% confidence level. The regressions and the correlation coefficients are calculated based on individual member forecasts separately and then are averaged to obtain the nine-member mean results.
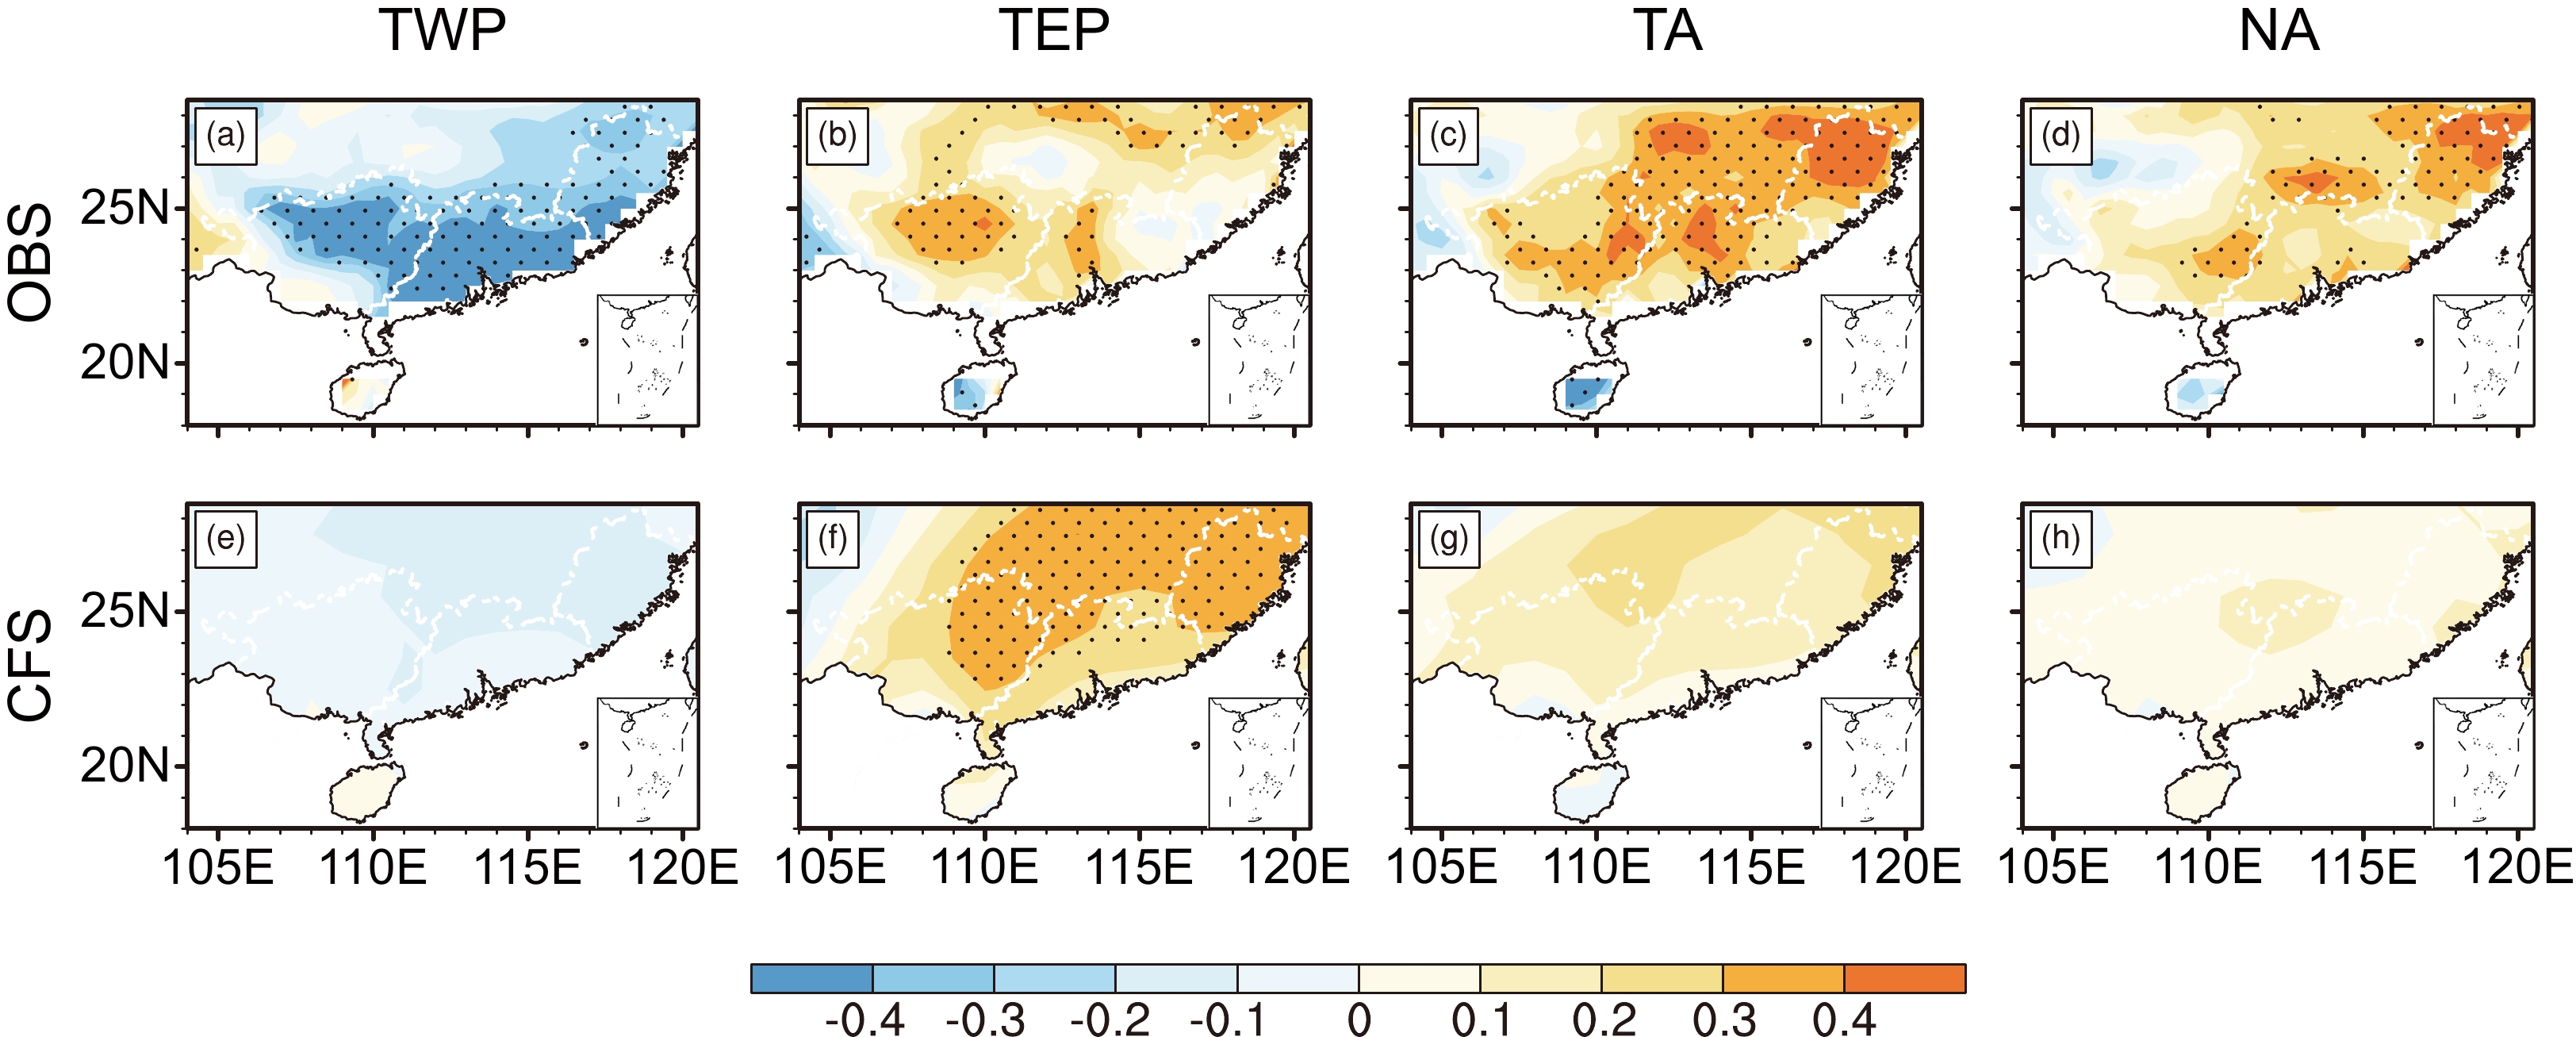
The correlation coefficients between the FRS precipitation anomalies over China and the SST anomalies in the four regions are presented in Fig. 8. The results show that both the sign and spatial pattern of the correlations in NUIST-CFS1.0 predictions are consistent with the observations, but the intensity and the maximum center of the correlations differ considerably. In particular, the negative correlation between the TWP SST and FRS precipitation is mainly located in Guangdong province in the observations. However, in the model predictions, the negative relation is weak and extends broadly to Jiangxi and Fujian provinces. In addition, associated with warm SST anomalies in the TEP, TA, and NA, positive precipitation anomalies tend to appear in Guangdong, Guangxi, and Fujian provinces, but Hainan province may experience dry conditions. These features are generally captured well by NUIST-CFS1.0 but with weak intensity. This indicates that NUIST-CFS1.0 can generally reproduce the impacts of these SST forcings on precipitation over South China, but it still has difficulty in accurately predicting the magnitude and locations of their relationships.
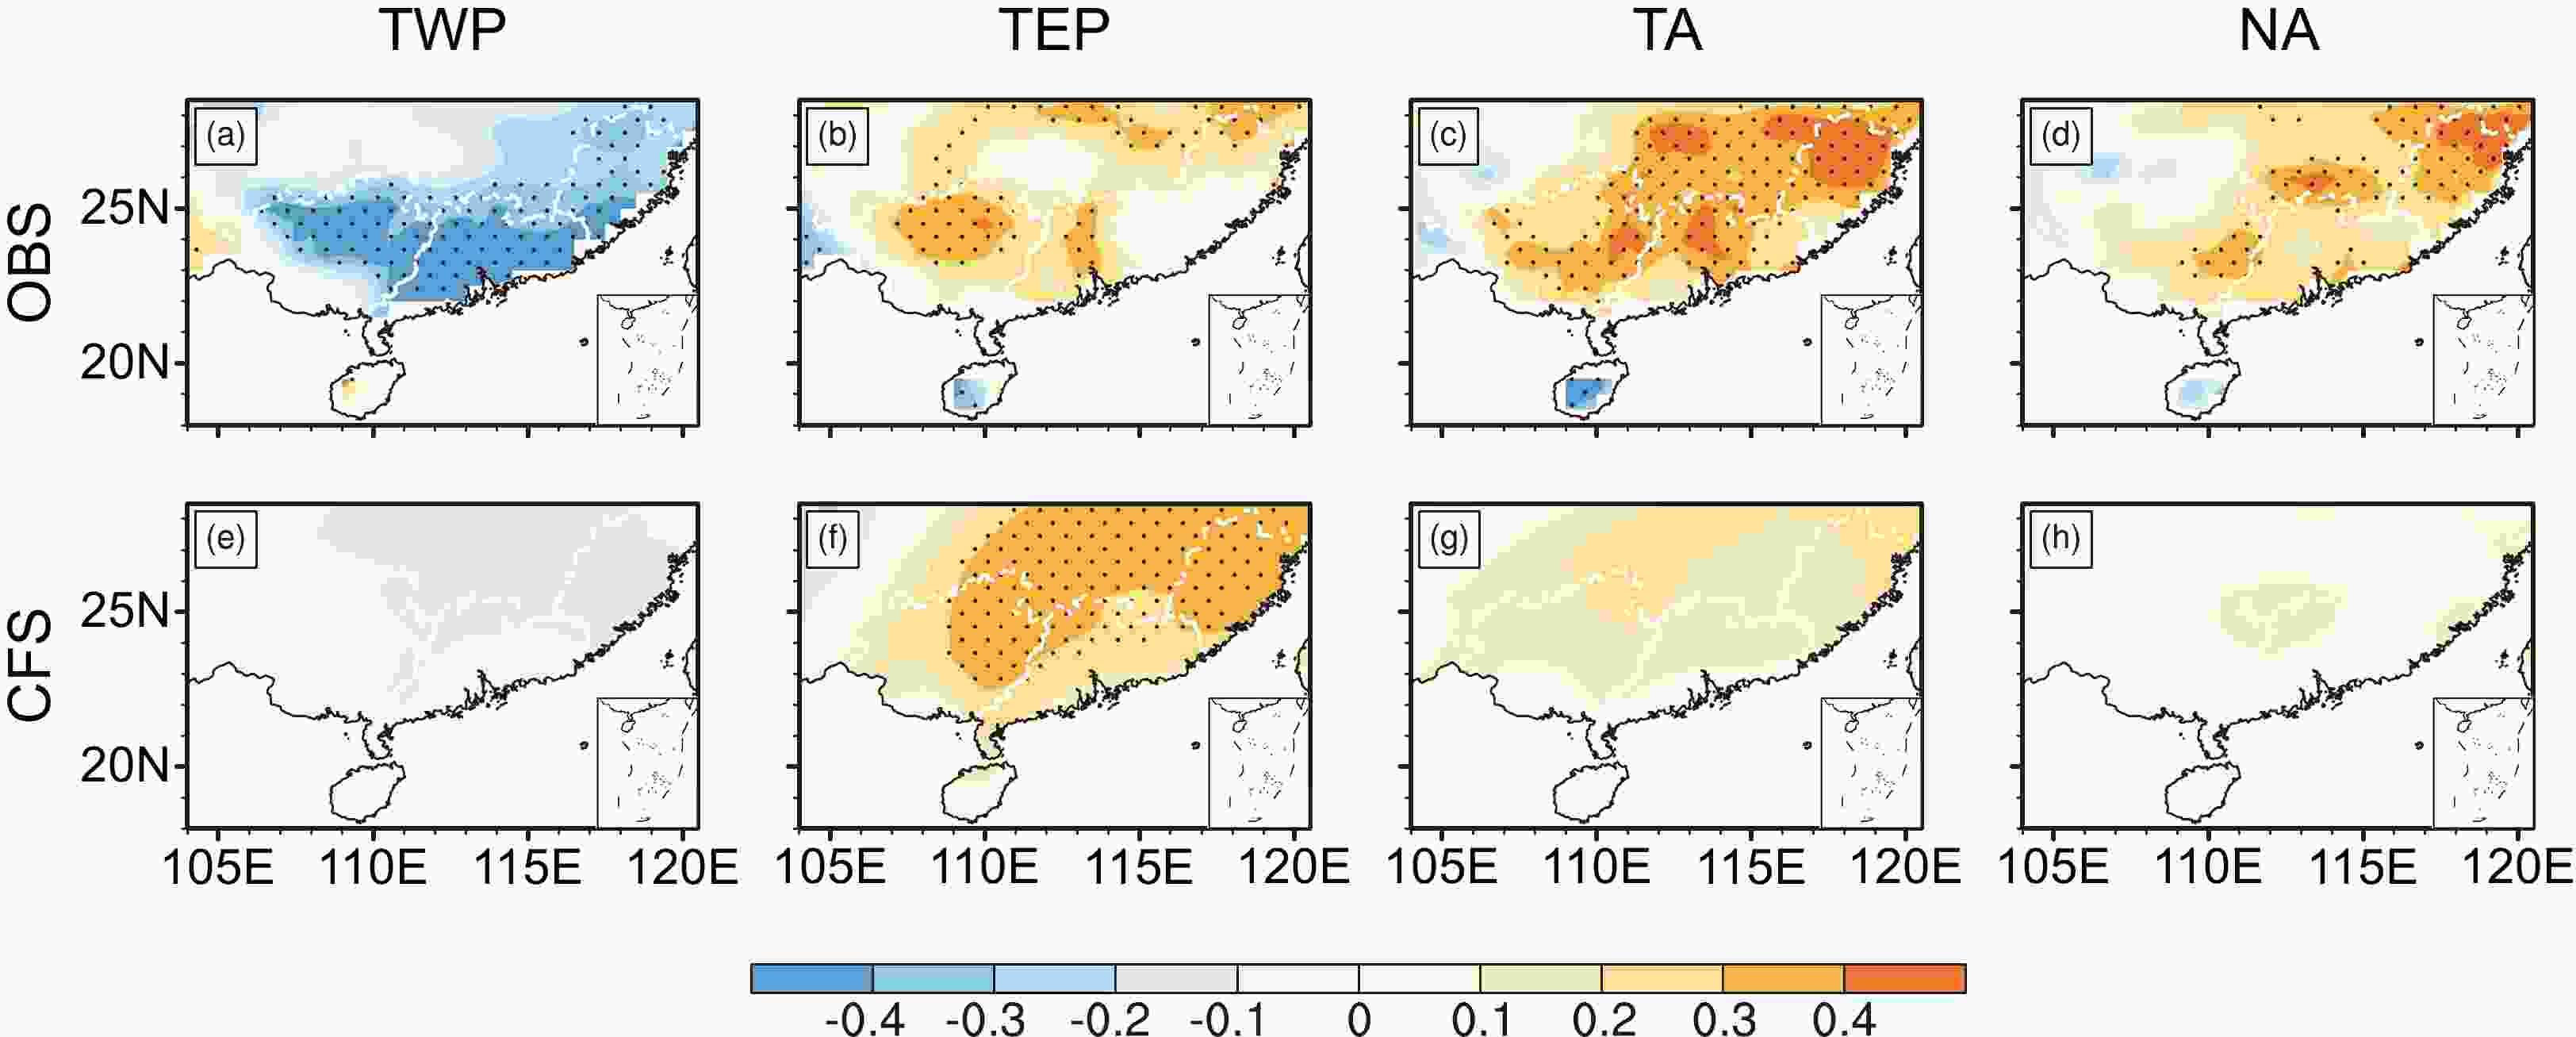
Figure 8. As in Fig. 7, but for the correlation coefficients between the precipitation anomaly during April–June over South China and the regionally averaged SST anomalies in (a, e) the tropical western Pacific, (b, f) the tropical eastern Pacific, (c, g) the tropical Atlantic, and (d, h) the northern North Atlantic based on (upper panels) the observations and (bottom panels) NUIST-CFS1.0 predictions initiated from 1 March. The correlation coefficients are calculated based on individual member forecasts separately and then are averaged to obtain the nine-member mean results. Dots indicate the results are statistically significant at 90% confidence level. White dashed lines denote the borders of Guangdong, Guangxi, and Fujian provinces.
-
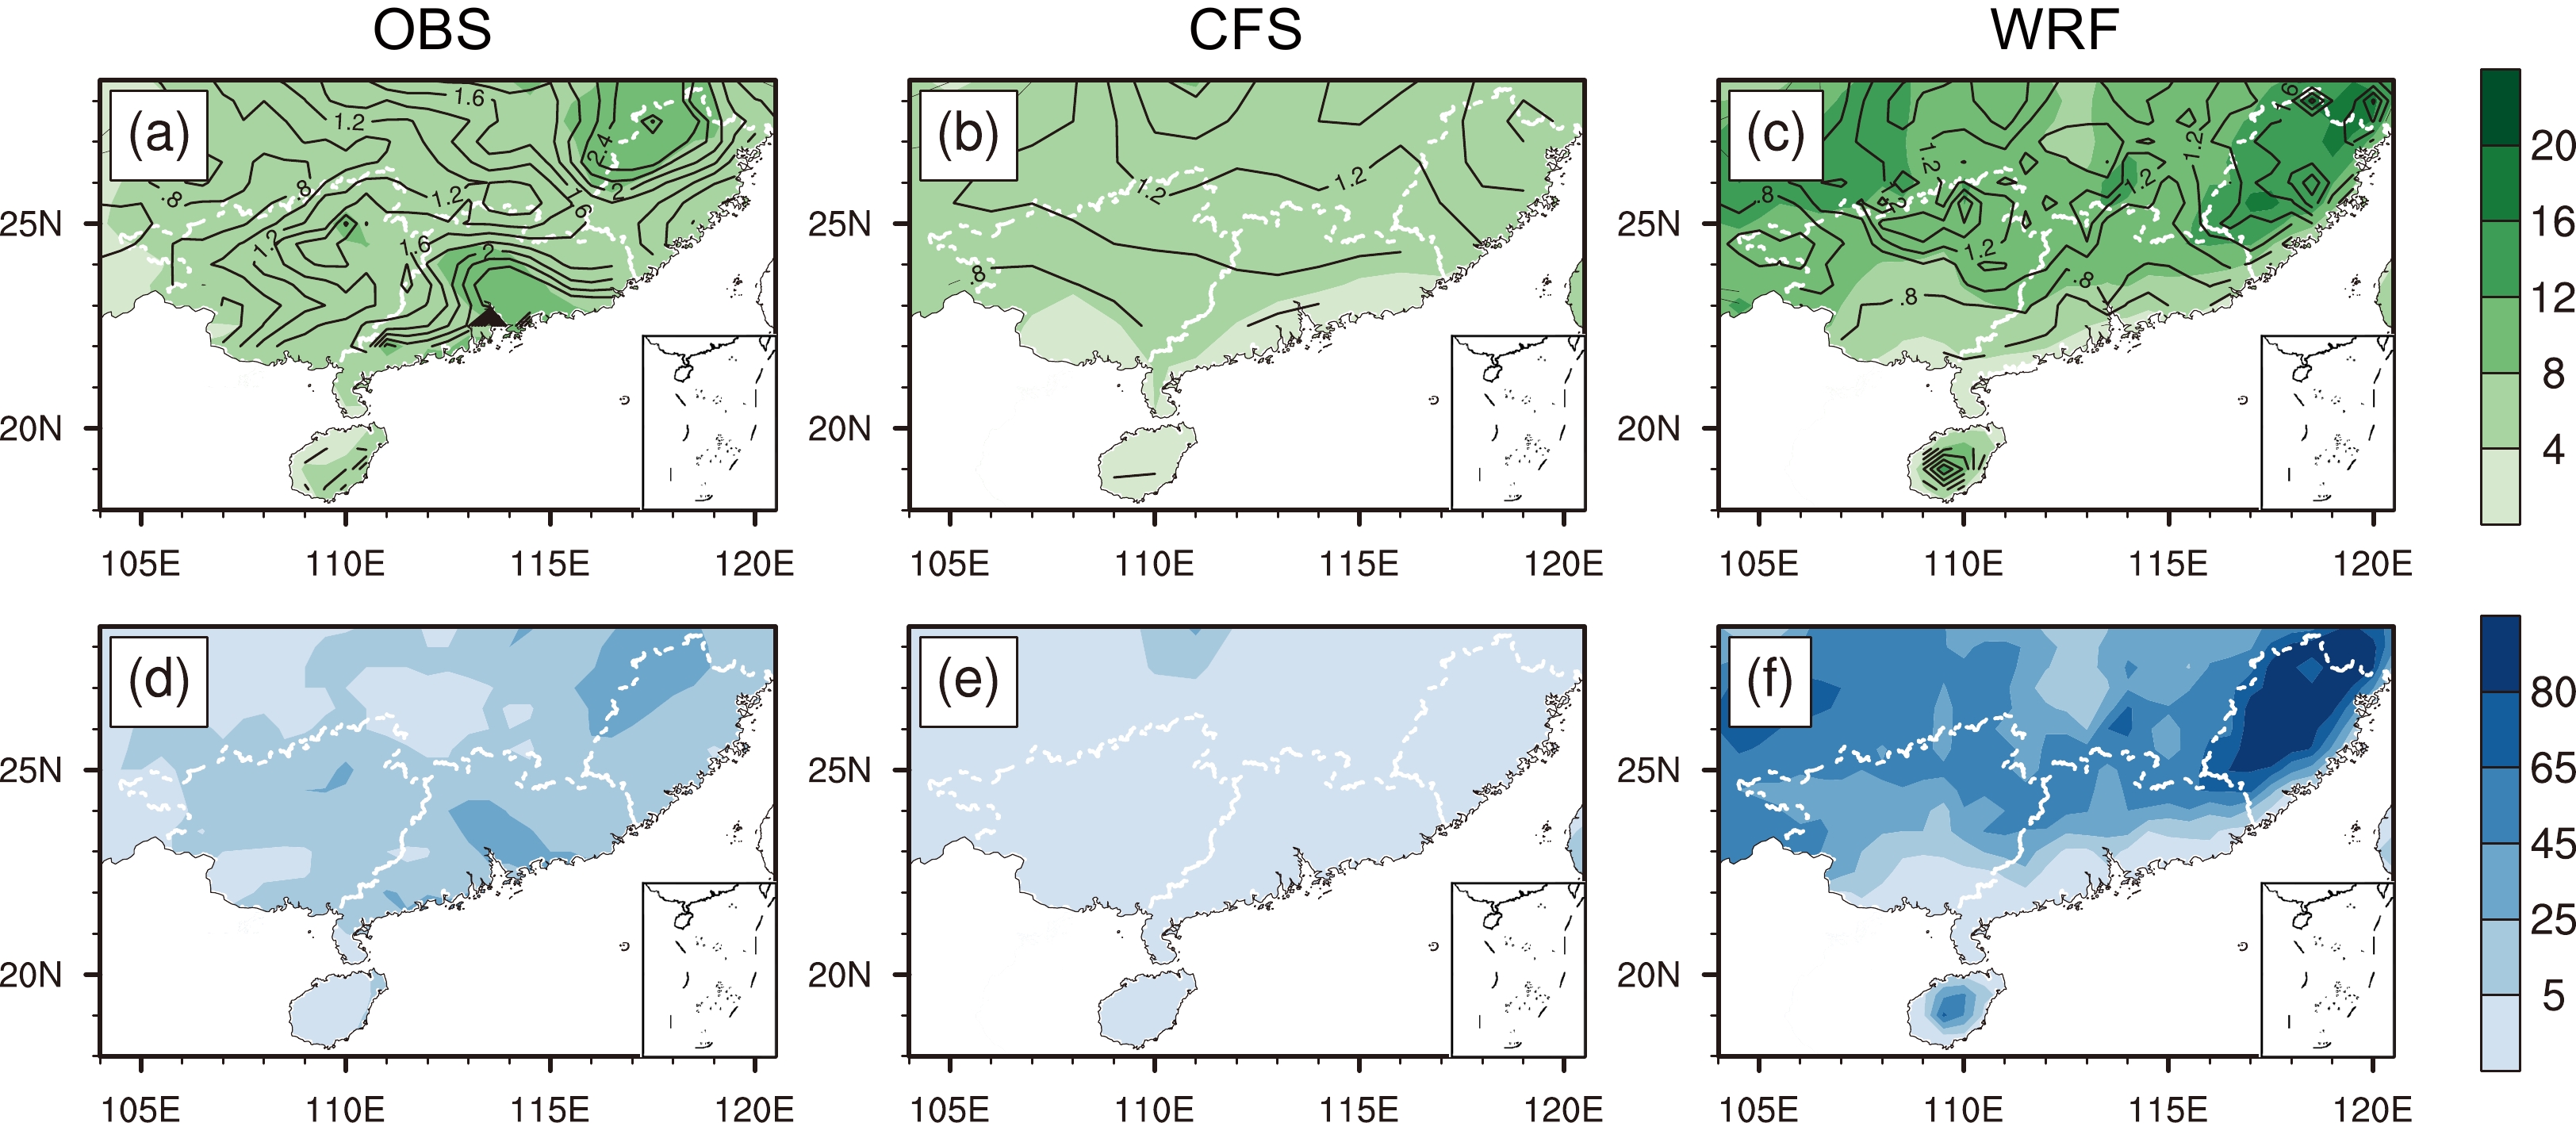
Many predecessors have applied the dynamical downscaling approach to improve predictions of regional climate (e.g., Sun et al., 2018; Xu et al., 2019). Here, we also evaluated downscaling prediction results for 1991–2020 based on the 30-km-resolution WRF model forced by large-scale information from NUIST-CFS1.0 (see section 2 and Ying et al., 2022 for details in WRF design and hindcast experiments). As shown in Fig. 9, compared with NUIST-CFS1.0, the intensity of climatological mean precipitation and the number of moderate rainy days (>10 mm d–1) are greatly increased in the downscaling predictions with higher resolution; this implies that the prediction skill for extreme precipitation events could be improved. However, compared to the observations, the WRF downscaling results overestimate both the magnitude of climatological mean precipitation and the number of rainy days. This is a common bias found in WRF model simulations, because precipitation in the model is often too easily triggered (e.g., Caldwell et al., 2009; Yu et al., 2010; Wang and Yu, 2013). Therefore, further efforts are required to improve WRF’s performance and/or parameterization schemes in simulating FRS precipitation over South China.
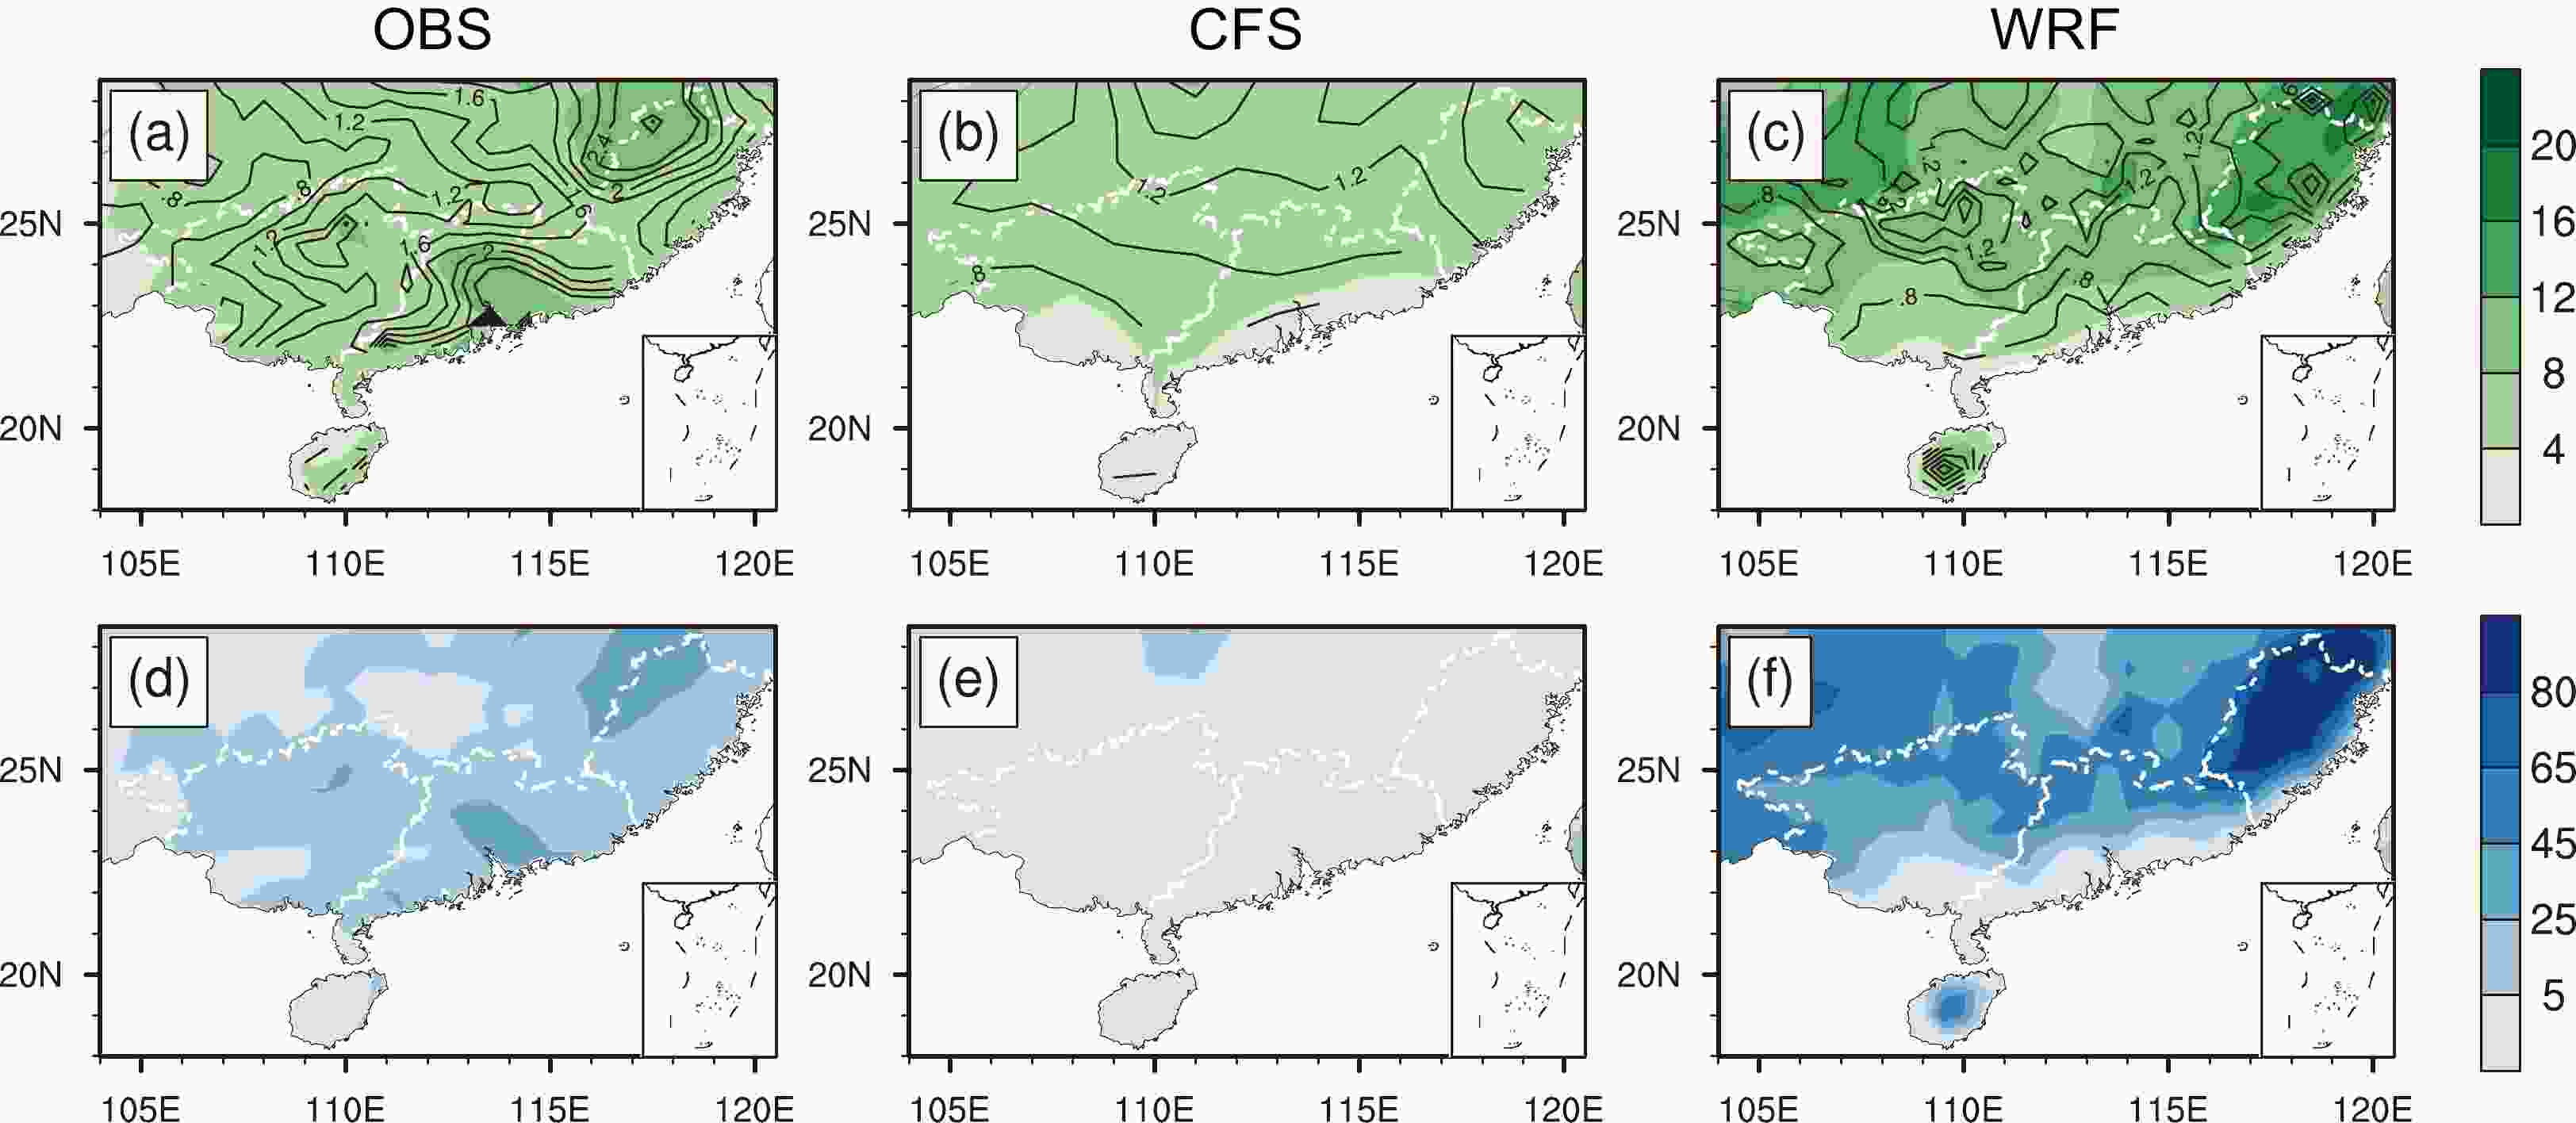
Figure 9. The climatological mean precipitation (color shading in the top panels) and the standard deviation of interannual precipitation anomaly (contour line in the top panels) (units: mm d−1) and the number of moderate rainy days (>10 mm d−1, bottom panels) in the FRS during 1991–2020 over South China based on (a, d) the observations, (b, e) NUIST-CFS1.0 ensemble mean predictions, and (c, f) WRF downscaling hindcasts. White dashed lines denote the borders of Guangdong, Guangxi, and Fujian provinces.
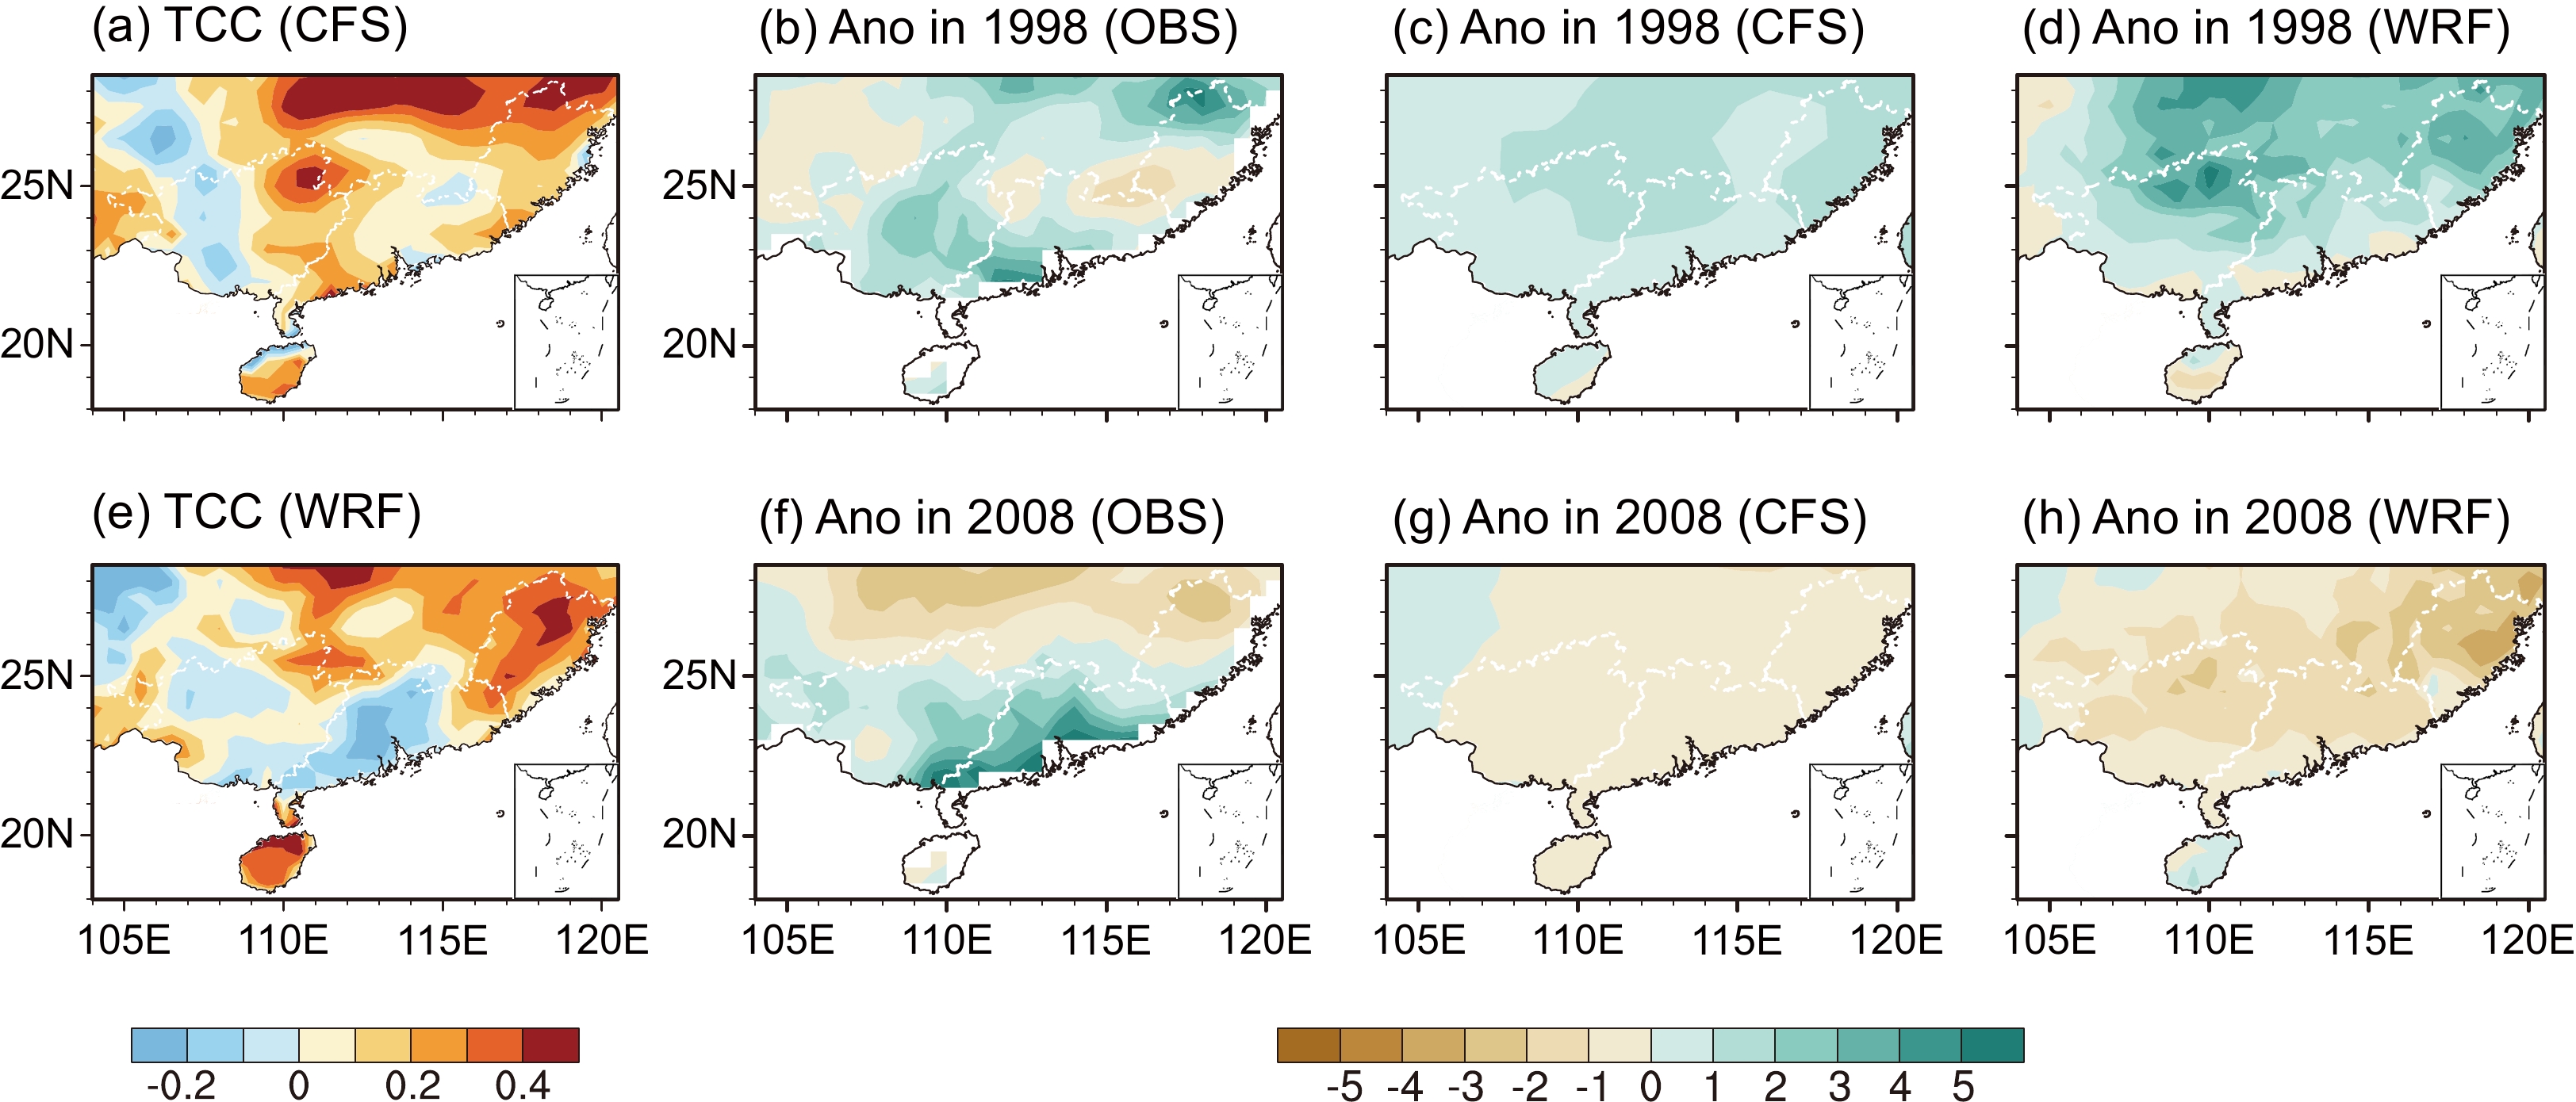
Figures 10a and 10e present the TCC skill of NUIST-CFS1.0 and the WRF downscaling experiments in predicting the precipitation anomalies in the FRS over South China for 1991–2020. The results indicate that the TCC skill in Hainan and Fujian provinces is improved by WRF downscaling, but the skill is degraded in Guangdong and Guangxi provinces (Fig. 10e). As WRF downscaling can simulate more intense precipitation and rainy days, we further check the model forecast skill in predicting two extremely wet years (i.e., 1998 and 2008, Figs. 10b–d, f–h). The observations show that the spatial distributions of the FRS precipitation anomalies in the two years are different. In 1998, a zonal tripole pattern appeared with positive anomalies occurring in Guangdong, Guangxi, and North Fujian and negative anomalies occurring along the north border of Guangdong province and South Fujian. While in 2008, a north–south dipole pattern occurred, with wet anomalies located in Guangdong and Guangxi provinces and dry anomalies located in Fujian province. The NUIST-CFS1.0 global model predicts wet anomalies over all of South China, but with small magnitudes, during the FRS in 1998 (Fig. 10c). In contrast, the global model completely fails to predict the 2008 case; the model wrongly produces dry anomalies over almost all of South China in 2008 (Fig. 10g). With the WRF downscaling approach, the distributions of the precipitation anomalies basically remain the same as those produced by the global model in both 1998 and 2008, but the magnitudes of the precipitation anomalies predicted by WRF are much larger (Figs. 10d, h). This suggests that WRF downscaling may improve or worsen the global model forecasts, i.e., better gets better, worse gets worse. This is also true for the WRF downscaling forecasts of summer precipitation over the MLYR region (see Ying et al., 2022). The results indicate that the dynamical downscaling approach could not effectively rectify incorrect forecasts of the global model, since the dynamical downscaling is constrained by the large-scale circulation produced by the global model.
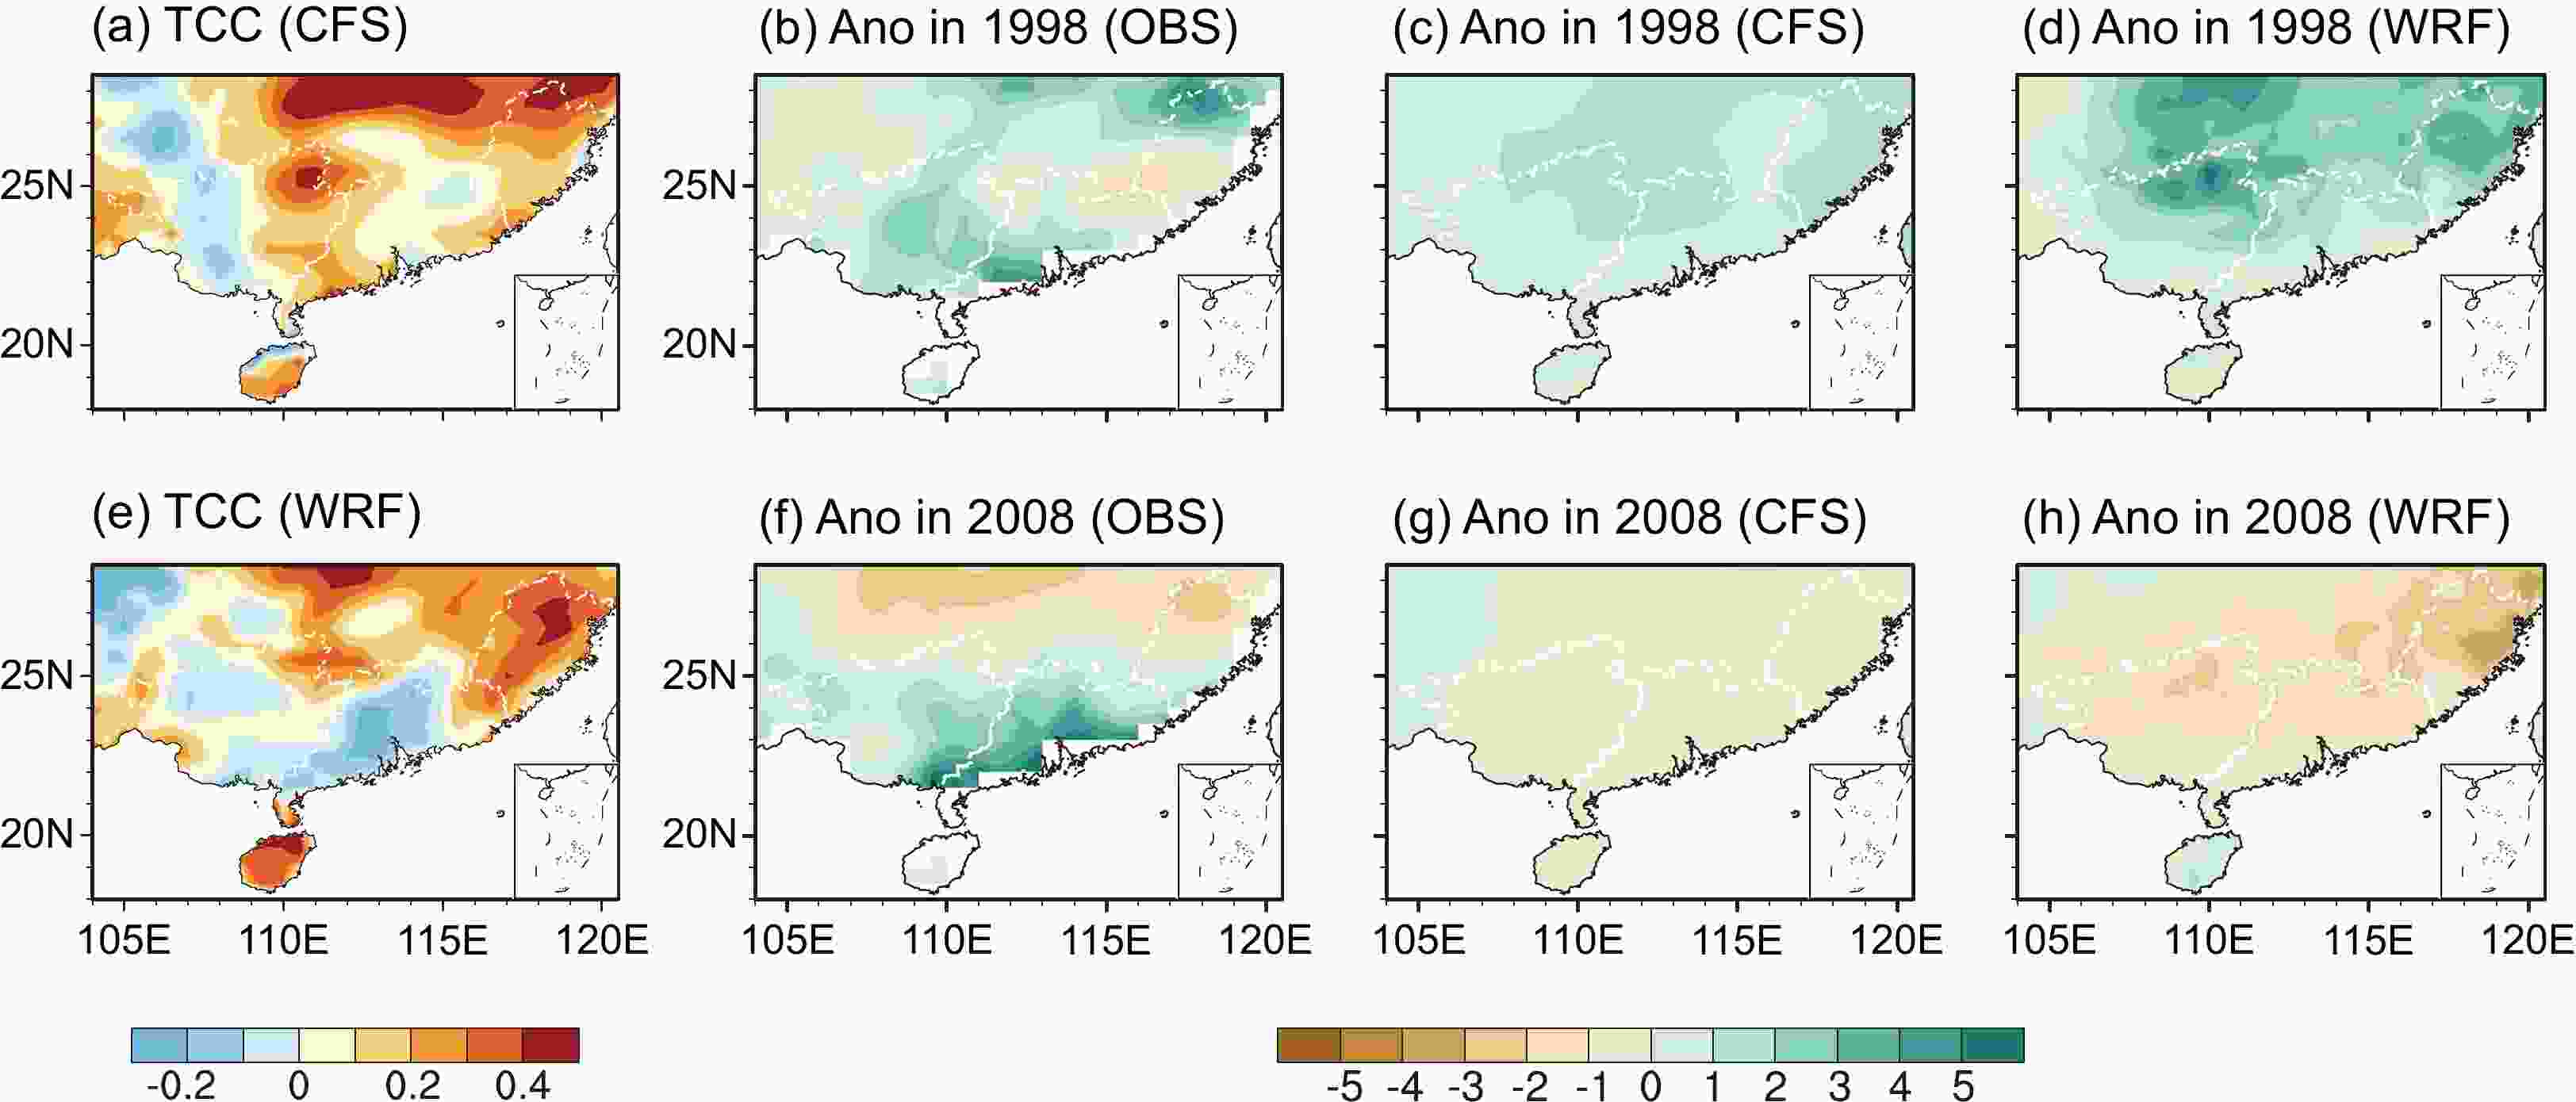
Figure 10. The correlation coefficients of the FRS precipitation anomaly during 1991–2020 between the observations and (a) NUIST-CFS1.0 ensemble mean predictions, and (e) WRF downscaling hindcasts. The spatial distribution of the FRS precipitation anomaly (units: mm d−1) over South China in 1998 and 2008 based on (b, f) the observations, (c, g) NUIST-CFS1.0 ensemble mean predictions, and (d, h) WRF downscaling hindcasts. White dashed lines denote the borders of Guangdong, Guangxi, and Fujian provinces.
-
The precipitation in the First Rainy Season (FRS) over South China has caused many disasters that endanger lives and property. However, limited research has been carried out to predict it at the seasonal scale. Therefore, we evaluated the skill in predicting FRS precipitation in South China (i.e., the four provinces) in this study, mostly based on NUIST-CFS1.0 ensemble hindcasts initiated from the 1st day of March, February, and January for 1982–2020. The skill at different lead times appears to be similar. Regarding the climatological mean precipitation, the global model predictions underestimate the magnitude over wide regions of South China. The low signal-to-noise ratio (as an indicator of potential predictability) estimated with the nine-member forecasts suggests that reliable prediction of FRS precipitation in South China is rather challenging. Consistently, the practical skill of NUIST-CFS1.0 in predicting the FRS precipitation anomalies in South China is also low (0.29), which is comparable to and even higher than the skill of most of the nine international climate models. The TCC skill in predicting the regionally averaged precipitation anomaly is slightly higher, reaching 0.38. However, the pattern correlation coefficient (PCC) skill displays a large year-to-year variation during 1982–2020, suggesting that the precipitation anomaly distribution in South China can be predicted well in some years (such as 1998 when the SST forcing is fairly dominant) but may completely fail in other years. This indicates the complexity and challenge in FRS precipitation predictions.
The present results suggest that one important factor of FRS precipitation is the anomalous anticyclone surrounding the Philippines, which strengthens the southwesterly wind from the South China Sea that acts to transport more warm and moist air to South China, increasing FRS precipitation. The Philippines anticyclone can be influenced by SST in the tropical western Pacific, the tropical eastern Pacific, the tropical Atlantic, and the northern North Atlantic, which provides a potential source for FRS precipitation prediction. NUIST-CFS1.0 can predict the Philippines anticyclone well, with the TCC skill reaching as high as 0.63, comparable to the skills of the nine international climate models. In addition, the influences of SST anomalies in the four regions on the Philippines anticyclone, and hence FRS precipitation over South China, can be captured by NUIST-CFS1.0 in general (albeit with a weak intensity).
Concerning the potential benefits of dynamical downscaling to regional precipitation forecasts, we have also examined WRF downscaling performance. The WRF downscaling forecasts can catch small- and medium-scale signals to a certain extent and improve the prediction of climatological mean precipitation magnitudes and increase the number of days of moderate precipitation, compared to the global model predictions. However, the forecast skill for precipitation anomalies could not be efficiently improved by the dynamical downscaling method, as the performance of regional model predictions are greatly constrained by the large-scale circulation produced by the global model. The enlarged magnitude of precipitation in the WRF downscaling experiments would make better forecast skill get better, but worse forecast skill get worse.
As was mentioned in the introduction, FRS precipitation experiences two stages. The first one occurs before the onset of the East Asia summer monsoon, which involves many frontal processes that are usually synoptic and hence difficult to be predicted on seasonal time scale. And the second one occurs during the post-monsoon period, which is more influenced by SST forcing. Separately evaluating forecast skill for precipitation during each stage might be more rational and warrants a future study.
It is worth noting that FRS precipitation over South China experienced a multi-decadal shift in 1992/93 (e.g., Wu et al., 2010; Kajikawa and Wang, 2012). We further examined whether the prediction skill might also vary among different decades, based on the 39-year hindcasts of NUIST-CFS1.0. As shown in Fig. S2 in the ESM, the TCC prediction skill does display noticeable differences among different decades. The TCC is low in most parts of South China during 1982–91, and slightly increases during 1992–2000, especially in the eastern part of Guangxi and the southwestern part of Guangdong. During 2001–09, the TCC skill falls sharply and even becomes significantly negative in Guangdong and Guangxi provinces. Interestingly, the prediction skill increases greatly in the 2010s. Such large multi-decadal variations in the forecast skill for FRS precipitation indicate that the predictability of FRS precipitation, which is governed by the relative importance of internal signals and external forcing, may also experience multi-decadal variations. Figure S3 in the ESM shows that the relationship between FRS precipitation and SST forcing does exhibit multi-decadal changes, especially in the northern Indian Ocean. This interesting multi-decadal change also warrants future studies to better understand the underlying mechanisms.
Acknowledgements. This work is supported by National Natural Science Foundation of China (Grant Nos. 42088101 and 42030605) and National Key R&D Program of China (Grant No. 2020YFA0608000). The model simulation is conducted in the High Performance Computing Center of Nanjing University of Information Science & Technology. The Hadley monthly mean SST data is downloaded from https://www.metoffice.gov.uk/hadobs/hadisst/data/download.html. NCEP–NCAR Reanalysis-II data is provided by the NOAA/OAR/ ESRL PSL, Boulder, Colorado, USA, and is downloaded from the website at https://psl.noaa.gov/.
Electronic supplementary material: Supplementary material is available in the online version of this article at
https://doi.org/10.1007/s00376-023-2318-0 .
| System name | Atmosphere Model | Ocean Model | Sea ice Model | Hindcast ensemble size |
| ECMWF _SEAS5 | IFS Cycle 43r1 (Dynamics: TCO319 Physics: O320) | NEMO v3.4 (ORCA 0.25L75) | LIM2 | 25 |
| JMA/MRI -CPS2 | JMA-GSM (TL159L60) | MRI.COM v3 1°×(3°−5°) | Part of MRI.COM v3 | 10 |
| GloSea5 -GC2 | Met Office UM- Global Atmosphere 6.0(N216L85) | NEMO v3.4 -Global Ocean5.0 (OCRA 0.25L75) | CICE v4.1 -Global Sea -Ice 6.0 | 28 |
| METFRA _System6 | ARPEGE v6.2 (TL359L91) | NEMO v3.4 (OCRA 1L75) | GELATO v6 | 25 |
| METFRA _System7 | ARPEGE v6.4 (TL359L91) | NEMO v3.6 (OCRA 0.25L75) | GELATO v6 | 25 |
| CMCC _SPS3 | CAM5.3 (1°L46) | NEMO v3.4 (0.25°L50) | CICE 4.0 | 40 |
| CMCC _SPS3.5 | CAM5.3 (0.5°L46) | NEMO v3.4 (0.25°L50) | CICE 4.0 | 40 |
| GCFS2.0 | ECHAM 6.3.05 (T127L95) | MPIOM 1.6.3 (TP04L40) | Same as ocean model | 30 |
| GCFS2.1 | ECHAM 6.3.04 (T127L95) | MPIOM 1.6.3 (TP04L40) | Same as ocean model | 30 |
 AAS Website
 AAS WeChat