


 DownLoad:


-
The pan-Arctic ecosystem is an important component of the Earth climate system and global carbon cycle (Saugier et al., 2001; McGuire et al., 2009). Although far from human society, the pan-Arctic region is confronted with significant impacts of anthropogenic activities. In recent decades, high-latitude ecosystems are experiencing twice rises of surface air temperature than global mean warming rates (Graversen et al., 2008; Huang et al., 2017), following the strong sea-ice albedo feedback (Thackeray and Hall, 2019) and the warming effect by anthropogenic aerosols from mid-latitudes (Garrett and Zhao, 2006). Rapid warming is projected to increase terrestrial CO2 emissions at mid-high latitudes through enhanced ecosystem respiration (Dorrepaal et al., 2009), strengthened drought stress (Liu et al., 2013), and increased wildfire activities (Walker et al., 2019; Yang et al., 2021). On the other hand, such warming is beneficial for land carbon uptake through longer growing seasons (Fridley et al., 2016), greener land cover (Urban et al., 2014), and higher CO2 fertilization (Donohue et al., 2013).
In addition to climate warming, the pan-Arctic is also influenced by the aerosol pollution emitted locally and/or transported from lower latitudes (Stohl, 2006; Breider et al., 2017). Human activities can significantly influence air quality in the Arctic through long-range transport of anthropogenic aerosols from Eurasia and North America (Hirdman et al., 2010; Vinogradova and Ponomareva, 2012). Local ship emissions account for more than 10% and 20% of the NO2 and SO2 concentrations in the Arctic (Gong et al., 2018). Natural wildfire emissions also contribute to the regional pollution (Law and Stohl, 2007). The seasonal distribution of the Arctic aerosols is related to transport efficiency from mid-latitudes (Garrett et al., 2010). These aerosols can perturb the radiative budget of the Arctic through light-absorption (Moosmüller et al., 2009), aerosol–cloud interactions (Pan et al., 2020), and physical deposition (Lawrence and Swenson, 2011). Aerosols from biomass burning reduce total surface solar radiation by 13.1W m−2 in the Arctic, several times larger than the radiative perturbation in Alaska and Svalbard (Markowicz et al., 2017). Apart from aerosol light absorption, aerosol–cloud interactions can also alter cloud properties to influence surface radiation and precipitation in the Arctic (Willis et al., 2018). Furthermore, the chemical and physical process of dust aerosols also influence surface radiation balance such as decreasing surface albedo (Bond et al., 2013) and increasing ice nuclei number concentration (Xie et al., 2013).
Apart from climatic effects, aerosol pollution also influences terrestrial ecosystem productivity through radiative perturbations. The light extinction by aerosols can enhance the amount of diffuse radiation, which increases light use efficiency of the canopy (Mercado et al., 2009). Long-term observations have shown that aerosols enhance plant photosynthesis up to 23% due to doubled diffuse radiation under clear-sky conditions (Gu et al., 2003). Such diffuse radiation fertilization effects (DRFEs) are subject to sky conditions (Alton, 2008) and/or aerosol loading (Zhou et al., 2021b). Low and moderate aerosol loadings promote plant photosynthesis (Wang et al., 2021), while dense cloud and/or high aerosol loading may cause limited DRFEs or even reverse the benefits by largely reducing direct radiation (Cirino et al., 2014). Regionally, Bian et al. (2021) estimated that the DRFEs of biomass burning aerosols enhance GPP by 2.6% in Amazon. Ma et al. (2022) showed that a 0.0002 yr−1 decreasing trend in aerosol induces a GPP enhancement of 7.3 g C m−2 yr−2 in central Asia. Keppel-Aleks and Washenfelder (2016) found that reductions in sulfate aerosols decreased diffuse radiation by 0.6% yr−1 and GPP by 0.07% yr−1 in United States. Globally, Chen and Zhuang (2014) applied a land ecosystem model and estimated that aerosol DRFEs enhanced global GPP by 4.9 Pg C yr−1. Strada and Unger (2016) performed simulations using a climate model and revealed that aerosol DRFEs increased global GPP by 1%–2% in the 2000s. Rap et al. (2018) specifically estimated that the DRFEs of biogenic aerosols enhanced global NPP by 1.23 Pg C yr−1. While previous studies mainly focused on aerosol DRFEs at low-mid latitudes (Doughty et al., 2010; Hemes et al., 2020) or global scales (Chakraborty and Lee, 2021; O’Sullivan et al., 2021; Zhang et al., 2021), the responses of ecosystem productivity in the pan-Arctic and related contributions by anthropogenic and natural emission sources remain unclear.
In this study, we apply the Yale Interactive terrestrial Biosphere (YIBs) model in combination with both chemical transport and radiative transfer models to explore the impacts of aerosol DRFEs on the net primary productivity (NPP) over the pan-Arctic (45°–90°N) NPP in growing season (May–September) during 2001–19. The chemical transport model is first used to isolate the contributions of natural and anthropogenic emissions to aerosols in the pan-Arctic region. Simulated 3-D aerosol profiles are then used to drive the radiative transfer model to predict the perturbations in diffuse and direct radiations caused by different types of aerosol species. Finally, the radiative fluxes with or without aerosols are used to drive the YIBs model to predict the changes in ecosystem productivities. The main purposes of this study are to: (1) quantify the responses of the pan-Arctic NPP to aerosol pollution under different (all-sky and clear-sky) sky conditions and from different (anthropogenic and natural) sources, and (2) explore the trends of aerosol DRFEs in the pan-Arctic and their driving factors related to the changes in anthropogenic and natural emissions.
-
Satellite observations include aerosol optical depth (AOD) from the Moderate-resolution Imaging Spectroradiometer (MODIS,
https://modis.gsfc.nasa.gov ), shortwave radiation and diffuse radiative fraction from the Clouds and the Earth's Radiant Energy System (CERES) SYN1deg products (http://ceres.larc.nasa.gov ). These global products are downscaled into spatial resolution of 1º×1º at a monthly timescale during 2001–19, which are used to validate the simulated AOD and radiative fluxes from radiative transfer model. Moreover, we use GPP benchmark product at 0.5º×0.5º upscaled from the global FLUXNET measurements during 2001–11 (Jung et al., 2009) and observed leaf area index (LAI) at 0.25º×0.25º from GLASS products (https://www.glass.umd.edu/LAI/MODIS/0.25D/ ) during 2001–19 in this study. Observed 8-day LAI and monthly GPP products are used to validate simulations from the YIBs model.To quantify the model performance, we select statistical metrics including determination coefficient (R2) and root-mean-square error (RMSE) defined as follows:
where
$ {S}_{i} $ and$ {O}_{i} $ are respectively the pairs of simulated and observed values,$\bar{O}$ is the average of the observations, and n is the number of samples. The higher the R2 and the lower the RMSE, then the better performance of the models. -
The 3-D atmospheric chemistry model of Goddard Earth Observing System coupled with Chemistry (GEOS-Chem,
http://geos-chem.org ) can well simulate the regional/global changes of air quality and atmospheric compositions (Bey et al., 2001). We use GEOS-Chem version 12.0.0 to predict 3-D aerosol concentrations from both anthropogenic and natural sources during 2001–19 at a horizontal resolution of 4º×5º and 47 vertical layers. We use the Community Emissions Data System (CEDS) inventory (Hoesly et al., 2018) to simulate the concentrations of anthropogenic aerosols including black carbon (BC), organic carbon (OC), sulfate, and nitrate. Meanwhile, concentrations of natural aerosols are predicted using a combination of multiple inventories including the Global Fire Emission Database version 4 (http://www.globalfiredata.org/ ) for fire emissions, the Model of Emissions of Gases and Aerosols from Nature (Guenther et al., 2012) for biogenic emissions, and the Global Emissions (GEIA,http://www.geiacenter.org/ ) for other natural emissions. -
Column Radiation Model (CRM) is the standalone version of the radiative module used by the National Center for Atmospheric Research (NCAR) Community Earth System Model (
http://www.cesm.ucar.edu/models/ ). Following the configurations in an earlier study (Yue and Unger, 2017), the CRM model is set up to simulate hourly radiative fluxes at 1º×1º horizontal grids and 20 vertical layers from ground to 0.5 hPa in the atmosphere. Using the 3-D monthly aerosol profiles from GEOS-Chem and hourly meteorological fields from MERRA-2 and 3-hourly cloud profiles from CERES, the CRM model can predict the hourly changes in surface direct and diffuse PAR caused by different aerosol species at varied sky conditions (Yue and Unger, 2018). In this study, aerosol concentrations simulated by the GEOS-Chem model are interpolated to 1º×1º with bilinear interpolations. Meanwhile, 3-hourly cloud cover and liquid water path from the CERES SYN1deg product (http://ceres.larc.nasa.gov ) are used as the cloud profile. -
The Yale Interactive terrestrial Biosphere (YIBs) model is a dynamic global vegetation model (DGVM). It simulates ecosystem productivities with dynamic tree growth and leaf area changes for nine plant functional types (PFTs), including tundra, evergreen needleleaf forest, deciduous broadleaf forest, evergreen broadleaf forest, shrubland, C3/C4 grassland, and C3/C4 cropland (Yue and Unger, 2015). Since the year 2020, YIBs model has joined the TRENDY project for DGVM inter-comparison to provide historical estimates of global carbon budget (Friedlingstein et al., 2020). The model uses the well-established schemes for leaf photosynthesis and stomatal conductance. In this model, photosynthesis of sunlit and shaded leaves is separated with varied responses to diffuse and direct light (Spitters et al., 1986; Luo et al., 2018). The whole canopy is divided into 2–16 adaptive layers. The fraction of sunlit-to-total leaf area
$ {F}_{\mathrm{s}\mathrm{u}\mathrm{n}\mathrm{l}\mathrm{i}\mathrm{t}} $ is calculated as:where L is LAI for a specific canopy layer and k is the extinction coefficient defined as 0.5/cosα (solar zenith angle α). As a result, the sunlit fraction is smaller at high latitudes due to the larger solar zenith angle on average. The total GPP is integrated along all LAI from the top to the bottom layer of canopy. In our previous studies, this canopy radiative transfer scheme was validated using measurements from hundreds of global FLUXNET sites (Zhou et al., 2021a). For 1 W m−2 enhancement of diffuse PAR, the YIBs model yielded increased GPP of 0.11%–1.1% for six different PFTs, similar to the observed efficiency of 0.16%–1.06% over FLUXNET sites.
For this study, the YIBs model is run over the pan-Arctic domain ([180°W–180°E, 45°–90°N]) driven with simulated diffuse/direct PAR from CRM model, so as to differentiate NPP responses to aerosol-induced perturbations in diffuse and direct PAR. We use the PFT coverage data from MODIS Collection 5 global land cover (Friedl et al., 2010). The original resolution of 0.0° for 17 International Geosphere-Biosphere Programme (IGBP) classes are aggregated into 0.2°×0.2° for the nine PFTs of YIBs model. Meteorological forcings from MERRA-2 data with interpolation for hourly scale and surface radiative fluxes for hourly scale form CRM are downscaled to 0.2°×0.2° with bilinear interpolations to match the PFT data, following the same model configurations in our previous studies (Yue et al., 2021).
-
We perform two GEOS-Chem runs, six CRM runs, and eight YIBs runs to simulate NPP changes caused by aerosols under different sky conditions and meteorological fields (Table S1). For all simulations, the models are driven with hourly or 3-hourly assimilated meteorology from the Modern-Era Retrospective analysis for Research and Applications, version 2 (MERRA-2). The GC_ALL and GC_NAT are performed using the same GEOS-Chem model except that the former is forced with both anthropogenic and natural emissions while the latter is forced with natural emissions alone. The differences between these two runs represent the contributions of anthropogenic emissions to aerosol concentrations. Four CRM runs are driven with aerosol profiles from either GC_ALL (ALL) or GC_NAT (NAT) runs in combination with (CLD) or without (CLR) observed cloud profiles from CERES to distinguish the aerosols effects in cloud-sky and clear-sky conditions. To quantify the radiative perturbations induced by aerosols, two baseline runs without any aerosol profiles (NOA) are performed with the CRM model for all-sky or clear-sky conditions. Predicted hourly diffuse and direct PAR from CRM runs are used to force the YIBs model to predict the changes of NPP in response to aerosol DRFEs over the pan-Arctic. Two additional YIBs runs are performed with fixed meteorology (CLIM_FIX) or temperature (TAS_FIX) at the year 2001, so as to isolate the NPP trends caused by changes in climate or temperature alone.
-
Simulated AOD reproduces observed spatial pattern with a R2 of 0.30 (p < 0.05) in the pan-Arctic [Fig. S1 in the electronic supplementary material (ESM)]. It also in general captures the observed AOD trends for 2001–19 (Fig. S2 in the ESM). However, the CRM systematically underestimates pan-Arctic AOD by 36.5%, which is likely attributed to the uncertainties of aerosol concentrations simulated with GEOS-Chem model. To diminish such bias, we apply a scaling factor of 1.6 to the original aerosol concentrations. The CRM model driven with adjusted aerosol concentrations reproduce the spatial pattern of observed shortwave radiation (Figs. 1a and 1b) with a high R2 of 0.88 (p<0.05) and a low RMSE of 14.3 W m−2 under all sky conditions (Fig. 1c). The CRM model overestimates shortwave radiation by 18% even with amplified aerosol loading. To evaluate the diffuse radiation simulated by the CRM, we further compare simulated diffuse fraction with observation from the CERES. The CRM model reproduces observed spatial pattern (Figs. 1d and 1e) with a high R2 of 0.81 and low biases of 7.7% (Fig. 1f). In general, both simulations and observations show high diffuse fraction (DF>0.6) and low shortwave radiation (SWR<200 W m−2) at high latitudes.

Figure 1. Evaluation of simulated total shortwave radiation (SWR, W m−2) and diffuse fraction (DF) in growing period. Simulated (a) SWR and (d) DF are derived by CRM based on 3-D aerosol concentrations from GEOS-Chem model. Observed (b) SWR and (e) DF are from the CERES satellite product (2001–19). For comparison, scatter plots between simulations and observations are shown in right panels, and determination coefficients (R2) and linear regressions are listed on each panel, respectively.
The YIBs model driven with PAR from CRM shows similar spatial pattern of GPP (Fig. 2a) compared with the benchmark product (Fig. 2b), with a high R2 of 0.63 and a low RMSE of 1.39 g C m−2 d−1 (Fig. 2b). The vegetation model also reproduces the observed spatial pattern for LAI with a R2 of 0.53 and a RMSE of 0.51 m2 m−2. On average, the YIBs model slightly overestimates GPP by 0.16 g C m−2 d−1 (4.6%) and overestimates LAI by 0.16 m2 m−2 (4.7%) over Eurasia.

Figure 2. Evaluation of simulated gross primary productivity (GPP, g C m2 d−1) and leaf area index (LAI, m2 m−2). Simulated (a) GPP and (d) LAI are performed by YIBs model driven with MERRA-2 reanalyses, observed (b) GPP is the benchmark product (2001–11) upscaled from site-level FLUXNET measurements and (e) LAI is the satellite-based retrieval from MODIS (2001–19). For comparison, scatter plots between simulations and observations are shown in right panels, and R2 and linear regressions are listed on each panel, respectively.
-
We quantify the changes of diffuse PAR caused by aerosols in the pan-Arctic (Fig. 3). Under all-sky conditions, aerosols increase diffuse PAR by 1.55 W m−2 (Fig. 3a) but decrease direct PAR by 4.13 W m−2 (Fig. S3a in the ESM), leading to a reduction of 2.58 W m−2 in the total PAR. Regionally, large reductions of direct PAR up to 10 W m−2 are predicted in northeastern China, accompanied by an enhancement of diffuse PAR by 3.73 W m−2. Such PAR changes are larger under clear-sky conditions with an increase of 8.43 W m−2 for diffuse PAR (Fig. 3d) but a decrease of 13.6 W m−2 for direct PAR (Fig. S3d). The enhanced diffuse radiation by aerosols under clear-sky conditions is due to the diminished cloud masking effects, which largely dampen total radiation available for aerosol extinction during the all-sky conditions (Yue and Unger, 2017).
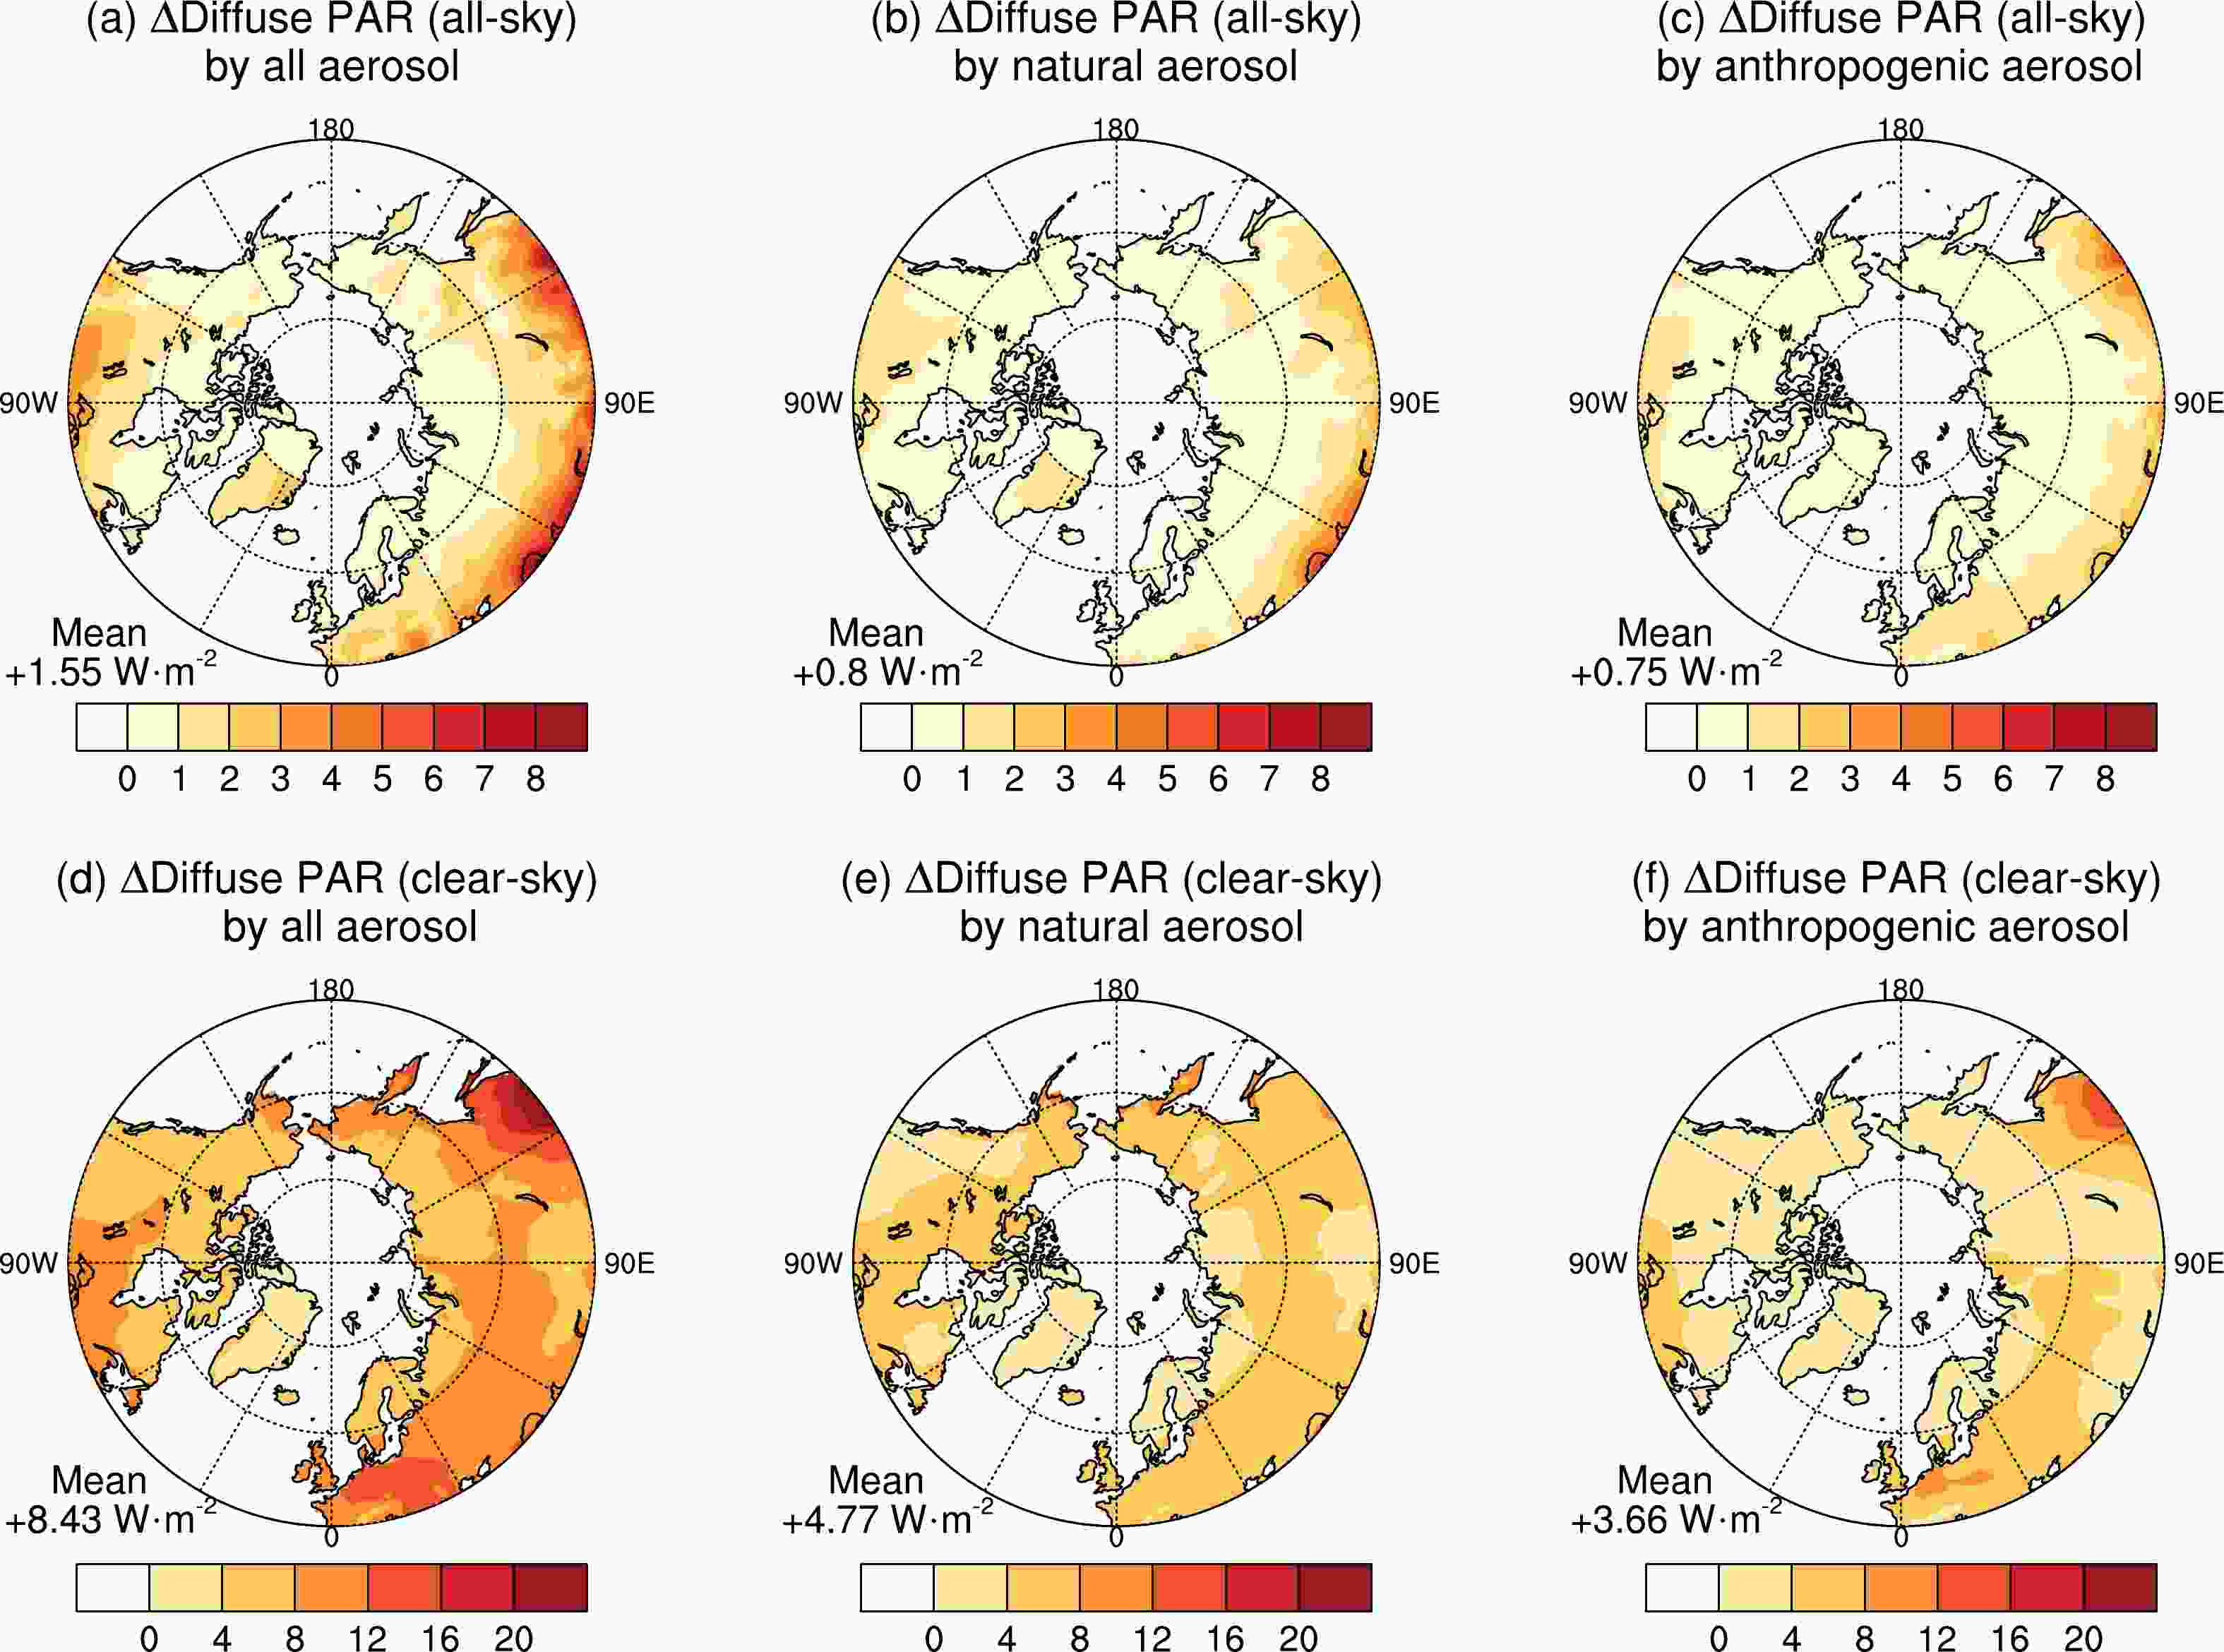
Figure 3. Simulated changes of diffuse PAR (W m−2) caused by all, natural, and anthropogenic aerosols under all (a–c) and clear (d–f) sky conditions. The average change in PAR is listed on each panel. Changes of direct PAR by all, natural, and anthropogenic aerosols are shown in Fig. S3. Please notice the differences in the color scales between all-sky and clear-sky conditions.
In the pan-Arctic, natural aerosols lead to increased diffuse PAR of 0.8 W m−2 (Fig. 3b) but decreased direct PAR of 2.66 W m−2 (Fig. S3b) under all-sky conditions. These PAR changes are mainly located at mid-high latitudes (45°–60°N) with large carbonaceous aerosol emissions from wildfires (Yue et al., 2013). Anthropogenic aerosols further increase diffuse PAR by 0.75 W m−2 (Fig. 3c) but reduce direct PAR by 1.47 W m−2 (Fig. S3c). The hotspots of such changes are mainly located at northeastern China, Europe, and southern Canada with large anthropogenic emissions. Under clear-sky conditions, natural aerosols increase diffuse PAR by 4.77 W m−2 (Fig. 3e) but decrease direct PAR by 8.2 W m−2 (Fig. S3e). Meanwhile, anthropogenic aerosols increase diffuse PAR by 3.66 W m−2 (Fig. 3f) but decrease direct PAR by 5.4 W m−2 (Fig. S3f).
-
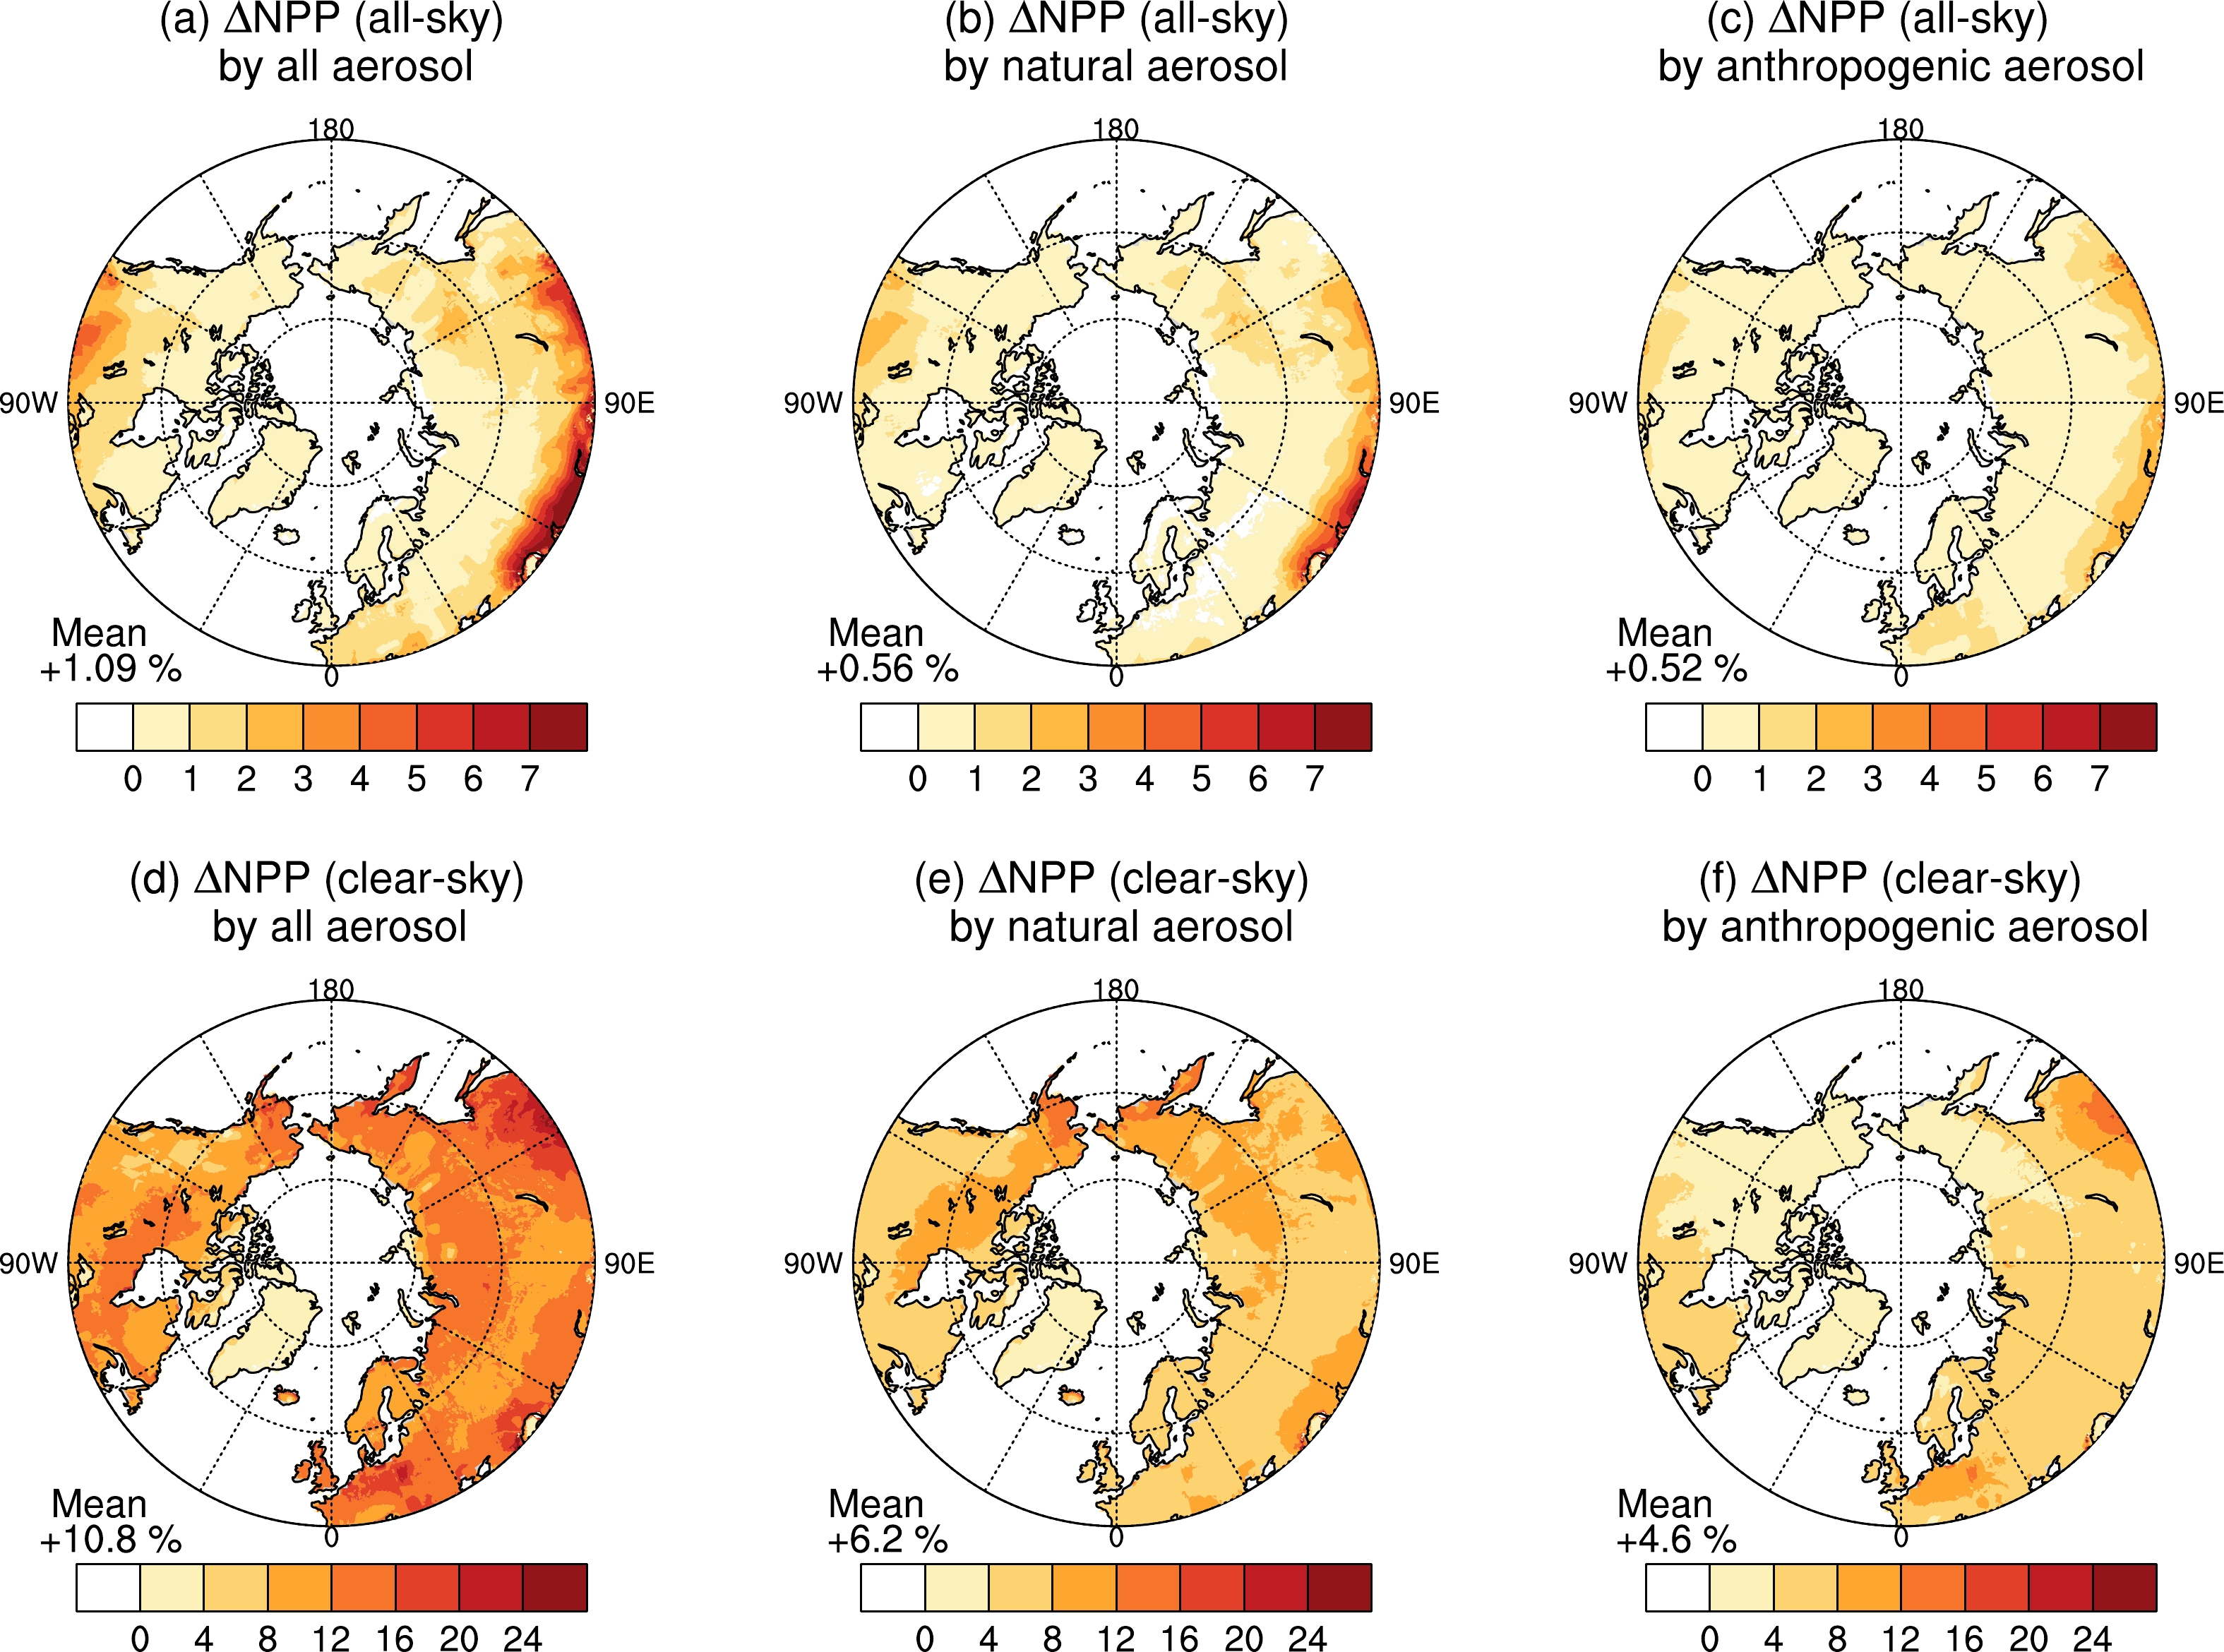
We explore the percentage changes of NPP caused by aerosol DRFEs in the pan-Arctic (Fig. 4). Relative to NPP without aerosols, aerosol DRFEs increase NPP by 0.26 Pg C yr−1 (1.24%) under all-sky conditions (Fig. 4a). Regional NPP enhancements of >1.5% are found over Eurasia and southern Canada. As a comparison, aerosol DRFEs increase NPP by 2.19 Pg C yr−1 (12.8%) under clear-sky conditions with high NPP enhancement of >10% in most regions and regional maximum of >25% in northeastern China (Fig. 4d). The smaller NPP enhancements under all-sky conditions are attributed to the inhibition effects of cloud, which tend to mask or even reverse aerosol DRFEs on ecosystem carbon assimilation (Alton, 2008; Cirino et al., 2014).

Figure 4. Percentage changes of NPP (%) caused by all, natural, and anthropogenic aerosols under (a–c) all and (d–f) clear sky conditions. The average change is shown on each panel. Please notice the differences in the color scales between all-sky and clear-sky conditions.
We distinguish the DRFEs of natural and anthropogenic aerosols in the pan-Arctic. Under clear-sky conditions, natural aerosols increase NPP by 8.88% (Fig. 4e), which is more than double of the DRFEs of 3.92% by anthropogenic aerosols (Fig. 4f). The DRFEs of natural aerosols cause high NPP enhancements of >10% over high latitudes (>60ºN) such as Alaska and Siberia (Fig. 4e), where the OC aerosols from wildfire emissions make dominant contributions (Yue and Unger, 2018). As a comparison, the DRFEs of anthropogenic aerosols increase NPP by >10% at mid-high latitudes (45º–60ºN) especially over northeastern China and Europe (Fig. 4f). These clear-sky hotspots are all masked by the high coverage of cloud in the pan-Arctic (Fig. S4a in the ESM), leading to limited DRFEs by natural and anthropogenic aerosols under the all-sky conditions. On average, natural aerosols increase NPP by 0.136 Pg C yr−1 (0.65%) under all-sky conditions (Fig. 4b), similar to the amount of 0.125 Pg C yr−1 (0.59%) caused by anthropogenic aerosols (Fig. 4c). Both DRFEs hotspots of natural and anthropogenic aerosols are confined to the middle latitudes (~45ºN) at all skies due to relatively low cloud amount (<40%) over mid-low latitudes (Fig. S4a).
-
We explore the trends of aerosol DRFEs at the pan-Arctic during 2001−19 (Fig. 5). Under the clear-sky conditions, aerosol DRFEs on average induce a decreasing NPP trend of −0.018% yr−1 (Fig. 5d), resulting from a positive trend of 0.15% yr−1 by natural aerosols (Fig. 5e) and a negative trend of −0.168% yr−1 by anthropogenic aerosols (Fig. 5f). The DRFEs of natural aerosols show positive trends (p < 0.05) in most regions except northeastern Siberia (Fig. 5e), while the DRFEs of anthropogenic aerosols show widespread negative trends (Fig. 5f). These changes mainly follow that of AOD (Fig. S5a in the ESM), which exhibits positive trends for natural aerosols (Fig. S5b) but negative trends for anthropogenic aerosols (Fig. S5c). The increase of natural AOD is attributed to increased BC/OC aerosols (Figs. S6a and S6b in the ESM) from more frequent wildfire activities and the consequent pollution emissions (Fig. S7 in the ESM). In addition, an increase of natural sulfate aerosols, which accounts for 45.9% of the total natural AOD, is predicted due to the increased emissions of dimethyl sulfate from the Arctic Sea (Mahmood et al., 2019). The decrease of anthropogenic AOD is mainly attributed to the reductions of anthropogenic emissions over most of industrialized areas at the middle latitudes (Streets et al., 2009; Yu et al., 2013; Tao et al., 2020).
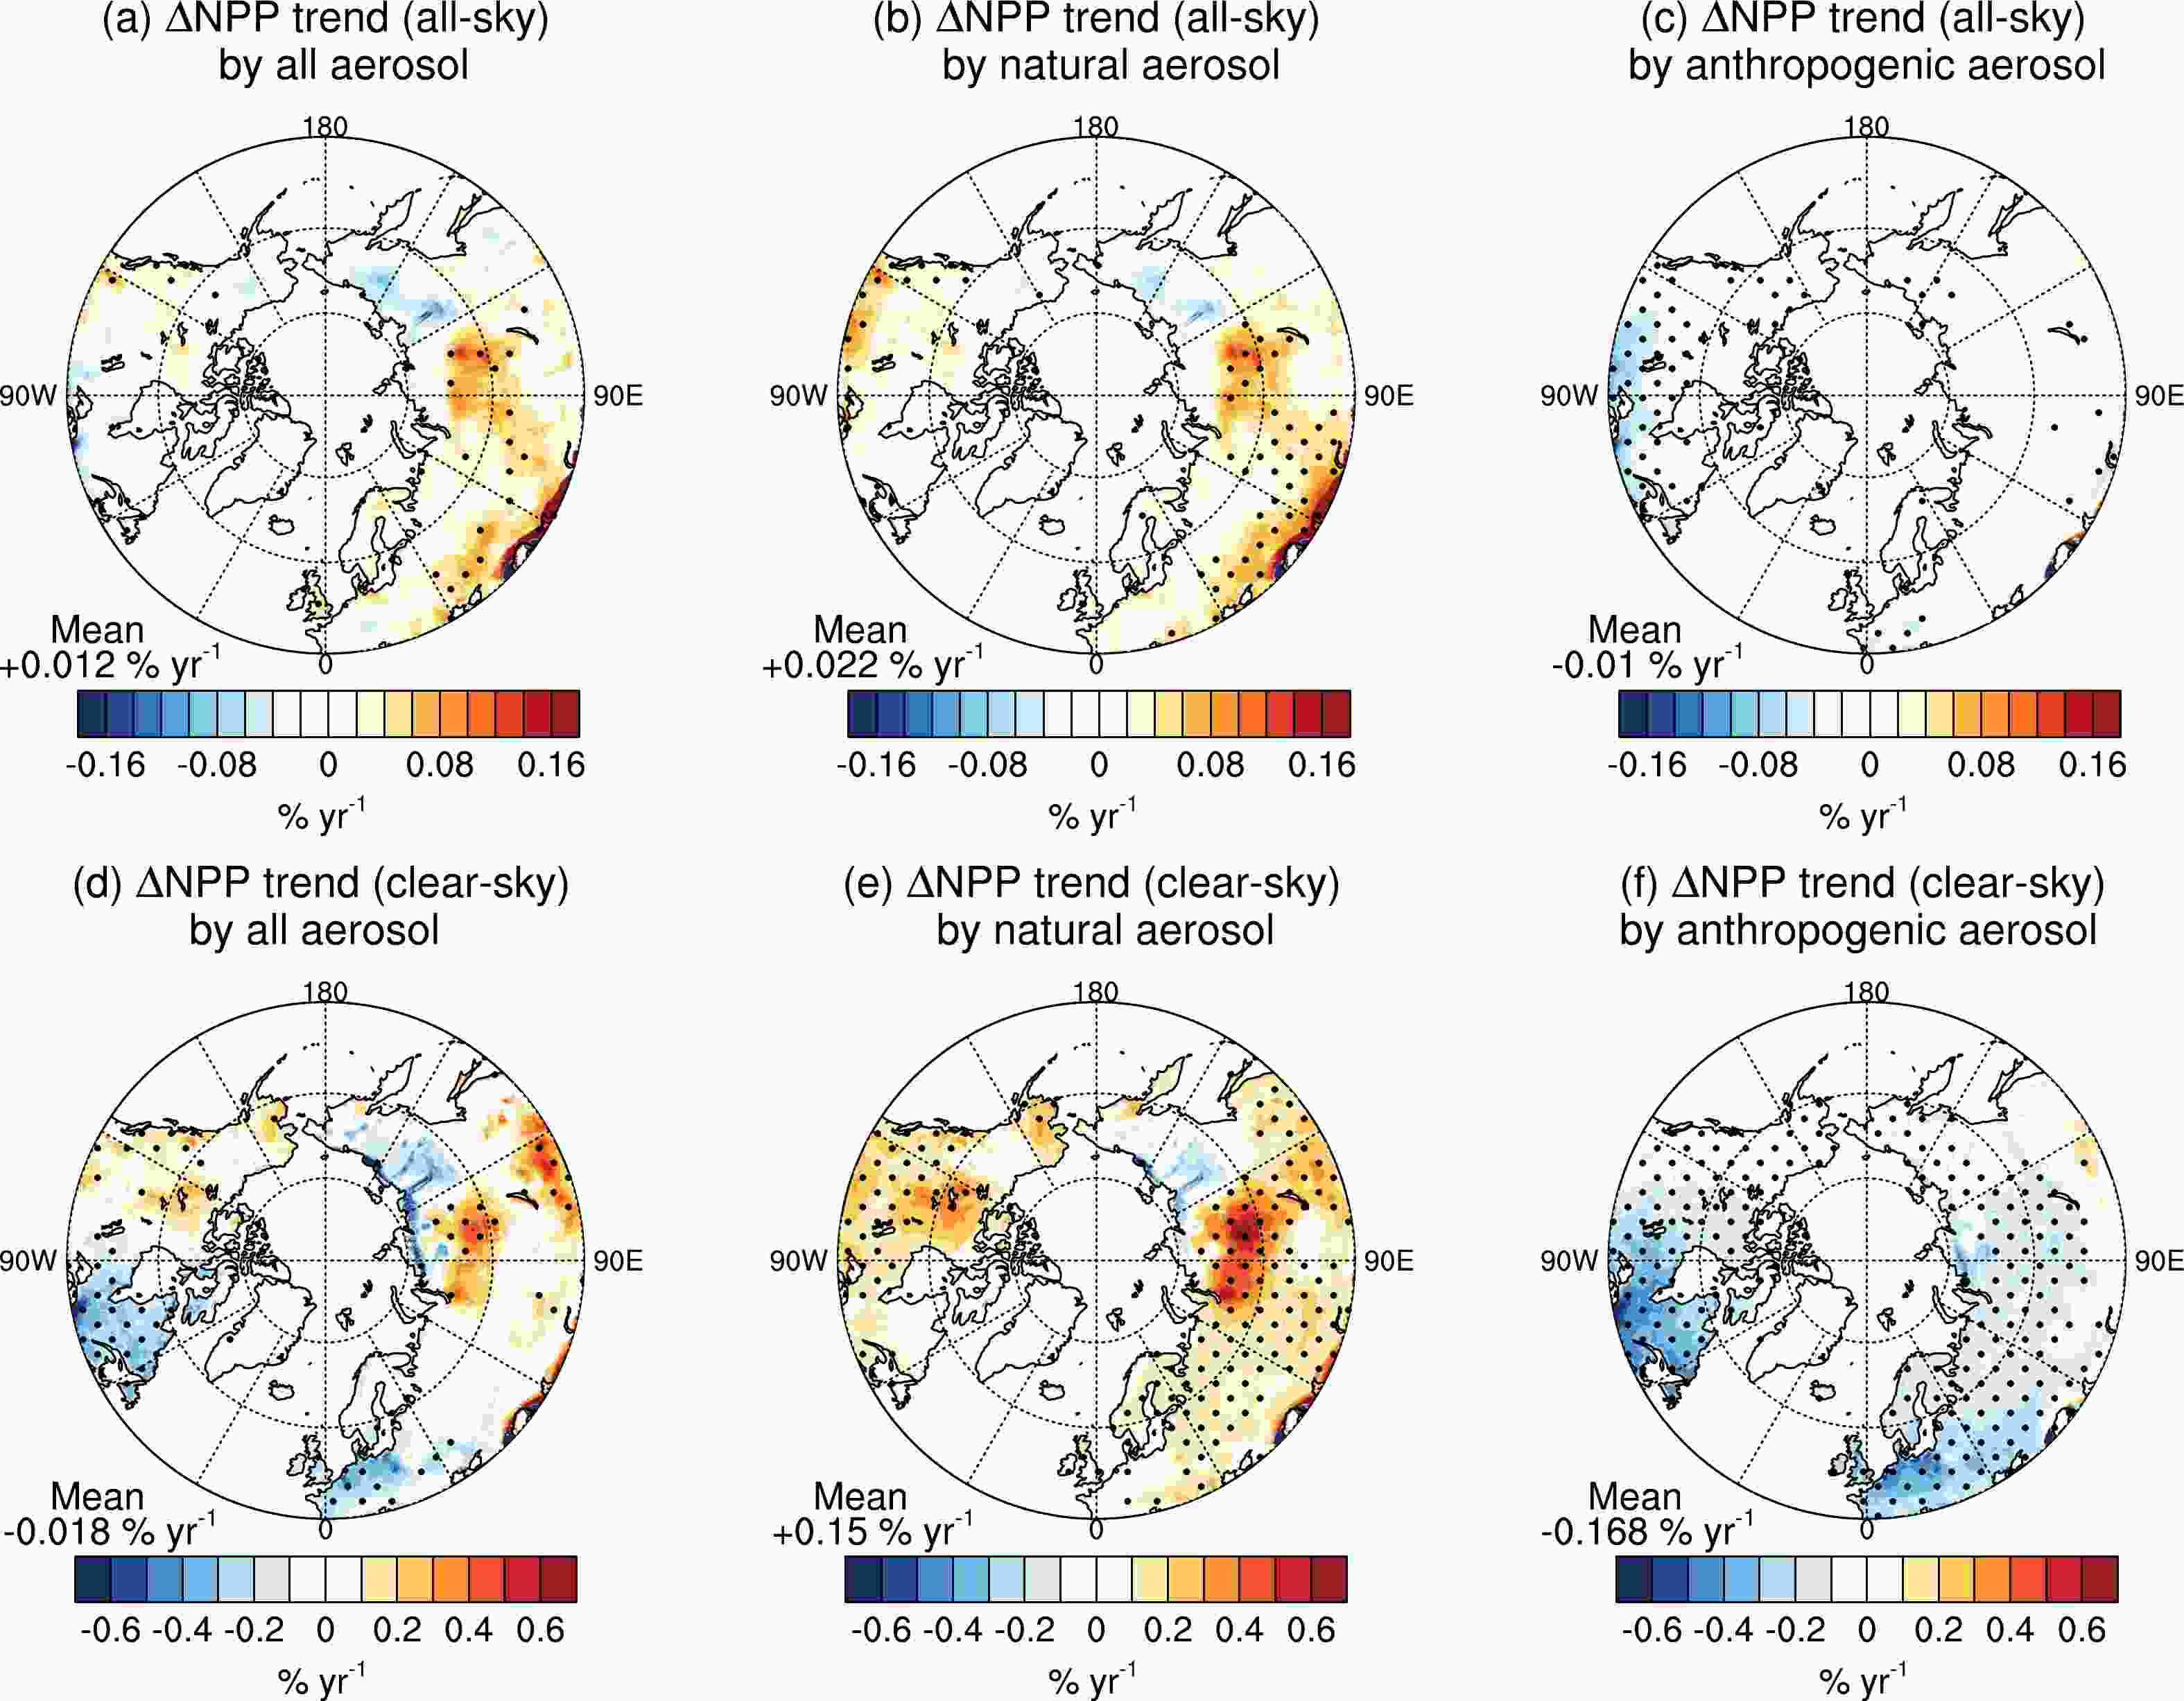
Figure 5. Simulated annual trends of NPP (% yr−1) caused by all, natural, and anthropogenic aerosols under (a–c) all and (d–f) clear sky conditions. The percentages represent the ratio of aerosol-induced ∆NPP trends to total mean NPP. Significant trends (p < 0.05) are shown with dotted area. Please notice the differences in the color scales between all-sky and clear-sky conditions.
Under all-sky conditions, the pattern of aerosol-induced ∆NPP trends (Fig. 5a) resembles that under the clear-sky conditions (Fig. 5d) but with the opposite sign of total NPP responses over the pan-Arctic due to the modulations by the changes of cloud. This is because both cloud coverage and cloud optical depth exhibit long-term decreasing trends during 2001–19 over most of the pan-Arctic (Fig. S4), leading to weakened masking effects of cloud on aerosol DRFEs. Among the total ∆NPP trend, natural aerosols induce an increasing trend of 0.022% yr−1 (Fig. 5b) with positive changes over middle and western Eurasia, and southern Canada, following increased trends of AOD from natural sources (Fig. S5b). In contrast, anthropogenic aerosols cause a decreasing trend of −0.01% yr−1 in NPP under all-sky conditions (Fig. 5c) due to the reductions of anthropogenic AOD (Fig. S5c in the ESM).
The aerosol-induced ∆NPP shows distinct trends for natural and anthropogenic sources between 2001–07 and 2008–19 (Fig. 6). For the earlier period, aerosols induce an increasing trend of the pan-Arctic NPP by 0.011% yr−1 (Fig. 6a), following the negative trend of −0.004% yr−1 by natural aerosols (Fig. 6b) and the positive trend of 0.015% yr−1 by anthropogenic aerosols (Fig. 6c). In contrast, the ∆NPP shows a positive trend of 0.013% yr−1 by natural aerosols (Fig. 6e) but a negative trend of −0.008% yr−1 (Fig. 6f) by anthropogenic aerosols during 2008–19, leading to a trend of 0.005 % yr−1 (Fig. 6d) in the pan-Arctic NPP that is smaller than the period of 2001–07. For 2008–19, the positive trends of natural AOD (Fig. S8e in the ESM) by more biomass burning (Fig. S7) contribute to the increase of NPP. Meanwhile, anthropogenic emissions peak at the year 2007 and decrease significantly thereafter in China (Zhang et al., 2017), leading to the contrast trends of anthropogenic AOD (Figs. S8c and S8f) and the consequent responses in NPP (Figs. 5c and 5f) over northeastern Asia.
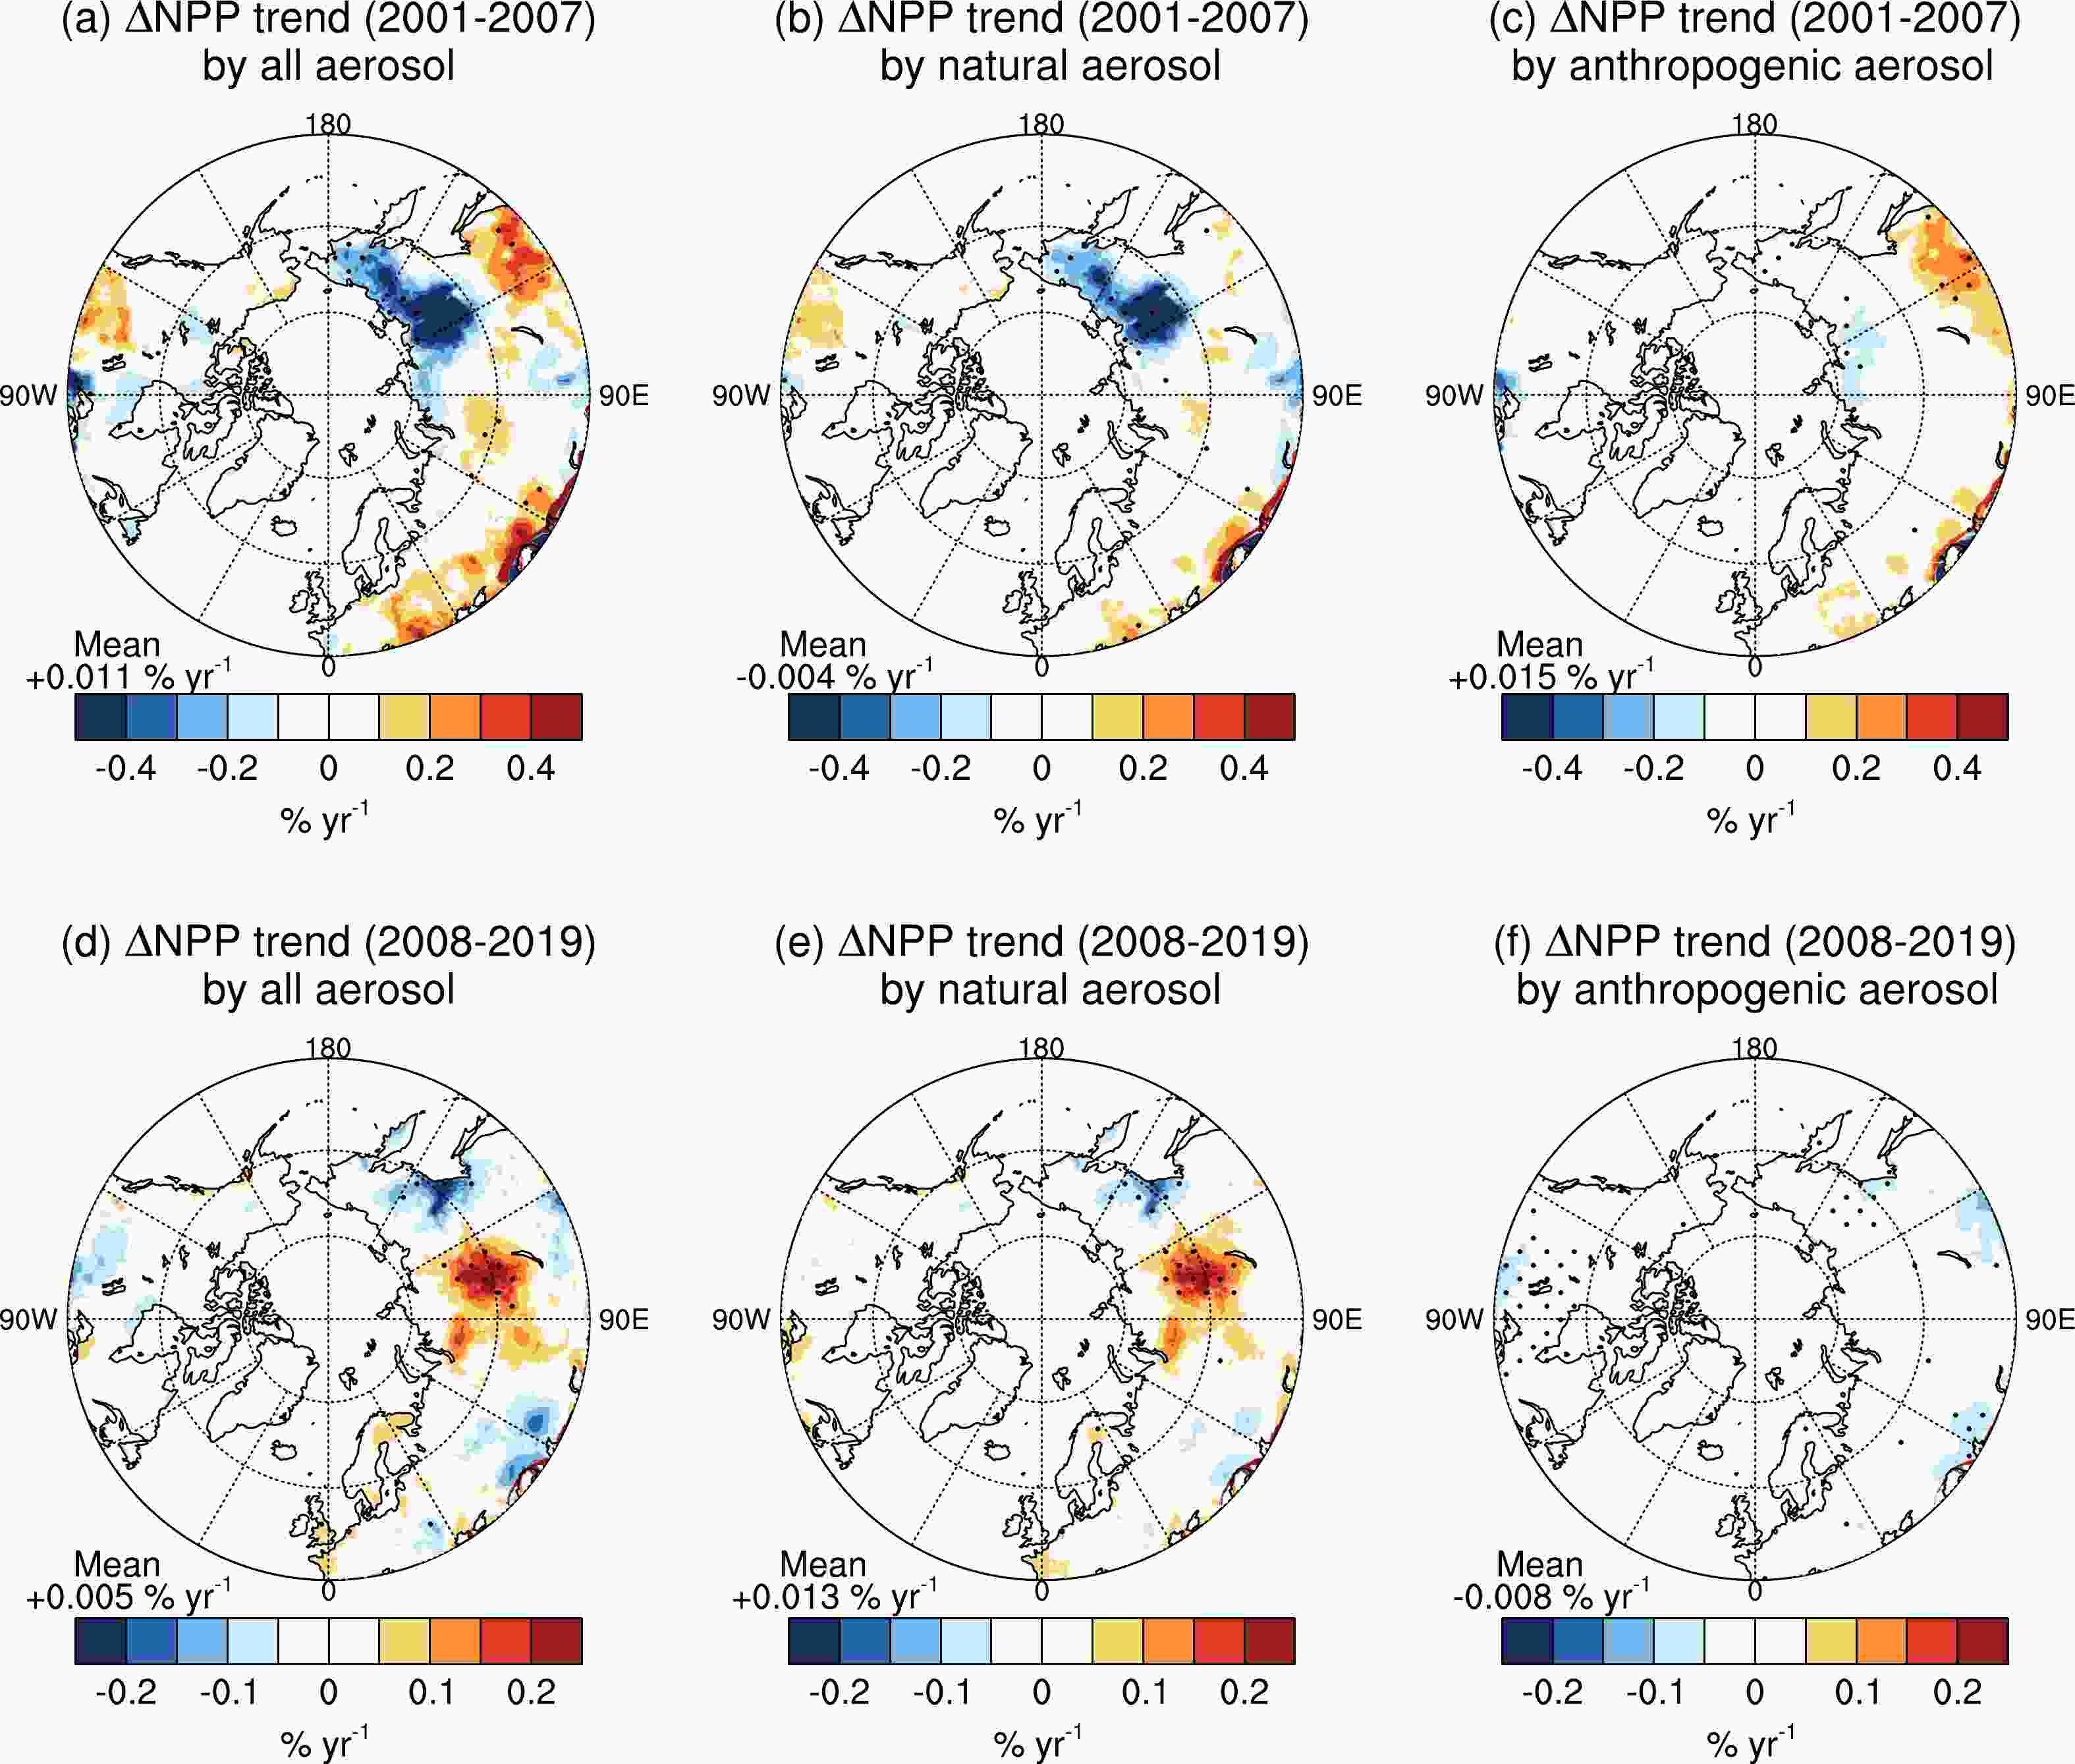
Figure 6. Simulated annual trends of NPP (% yr−1) caused by all, natural, and anthropogenic aerosols during (a–c) 2001–07 and (d–f) 2008–19. The percentages represent the ratio of aerosol-induced ∆NPP trends to total mean NPP. Significant trends (p < 0.05) are shown with dotted area. Please notice the differences in the color scales between the two periods.
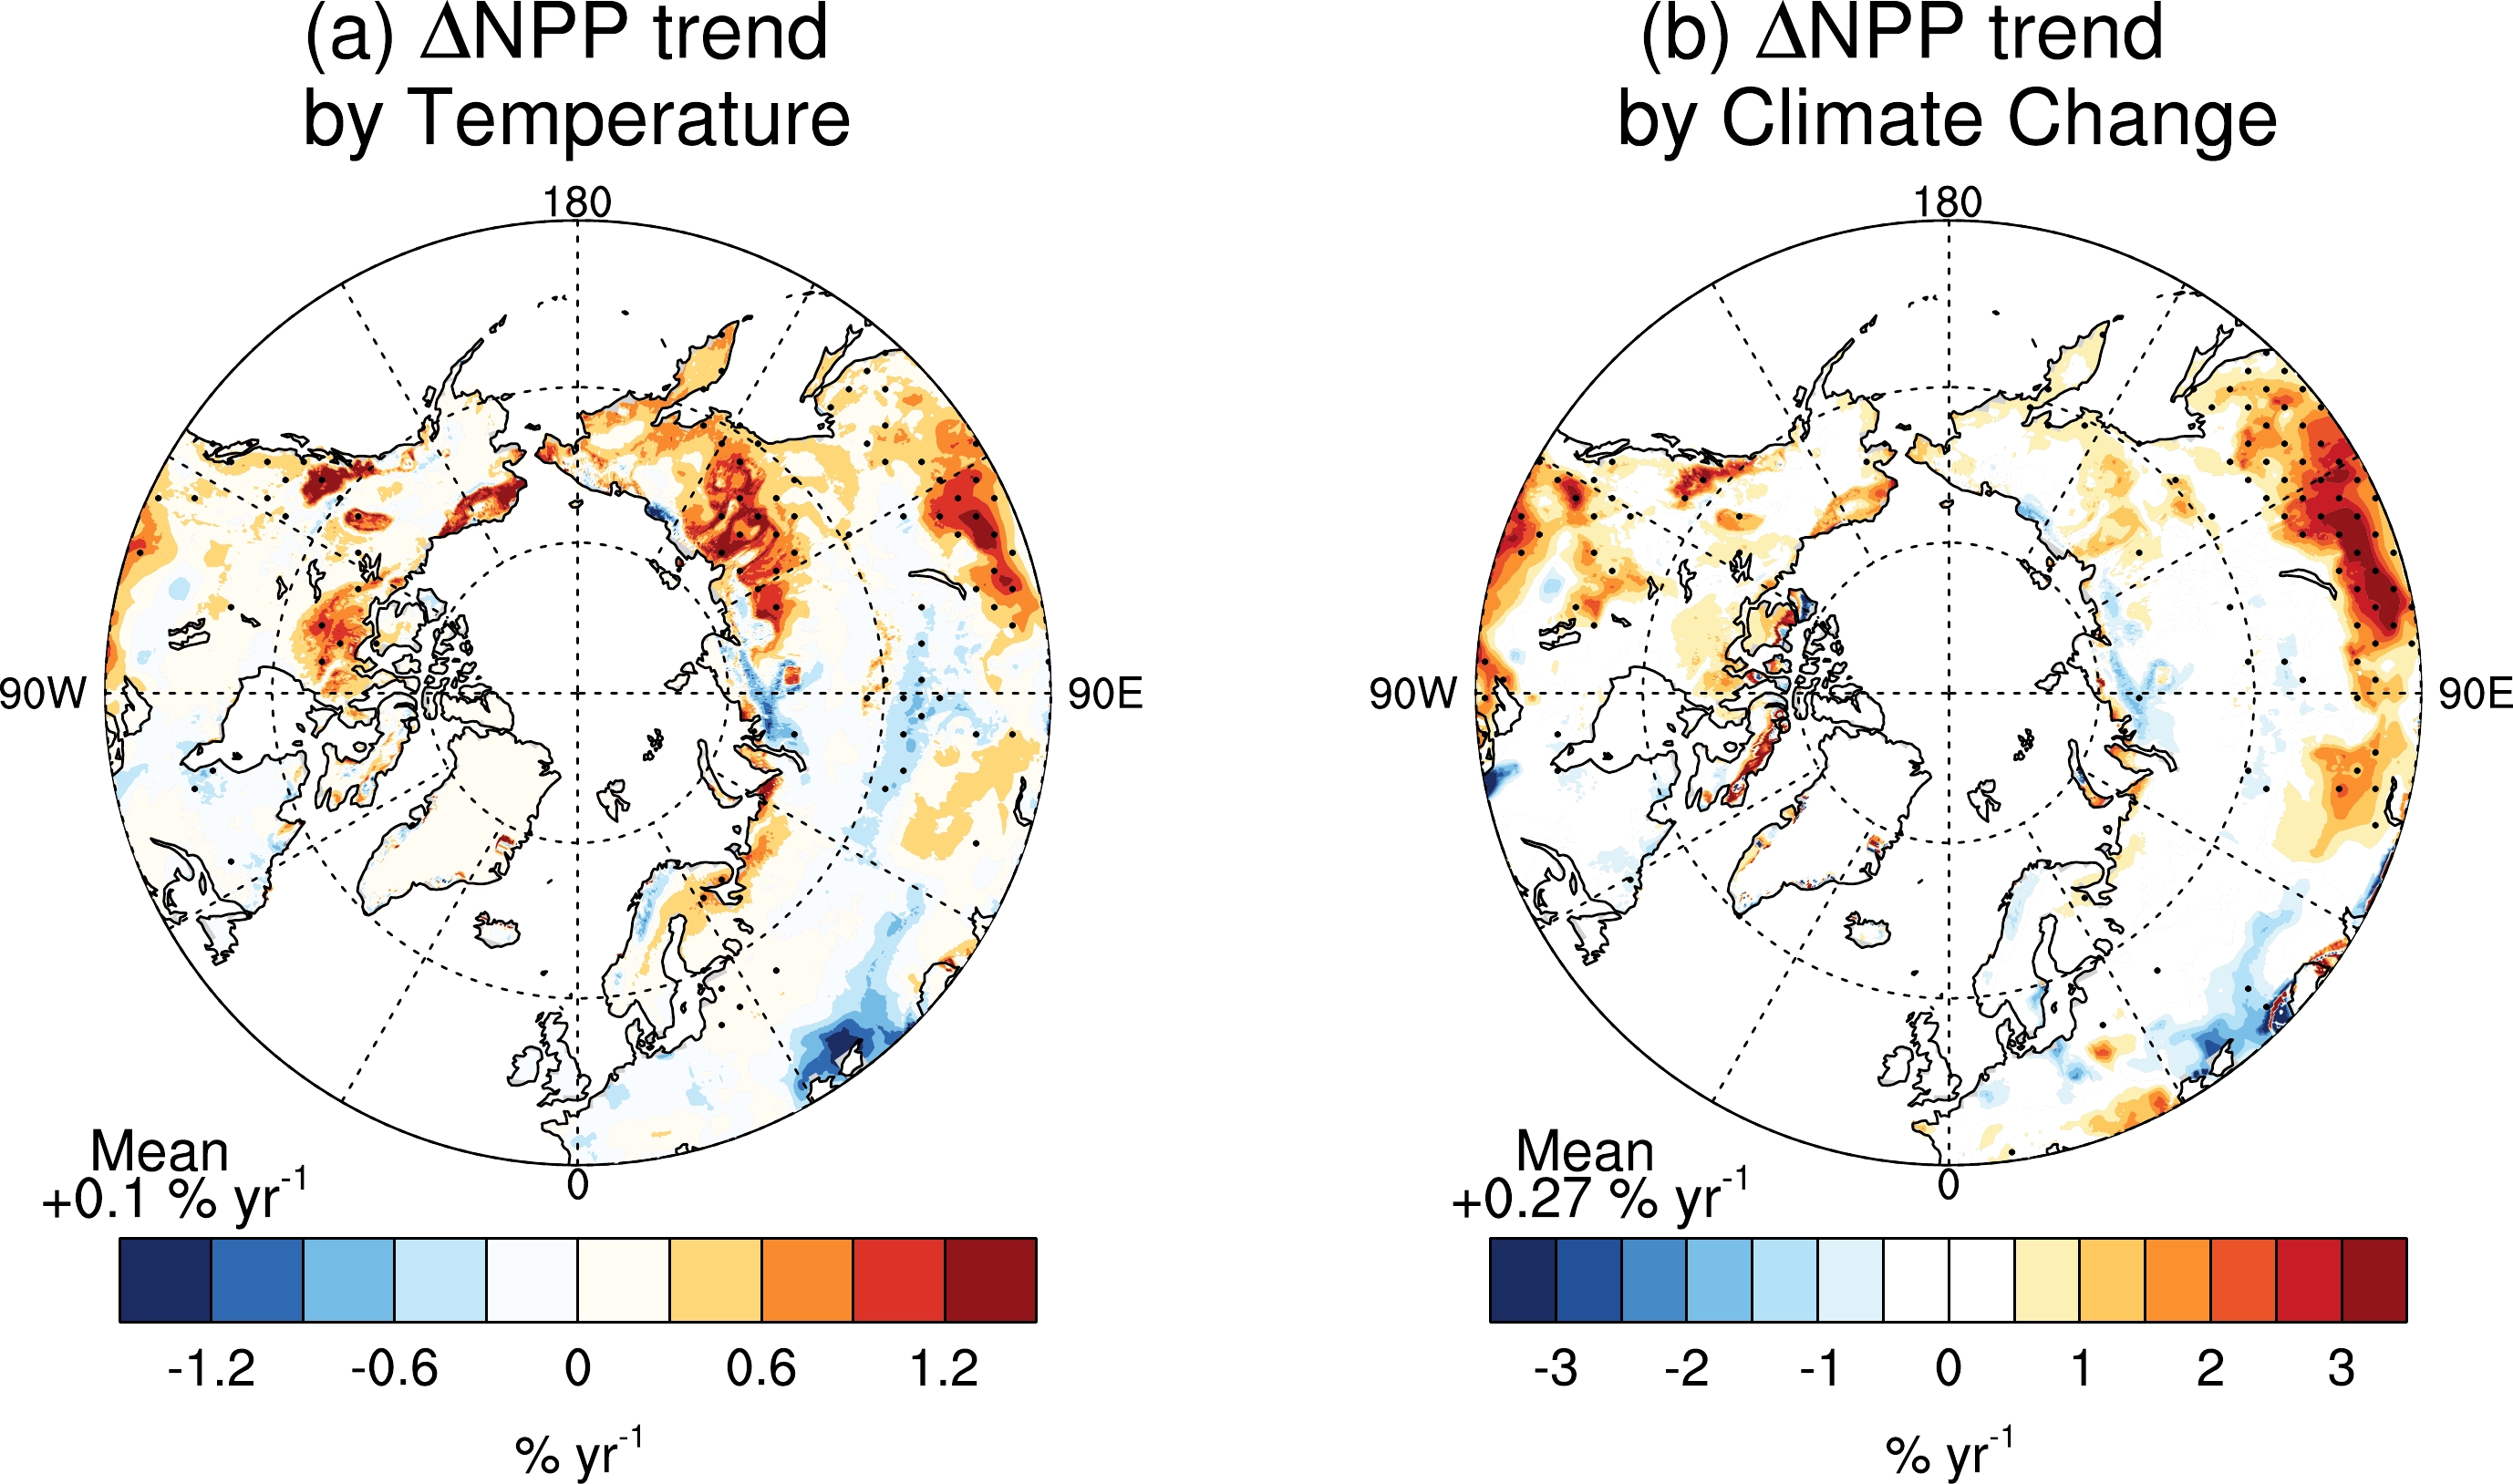
We further compare the aerosol-induced NPP trend to that caused by changes in temperature and all climatic variables (Fig. 7). In the pan-Arctic, temperature alone induces an increasing NPP trend of 0.1% yr−1 (Fig. 7a), which is almost ten times of aerosol-induced changes in NPP (0.012% yr−1) (Fig. 5a). The regional hotspots of NPP trend by temperature are much larger in magnitude than that by aerosol DRFEs, with positive values of >1% over northern Canada and eastern Eurasia but negative values of <−1% over eastern Europe. Such NPP trend mainly follows the changes of temperature in the pan-Arctic region during 2001–19 (Fig. S9 in the ESM) except for the opposite responses in eastern Europe, where the regional warming promotes plant respiration (Fig. S10b in the ESM) and limits vegetation growth. Including the contributions by temperature, climate change results in an increasing NPP trend of 0.27% yr−1 in the pan-Arctic at the same period (Fig. 6b). These results indicate that the NPP trend by aerosol DRFEs is equivalent to 12% of that by temperature change and 4.4% of that by climate change, even though the natural and anthropogenic aerosols show contrasting trends over the pan-Arctic during 2001–19.

Figure 7. Simulated trends of NPP (% yr−1) induced by changes in (a) temperature alone and (b) all climatic variables under all-sky conditions during 2001–19.
-
We quantify the impacts of aerosol DRFEs on NPP in the pan-Arctic. In our simulations, aerosol DRFEs increase NPP by 2.19 Pg C yr−1 (12.8%) under clear-sky conditions, but only 0.26 Pg C yr−1 (1.24%) under all-sky conditions (Fig. 4). Natural and anthropogenic aerosols make comparable contributions to such DRFEs with NPP enhancement of 0.136 Pg C yr−1 (0.65%) and 0.125 Pg C yr−1 (0.59%), respectively. Long-term simulations showed that aerosol DRFEs induce a positive NPP trend of 0.012% yr−1 during 2001–19 (Fig. 5), resulting from a larger NPP enhancement by natural aerosol DRFEs and an offsetting NPP reduction by anthropogenic aerosol DRFEs. The aerosol-induced NPP trend shows a turning point at the year of 2007 (Fig. 6). Before this specific year, ∆NPP by natural aerosols exhibits limited or even slightly downward trends while that by anthropogenic aerosols shows increasing trends mainly following the emission rise in China. After 2007, ∆NPP by natural aerosols shows an increasing trend due to more fire emissions in recent years (Chen et al., 2021; Veraverbeke et al., 2021; Tian et al., 2022) while the ∆NPP by anthropogenic aerosols decrease significantly because of emission controls over most areas especially in China.
Our estimate is subject to limitations and uncertainties. First, aerosol DRFEs are sensitive to the biases in aerosol profiles. Evaluations showed that simulated AOD is underestimated by 34.1% (Fig. S1). Although we applied a scaling factor of 1.6 to amplify the original aerosol concentrations, the biases in aerosol distribution may still influence the estimate of radiation. For example, simulated surface shortwave radiation is 18% higher than the satellite retrieval (Fig. 1c), which may be related to the underestimation of AOD in Eurasia and Canada (Fig. S1). Second, we neglect NPP responses to aerosol climatic effects in the pan-Arctic. Observations have shown that warming promotes plant photosynthesis at high latitudes (Piao et al., 2013). Therefore, we may overestimate aerosol DRFEs due to the neglection of aerosol-induced surface cooling (Chakraborty et al., 2021). On the other hand, previous studies found that aerosol DRFEs account for 78% of the total aerosol effects to ecosystems, much higher than the GPP changes induced by aerosol climatic effects (Zhang et al., 2021). Third, we neglect aerosol indirect radiative effects on terrestrial carbon uptake in this study. Aerosols can influence cloud properties to alter surface radiative fluxes and meteorology (Bellouin et al., 2020), which are essential for vegetation growth. However, changes in surface radiation caused by aerosol-cloud interactions vary in Earth system models (Malavelle et al., 2019), leading to uncertainties in the responses of terrestrial productivity. Fourth, we may underestimate the aerosol DRFEs due to including aerosol dimming effects. Increases of aerosols could reduce direct shortwave radiation, which will decrease plant photosynthesis in sunlit leaves and partly offset carbon benefits by aerosols DRFEs (Chakraborty et al., 2022).
Our study reveals that aerosol DRFEs help enhance land carbon uptake in the pan-Arctic. In the past two decades, the net NPP trend by aerosol DRFEs was only tenth of that induced by temperature due to the offsetting effects from the changes in natural and anthropogenic aerosols. However, our study reveals larger DRFEs by either natural or anthropogenic aerosols individually, suggesting an important role of aerosols from different emissions in the modulation of ecosystem productivity at the pan-Arctic areas. With more countries aiming towards carbon neutrality, global anthropogenic emissions are expected to decrease gradually (Zheng et al., 2018; Monjardino et al., 2021). Meanwhile, global warming is expected to increase fire activities in the pan-Arctic (Running, 2006; McCarty et al., 2021) and consequently enhances the amounts of natural aerosols. As a result, the impacts of aerosol DRFEs on pan-Arctic NPP are likely increasing even though the contributions by anthropogenic aerosols will further decrease in the future. We suggest to include aerosol DRFEs for the projection of future carbon budget over the pan-Arctic taking into account changes in both natural and anthropogenic emissions under different climate scenarios.
Data availability statement. Observational data used for this study are available through the references and/or the links provided in the Method section. Simulation data are available upon reasonable request from the authors.
Acknowledgements. This work was jointly supported by the National Key Research and Development Program of China (Grant No. 2022YFE0106500) and Jiangsu Science Fund for Distinguished Young Scholars (Grant No. BK20200040).
Electronic supplementary material: Supplementary material is available in the online version of this article at
https://doi.org/10.1007/s00376-023-2329-x .
Simulation of the Ecosystem Productivity Responses to Aerosol Diffuse Radiation Fertilization Effects over the Pan-Arctic during 2001–19
- Manuscript received: 2022-11-03
- Manuscript revised: 2023-04-06
- Manuscript accepted: 2023-04-10
Abstract: The pan-Arctic is confronted with air pollution transported from lower latitudes. Observations have shown that aerosols help increase plant photosynthesis through the diffuse radiation fertilization effects (DRFEs). While such DRFEs have been explored at low to middle latitudes, the aerosol impacts on pan-Arctic ecosystems and the contributions by anthropogenic and natural emission sources remain less quantified. Here, we perform regional simulations at 0.2º×0.2º using a well-validated vegetation model (Yale Interactive terrestrial Biosphere, YIBs) in combination with multi-source of observations to quantify the impacts of aerosol DRFEs on the net primary productivity (NPP) in the pan-Arctic during 2001–19. Results show that aerosol DRFEs increase pan-Arctic NPP by 2.19 Pg C (12.8%) yr−1 under clear-sky conditions, in which natural and anthropogenic sources contribute to 8.9% and 3.9%, respectively. Under all-sky conditions, such DRFEs are largely dampened by cloud to only 0.26 Pg C (1.24%) yr−1, with contributions of 0.65% by natural and 0.59% by anthropogenic species. Natural aerosols cause a positive NPP trend of 0.022% yr−1 following the increased fire activities in the pan-Arctic. In contrast, anthropogenic aerosols induce a negative trend of −0.01% yr−1 due to reduced emissions from the middle latitudes. Such trends in aerosol DRFEs show a turning point in the year of 2007 with more positive NPP trends by natural aerosols but negative NPP trends by anthropogenic aerosols thereafter. Though affected by modeling uncertainties, this study suggests a likely increasing impact of aerosols on terrestrial ecosystems in the pan-Arctic under global warming.
-
Keywords:
- diffuse radiation fertilization effects,
- anthropogenic aerosols,
- natural aerosols,
- pan-Arctic,
- net primary productivity
摘要: 泛北极地区面临着从低纬度传输而来的空气污染的影响。观测表明气溶胶能够通过散射辐射施肥效应(DRFEs)促进植被的光合作用。尽管DRFEs在中低纬度地区已有相关研究,气溶胶对泛北极生态系统的影响以及对人为和自然气溶胶的相对贡献尚不明确。在本研究中我们使用一个充分验证的植被模式(耶鲁互动生物圈模式,YIBs)和多源观测数据,量化了气溶胶的DRFEs对2001-19年期间泛北极地区净初级生产力(NPP)的影响。结果表明,晴空条件下气溶胶DRFEs使泛北极地区NPP增加了2.19 Pg C(12.8%)yr-1,其中自然和人为气溶胶的贡献分别为8.9%和3.9%。在全天空条件下,气溶胶的 DRFEs在很大程度上被云层削弱,仅有0.26 Pg C(1.24%)yr-1的促进效应,其中自然气溶胶贡献0.65%而人为气溶胶贡献0.59%。随着泛北极地区野火活动的增加,自然气溶胶导致NPP呈0.022%yr-1的增长趋势。相比之下,由于中纬度地区的排放量减少,人为气溶胶产生了-0.01%yr-1的NPP降低趋势。气溶胶DRFEs的趋势转折点出现在2007年,在此之后自然气溶胶导致的NPP增长趋势更强,而人为气溶胶导致的NPP增长趋势开始减弱。尽管受到模型不确定性的影响,本研究表明在全球变暖背景下,气溶胶对泛北极地区陆地生态系统的影响可能会越来越大。


 AAS Website
 AAS WeChat