


 DownLoad:


-
The Madden–Julian Oscillation (MJO; Madden and Julian, 1971) is a dominant intraseasonal mode of tropical convection, featured by an eastward propagation of cloud and precipitation along the equator, with a frequency of 30–60 days (e.g., Kiladis et al., 2005, 2014; Waliser et al., 2009). Its timescale and close connection with situ and remote weather and climate systems make it an important regulator of tropical and extratropical predictability (e.g., tropical cyclones, monsoons, El Niño–Southern Oscillation, North Atlantic Oscillation, etc.). Improving MJO prediction skill has become an important task for many research communities and operational centers.
In the recent two decades, many international projects have been organized to deepen the understanding of subseasonal predictability. For example, the Intraseasonal Variability Hindcast Experiment (ISVHE) launched in 2009 (Neena et al., 2014), the Subseasonal to Seasonal Prediction (S2S) Project under the World Climate Research Programme (WCRP) and World Weather Research Programme (WWRP) launched in 2013 (Vitart et al., 2017), and the Subseasonal Experiment (SubX) launched in 2017 (Pegion et al., 2019). As the leading source of subseasonal scale predictability, the MJO is a major focus of these projects. The forecast systems in ISVHE have useful prediction skills (the forecast day when the bivariate correlation coefficient reaches 0.5) for the MJO of around 8–26 days (Lee et al., 2017). For the ten operational models in the S2S project, the useful prediction skill of the MJO ranges from 10 to 34 forecast days, and the skills in most models are below 24 forecast days (Vitart, 2017). Similarly, the useful prediction skill of the MJO in the SubX project models is around three weeks (Pegion et al., 2019). Overall, the state-of-the-art operational forecast systems could predict the MJO with useful skill beyond 3–4 forecast weeks (Rashid et al., 2011; Liu et al., 2017, 2019; Vitart, 2017; Kim et al., 2018, 2019).
Although MJO prediction has shown remarkable improvements in the aforementioned international projects, its prediction remains challenging due to many factors. The model parameterization schemes and air-sea coupling could considerably influence MJO simulation and prediction (Vitart et al., 2007; Lin et al., 2008; Fu et al., 2013; Hannah and Maloney, 2014; Klingaman and Woolnough, 2014; Miyakawa et al., 2014; Shelly et al., 2014; Vitart, 2014; Hannah et al., 2015; Kim et al., 2018). Also, the dynamical models usually fail to simulate the eastward propagation of the MJO when it approaches the Maritime Continent (MC). This problem is perceived as the MC barrier effect, which exists in many forecast models and prevents the MJO events from crossing the MC in the forecast (Kim et al., 2014; Wang et al., 2014, 2017; Xiang et al., 2015; Liu et al., 2017, 2019; Vitart, 2017; Zhu et al., 2017; Zhou et al., 2022). Besides the capability of the models to represent the MJO, the initial condition is another key factor that determines the prediction skill of the MJO. Usually, more coordinated and accurate initial conditions could improve the prediction skill of the MJO (Fu et al., 2011; Ling et al., 2014; Liu et al., 2017, 2019; Ren et al., 2017; Kim et al., 2018). Nevertheless, sometimes the internal process of the numerical model may amplify the errors of initial conditions, thus worsening the MJO forecast (Yao et al., 2021). A better understanding of these factors and their possible influences is crucial for improving MJO prediction.
Given the importance and challenges of MJO prediction, enormous efforts have been made by the China Meteorological Administration (CMA) to improve its forecast skill. Different versions of the Beijing Climate Center Climate System Model (BCC-CSM) are used to conduct S2S prediction operations. At the S2S project phase I (2014–18), initialized by various reanalysis data, a medium-resolution model version is used to provide fixed re-forecasts for every initial date from 1994–2013 and real-time forecast since 2014. Liu et al. (2017, 2019) comprehensively introduced this S2S forecast system, including the model, initialization scheme, and ensemble forecast scheme, and further improved the MJO prediction skill from 15 days to 22–23 days by optimizing the initial conditions and model parameterization. At the S2S project phase II (2019–23), a new forecast system consisting of a high-resolution model version (Wu et al., 2021), coupled data assimilation scheme (Liu et al., 2021), and ensemble scheme based on stochastically perturbed parametrization tendencies (SPPT), is adopted. The new real-time forecasts and re-forecasts of the past 15 years have been provided twice weekly (Monday and Thursday) with an on-the-fly mode since November 2019.
In this study, we investigate the MJO prediction skill of BCC-CSM in different stages of the S2S project and further explore the factors that led to the progress of MJO prediction. This study aims to answer the following three questions. (1) What is the capability of the new high-resolution model in simulating MJO climatology compared with its predecessors? (2) What are the differences in MJO prediction skills between the model version from S2S project phase I and that in phase II? (3) What are the possible factors that contributed to these differences in MJO prediction skills? Several sets of long-term historical simulation experiments and hindcast experiments are used to explore the above issues.
The remainder of this paper is organized as follows. Section 2 describes the models, hindcast experiments, observation datasets, and analysis methods used in this study. In section 3, we present the simulations of MJO climatology from three different versions of BCC-CSM. In section 4, we outline the significant differences among three sets of hindcast experiments and further explore their possible causes. The conclusions are presented in section 5.
-
In this study, we used three different versions of BCC-CSM, including a medium-resolution model version (BCC-CSM1.2), an updated version with modified physical parameters (BCC-CSM1.2-M), and a newly developed high-resolution model version (BCC-CSM2-HR), respectively.
BCC-CSM1.2 participated in phase I of the S2S project. Its atmospheric component is the BCC Atmospheric General Circulation Model (BCC-AGCM) version 2, which has a horizontal resolution of T106 triangular truncation (approximately 110 km) and 40 vertical hybrid sigma/pressure layers with the top level at 0.5 hPa. The land component is the BCC Atmosphere and Vegetation Interaction Model (BCC-AVIM) version 1.0. The ocean and sea-ice components are from the GFDL Modular Ocean Model version 4 (Griffies et al., 2005) and Sea Ice Simulator version 4 (Winton, 2000) with 1/3° and 1° horizontal resolution, respectively. An overview of the development of this model and its use in short-term climate prediction and climate change is given by previous studies (Wu et al., 2013, 2014; Liu et al., 2014, 2015, 2017, 2019).
Based on BCC-CSM1.2, Liu et al. (2019) modified the parameterization schemes to get a better simulation of the MJO. Following the sampling approach and physical interpretation of Yang et al. (2015), a Latin hypercube sampling method was used to perturb seven key physical parameters related to MJO simulation, which consist of an adjustment timescale and precipitation efficiency for shallow convection, a relative humidity threshold for low and high stable clouds, a relative humidity threshold for a convection trigger, and precipitation efficiency and evaporation efficiency for deep convection. An optimal set of seven parameters was selected from a total of 85 perturbed experiments based on their performance of several basic MJO metrics (for details, please refer to Liu et al., 2019). The BCC-CSM with modified parameters is referred to as BCC-CSM1.2-M hereafter.
In phase II of the S2S project, a high-resolution version of BCC-CSM (i.e., BCC-CSM2-HR; Wu et al., 2021) was developed to operate the S2S forecast. The atmospheric component is BCC-AGCM version 3 (Wu et al., 2019), with a horizontal resolution of T266 triangular truncation (approximately 45 km) and 56 vertical hybrid sigma/pressure layers with the top level at 0.1 hPa. The ocean component of BCC-CSM2-HR is MOM5 (Griffies, 2012), with a horizontal resolution of 0.25° and 50 vertical levels. The land component is the BCC-AVIM version 2, and the sea-ice component is SIS5 (Delworth et al., 2006).
-
To understand the model’s capability to simulate the MJO, we used the above three model versions to conduct three sets of historical simulation experiments. Each experiment includes a 15-year free-run integration. Also, based on the BCC-CSM1.2, BCC-CSM1.2-M, and BCC-CSM2-HR in different phases of the S2S project, we have conducted three sets of hindcast experiments, referred to as EXP1, EXP1-M, and EXP2, respectively.
EXP1 is the original hindcast dataset submitted to phase I of the S2S. It provided hindcast experiments initialized each day from 1994–2013 (Liu et al., 2017). The atmospheric initial condition is from the 6-hourly atmospheric fields in the NCEP Reanalysis 1, and the oceanic initial condition is from the BCC Global Ocean Data Assimilation System version 2. Each hindcast case includes four lagged average forecasting (LAF) members with 60-day forecast integration. Based on the BCC-CSM1.2-M, EXP1-M provides hindcast experiments initialized on the 1st, 6th, 11th, 16th, 21st, and 26th of each month during 2000–13. It uses the NCEP FNL (Final) Operational Global Analysis to produce the atmospheric initial condition and introduce the NOAA 1/4° daily Optimum Interpolation Sea Surface Temperature data (Reynolds et al., 2007) to update the sea surface temperature (SST) initial condition. During phase I of the S2S project, EXP1-M replaced EXP1 to provide real-time forecasts since mid-2017. Details of the differences between EXP1 and EXP1-M are documented in Liu et al. (2019). This study uses EXP1 and EXP1-M with the same initial date from 2000 to 2013. Each of them contains 1008 hindcast cases.
EXP2 is the hindcast experiment based on BCC-CSM2-HR, which became operational in November 2019 in phase II of the S2S project. The real-time forecasts and re-forecasts were conducted twice weekly (Monday and Thursday). Unlike the fixed hindcast experiment with a daily frequency in phase I of the S2S project, the hindcast experiment in phase II of the S2S project is produced in an on-the-fly mode, which is more suitable for an operation with a changing forecast system. It means that if there was a real-time forecast on one calendar day, related re-forecasts over the past 15 years were conducted on that calendar day. The hindcast experiments covering 2005–19 (a total of 1575 hindcast cases) are analyzed in this study. Each hindcast case contains four ensemble members generated by the SPPT method. The initial conditions of EXP2 are provided by a newly-developed coupled assimilation system, in which the ocean and sea-ice components assimilate the temperature and salinity profiles, SST, sea-ice concentration, and sea level anomaly data. The atmospheric component of the assimilation system is nudged towards the ERA-interim reanalysis before 2018 and the atmospheric real-time analysis of the European Centre for Medium-Range Weather Forecasts (ECMWF) afterward. Detailed information about this coupled assimilation system is given by Liu et al. (2021).
-
In this study, we applied the observed daily outgoing longwave radiation (OLR) at a 2.5° resolution (Liebmann and Smith, 1996) from the National Oceanic and Atmospheric Administration (NOAA). The daily winds, specific humidity, and vertical velocity data from the ECMWF ERA5 reanalysis (Hersbach et al., 2020) were used as validation data. These data are referred to as observations for simplicity.
-
In this study, we used different methods to extract MJO signals from the model's historical simulation and hindcast data. For the model historical simulation, same as those in Liu et al. (2017, 2019), after applying a 20–100-day Lancoz filter, a combined empirical orthogonal function (EOF) analysis was applied to the OLR and the 850-hPa and 200-hPa zonal winds. Then, the spatial structure and principal components (PCs) of the MJO were derived. For the hindcast experiments, we used the real-time multivariate MJO (RMM; Wheeler and Hendon, 2004) indices. Using OLR, 850-hPa, and 200-hPa zonal winds at a horizontal resolution of 2.5°, the RMM indices were calculated by projecting predicted normalized intraseasonal anomalies of the above fields onto the observed combined EOF eigenvectors.
Following Wheeler and Hendon (2004), the MJO amplitude and phase angle are defined as
$ \sqrt{{\mathrm{R}\mathrm{M}\mathrm{M}1}^{2}+{\mathrm{R}\mathrm{M}\mathrm{M}2}^{2}} $ and$ {\mathrm{tan}}^{-1}({\mathrm{R}\mathrm{M}\mathrm{M}1}^{2}/{\mathrm{R}\mathrm{M}\mathrm{M}2}^{2}) $ , respectively. The MJO prediction skill is measured by the bivariate correlation coefficient and bivariate root square mean error (RMSE), as documented in Rashid et al. (2011). -
The model's capability to simulate key characteristics of MJO may potentially influence its MJO forecast. Therefore, in this section, we first examined the model’s performance in representing MJO structure and propagation.
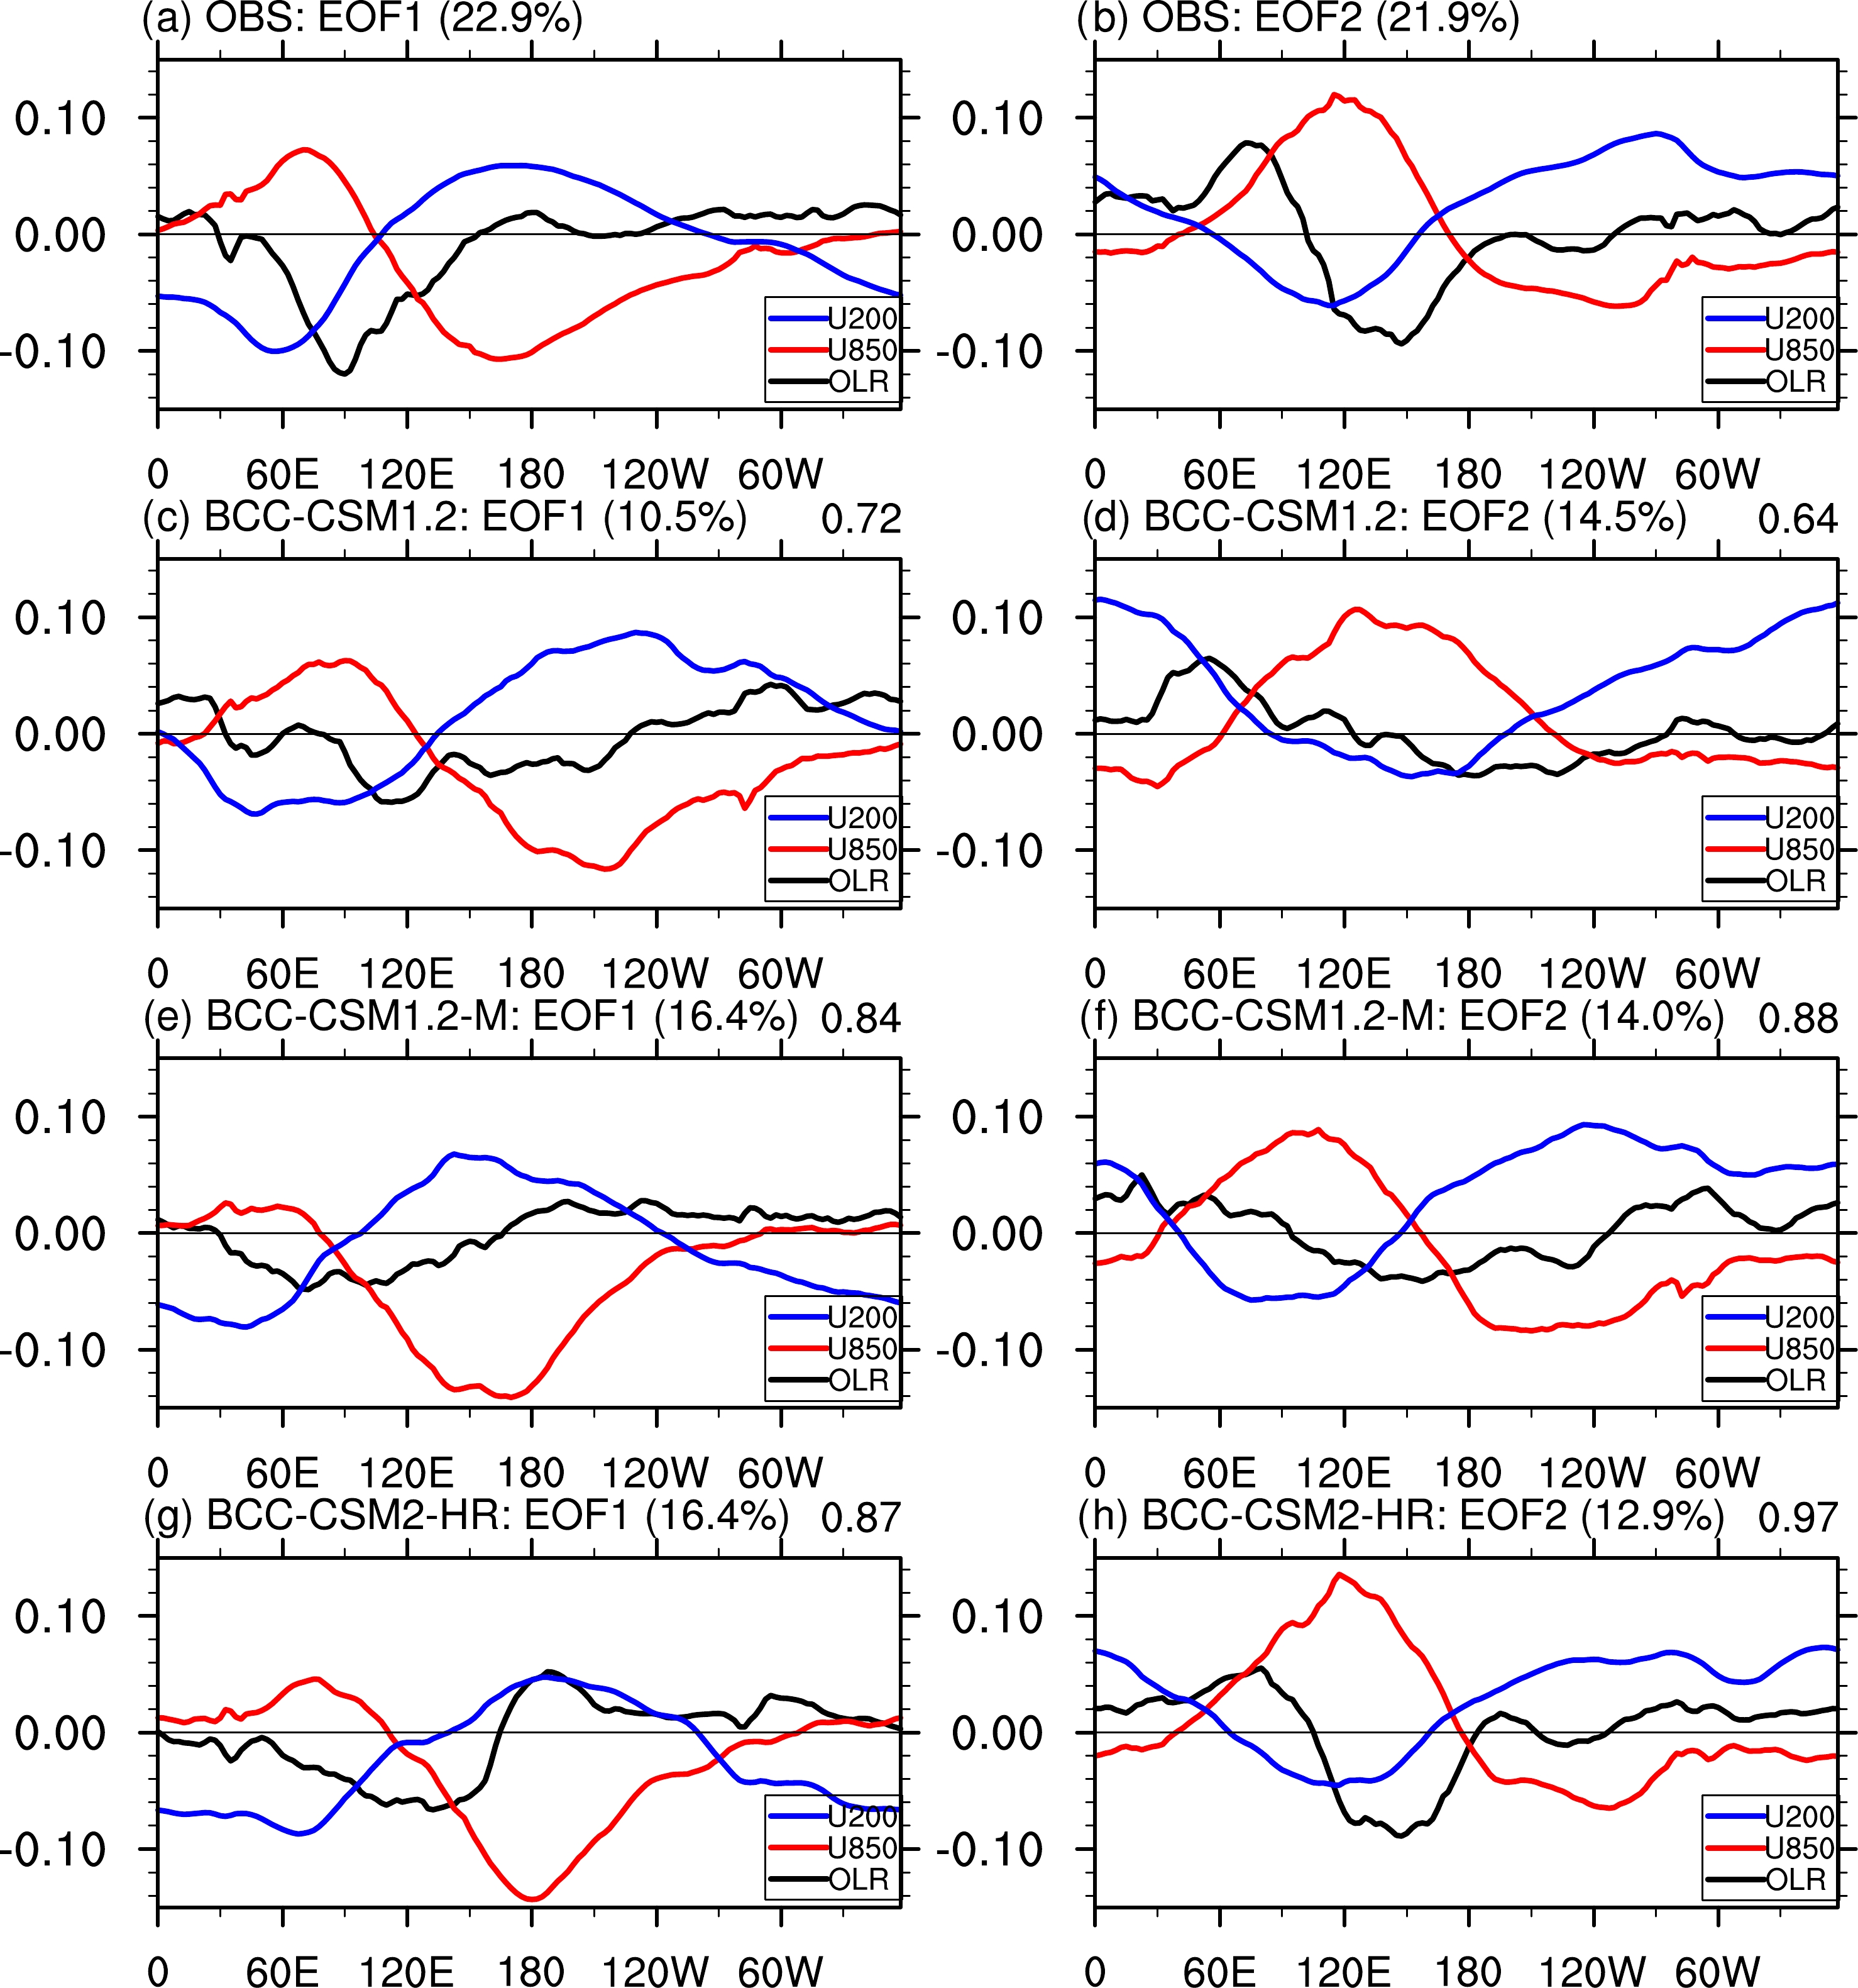
Figure 1 shows the two leading EOFs of 20–100-day filtered anomalies of combined OLR and zonal winds at 850 and 200 hPa. In observations, EOF1 and EOF2 represent the MC mode and the Indian-Pacific Ocean mode in the MJO (Kiladis et al. 2014), respectively. The EOF1 mode shows remarkably enhanced convection over the MC region (Fig. 1a). The EOF2 mode shows convection enhancements over the Indian Ocean and suppression over the western Pacific (Fig. 1b). The sign change of 850-hPa (200-hPa) zonal wind around the maximum negative OLR represents low-level (high-level) convergence (divergence) related to the enhanced convection. The total explained variance among the two EOF modes is 44.8%.
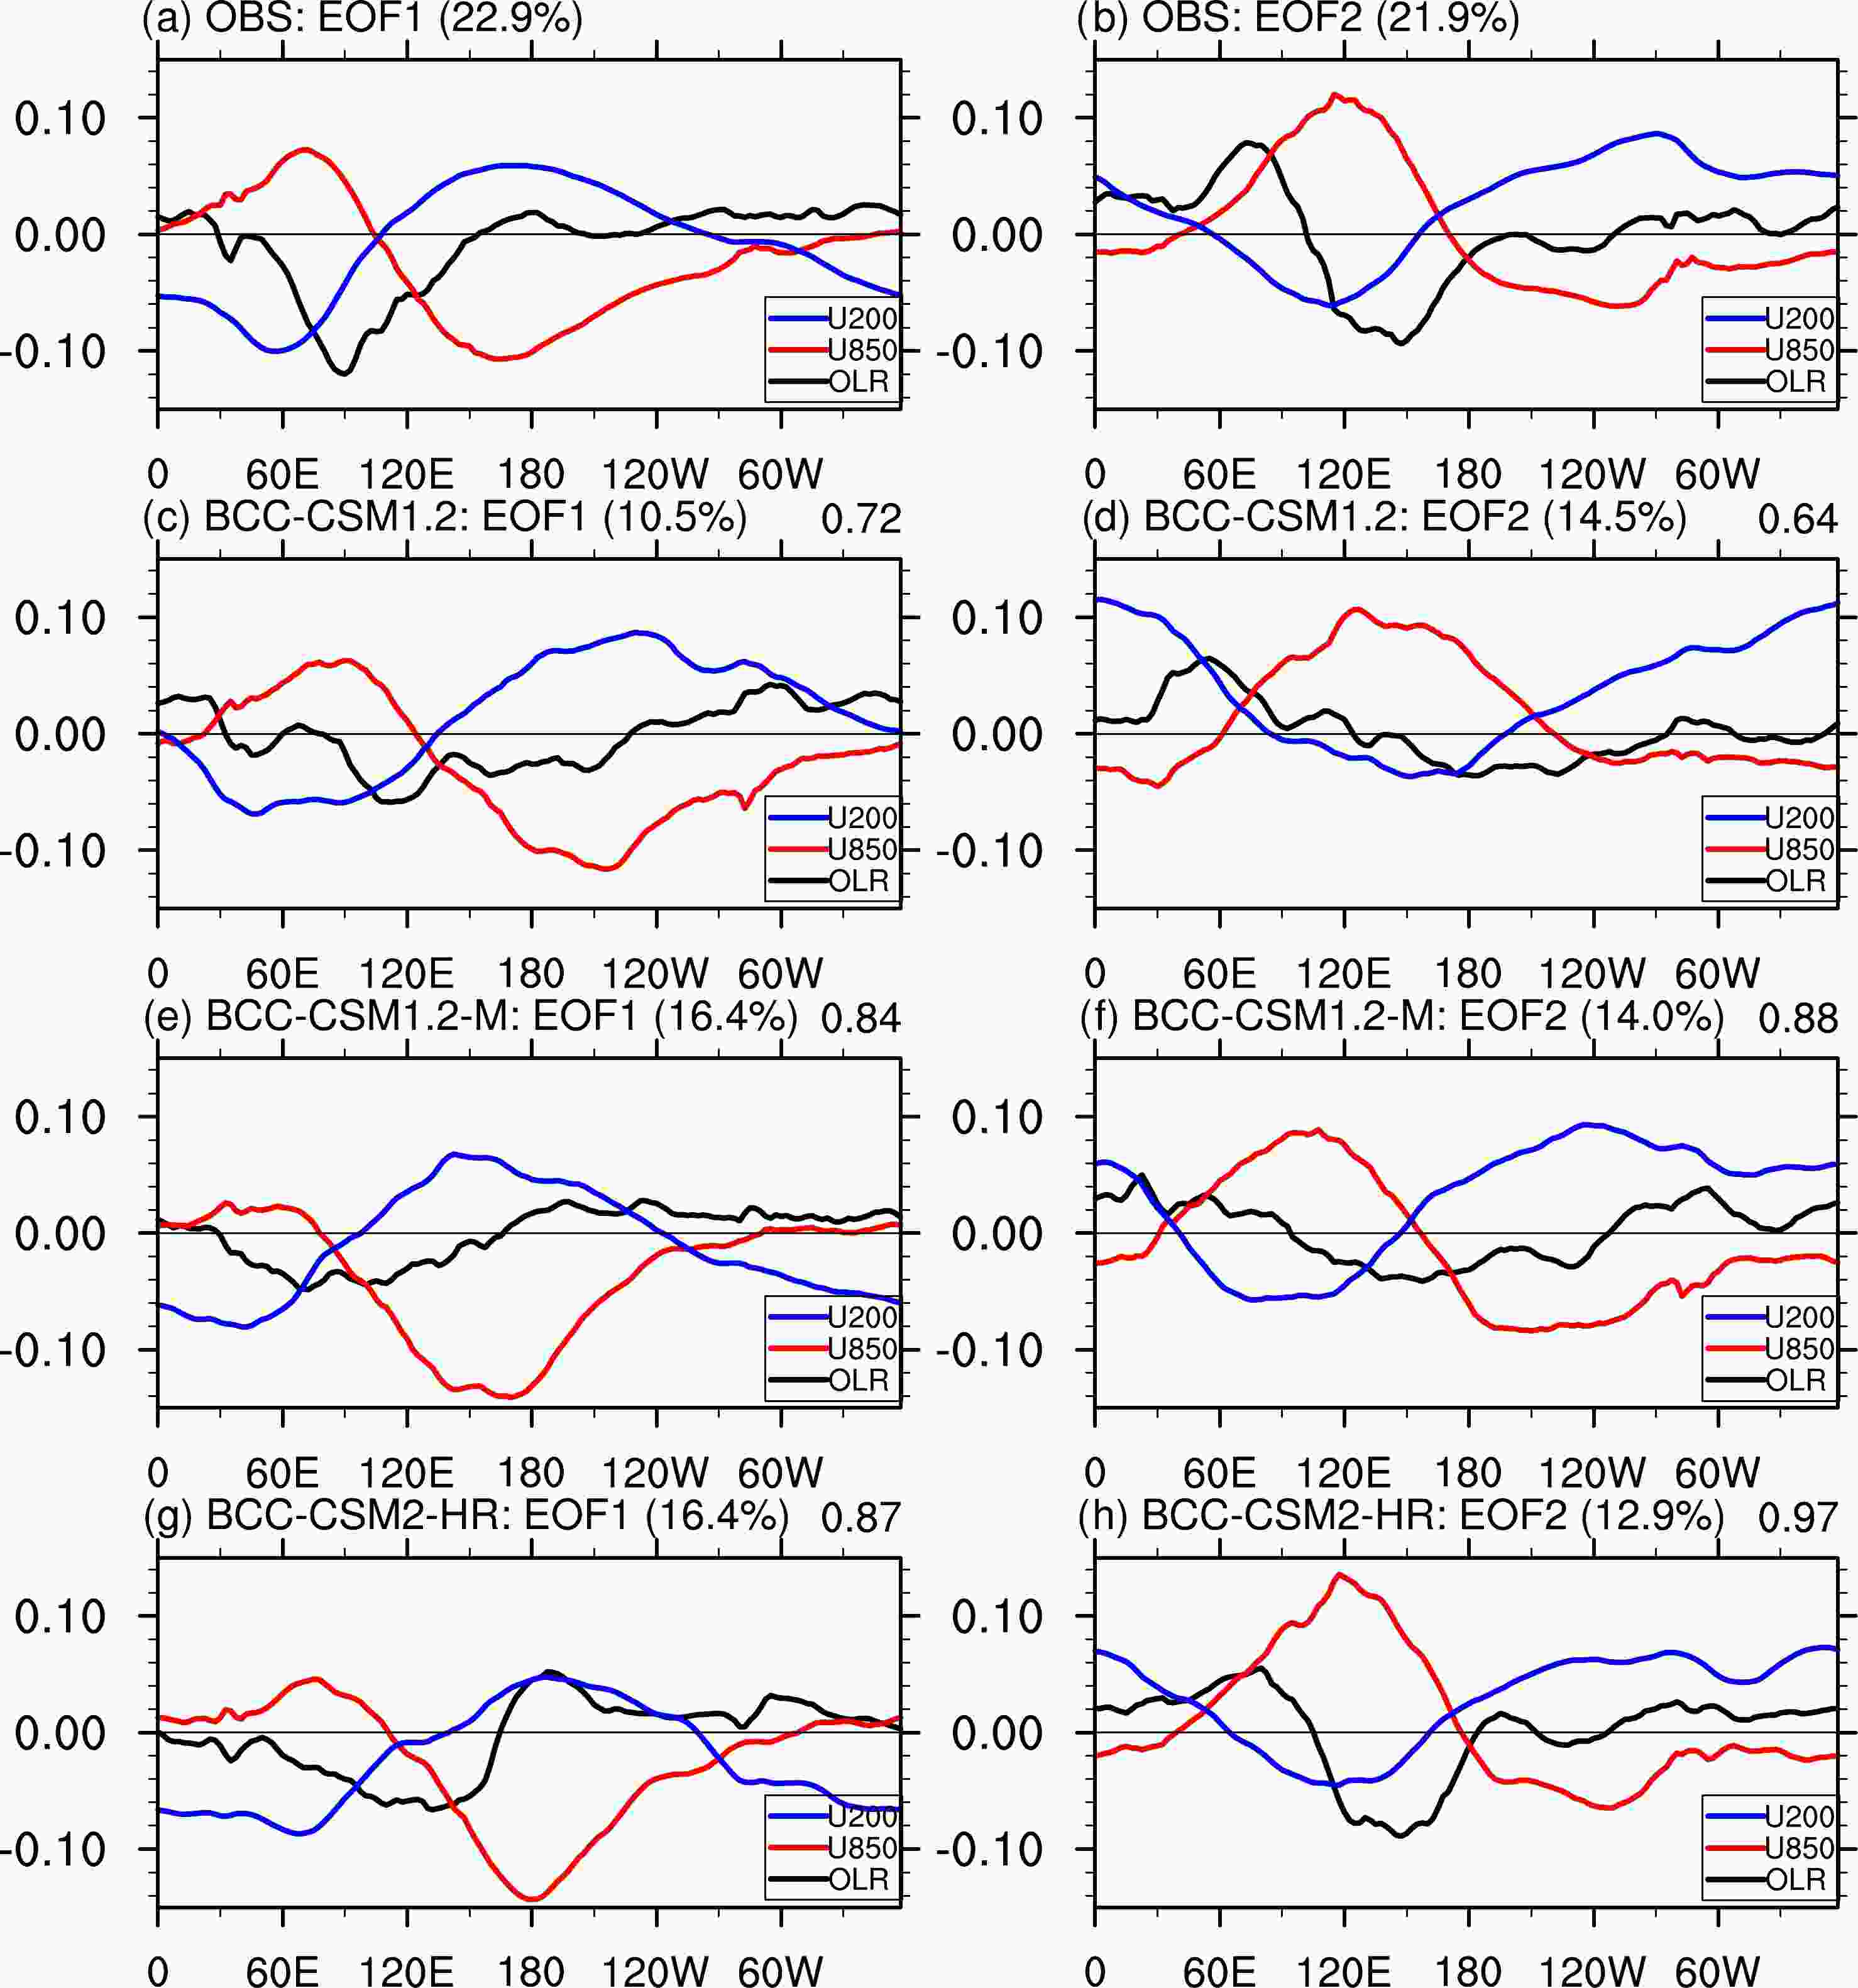
Figure 1. Two leading EOFs of intraseasonal anomalies of combined outgoing longwave radiation, 850-hPa zonal wind, and 200-hPa zonal wind in (a–b) observation, (c–d) BCC-CSM1.2, (e–f) BCC-CSM1.2-M, and (g–h) BCC-CSM2-HR. The variance explained by each mode is given after each subtitle in the parentheses at the top left of each panel. The value at the top right is the spatial pattern correlation between observation and simulation.
Compared with the observation, the EOF1 and EOF2 modes in the BCC-CSM1.2 simulation show a reversed sequence, reduced explained variance (about 25.0%), and weakened convection anomalies (Figs. 1c, d). The pattern correlation coefficients of EOF1 and EOF2 between the model and observation are 0.72 and 0.64, respectively. Compared with BCC-CSM1.2, the modes order of EOF1 and EOF2 in BCC-CSM1.2-M is correct, and its explained variance has been improved. (Figs. 1e, f). The pattern correlation coefficient of EOF1 and EOF2 between BCC-CSM1.2-M and observation is 0.84 and 0.88, respectively. These improvements indicate that the parameter modification in BCC-CSM1.2-M had effectively improved the MJO simulation. Further, BCC-CSM2-HR displays advantages in simulating the magnitude and spatial pattern of OLR and zonal wind compared with the previous two model versions (Figs. 1g, h). The pattern correlation coefficients are enhanced to 0.87 and 0.97 for EOF1 and EOF2, respectively.
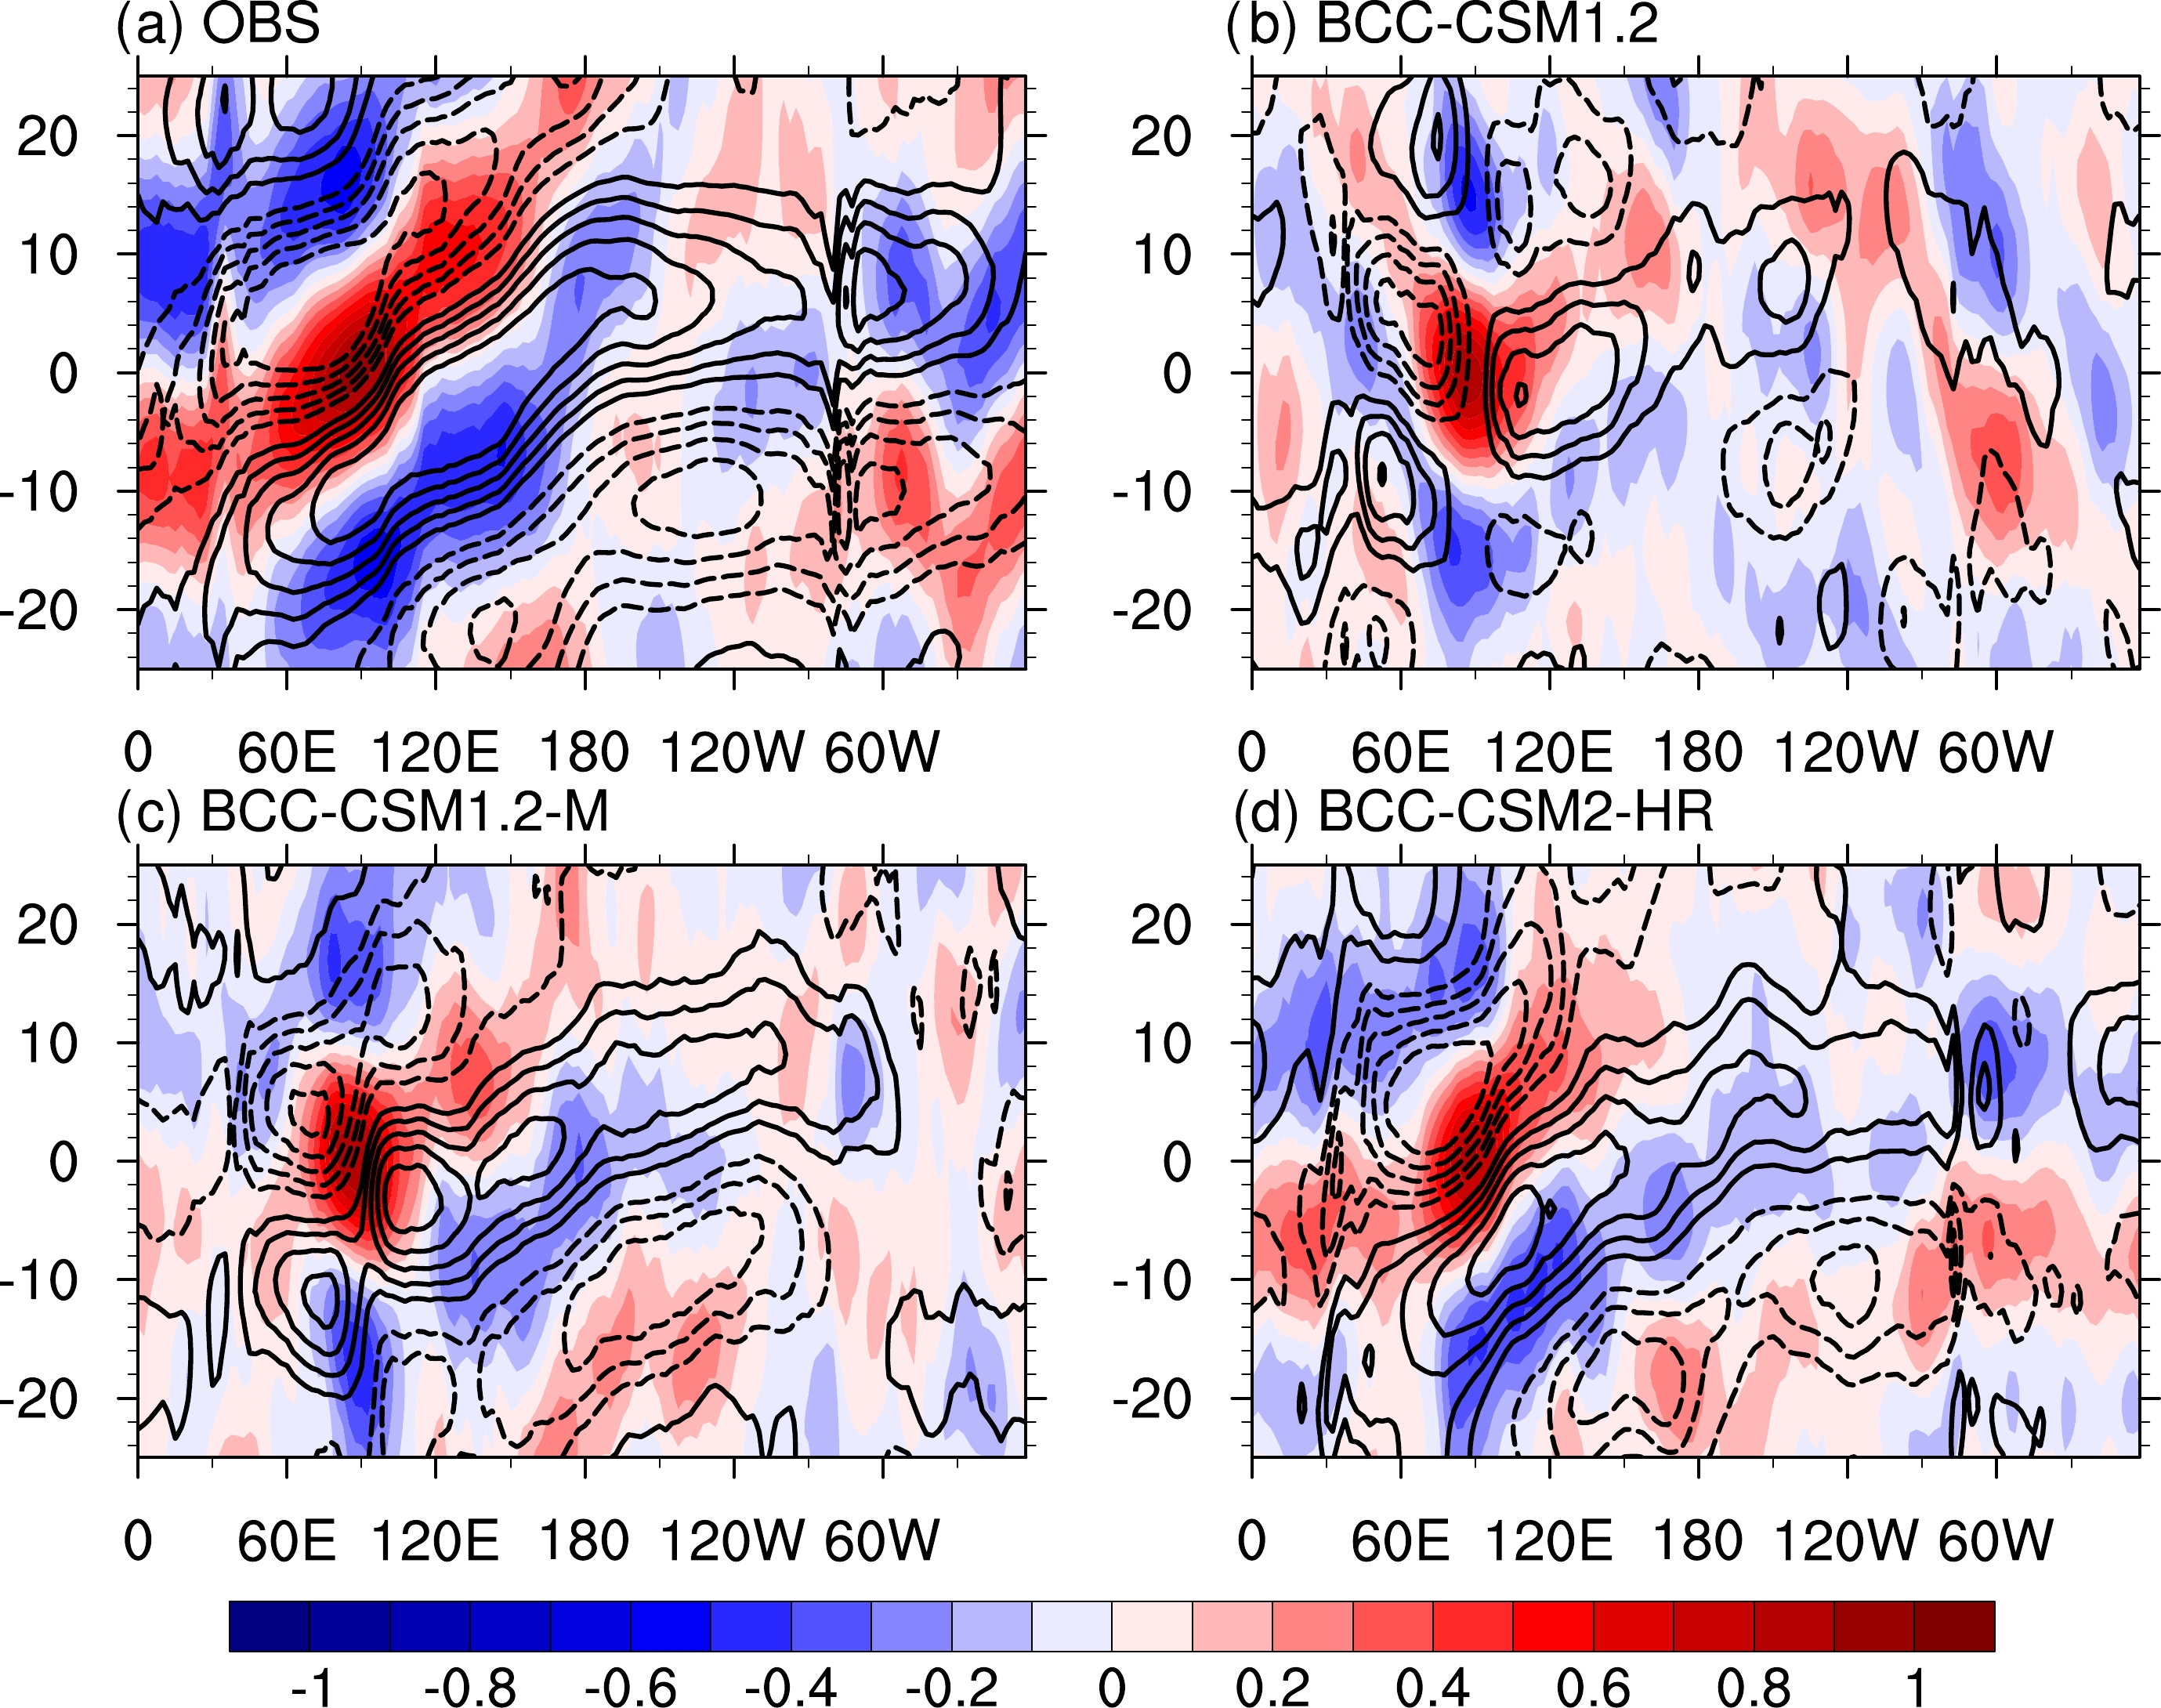
Figure 2 shows the lag correlation of tropical 20–100-day band pass filtered anomalies of OLR and 850-hPa zonal wind against the OLR over the Indian Ocean region (10°S–5°N, 75°–100°E) during the boreal winter. The feature of an eastward propagating MJO is clearly displayed in the observation (Fig. 2a). The positive correlation of OLR, representing enhanced convection, starts from the west Indian Ocean at lag day −15, then propagates into the Pacific Ocean in the next 40 days. There are westerlies (easterlies) at 850-hPa to the west (east) of enhanced convection, indicating the low-level convergence in the troposphere. This feature is well captured in BCC-CSM1.2-M and BCC-CSM2-HR but not in BCC-CSM1.2. The convection in BCC-CSM1.2 is of weaker intensity and has a faster propagation speed (Fig. 2b). Notably, the OLR correlation in BCC-CSM1.2 rapidly decreases when propagating into the MC region around 110°–125°E. This complicating phenomenon in MJO prediction is referred to as the MC barrier effect (Vitart et al., 2007, 2017; Seo and Wang, 2010; Wang et al., 2014; Kim et al., 2018). Although BCC-CSM1.2-M and BCC-CSM2-HR improve the strength, propagation speed, and OLR-wind relationship of the MJO compared with BCC-CSM1.2, the MC barrier effect still exists (Figs. 2c, d). Compared with BCC-CSM1.2-M, BCC-CSM2-HR further improves the MJO propagation over the western Indian Ocean to the MC region during lag days −10 to 10.
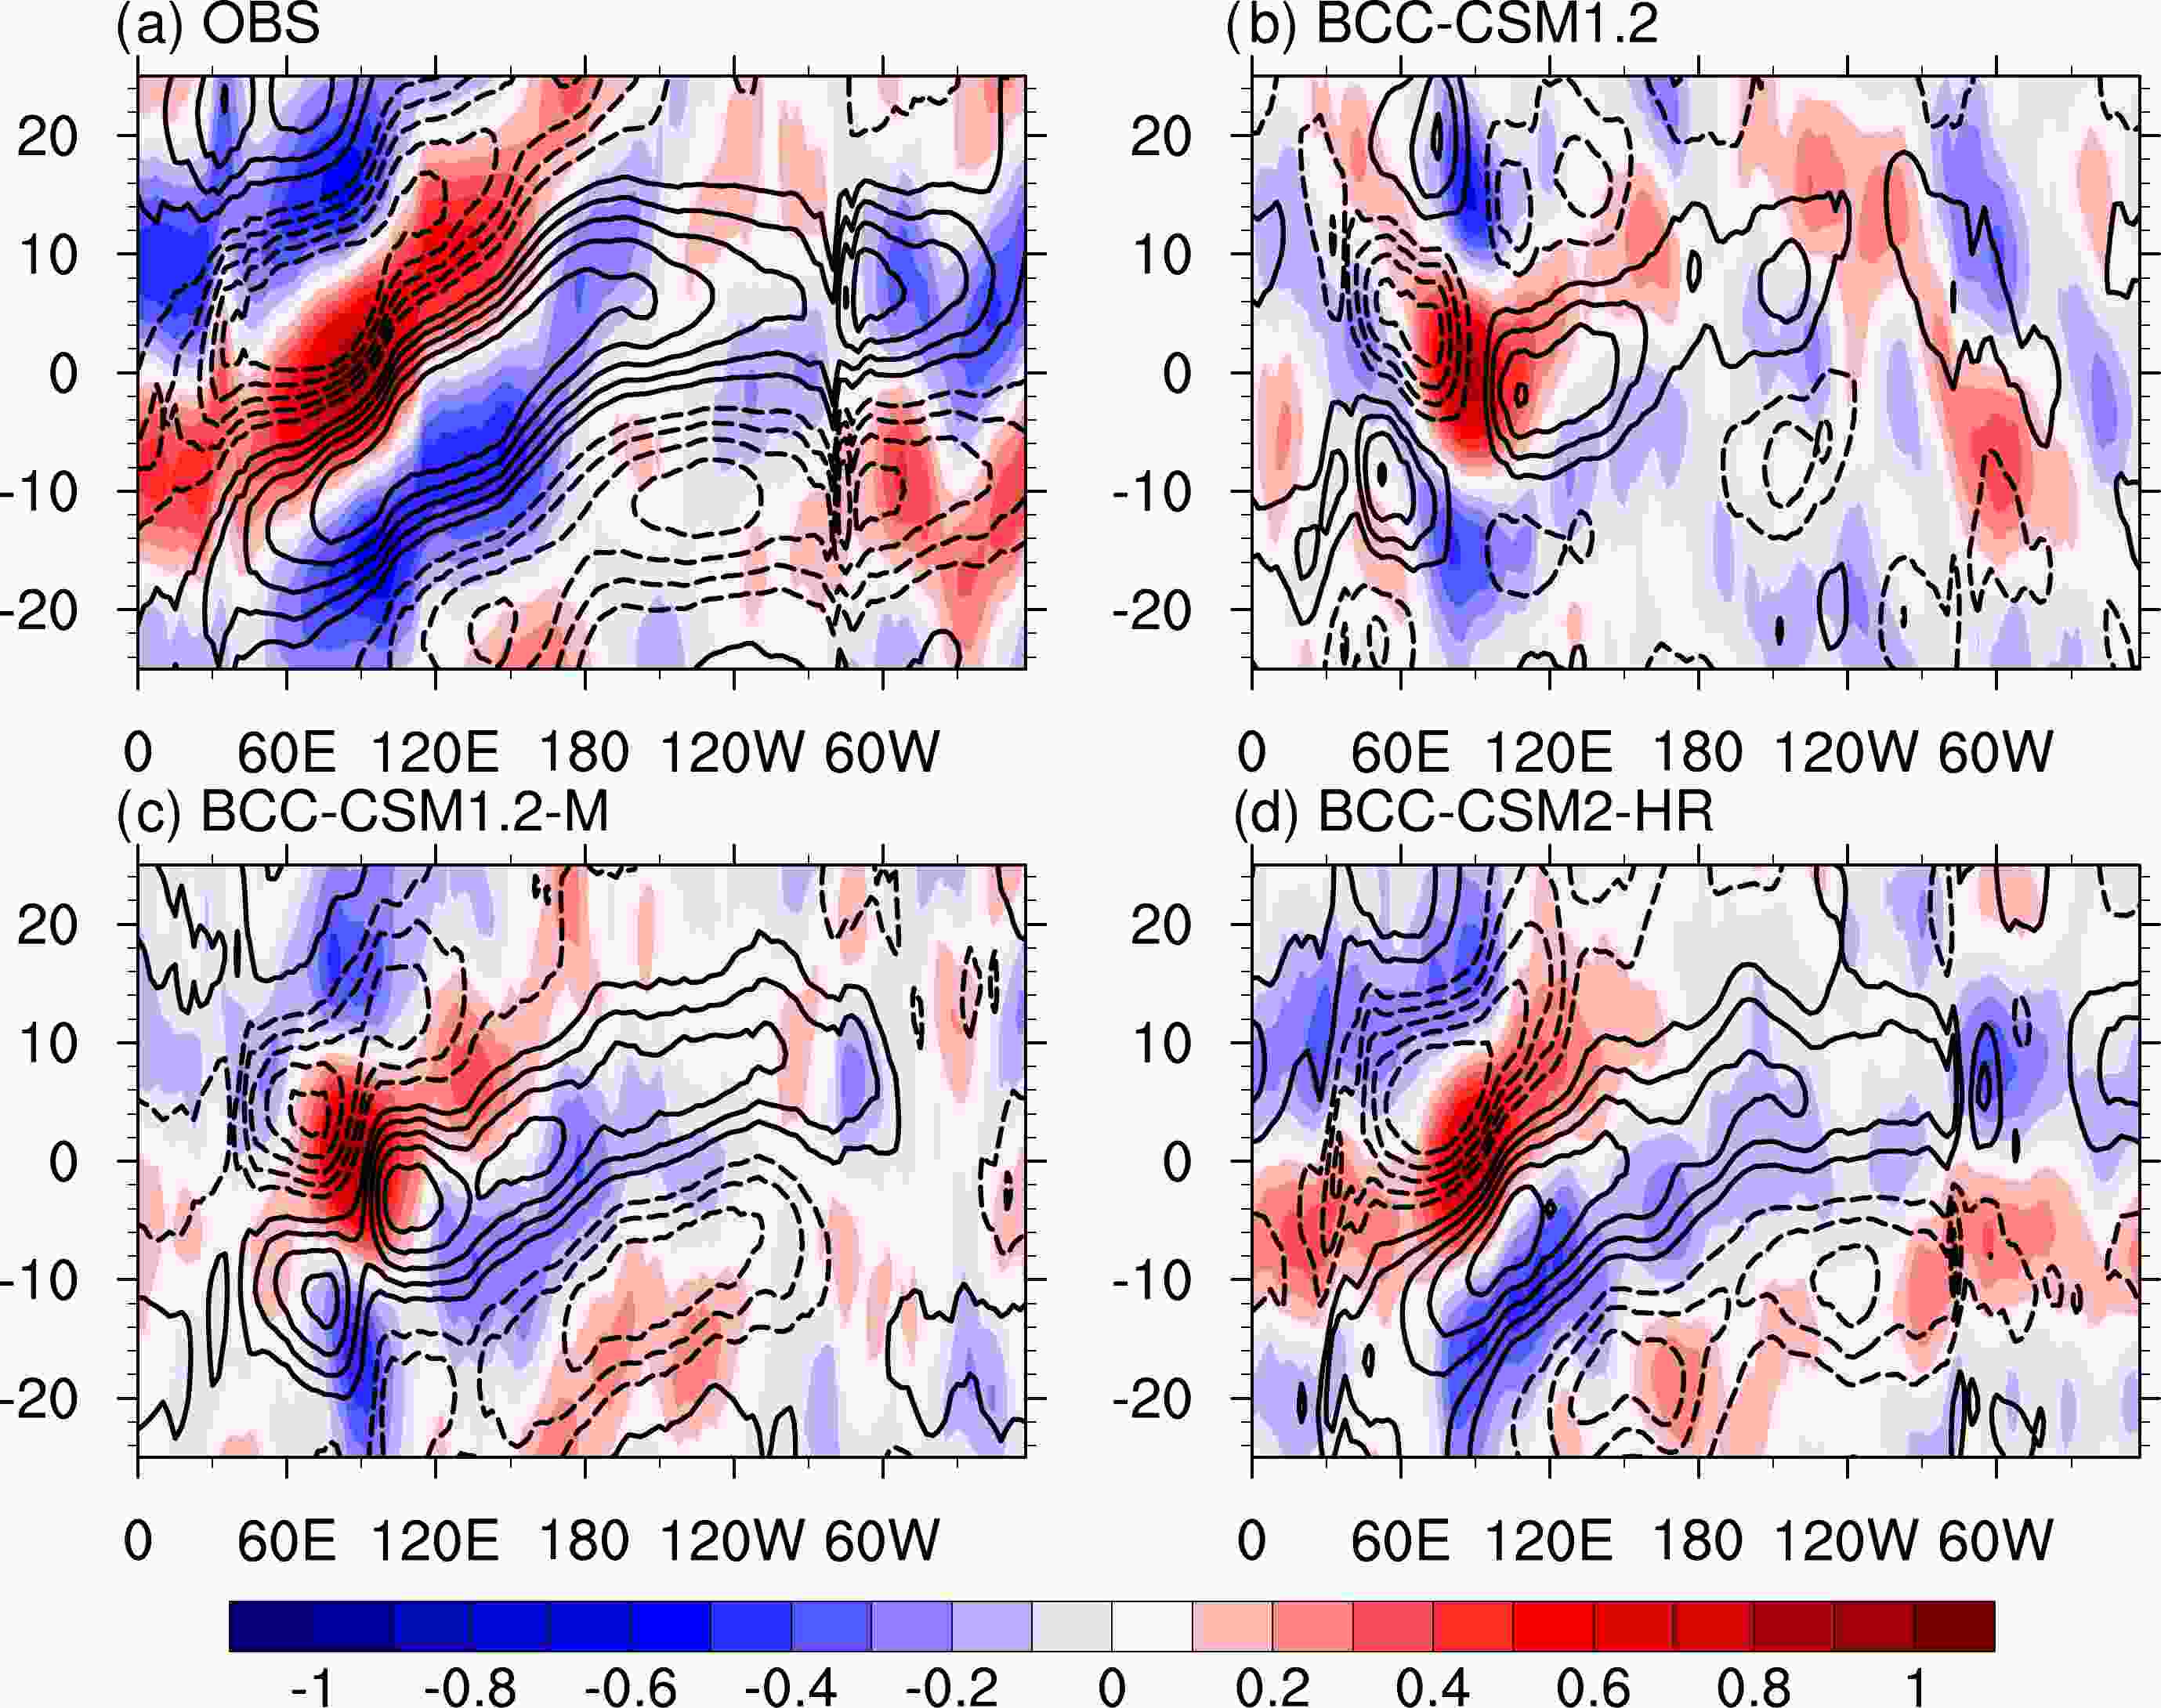
Figure 2. November–April longitude–time evolution of 20–100 day band pass filtered outgoing longwave radiation anomalies (shaded; units: W m−2), and 850-hPa zonal wind anomalies (contour; units: m s−1) averaged over 10°S–10°N correlated against the intraseasonal outgoing longwave radiation anomalies at the Indian Ocean region (10°S–5°N, 75°–100°E) in (a) observation, (b) BCC-CSM1.2, (c) BCC-CSM1.2-M, and (d) BCC-CSM2-HR.
Figure 3 illustrates the MJO life cycle by compositing the OLR and 850-hPa zonal wind anomalies at eight MJO phases. In the observation, the convection generates in Africa and the western Indian Ocean, then propagates eastward across the eastern Indian Ocean, into and through the MC then route to the western Pacific before finally decaying around 180° (Fig. 3a). All models generally reproduce the life cycle of MJO propagation, but with different deficiencies. Compared with the observation, the BCC-CSM1.2 exhibits a weaker intensity and wider spatial range of convection anomaly when the MJO propagates from the Indian Ocean to the Pacific, displaying a fragmentized MJO structure (Fig. 3b). The BCC-CSM1.2-M reduces the biases in the spatial distribution of convection, but still with a weaker-than-observed convection intensity (Fig. 3c). Obviously, the BCC-CSM2-HR shows superiorities in simulating MJO spatial structure and propagation (Fig. 3d). Particularly, it shows convection intensity that is comparable observations and exhibits a more realistic transition of convection between dry and wet phase. Meanwhile, the convection intensity in BCC-CSM1.2 and BCC-CSM1.2-M is nearly half that in BCC-CSM2-HR, which supports the premise that the simulation of MJO climatology is gradually improved by upgrading the model version, and the newly-developed BCC-CSM2-HR outperforms its predecessors.

Figure 3. November–April composite intraseasonal anomalies of outgoing longwave radiation (shaded; units: W m−2) and 850-hPa zonal wind (contour; units: m s−1) in eight MJO phases from (a) observation, (b) BCC-CSM1.2, (c) BCC-CSM1.2-M, and (d) BCC-CSM2-HR. The ranges of the color bars from BCC-CSM-1.2 and BCC-CSM1.2-M are half of those from the observation and BCC-CSM2-HR. The number at the bottom right of each panel denotes the phase and the number of days used to generate the composite for each MJO phase.
The improvements in the MJO simulation from BCC-CSM1.2 and BCC-CSM1.2-M to BCC-CSM2-HR may be largely attributed to the upgrades of the atmospheric component. As illustrated by Wu et al. (2021), compared with its previous versions, BCC-CSM2-HR increases the horizontal resolution, vertical resolution, and the top pressure level of the atmospheric component and also improves the physical schemes, including those of deep cumulus convection, the shallow and middle tropospheric moist convection, and cloud microphysics; thus, helping to improve the simulation of tropical convection and leading to a better representation of the MJO in the model.
-
In this section, we examined the MJO forecast skills by three sets of hindcast experiments (i.e., EXP1, EXP1-M, and EXP2) using the aforementioned different model versions.
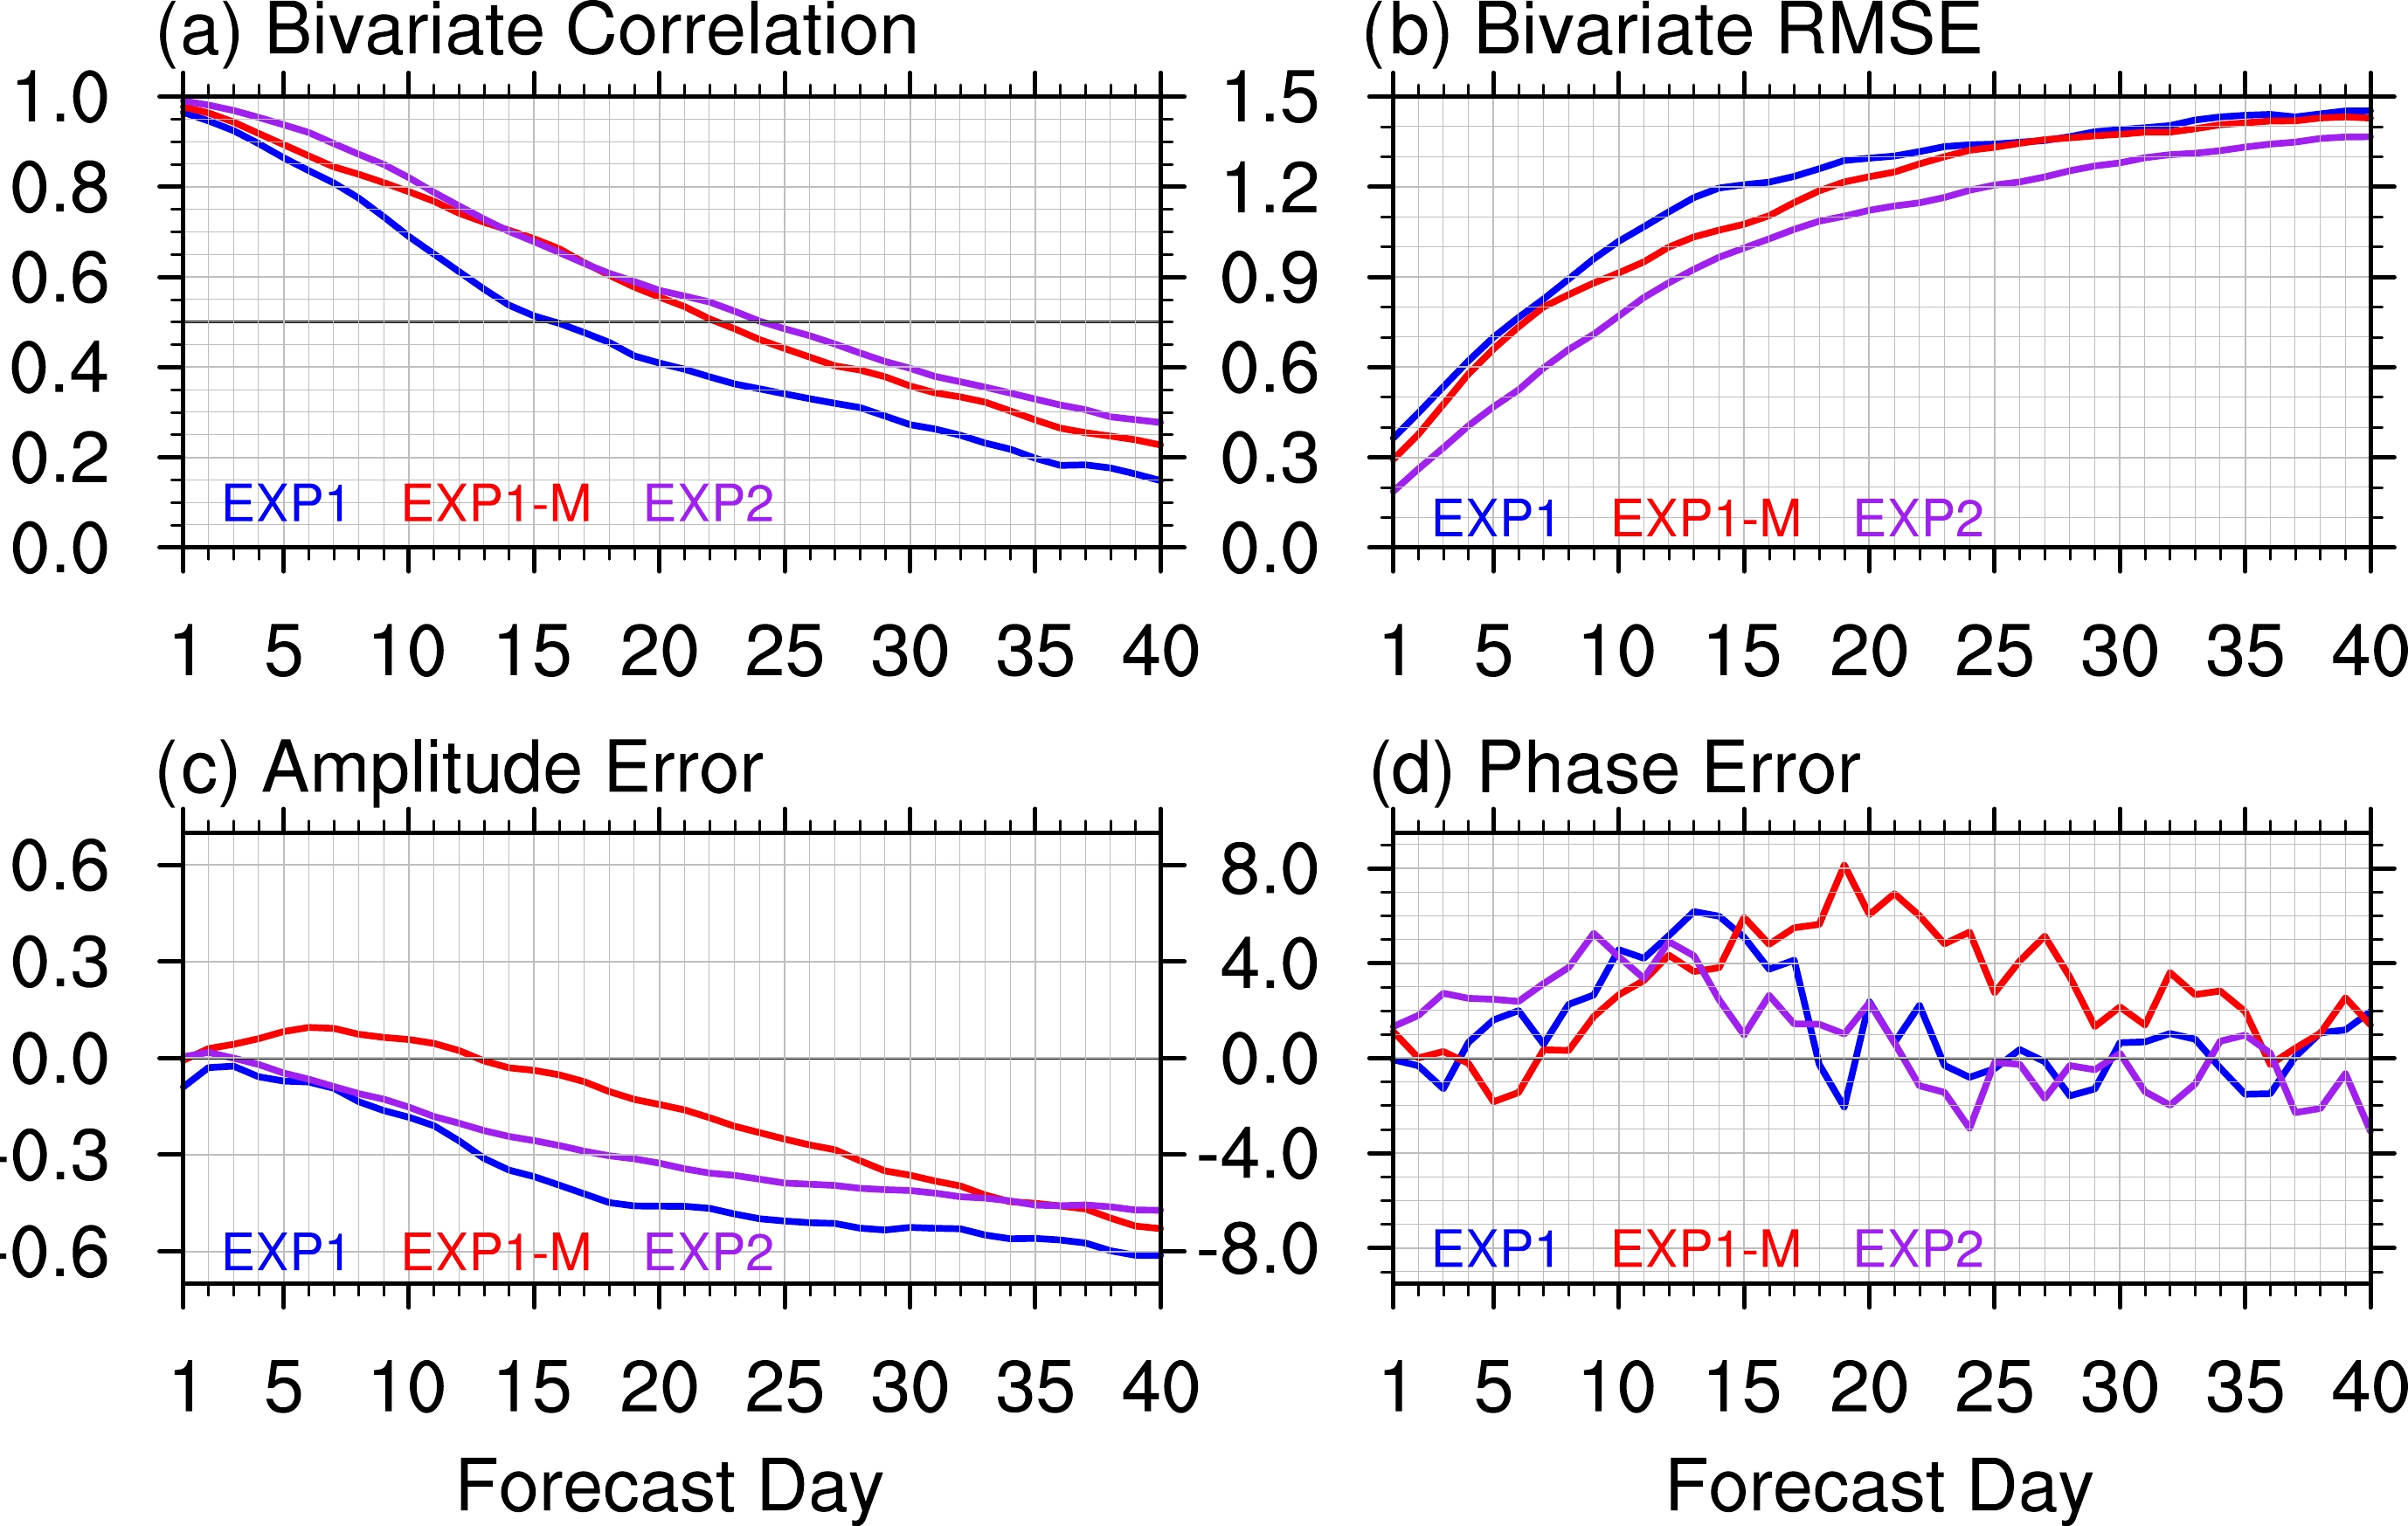
The bivariate correlation, bivariate RMSE, amplitude error, and phase speed error of the RMM index were calculated on each forecast day (Fig. 4). The bivariate correlation from EXP1, EXP1-M, and EXP2 reaches 0.5 on forecast days 15, 22, and 24, respectively (Fig. 4a). As reported by Liu et al. (2019), the 7-day incremental improvement of useful prediction skill from EXP1 to EXP1-M is contributed mainly by upgrading initial conditions (about 6 days) and to a lesser extent by optimizing parameterization schemes (about 1 day). The further increase of two days from EXP1-M to EXP2 may be the combined results of both new initial conditions and the upgraded model version. In terms of RMSE, EXP1 shows the largest error among all experiments, and EXP1-M reduced the error mainly during forecast weeks 2–3 (Fig. 4b). Notably, EXP2 exhibits the lowest error compared with other experiments during all forecast times.
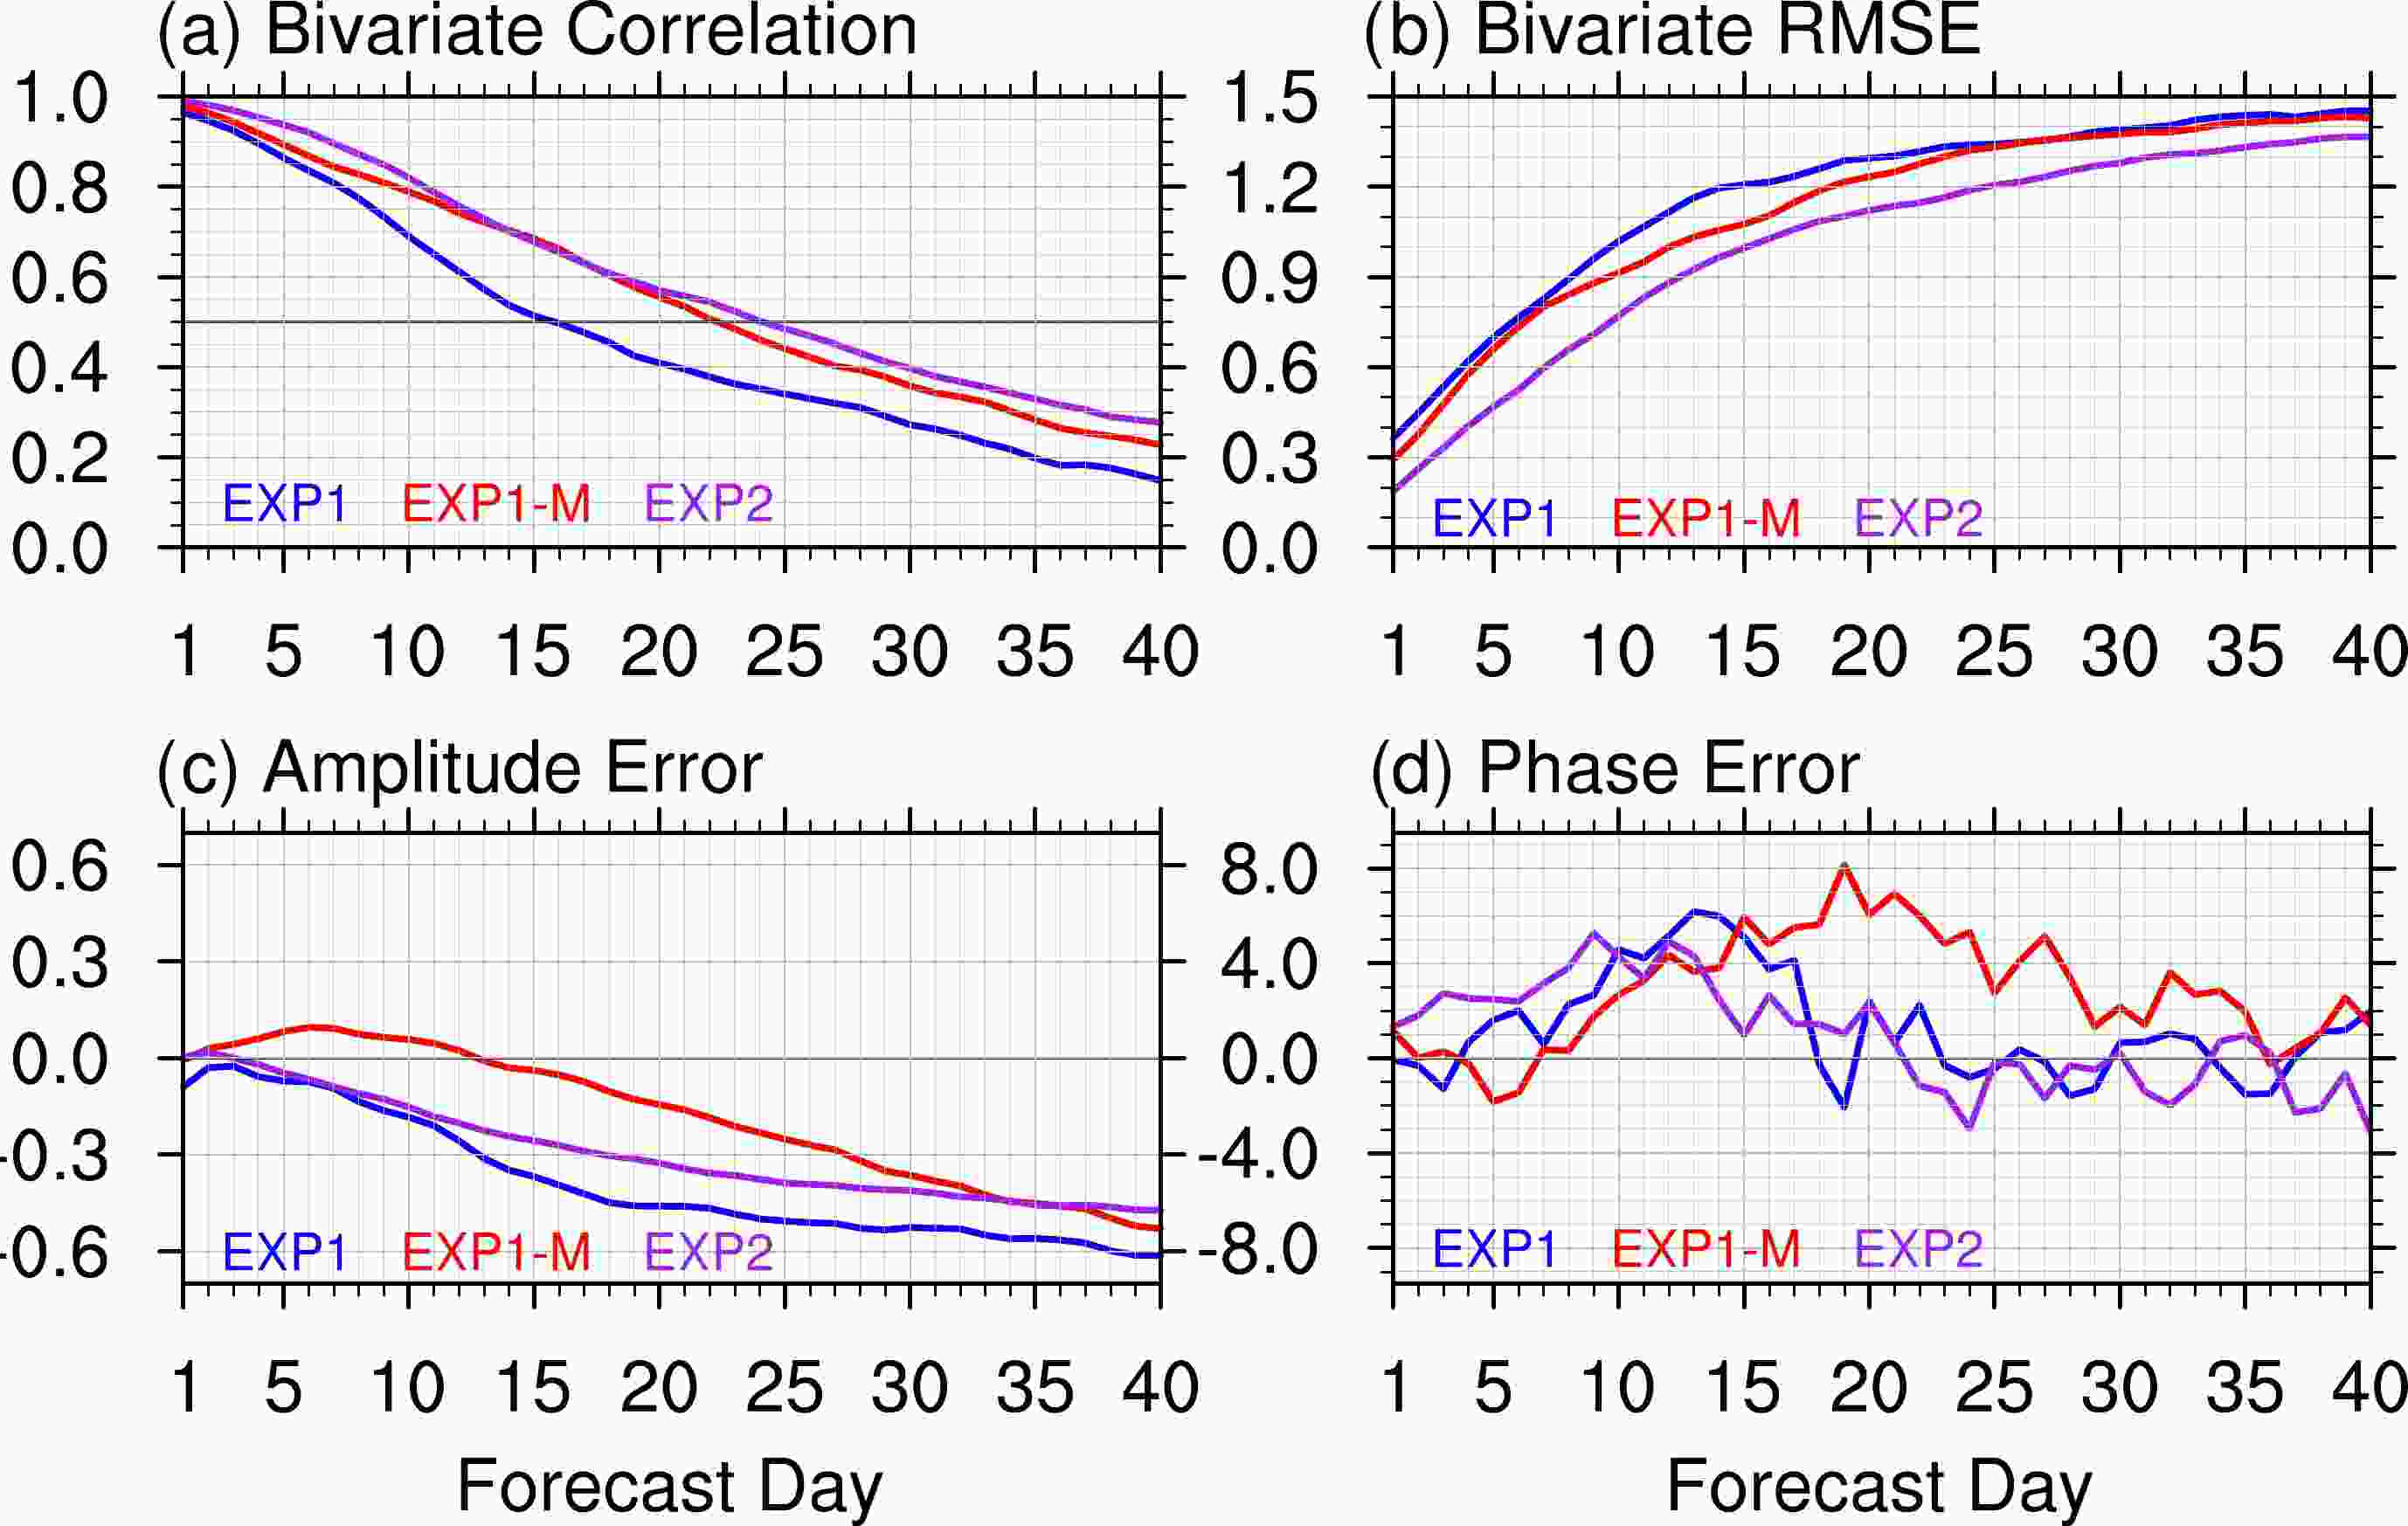
Figure 4. Evolution of the MJO (a) bivariate correlation, (b) bivariate root-mean-square-error, (c) amplitude error, and (d) phase error as a function of forecast lead time for hindcast experiments of EXP1 (blue), EXP1-M (red), and EXP2 (purple).
With the increase of the forecast time, EXP1 and EXP2 tend to damp the MJO intensity, represented by the negative amplitude error since the beginning of the forecast (Fig. 4c). In contrast, EXP1-M enhances the MJO intensity before the forecast week 2, but damps it after that. In terms of the phase error, the MJO propagation speed is obviously overestimated in the first two forecast weeks in EXP1 and EXP2, but the overestimation persists for about 5 forecast weeks in EXP1-M (Fig. 4d). This means that EXP1-M has a lower error in MJO amplitude, but a larger error in the MJO phase evolution, implying the uncertainty of modifying parametrization schemes. Sometimes the improvement in one aspect of the MJO prediction may be at the cost of degradation in others.
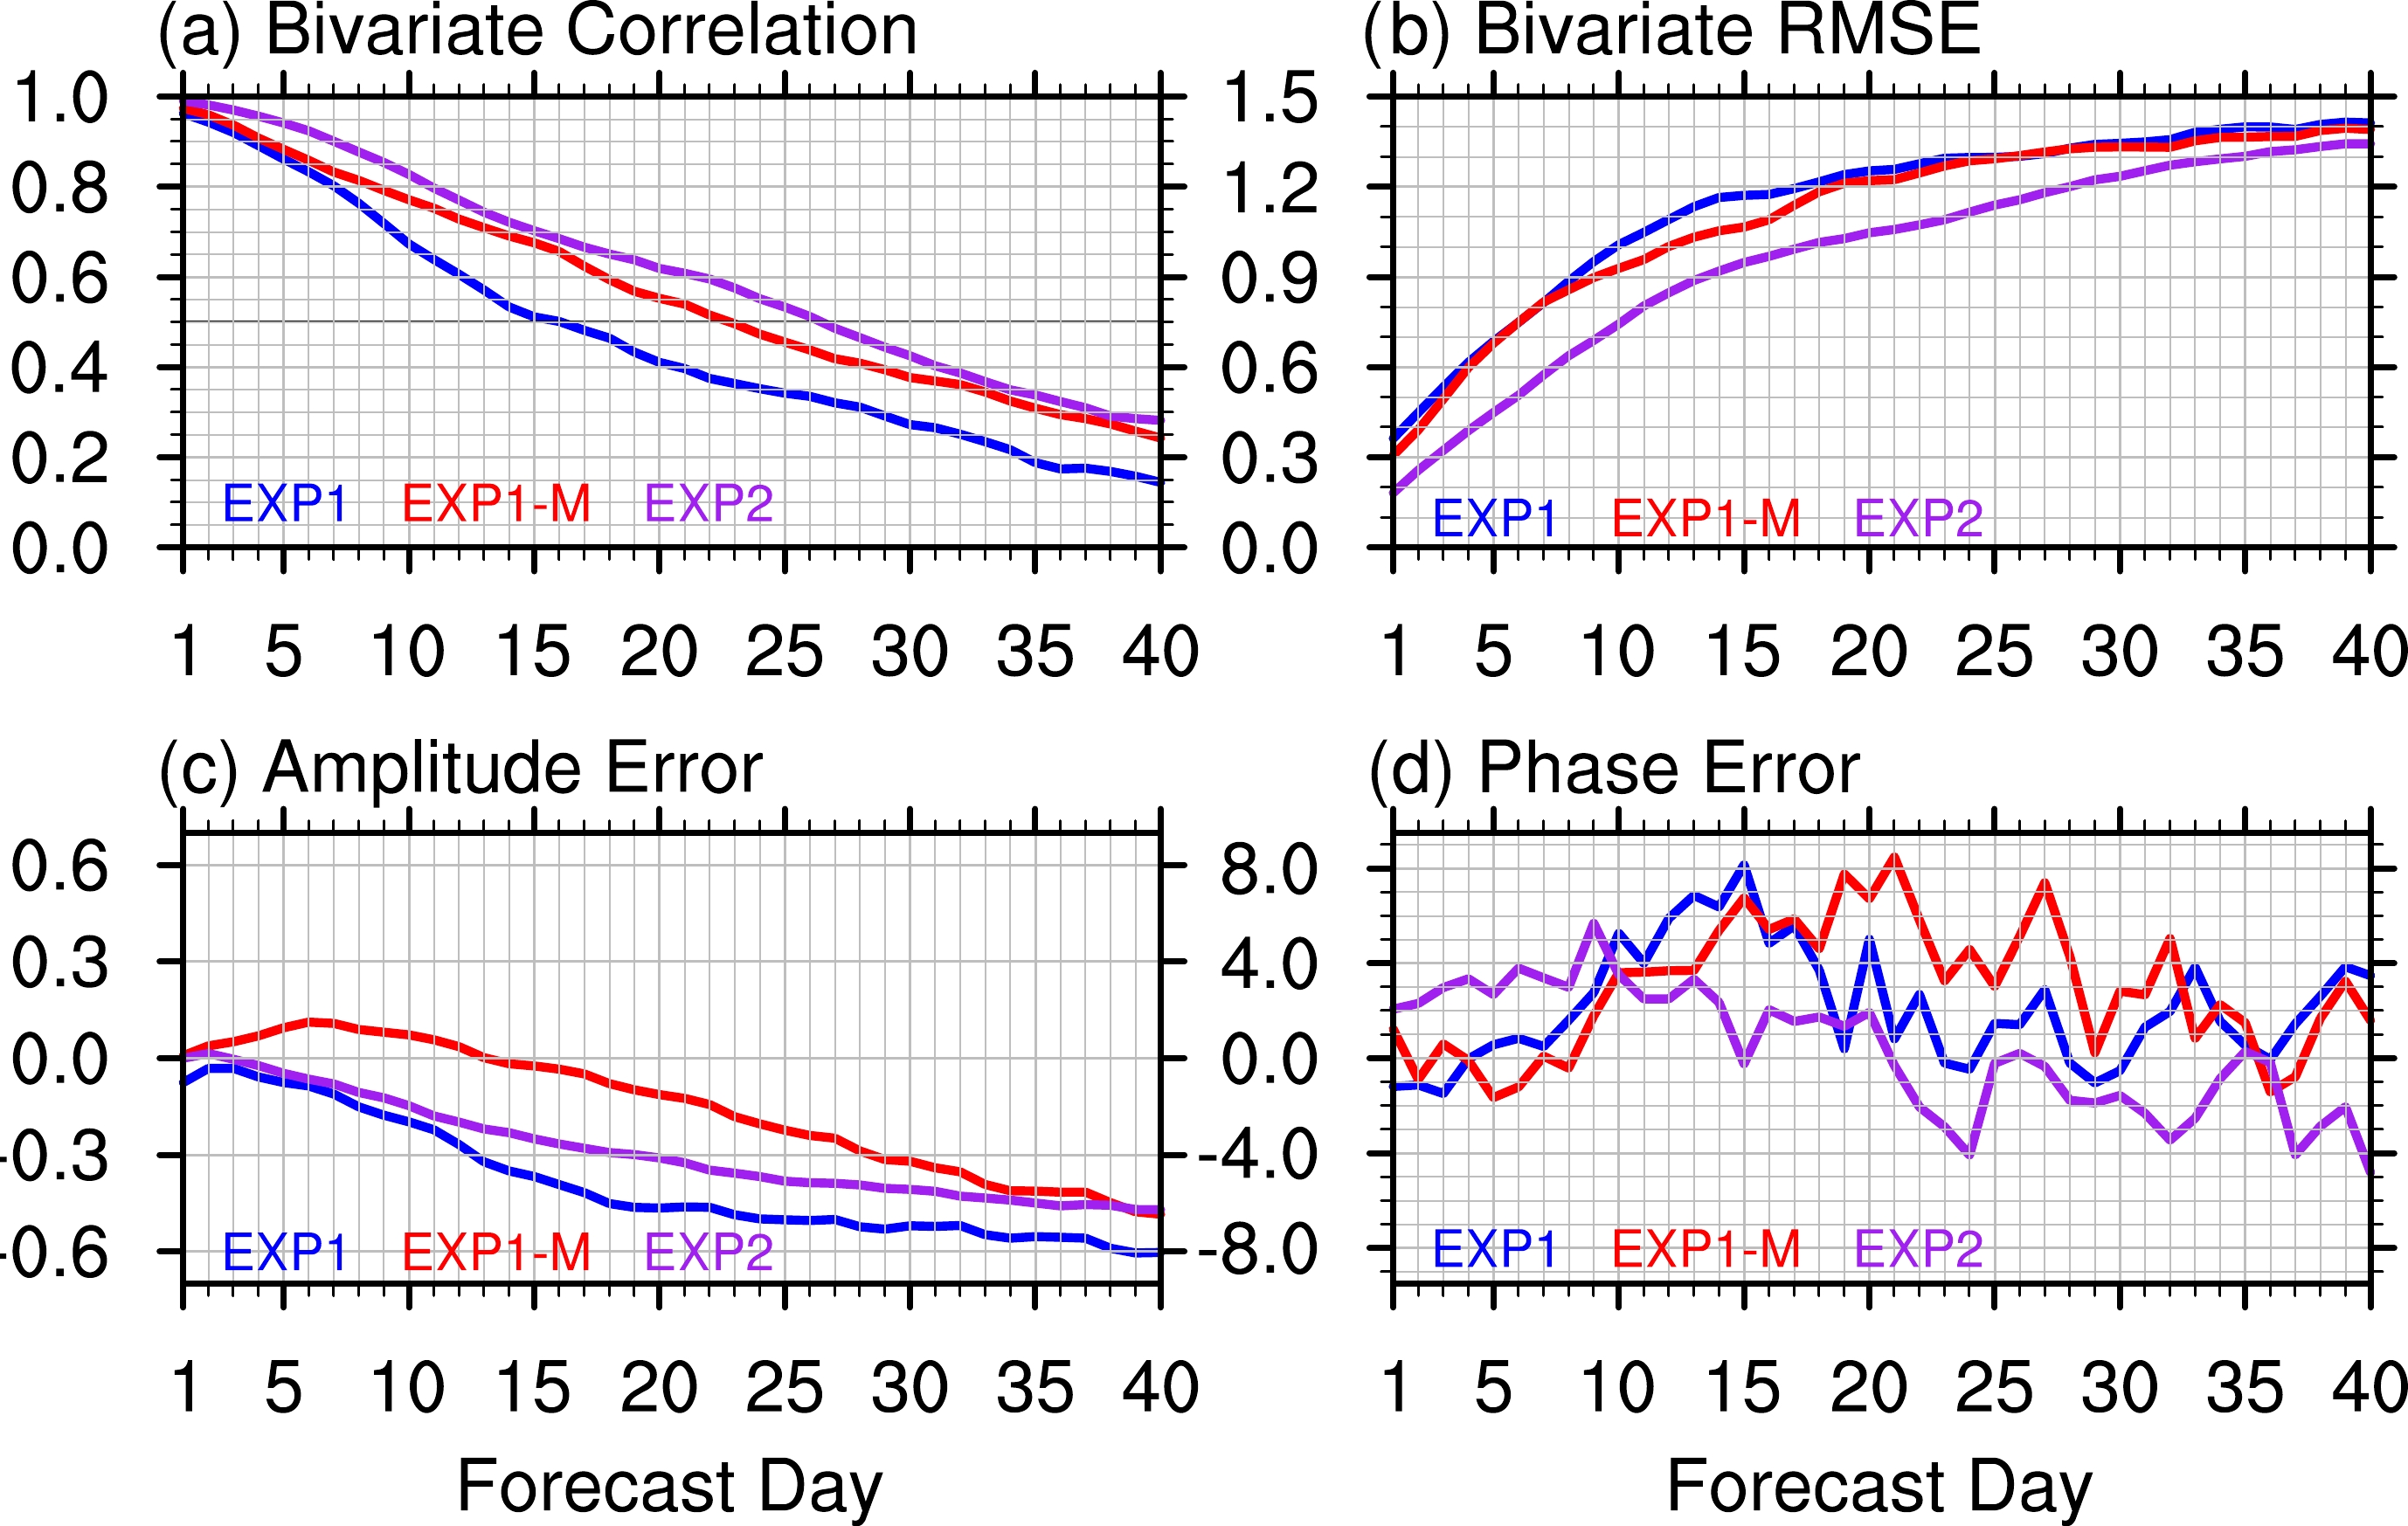
Given that the difference in the hindcast period of the three experiments may affect the robustness of the above conclusions, Fig. 5 further shows the skills of the three hindcast experiments during the common hindcast period of 2005–13. It indicates that the useful prediction skills of the three hindcast experiments are nearly the same as Fig. 4, and EXP2 still has the highest correlation and lowest error compared with other experiments (Figs. 5a, b). The features of MJO amplitude error and phase error from three hindcast experiments are also consistent with the results shown in Fig. 4. This further demonstrates the gradual improvements of MJO prediction from EXP1 to EXP1-M, further extending to EXP2.

Figure 5. Same as in Fig.4, but based on the experiments in the common hindcast period during 2005–13.
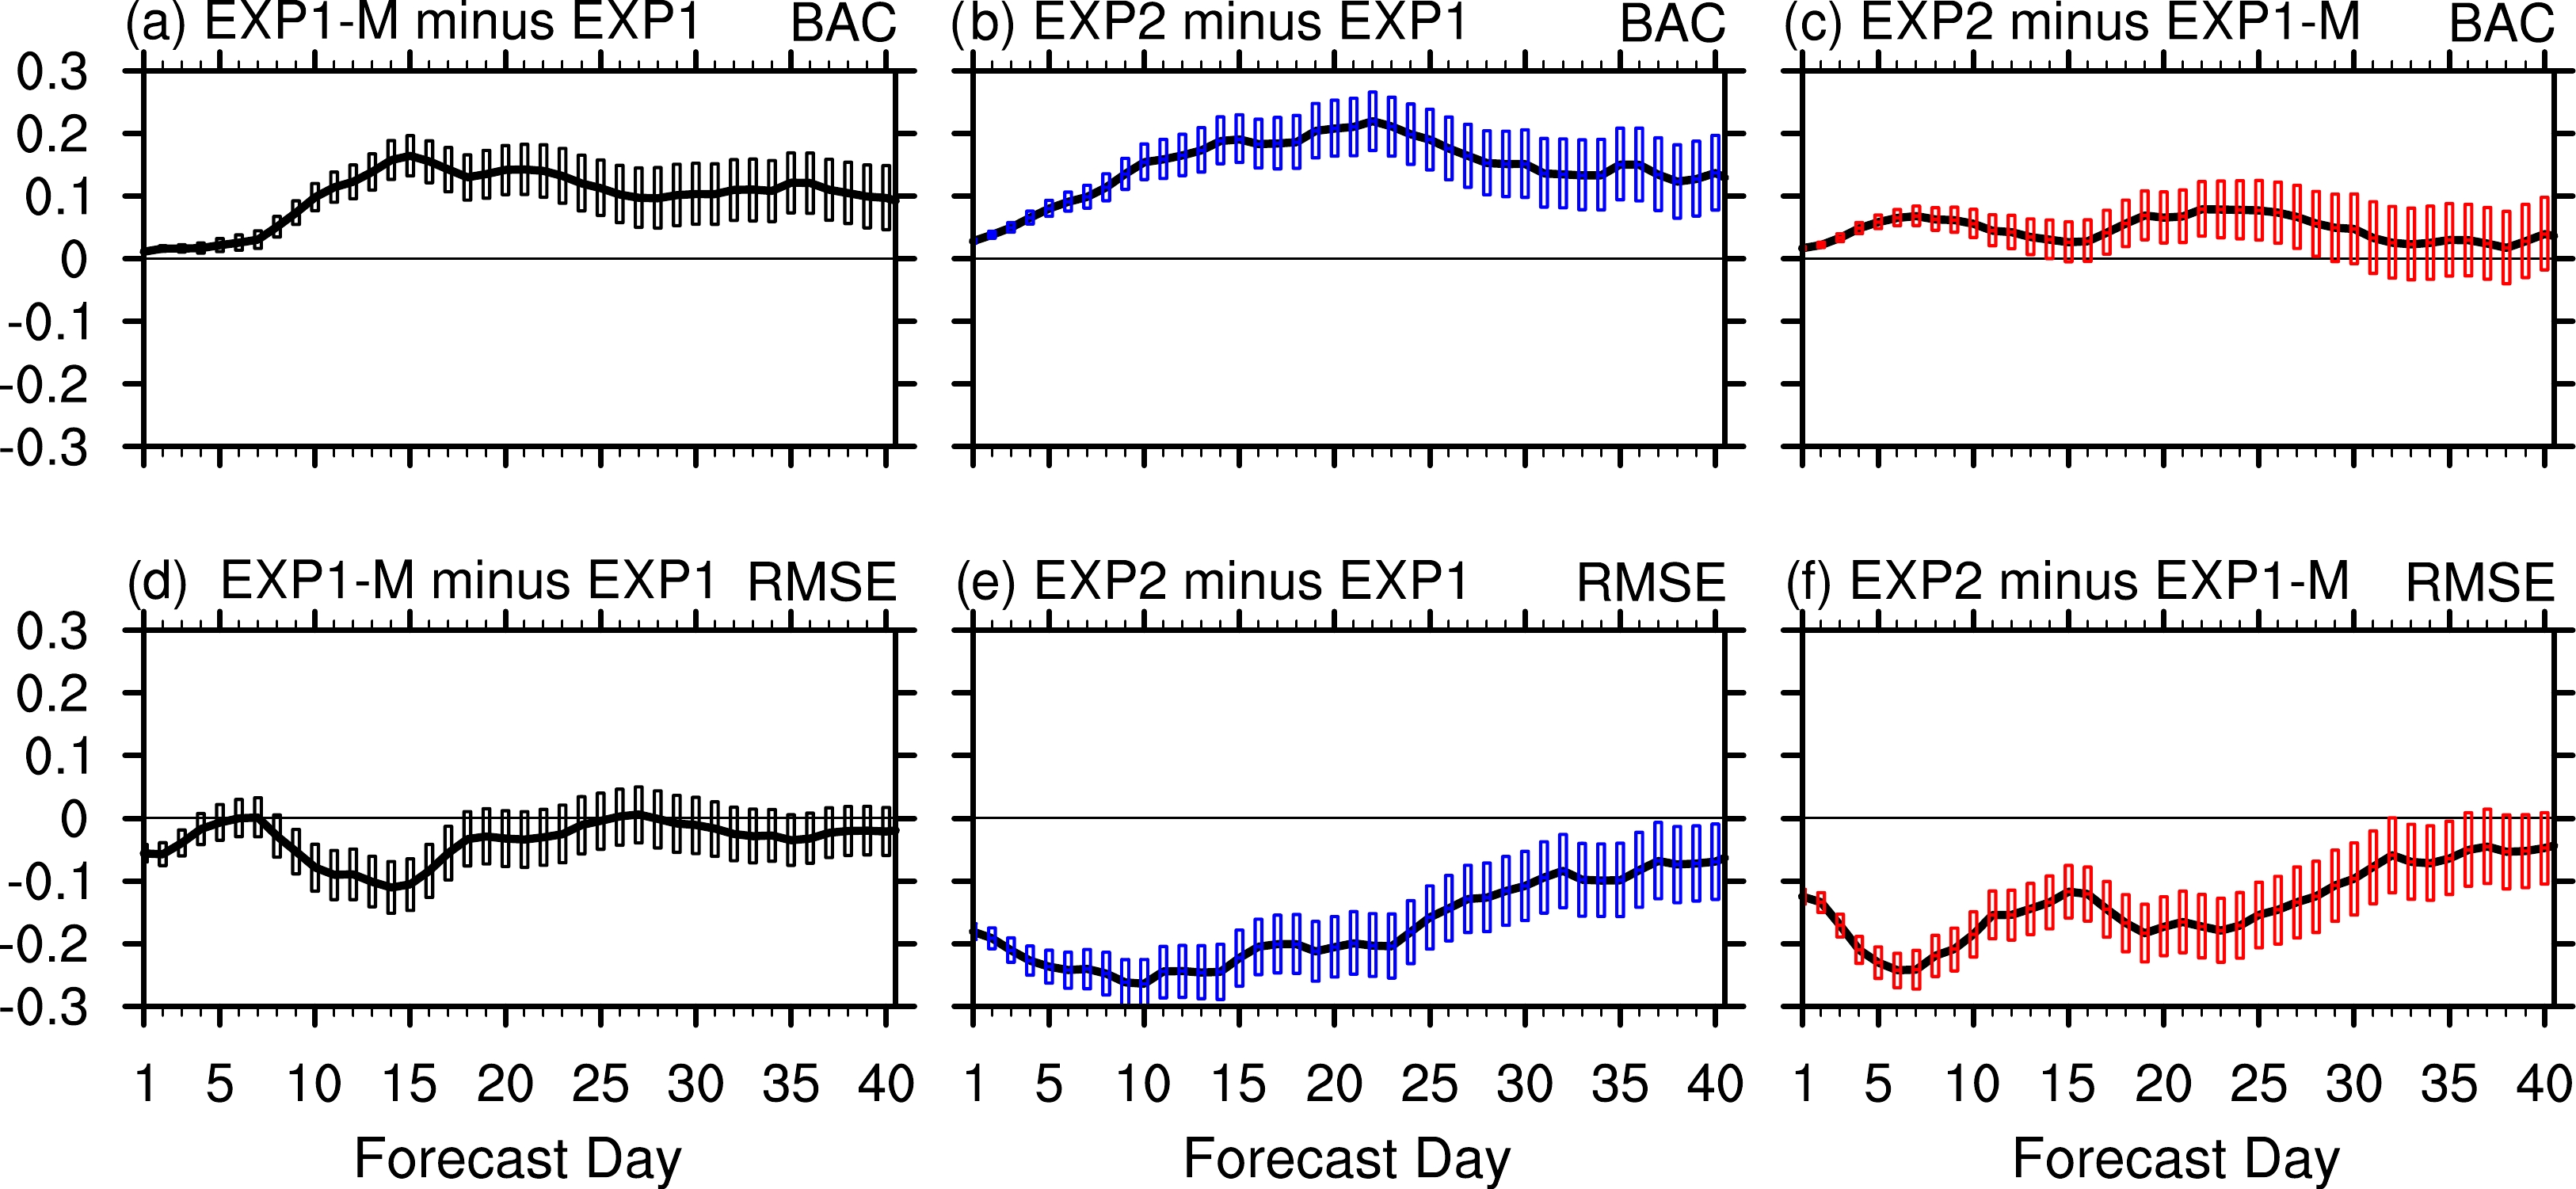
To investigate the statistical significance of the differences between the three hindcast experiments, we applied a bootstrap significance test. The forecast skill differences between experiments are computed from a bootstrap resampling procedure with 10 000 iterations. As shown in Fig. 6, EXP1-M significantly improved the MJO prediction compared with EXP1 during forecast weeks 2–3. For EXP1-M, the bivariate correlation increased, and the bivariate RMSE decreased compared with EXP1 (Figs. 6a and d). These metrics reached their extremum around forecast week 2 before significance was reduced around forecast week 3. This indicates that the positive effect of optimizing the initial condition and physical parameters in EXP1-M mainly occurs within three forecast weeks. EXP2 further improves the MJO prediction and is thus superior to other hindcast experiments (Figs. 6b, e). Interestingly, the enhanced bivariate correlation coefficient and reduced RMSE in EXP2, relative to EXP1-M, is especially significant in the first forecast week (Figs. 6c, f). Such improvements within the first forecast week usually relate to the initial conditions. Thus, the improvements of EXP2 relative to EXP1-M at short forecast times may be mainly attributed to the upgraded initial conditions provided by the coupled data assimilation system.

Figure 6. Evolution of the differences (left column) between EXP1-M and EXP1, (central column) between EXP2 and EXP1, and (right column) between EXP2 and EXP1-M as a function of forecast lead time. (a)–(c) Bivariate correlation and (d)–(f) bivariate root-mean-square-error of RMM index. The vertical bars represent significance at the 95% confidence level, as computed from a bootstrap resampling procedure with 10 000 iterations.
To test whether the skill differences are significant during the common hindcast period, the bootstrap differences for the hindcasts during 2005–13 are further given in Fig. 7. The statistical significance of the skill differences among the three hindcast experiments is still maintained. The skill enhancements from EXP1 to EXP1-M are still clear during forecast weeks 2–3. The overall improvements from EXP1-M to EXP2 are also observed at most of the forecast time. This further confirms the superiorities of EXP2 in MJO prediction.

Figure 7. Same as in Fig. 6, but based on the experiments in the common hindcast period, during 2005–13.
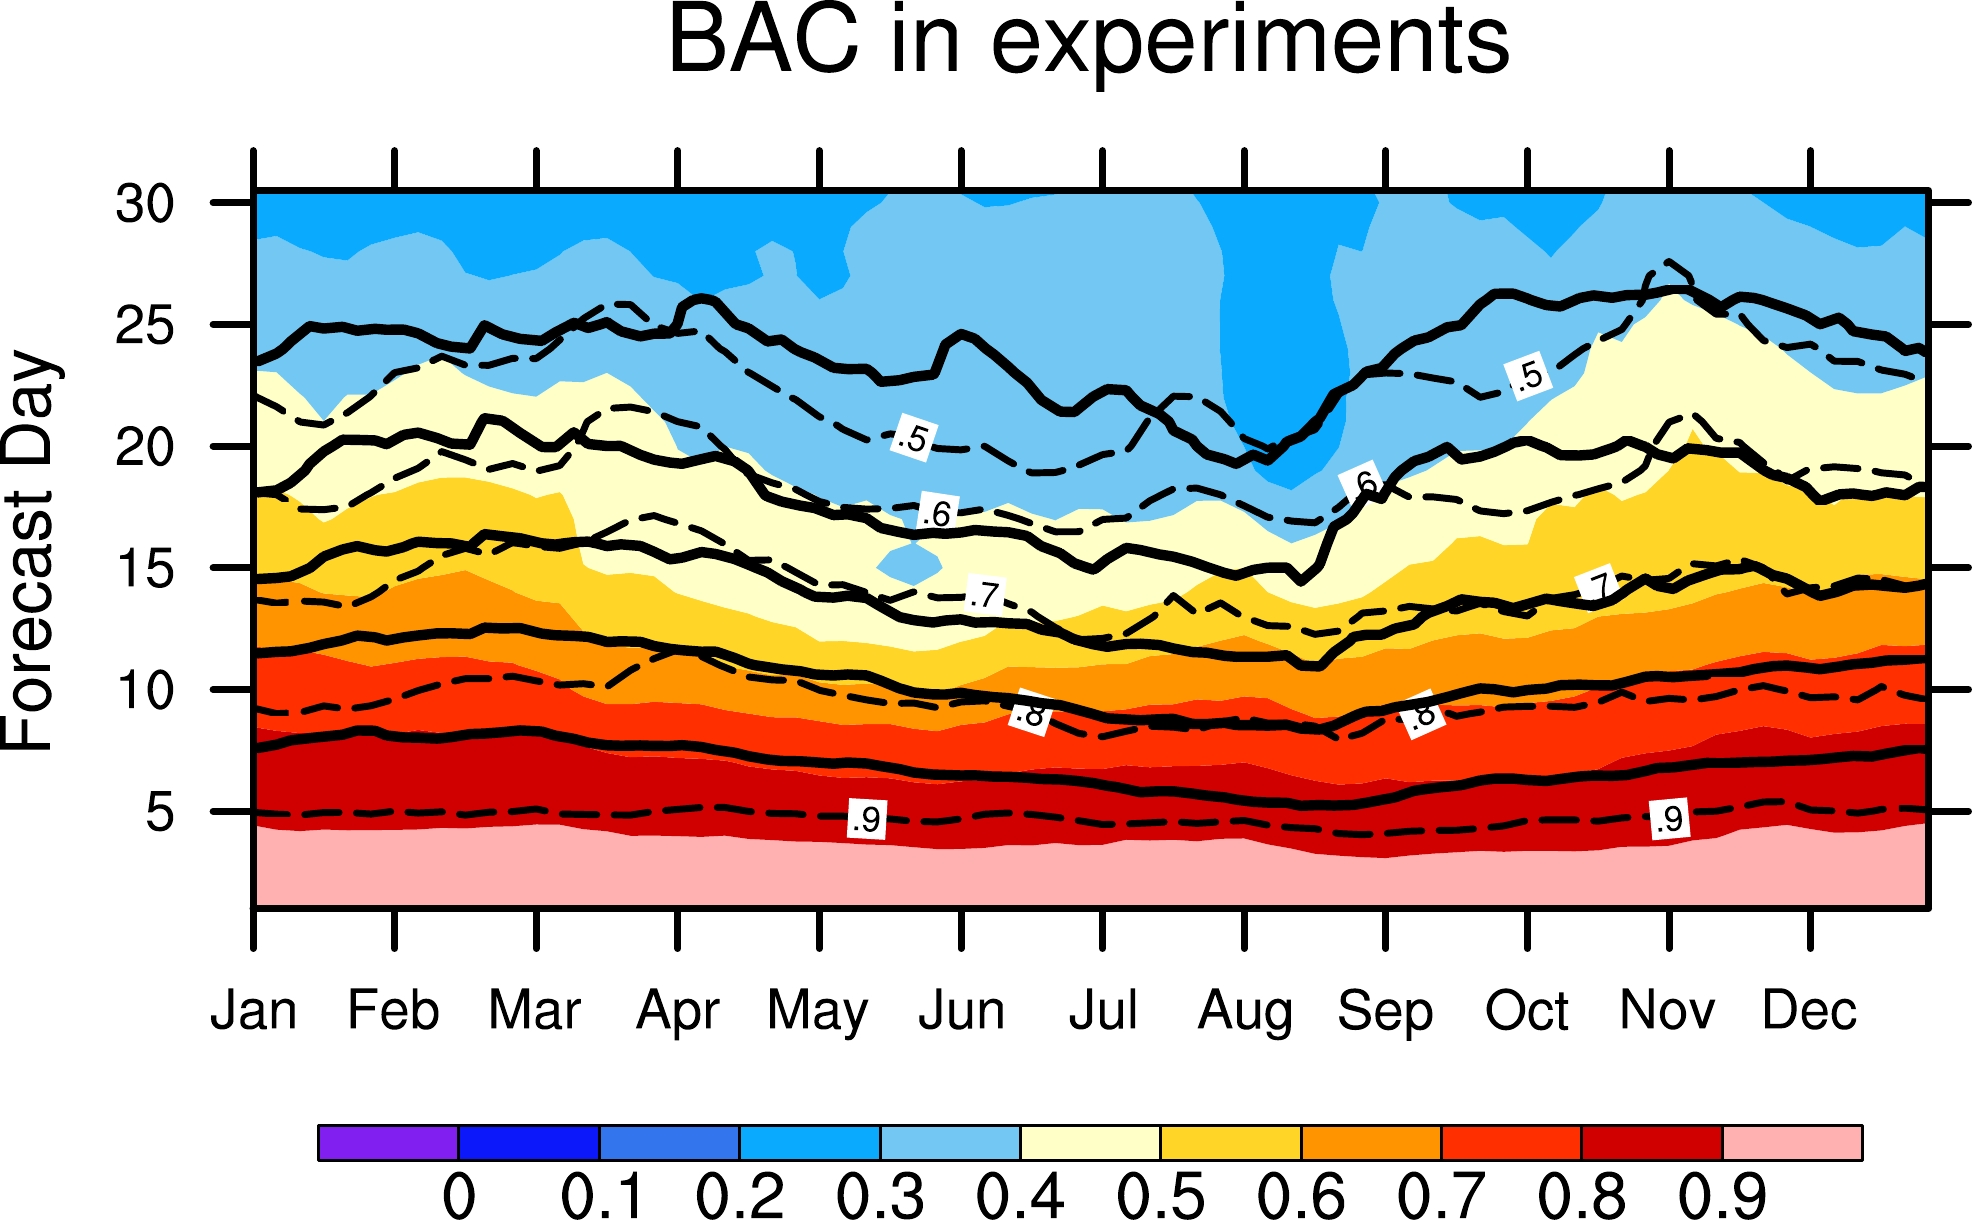
Given that the predictability of MJO varies with the season, Fig. 8 illustrates the seasonal variations of MJO prediction skills in various hindcast experiments. In EXP1, the useful prediction skill of MJO peaks in the boreal winter (approximately 17 days) and reaches its minimum in the boreal summer (approximately 13 days). MJO prediction is significantly improved in EXP1-M, with a useful skill of about 20 days from May to October and around 24 days from November to April. In EXP2, the prediction skill is further enhanced. The useful skill in EXP2 increases by 1 or 2 days in nearly all months compared with EXP1-M. We notice that the bivariate correlation coefficient reaches 0.9 at the forecast time of 8 days in EXP2, which is significantly higher than the 5 forecast days in EXP1-M. This, to some extent, indicates the superiority of the new initial conditions provided by the coupled data assimilation system.
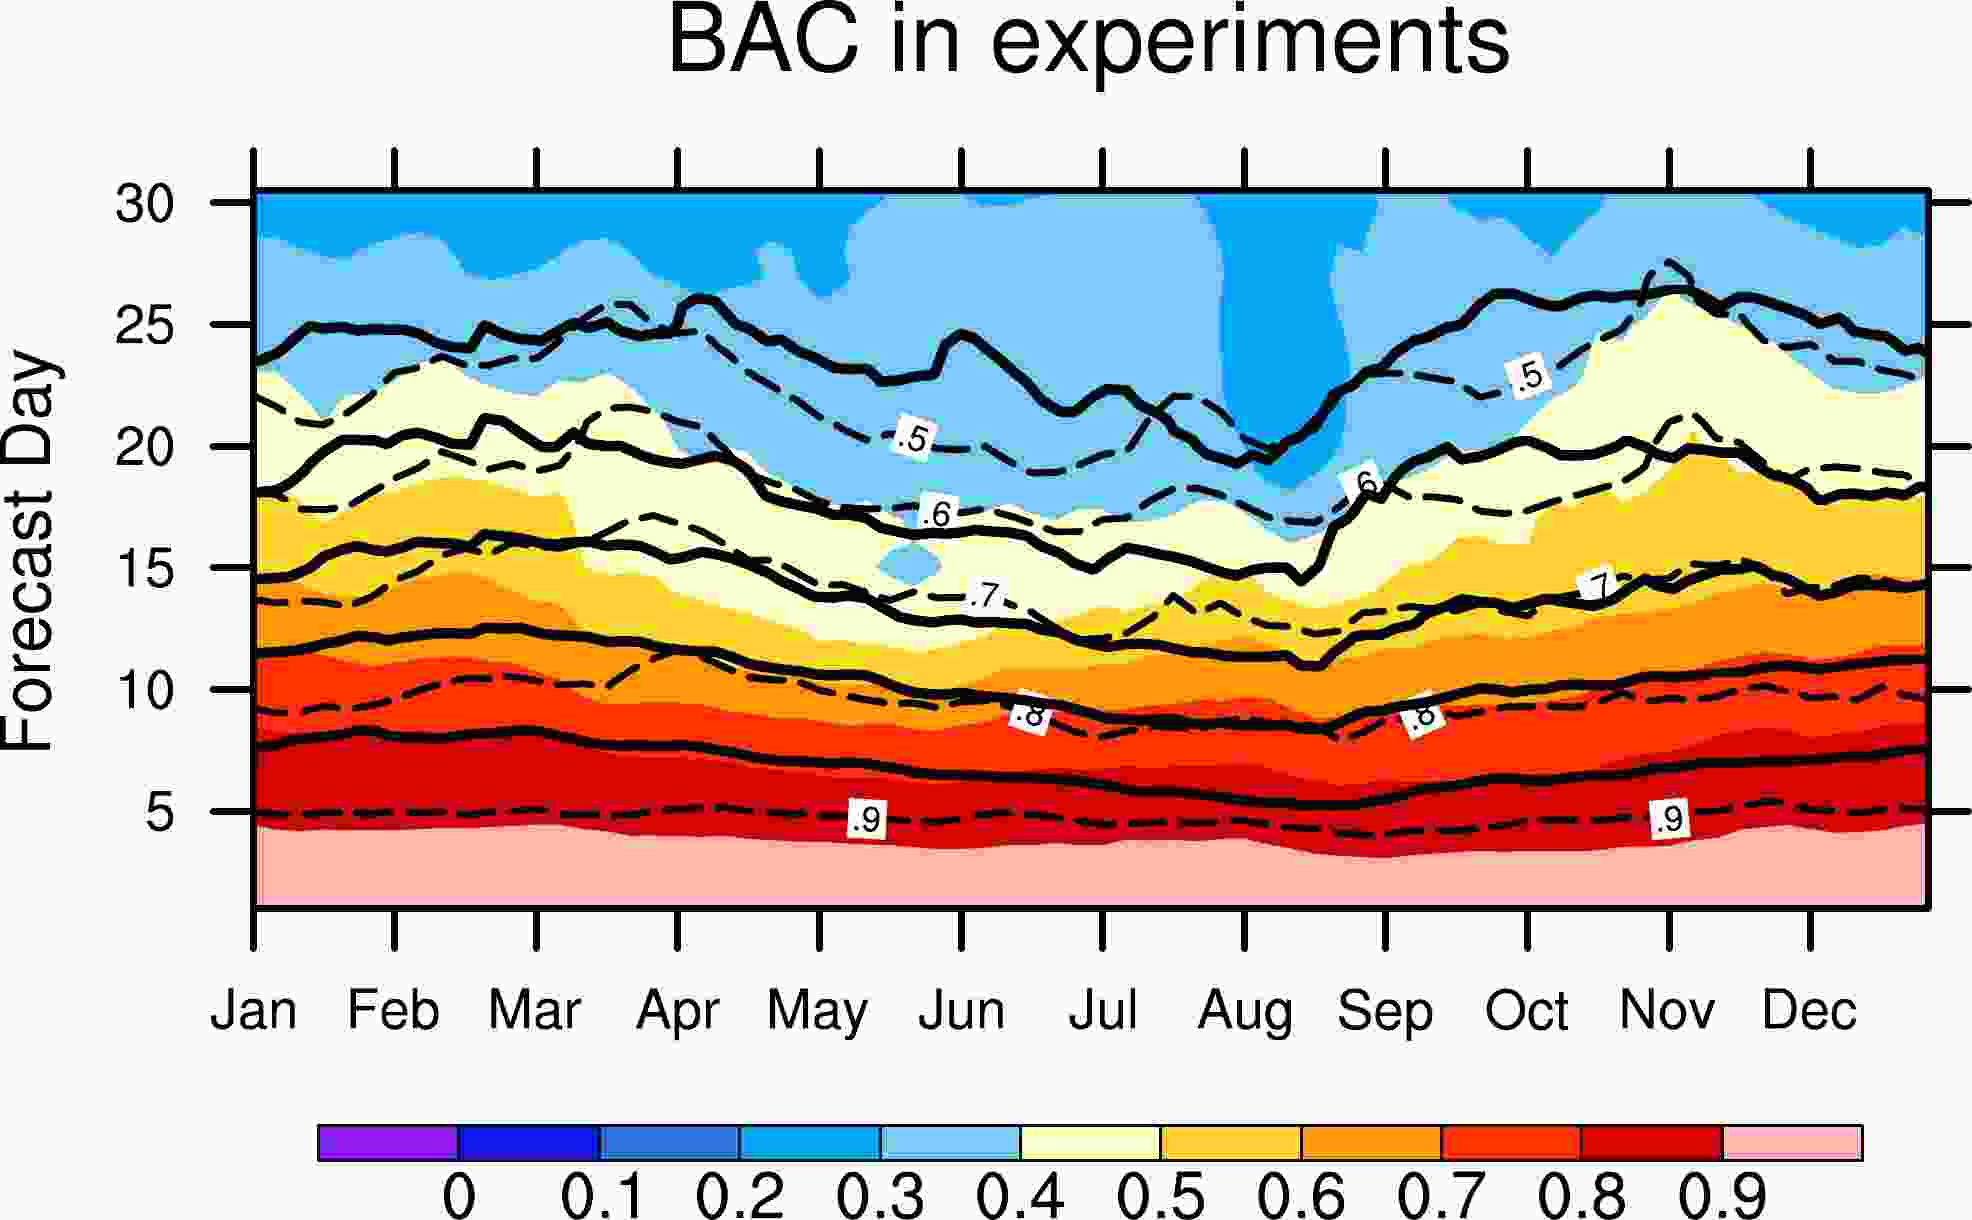
Figure 8. Bivariate correlation of RMM index between observations and hindcast experiments as a function of forecast lead time and calendar date. Skills are computed within a 3-month window centered on each hindcast start date. Results shown are from EXP1 (shading), EXP1-M (short dashed contour), and EXP2 (solid contour).
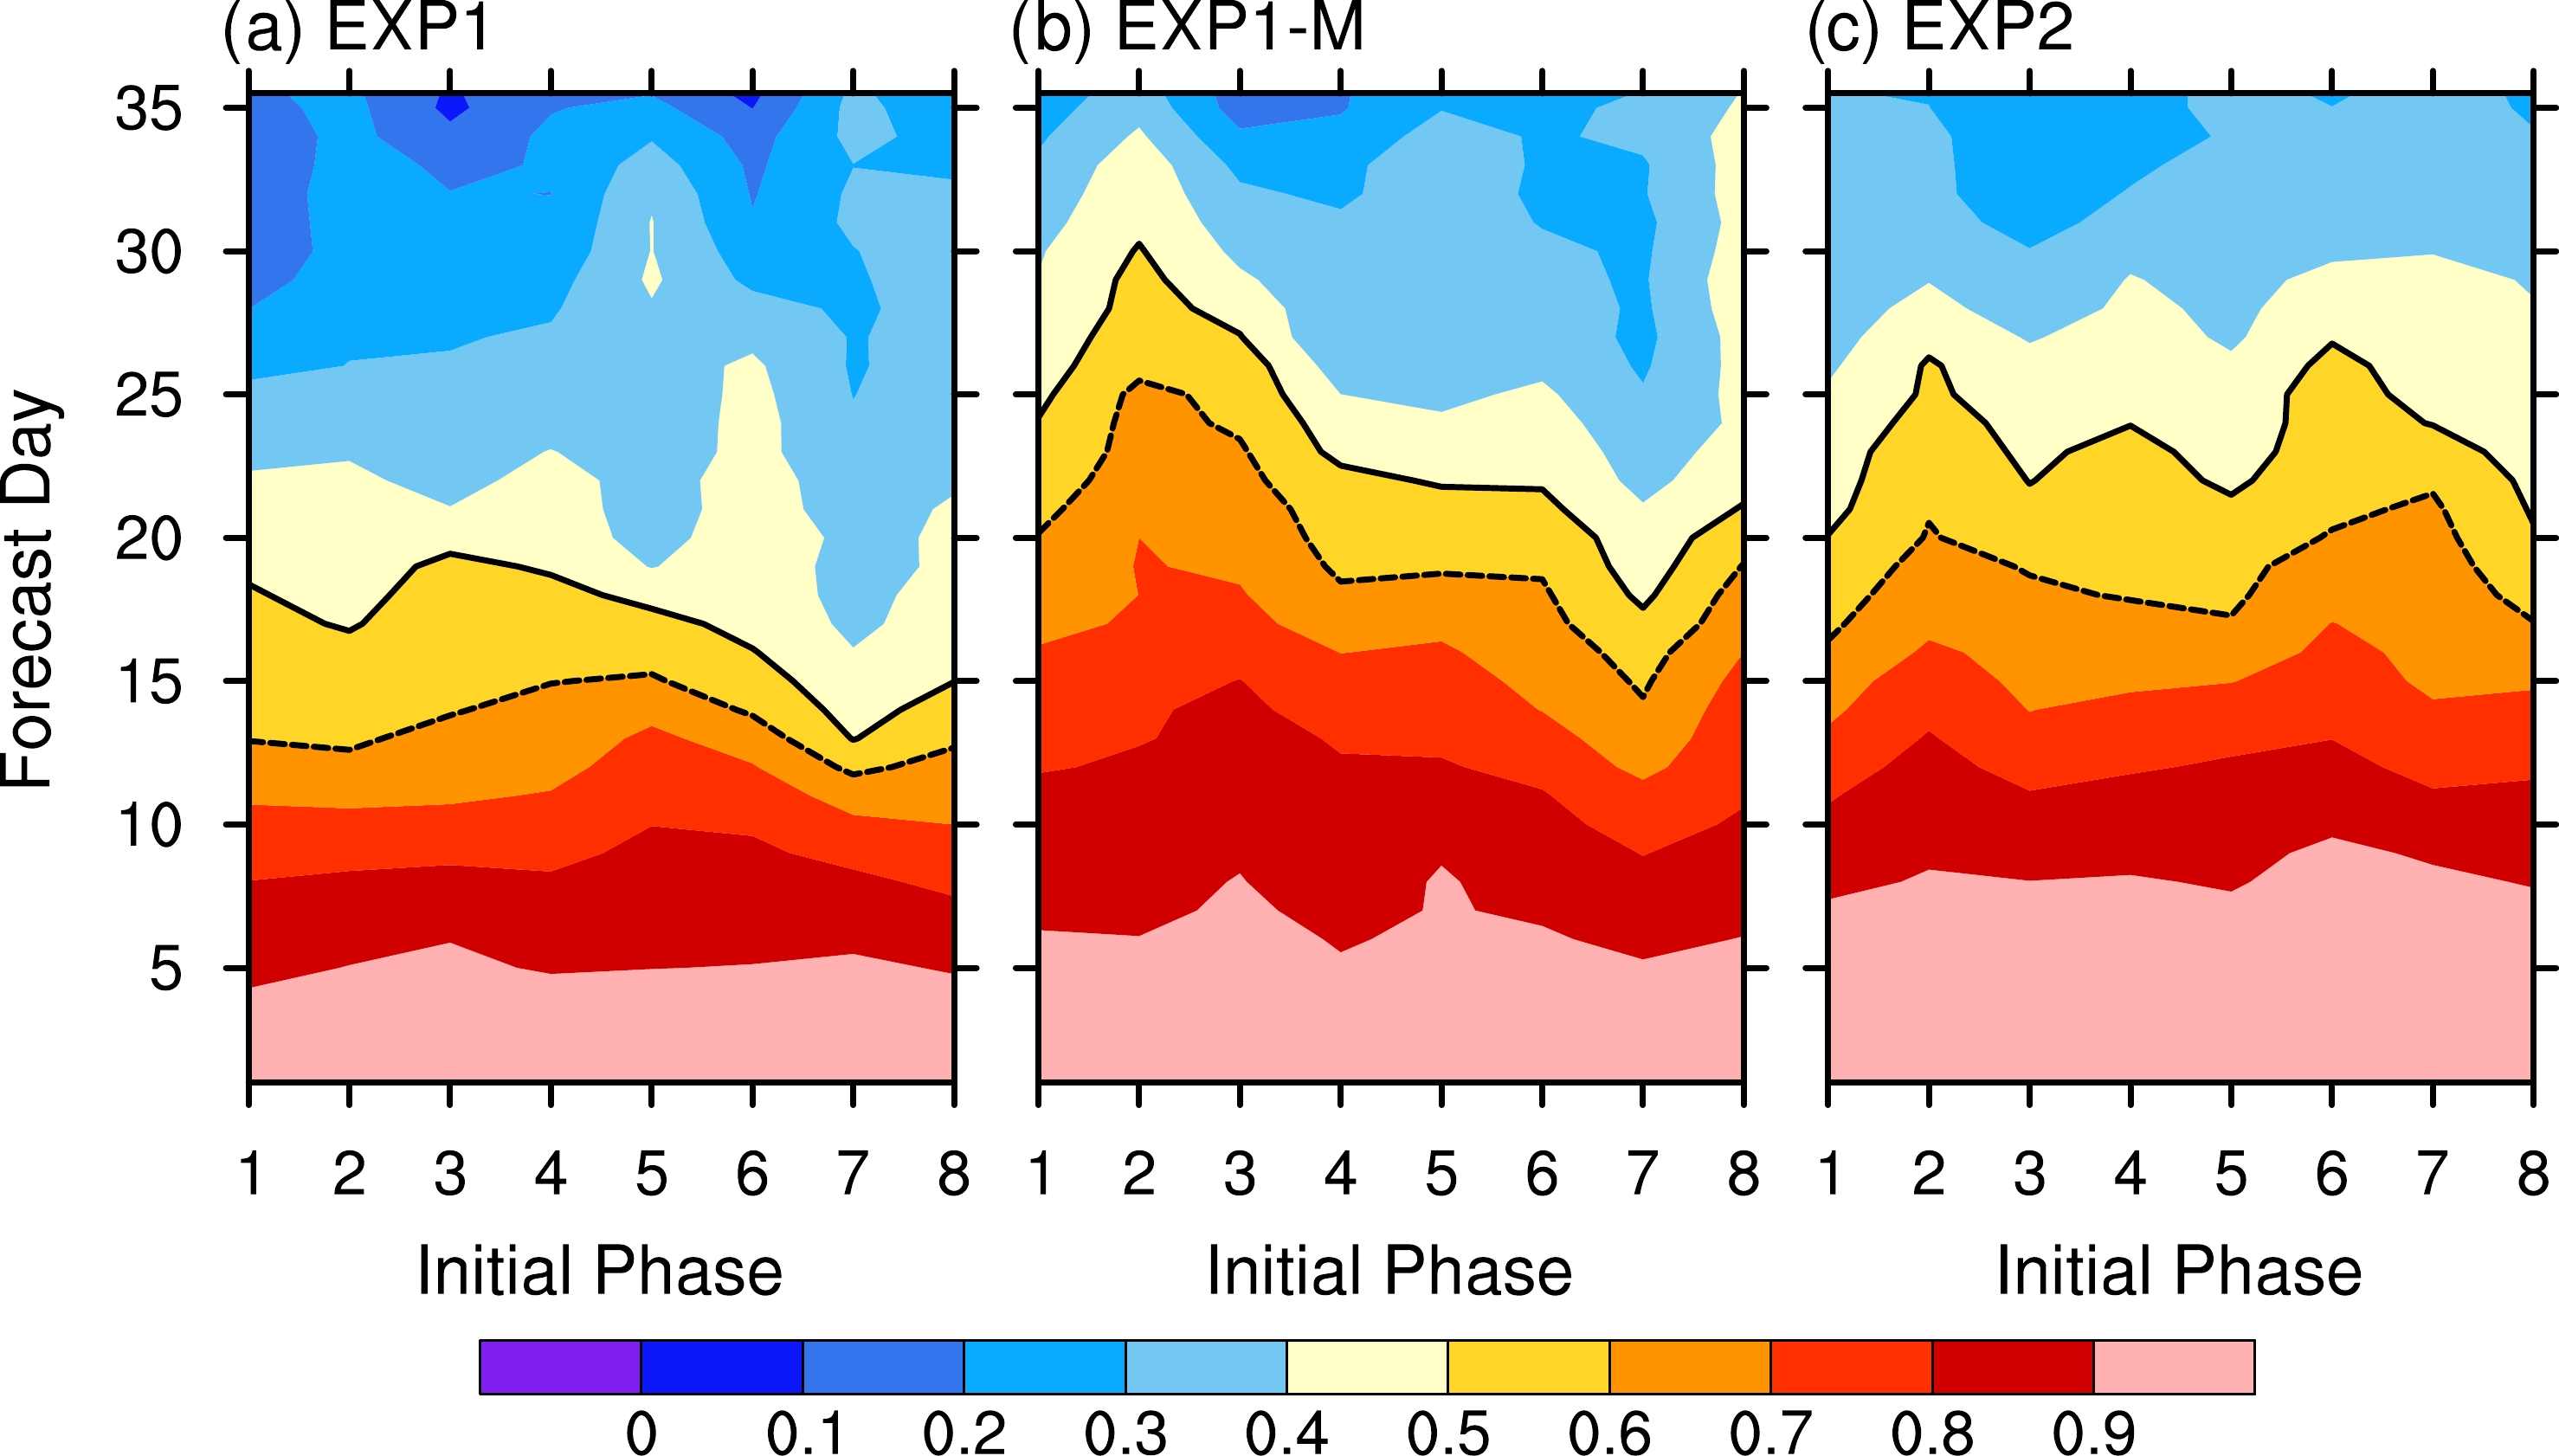
The above results show the improvements of EXP2 in MJO prediction compared with its predecessors. Nevertheless, we notice that the improvements of prediction skill from EXP2 relative to EXP1-M are not as large as those from EXP1-M relative to EXP1. Specifically, the skill differences between EXP2 and EXP1-M are remarkable within the first forecast week but become small afterward. To identify the possible cause for the reduced superiority of EXP2 after the first forecast week, we computed the bivariate correlation coefficients between the observation and experiments for each MJO initial phase. As shown in Fig. 9, EXP2 differs from EXP1 and EXP1-M in the distribution of useful prediction skill across different MJO initial phases. In EXP1 and EXP1-M (Figs. 9a, b), the prediction skills from experiments initialized in phases 1–4 (from the central Indian Ocean to the MC) are higher than those initialized in phases 5–8 (from the western Pacific warm pool to the central Pacific). EXP2 shows few differences in the useful skill between initial phases 1–4 and 5–8 (Fig. 9c). Moreover, EXP1-M and EXP2 show obvious contrast when initialized from phases 2–3 and phases 6–7. Specifically, the useful prediction skill from phases 2–3 reaches nearly 30 days in EXP1-M but is only 25 days in EXP2. In contrast, the useful skills from phases 6–7 are around 17 forecast days in EXP1-M but improve to about 25 forecast days in EXP2. This may partially contribute to the marginal differences in MJO prediction skill between EXP1-M and EXP2 during forecast weeks 2–3.
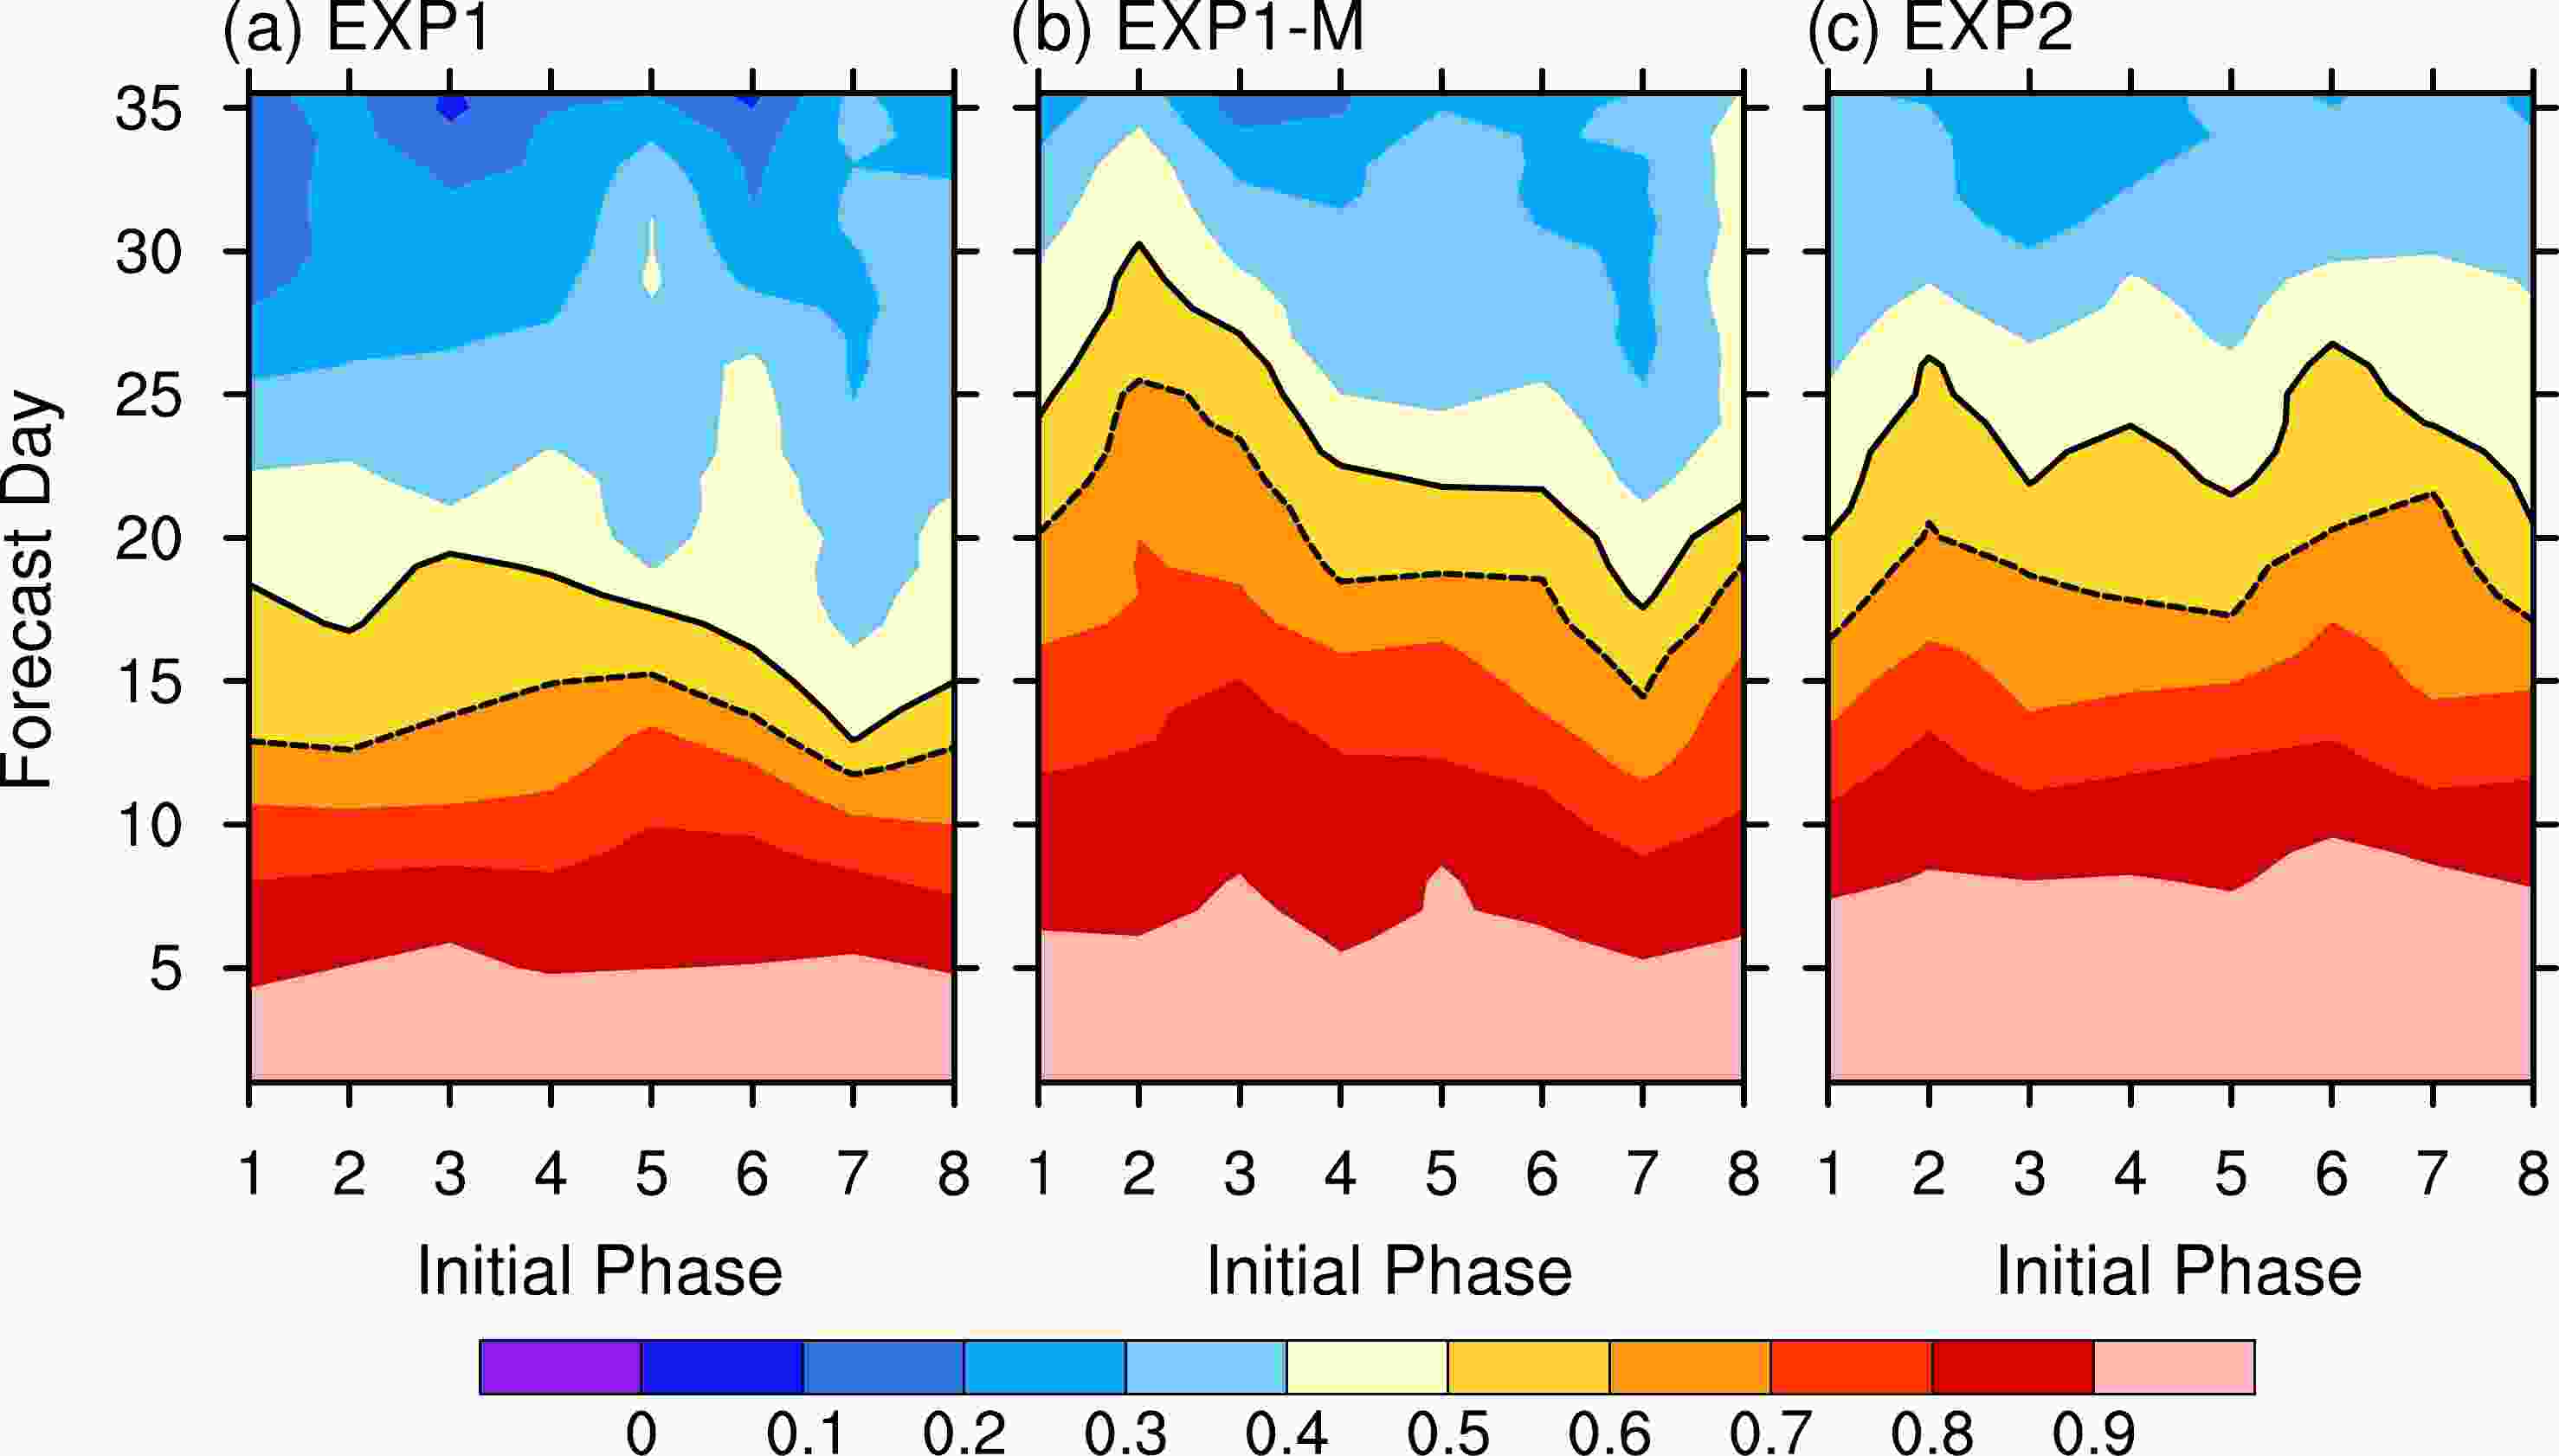
Figure 9. Bivariate correlation of RMM index between observations and forecasts as a function of forecast lead time and MJO initial phase for cases with amplitude greater than 1.0. Results shown are from (a) EXP1, (b) EXP1-M, and (c) EXP2.
We also applied the bootstrap significance test to the hindcast experiments initialized from different MJO phases. As shown in Fig. 10, MJO prediction skills with higher overall statistical significance within three forecast weeks are detected in EXP1-M and EXP2 compared with EXP1 for all MJO initial phases. The differences between EXP1-M and EXP2 vary with the initial phases of the MJO. In the first forecast week, EXP2 slightly improved the MJO prediction skill at all MJO initial phases (Fig. 10, right column), indicating the effect of upgraded initial conditions. During forecast weeks 2–3, significant improvements in phases 6–7 (Figs. 10r, u) and evident degradation in phase 3 (Fig. 10i) are found in EXP2 relative to EXP1-M, further indicating that overall prediction skill improvements may be offset by different MJO phases.
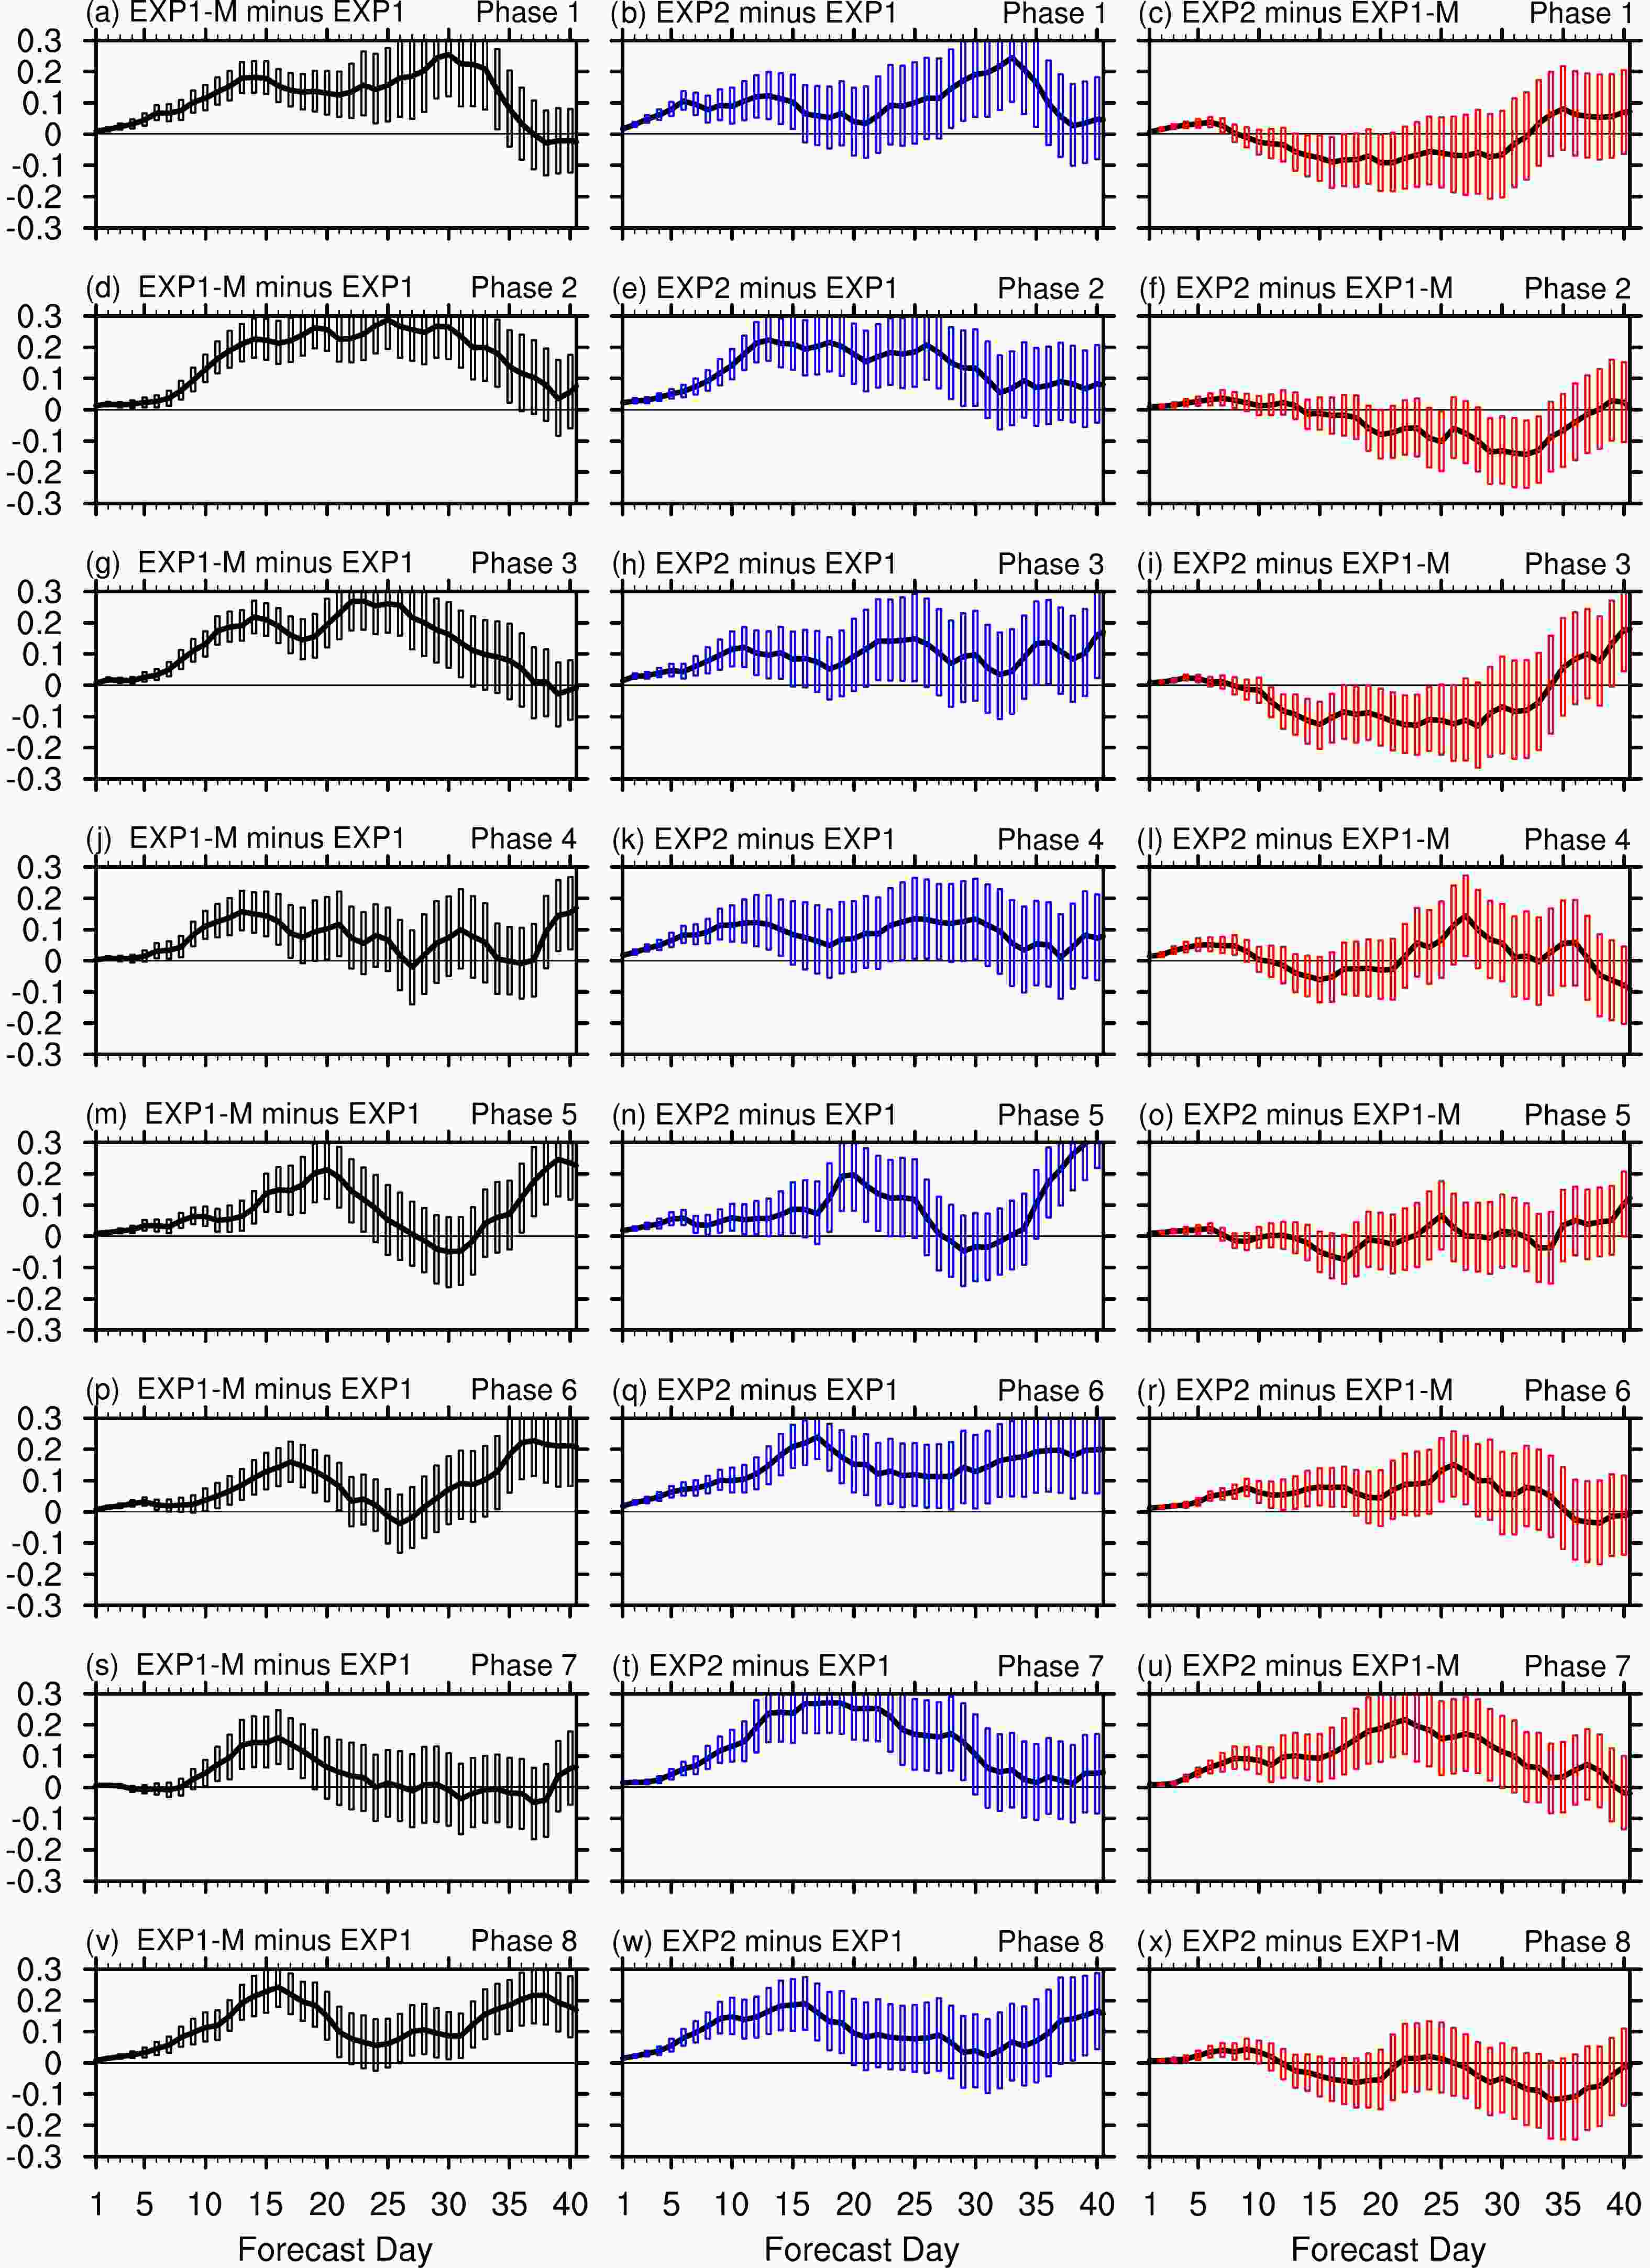
Figure 10. Evolution of the differences of bivariate correlation between EXP1-M and EXP1 (left column), between EXP2 and EXP1 (central column), and between EXP2 and EXP1-M (right column) as a function of forecast lead time. Panels from top to bottom represent hindcasts initialized with eight MJO phases (amplitude >1.0). The vertical bars represent the 95% confidence level computed from a bootstrap resampling procedure with 10 000 iterations.
Understanding the possible physical causes for the skill differences between different initial phases may provide important information for improving MJO prediction skills in the future. Thus, the evolution of the anomalous OLR and wind field from the observation and hindcast experiments initialized in phases 3 and 7 are given in Fig. 11. For the observation in the phase 3 of the MJO, the negative OLR anomaly propagates from the Indian Ocean into the western Pacific, accompanied by a strong westerly (easterly) low-level wind anomaly to its west (east) (Fig. 11a). None of the hindcast experiments reasonably predict the negative OLR anomalies after forecast day 10. The OLR anomalies in these experiments propagate faster than in observation, and their spatial structure becomes scattered upon reaching the MC.
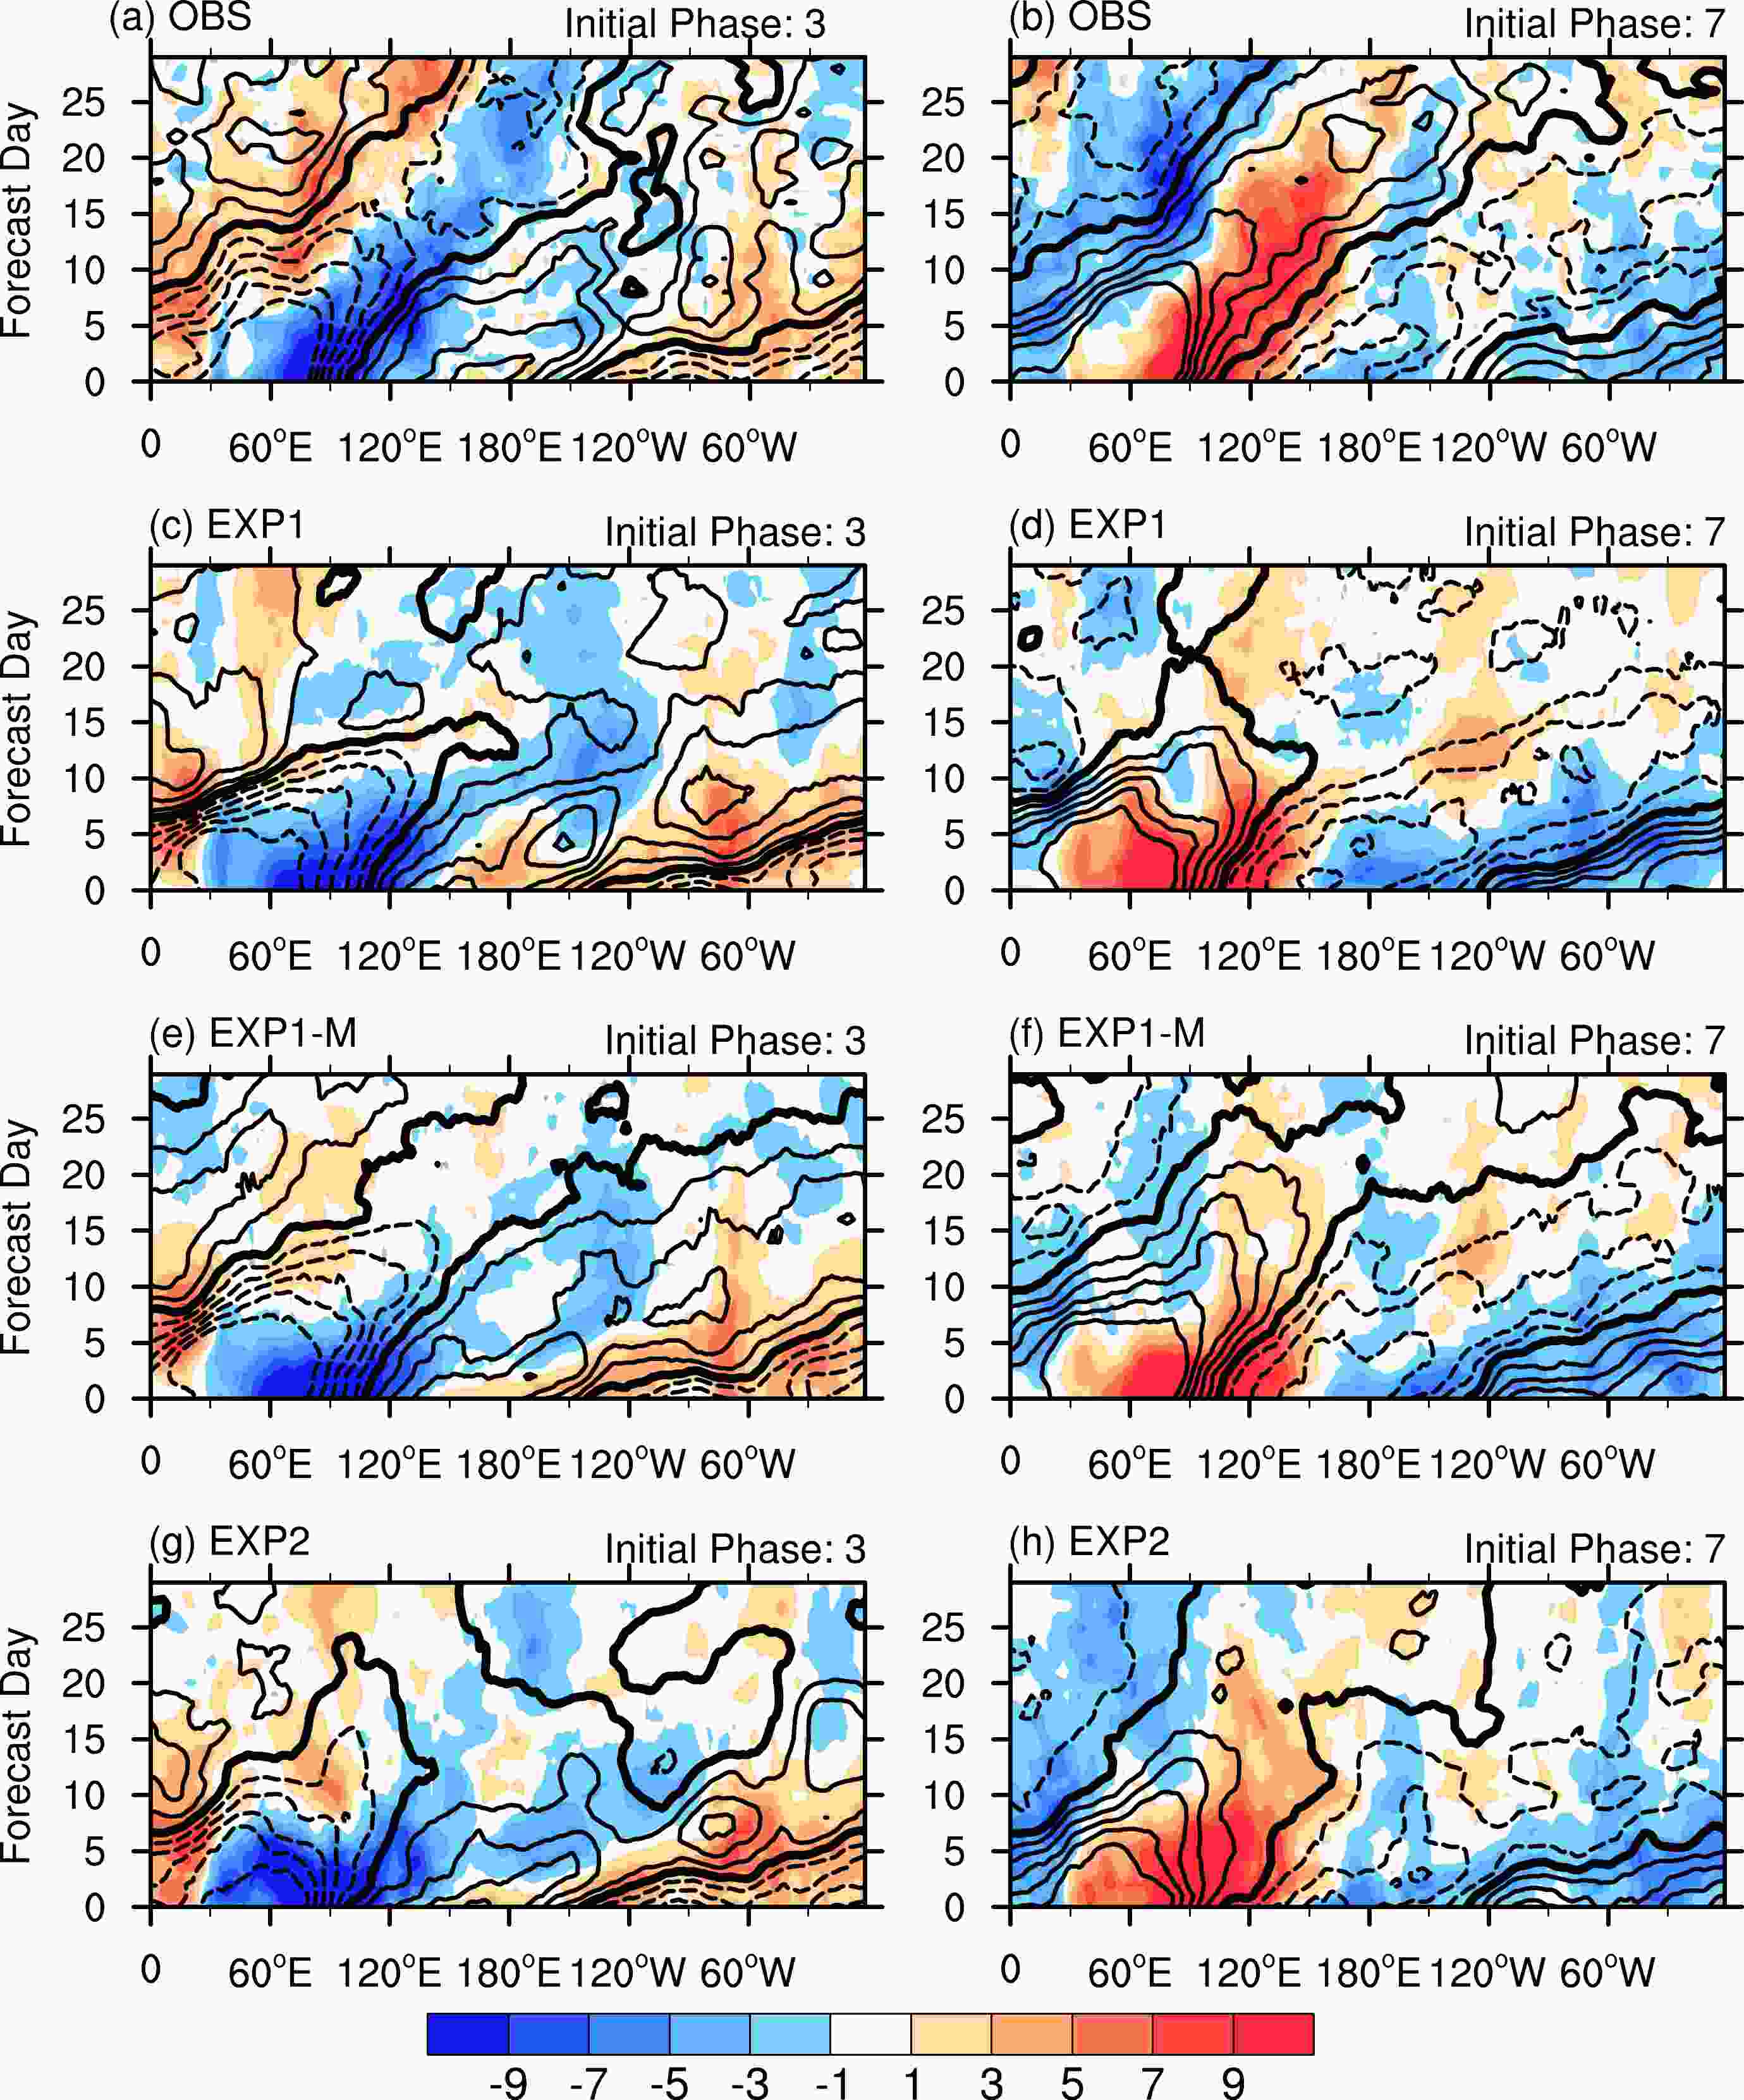
Figure 11. Time-longitude composites of outgoing longwave radiation (shaded; units: W m−2) and 850-hPa zonal wind (contour; units: m s−1) anomalies for hindcasts initialized at phase 3 (left column) and phase 7 (right column) of the MJO with amplitude > 1.0. Results are from (a–b) observation, (c–d) EXP1, (e–f) EXP1-M, and (g–h) EXP2, respectively.
Despite their failure in predicting OLR anomalies, all experiments reasonably predict the low-level wind anomalies into forecast week 2, especially the low-level convergence over the Indian Ocean. Afterward, large differences arise among the experiments. EXP1 has the lowest prediction skill for the low-level zonal wind among all experiments (Fig. 11c). Since forecast week 2, clear propagation of convective anomalies from the Maritime Continent to the western Pacific is notably absent. Instead of the easterlies in observation, the westerlies dominate the western Pacific in EXP1 after forecast week 2. In contrast, EXP1-M is the most skillful (Fig. 11e). Although there are some slight errors in convection intensity compared with the observation after forecast day 10, the spatial distribution and temporal evolution of the 850-hPa zonal wind anomaly are generally consistent with the observation until forecast week 4. The performance of EXP2 is between those of EXP1 and EXP1-M (Fig. 11g). During forecast weeks 2–3, the magnitude of 850-hPa zonal wind anomaly in EXP2 is significantly lower than that in EXP1-M. As a result, the low-level convergence driven by MJO convection in EXP2 is insufficient, thereby worsening the MJO prediction skill.
For the observation in phase 7 of the MJO a positive OLR field accompanied by strong low-level divergence propagates from the Indian Ocean to the western Pacific (Fig. 11b). In EXP1, after forecast day 10, the magnitude of OLR and zonal wind anomaly drastically declines, and there is no further propagation of the MJO signal into the western Pacific (Fig. 11d). EXP1-M improves upon the intensity of the low-level convergence, but still shows an underestimated OLR anomaly over the tropical Indian Ocean to the western Pacific after week 2 (Fig. 11f). EXP2 has the best prediction skill among three experiments (Fig. 11h). It reasonably predicts the intensity and propagation of OLR and zonal wind anomalies into three weeks.
To further investigate the underlying dynamic mechanisms leading to the significant differences among various experiments, Fig. 12 illustrates the spatial distribution of the OLR, 850-hPa winds, and vertical motion anomalies for the observation and hindcast experiments initialized in phase 3. In the observation, the MJO is featured by strong convection initiated over the eastern tropical Indian Ocean and subsequent eastward propagation into the western Pacific warm pool in the next 20 days (Fig. 12a). Such enhanced convection generates strong diabatic heating along the equator and induces a Kelvin wave response to its east (Gill, 1980). Obviously, the Kelvin wave response initiated from MJO phase 3 is represented by the eastward propagation of anomalously strong ascending motion (Fig. 12a, solid purple line) and convergence of 850-hPa wind anomalies.
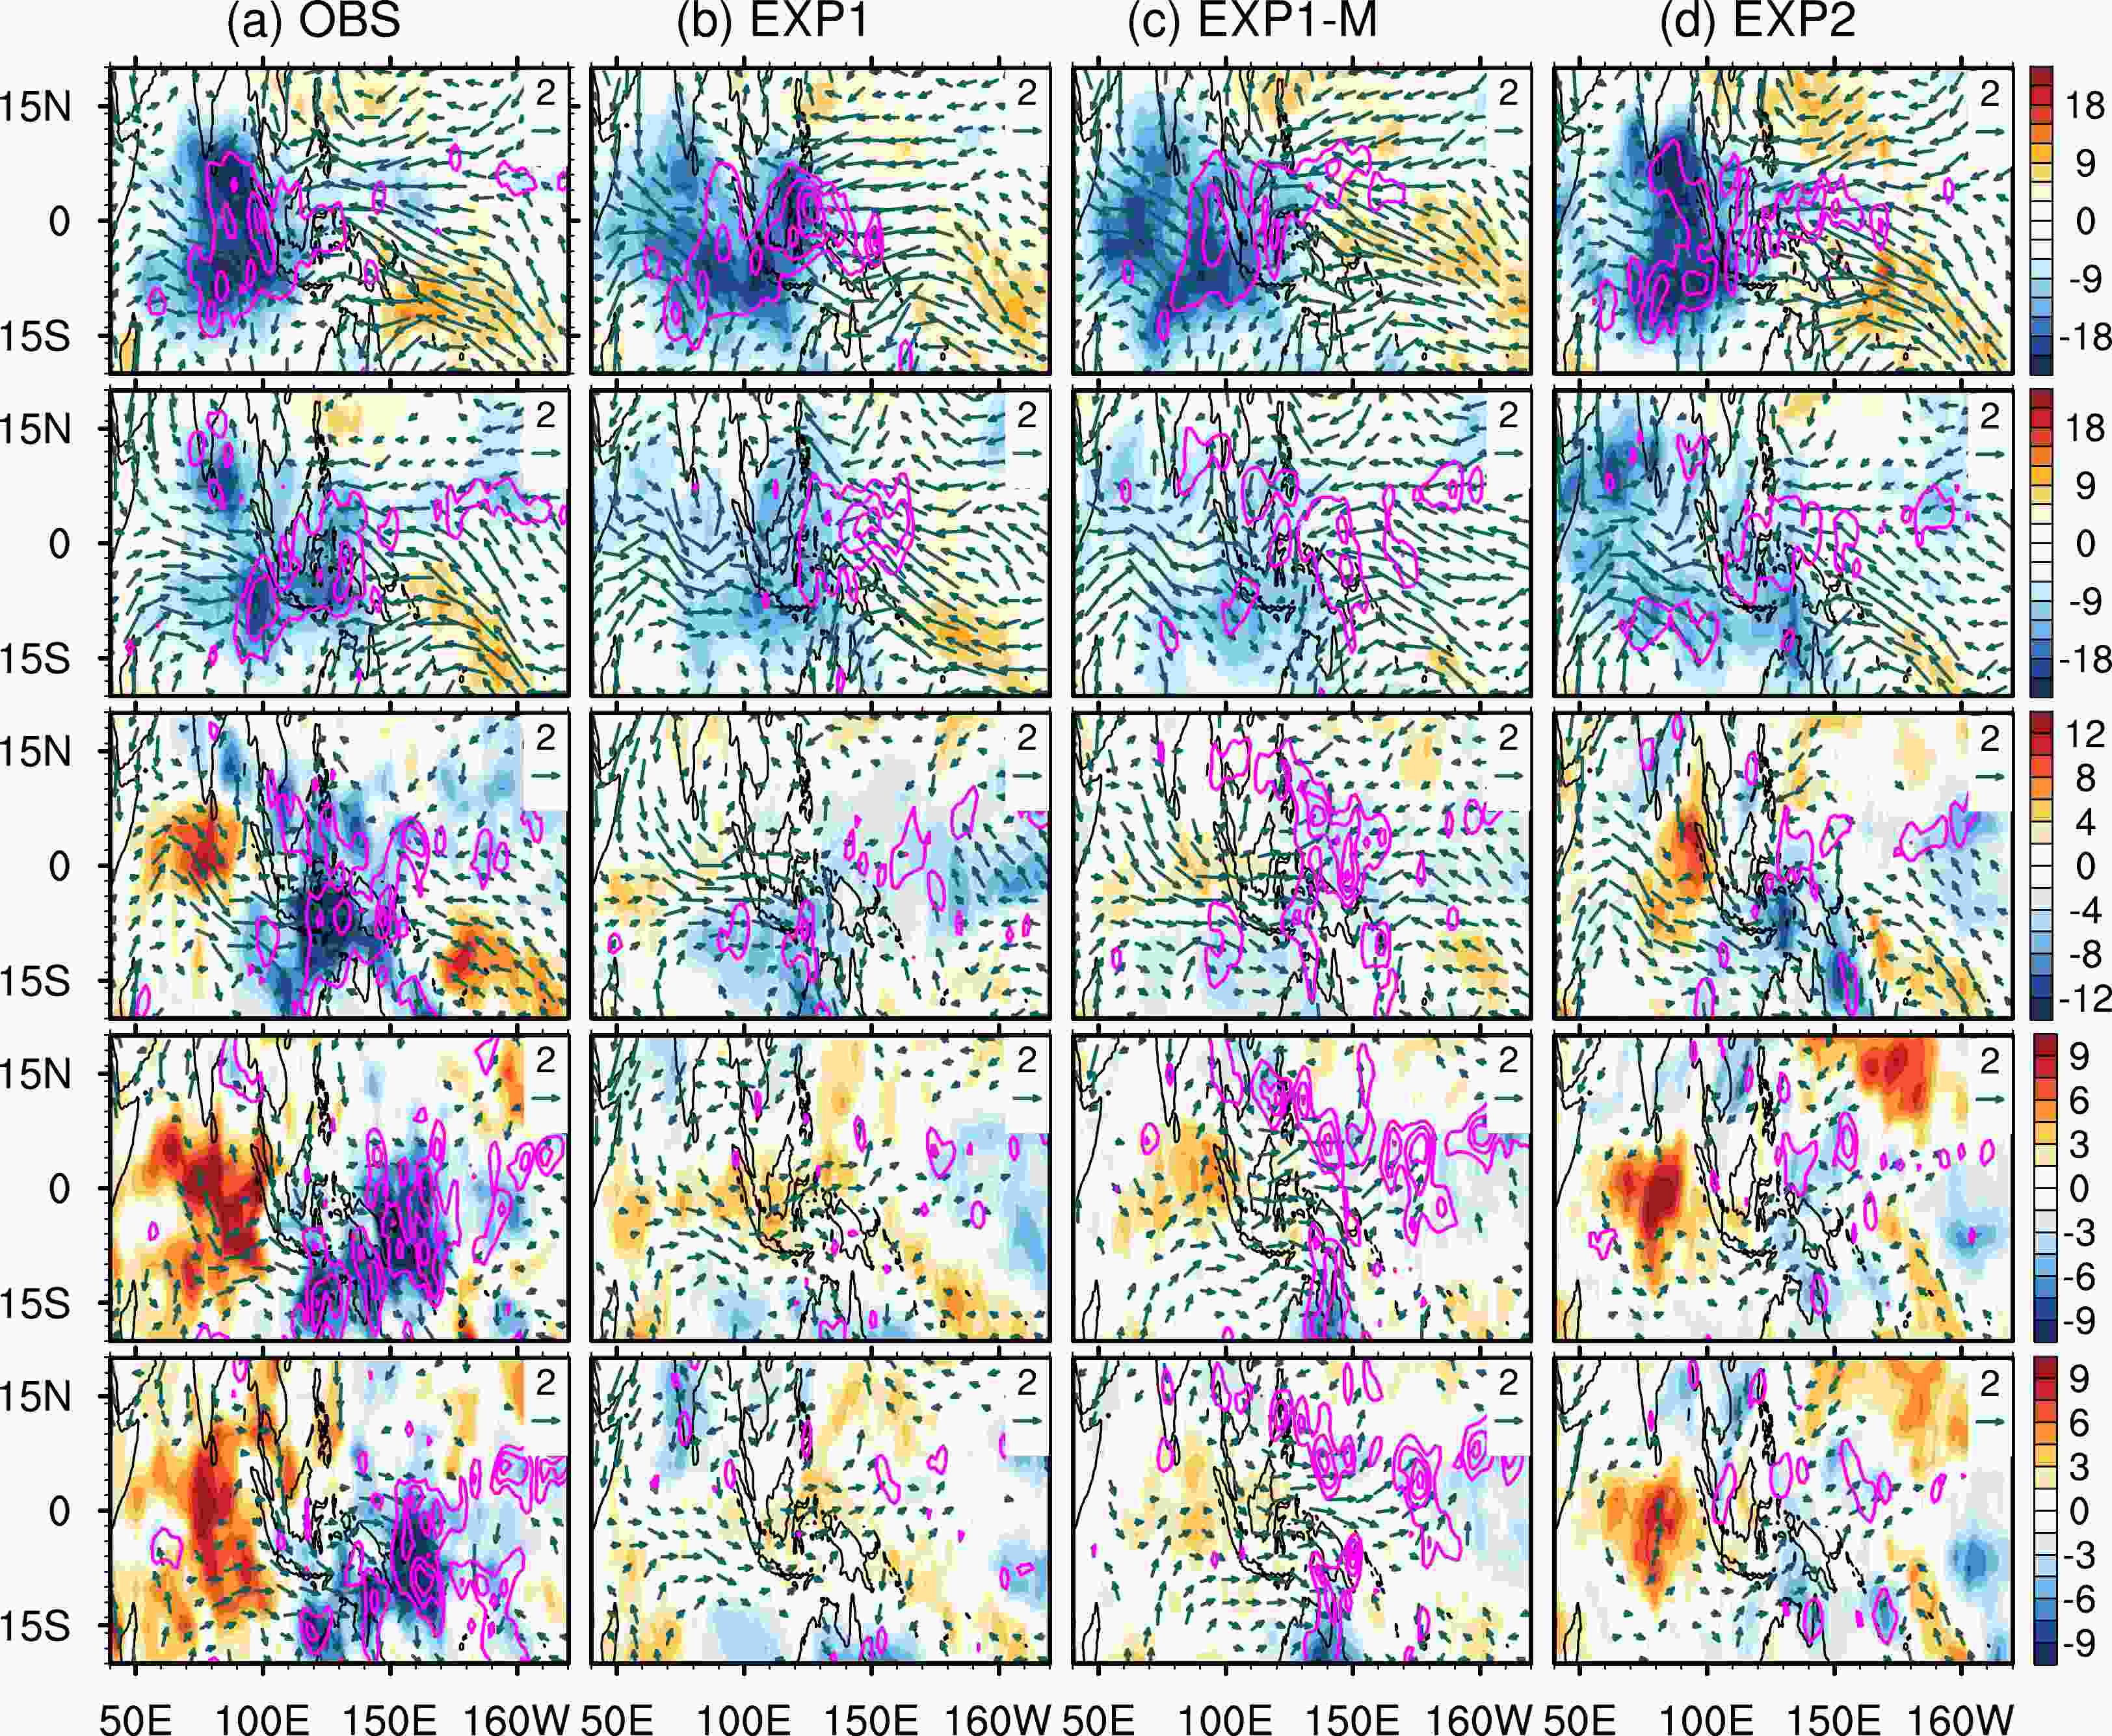
Figure 12. Composites of outgoing longwave radiation (shaded; units: W m−2), 850-hPa winds (vector; units: m s−1, not shown when the wind speed is less than 0.5 m s−1) anomalies from (a) observation, (b) EXP1, (c) EXP1-M, and (d) EXP2 initialized with phase 3 of the MJO at forecast day 1 (first row), 5 (second row), 10 (third row), 15 (fourth row), 20 (fifth row). The solid purple line denotes the composited negative vertical velocity anomalies at 500 hPa (units: Pa s−1, intervals are –0.02, –0.02, –0.015, –0.01, –0.01 Pa s−1 for forecast days 1, 5, 10, 15, 20, respectively).
The key features distinguishing the three hindcast experiments are the strong convection enhancement over the MC and the related Kelvin wave response after forecast day 10. EXP1 shows weak convection and weakened ascending motion over the MC after forecast day 10 (Fig. 12a), resulting in a gradually faded Kelvin wave response. In EXP1-M, the intensity of the convection and related Kelvin wave response is somewhat improved compared with EXP1 (Fig. 12b). Although the negative OLR anomaly over the MC is still weaker-than-observed, the Kelvin wave response can propagate eastward into the western Pacific warm pool till forecast day 20 (Fig. 12c). Interestingly, we find that the strong anomalous ascending motion decouples with the weak negative OLR anomaly in EXP1-M. This suggests that after modifying the parameterization schemes in EXP1-M, vertical ascending motion with strong intensity is more easily triggered despite the OLR anomaly being very weak compared with the observation; thus, the eastward propagation of the Kelvin wave is sustained. The vertical motion also decouples with the OLR in EXP2, but in a different way. EXP2 reasonably predicts the spatial distribution and intensity of the negative OLR anomaly within forecast day 10 (Fig. 12d). Afterwards, the ascending motion anomalies and related Kelvin wave response rapidly decay despite maintaining the negative OLR anomaly. Therefore, the anomalies of ascending motion and 850-hPa wind are not well organized in the Kelvin wave structure, leading to the quicker decline of MJO prediction skill in EXP2 than in EXP1-M.
In phase 7 of the MJO, the observed positive OLR and strong descending motion anomalies propagate from the eastern Indian Ocean to the MC in 10 days (Fig. 13a). Afterwards, the anomalous positive OLR and descending motion occupy the MC until forecast day 20. Meanwhile, new convection initiates from the eastern Indian Ocean and then propagates to the western Indian Ocean during forecast days 10–20. In both EXP1 and EXP1-M, the positive OLR anomaly over the MC decays rapidly after forecast day 5 and completely disappears on forecast day 15 (Figs. 13b, c). Compared with EXP1, EXP1-M shows advantages in predicting the intensity and spatial distribution of descending motion and related divergence over the MC. This is similar to the previously mentioned results for hindcast experiments initialized in phase 3 of the MJO in which EXP1-M reasonably predicts the vertical motion and wind field into forecast day 20 without capturing the negative OLR anomaly. However, due to the more rapid decay of the positive OLR anomaly, the prediction skill for the hindcast experiments initialized in phase 7 is less skillful than that initialized in phase 3 for EXP1-M. Unlike EXP1 and EXP1-M, EXP2 significantly improves upon the prediction of OLR over the MC, with an intensity nearly comparable with the observation within 10 forecast days, and maintains a long existence of positive OLR anomaly for more than 20 forecast days. Although the intensities of divergence and descending motion in EXP2 are weaker than that in EXP1-M since forecast day 10, the low-level convergence, especially the easterly wind over the MC, is still reasonably reproduced, leading to higher skill in EXP2 than in other experiments initialized in phase 7 of the MJO.
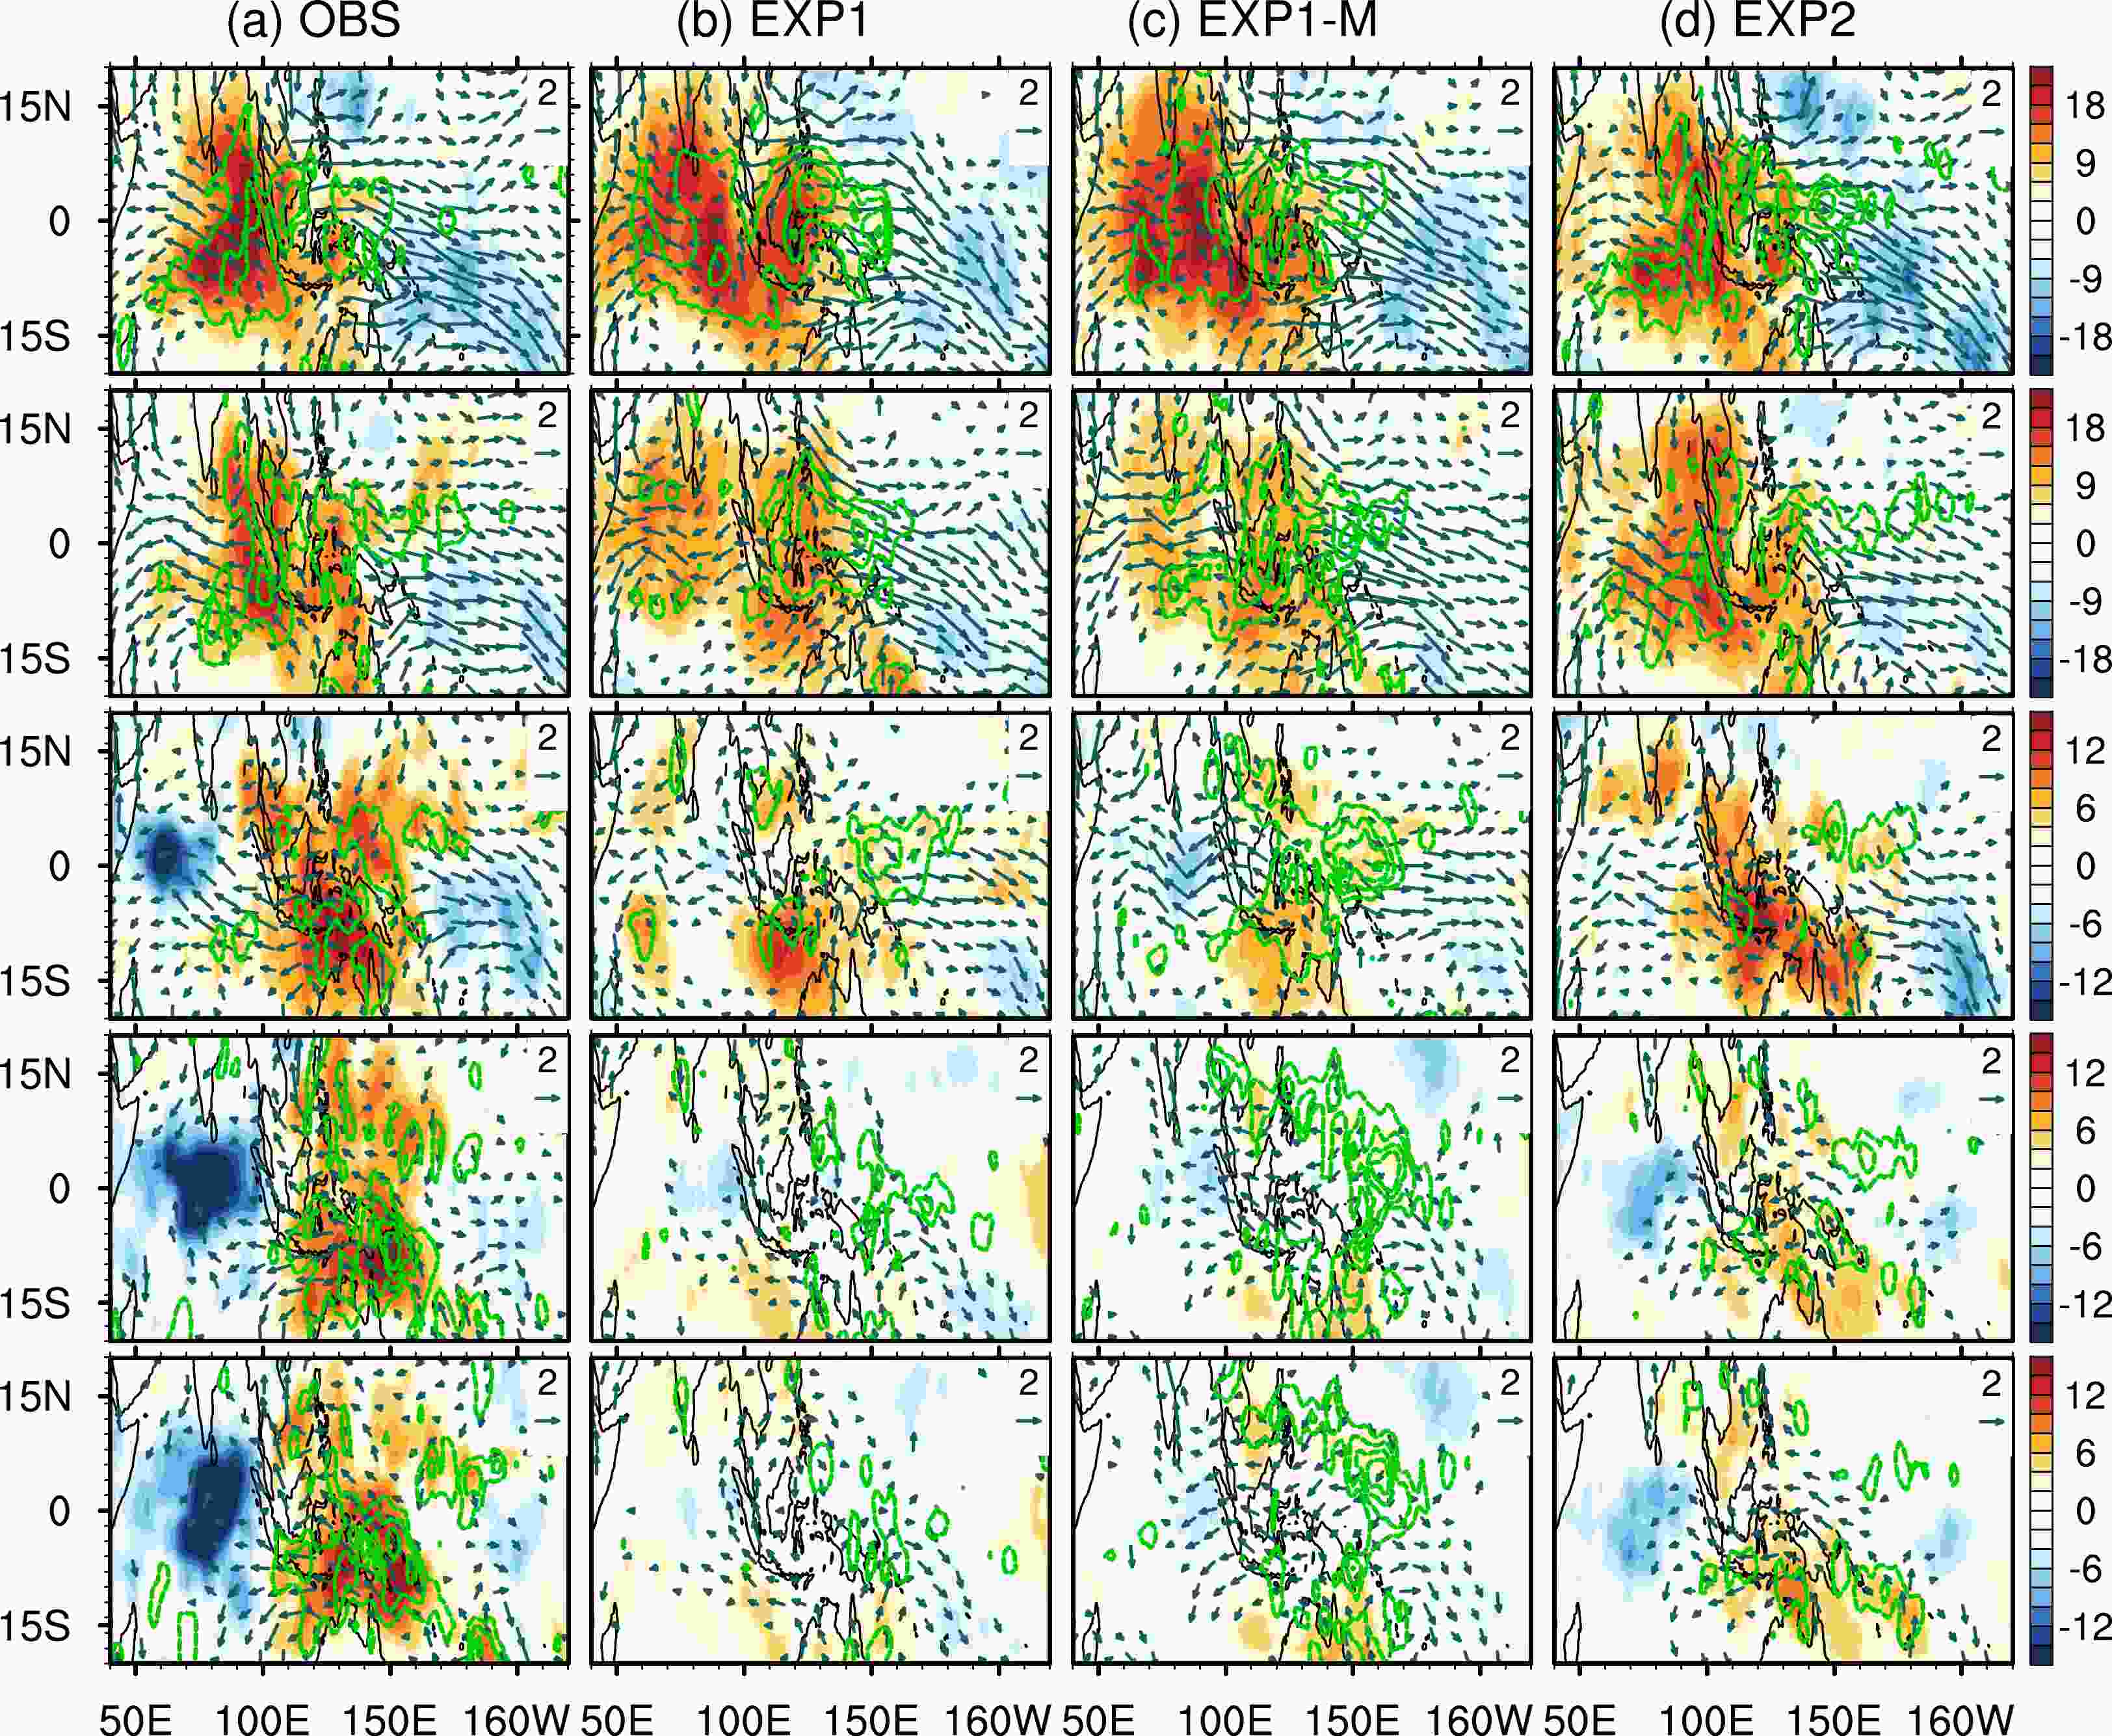
Figure 13. Composites of outgoing longwave radiation (shaded; units: W m−2) and 850-hPa wind (vector; units: m s−1, not shown when the wind speed is less than 0.5 m s−1) anomalies from (a) observation, (b) EXP1, (c) EXP1-M, and (d) EXP2 initialized with phase 7 of the MJO at forecast day 1 (first row), 5 (second row), 10 (third row), 15 (fourth row), 20 (fifth row). The green dashed line denotes the composited positive vertical velocity anomalies at 500 hPa (units: Pa s−1, intervals are 0.015, 0.015, 0.15, 0.01, 0.01 Pa s−1 for forecast days 1, 5, 10, 15, 20, respectively).
The above analysis indicates that, compared with EXP1-M, EXP2 is superior in predicting OLR evolution for hindcast experiments initialized in phase 7 of the MJO but inferior for those initialized in phase 3. This may result in a small difference in overall prediction skill between EXP1-M and EXP2 during forecast weeks 2–3. We demonstrate that the OLR, as an indicator of convection intensity, should be a key factor in influencing MJO prediction skill, especially in the early stage of the forecast. Although EXP2 skillfully predicts OLR for over 20 forecast days when initialized in phase 7 of the MJO, most predictions cannot provide skillful OLR predictions beyond 10 forecast days and thus lead to a quick decline of MJO prediction skill at a long forecast time. Notably, a decoupling of the OLR and circulation may exist in the model and further affect the actual predictability of MJO at long-forecast times. Specifically, for experiments initialized in phase 3, despite the degraded prediction skill of OLR after forecast day 10, EXP1-M still skillfully captures the vertical motion, wind field, and related Kelvin wave response and further gains reasonable prediction skill of the MJO. In this context, a better description of the coupled relationship between OLR and the atmospheric circulation over the key MJO-activity area may further improve the long-term forecast of the MJO.
It is worth noting that the improvements of MJO simulation from BCC-CSM1.2-M to BCC-CSM2-HR are larger than those from BCC-CSM1.2 to BCC-CSM1.2-M. However, the improvements in MJO prediction from EXP1-M to EXP2 are not as remarkable as those from EXP-1 to EXP1-M. This implies that a better MJO simulation may not always lead to an improved MJO prediction. A series of studies have also confirmed that there is no significant association between MJO fidelity in climate simulations and the MJO medium-range forecast (Jiang et al., 2015; Klingaman et al., 2015a, b; Xavier et al., 2015). Such a gap between MJO simulation and prediction may be attributed to the nonlinear interaction between modeling error and initial condition error. Thus, to improve MJO prediction, it is highly necessary to understand the roles that the modeling error, initial condition error, and their interactions play.
-
In this study, the progress of BCC-CSM participating in the S2S prediction project is introduced from aspects of MJO simulation and forecast. Long-term simulation experiments and three sets of hindcast experiments (i.e., EXP1, EXP1-M, and EXP2) by different model versions of BCC-CSM (i.e., BCC-CSM1.2, BCC-CSM-1.2-M, and BCC-CSM2-HR) are compared.
Regarding the MJO simulation, BCC-CSM1.2 suffers from the underestimated explained variance of MJO modes, overestimated propagation speed, weakened convection intensity, and a spatial structure that lacks organization. By modifying the parameterization schemes, BCC-CSM1.2-M improves upon the explained variance of the MJO modes and reduces the biases of MJO propagation speed and spatial structure. Nevertheless, the convection intensity of MJO in BCC-CSM1.2-M is still weaker than observed. By upgrading the model version, the newly developed BCC-CSM2-HR further improves the MJO simulation and shows the highest skills among the three model versions in simulating MJO characteristics.
As for the MJO prediction, the useful prediction skills of MJO in EXP1, EXP1-M, and EXP2 are 15, 22, and 24 days, respectively. The 7-day incremental improvement in prediction skill from EXP1 to EXP1-M is primarily contributed to upgrading the initial condition and, to a lesser extent, by optimizing the physical parameters. Moreover, EXP1-M significantly improves upon the MJO prediction skill during forecast weeks 2–3, especially in the boreal summer and when the hindcast experiments were initialized in phases 2–3. Compared with EXP1-M, EXP2 further improves the useful prediction skill of MJO by about two days in all seasons. The enhancement of overall prediction skill is obvious in the first forecast week due mainly to the upgraded initial condition, but quite small in forecast weeks 2–3 because at long forecast times, the apparent improvements when initialized in phases 6–7 are offset by degradations when initialized in phases 2–3.
The hindcast experiments show distinct performances at different initialization phases of the MJO. Predictions of OLR and circulation are especially important aspects. For hindcast experiments initialized in phase 3, all experiments fail to predict the OLR anomaly after 10 forecast days but may reasonably predict the wind anomaly at longer forecast times. EXP1 only predicts the wind anomaly within two forecast weeks, leading to the lowest prediction skill. By improving initial conditions and model physical parameters, EXP1-M skillfully predicts the 850-hPa wind anomaly beyond 20 forecast days when initialized in phase 3. Accordingly, the ascending motion and low-level convergence are well predicted after forecast day 10, even though the OLR field has been unpredictable and decoupled from circulation features. This is favorable for the eastward propagation of the Kelvin waves, leading to the highest prediction skill of EXP-1M among all the experiments. However, in EXP2, with increasing forecast time, the vertical motion and wind anomalies decay more quickly, thus limiting the MJO prediction skill. For hindcast experiments initialized in phase 7, EXP1 yet again shows the lowest prediction skill of OLR and wind anomalies among the three experiments. EXP1-M is advantageous in predicting strong descending motion and low-level divergence but only skillfully predicts the OLR anomaly within five forecast days. In contrast, EXP2 reasonably captures the OLR anomaly beyond 20 forecast days and thus provides the highest skill for MJO prediction when initialized in phase 7.
The above results show that during phase I to phase II of the S2S project, the MJO prediction at CMA has made obvious progress by upgrading the model's initial conditions and physics parameterizations. It is worth noting that the benefits of improving the accuracy and coordination of initial conditions are considerably large at short lead time of the MJO forecast. After around 10 forecast days, a reliable physics parameterization scheme becomes necessary for a skillful MJO forecast. Nevertheless, improved MJO prediction skill due to upgraded model physics may come at the cost of hindering the prediction skill in some individual phases. Furthermore, when the influence of the initial condition fades with increasing forecast time, suitable parameterization schemes that allow for MJO convection to propagate across the MC domain should be regarded as an especially crucial factor in determining the MJO prediction skill. In this context, future studies should pay special attention to model-deficient MJO physics around the MC region.
Acknowledgements. This study is supported by the National Natural Science Foundation of China (Grant No. 42075161).
Progress of MJO Prediction at CMA from Phase I to Phase II of the Sub-Seasonal to Seasonal Prediction Project
- Manuscript received: 2022-11-23
- Manuscript revised: 2023-02-14
- Manuscript accepted: 2023-02-28
Abstract: As one of the participants in the Subseasonal to Seasonal (S2S) Prediction Project, the China Meteorological Administration (CMA) has adopted several model versions to participate in the S2S Project. This study evaluates the models’ capability to simulate and predict the Madden-Julian Oscillation (MJO). Three versions of the Beijing Climate Center Climate System Model (BCC-CSM) are used to conduct historical simulations and re-forecast experiments (referred to as EXP1, EXP1-M, and EXP2, respectively). In simulating MJO characteristics, the newly-developed high-resolution BCC-CSM outperforms its predecessors. In terms of MJO prediction, the useful prediction skill of the MJO index is enhanced from 15 days in EXP1 to 22 days in EXP1-M, and further to 24 days in EXP2. Within the first forecast week, the better initial condition in EXP2 largely contributes to the enhancement of MJO prediction skill. However, during forecast weeks 2–3, EXP2 shows little advantage compared with EXP1-M because the increased skill at MJO initial phases 6–7 is largely offset by the degraded skill at MJO initial phases 2–3. Particularly at initial phases 2–3, EXP1-M skillfully captures the wind field and Kelvin-wave response to MJO convection, leading to the highest prediction skill of the MJO. Our results reveal that, during the participation of the CMA models in the S2S Project, both the improved model initialization and updated model physics played positive roles in improving MJO prediction. Future efforts should focus on improving the model physics to better simulate MJO convection over the Maritime Continent and further improve MJO prediction at long lead times.
-
Keywords:
- Madden-Julian Oscillation (MJO),
- Subseasonal to Seasonal (S2S),
- prediction skill,
- improvement,
- initial phase
摘要: 中国气象局(CMA)在参与国际次季节-季节(S2S)预测计划的第一到第二阶段,对S2S尺度重要现象—马登-朱利安振荡 (MJO)的预测能力逐步提升。本文利用中国气象局参加S2S计划的三个模式版本分别开展了历史模拟和回报试验(EXP1、EXP1-M和EXP2),进而探讨了模式对MJO预测的改进程度及可能原因。结果表明,在MJO 气候态模拟方面,新开发的高分辨率气候系统模式优于之前的中等分辨率模式。在MJO预测方面,由于初始条件的改进和模式的逐步更新,MJO的可用预测技巧从EXP1的15天提高到EXP1-M的22天,进一步在EXP2提高到24天。EXP2的MJO整体预测技巧最高,但其相比EXP1-M在预测第 2-3 周的改进并不明显。这主要是因为,针对第2-3初始位相的MJO预报,EXP1-M能够合理预测第2-3周的海洋大陆区域MJO对流异常和风场的响应关系,但EXP2对这种关系的预测能力快速下降。研究也同时指出,未来应侧重于进一步改进模式物理过程,尤其是海洋大陆区域MJO对流过程,从而提高MJO的预测技巧。
-
关键词:
- 马登-朱利安振荡(MJO),
- 次季节-季节(S2S),
- 预测技巧,
- 改进,
- 初始位相


 AAS Website
 AAS WeChat