


 DownLoad:


-
Low-level jets (LLJs), typically defined as the wind maximum in the lowest kilometers, are widely distributed around the world (Krishnamurti et al., 1976; Stensrud 1996; Vera et al., 2006; Rife et al., 2010). Over southern China, LLJs frequently establish themselves within the southwesterly flow of the summer monsoon (Chen et al., 2006; He et al., 2016). They occur most frequently in the mei-yu season when the East Asian summer monsoon marches northward (Du et al., 2014; Li et al., 2020). Enhanced southwesterlies associated with the LLJ formation act to transport water vapor from southern China to central China, strengthen low-level lifting, and generate convective instability to the south of the mei-yu front (Chen et al., 2017; Luo et al., 2017; Xue et al., 2018; Xia et al., 2021; Luo and Du, 2023). These conditions are favorable for the growth of mesoscale convective systems at the northern terminus of LLJs often resulting in the production of heavy rainfall (Sun and Zhai, 1980; Zhao and Zhou, 2001; Wang et al., 2013; Liu et al., 2014; Li and Du, 2021). The climatology study of Du and Chen (2019) (hereafter referred to as DC19) found that LLJs with different heights of maximum wind speed can lead to different rainfall patterns over Southeast and East China via related terrain effects, synoptic disturbances, and moisture transport. Low-level jet (LLJ) occurrences are also related to the interannual variations of the East Asian rainband and play a role in the regional climate (Chen and Yu, 1988; Chen et al., 2006; Wang et al., 2013; Du et al., 2022). Further studies of LLJs and their associated impacts have the potential to yield insight and valuable implications for understanding extreme heavy rainfall and climate variations over East Asia.
Low-level jets (LLJs) repeatedly occur in southern China for days, indicating that their formation may be related to synoptic-scale variations. He et al. (2016) showed that LLJs are usually established in the northwestern flank of the western Pacific subtropical high (WPSH). A strengthened WPSH accompanied by a deepened westerly trough may enhance the background low-level winds for LLJ formation (Sun and Dell'osso, 1985). Low-level jets (LLJs) also prefer to form at the southeastern flank of low-pressure systems, such as within the southwest vortexes in the Sichuan basin (Wang et al., 2003, Zhang et al., 2014). Some previous studies noted that southwesterly LLJs tend to extend to the south of the mei-yu front (Chou et al., 1990; Sun and Zhang, 2012; Fu et al., 2019), and are established by low-pressure systems in the frontal zone as a key part of the secondary frontal circulation (Ding, 1994; Qian et al., 2004; Liu et al., 2008). Such synoptic-scale variations could strengthen the horizontal pressure gradient, yielding increases in the daily-mean geostrophic winds for LLJ formation (Zeng et al., 2022). Therefore, the LLJ formation is closely related to the different types of synoptic-scale disturbances, indicating diversity in the formation processes of LLJs. This calls for us to distinguish among different synoptic-scale disturbances to clarify the physical processes governing LLJ formation.
The LLJs over southern China feature a pronounced diurnal cycle with wind speed maximums occurring after midnight into early morning (Zhang et al., 2006; Du et al., 2014, 2015; DC19). Such nocturnal LLJs are associated with a clockwise rotation of the diurnal deviation of the winds (mostly the ageostrophic components) (He et al., 2016; Chen, 2020; Zeng et al., 2022). The formation of nocturnal LLJs can express themselves as a response of low-level winds to diurnal thermal forcing, as a result of a boundary-layer inertial oscillation arising from the decay of turbulence at sunset (Blackadar, 1957; Holton, 1967; Du and Rotunno, 2014; Parish, 2017; Luo and Du, 2023). Recent studies have noted that the diurnal amplitudes of southwesterly winds vary in different events of LLJs over southern China (Xue et al., 2018; Liu et al., 2022; Zeng et al., 2022). The diurnal amplitude of the winds corresponds to the differing strengths of daytime heating in the boundary layer over the landmass of southern China, which is regulated by a variety of synoptic-scale disturbances. As indicated above, the diurnal thermal forcing should play a role in LLJ formation, and this role may be evaluated by the differences in the diurnal amplitude of the winds. In addition to analyzing the variations of synoptic-scale disturbances associated with daily LLJ strength, performing statistical analysis on nocturnal LLJs with different diurnal amplitudes will further help improve our understanding of their formation.
Previous studies, including DC19, have examined the climatology of LLJs and their impact on rainfall over southern China. However, LLJ formation can be diverse in different events, which may be related to the joint impact of synoptic-scale disturbances and diurnal thermal forcing. In this study, we attempt to objectively identify the different types of LLJ formation and to clarify their governing physical processes over southern China in the mei-yu season. We pay attention to the enhancement of low-level winds (including their daily mean and diurnal amplitude) on the day of LLJ formation compared to the day before. The goal is to clarify the influence of different synoptic-scale disturbances and diurnal thermal forcings on the two components of low-level wind variations (daily mean and diurnal amplitude). The remainder of this paper is organized as follows. Section 2 introduces the data and methods used in this study. Section 3 presents the variations of low-level winds during LLJ formation. We illustrate the diversity in enhanced low-level winds for the different types of LLJ formation in section 4. In section 5, we examine the physical processes governing the wind variations in the different types of LLJ formation, with emphasis on the synoptic-scale disturbances and diurnal thermal forcing related to increases in the daily mean and diurnal amplitude of low-level winds, respectively. Finally, the conclusion and discussions are given in section 6.
-
To analyze the LLJ formation and related atmospheric conditions, we used the fifth generation reanalysis data of ERA5 from the European Centre for Medium-Range Weather Forecasts (Hersbach et al., 2020). The ERA5 reanalysis has a horizontal spatial resolution of 0.25° × 0.25° and a 1-h time interval with 37 vertical levels. The high-resolution ERA5 dataset well represents the diurnal cycles of winds over southern China compared to other reanalysis data (DC19; Zeng et al., 2022). The period of ERA5 reanalysis used in the present study is from June to July for 1989–2018. June and July are considered as the mei-yu season in southern China. The diurnal cycle is estimated from 1200 LST (LST = UTC + 8) to 1100 LST of the next day since diurnal variations are usually regulated by daytime heating in the boundary layer (Chen, 2020). The four synoptic hours 1400, 2000, 0200, and 0800 LST denote afternoon, evening, midnight, and morning, respectively. Note that, the southerly wind over southern China in the ERA5 reanalysis data exhibits a decrease from 1700–1800 LST and 0500–0600 LST because of the 12-h cycle of data assimilation. Following Chen (2020), the daily mean is calculated by an average of 0800 LST and 2000 LST when the radiosonde observations are assimilated in ERA5 to better describe the diurnal cycle of wind over southern China. The diurnal deviation is estimated as the 6-h increase from 2000 LST to the following 0200 LST (Chen et al., 2021; Zeng et al., 2022). It is noted that the surface pressure averaged over southern China is 1010 hPa during this period. To approximate the near-surface layer, we used the commonly accepted approximation of 1000 hPa.
-
Following DC19, we employ objective criteria to identify the occurrence of an LLJ. First, the maximum wind speed below 700 hPa must be larger than 10 m s–1. Second, the wind speed must decrease by at least 3 m s–1 from wind maximum upward to the next wind minimum below 600 hPa. We defined the LLJ events of summer monsoon using the ERA5 reanalysis data if the LLJ criterion is satisfied in more than 40% of the grid points of southern China (23°–31°N, 107°–117°E) and the averaged meridional component is characterized by the southerlies. To facilitate the analyses, we defined the day of LLJ formation (Day 0) when an LLJ event is established, while the day before is named as Day –1 (without LLJs). A total of 171 LLJ-formation events were identified in 30 years from 1989–2018, with an average of 5.7 events per year. We focus on the increase of low-level winds on Day 0, compared to that on Day –1. The low-level winds were decomposed into increments of daily mean and diurnal amplitude from Day –1 to Day 0.
-
The Self-Organizing Map (SOM) was used to analyze the different types of synoptic-scale patterns occurring during the days of LLJ formation. The SOM algorithm is an artificial neural network based on unsupervised learning and acts as an effective method for feature extraction and classification (Kohonen, 1998, 2013). The SOM method, compared to the empirical orthogonal function (EOF) technique, performs well in extracting nonlinear features (Liu et al., 2006). The SOM can extract the representative patterns and it is widely applied for categorizing the synoptic-scale patterns in climate and meteorological studies (e.g., Liu and Weisberg, 2011; Liu et al., 2016; Park et al., 2021). The SOM technique is detailed in Johnson et al. (2008).
In this study, we conducted the SOM analysis on the 850-hPa geopotential height at Day 0 to obtain the major types of synoptic-scale patterns in relation to the daily wind variations of LLJs. The domain of SOM analysis is chosen as the southern China and its surrounding area (18°–35°N, 100°–128°E). Node arrangement is a crucial parameter in the SOM analysis (Johnson, 2013; Rousi et al., 2015). We conducted a test run using a trial-and-error approach, as in previous studies (Nigro and Cassano, 2014; Jung et al., 2019). We also evaluated the suitability of node selection by checking the objective quantization error and the topological error (Liu et al., 2016). As a result, 2 × 2 nodes (types) are optimal for distinguishing the synoptic-scale patterns of the LLJs. We note that the 850-hPa geopotential height, which lies beneath the terrain of the eastern Tibetan Plateau, is estimated in the global reanalysis. However, our sensitivity tests show that we obtained the same results of SOM analysis even when setting the data there as an undefined value. Therefore, we concluded that this issue does not change our conclusions.
-
In this section, we examined the spatiotemporal variations of low-level winds with emphasis on their change from Day –1 to Day 0. Figures 1a and 1b show an enhancement of the the 850-hPa southwesterly winds over southern China from 8 m s–1 on Day –1 to 10 m s–1 on Day 0. The maximum southwesterly wind speeds on Day 0 are established at the eastern slope of the Yunnan-Guizhou Plateau where the maximum occurrence of LLJs is usually observed (Fig. 1b; Liu et al., 2014). The enhanced horizontal winds are characterized by a large southerly component of 7–8 m s–1 and a relatively small westerly component of 3–4 m s–1. So, we pay more attention to the variation of southerly wind component because of its relatively large magnitude on Day 0. The increment of daily-mean southerly wind from Day –1 to Day 0 is estimated at 1–2 m s–1 (Fig. 1c). The maximum increment is seen at 110°E and 26°N (east of the Yunnan-Guizhou Plateau) and extends to central areas of eastern China. A northerly anomaly is seen in the Sichuan Basin (28°–32°N, 105°–110°E), which is located immediately to the north of enhanced southerlies. These changes in wind patterns are closely related to the synoptic-scale disturbances which will be discussed in sections 4 and 5.
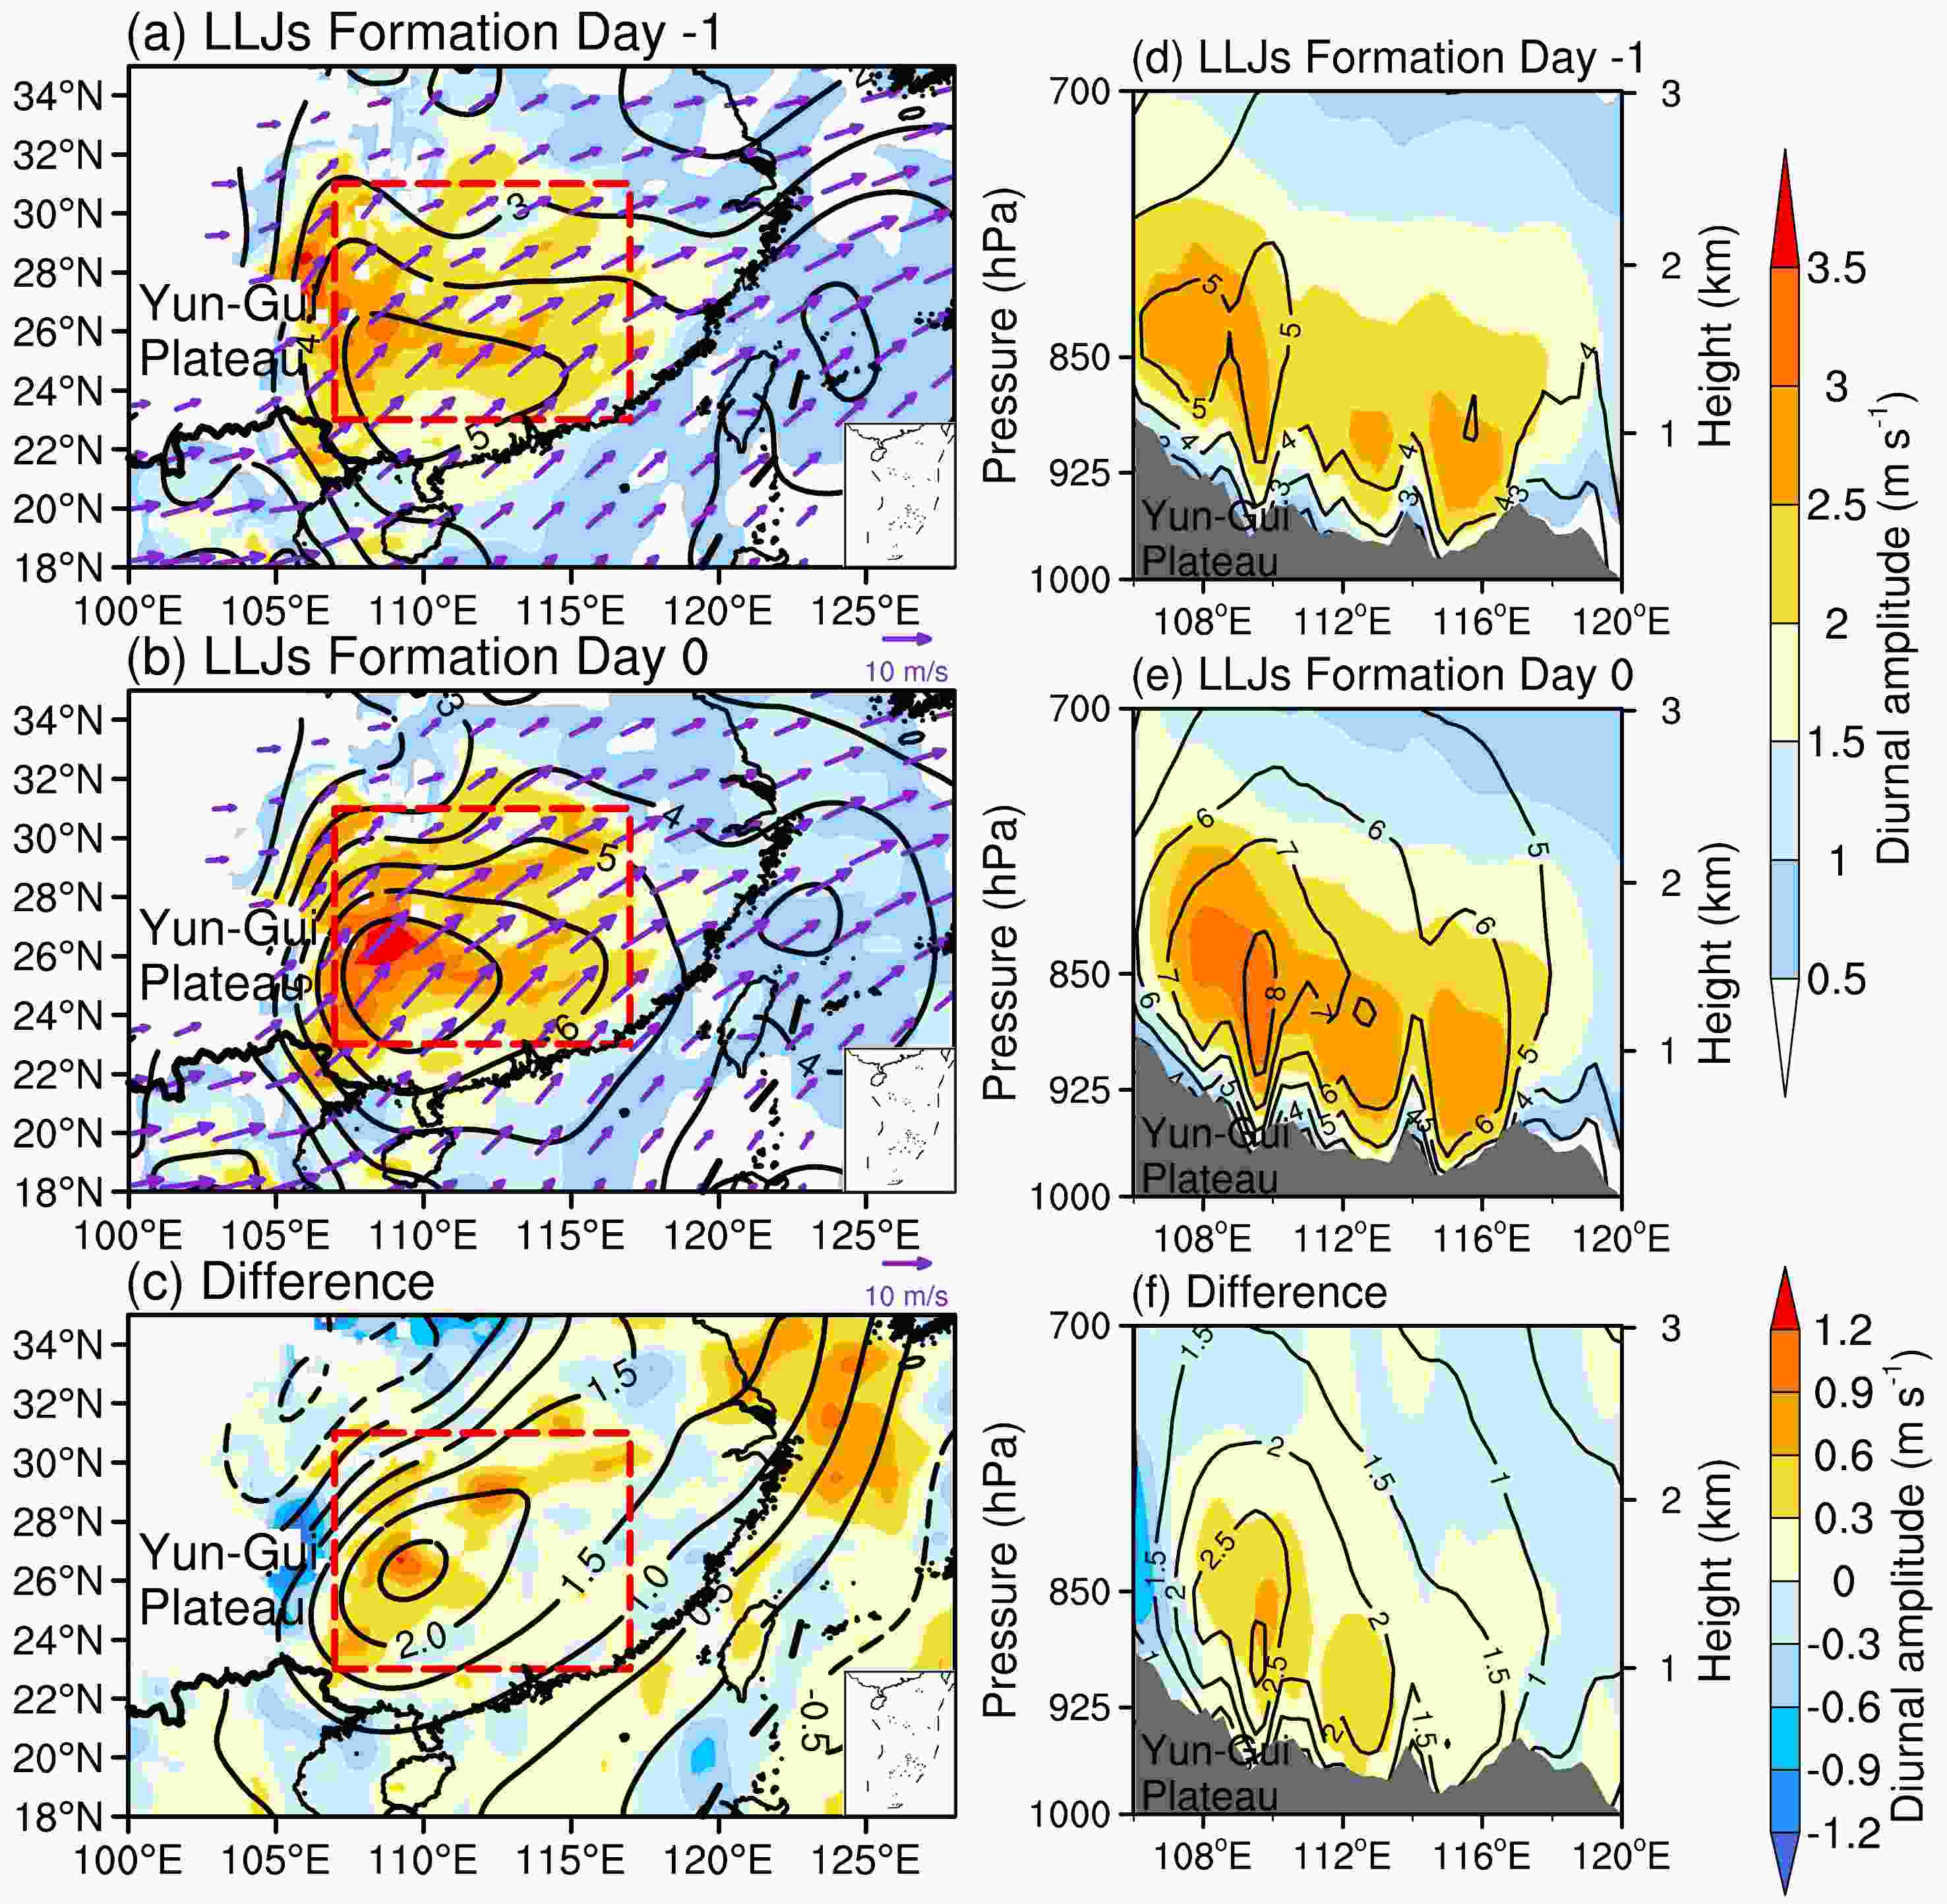
Figure 1. Daily-mean meridional wind (m s–1, black contours), diurnal amplitude (0200 LST minus 2000 LST) of meridional wind (m s–1, shading), and 850-hPa horizontal winds averaged from 0200 LST to 0800 LST (m s–1, vectors), which are composited on (a) Day –1 and (b) Day 0. (c) Differences in the daily-mean meridional wind (m s–1, black contours) and diurnal amplitude of meridional wind (m s–1, shading) at 850 hPa between Day –1 and Day 0. Longitude-vertical sections of daily-mean meridional wind (m s–1, black contours) and diurnal amplitude of meridional wind (m s–1, qshading) averaged over 23°–31°N, which are composited on (d) Day –1 and (e) Day 0. (f) Differences in longitude-vertical sections of the daily-mean meridional wind (m s–1, black contours) and diurnal amplitude of meridional wind (m s–1, shading) between Day –1 and Day 0. Red rectangles denote southern China (23°–31°N, 107°–117°E). Grey shadows denote the distribution of terrain height.
The low-level southwesterlies are featured by a large diurnal variation of the southerly component on the land of southern China. The largest diurnal amplitude of 3.5 m s–1 is seen at the east slope of the Yunnan-Guizhou Plateau on Day 0 (Fig. 1b), which accounts for a part of the enhanced wind speed of LLJs. The diurnal amplitude increases by 0.3–0.9 m s–1 from Day –1 to Day 0 (Fig. 1c). The centers of wind diurnal amplitude and its increase during LLJ formation are generally collocated with those of the daily mean at the east slope of the Yunnan-Guizhou Plateau (Figs. 1b, c). Therefore, the combination of enhanced daily mean and diurnal amplitude of meridional wind is a key feature of LLJ formation, leading to the preferred occurrence of nocturnal LLJs in southern China.
Figures 1d and 1e show the longitudinal-vertical sections of meridional wind. Both the daily mean and diurnal amplitude in the lowest 2 km layers are remarkably intensified from Day –1 to Day 0. The daily meridional wind of 6–8 m s–1 is combined with a diurnal amplitude of 2.5–3.5 m s–1 at 107°–117°E on Day 0, resulting in the establishment of a subsynoptic-scale LLJ. The largest diurnal amplitude is seen at the top of the boundary layer [about 1.5 km above the surface; Chen et al. (2014); Allabakash et al. (2017)]. The height of large diurnal amplitude is tilting upward from east to west following the terrain’s elevation. It indicates that the diurnal thermal forcing may play a crucial role in the formation and diurnal variations of LLJs over the large landmass of southern China, which is the focus of this study (Blackadar, 1957; Holton, 1967; Du and Rotunno, 2014). The diurnal amplitude maximizes at three local valleys at 109
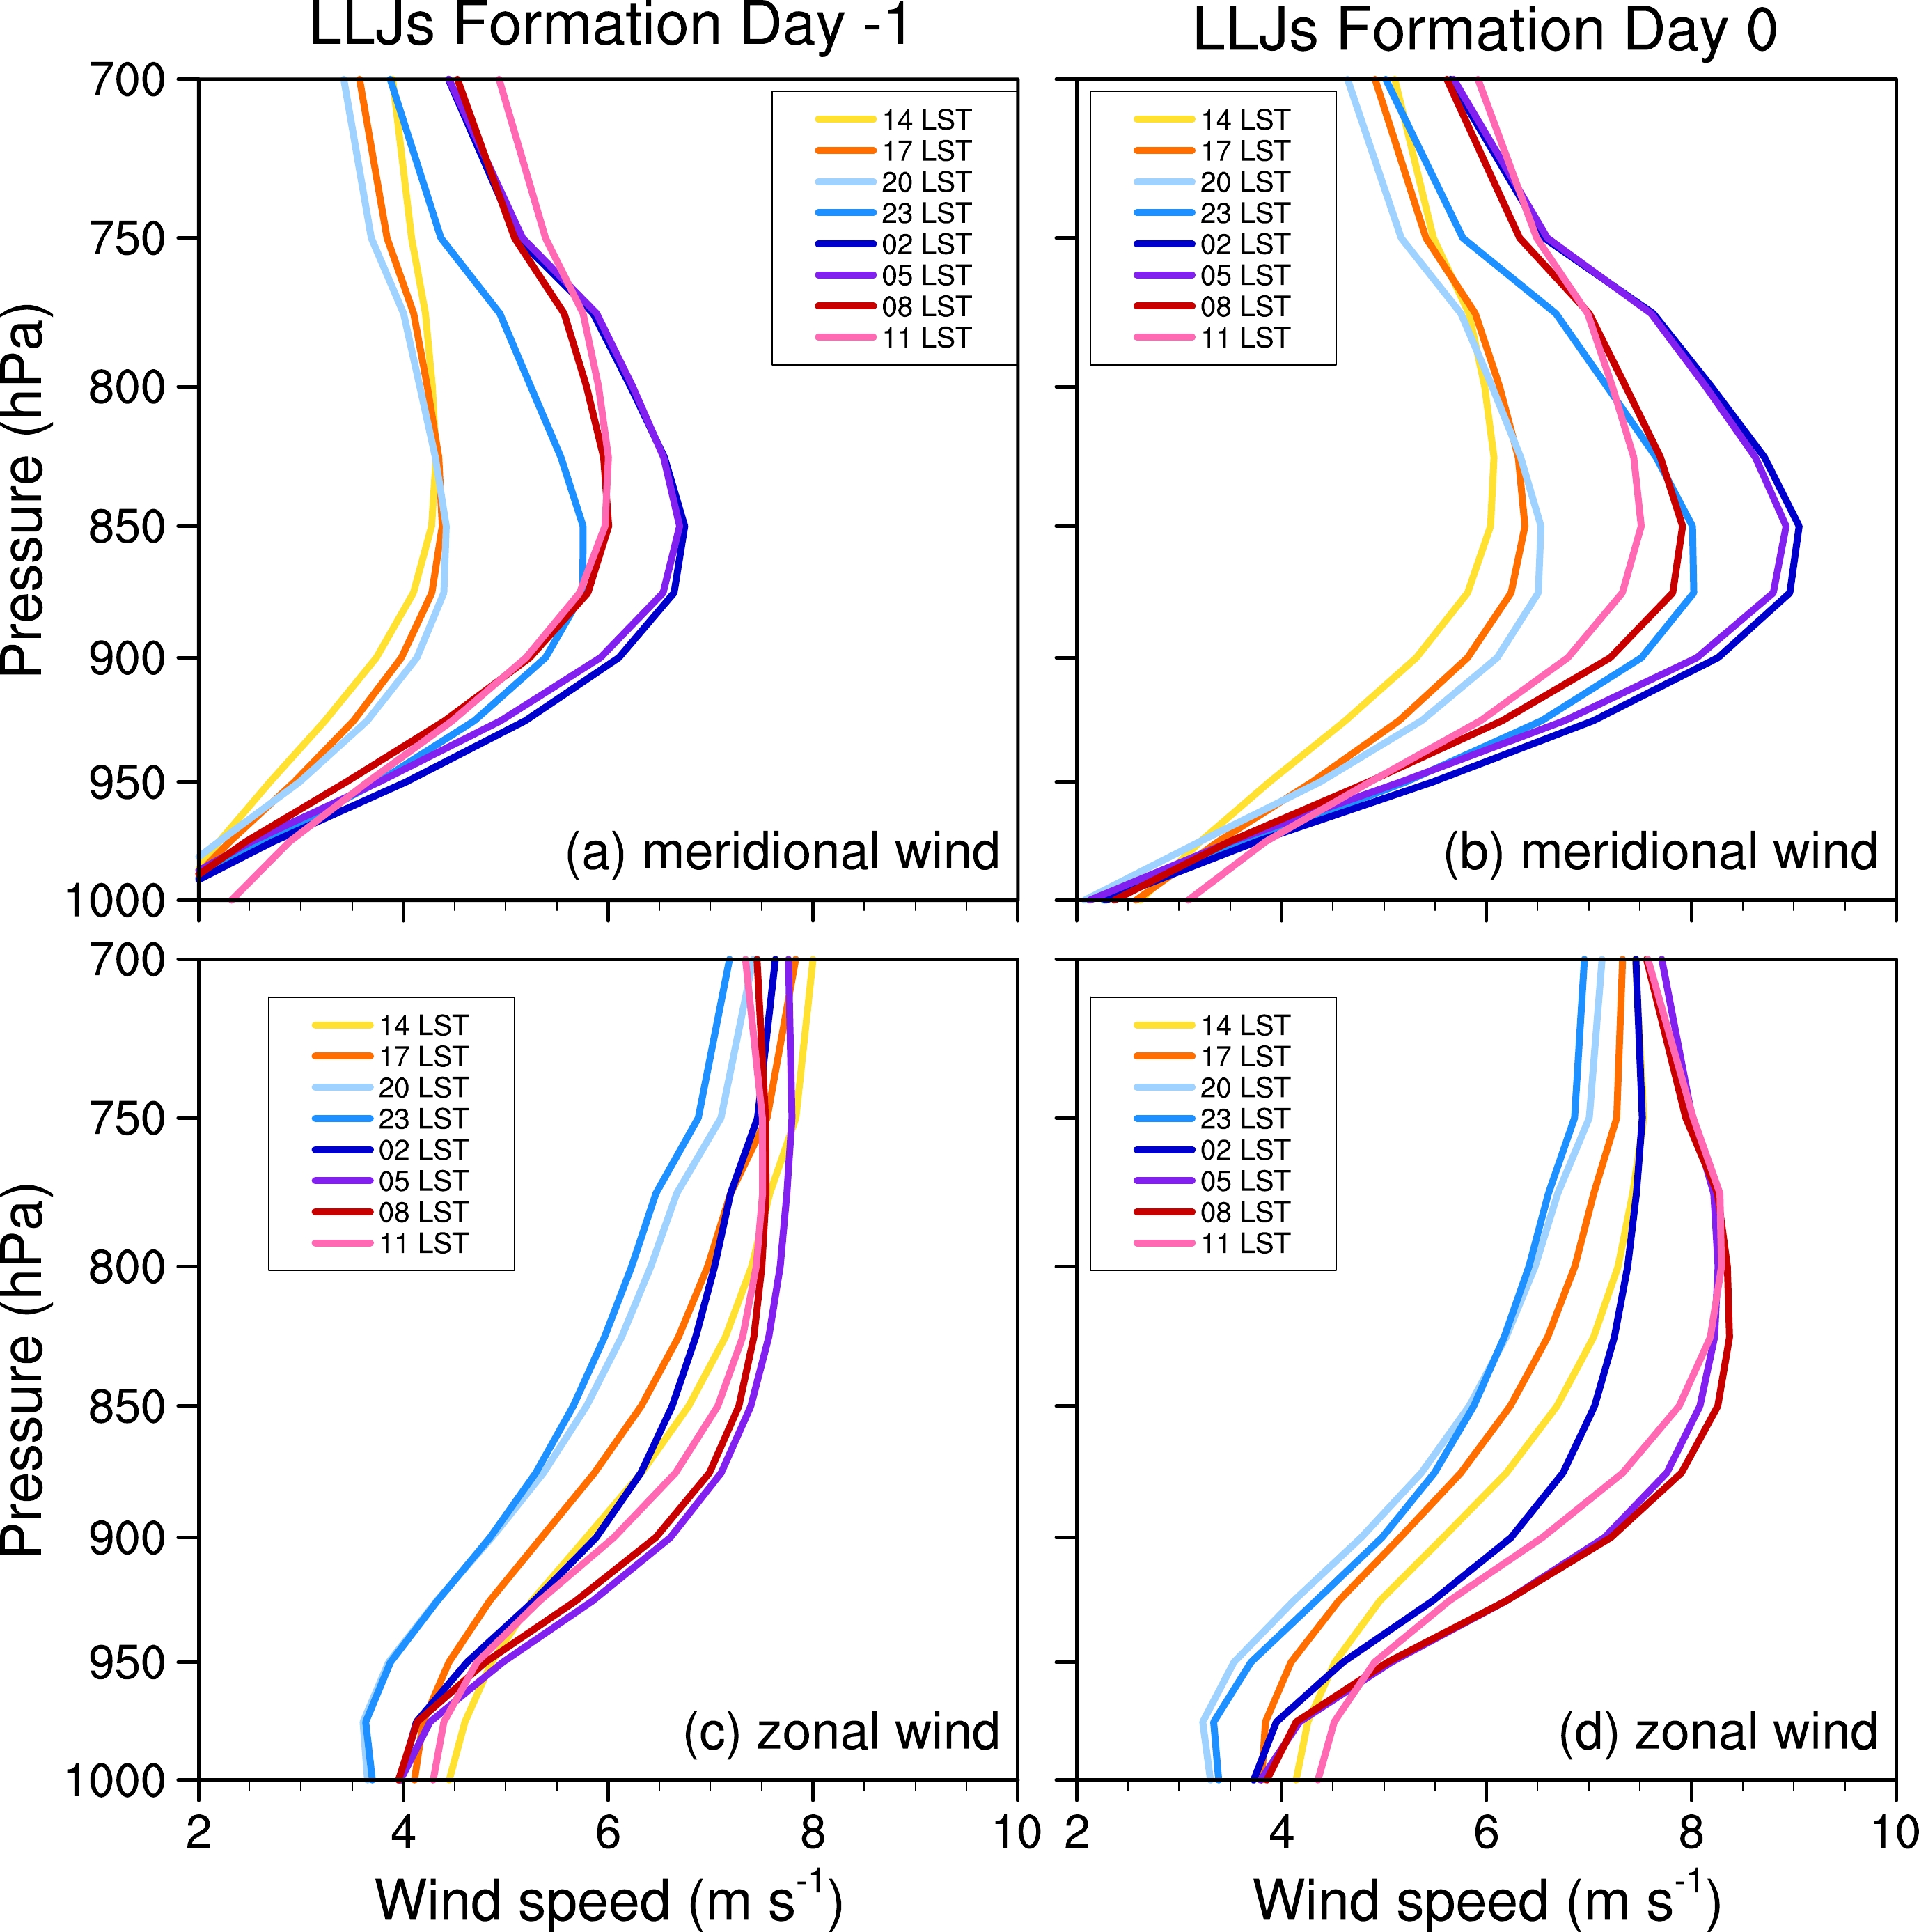
$ ° $ , 113$ ° $ , and 115$ ° $ E, with the largest one at the foothills of the Yunnan-Guizhou Plateau. These features agree with previous studies that have shown the barrier and channeling effects of local terrain can result in local maxima of wind diurnal variations in the valleys between mountain ranges (Chen et al., 2017). Such dynamic effects seem favorable for the mesoscale distributions of LLJs, which are favorable for the growth of MCSs at their northern terminus, though the details of their specific influence on heavy rainfall are beyond the scope of this study. (Du et al., 2015; He et al., 2016; DC19; Zhang et al., 2022).Next, we examine the detailed diurnal variations of low-level winds during the LLJs formation from Day –1 to Day 0. Figures 2a and 2b show the 3-hourly variations of the meridional wind profile. The southerly wind is greatly suppressed at 1400–2000 LST and corresponds to the well-mixed boundary layer due to a strong daytime heating. It increases rapidly at 2300 LST and maximizes at 0200 LST, with the largest incremental increase at 850 hPa. The wind profiles develop a pronounced nose-like structure at 0200 and 0500 LST when the nocturnal LLJs are usually formed. The peak hours (0200–0400 LST) of 850-hPa meridional wind change little from Day –1 to Day 0, while the diurnal amplitude is greatly enhanced and can be comparable to the change in daily mean (Fig. 3). In contrast, the diurnal variations of 700-hPa meridional wind are small and the differences between Day –1 and Day 0 is small as well. So, the daily mean and diurnal variations of meridional wind during LLJ formation are closely related to the changes in the boundary layer.
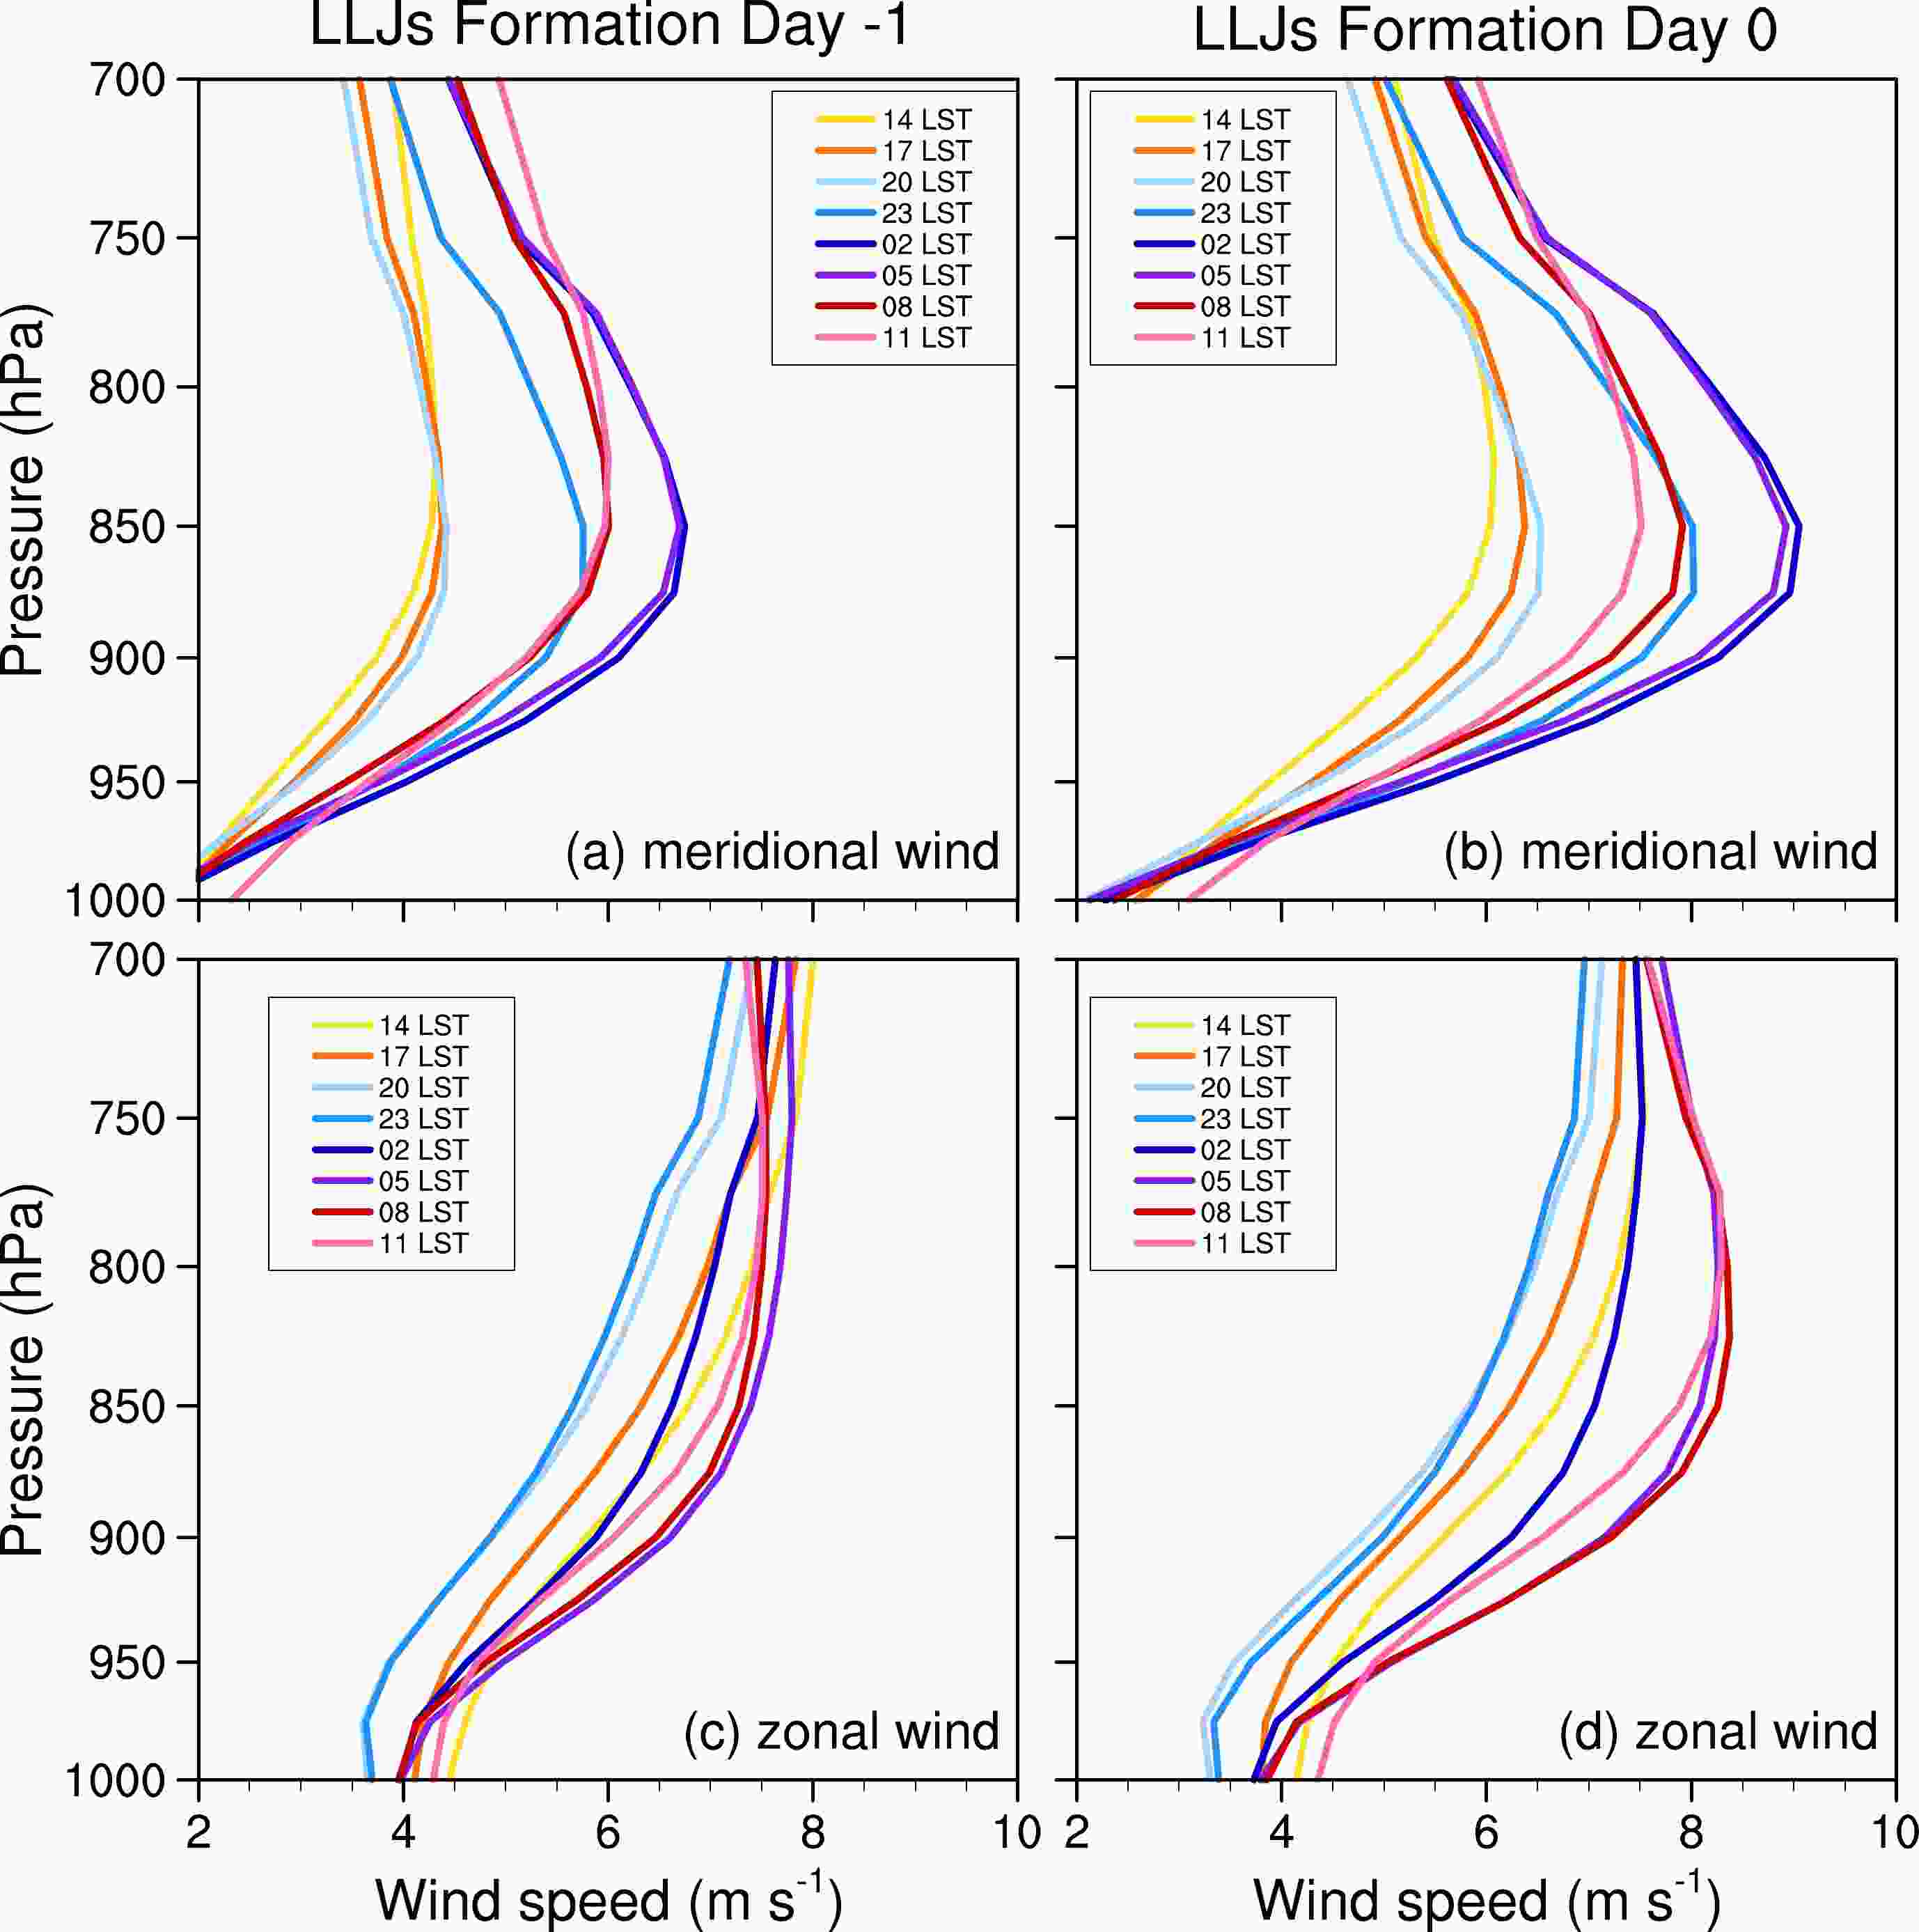
Figure 2. Diurnal cycle of vertical profiles of meridional wind and zonal wind averaged over 23°–31°N, 107°–117°E for (a, c) Day –1 and (b, d) Day 0.
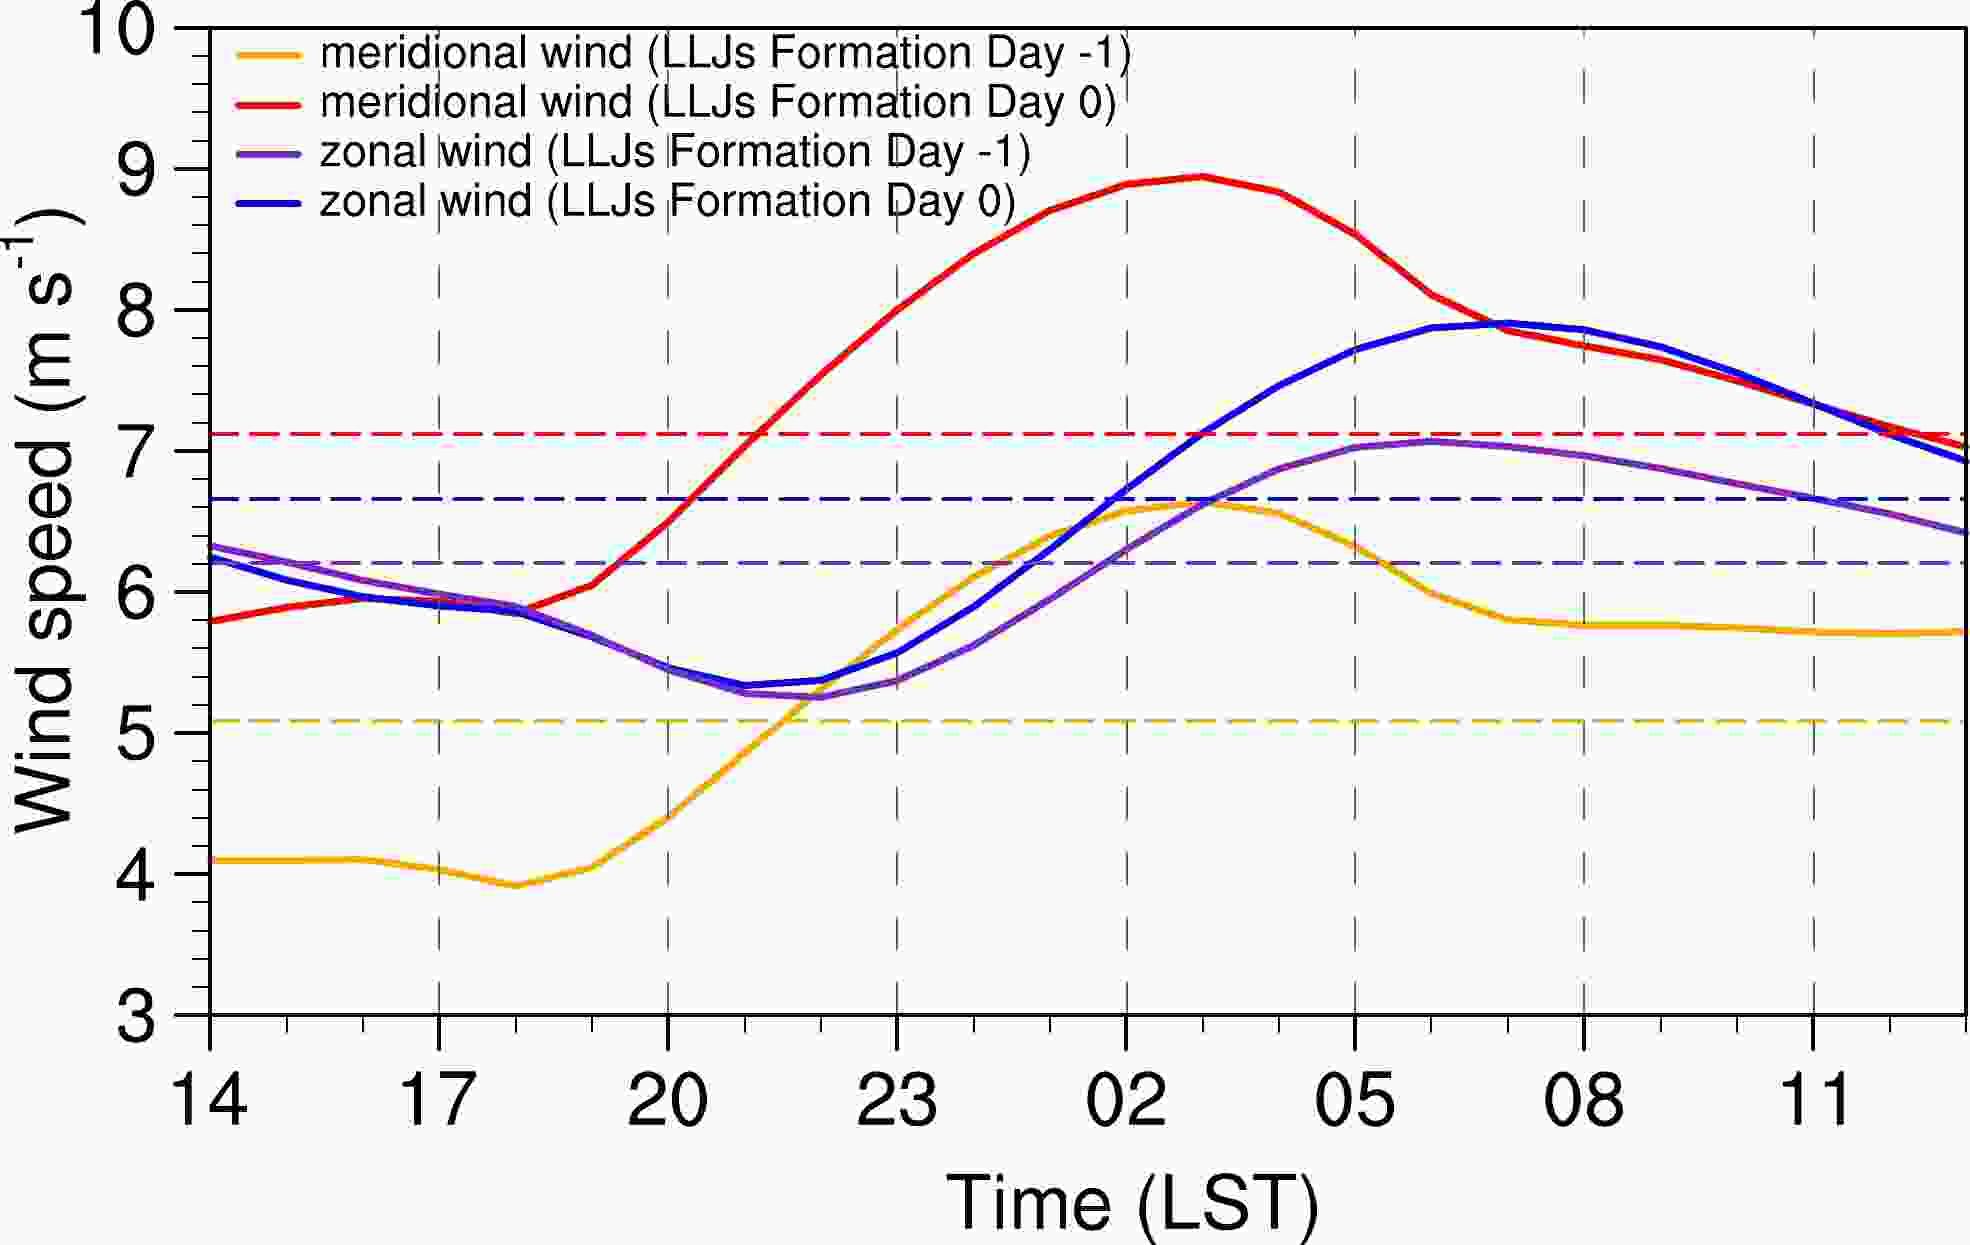
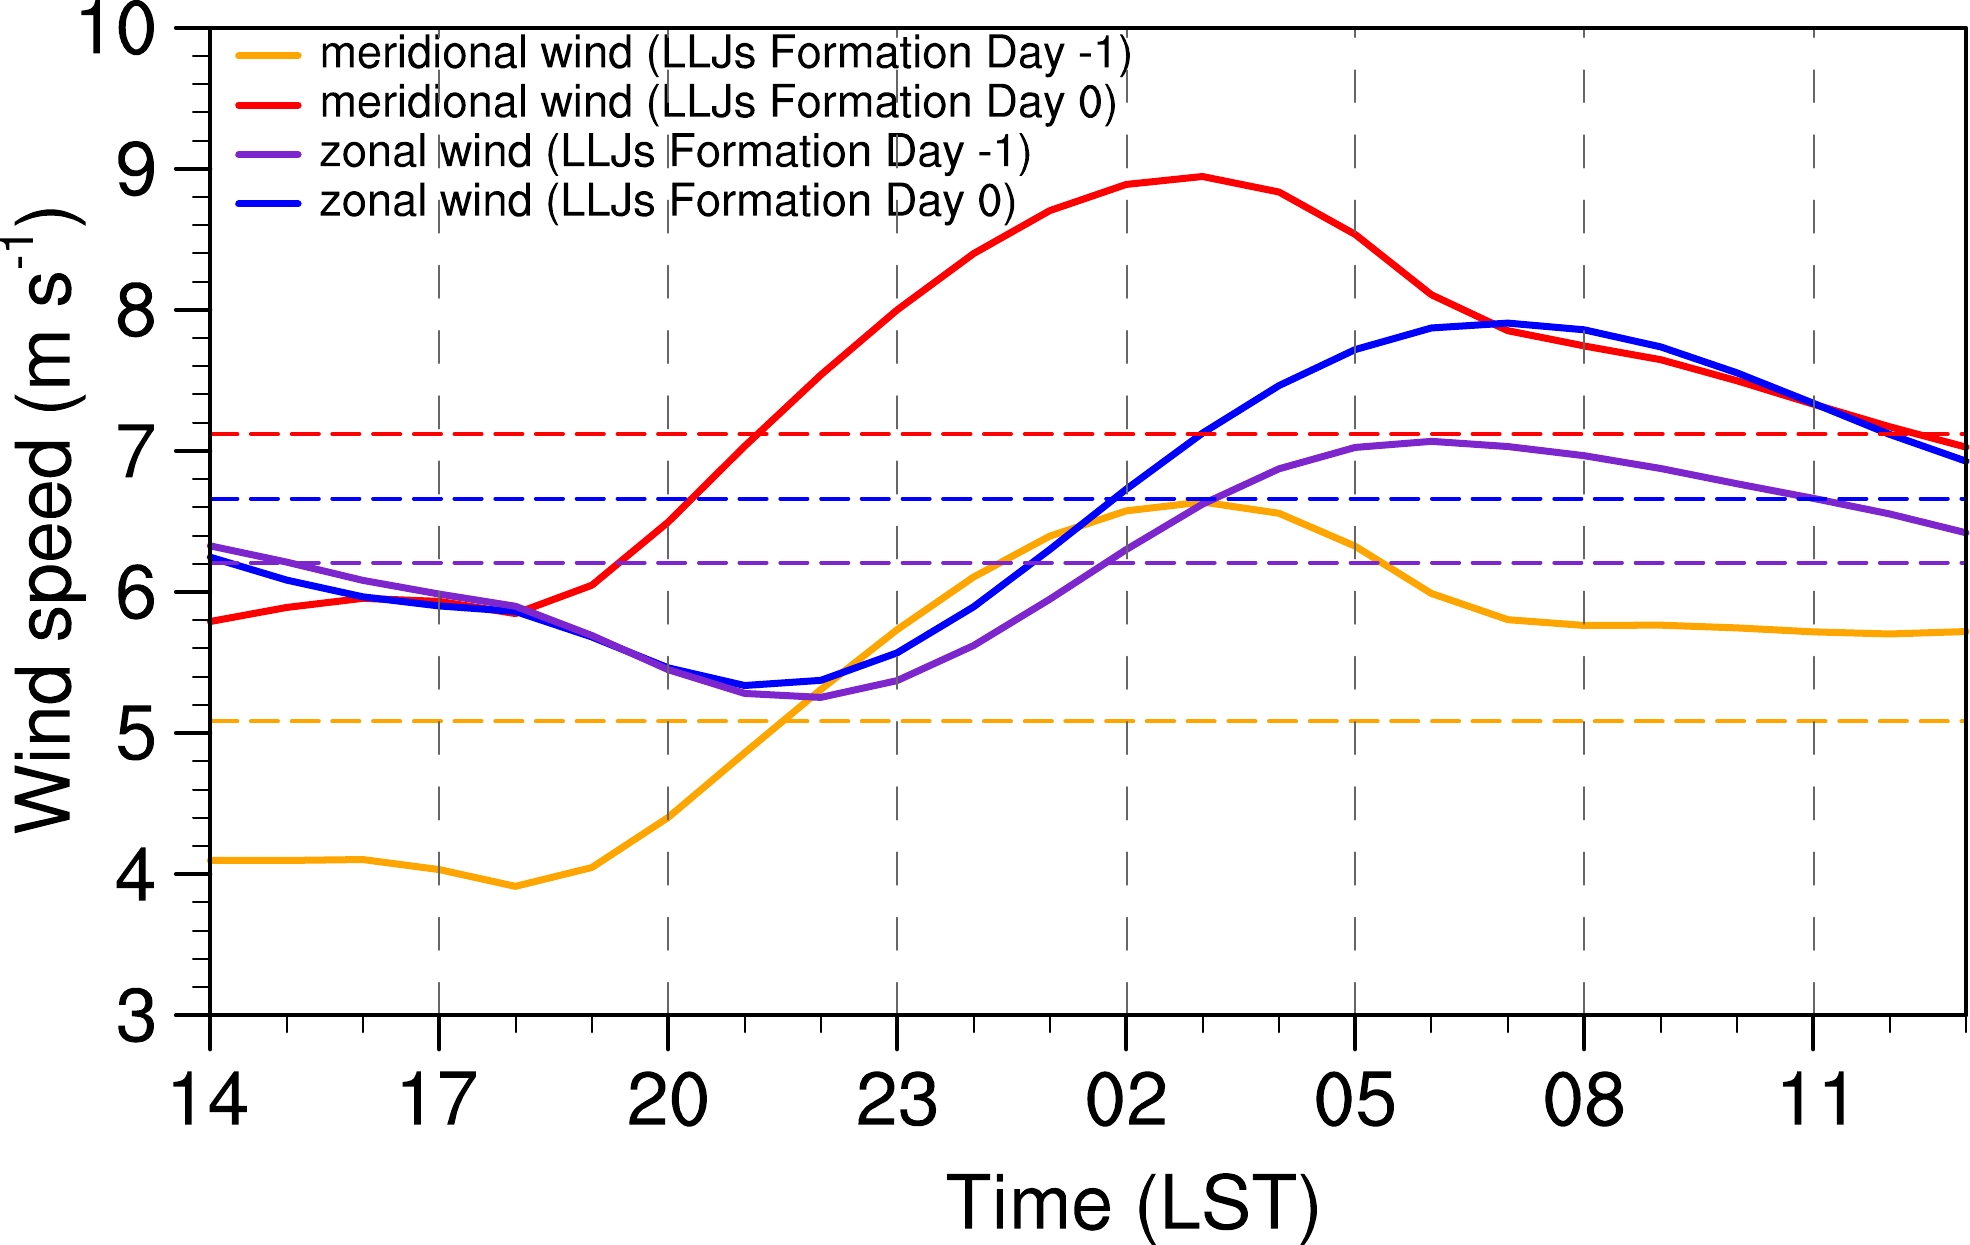
Figure 3. Diurnal cycle of the 850-hPa meridional and zonal wind averaged over 23°–31°N, 107°–117°E for Day –1 (Day 0) are denoted by red and blue (orange and purple) lines, respectively. Dashed lines denote the daily-mean wind.
Figures 2c and 2d show that the zonal wind also undergoes a diurnal variation at the layers below 750 hPa, but its amplitude is smaller than that of meridional wind. The nose-like structure is seen at 850 hPa on Day 0 in Fig. 2d, but it is less pronounced than that in Fig. 2b. Such differences are mainly induced by the advection of meridional momentum away from southern China whichacts to reduce the local change of zonal wind (Zeng et al., 2019). Overall, the increase of zonal wind from Day –1 to Day 0 is smaller than that of meridional wind. The peak hours of zonal wind appear at 0500 or 0800 LST, with a delay of 3–5 hours relative to the meridional wind because of the inertial oscillation (Fig. 3). Moreover, the peak hours on Day 0 have a delay of 1−2 hours compared to Day –1, which may be related to the change in the relative contribution of Blackadar (1957) and Holton (1967) mechanisms. Therefore, the change of meridional wind is pronounced over the LLJ-formation region and has a diurnal phase leading the zonal wind. It contributes to northward moisture transport downstream to central China where it undergoes a clockwise rotation into the zonal wind along the mei-yu front hours later (Ninomiya, 2000; Chen et al., 2017; Zeng et al., 2019).
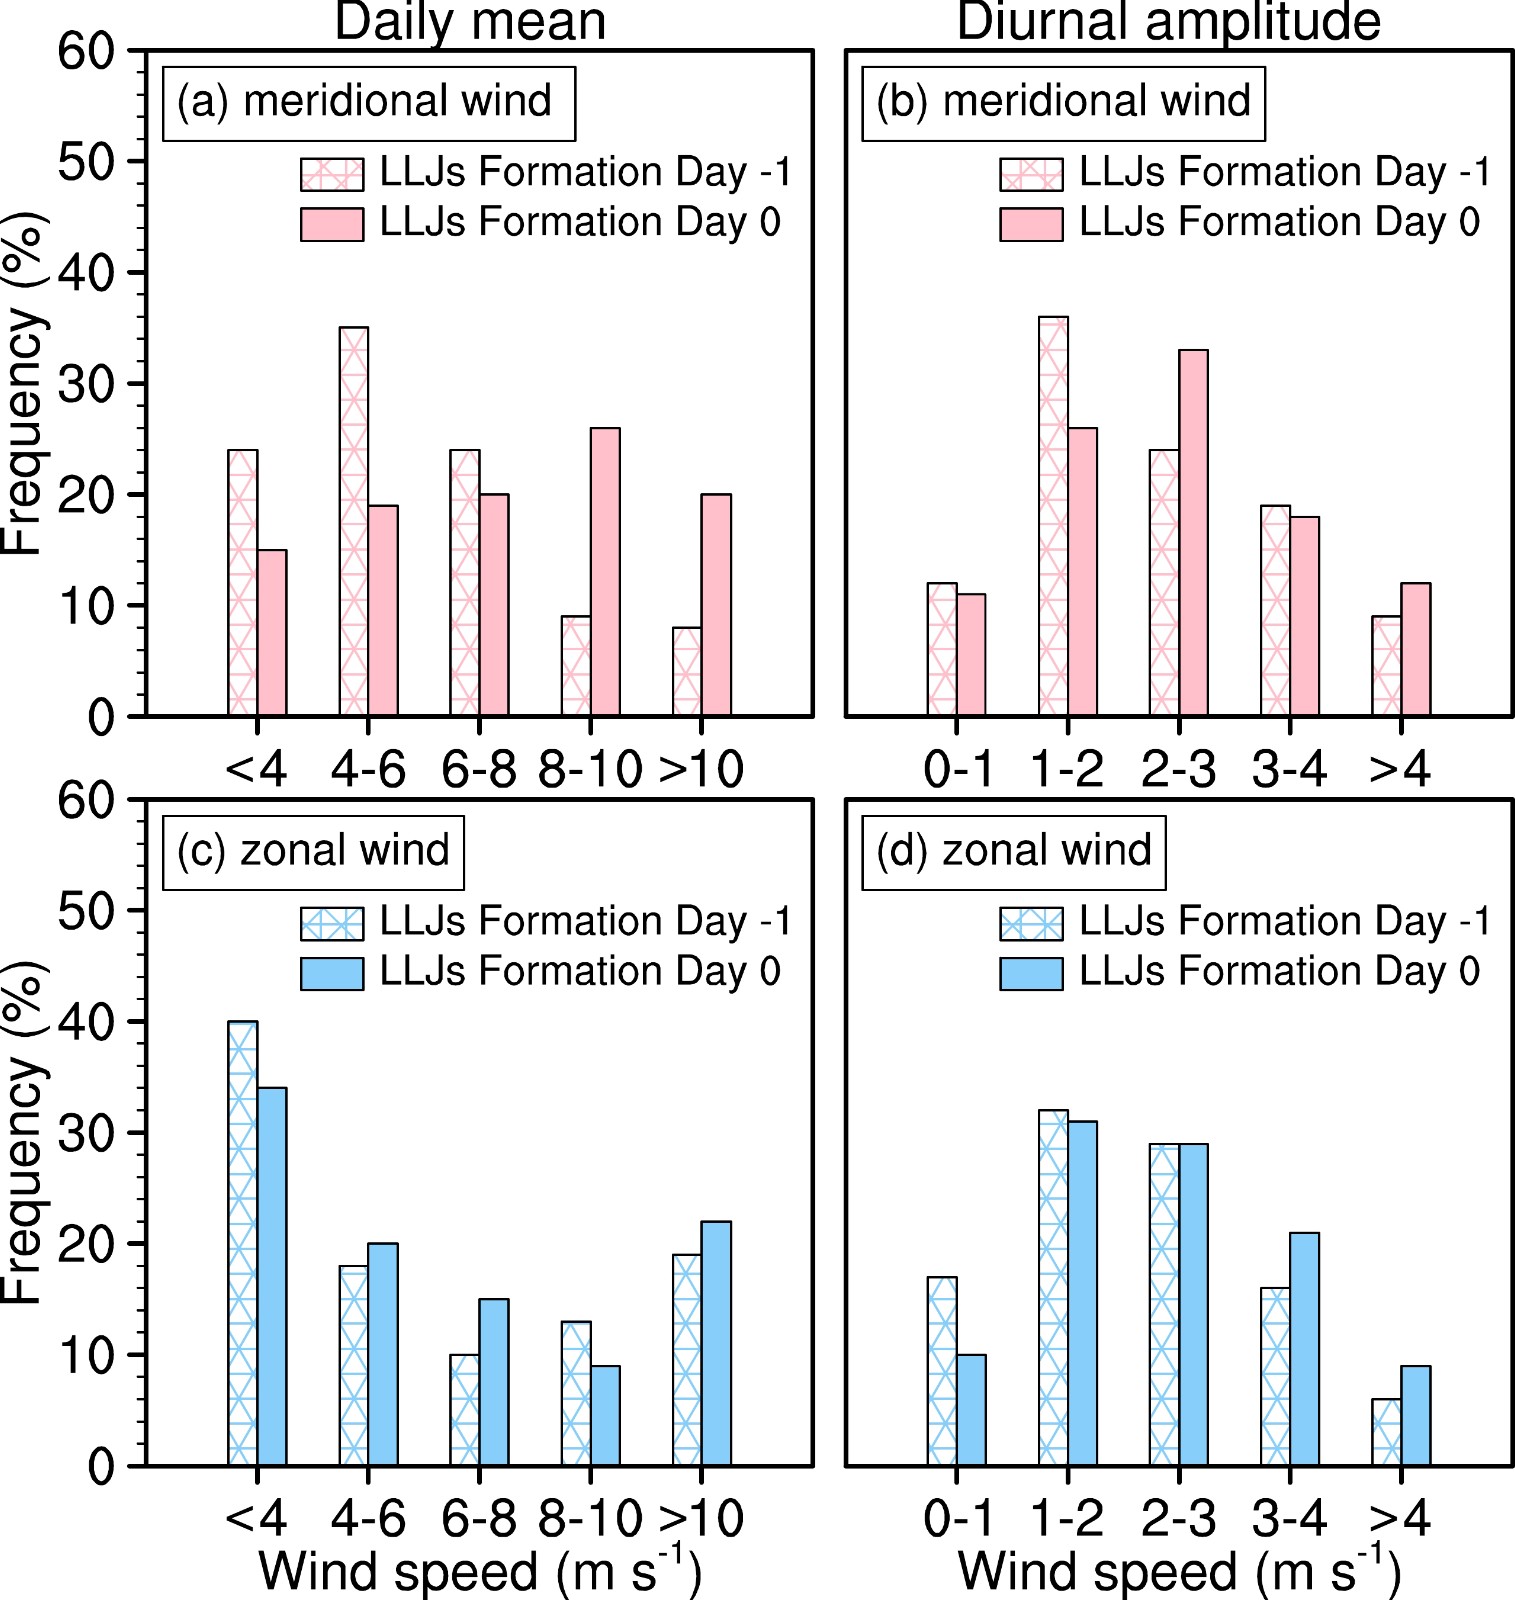
We further examined the increases of meridional and zonal wind components for the LLJ events from Day –1 to Day 0. Figure 4a shows the frequency distributions of daily meridional wind. The daily meridional wind on Day –1 is mostly seen in the range of 4–6 m s–1, with 17% of the events greater than 8 m s–1. The occurrence of meridional wind greater than 8 m s–1 increases to 46% on Day 0. Figure 4b shows that the diurnal amplitude of meridional wind is mainly seen in the ranges of 1–3 m s–1. The largest occurrence on Day –1 appears in the range of 1–2 m s–1, while the largest occurrence on Day 0 is shifted to the range of 2–3 m s–1. In this way, we see a pronounced increase of meridional wind in both daily mean and diurnal amplitude.
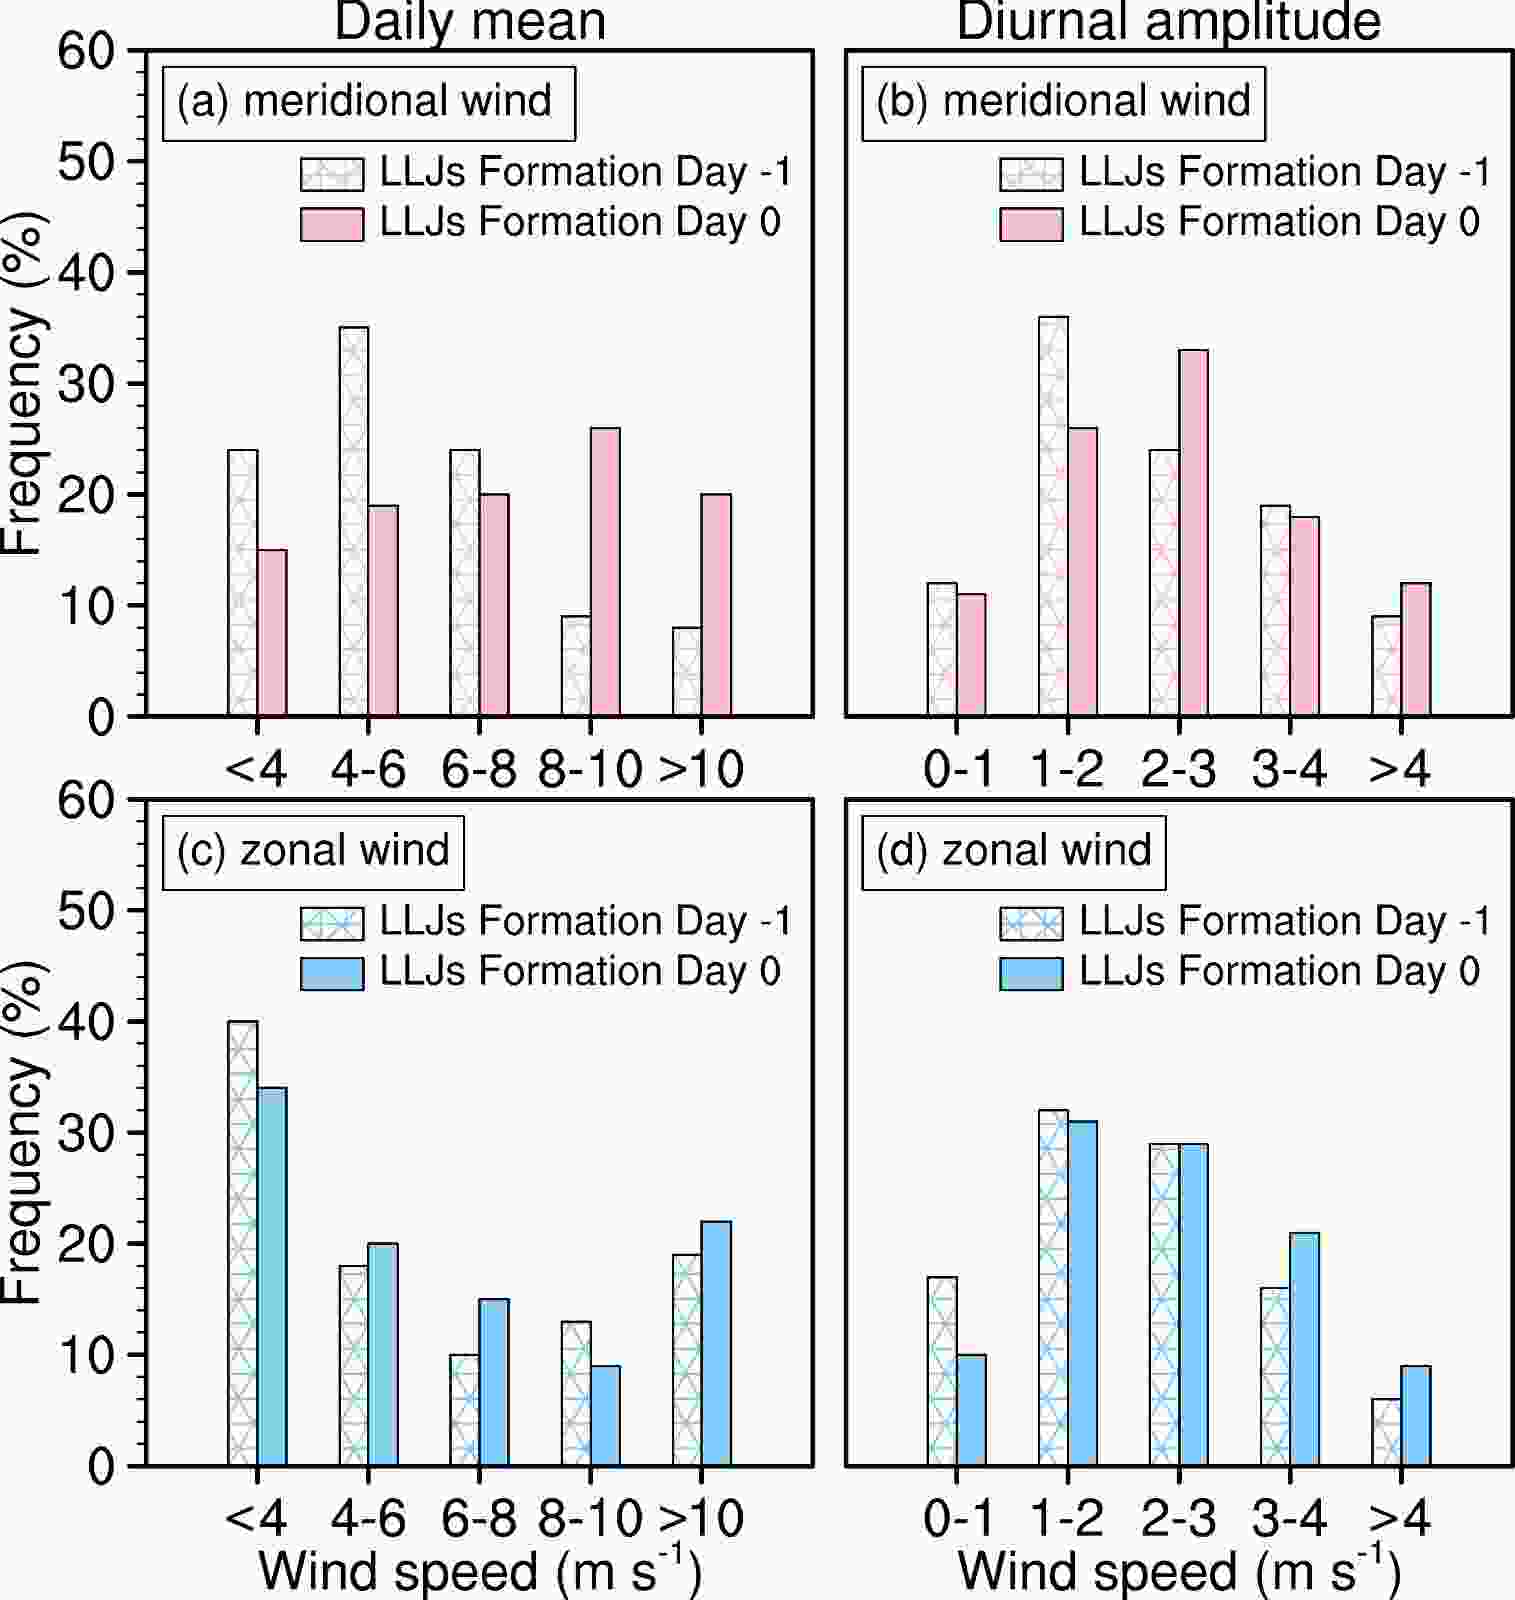
Figure 4. Distribution of the occurrence frequency (%) for the 850-hPa daily-mean (a) meridional wind and (c) zonal wind, and the diurnal amplitude of the (b) meridional wind and (d) zonal wind averaged over 23°–31°N, 107°–117°E for Day –1 and Day 0.
Figure 4c shows that the frequency distributions of daily zonal wind change little from Day –1 to Day 0. In particular, the occurrence of zonal wind speeds greater than 8 m s–1 in Fig. 4c changes less than those in Fig. 4a. Figure 4d shows that the diurnal amplitude of zonal wind is also confined to the ranges of 1–2 m s–1 and 2–3 m s–1 on both Day –1 and Day 0, although a slight increase of occurrence in ranges greater than 3 m s–1 are noted on Day 0. Overall, we see a pronounced change in the frequency distributions of the meridional wind more so than that in zonal wind during LLJ formation. Moreover, the daily meridional wind is enhanced from Day –1 to Day 0 but it has a considerable proportion in each range. Such an enhancement of a wide range of meridional wind speeds range denotes a large diversity in the wind variations of LLJ formation. Therefore, we are motivated to specifically examine the LLJ formation events.
-
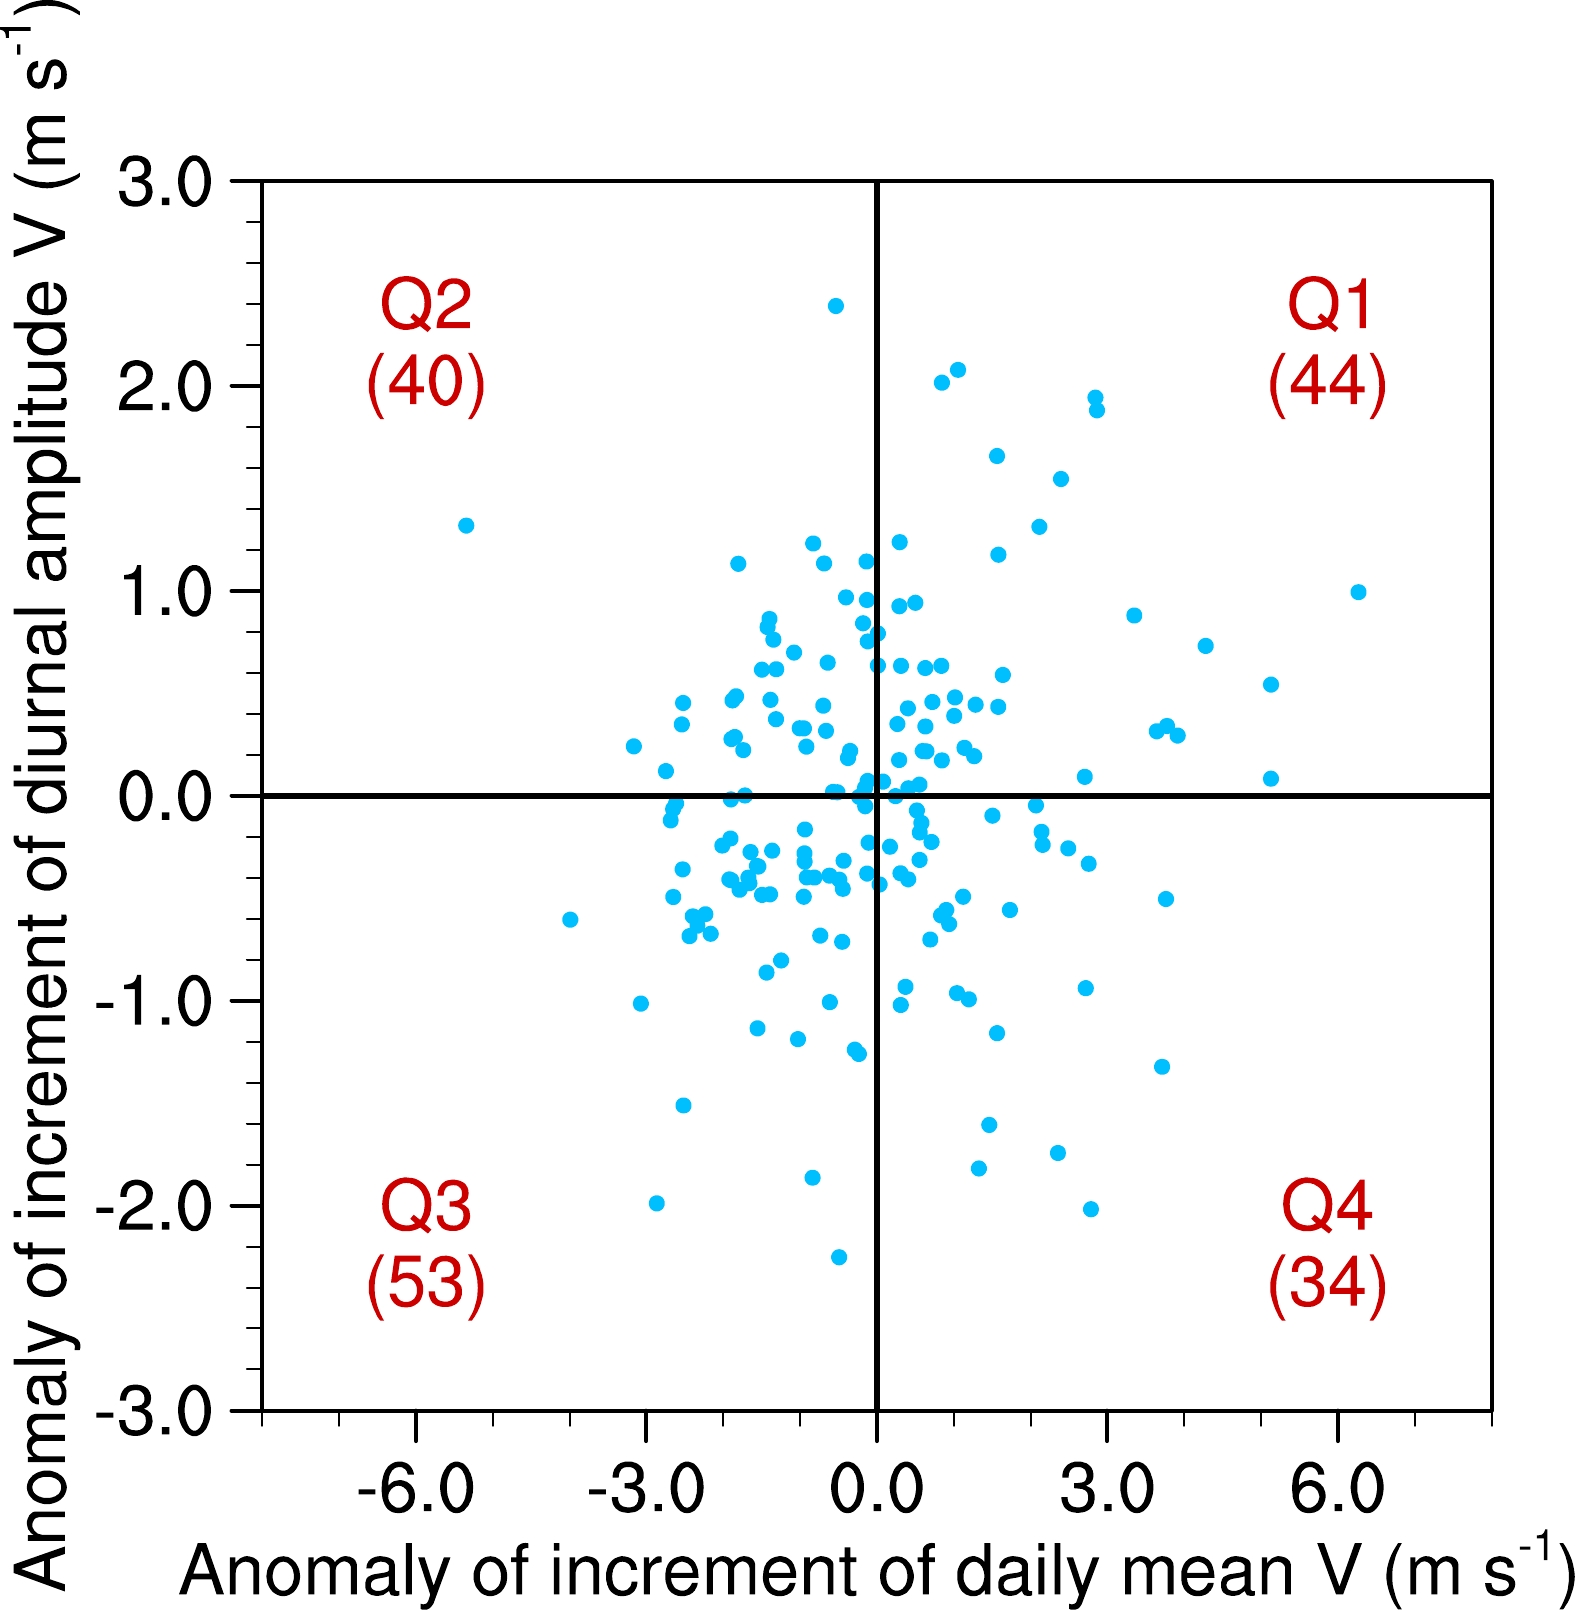
Section 3 shows that LLJ formation is closely related to the intensification of the daily mean and diurnal amplitude components of meridional wind from Day –1 to Day 0. We can estimate the diversity in LLJ formation based on the different increases in these two components. The anomalies of the increment of daily mean and diurnal amplitude were calculated by subtracting the average of 171 events of LLJ formation in the mei-yu season. The wind speed at a given hour can be decomposed into the enhancements of daily-mean value and wind diurnal deviation. The relative intensity of these two components leads to four different types of LLJs. So, the LLJ formation events during 1989–2018 were partitioned into four dynamic quadrants (namely, Q1–Q4) according to the anomalies of the enhancement of daily mean and diurnal amplitude of meridional wind from Day –1 to Day 0. As shown in Fig. 5, the increase of daily mean is dominant in the quadrants to the right (Q1 and Q4) while it is small in the left quadrants (Q2 and Q3). The increase of diurnal amplitude is relatively large in the upper quadrants (Q1 and Q2) while it is small in the bottom quadrants (Q3 and Q4). About 57% of the LLJ formation events are characterized by large or small increases of southerly wind in both the daily mean and diurnal amplitude. These results agree with previous studies in that the strong (weak) wind diurnal amplitude tends to occur in tandem with large (small) background wind speeds (Shapiro et al., 2016; Xue et al., 2018; Chen, 2020).
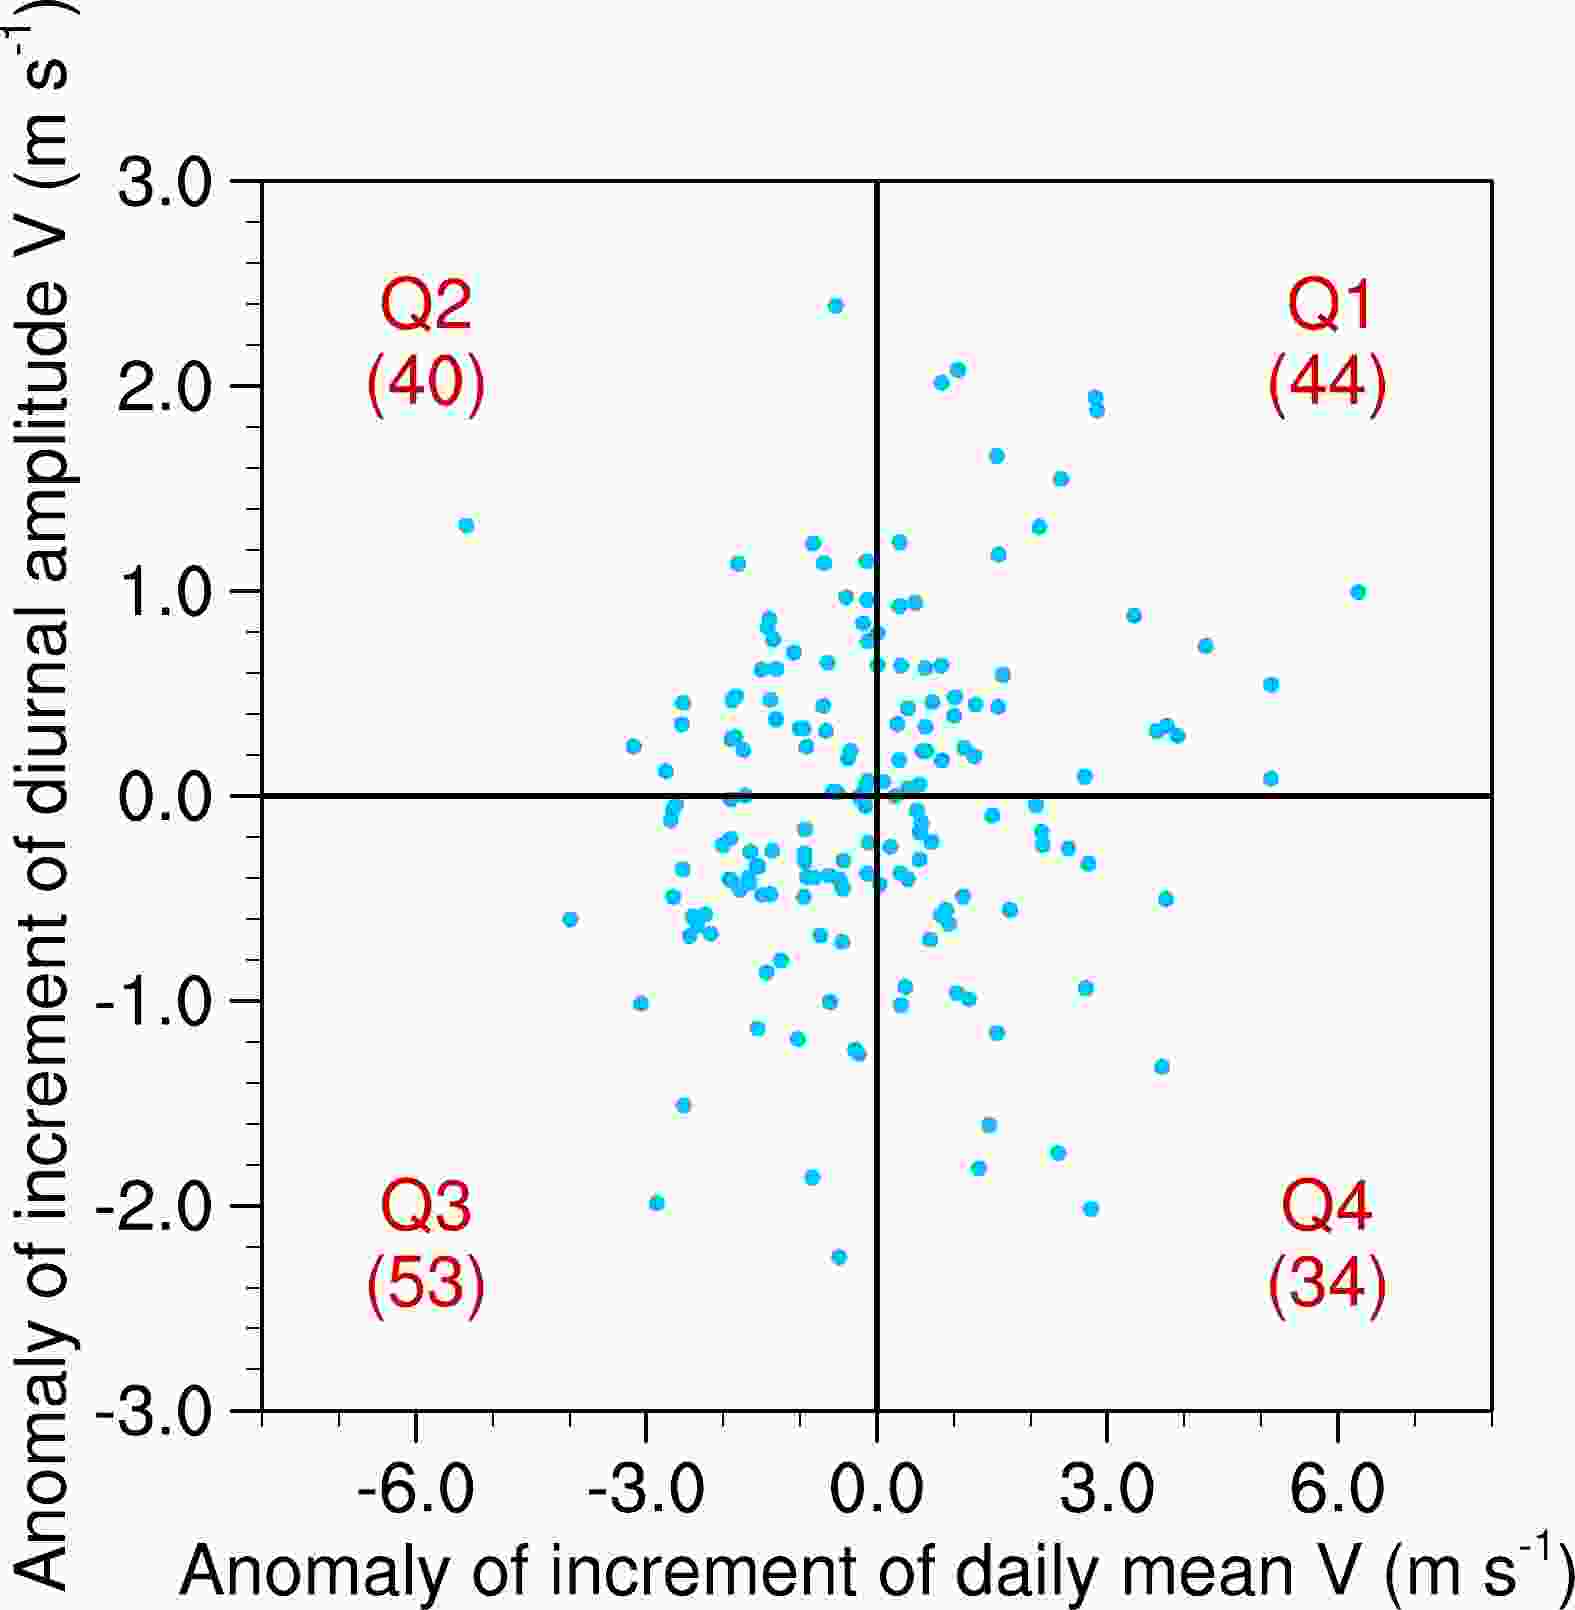
Figure 5. Scatterplot of the incremental anomaly of the daily-mean meridional wind vs. the incremental anomaly of the diurnal amplitude (0200 LST minus 2000 LST) for the meridional wind averaged over 23°–31°N, 107°–117°E.
Figure 6 shows the detailed diurnal variations of four dynamic quadrants during LLJ formation from Day –1 to Day 0. In Q1 (Fig. 6a), the daily-mean meridional wind is enhanced by 4.46 m s–1, i.e., from 4.03 m s–1 on Day –1 (yellow dashed line) to 8.49 m s–1 on Day 0 (red dashed line). The diurnal deviation of meridional wind increases by 1.09 m s–1, i.e., from 2.16 m s–1 on Day –1 to 3.25 m s–1 on Day 0. In Q4 (Fig. 6d), although the daily mean of southerlies increases by 4.04 m s–1 from Day –1 to Day 0 (comparable to Q1), the change of diurnal amplitude is smaller than that in Q1. In addition, the zonal wind changes less than meridional wind in terms of daily mean and diurnal amplitude from Day –1 to Day 0 in both Q1 and Q4. In Q2 (Fig. 6b), the daily-mean meridional wind is less prone to change but the diurnal amplitude of meridional wind has a pronounced incremental change of 1.00 m s–1 from Day –1 to Day 0. Figure 6c shows that both the daily mean and diurnal amplitude of southerlies in Q3 have changed less on Day 0 compared to Day –1. Although the meridional wind does not change much in Q2 and Q3, we can see a pronounced increase in zonal wind from Day –1 to Day 0. In particular, the daily-mean zonal wind in Q3 increases by 0.95 m s–1 from Day –1 to Day 0. It can be seen that the four dynamic quadrants of wind variations are distinguishable from each other; thus, manifesting diversity in the formation of their respective LLJs.
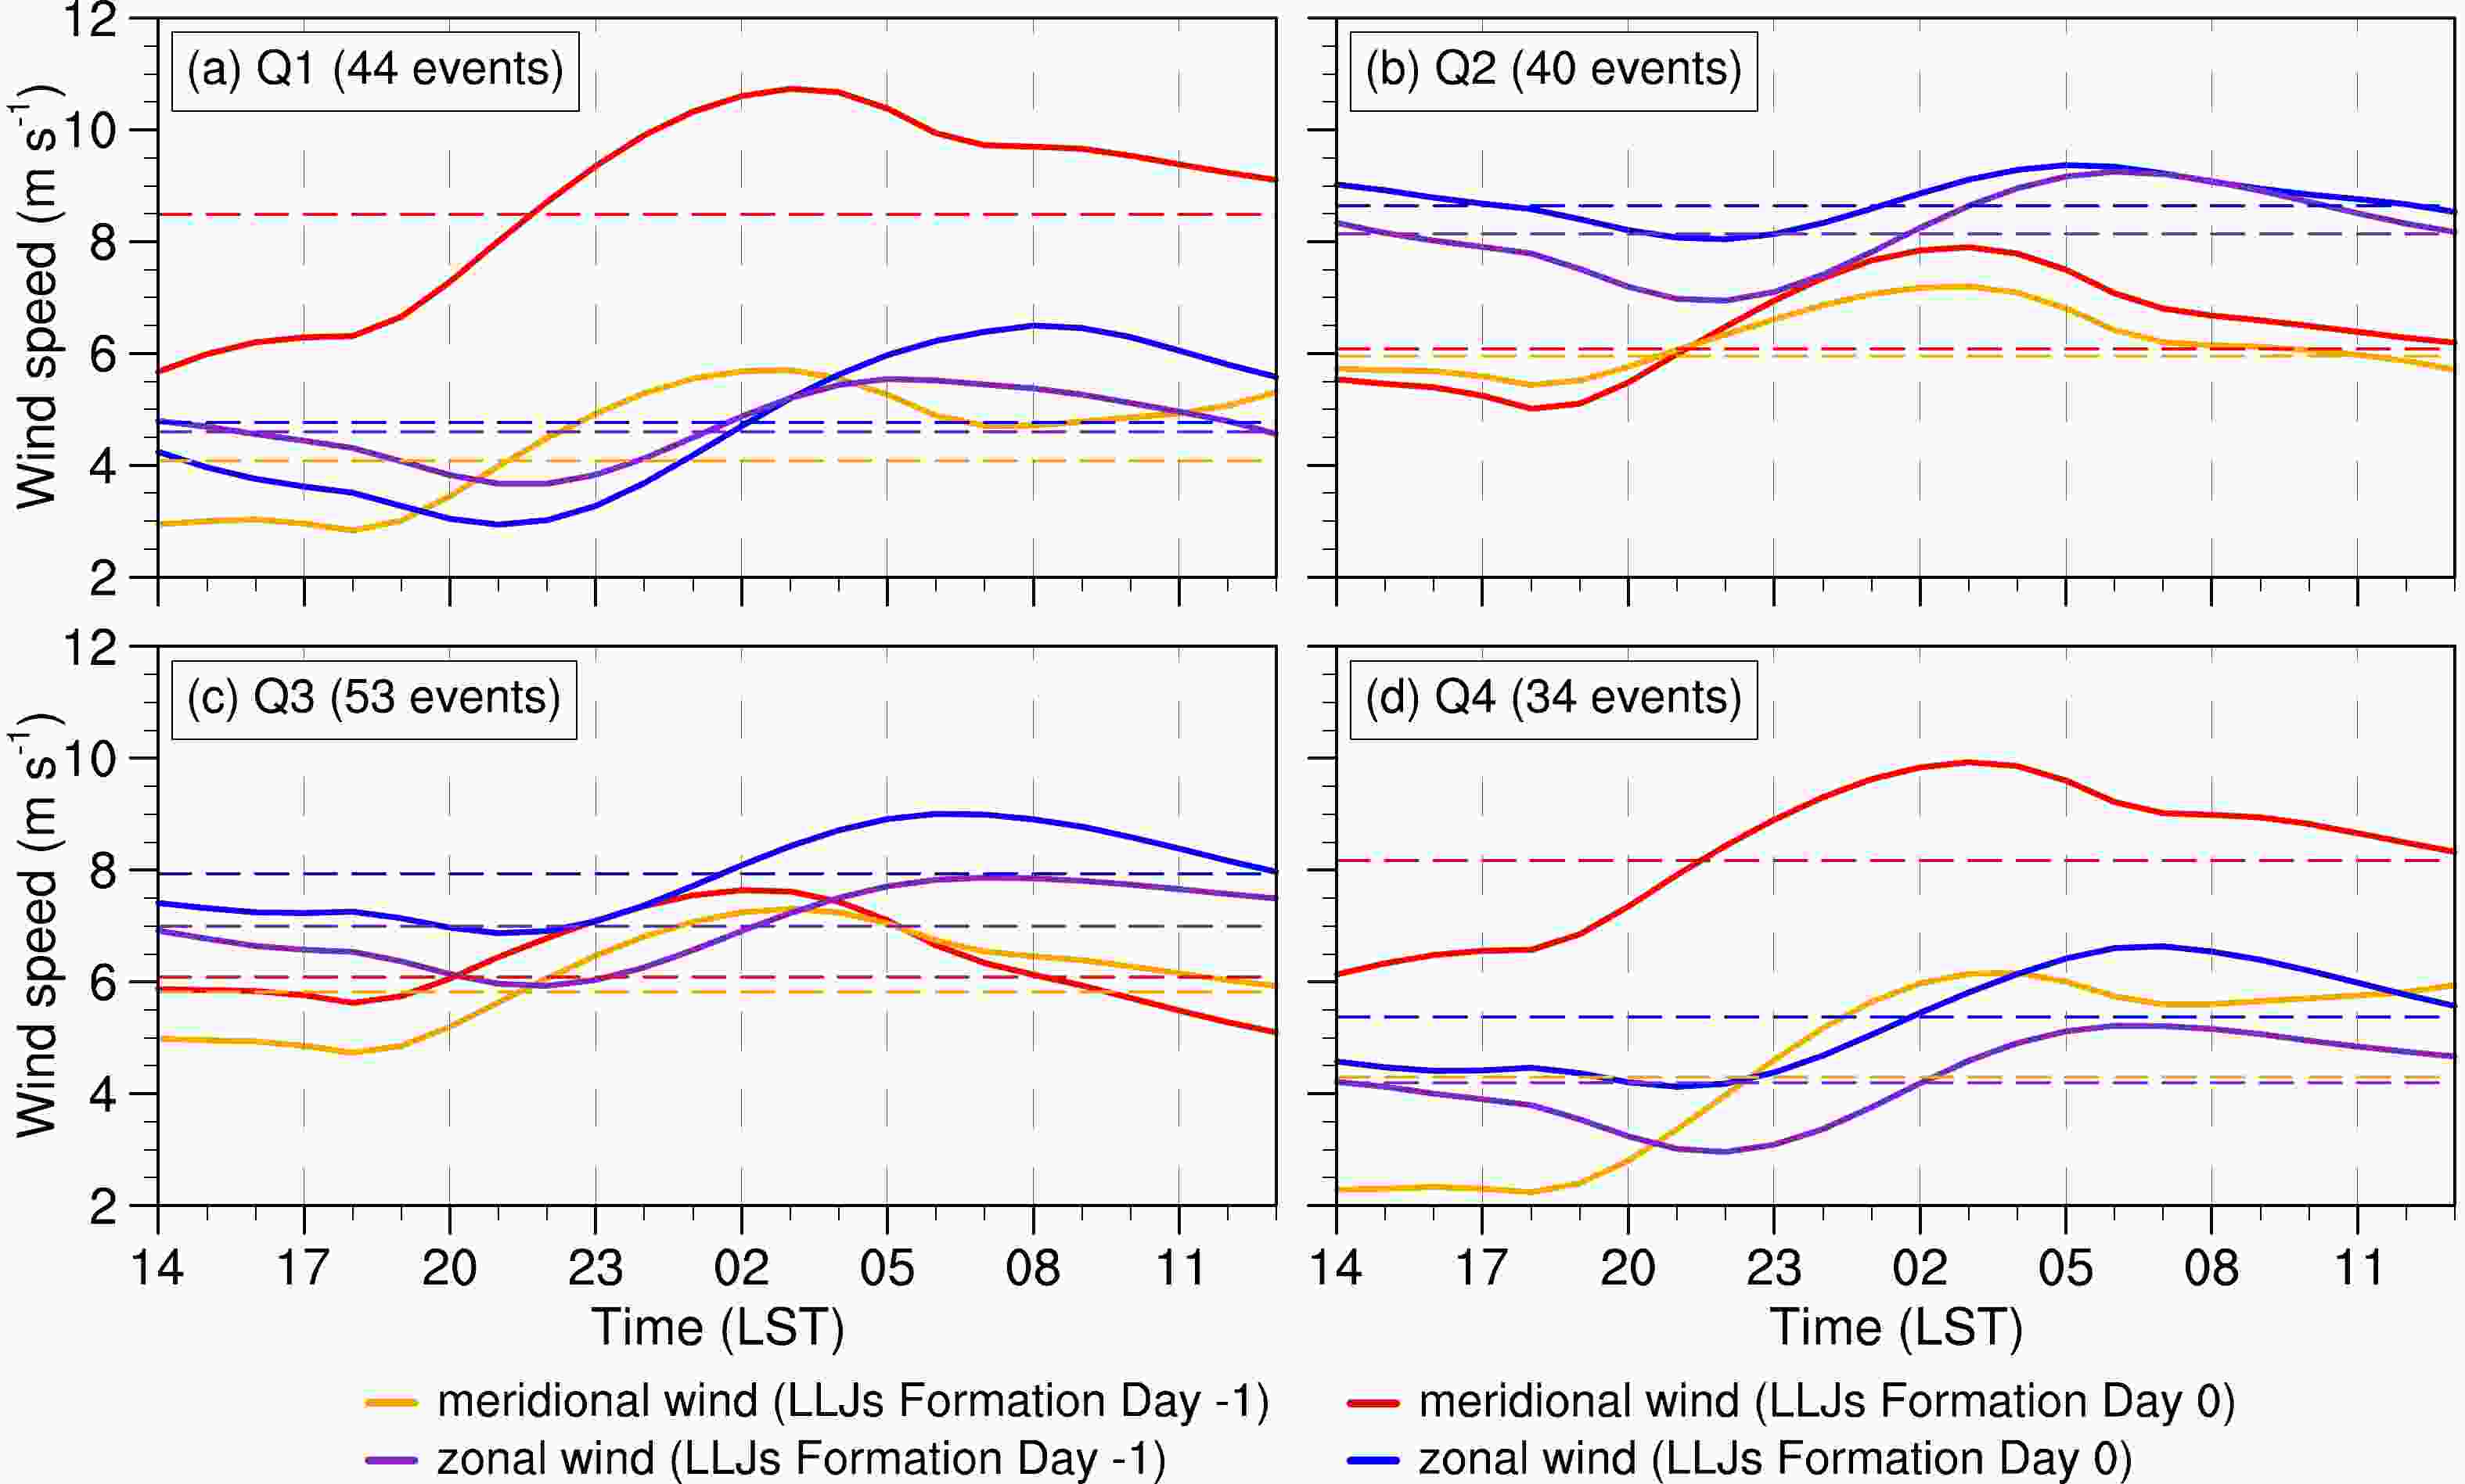
Figure 6. Same as in Fig. 3, but for the four types of LLJ formation events.
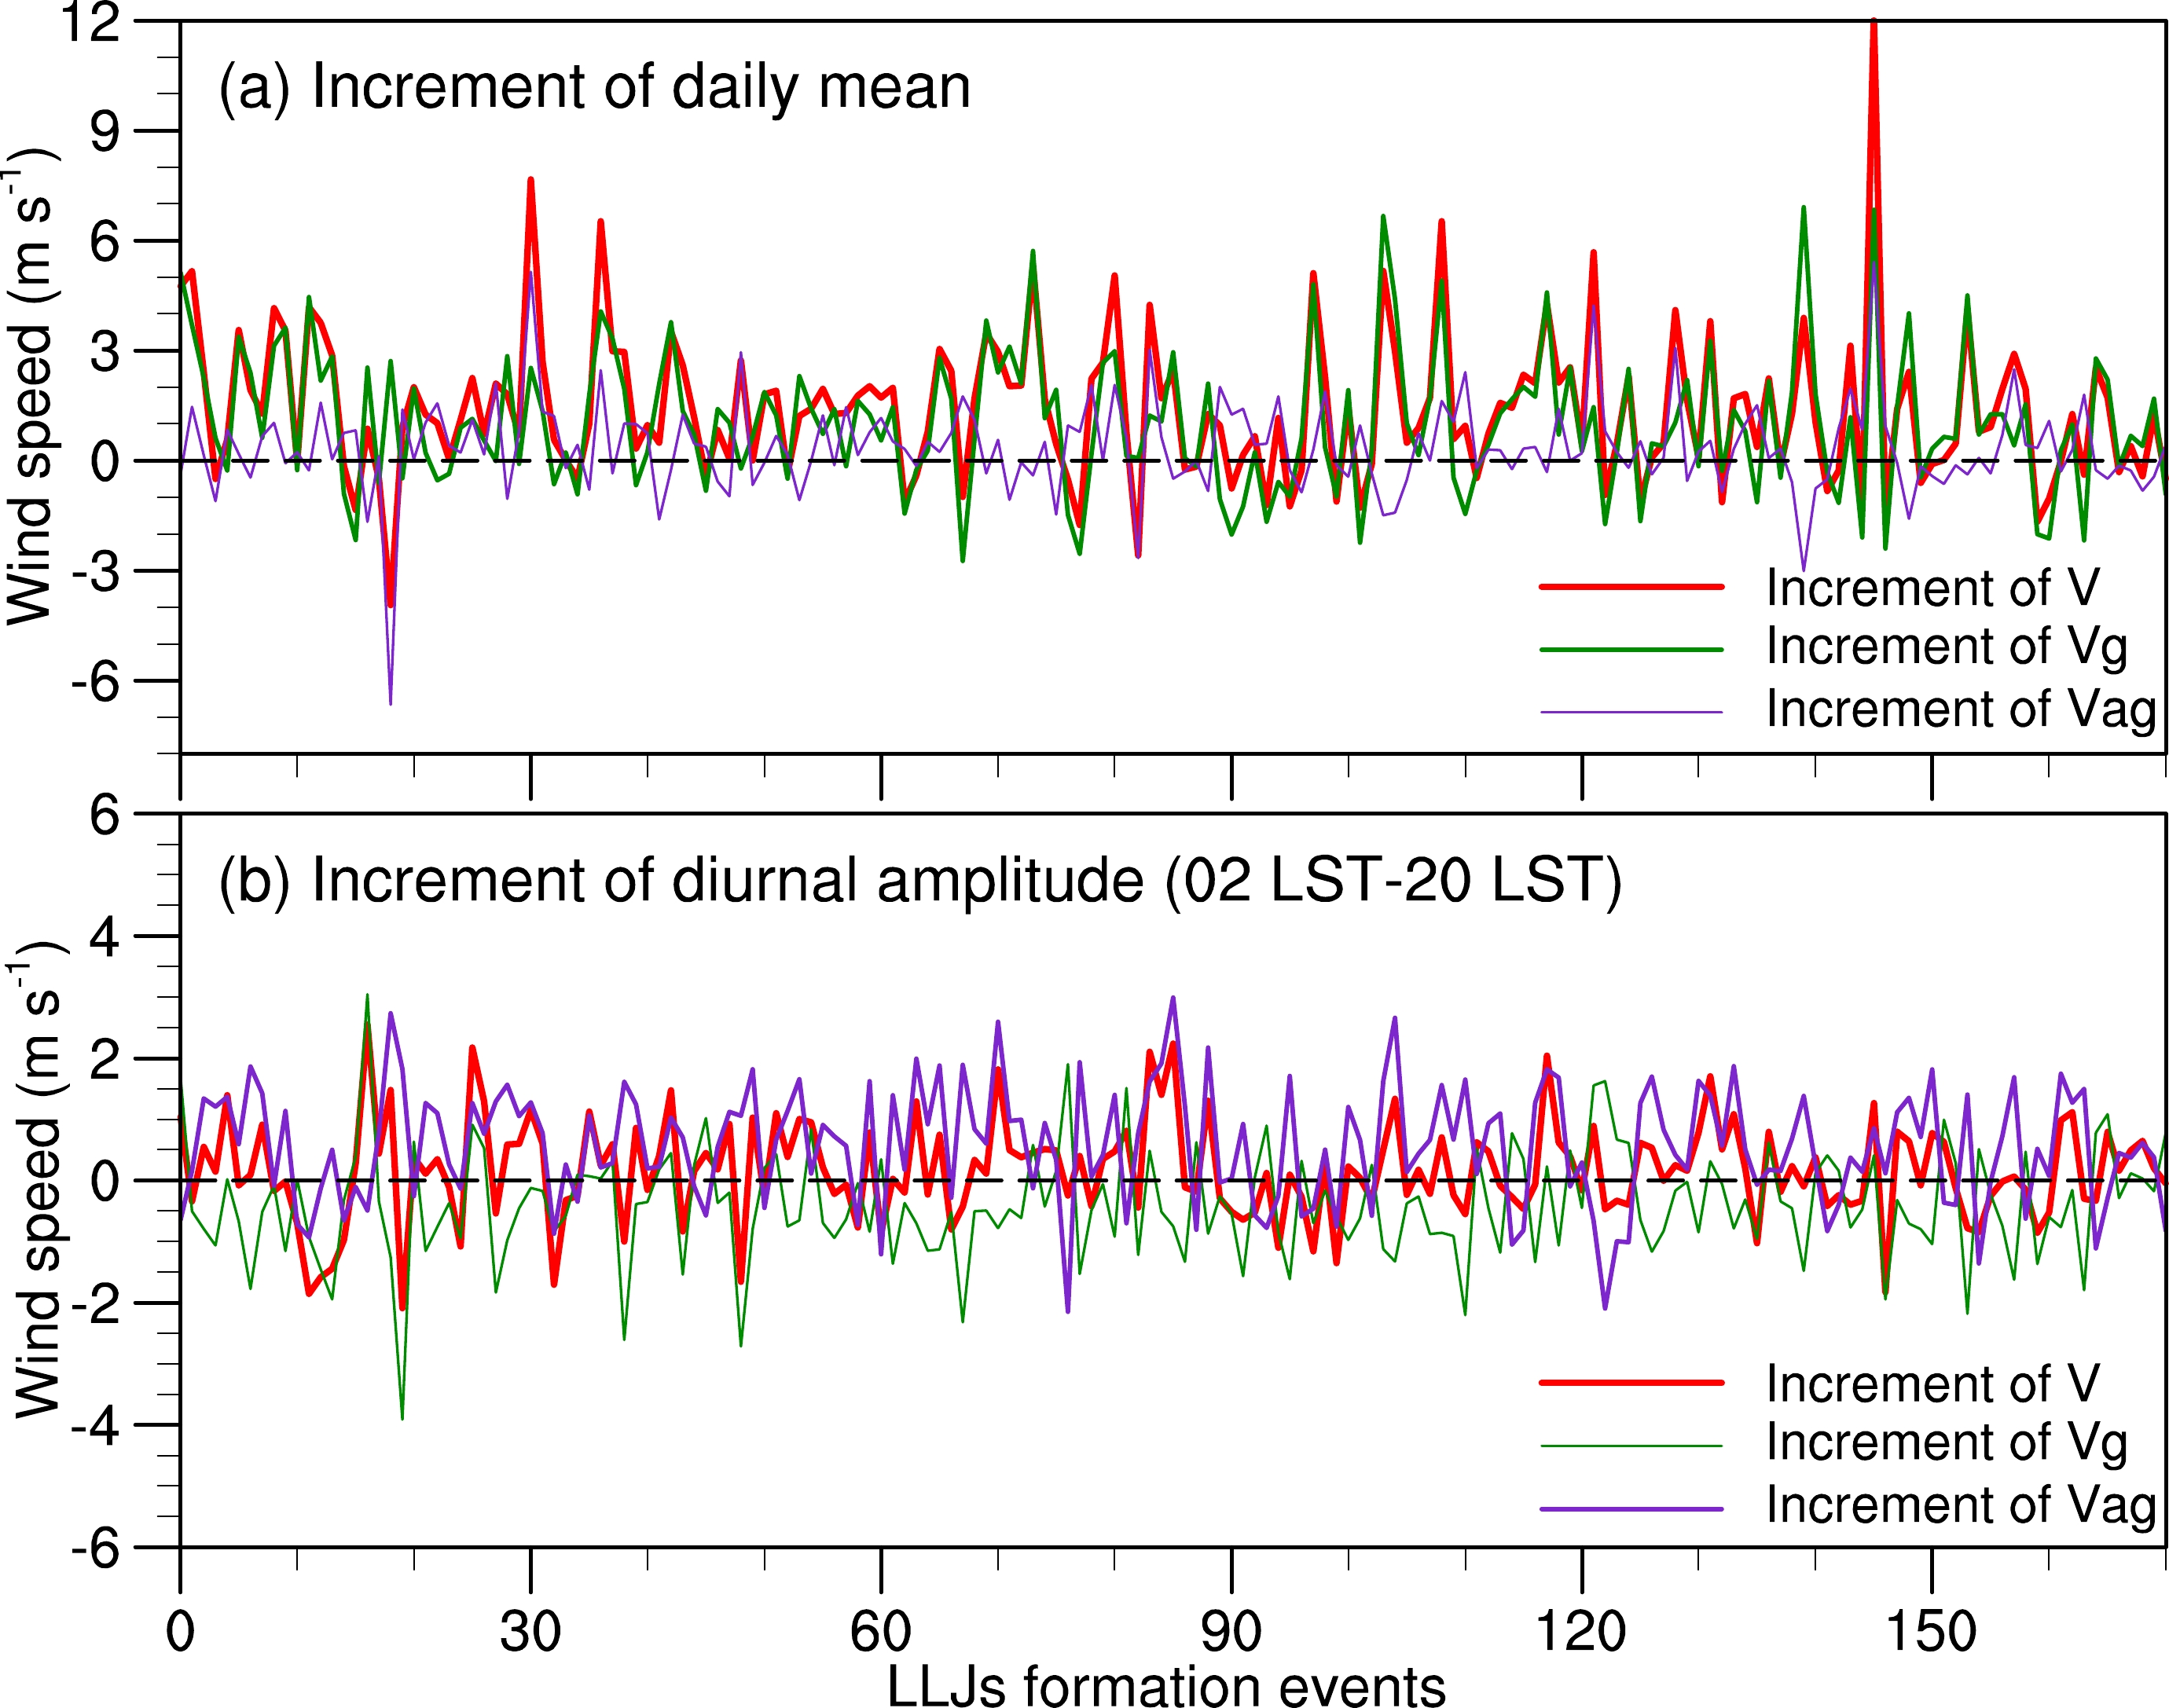
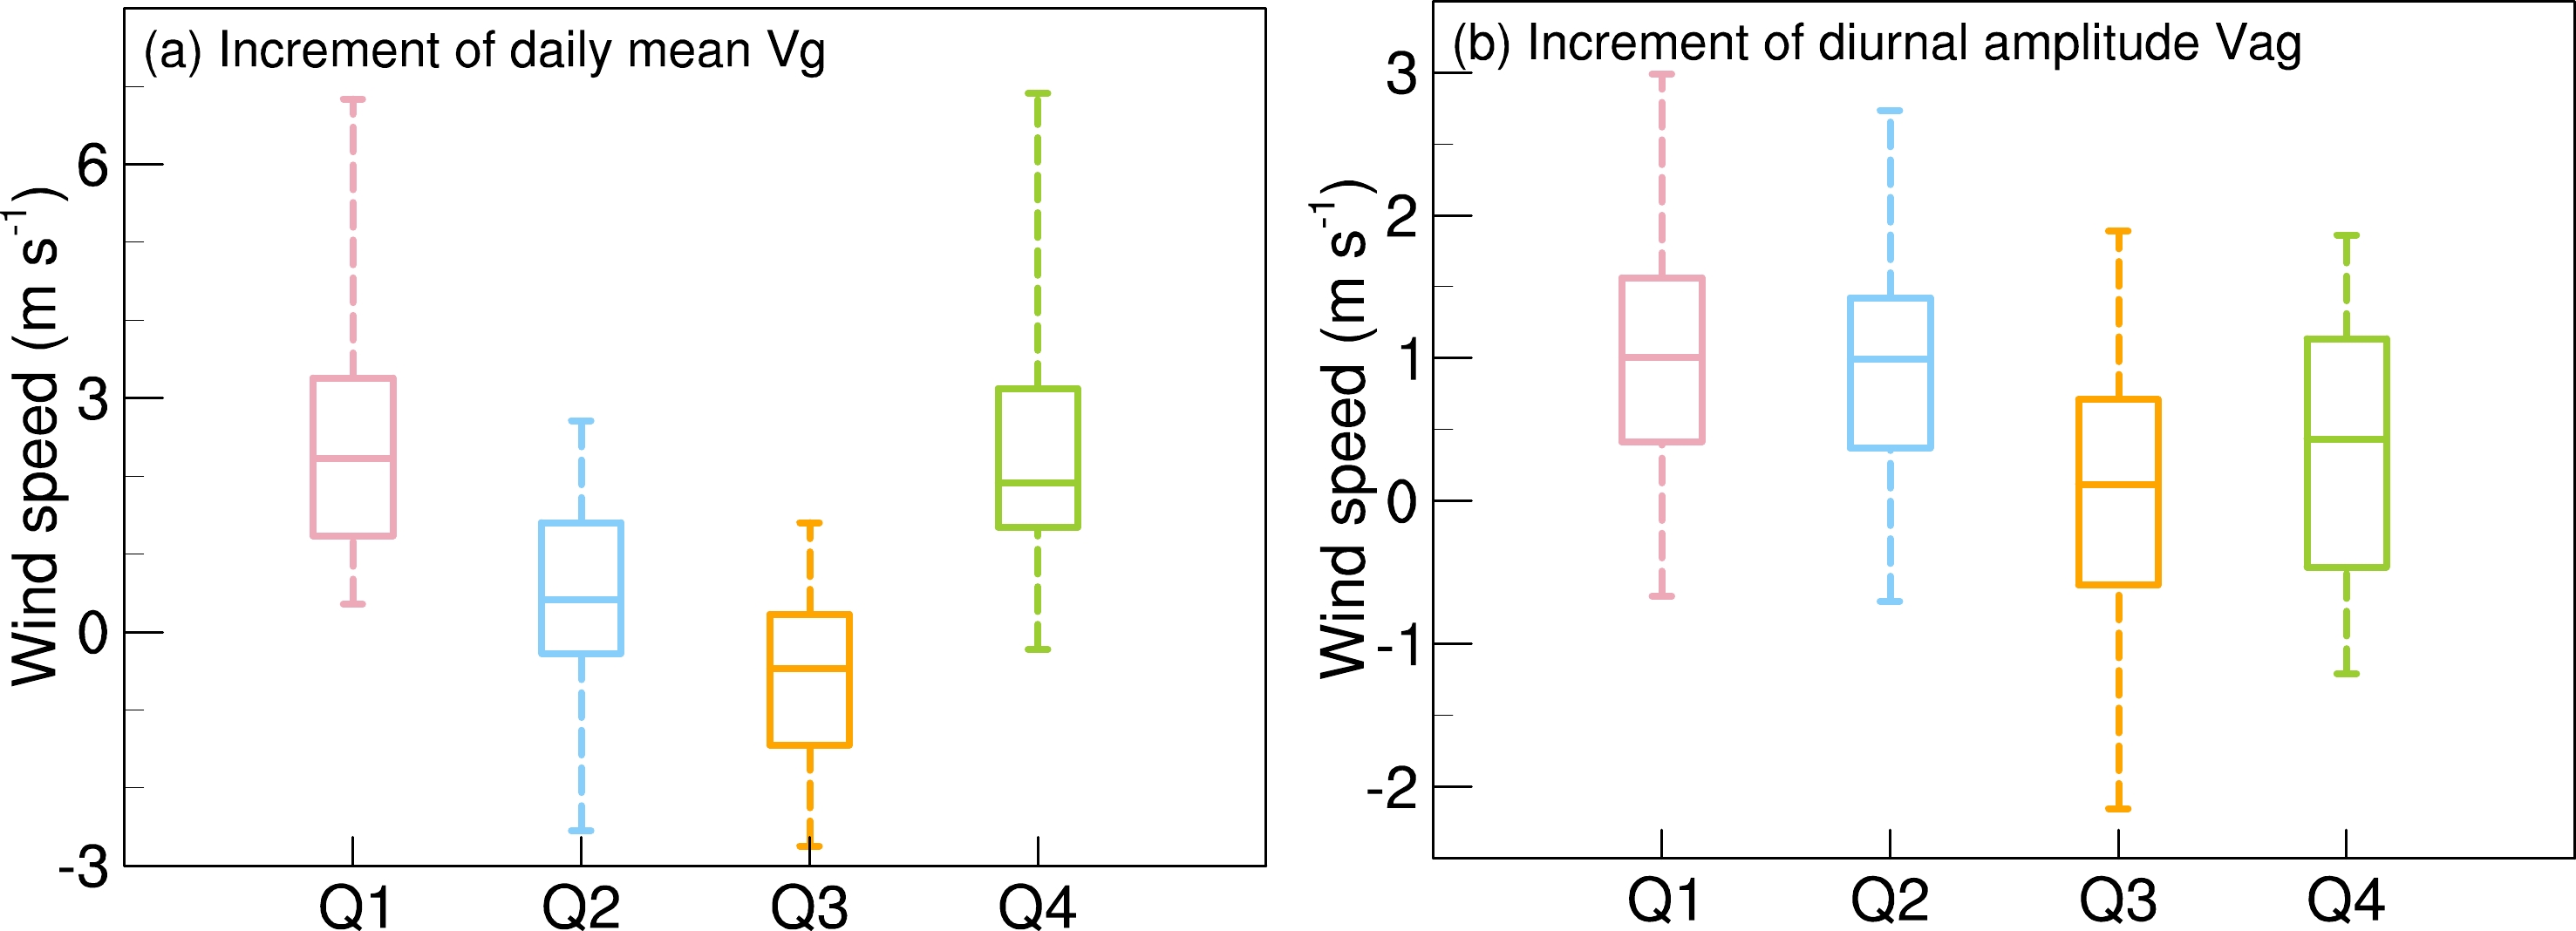
Previous studies have pointed out that daily variation of wind component is related to the relatively slow change in the geostrophic wind and the component of diurnal amplitude is related to the change in ageostrophic wind (Du and Rotunno, 2014; Zeng et al., 2022). We further examined the properties of the increment of daily mean and diurnal amplitude of meridional wind on each LLJ-formation event, with emphasis on their relationship to geostrophic/ageostrophic winds. Figure 7a shows that the enhancement of the daily mean southerly wind (red line) from Day –1 to Day 0 is comparable to that in the geostrophic wind component (green line) while the increase in ageostrophic wind (purple line) is small. The daily mean wind is highly related to the geostrophic wind that varies among the events of LLJ formation with a correlation coefficient of 0.79, exceeding the 99.9% confidence level. We further examined the properties of daily-mean increment in the four types of LLJ formation. The boxplot of Fig. 8a shows that the two types of LLJ formation with large daily-mean increments well correspond to a pronounced increase of geostrophic meridional wind with a mean increase of 2.55 m s–1 in Q1 and 2.24 m s–1 in Q4. In contrast, the other two types (Q2 and Q3) have less of an increase in the geostrophic meridional wind from Day –1 to Day 0. We further note that Q2 and Q3 are characterized by a substantial increase in daily-mean zonal wind, particularly in Q3 (Figs. 6b, c), which corresponds well with an increase in the geostrophic zonal wind (not shown).

Figure 7. Time series of the (a) daily mean and (b) diurnal amplitude (0200 LST minus 2000 LST) of the 850-hPa meridional wind averaged over 23°–31°N, 107°–117°E. The increment of total wind (V), increment of geostrophic wind (Vg) and increment of ageostrophic wind (Vag) are denoted by red, green and purple lines, respectively.

Figure 8. Box plots corresponding to the increment of 850-hPa daily-mean geostrophic wind (Vg) and increment of diurnal amplitude (0200 LST minus 2000 LST) of ageostrophic wind (Vag) averaged over 23°–31°N, 107°–117°E for four types of LLJ-formation events.
Figure 7b shows that the increase in the diurnal amplitude of meridional wind is closely matched with the increased diurnal amplitude of ageostrophic wind component while it is less related to the geostrophic wind. The variations of diurnal amplitude among the events are highly related to the ageostrophic wind with a correlation coefficient of 0.56, significant at the 99.9% confidence level. The correlation coefficient between the geostrophic wind and diurnal amplitude is lower, estimated as 0.44, significant at the 95% confidence level. Previous studies (Chen et al., 2009, 2012; Xue et al., 2018) have demonstrated a strong relationship between the diurnal wind and ageostropic component, which is consistent with our findings. In this study, this relationship applies to the wind change during LLJ formation. Figure 8b shows that the two types of LLJ formation with large increases of diurnal amplitude also have large increases of ageostrophic wind. The incremental increases in the ageostrophic wind from Day –1 to Day 0 have means of 1.01 m s–1 in Q1 and 0.91 m s–1 in Q2, while these values are relatively small in Q3 and Q4. Therefore, the enhanced daily meridional wind during the LLJ formation is mainly attributed to the geostrophic wind, whereas the increased diurnal amplitude of meridional wind is attributed to the ageostrophic wind. The relative dominance of these two components varies in the different types of LLJ formation, indicating the presence of different physical processes, a phenomenon that will be clarified in section 5.
We further examine the impact of the four types of LLJ formation on downstream precipitation, paying particular attention to the rainfall accumulated during the midnight and early morning hours from 0000 LST to 0900 LST on Day 0 when the low-level winds of LLJs are strongest. We compared this 9-h accumulated rainfall to that which occurred on Day –1. Figure 9 shows rainfall increases over southern China from Day –1 to Day 0 for all four types of LLJ formation. The rainfall increase in Q1 and Q4 is more pronounced than that in Q2 and Q3, especially north of 29°N, likely related to the large increase in daily southerlies in Q1 and Q4. The morning-hour rainfall in Q1 is marginally strong and northwardly displaced compared to that in Q4 (Figs. 9a, d), which corresponds to the southerlies with a relatively large diurnal amplitude in Q1. In Q2, the increased rainfall is also displaced slightly to the north compared to Q3 (Figs. 9b, c). Therefore, the four types of LLJs seem to produce remarkably different patterns of morning rainfall at their northern terminus. DC19 has shown that LLJs with different heights of maximum wind speed can regulate the rainfall patterns over southern China. Here, we further find that LLJs with differential increases in the daily mean and diurnal amplitude of low-level winds also lead to different rainfall patterns. In climatology, these two components of low-level winds may be crucial for regulating the intensity and latitude of the East Asian summer rainband (Chen, 2020). Further studies are needed to estimate the dynamic lift, moisture transport, and convective instability that occurs during the different types of LLJs for producing heavy rainfall, noting that such an undertaking is beyond the scope of this study.
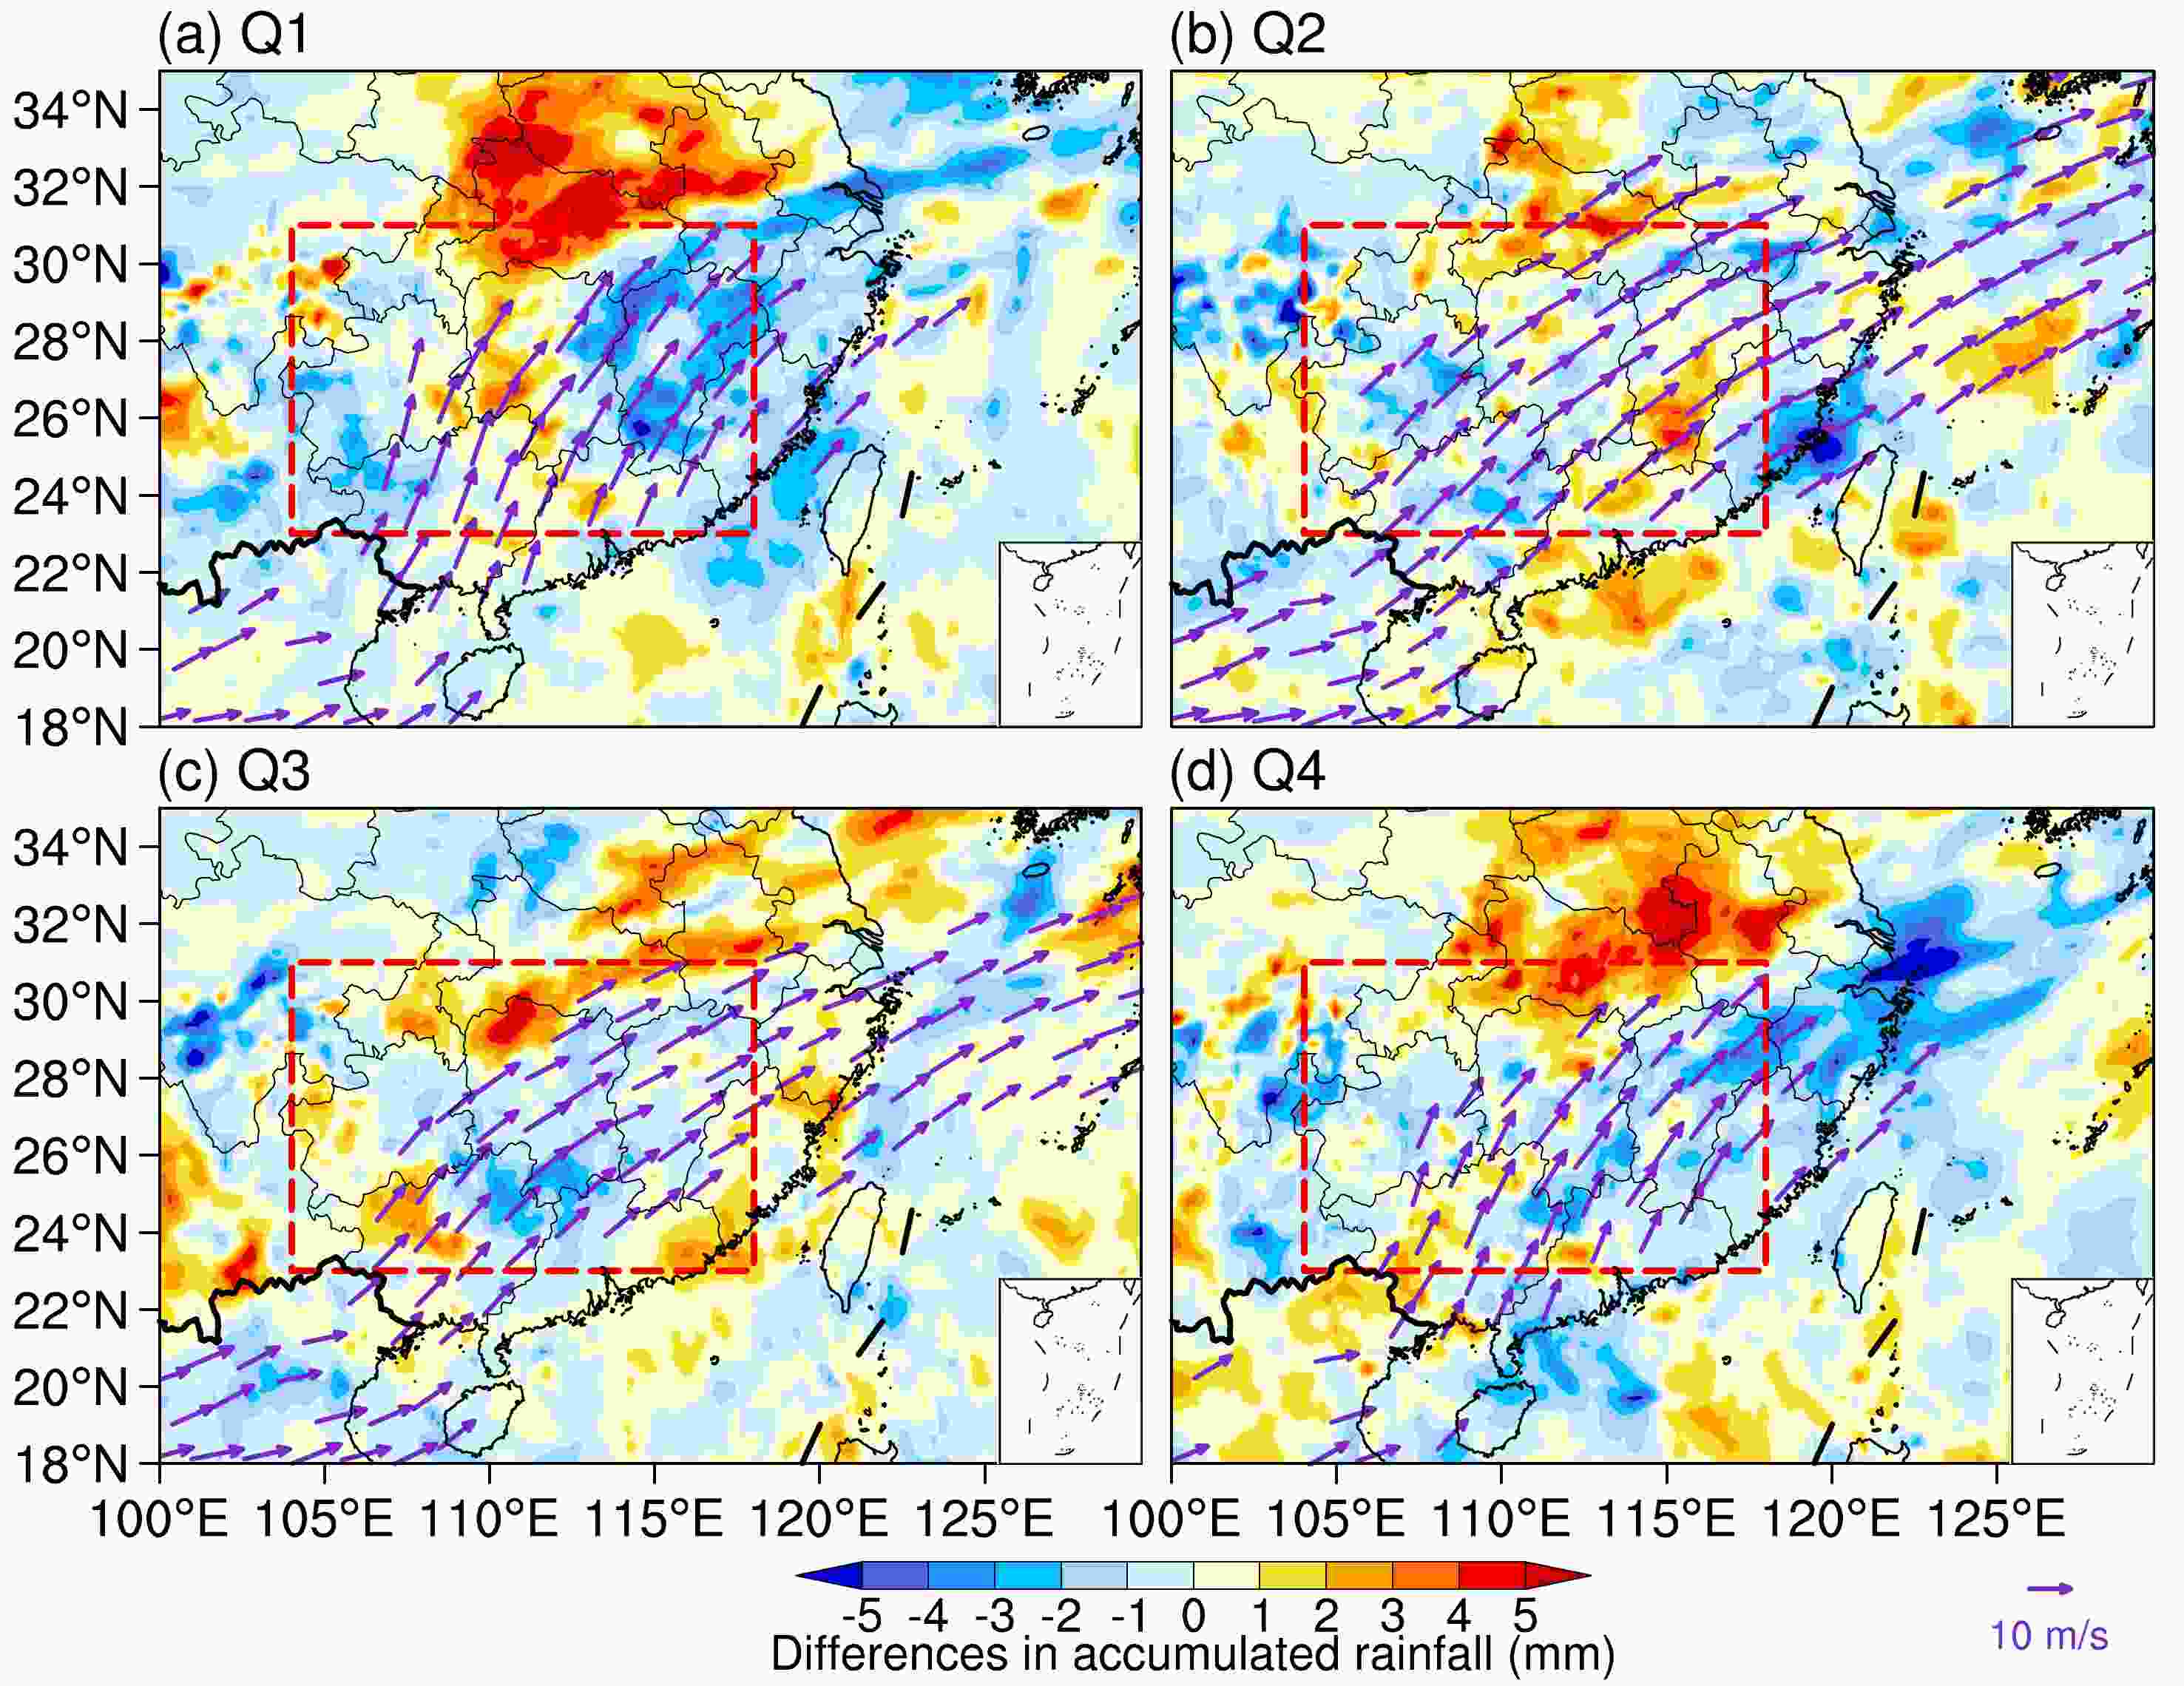
Figure 9. Differences in rainfall accumulated from 0000 LST to 0900 LST (mm, shading) on Day 0 compared to Day –1, and horizontal winds averaged from 0200 LST to 0800 LST (>10 m s–1, vectors) at 850 hPa on Day 0. Red rectangles denote southern China (23°–31°N, 107°–117°E).
-
As the geostrophic wind greatly contributes to the increased daily southerlies during LLJ formation, we examine those synoptic-scale disturbances that produce geopotential height patterns that favor LLJ formation. First, we perform an objective classification of synoptic-scale disturbances using the SOM method. Specifically, we conducted SOM analysis of the 850-hPa geopotential height over southern China on Day 0 as introduced in section 2.3. From this, we obtain four patterns of synoptic-scale disturbances (namely, P1–P4) associated with their LLJ formation. We can compare the four types of synoptic-scale patterns with the four classifications of LLJs to clarify their topological relationship. P1 accounts for about 33.9% of the LLJ formation events, P2 for 21.1%, P3 for 21.6%, and P4 for 23.4% (Fig. 10).
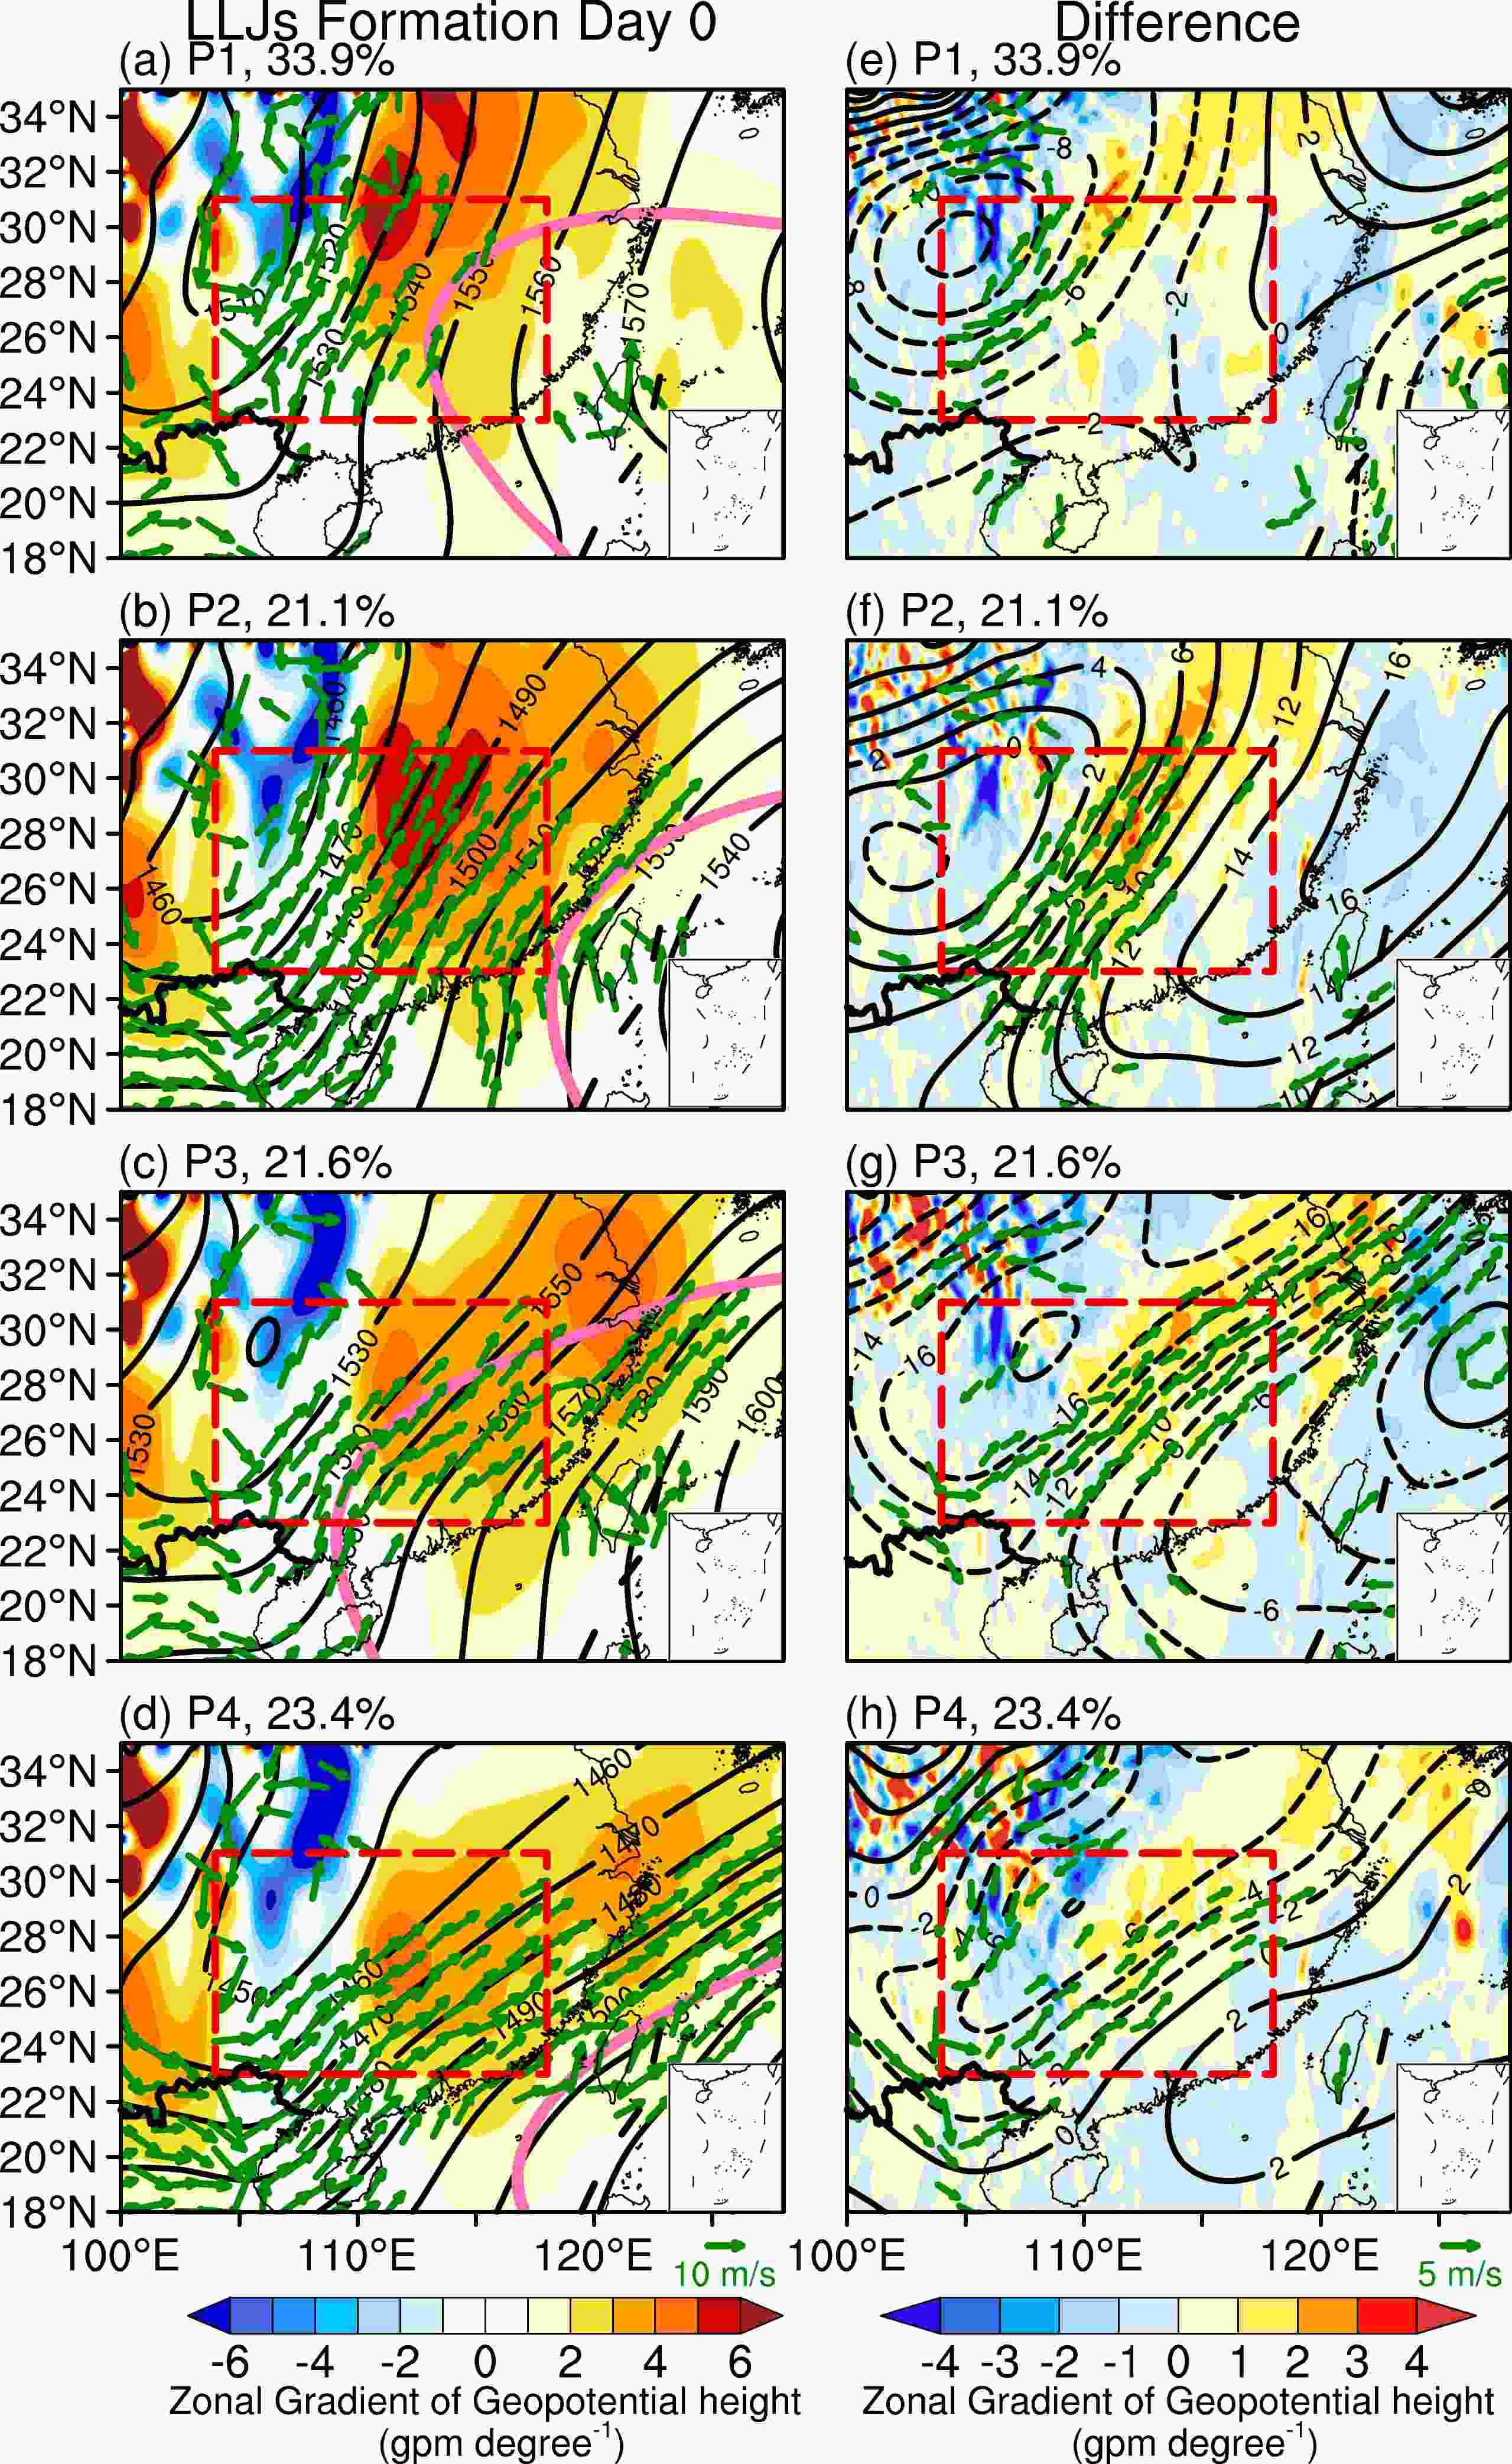
Figure 10. Daily-mean zonal gradient of the geopotential height (gpm degree–1, shading), geostrophic winds (>8 m s–1, green vectors), and geopotential height (gpm, black contours) at 850 hPa, which are composited on (a–d) Day 0. (e–h) Differences between Day –1 and Day 0 in daily-mean geopotential height (gpm, black contours), its zonal gradient (gpm degree–1, shading), and geostrophic winds (green vectors) at 850 hPa. Pink lines denote the 500-hPa daily-mean geopotential heights larger than 5880 gpm. Red rectangles denote southern China (23°–31°N, 107°–117°E).
The first pattern (P1) of synoptic-scale disturbances is characterized by the WPSH dominating the land surface of southern China (pink contour for 5880 gpm in Fig. 10a). A low-pressure system is established over the Sichuan Basin, which is related to the activities of the southwest vortex which develops with a decreased geopotential height of ~6 gpm on Day 0 compared to Day –1, during which time the WPSH extends slightly northward (Fig. 10e). The intensified southwest vortex helps to strengthen the pressure gradient at its eastern flank. This feature corresponds to the daily geostrophic wind that increases to ~11.1 m s–1 particularly east of the Sichuan Basin and extends to ~30°N on Day 0. The synoptic-scale pattern (P1) accounts for about 33.9% of the LLJ-formation events, which is the most frequent among the four patterns.
The second pattern (P2) is featured by a WPSH that dominates the offshore area of southern China on Day 0 (Fig. 10b). The WPSH extensively strengthens along the eastern coasts of China on Day 0 compared to Day –1 with daily increases of geopotential height of up to ~14 gpm (Fig. 10f). As a result, an induced pressure gradient becomes pronounced over a large expanse of southern China, which is much wider than that in P1. Consequently, the daily geostrophic wind increases to ~12.5 m s–1 on Day 0, and thus the extensive strong southwesterlies prevail over southern China. Both P1 and P2 are featured by a west-east dipole pattern of pressure change that leads to a relatively large increase in the southerly wind component during LLJ formation.
The third pattern (P3) is featured by a WPSH that extends to the eastern sector of southern China (Fig. 10c). A large decrease of geopotential height (~16 gpm) is seen in the Sichuan Basin and North China on Day 0 compared to Day –1 (Fig. 10g). It suggests that a low-pressure system related to a mid-latitude trough is developing. The pressure gradient is enhanced from Day –1 to Day 0 over southern China. Correspondingly, the daily southwesterlies increase to ~11.4 m s–1. In the fourth pattern (P4), the WPSH is established mainly over the Philippine Sea on Day 0 (Fig. 10d), and is positioned further south compared to that in P3 (Fig. 10c). The WPSH strengthens with a slight increase of geopotential height (~2 gpm) along the south coasts of southern China on Day 0 compared to Day –1. The low-pressure system, related to the mid-latitude trough, develops in the Sichuan Basin and North China (Fig. 10h), which is similar to P3. An intensified pressure gradient occurs over southern China; thus, enhancing the daily southwesterlies on Day 0.
Overall, we see that the four patterns are distinguishable from each other as they are related to the different activities within synoptic-scale disturbances. The first two patterns, P1 and P2, mainly feature a west-east dipole pattern of pressure change (with an enhanced pressure gradient), which is different from that of the northwest-southeast dipole pattern of P3 and P4. All four patterns contribute to increased daily-mean southwesterlies, in which P1 and P2 (P3 and P4) mainly lead to relatively large increases in the southerly (westerly) wind component during their respective formation of LLJs.
We further examine the relationship of the four patterns of synoptic-scale disturbances (P1–P4) to the four types of LLJ-formation events (Q1–Q4). Figure 11 shows that up to 73% of Q1 and Q4 events are of synoptic-scale patterns of P1 and P2, while the other two patterns contribute less. So, the LLJ-formation events with dominant southerlies (Q1 and Q4) are mostly induced by P1 and P2, because these two patterns greatly contribute to an increase in the daily southerly wind as shown in Figs. 10a, b. In contrast, up to 62% of Q2 and Q3 events are induced by the synoptic-scale patterns P3 and P4. The P3 and P4 patterns thus tend to result in southwesterly LLJs with a pronounced westerly component, because they mainly lead to increased westerly winds, as in Figs. 10c, d. We see that the increases in daily southwesterlies during LLJ formation can be induced by the intensified pressure gradient over southern China. To clarify the responsible processes, we further decompose the enhancement of the west-east or northwest-southeast pressure diploe into two types of synoptic patterns, respectively. They are related to different synoptic-scale disturbances such as the WPSH, the southwest vortex, and the mid-latitude trough. These results agree with the findings in previous studies (DC19; Liu et al., 2022; Zeng et al., 2022). This study further highlights that the different combinations of synoptic-scale disturbances lead to some differences in the increased southerly/westerly wind components. Such differences account for the diversity in the LLJ formation in terms of the daily-mean low-level winds.
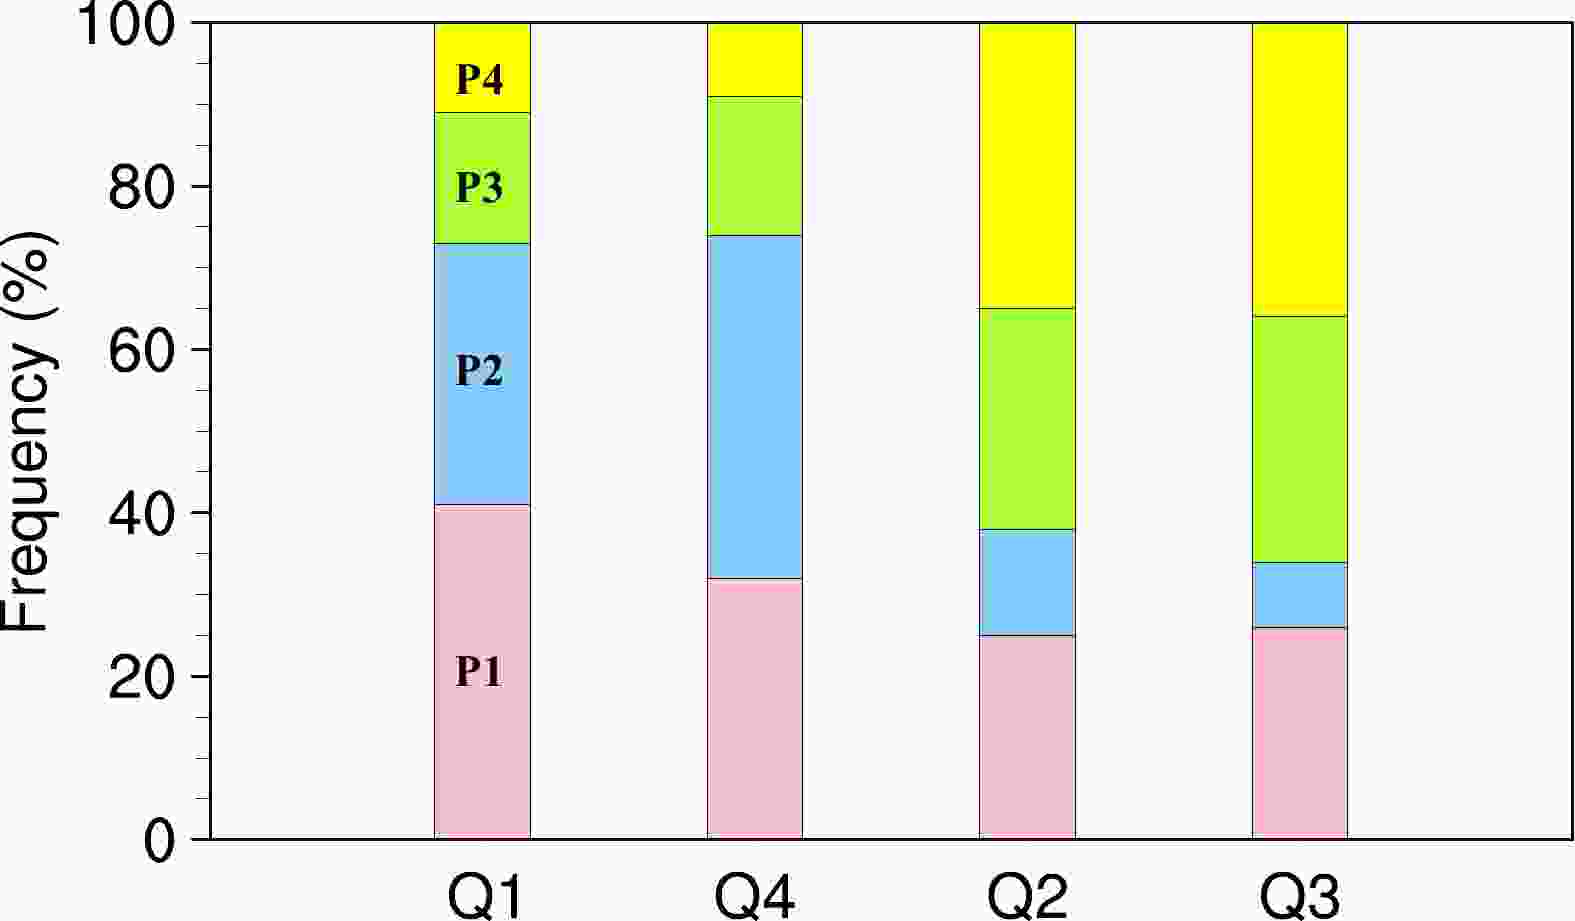
Figure 11. Distribution of occurrence frequency (%) of the four patterns of synoptic-scale disturbances (P1–P4) with respect to the four types of LLJ formation events (Q1–Q4).
-
The LLJs over southern China are characterized by a pronounced diurnal cycle with a nocturnal maximum wind speed, leading to the preferred occurrence of nocturnal LLJs. Previous studies have suggested that the diurnal amplitudes of low-level winds (mainly the ageostrophic wind component) vary with the intensity of diurnal thermal forcing (Du and Rotunno, 2014; Xue et al., 2018; Chen, 2020; Zeng et al., 2022). In this section, we examined how the diurnal thermal forcing regulates the wind diurnal variations of nocturnal LLJs, with emphasis on the diurnal temperature range and its increment from Day –1 to Day 0. We compare their differences among the four types of LLJ-formation events.
Figure 12 shows the longitudinal-vertical sections of the diurnal temperature range. In Q1, a large diurnal temperature range (up to 2.0 K) occurs in the boundary layer on Day 0 due to strong daytime heating (Fig. 12a). This feature indicates active turbulent mixing in the boundary layer which is favorable for the large diurnal wind variations over the landmass of southern China (Chen, 2020). The diurnal temperature range increases by ~0.75 K from Day –1 to Day 0 (Fig. 12e), indicating the presence of anomalously strong boundary-layer turbulent mixing. Correspondingly, the diurnal amplitude of the wind is enhanced by ~1.0 m s–1 from Day –1 to Day 0. Previous studies have noted that the diurnal cycles of boundary-layer temperature and winds are expressed as a response to the daytime solar radiation (He et al., 2016; Zeng et al., 2022). Relative to LLJs, an enhanced diurnal temperature range is supported by strengthened short-wave radiation (Fig. 13a), which may be related to less cloudiness on Day 0 (Yamada et al., 2007; Wu and Chen, 2021). This suggests that the intensified diurnal thermal forcing is favorable for increasing the diurnal amplitude of southerlies for nocturnal LLJs.
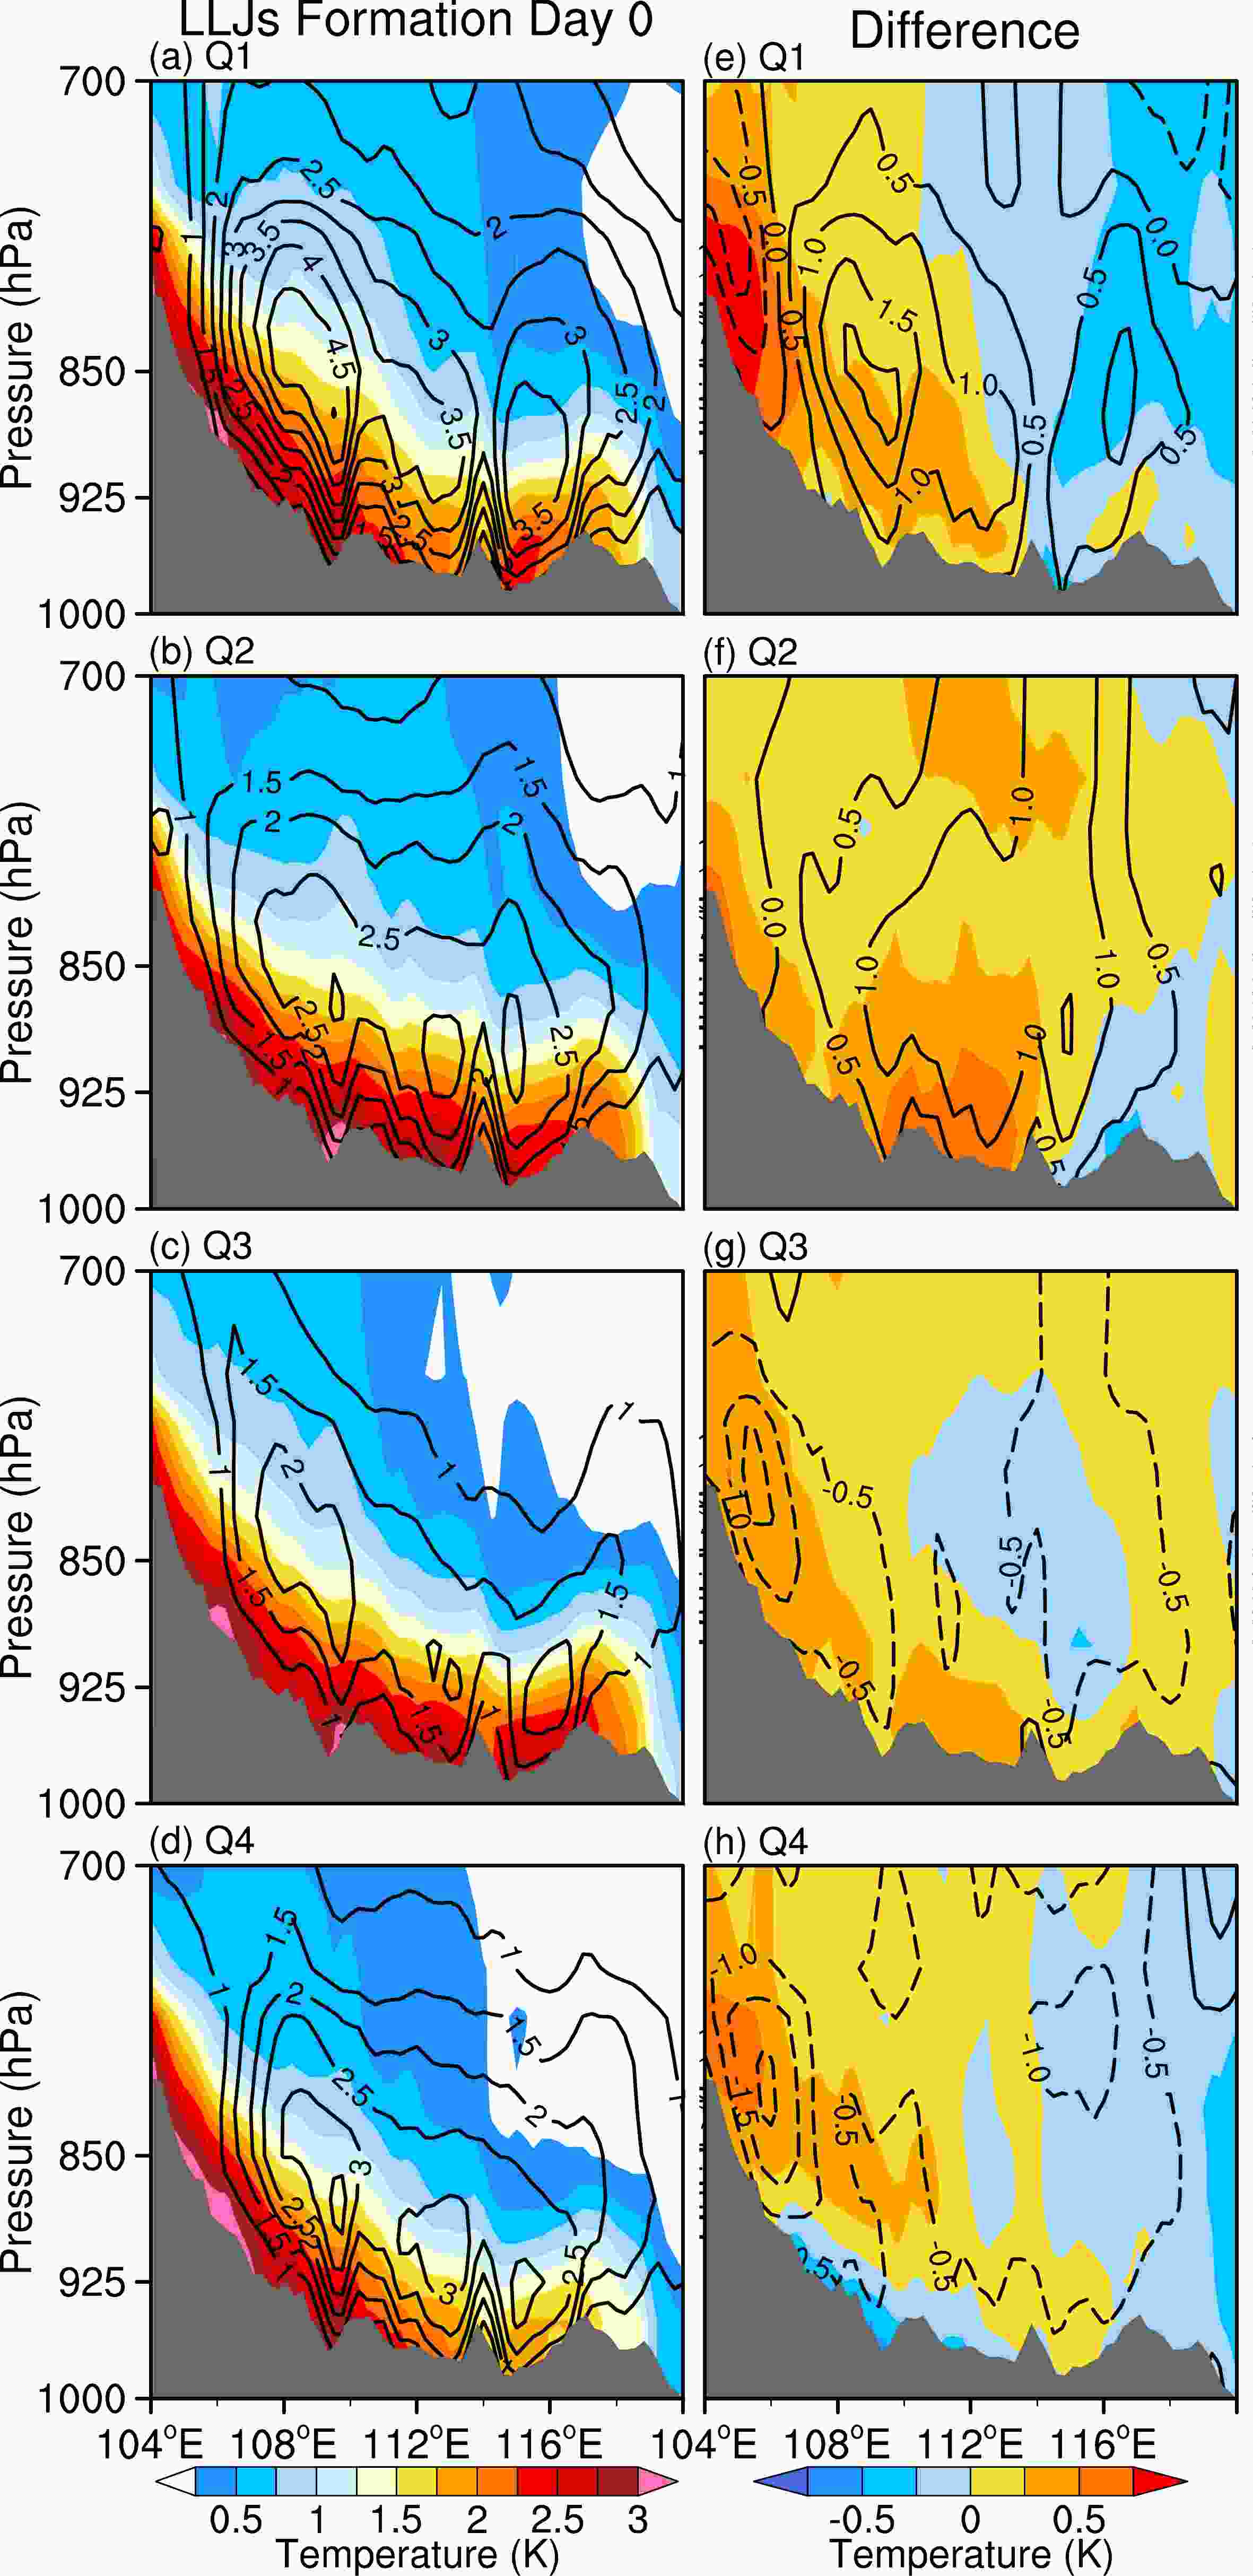
Figure 12. Longitude-vertical sections of the diurnal temperature range (2000 LST minus 0800 LST) (K, shading) and diurnal amplitude (0200 LST minus 2000 LST) of the meridional wind (m s–1, black contours) averaged over 24°–28°N, which are composited on (a–d) Day 0. (e–h) Differences between Day –1 and Day 0 in longitude-vertical sections of the diurnal temperature range (K, shading) and diurnal amplitude of meridional wind (m s–1, black contours).
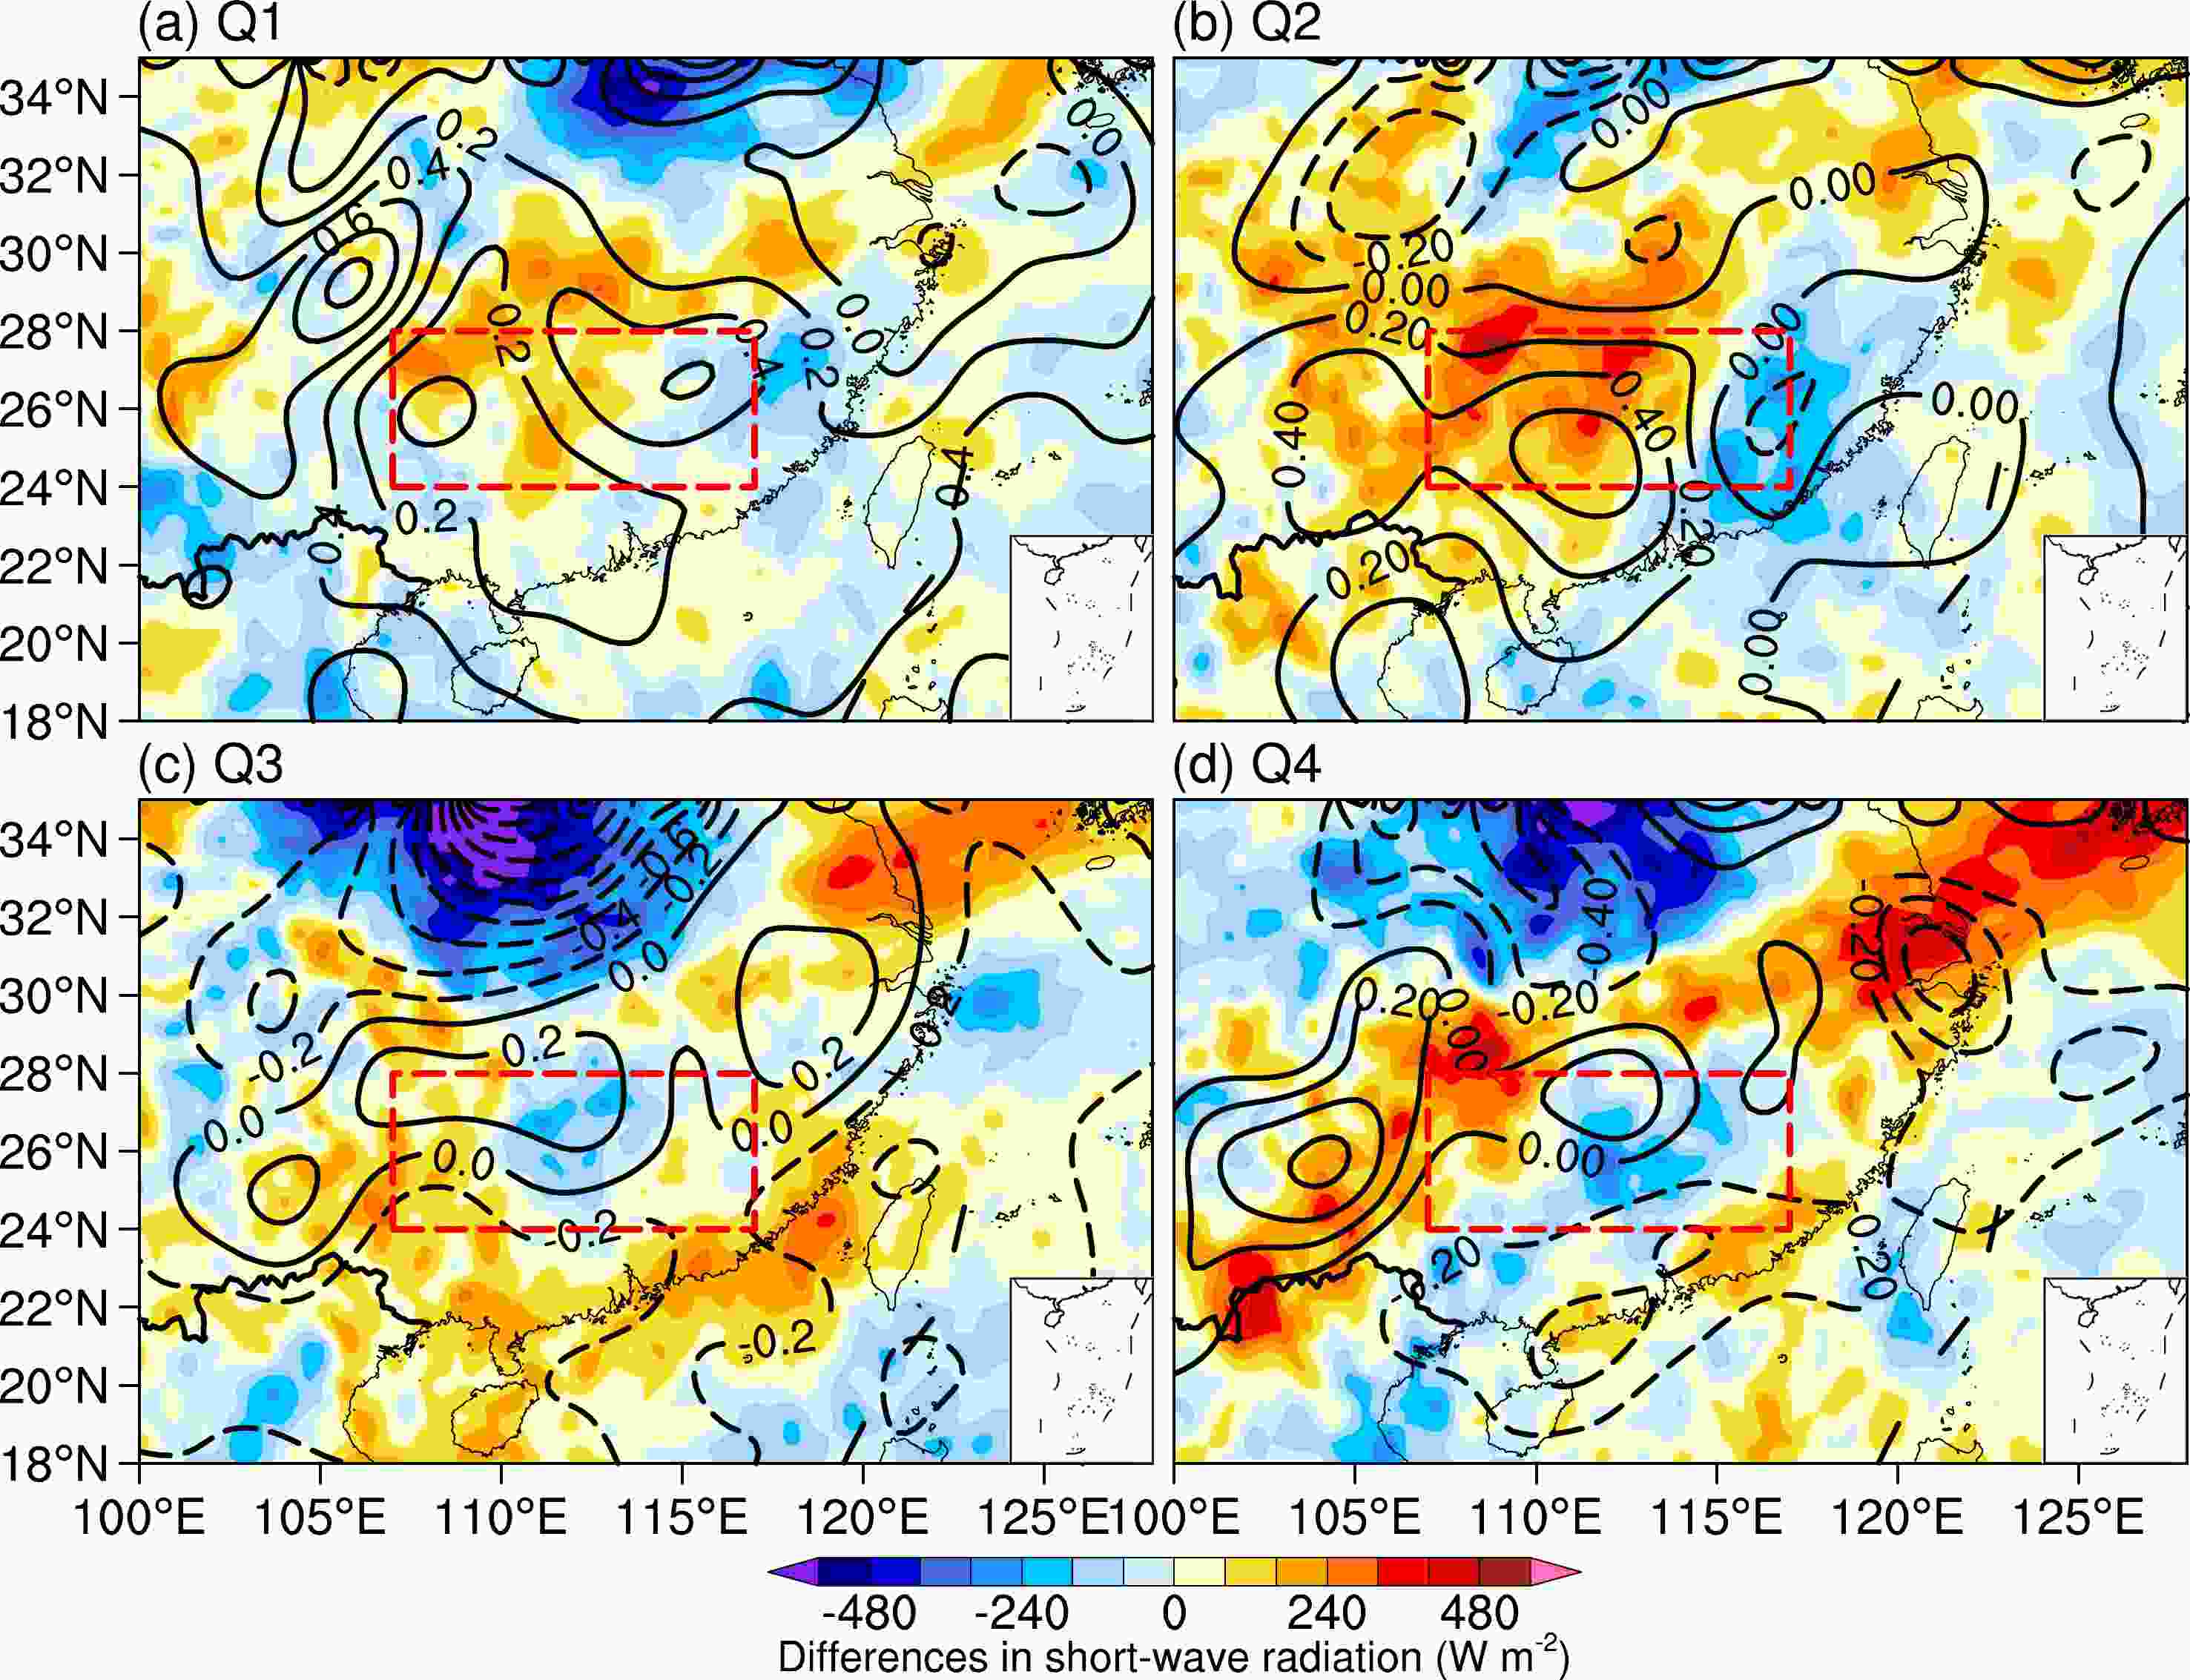
Figure 13. Differences in temporal mean of downward short-wave radiation at the surface from 1100 LST to 1700 LST (W m–2, shading) and the diurnal temperature range (2000 LST minus 0800 LST) (K, black contours) at 925 hPa between Day –1 and Day 0. Red rectangles denote the area of 24°–28°N, 107°–117°E used to generate Fig. 14.
In Q4, the background daily southerlies increase as in Q1, while the diurnal temperature range is relatively small (Fig. 12d). The diurnal temperature range decreases near the surface from Day –1 to Day 0 (Fig. 12h), which is totally different from Q1. The decreased diurnal temperature range is mainly induced by the weaker short-wave radiation on Day 0 than that on Day –1 (Fig. 13d). Such weak daytime heating leads to a relatively small wind diurnal amplitude in Q4. Climatology studies have found that strong (weak) daytime heating explained the large (small) diurnal amplitude of low-level winds on summer days (e.g., Chen, 2020). Here, we suggest that this process is also applied to the days of LLJ formation.
We also note the differences in the intensity of diurnal thermal forcing between Q2 and Q3, which correspond to the differences in wind diurnal variations (Figs. 12b, c). Figure 12f shows that the diurnal temperature range in Q2 increases by ~0.5 K from Day –1 to Day 0, corresponding to pronounced increases in short-wave radiation (Fig. 13b). As a result, the diurnal amplitude of the wind also is enhanced on Day 0. In contrast, Q3 is characterized by less of a change in the near-surface diurnal temperature range on Day 0 compared to Day –1 (Fig. 12g). This feature is related to a reduced change in short-wave radiation and small diurnal variations of wind (Fig. 13c). Such differences between Q2 and Q3 in terms of daytime heating intensity and induced wind diurnal amplitude are similar to those differences between Q1 and Q4.
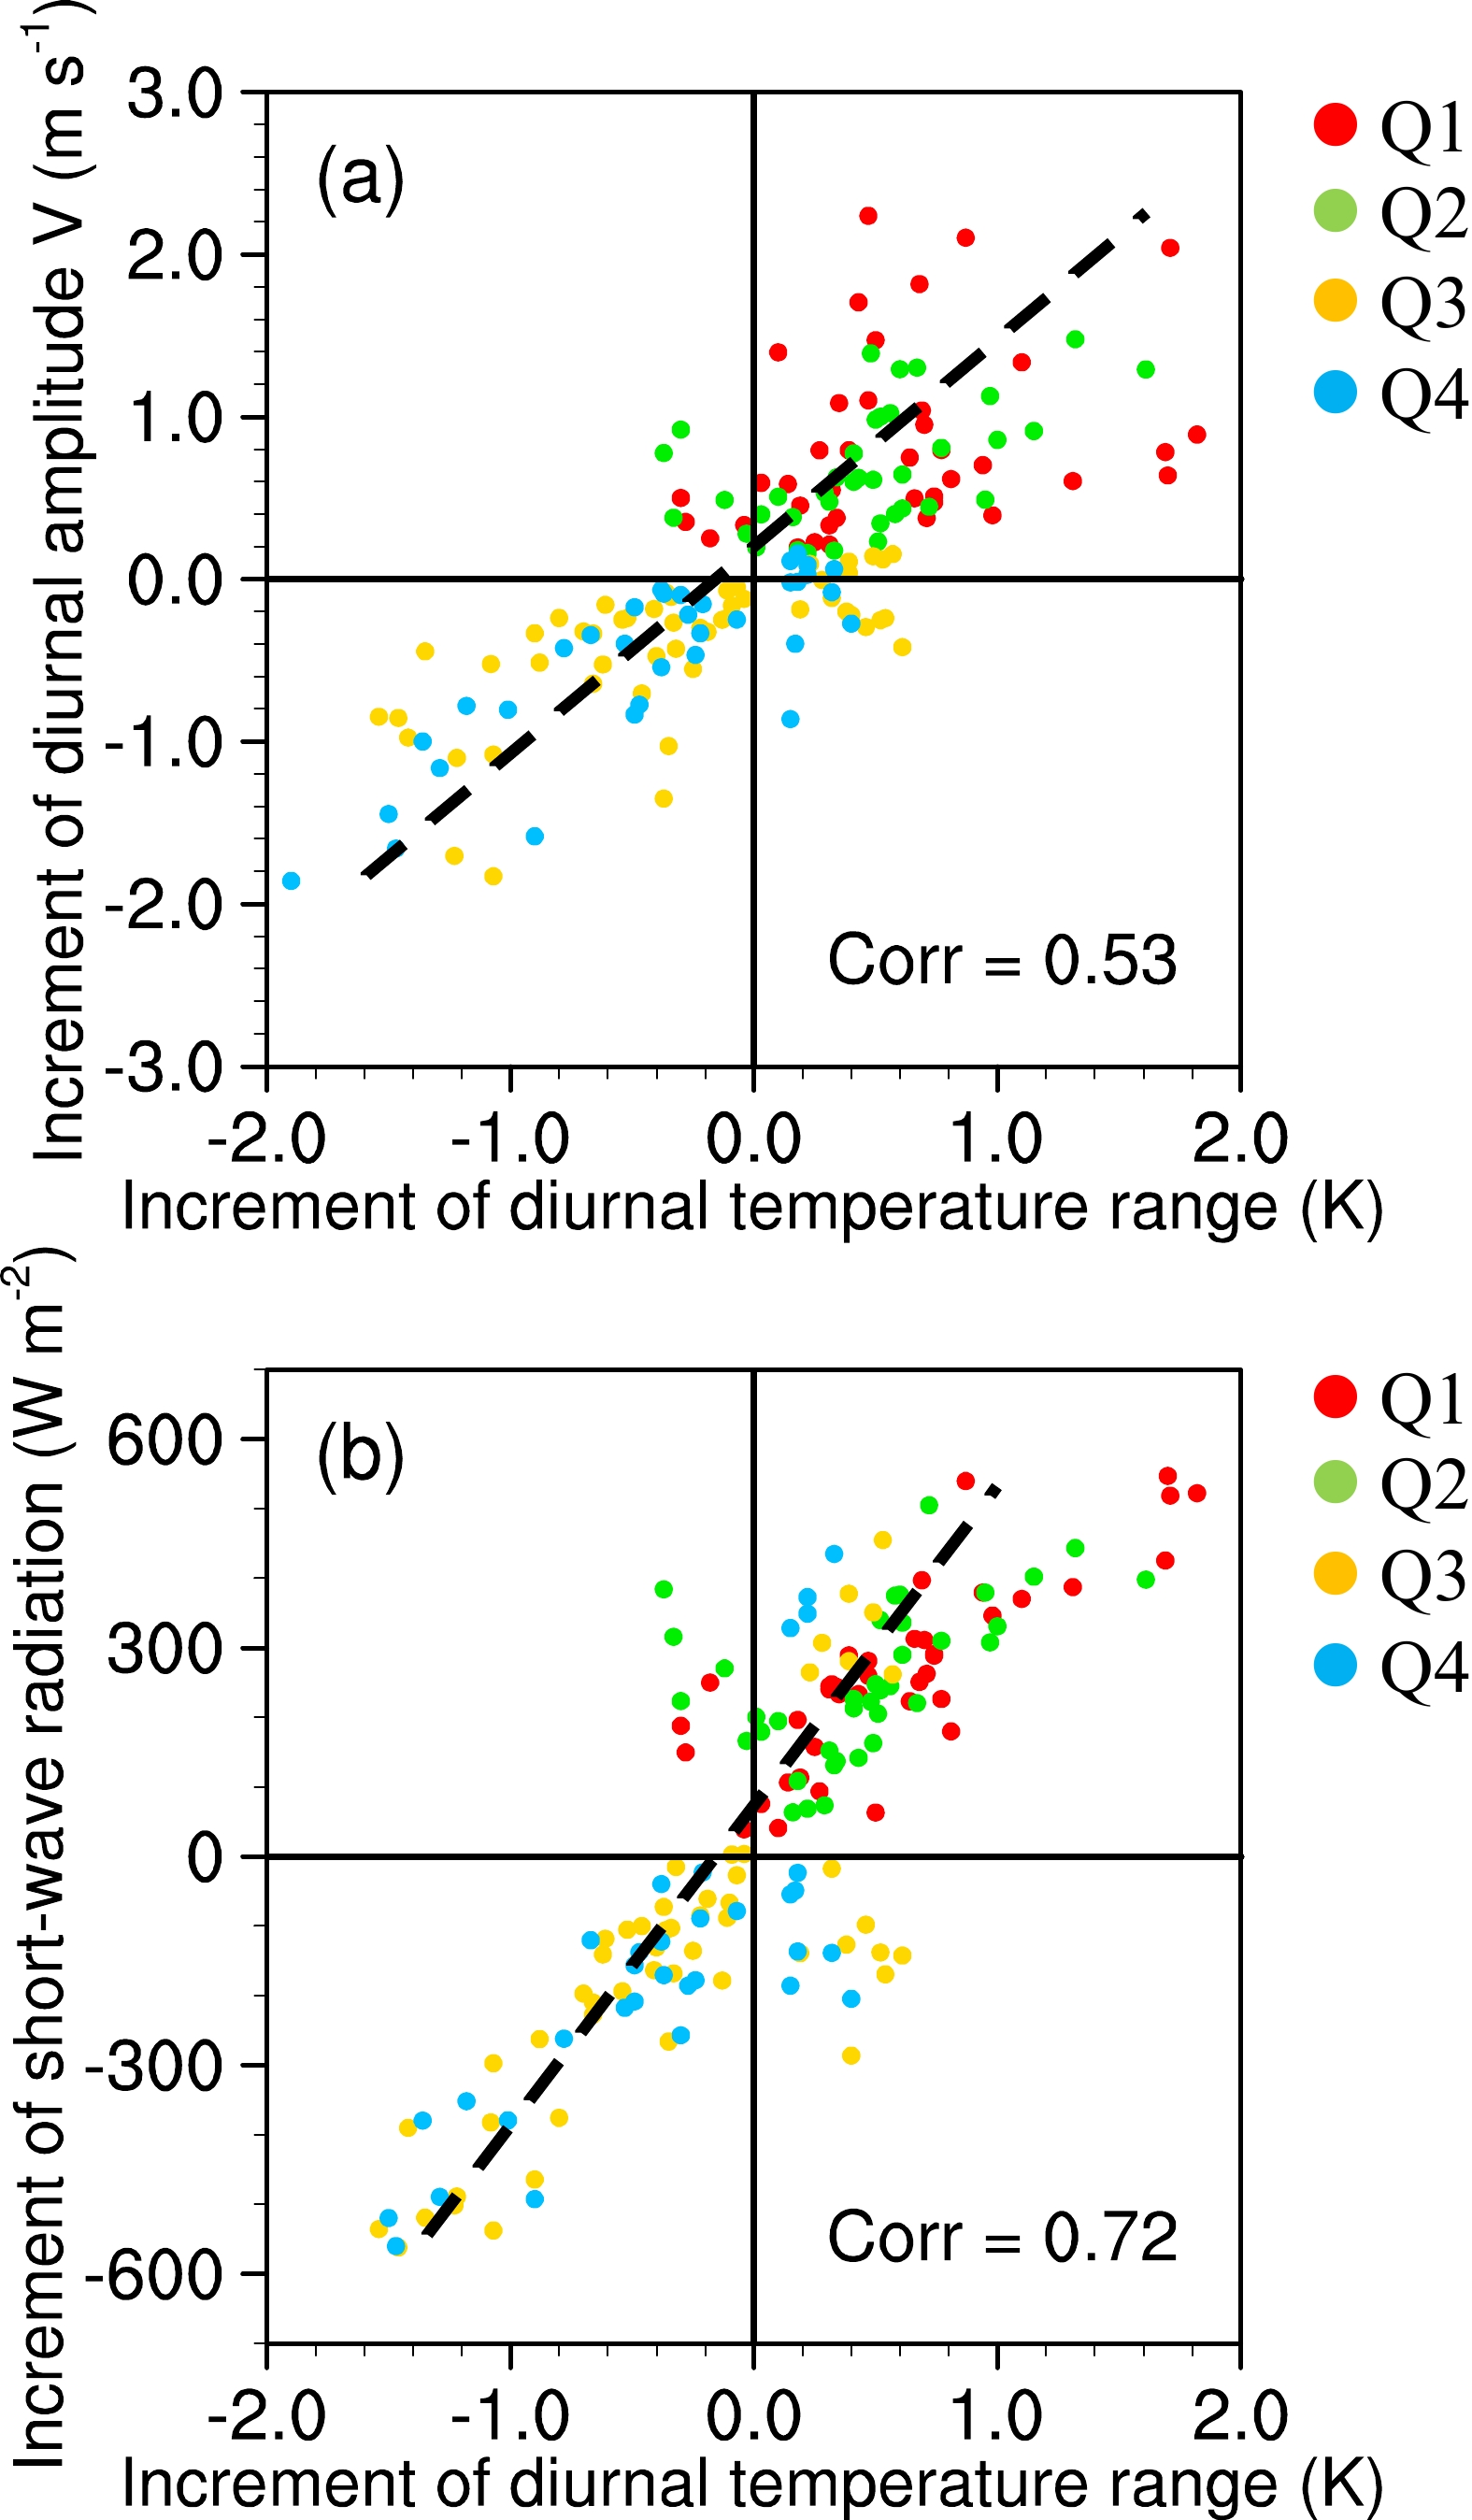
According to the theory of inertial oscillation (Blackadar, 1957; Chen et al., 2014), the daytime heating of the surface leads to the turbulent mixing in the boundary layer that induces the pronounced wind diurnal variations at the boundary-layer top. We can examine these three variables by estimating the surface short-wave radiation, the diurnal temperature range at 925 hPa, and the diurnal wind variation at 850 hPa (Fig. 14). The two types of LLJ formation (Q1 and Q2) with enhanced diurnal wind variations have large increments of diurnal temperature range (Fig. 14a), which corresponds well to a pronounced increment of short-wave radiation (Fig. 14b). As a result, they are confined in the right-upper corner of the diagram while the other two types (Q3 and Q4) are confined in the left-bottom corner. Statistical analysis shows that the variations of the diurnal amplitude of wind among the events are positively related to the diurnal temperature range with a correlation coefficient of 0.53, which exceeds the 99.9% confidence level (Fig. 14a). This close relationship is consistent with inertial oscillation theory in that the diurnal wind variations are induced by the diurnal cycle of turbulent mixing, which also related to the heat exchange (temperature diurnal range) between the near-surface layer and the boundary layer (Blackadar 1957; Chen 2020). The variations in the diurnal temperature range strongly depend on the short-wave radiation with a correlation coefficient of 0.72, which exceeds a confidence level of 99.9% (Fig. 14b). So, the cloud-related short-wave radiation on the ground is a key factor for regulating the diurnal cycle of heat exchange in the boundary layer (Yamada et al., 2007; Wu and Chen, 2021; Wu et al., 2023). Previous studies noted that diurnal thermal forcing over southern China plays a key role in regulating the diurnal amplitude of the wind (Zeng et al., 2019; Chen, 2020; Chen et al., 2021). In this study, we further point out that the intensity of diurnal thermal forcing varies among the LLJ-formation events. So we suggest that the different intensity of diurnal thermal forcing can well explain the diversity in the diurnal amplitude of low-level winds in LLJ formation.
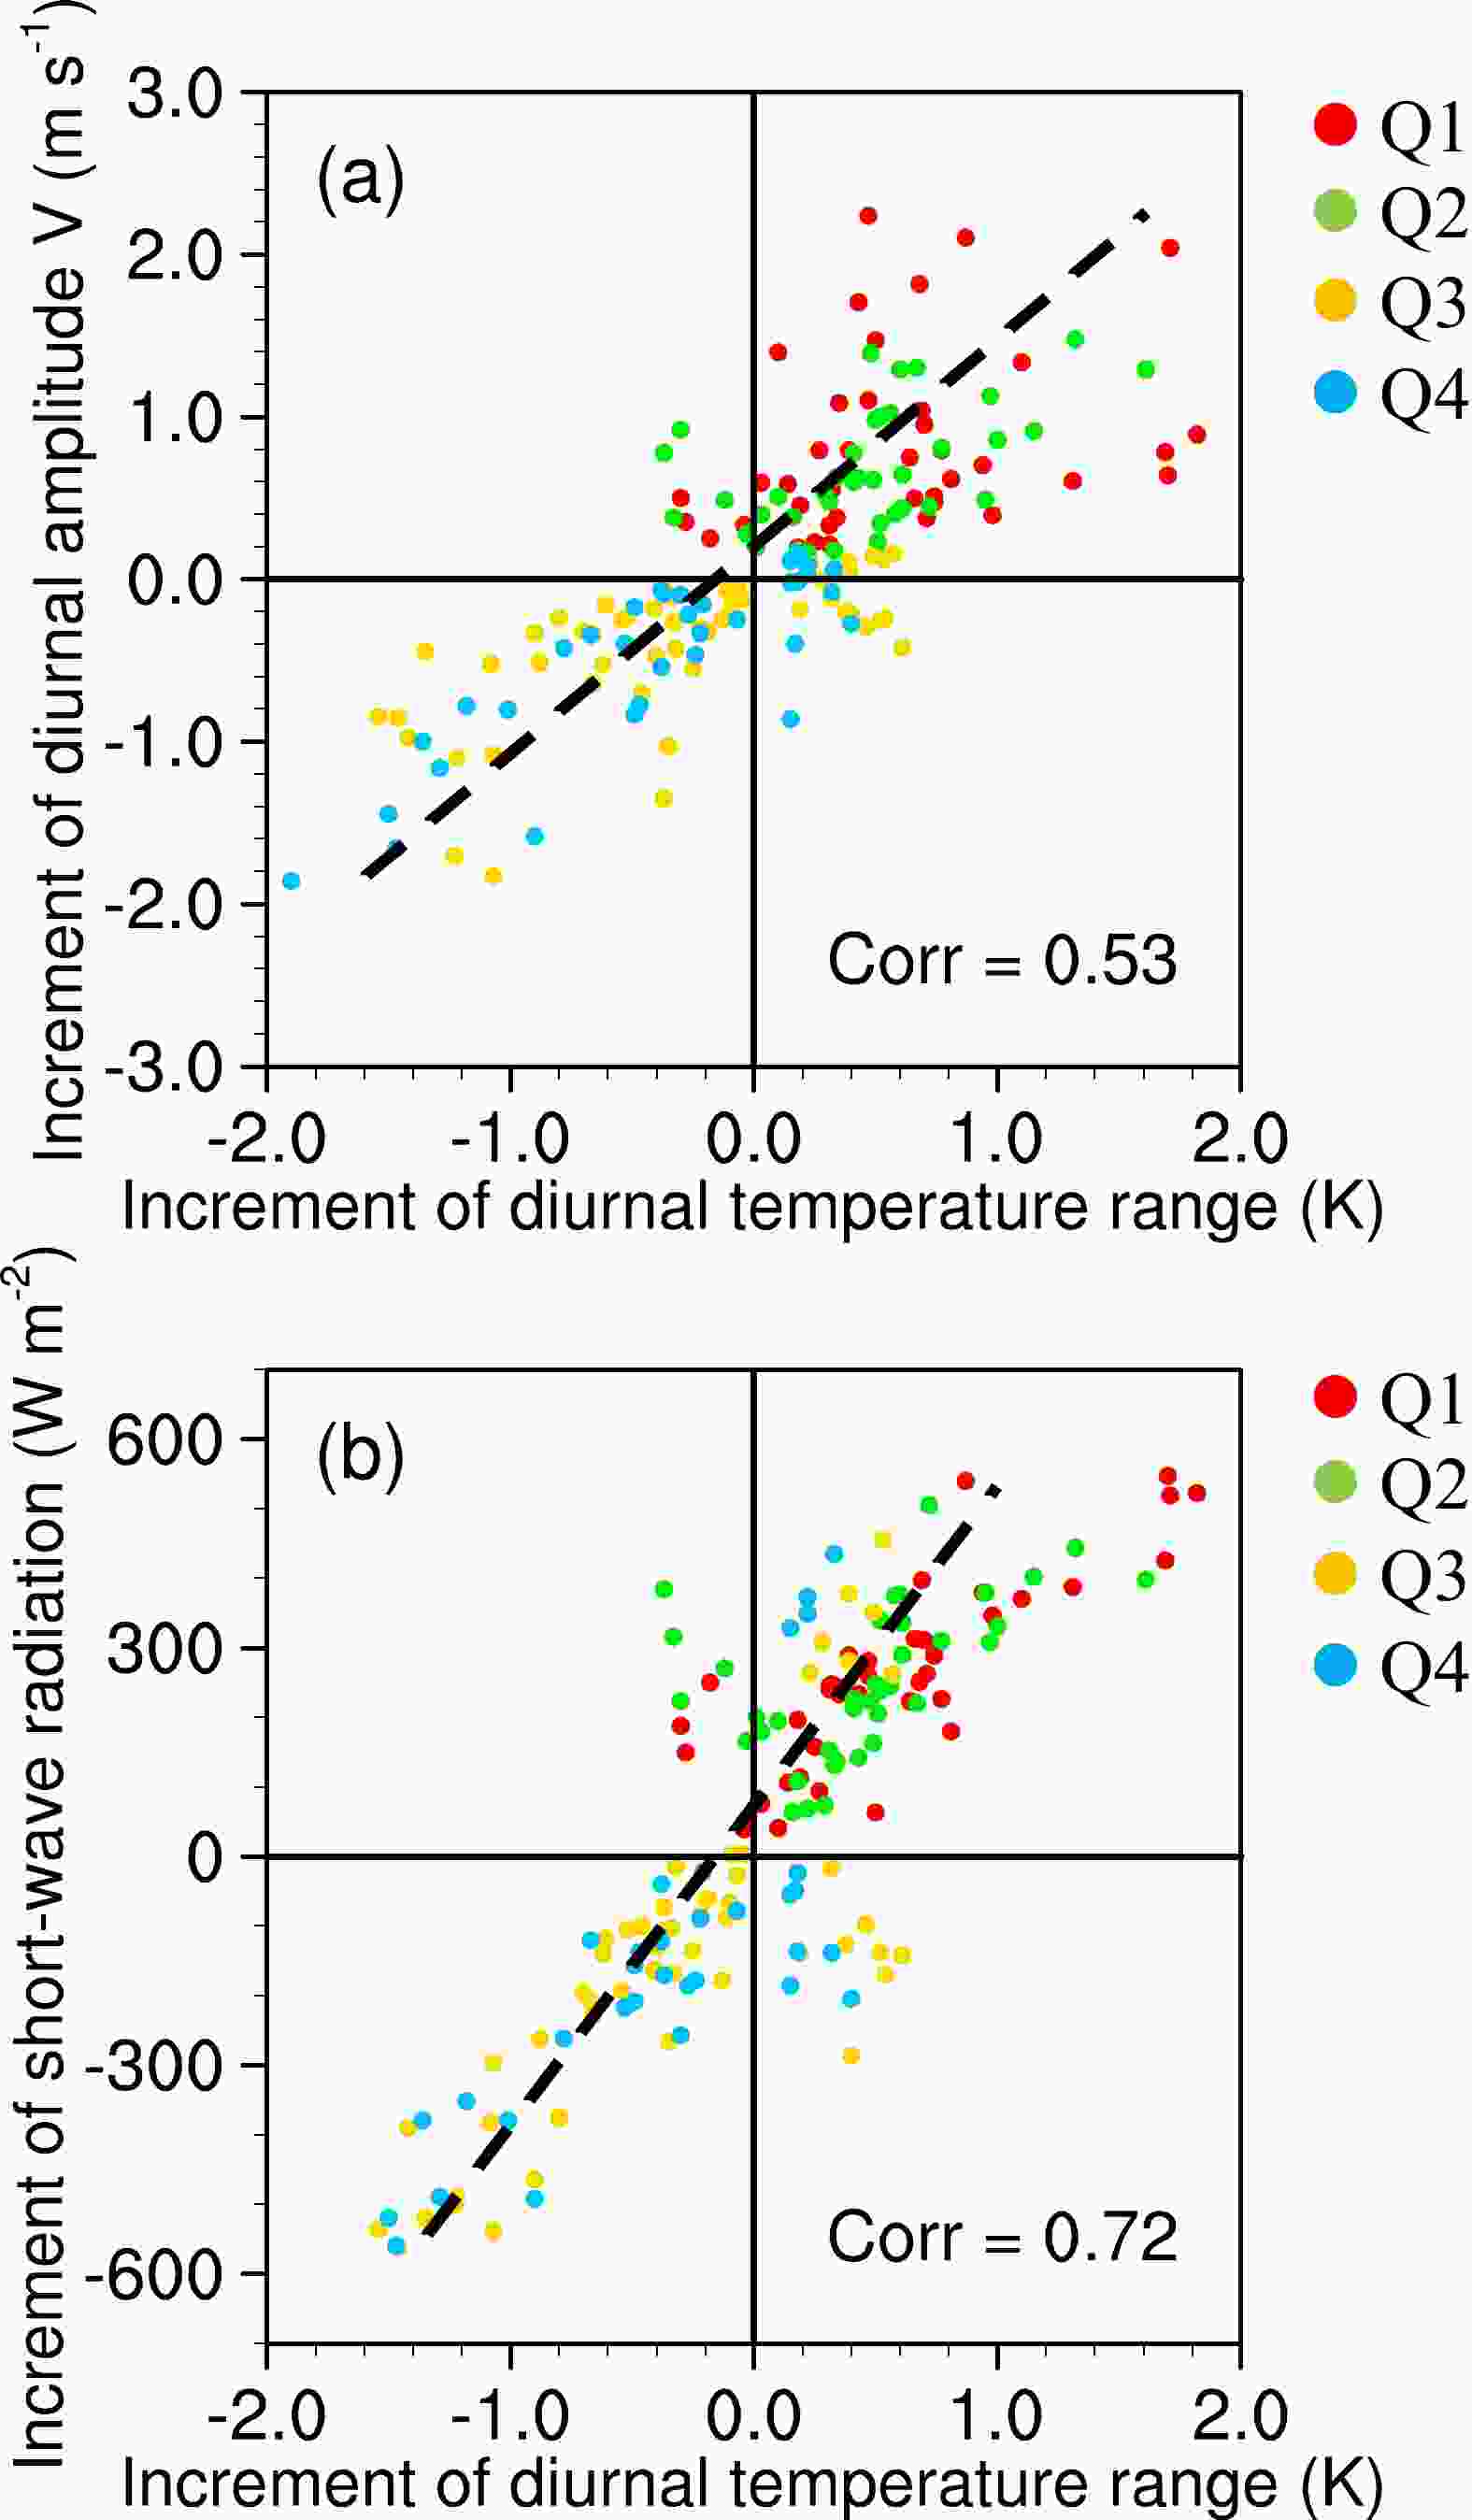
Figure 14. Scatterplots of (a) the increment of the 925-hPa diurnal temperature range (2000 LST minus 0800 LST) (K) against the increment of the 850-hPa diurnal amplitude of meridional wind (m s–1), (b) the increment of 925-hPa diurnal temperature range (K) against the increment of temporal mean short-wave radiation at the surface from 1100 LST to 1700 LST (W m–2). The correlation coefficients are shown in the bottom right of each plot. Variables are averaged over 24°–28°N, 107°–117°E, as shown by red rectangles in Fig. 13.
-
Low-level jets are frequently established over southern China and play a key role in regulating mei-yu season rainfall. To examine the diversity of LLJ formation, we used 30 years of ERA5 reanalysis data to objectively identify the different types of LLJ formation. The physical processes governing the low-level wind variations during the LLJ formation were clarified. The major findings are summarized as follows.
A total of 171 LLJ formation events were identified over southern China in the mei-yu seasons of 1989–2018. They are featured by strong low-level southwesterlies on Day 0 with a maximum wind speed at the eastern slope of the Yunnan-Guizhou Plateau. The daily mean and diurnal amplitude of the low-level winds vary in the different LLJ formation events. We further categorized the LLJ formation events into four types based on the different increases in these two components. Two types of LLJ formation (Q1 and Q4) have relatively large increases in their daily southerly wind components. In contrast, the other two types (Q2 and Q3) are characterized by relatively large increases in the daily westerly wind components. The increases in diurnal amplitude of low-level winds are pronounced in Q1 and Q2, while they are relatively small in the other two types (Q3 and Q4). The four types of LLJ formation are distinguishable from each other and are manifested by diversity in their low-level wind variations.
We first examined the varying synoptic-scale disturbances over southern China associated with LLJ formation using an objective classification scheme of an SOM algorithm. The two types of LLJ formation (Q1 and Q4) with large increases in daily southerlies are mainly induced by a west-east dipole of pressure change. Such patterns associated with the southwest vortex and/or the WPSH lead to a relatively large increase in the southerly wind component during LLJ formation. In contrast, the other two types of LLJ formation (Q2 and Q3), which have a relatively large increase in their daily westerly component, are related to a northwest-southeast dipole of pressure change, due to the interaction between the mid-latitude trough and the WPSH. Such differing combinations of the synoptic-scale disturbances account for the diversity in LLJ formation in terms of increased daily-mean low-level winds.
We further compared the diurnal thermal forcing at diurnal timescales among the four types of LLJ-formation events. The two types (Q1 and Q2) with enhanced diurnal wind variations have a large increase in the diurnal temperature range from Day –1 to Day 0. This feature well corresponds to a pronounced increase in solar radiation over the landmass of southern China. The intensified diurnal thermal forcing is favorable for relatively large increases in the diurnal amplitude of southerlies for nocturnal LLJs. In contrast, the other two types (Q3 and Q4) feature a reduced change in the diurnal temperature range, which is consistent with the reduced change in solar radiation and small wind diurnal variations. The differential intensity of diurnal thermal forcing can well explain the diversity in the diurnal amplitude of low-level winds in the various LLJ-formation processes.
Previous climatological studies have shown that the nocturnal amplitude of low-level winds over southern China can be induced by synoptic-scale disturbances and diurnal thermal forcing (Yamada et al., 2007; He et al., 2016; Liu et al., 2022; Zeng et al., 2022). Recent studies indicate that the diurnal variations of the wind are related to diurnal thermal forcing induced by cloud radiative effects (Gao et al., 2019; Yin and Porporato, 2020; Wu and Chen, 2021; Li et al., 2022). Our study further suggests that these processes are also applied to the formation events of strong low-level winds as LLJs, in which the increased southwesterlies of the LLJs result from the different combinations of synoptic-scale disturbances and diurnal thermal forcing. We further found that the increases in the daily-mean winds of LLJs are associated with daily variations of synoptic-scale disturbances, which can be traced back to the days before LLJ formation. The intensity of diurnal thermal forcing in the daytime can affect the nocturnal amplitude of LLJs, indicating a 12-h time-lagged relationship between them. Moreover, the wind diurnal variations may lag behind the diurnal thermal forcing by 24 hours if cloud regimes (or weather states) are taken into account (e.g., Wu et al., 2023). This time-lagged relationship between these key variables indicates predictability for LLJs by estimating the potential increases of low-level winds in terms of their daily mean and diurnal amplitude. In this study, we also found that the four types of LLJ formation events express different responses to downstream precipitation in section 4. Heavy rainfall is usually associated with LLJ-induced mesoscale conditions such as dynamic lifting, water vapor transport, and convective instability (Chen et al., 2017; Luo et al., 2017; Xue et al., 2018; DC19; Sun et al., 2019). Further studies which quantify the impacts of the different types of LLJ formation on these mesoscale conditions are warranted to improve our understanding of the heavy rainfall downstream.
Acknowledgements. The authors are grateful to the ECMWF for providing the ERA5 reanalysis data. This study is supported by the Guangdong Major Project of Basic and Applied Basic Research (2020B0301030004) and the National Natural Science Foundation of China (Grant Nos. 42275002, 41875055, and 42122033).
Formation of Low-Level Jets over Southern China in the Mei-yu Season
- Manuscript received: 2022-11-27
- Manuscript revised: 2023-02-27
- Manuscript accepted: 2023-04-04
Abstract: This study examines the diversity of low-level jet (LLJ) formation and related physical processes over southern China. A total of 171 LLJ formation events with enhanced daily southwesterlies and early-morning maximum wind speeds were observed during the mei-yu seasons of 1989–2018. The LLJs can be further categorized into four types based on the increases in the daily mean and diurnal amplitude of the low-level winds. Analysis of the synoptic-scale disturbances shows that the two types of LLJ formation (Q1 and Q4), which feature large increases of daily southerly wind components, are mainly induced by west-east dipole patterns of pressure change, in association with the enhanced southwest vortex and/or the western Pacific subtropical high (WPSH). In contrast, the other two types (Q2 and Q3), which feature relatively large increases in their daily westerly components, are related to a northwest-southeast dipole pattern of pressure change due to the mid-latitude trough and the WPSH. We further analyze the considerable variations in the diurnal thermal forcing among the LLJ formation events. The strong (weak) daytime heating of solar radiation leads to relatively large (small) increases in the diurnal amplitude of low-level winds in Q1 and Q2 (Q3 and Q4) types. Therefore, different combinations of synoptic-scale disturbances and diurnal thermal forcings are found to account for the diversity in LLJ formation and associated differences in downstream rainfall patterns. These results help to improve our understanding and prediction of the formation of LLJs.
摘要: 本文探究了中国南部低空急流的多样性及相关物理机制。在1989–2018年的梅雨季节,中国南部共观测到171个低空急流建立事件,它们伴有增强的日平均西南风和清晨的最大风速。根据低空急流建立前一天到建立当天的低层风场日平均和日变化振幅的增幅,可以将低空急流建立事件分成四种类型(即Q1–Q4)。对天气尺度扰动的分析表明,日平均南风分量增幅较大的两种类型低空急流建立事件(Q1和Q4)主要是由东–西偶极型的气压变化模态引起,这种模态与增强西南涡或西太平洋副热带高压有关。相比之下,另外两种类型(Q2和Q3)的日平均西风分量增幅较大,这与中纬度低压槽和西太平洋副热带高压导致的东南–西北偶极型的气压变化模态有关。我们进一步比较了四种不同类型的低空急流建立事件在日变化时间尺度上的昼夜热力强迫。较强(弱)的白天太阳辐射加热导致Q1和Q2(Q3和Q4)相对较大(较小)的低层风场日变化振幅。因此,天气尺度扰动和昼夜热力强迫的不同组合可以很好地解释低空急流形成的多样性及其下游降水分布的差异。这些研究结果有助于提高我们对低空急流形成的理解和预测。


 AAS Website
 AAS WeChat