


 DownLoad:


-
A long-duration atmospheric circulation anomaly over specific regions, known as a persistent anomaly event (Dole and Gordon, 1983), exerts noticeable impacts on climate and extreme events (Cattiaux et al., 2010; Barriopedro et al., 2011; Matsueda, 2011; Otto et al., 2012). The Ural Mountains, North Pacific, and North Atlantic are the three hot spots that feature the maximum occurrence of persistent anomalies (Dole, 1986a, b).
The Ural Mountains are located upstream of East Asia and the atmospheric circulation anomalies of the region profoundly influence the East Asian climate. Measured by the 500-hPa geopotential height anomalies (e.g., Barriopedro et al., 2010; Dunn-Sigouin and Son, 2013), the persistent positive height anomaly event (PAE is brief) in the middle troposphere over the Ural Mountains generally lasts 10 to 30 days and occurs once or twice each summer or winter. Extensive research has supported the close linkage of the synoptic events over East Asia with the Ural PAE (Wei et al., 2011; Yan et al., 2011; Wang and Chen, 2014; Cheung and Zhou, 2016; Wu et al., 2016). For example, the Yangtze River Basin of China in the summer of 1998 suffered the most devastating flood in the past 50 years, and one of the most significant variations in the atmospheric circulation coincident with this event was the maintenance of a Ural PAE (Li and Ji, 2001). In the winter of 2004, two large-scale cold waves infiltrated China, whose occurrence was closely related to a long-duration Ural PAE (Ma et al., 2008). The most disastrous freezing rain and snowstorm event happened in South China in January 2008, concurrent with a Ural PAE that lasted for about 22 days (Ding et al., 2008; Tao and Wei, 2008; Zhou et al., 2009; Li et al., 2012).
Notably, the atmospheric circulation variation over the mid-to-high latitudes of Eurasia has exhibited substantial decadal variability (Liu et al., 2012; Cheung et al., 2015; Luo et al., 2017; Zhao et al., 2022). The decadal variation of the Ural atmospheric circulation may have contributed to China’s warming hiatus in 1998–2013 with more frequent extreme cold events (Xie et al., 2017; Lei et al., 2020). Many previous studies have reported that the following factors may have possibly contributed to the decadal variation of the Ural circulation: the Pacific Decadal Oscillation (PDO; Li and Xian, 2003; Luo et al., 2022), the North Atlantic Sea Surface Temperature (SST) (Li et al., 2018a; Jin et al., 2020; Chen et al., 2021), and Arctic sea ice (e.g., Mori et al., 2014; Yao et al., 2017). The North Atlantic SST anomaly is thought to trigger a Rossby wave train that emanates from the northwestern Atlantic and propagates to the Ural Mountains (Palmer and Sun, 1985; Li, 2004). Less-than-normal Arctic Sea ice tends to weaken the meridional temperature gradient between the mid-latitudes and Arctic, decelerating the climatological westerly jet, favoring the development of positive geopotential height anomalies over the Ural Mountains (Han and Li, 2013; Walsh, 2014; Xu et al., 2021; Duan et al., 2022). These results highlight the role of lower boundary forcing in modulating the Ural background circulation.
However, whether the Ural PAE exhibits a significant decadal change is unclear. If the answer is yes, whether the lower boundary forcings like SST and sea ice concentration (SIC) could modulate the decadal variation of Ural PAEs remain an unresolved issue. To address this possibility, an observational and modeling approach is employed. Sensitivity experiments using the Coupled Model Intercomparison Project Phase 6 (CMIP6)-Atmospheric Model Intercomparison Project (AMIP) with historically evolving lower boundary forcings and an atmospheric general circulation model (AGCM) that isolate the forcings are performed accordingly in this study.
The remainder of this paper is organized as follows. Section 2 describes the data, methods, and model experiments. In section 3, we examine the decadal variation of the observed Ural PAE occurrence and check the reproducibility of the observed decadal variation in CMIP6 AMIP simulations. We especially focus on the individual contributions of a wide SST and Arctic Sea ice anomaly, each of which are isolated by using AGCM-Community Atmospheric Model (CAM5) sensitivity experiments. Finally, a summary and discussion are drawn in section 4.
-
The daily atmospheric reanalysis datasets on a 1.25° × 1.25° grid from 1979–2014 are provided by the Japanese Meteorological Agency (Ebita et al., 2011), including the horizontal wind, geopotential height, and sea level pressure (SLP). We also use the National Oceanic and Atmospheric Administration (NOAA) 20th Century Reanalysis V2c (20thCRV2c) (1851–2014), with a horizontal resolution of 2.0° × 2.0° (lat/lon) (Compo et al., 2011), to explore the impacts of PDO and AMO for a more extended period. The SST during 1901–2014 and sea ice concentration (SIC) during 1979–2014 are from the Met Office Hadley Centre (Rayner et al., 2003), which are gridded to 1.0° × 1.0°. The Pacific Decadal Oscillation (PDO) index is defined as the leading Empirical Orthogonal Function (EOF) principal component (PC) time series of winter mean de-trended SST anomalies over the North Pacific, north of 20°N (Mantua et al., 1997), and the 11-year running average is performed on the PC series to obtain the decadal component. The Atlantic Multidecadal Oscillation (AMO) index is defined as the de-trended and 11-year running average of the winter mean SST anomalies over the North Atlantic basin (0°–60°N, 7.5°–75°W) (Sutton and Hodson, 2005). As in Wu et al. (2011), the winter mean SIC index over the Barents-Kara Seas region is used and averaged over 67.5°–80.5°N and 20.5°–80.5°E.
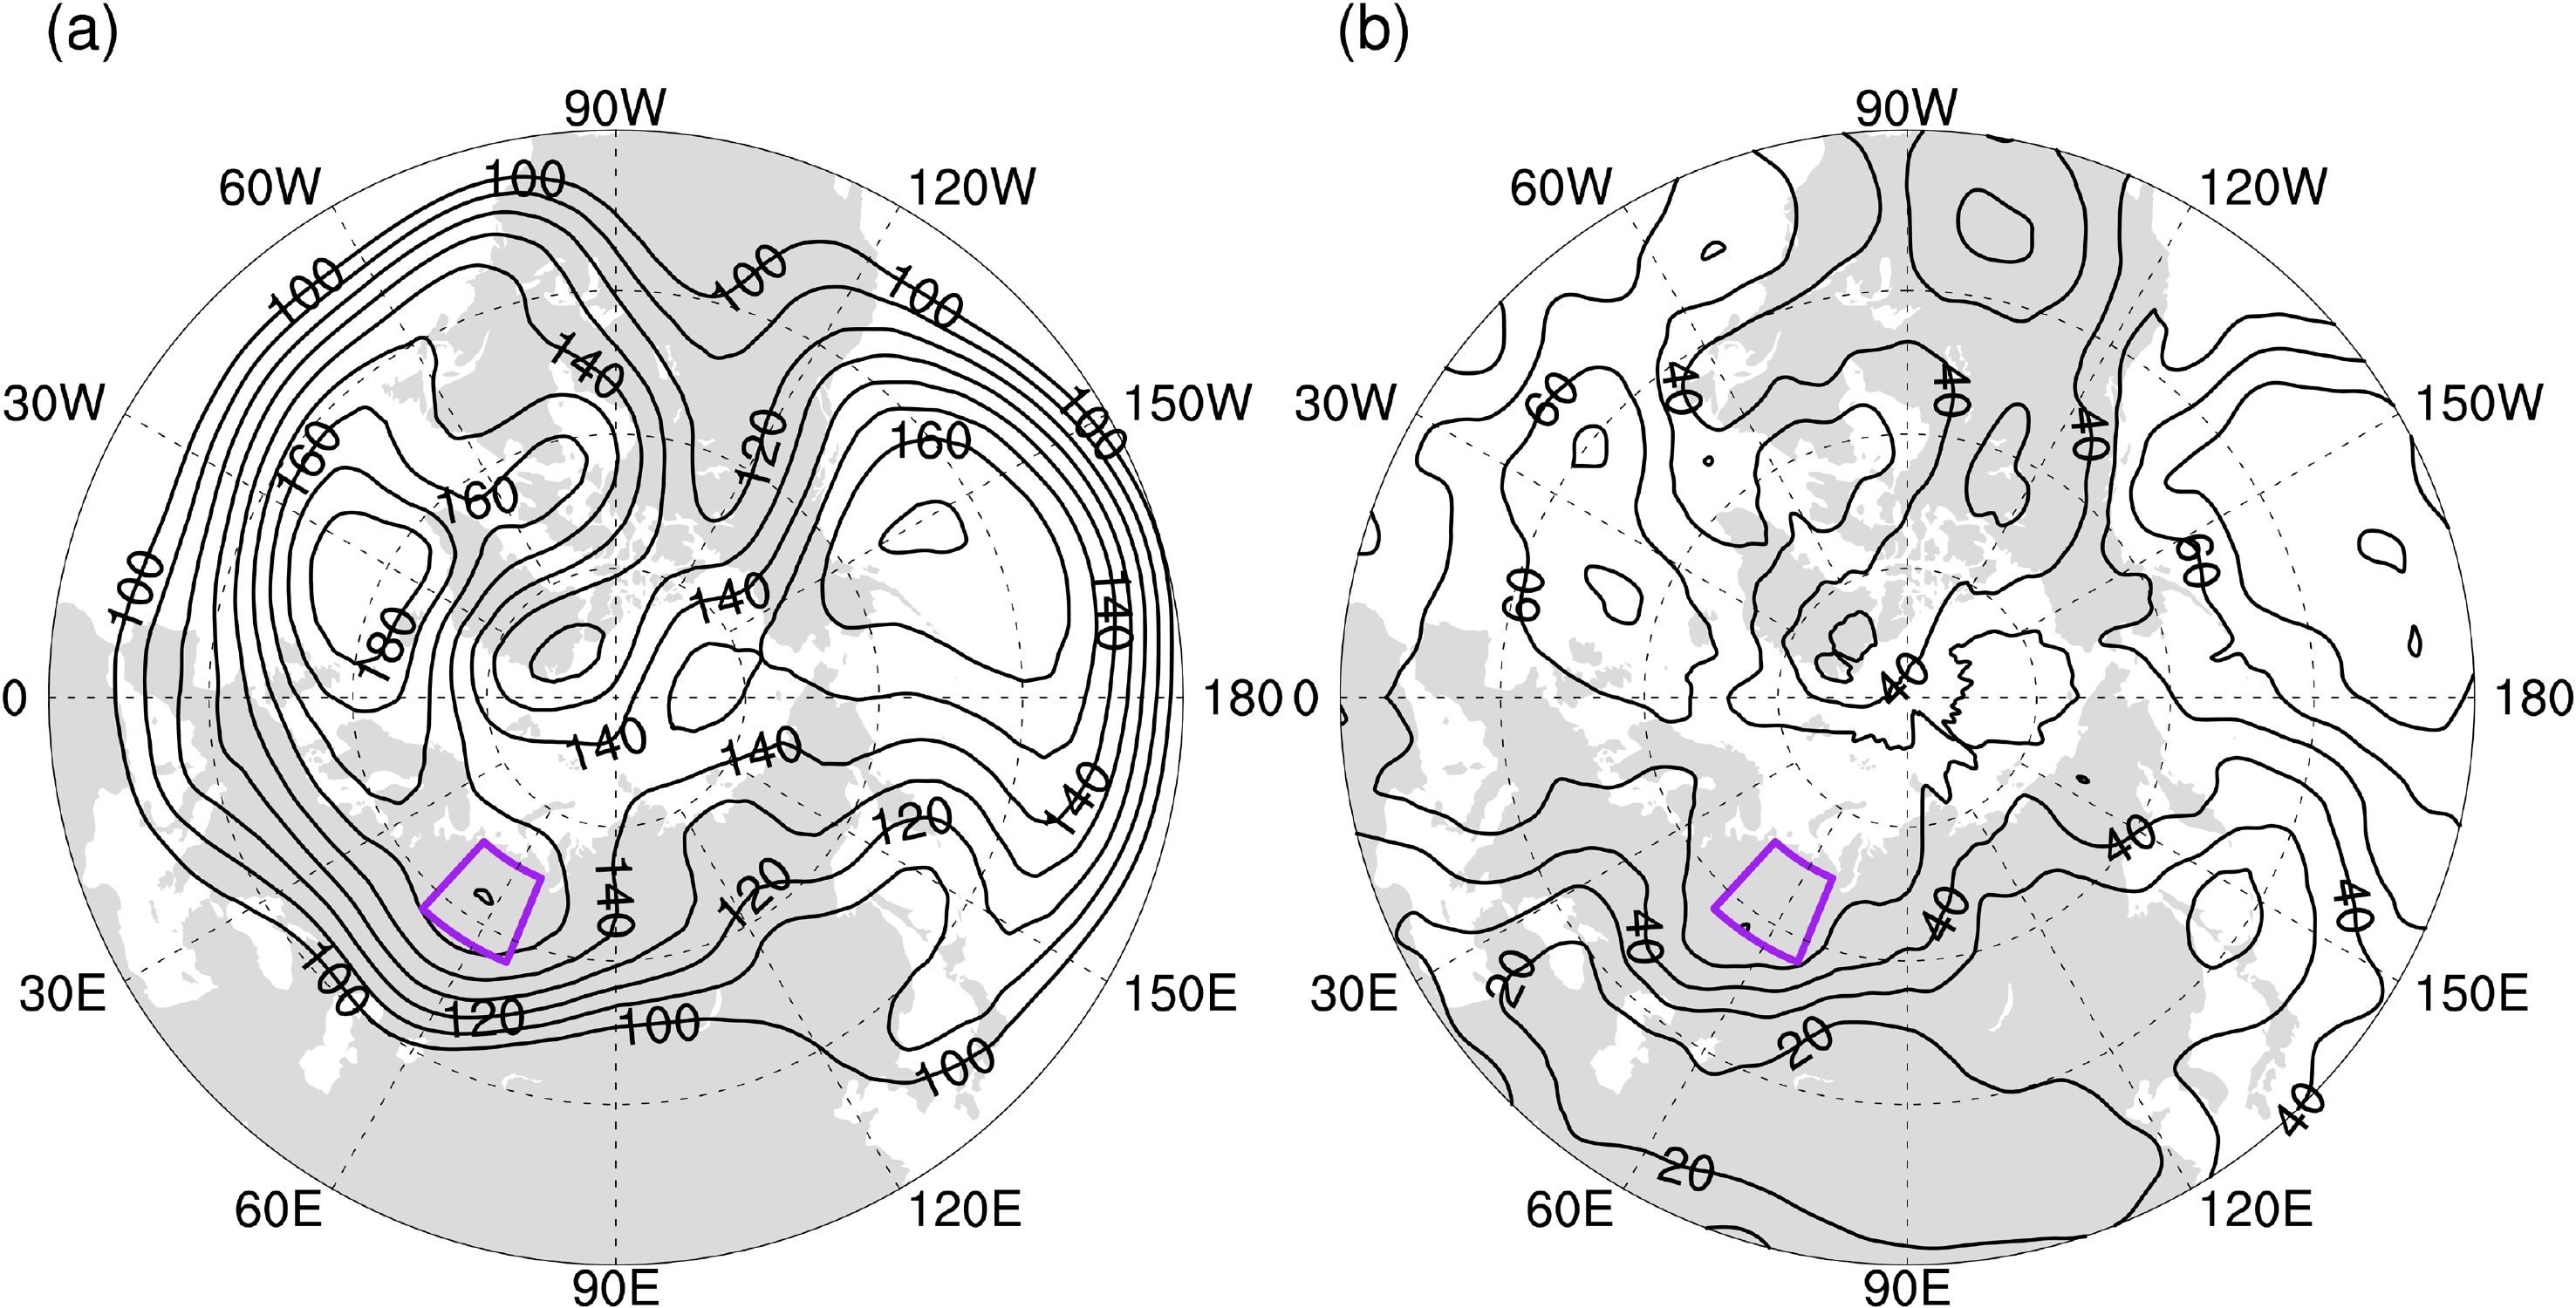
The threshold that defines PAE in this study is based on Dole and Gordon (1983), but the 500-hPa geopotential height (Z500) anomalies are normalized by zonal-mean standard deviation at the latitude of each point. This definition directly reflects the persistent atmospheric circulation anomalies and has also been widely used in previous studies (Barriopedro et al., 2010; Dunn-Sigouin and Son, 2013; Miller et al., 2020; Yao et al., 2022). In this study, a PAE is defined when the normalized anomaly is greater than 0.75 and persists for at least ten days. Over the Ural Mountains, the Z500 anomaly is obtained by averaging the values at all points within an area of 5° (lat) × 10° (lon) centered on 62.5°N and 57.5°E. The central point is consistent with the maximum standard deviation (abbreviated as std hereafter) of winter daily Z500 (Fig. 1a) and also with the maximum PAE occurrence around the Urals (Fig. 1b). Then the regional Z500 anomaly is normalized by regional std, which is the average of zonal-mean std at three latitudes (57.5°N, 62.5°N, and 67.5°N). The climatology of the mean winter regional std is 128 gpm; thus, a 0.75-times std is equal to 96 gpm. When the normalized regional anomaly is greater than 0.75 and maintains itself for at least ten days, then a Ural PAE is classified. Before calculating the anomaly, a five-day running average is applied to the daily Z500 to remove the possible effect of shorter synoptic-scale disturbances. The climatology is calculated as the 1979–2014 mean value. The statistical significance in composite analyses is estimated by using a Student’s t-test. Finally, winter is defined as December to the following February.

Figure 1. (a) The standard deviation of daily Z500 (units: gpm) and (b) the accumulated occurrence of persistent anomaly events (units: times) during the 1979–2013 winters. The boxed region is bounded by 57.5°–67.5°N and 47.5°–67.5°E.
-
Previous studies have reported on the capability of numerical models in simulating the basic atmospheric circulation and the occurrence of blocking events (Mizuta et al., 2012; Masato et al., 2013; Davini and D’Andrea, 2016; Schiemann et al., 2017). Most models can reproduce the geographical distribution of blocking in the Northern Hemisphere reasonably well (e.g., Anstey et al., 2013; Dunn-Sigouin and Son, 2013; Mokhov et al., 2013). Therefore, outputs from the AMIP runs of the 17 state-of-the-art models attending the CMIP6 are used (Table S1 in the Electronic Supplementary Material, ESM). The archived data of these models have 19 standard vertical levels. The AMIP experiments are conducted with the prescribed realistic SST and SIC forcings, as well as external forcings (including volcanic, solar, and anthropogenic forcings). Its detailed description is given in Eyring et al. (2016). Due to the prescribed underlying SST and SIC forcings, the AMIP experiments facilitate the understanding of the roles of SST and SIC in climate variations. The AMIP runs are integrated for the period 1979–2014. Only the first member of each model is analyzed to give an equal weight for each model.
In addition, the sensitivity simulations are conducted by CAM5, which is the atmospheric component of the Community Earth System Model (CESM1_2_2) with a horizontal resolution of 1.9° latitude × 2.5° longitude, with 26 hybrid sigma levels (Gent et al., 2011). Four sets of 66-year ensemble experiments, driven by the prescribed SST and SIC, are conducted. They are summarized in Table S2 and displayed in Fig. S1 in the ESM.
The first experiment is forced with the climatological SST and sea ice conditions (marked as CTRL_Exp). The second experiment is SIC-only (marked as SIC_Exp), in which the model is forced gradually with a SIC anomaly superimposed on the climatological December-to-February SIC. The SIC anomaly is given by the difference in the winter mean Barents-Kara SIC between 2001–2013 and 1979–1997. The third is a PDO-SST experiment (marked as PDO_Exp), in which the model is forced gradually with an SST anomaly superimposed on the climatological December-to-February SST. The SST anomaly is the difference in the winter mean North Pacific SST between the negative and positive phases of the PDO (negative minus positive). The positive (negative) phase of PDO is defined when the normalized PDO index is greater (less) than 0.5 (–0.5). The last is an AMO-SST experiment (marked as AMO_Exp). This experiment is the same as PDO_Exp, except that the SST anomaly is the difference in the winter mean North Atlantic SST between the positive and negative phases of AMO (positive minus negative). The method of obtaining positive and negative phases of the AMO is similar to those of PDO. Except for CTRL_exp, the modeling experiments described above are referred to as perturbation experiments.
The responses in atmospheric variables are obtained by subtracting their mean in the CTRL_Exp from those in the perturbation experiments. In each CAM5 experiment, the first 20-year simulation is discarded as the model’s spin-up, and the remaining 46-year simulation (including 45 winters) is used for analysis. The 46-year simulation is equivalent to an ensemble of 46 individual simulations with different initial fields (e.g., Zhao et al., 2012). As in the observational analysis, a Student’s t-test is used to evaluate the statistical significance of the atmospheric response.
-
From Fig. 2, the frequency of Ural PAEs exhibited moderate variability over 1979–2013, with a lower frequency of occurrence during 1979–2000 (with zero occurrences during 1988–1992) but with an increased occurrence (one or two events each year) since 2000 (Figs. 2a, b). This indicates a decadal variation in the Ural PAE occurrence frequency. From an 11-year running t-test (Fig. 2c), the increased PAE occurrence frequency is significant at the 95% confidence level after 1997 and peaks in 2001, indicating a significant decadal increase after the early-2000s. To highlight the decadal variation of PAEs and provide a further comparison, we divide the whole period into two sub-periods: 1979–1997 (marked as P1) and 2001–2013 (marked as P2). There are 10 and 14 events during the two sub-periods, respectively. The average occurrence is 0.53 and 1.08 per winter for P1 and P2, respectively. This suggests a difference in the PAE occurrence between the two sub-periods. The difference is also seen in Fig. 2d which shows the spatial distribution of PAEs based on grid points (P2 minus P1). From this product, there is a significantly positive maximum over the Urals, verifying a decadal shift in Ural PAE occurrence.

Figure 2. A comparison of Ural PAEs between the two sub-periods (1979–1997 vs. 2001–2013). The (a) annual occurrence of winter Ural PAEs during 1979–2013, (b) detailed PAE processes with the beginning and ending dates, (c) significance test results for the shift in occurrence based on an 11-year running t-test, and (d) difference of PAE occurrence (units: times) during P2 minus that in P1. The long (short) dashed line in (c) represents 90% (95%) significance. The purple box in (d) corresponds to the defined Ural Mountains region (centered at 62.5°N, 57.5°E). The hatched (dotted) areas in (d) are significant at the 95% (90%) confidence level.
The decadal variation of Ural PAE occurrence is also derived from a comparison of mean winter atmospheric circulation during the two sub-periods (Fig. 3). Those over Eurasia are nearly the opposite. Negative height anomalies are seen over the Urals during P1 (Fig. 3a). In contrast, positive height anomalies are seen during P2, which is consistent with the occurrence of PAEs (Fig. 3b). Besides Ural PAEs, other atmospheric patterns associated with the decadal variability in the Northern Hemisphere include increased atmospheric blocking frequency over the Urals, Greenland, and Siberia (Luo et al., 2016; Ye et al., 2018) and increased frequency of cold extremes over Eurasia (e.g., Zhang et al., 2012; Ye and Messori, 2020).

Figure 3. A comparison of winter seasonal mean Z500 (units: gpm) anomalies during (a) P1 and (b) P2. Panel (c) illustrates the difference of (b) minus (a). The hatched (dotted) areas are significant at the 95% (90%) confidence level.
Figure 4 compares the SST and SIC anomalies during the two sub-periods. During P1 there are negative SST anomalies in the North Atlantic and the central-western North Pacific but positive anomalies in the eastern North Pacific along the western coast of North America (Fig. 4a). Especially notable are the strong, albeit insignificant, positive SST anomalies over the central-eastern Pacific, which imply the possible role of strong El Niño events. To verify this, we examined two super El Niño cases (1982/83 and 1997/98), but no Ural PAEs were found. Thus, the influence of the super El Niño is negligible.

Figure 4. The comparison of winter mean SST anomalies (units: °C) during (a) P1 and (b) P2. Panel (c) shows the difference of (b) minus (a). (d–f) Same as in (a–c) but for SIC. The hatched (dotted) areas are significant at the 95% (90%) confidence level.
During P2, the distribution of SST anomalies is nearly opposite to that in P1 (Fig. 4b). This decadal variation in SST is even apparent in their difference (Fig. 4c). For SIC, the most remarkable feature is the opposite anomaly in the Barents-Kara Seas in the two sub-periods (Figs. 4d–f). These significant decadal changes in the atmospheric circulation and underlying SST and SIC variations from P1 to P2 have also been reported in previous studies (e.g., Wang and Chen, 2014; Yang and Yuan, 2014; Guan et al., 2015; Huang et al., 2017; Xie et al., 2017; Li et al., 2018b). Next, we explore whether the SST and SIC can modulate the decadal variations of Ural PAE occurrence by analyzing the CMIP6 AMIP simulations.
-
Figure S2 in the ESM compares the standard deviation (std) of winter daily Z500 in the AMIP experiments of the 17 available CMIP6 models for the historical period (1979–2013). All models reproduce the three centers of maximum std in the observations. The std center over the Urals is reproduced by most of the models, except for two models, IPSL-CM6A-LR and MRI-ESM2-0. This illustrates that these AMIP experiments reproduce the observational climatology reasonably well.
Next, we compare the Ural PAE occurrence in these models during 1979–2013. The observed decadal increase is simulated by 13 out of the 17 models (Fig. 5). The four outliers include CanESM5, INM-CM4-8, KACE-1-0-G, and MIROC6. In contrast, the four models which demonstrate outstanding and significant skill in capturing the observed shift include ACCESS-CM2, CESM2-WACCM, EC-Earth3-Veg, and NorESM2-LM. This is verified by an 11-year running t-test (Fig. S3 in the ESM). These models are therefore referred to as SHIFT-LIKE-OBS models.

Figure 5. The comparison of the annual occurrence (blue bar) of Ural PAEs during 1979–2013 winters in AMIP historical experiments from 17 CMIP6 models. The red solid horizontal lines represent the average for the two sub-periods. The string “avg1” and “avg2” in each panel denotes the mean during the subperiod (1979–1997) and the subperiod (2001–2013), respectively. The p-value corresponding to the difference in the averaged Ural PAE between P2 and P1 is displayed below the model’s name in each panel.
The differences in the ensemble mean Z500 between the P2 and P1 subperiods in the SHIFT-LIKE-OBS models are displayed in Fig. 6a. From Fig. 6a, we can see an anomalous anticyclone around the East European Plain and two anomalous cyclones around the Mediterranean Sea and Balkhash Lake, which is similar to the reanalysis results (Fig. 3c). Since the uneven zonal distribution of the geopotential height could more reasonably reflect the Ural anticyclone, the composite Z500 deviations (Z500 minus its zonal mean along 0°–110°E) between P2 and P1 in the reanalysis are shown in Fig. S4a in the ESM. The atmospheric pattern in Fig. 3c favors the zonal gradient between the geopotential height around the Ural Mountains and its south/east flank, subsequently favoring the occurrence of a Ural PAE (Fig. 2d). The model simulation shows similar results (Fig. S4b), albeit with relatively weaker statistical significance. Concurrently, the negative anomalies of the zonal wind component at 300-hPa over the Eurasian mid-latitudes indicate a weakening of the westerly jet (Fig. 6b). The Ural PAE corresponds to the positive SLP anomalies over the northern Eurasian continent and the negative SLP anomalies over mid-latitude Eurasia, thereby intensifying the East Asian winter monsoon (EAWM) activity (Fig. 6c). Consequently, contrary to the warming trend during P1 (Fig. S5a), a cooling anomaly appears over East China during P2 (Fig. S5b). These results confirm the effect of a Ural PAE on East China, which is consistent with previous studies (Zhou et al., 2009; Peng and Bueh, 2011; Wang et al., 2017; Bueh et al., 2018). The analyses suggest that the underlying boundary anomalies may indeed affect the decadal change in Ural PAE occurrence.

Figure 6. The difference in ensemble mean atmospheric circulation variables during the P2 sub-period minus that during the P1 sub-period in the SHIFT-LIKE-OBS models: (a) Z500 (units: gpm), (b) U300 (units: m s–1), and (c) SLP (units: Pa). The hatched (dotted) areas indicate significance at the 95% (90%) confidence level.
Besides the AMIP simulation, we further analyze the CMIP6 historical simulation of the aforementioned four models. Because the daily geopotential height in the EC-Earth3-Veg historical simulation is unavailable, we only analyze the annual occurrence of the winter Ural PAE during 1979–2013 in ACCESS-CM2, CESM2-WACCM, and NorESM2-LM (figure not shown). The averaged Ural PAE occurrence in P1 and P2 are almost equal in all three models, showing different results than their corresponding AMIP simulations and the reanalysis results. Considering that the historical experiment is run with the full-coupled model while the AMIP experiment is run with the prescribed underlying thermal forcing, we suspect that the atmospheric feedback possibly decreases the response of the Ural PAE occurrence to the underlying thermal forcing. On the other hand, the current model cannot well reproduce the decadal climate variability (Xia et al., 2022), which may fail to simulate the decadal variation of the Ural PAE occurrence. However, the detailed reasons should be carefully explored in future studies.
-
As shown in Fig. 4c, the SST anomalies over the North Atlantic and the North Pacific resemble the modes of AMO and PDO, respectively. At the same time, the SIC anomalies are most obvious in the Barents-Kara Seas (Fig. 4f). Thus, we explore the potential roles of SIC, PDO, and AMO. Figure S6 in the ESM shows the low-pass filtered winter PDO and AMO index during 1901–2013 along with the time series of the SIC index in the Barents-Kara Seas during 1979–2013. Around 2000, the sea ice in Barents-Kara Seas sharply declined, and the PDO shifted from positive to negative, overall concurrent with a shift of the AMO to its positive phase. To obtain insight into the potential influence of these three factors, the differences of both Z500 and PAE occurrence, as derived from the NOAA 20thCRV2c reanalysis, between the years when the specific indices are positive and negative are shown in Fig. 7. Here, only the results for the PDO and AMO are given because the SIC data length is too short.
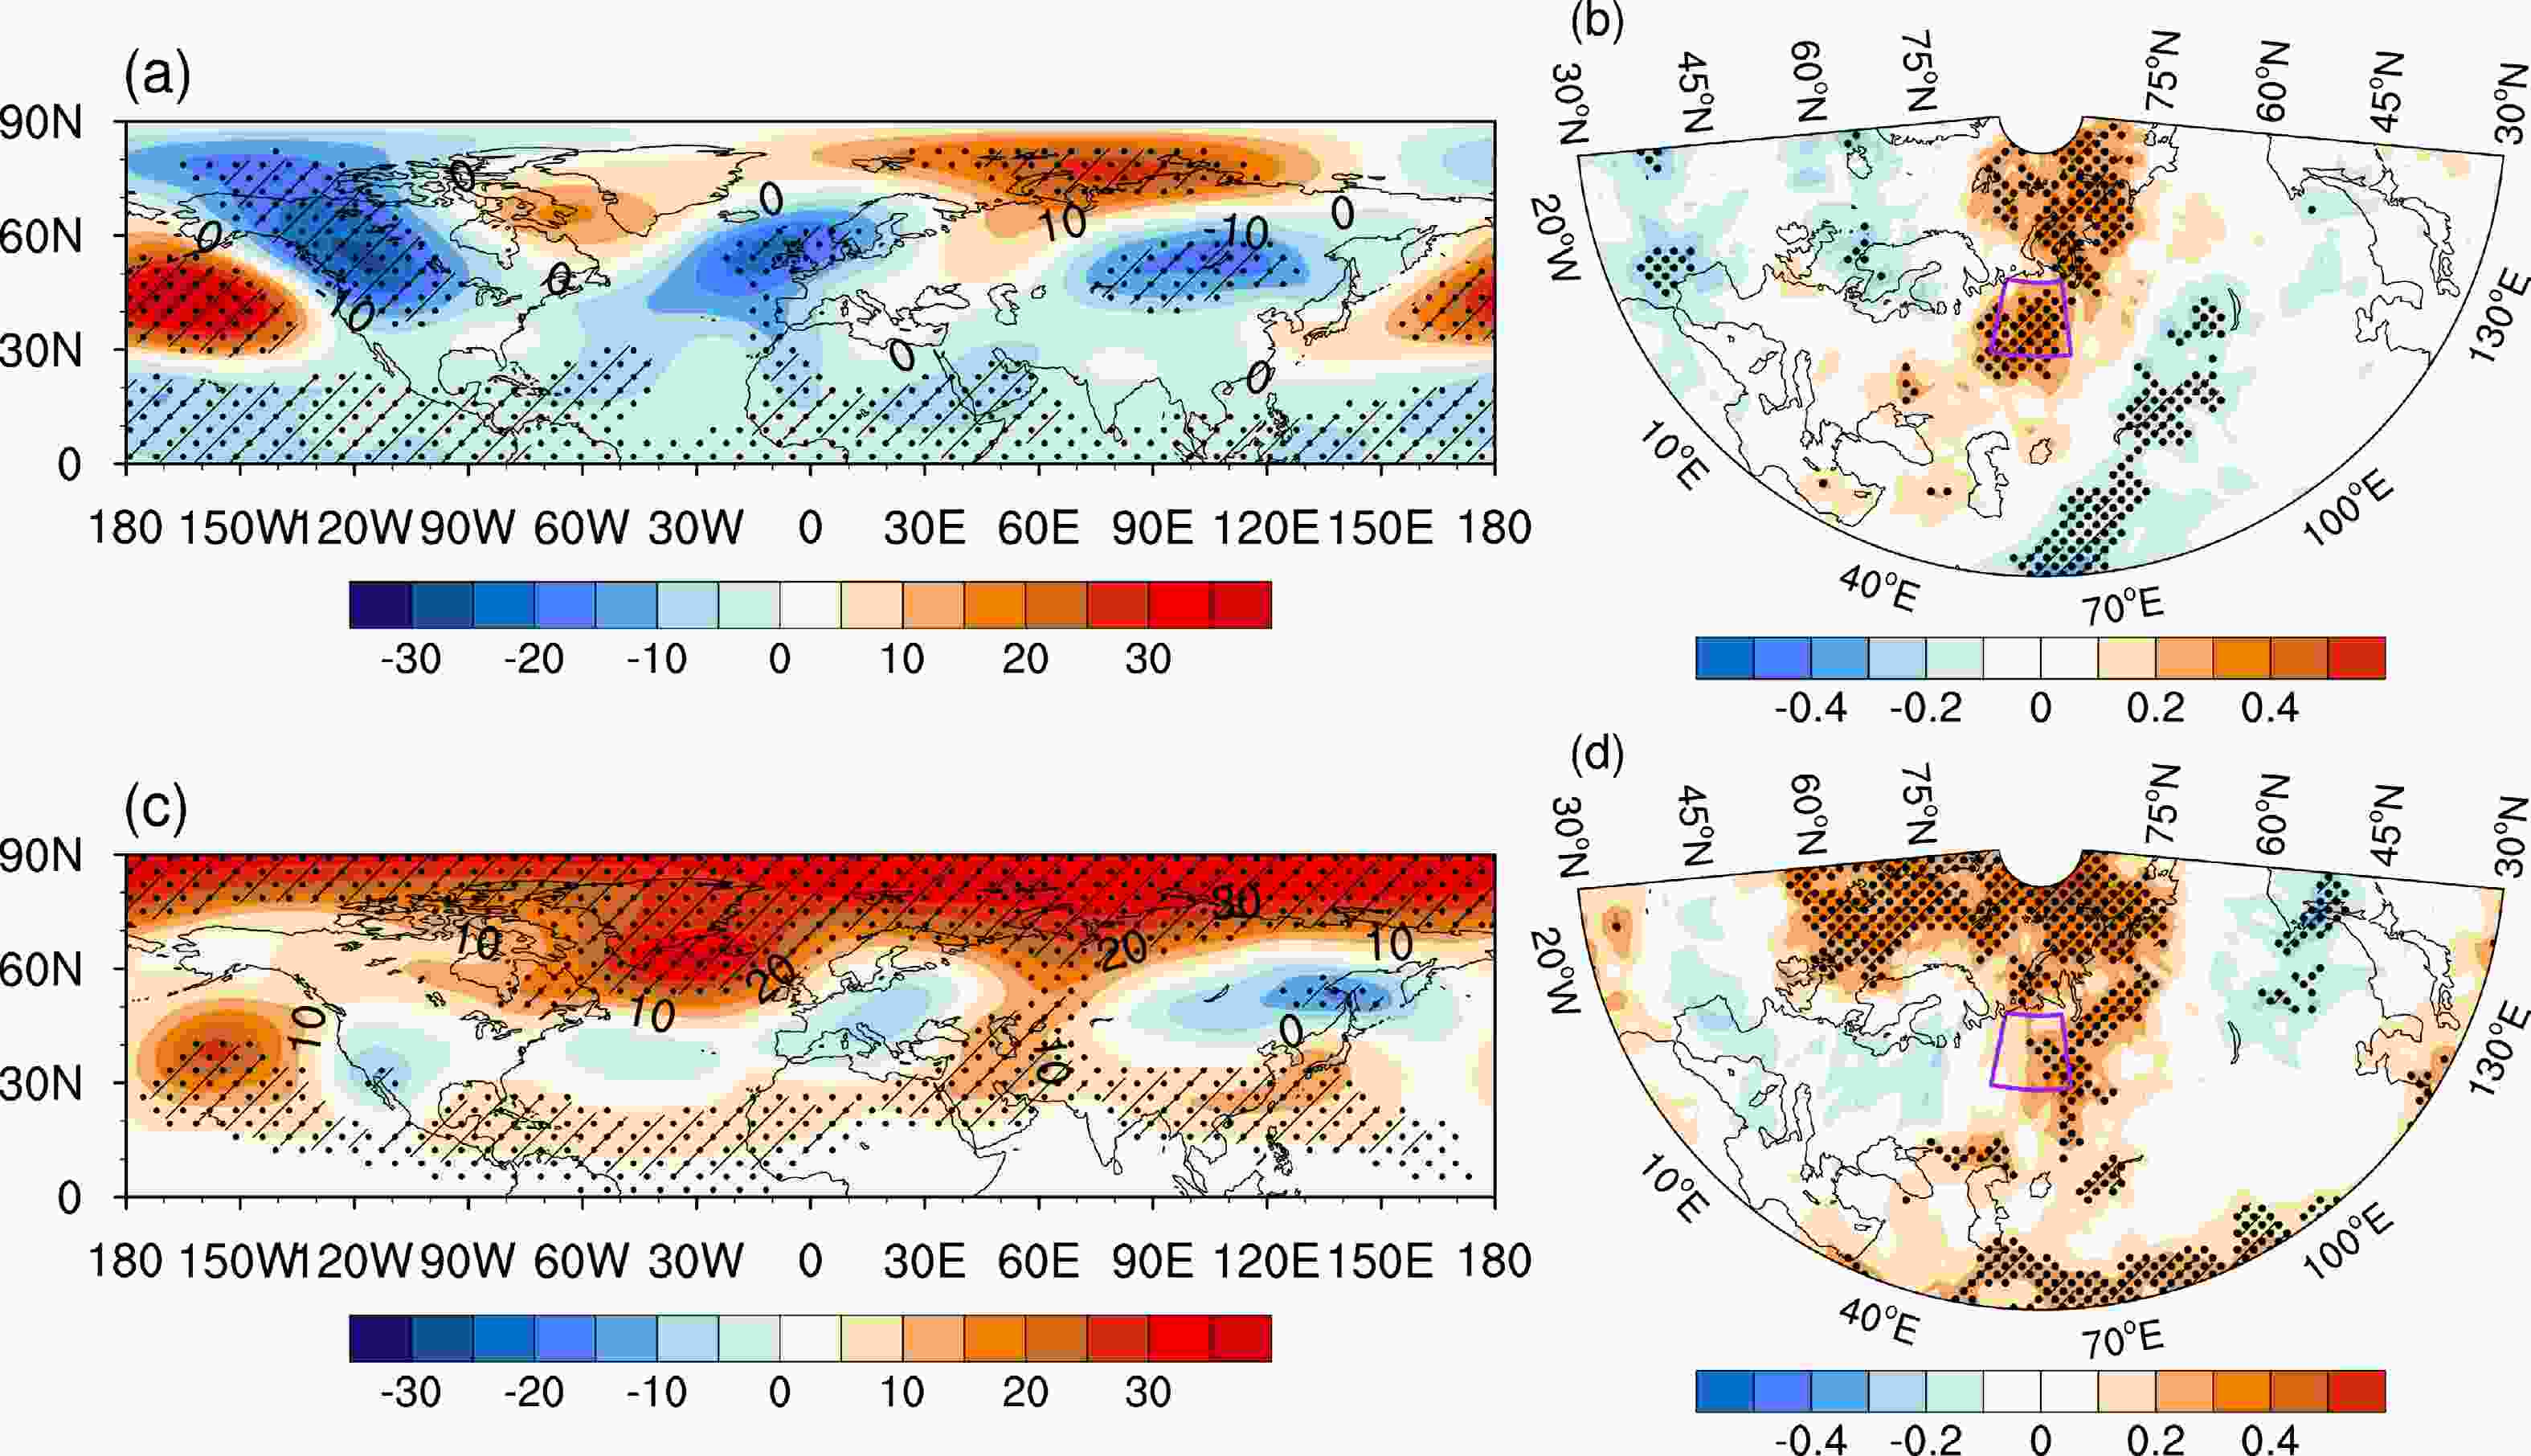
Figure 7. Differences between composite Z500 anomalies (units: gpm) for the different phase periods of the PDO and AMO. Panel (a) represents the negative PDO years minus the positive PDO years, and (c) the positive AMO years minus the negative AMO years. (b, d) Same as in (a, c), but for the PAE occurrence (units: times). The purple box in (b, d) corresponds to the defined Ural Mountains region (centered at 62.5°N, 57.5°E). The hatched (dotted) areas are significant at the 95% (90%) confidence level.
From Fig. 7a, the negative phase of the PDO is closely related to the weakened Aleutian Low as previously revealed (Kim et al., 2014), and it serves to excite a wave train propagating downstream from the North Pacific. The anomaly centers extend from the North Pacific to North America, the North Atlantic, the coastal Atlantic to West Europe, the Ural Mountains, and East Asia. The wave train lobe over the Ural Mountains is positive and favors the occurrence of PAEs there (Fig. 7b).
Figure 7c displays the differences in the composite Z500 and PAE occurrences between the positive and negative AMO years. The positive AMO triggers a Rossby wave train that emanates from the North Atlantic to the Ural Mountains, albeit a southward shift of its position. The southward shift during P2 is even evident in the occurrence of PAEs around the Urals (Fig. 7d). Overall, the negative phase of PDO favors an increase in Ural PAEs while the positive phase of AMO primarily favors a southward shift of the position of Ural PAE maximum. Because the reanalysis period is relatively shorter, we further analyze the influence of the PDO, AMO, and Barents-Kara Sea ice anomaly on the Ural PAE by the CMIP6 piControl simulations. Since the CMIP6-AMIP model evaluation indicates good performances of the ACCESS-CM2, CESM2-WACCM, EC-Earth3-Veg, and NorESM2-LM, we evaluate the corresponding piControl simulations. However, the lengths of the available daily outputs in ACCESS-CM2 and NorESM2-LM are too short, and the daily geopotential height in EC-Earth3-Veg is unavailable. Therefore, these three models cannot be analyzed, rather we focus on the CESM2-WACCM with a 499-year simulation. The composite PAE occurrence during different phases of the PDO, AMO, and Barents-Kara Sea ice anomaly is then analyzed (figure not shown). The negative (positive) PDO and Barents Kara Sea ice anomaly could increase (decrease) the Ural PAE occurrence, and the positive (negative) AMO favors (hinders) the PAE occurrence to the south of the Ural Mountains. These results are similar to the reanalysis, although their corresponding statistical significance is relatively weaker. Such results may be due to the following hypotheses: (1) the simulated PDO/AMO pattern varies in different models (Wang et al., 2019; Xia et al., 2021), which may not reproduce the atmospheric responses to the observational PDO/AMO pattern; (2) the PDO, AMO, and Barents-Kara Sea ice anomalies are associated with SST and SIC anomalies over other regions and the composite results by the piControl simulation may not reflect their pure influences. Next, we analyze the individual role of the Barents-Kara Seas ice anomaly, PDO, and AMO via CAM5 sensitivity experiments.
The ability of the model to simulate the observed intrinsic variability will influence the simulated atmospheric response. Therefore, it is necessary to check whether the model can reproduce the observed atmospheric intrinsic variability. Before evaluating the CAM5 performance, we revisit the CESM2 simulation in the AMIP experiment, which features a more relevant atmospheric component, as in the CAM5. The CESM2 could reproduce the three active centers of PAEs in the observations (Fig. S2). Although the CESM2 cannot simulate a significant decadal increase in the Ural PAE occurrence, the correlation coefficient for the 11-year running averaged time series of the Ural PAE occurrence between the reanalysis and CESM2 simulation is 0.87, significant at the 90% confidence level (according to an effective five degrees of freedom, as estimated from the method of Quenouille, 1952). The significant correlation between the two decadal indices indicates that the CESM2 could simulate the decadal impacts of the underlying thermal forcing on the Ural PAE. Therefore, it is rational to use the CAM5, which is similar to the atmospheric component of the CESM2, in the following sensitivity experiments. The climatologies of the mean and std of Z500 in winter are shown in Fig. S7 in the ESM. The distribution of the std climatology features three centers over the North Atlantic, the Ural Mountains, and the North Pacific (Fig. S7d), consistent with the observations (Fig. S7c). The position and amplitude of std around the Urals are nearly the same as those in observations, although the center in the North Atlantic is shifted southward (Fig. S7d). The std center over the Urals (62.5°N, 57.5°E) attains the value of 160 and 157 gpm in the observations and model, respectively, approximately equal to each other. This suggests that the model successfully reproduces the observed intrinsic variability.
In response to sea ice loss in the Barents-Kara Seas (Figs. 8a and d), there are positive Z500 anomalies in the mid-to-high latitudes of the Eurasian continent, with a maximum over the Urals. Meanwhile, there are negative anomalies over East Asia, extending to the central North Pacific. Correspondingly, the PAE occurrence shows positive anomalies in the high latitudes of Europe with a maximum located over the Urals and negative anomalies over East China and the North Pacific. Caused by the Barents-Kara Sea ice loss, there is an increase in the Ural PAE with the rate of 3.1 (10 yr)–1. The Z500 response to the negative PDO-like SST forcing is shown in Fig. 8b. The wave train along the mid-to-high latitudes is identifiable, although the positive anomaly center is shifted slightly eastward and the negative center over Canada is weaker in comparison to the observations. The significant positive anomalies over the Urals are consistent with the increased Ural PAEs, with an increment of 2.9 (10 yr)–1 (Fig. 8e). Furthermore, we examine the fluctuation of the Ural PAE occurrences. The results show more Ural PAEs in most years under conditions of Barents-Kara sea ice loss and negative PDO-like SST forcing. In response to positive AMO-like SST forcing (Figs. 8c, f), there are positive Z500 anomalies in northern Europe, along with negative anomalies over the mid-latitude North Atlantic and the Mediterranean which resembles the negative phase of the North Atlantic Oscillation (NAO). The observed positive Z500 anomalies to the south of the Ural Mountains have been well simulated (Fig. 8c). Thus, the occurrence center of the Ural PAEs indeed exhibit a southward movement under the influence of the positive AMO, with a weak increment of 1.6 (10 yr)–1 relative to the observations (Fig. 8f).
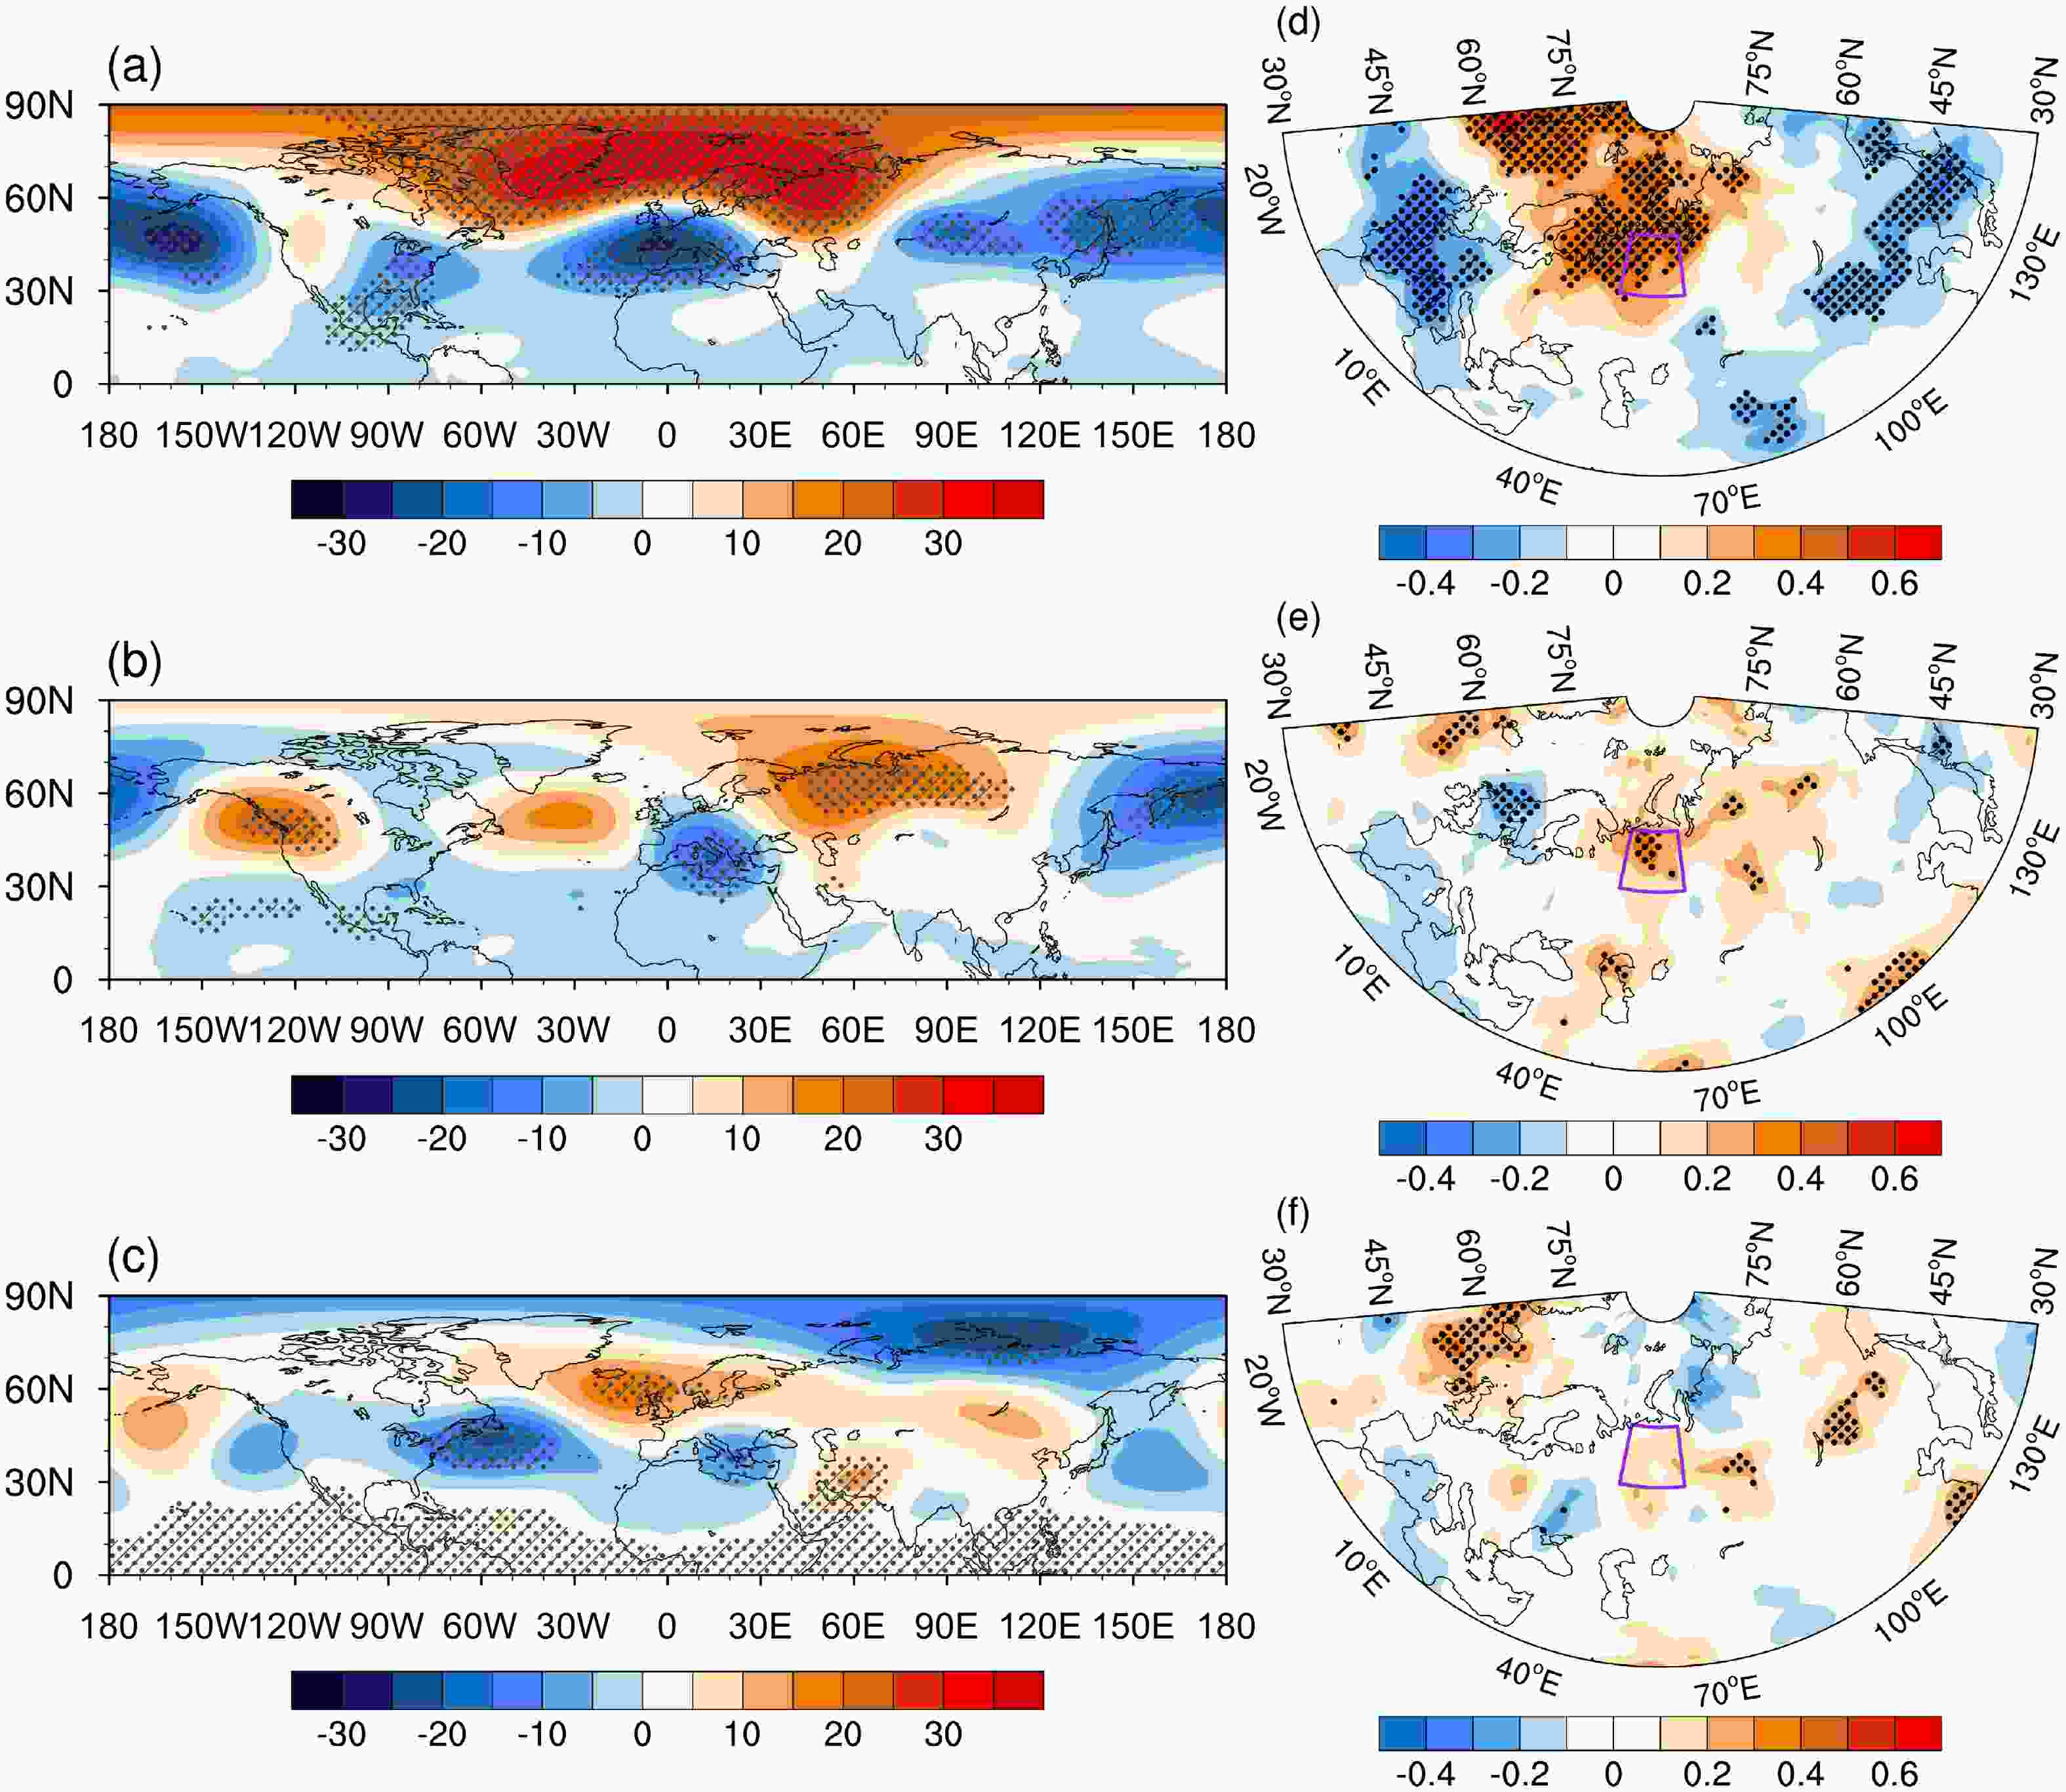
Figure 8. Simulated responses of Z500 (units: gpm) and PAE occurrence (units: times) to various forcing. Panels (a, d) represent sea ice loss in the Barents-Kara Seas, (b, e) are for a negative PDO-like SST anomaly, and (c, f) are for a positive AMO-like SST anomaly. The purple box in (d−f) corresponds to the defined Ural Mountains region (centered at 62.5°N, 57.5°E). The hatched (dotted) areas are significant at the 95% (90%) confidence level.
-
During the warming hiatus period spanning 1998–2013, the EAWM experienced strengthening, and China's surface temperature showed an anomalous cooling trend relative to the global mean (Lei et al., 2020). As one important factor influencing the EAWM and China’s climate, the decadal variation of Ural PAEs is still unclear, and exploring the possible mechanism is intriguing. In this study, we analyzed the observed decadal changes of Ural PAE occurrence during 1979–2013 and investigated the roles of underlying boundary forcings, like SST and SIC. Then, CMIP6 AMIP experiments are employed and sensitivity experiments in CAM5 are conducted for an in-depth analysis. The results are summarized as follows.
In the observations, there is a significant increase in Ural PAE occurrence in the latter half of the study period (P2, 2001–2013) relative to the former half (P1, 1979–1997). The average occurrence of PAE during P2 is almost twice as much as P1, and the maximum center of Ural PAEs shifts to the south in P2. In agreement with the decadal shift of PAEs, the winter mean atmospheric circulation anomalies over the Urals during the two sub-periods are nearly opposite of one another. Accompanied by the decadal shift of PAEs over the Urals, boundary forcings including the Atlantic and Pacific SST and Arctic sea ice exhibited substantial changes. The PDO transitions from its positive to its negative phase, while the AMO conversely shifts from its negative phase to a positive one. Meanwhile, there are significant reductions in Arctic SIC, especially in the Barents-Kara Seas. The observed decadal shift in Ural PAEs can be reproduced by the AMIP experiments in most of the CMIP6 models, which are forced with the historically evolving boundary forcing, including the SST and SIC. Thus, the underlying SIC and SST anomalies may have played a substantial role in shaping the observed variation of the PAE.
The roles of SST and SIC are validated with the sensitivity experiments in CAM5. The SIC reduction in the Barents-Kara Seas induces an atmospheric teleconnection over the Eurasian continent with a positive center located over the Urals, which favors the frequent PAEs (Figs. 8a, d). The negative PDO excites a wave train propagating downstream from the North Pacific toward North America and further downstream into the North Atlantic and Europe, leading to positive anomalies over the Urals (Figs. 8b, e). Thus, the positive-negative PDO transition favors the decadal increase in Ural PAEs. The positive AMO leads to positive Z500 anomalies south of the Urals and causes a southward shift of the maximum center of PAE occurrence (Figs. 8c, f). In summary, the SIC loss and the tendency of the PDO to shift toward its negative phase favor an increase in Ural PAEs, while the positive AMO causes the position of Ural PAEs to shift southward.
Because the period of 1979–2013 is analyzed, readers will probably wonder what has happened since 2013. Thus, we conducted a supplemental analysis by extending the analysis period to 2018. The result (figure not shown) illustrates a reduction in PAEs through 2014–2018, except for 2017 which had the maximum occurrence of three, and with that the turning point of the significant decadal shift remains unchanged. This supports the robustness of the present conclusions.
Besides, one may wonder why only four models among the 17 CMIP6-AMIP models are used for the present analysis, when in fact, there are 13 models which simulate a decadal increase of Ural PAE from P1 to P2 more or less, and only the remaining 4 models show a significant inconsistency with the observations. The reason we selected 4 models from the 13 models for analysis centered upon their ability to simulate the observed shift most reasonably. However, the reason for the weaker skill of the models in reproducing the observed shift remains an issue. One potential explanation concerns the bias of the models’ climate background from the observations. From an additive analysis (Fig. S8 in the ESM), the models’ simulation of a weaker increase in Ural PAEs also features a weakened winter seasonal mean Z500. The above results further confirm that the approximately simultaneous decadal variations in the Ural winter atmospheric circulation and the underlying thermal conditions (e.g., PDO, AMO, and Arctic Sea ice) cited in previous studies (Li et al., 2018a; Jin et al., 2020; Xu et al., 2021; Luo et al., 2022) are not coincidental. Further, this study validates a significant modulation of the Ural background circulation change on the regional occurrence of PAEs.
Recently, Luo et al. (2021, 2022) found the role of the lower boundary forcing on Ural blocking. The present results are in overall agreement with their results considering the close connection between blocking and PAE. However, this study contributes additional meaning. According to its definition, a PAE includes not only anomalous blocking highs, which are generally measured by a reversal of the meridional gradient in height (e.g., Tibaldi and Molteni, 1990; Luo et al., 2021, 2022), but also some critical features related to meridional shifts in jet stream position (Miller et al., 2020). Nevertheless, this study provides additional evidence concerning the role of lower boundary forcing in shaping a synoptic Ural circulation anomaly from the PAE perspective that is different from blocking.
It is noteworthy that the detailed processes as to how and why the decadal SIC and SST variations modulate synoptic Ural PAEs remain unclear. Atmospheric stationary waves may play a role (Li et al., 2018a). The sea ice decline in the Barents-Kara Seas indeed induces a stationary wave train over the mid-high latitude Eurasian continents with positive Z500 anomalies over the Urals (Fig. 9a). The PDO excites a wavenumber-three stationary structure in the mid-to-high latitudes with positive anomalies over the Urals (Fig. 9b). While the AMO excites a stationary wave from the North Atlantic with positive Z500 anomalies to the south of the Urals and favors a southward shift of Ural PAEs (Fig. 9c). Since atmospheric internal processes are complicated and interact with each other on different timescales, how the stationary wave modulates PAEs is worthy of an in-depth study. Nonetheless, the present observational analyses and model results both provide evidence linking the modulation of these lower boundary factors to the occurrence and position of a Ural PAE.

Figure 9. Same as in Figs. 8a–c, but for the stationary waves of the winter Z500 (units: gpm). The stationary wave is obtained by subtracting the zonal mean from the Z500 field. The hatched (dotted) areas are significant at the 95% (90%) confidence level.
Aside from the underlying thermal forcing, the internal atmospheric variability could also contribute to the interdecadal change of Ural PAEs. Previous studies have shown a significant influence of the winter Arctic Oscillation (AO)/NAO on the Ural atmospheric circulation (Gong et al., 2001; He et al., 2017). Associated with the positive-negative shift of the AO/NAO phase around 2000 after the mid-1980s, the Ural Z500 variation shows an interdecadal increase (Ding et al., 2014; Iles and Hegerl, 2017; Ye and Messori, 2020), which may favor Ural PAE occurrence. In addition, the conventional EU pattern significantly impacts the atmospheric circulation of the Ural region by the triggered wave train (Liu et al., 2014; Ye and Messori, 2020). Since the mid-1980s, the negative EU pattern transitions to its positive pattern around 2000, causing the interdecadal increase in the Ural Z500 anomaly and possibly contributing to the interdecadal variation in Ural PAEs. The influence of the internal atmospheric variability on the Ural PAE interdecadal variation should be carefully investigated in future studies.
The Role of Underlying Boundary Forcing in Shaping the Recent Decadal Change of Persistent Anomalous Activity over the Ural Mountains
- Manuscript received: 2023-02-12
- Manuscript revised: 2023-05-23
- Manuscript accepted: 2023-06-21
Abstract: Observational analyses demonstrate that the Ural persistent positive height anomaly event (PAE) experienced a decadal increase around the year 2000, exhibiting a southward displacement afterward. These decadal variations are related to a large-scale circulation shift over the Eurasian Continent. The effects of underlying sea ice and sea surface temperature (SST) anomalies on the Ural PAE and the related atmospheric circulation were explored by Atmospheric Model Intercomparison Project (AMIP) experiments from the Coupled Model Intercomparison Project Phase 6 and by sensitivity experiments using the Atmospheric General Circulation Model (AGCM). The AMIP experiment results suggest that the underlying sea ice and SST anomalies play important roles. The individual contributions of sea ice loss in the Barents-Kara Seas and the SST anomalies linked to the phase transition of the Pacific Decadal Oscillation (PDO) and Atlantic Multidecadal Oscillation (AMO) are further investigated by AGCM sensitivity experiments isolating the respective forcings. The sea ice decline in Barents-Kara Seas triggers an atmospheric wave train over the Eurasian mid-to-high latitudes with positive anomalies over the Urals, favoring the occurrence of Ural PAEs. The shift in the PDO to its negative phase triggers a wave train propagating downstream from the North Pacific. One positive anomaly lobe of the wave train is located over the Ural Mountains and increases the PAE there. The negative-to-positive transition of the AMO phase since the late-1990s causes positive 500-hPa height anomalies south of the Ural Mountains, which promote a southward shift of Ural PAE.
-
Keywords:
- Ural,
- persistent anomaly,
- Pacific decadal oscillation,
- Atlantic multidecadal oscillation,
- sea ice loss in Barents-Kara Seas
 AAS Website
 AAS WeChat