


 DownLoad:


-
Atmospheric dipolar modes (DMs) such as the Northern Hemisphere annular mode (NAM, Thompson and Wallace, 2000; also known as the Arctic Oscillation or the AO, Thompson and Wallace, 1998), and the North Atlantic Oscillation (NAO, Hurrell et al., 2003) are important teleconnection patterns in the extratropical regions of the Northern Hemisphere (NH). These two DMs share a similar spatial feature: a north-south-oriented dipolar structure in the pressure field representing an oscillation in atmospheric pressure between the mid-latitudes and sub-polar regions accompanied by a north-south vacillation of the mid-latitude, eddy-driven jet. The atmospheric DMs are considered to be representative of low-frequency modes because the typical lifetime of the atmospheric DMs events is about two weeks, which is well beyond the synoptic timescale (Feldstein, 2000). Contrary to intuition, the chaotic stirring of the transient eddies is the main contributor that drives the large-scale circulation anomalies associated with the atmospheric DMs as opposed to dissipating them (Feldstein, 2003). In turn, the large-scale flow anomalies associated with the atmospheric DMs tend to organize the transient eddies thereby facilitating the maintenance of the large-scale circulation anomalies themselves. Thus, there is a positive feedback between the transient eddies and large-scale circulation anomalies associated with the atmospheric DMs. This positive eddy feedback is considered be the key mechanism responsible for the long persistence of atmospheric DMs (Lorenz and Hartmann, 2003).
Thompson and Wallace (1998) considered the NAO as a regional expression or sectoral paradigm of the NAM over the North Atlantic since their spatial patterns are largely overlapped in the North Atlantic sector and their time series are also highly correlated. Note that the NAM is usually defined as the first Empirical Orthogonal Function mode (EOF) of the NH surface pressure (Thompson and Wallace, 1998). Thus, the NAM could be an artifact of the mathematical analysis but not a physical mode (Ambaum et al., 2001). Deser (2000) found that the correlation between the sea level pressure (SLP) field of the Atlantic and Pacific centers of action of the NAM is weak. The lack of coordinated variations between the Pacific and Atlantic action centers of the NAM challenges the physical reality of the NAM. Ambaum et al. (2001) argued that the NAO paradigm maybe more physically relevant and robust for NH variability than the NAM paradigm. To mediate this debate and achieve a consensus, Wallace (2000) argued that the NAM and NAO are “one phenomenon two paradigms”. Feldstein and Franzke (2006) also pointed out that the NAM and NAO are nearly indistinguishable in their statistics. They considered the NAO to be neither a regional manifestation of the NAM nor the NAM to be a statistical artifact. These two patterns should be regarded as redundant to each other.
Recently, Song (2019) found using an idealized atmospheric model that the composite pattern of the short-persisting NAO events
1 is confined to the North Atlantic region just like the canonical NAO. While the composite pattern of the long-persisting NAO events has a hemispheric-scale dipolar pattern, largely similar to the pattern of the NAM. By calculating autocorrelations of the daily NAM and NAO indexes, Song (2019) also found that the daily NAM index has a longer persistence in intraseasonal timescales. Therefore, the results of Song (2019) provide a new viewpoint to reconsider the relationship between the NAM and NAO that the NAM might be, at least partially, equivalent to the long-persisting NAO.It is well known that the dipolar structure associated with the NAM is hemispheric in scale, obviously broader than the NAO in the zonal direction. Therefore, Song’s results raise a question regarding the relationship between the persistence and zonal scale of atmospheric DMs; namely, do atmospheric DMs that have a broader (narrower) zonal scale dipolar structure possess a longer (shorter) persistence? If such a relationship indeed exists, then how can we understand this relationship? The main goal of this study is to answer these two questions. In addition, analyzing and discussing the relationship between the persistence and zonal scale of atmospheric DMs could also aid in our understanding concerning the connection and distinction between the NAM and NAO.
The remainder of this study is organized as follows. Section 2 briefly introduces the data, atmospheric model, and vorticity diagnostic equation used in this study. Section 3 provides some observed and model results to confirm the existence of the relationship between the persistence and zonal scale of atmospheric DMs. To understand the relationship between the persistence and zonal scale of atmospheric DMs, diagnostic results of a detailed vorticity budget for two models’ atmospheric DMs with different zonal scales are presented and discussed in section 4. We also examine and discuss the eddy feedback intensity of atmospheric DMs for the two models in section 5. The last section provides a summary of this study. -
The state-of-the-art reanalysis daily ERA5 data (Hersbach et al., 2020) are used in this study. The authors choose a horizontal grid resolution of 2.5° × 2.5° for the data. The ERA5 data cover a time period from 1979 to the present. In this study, however, the authors only use 39 boreal winters (DJF) data from 1979/80 to 2017/18 further noting that the 29th of February of each leap year is removed for calculation convenience. Thus, the total number of days of the dataset is 3510.
-
This study also employs an idealized atmospheric model: the Geophysical Fluid Dynamics Laboratory (GFDL) dynamical core model (Held and Suarez, 1994, hereafter HS94). This model is a dry, no topography, sigma ( $ \mathrm{\sigma }=p/{p}_{\mathrm{s}} $ ) coordinate spectral model consisting of primitive equations on the sphere driven by diabatic heating via Newtonian relaxation towards an idealized zonally symmetric equilibrium temperature profile Teq of HS94. To achieve an energy balance, the model incorporates idealized physical damping processes such as linear radiative damping, Rayleigh drag (representing the frictional effects of the planetary boundary layer), and a horizontal 8th-order ($ {\nabla }^{8} $ ) hyperdiffusion. All of these physical parameters are the same as in HS94. Since the physical processes in the model are highly simplified, this model clearly focuses on internal atmospheric dynamics.Using this model, a 20 200-days long-term run is integrated with a T42 horizontal resolution and 10 evenly spaced sigma levels in the vertical for this study. The output of the first 200 days are discarded as spin-up, thus, a 20 000-days idealized model atmospheric dataset is acquired. Under the model design, the long-term experiment produces a zonally symmetric earth-like climate characterized by a single mid-latitude jet with a maximum strength of nearly 30 m s–1.
-
To help clarify the relationship between the persistence and zonal scale of atmospheric DMs, a vorticity budget analysis, as in Song (2018), is used to evaluate the relative importance of various dynamic processes in the formation of an anomalous circulation pattern. This vorticity budget analysis is based on a vorticity tendency equation, which is:
where,
The residual term represents the residual components such as frictional dissipation and the tilting term,
$ \zeta $ is the relative vorticity, U is the horizontal wind vector, u and v the zonal and meridional components of U,$ f $ is the Coriolis parameter, and β is the planetary vorticity gradient. The overbar and prime symbol denote the time mean and its departure, respectively. Briefly, term1 (term2) is the zonal (meridional) advection of anomalous vorticity by the background flows, term3 (term4) the zonal (meridional) advection of background vorticity by the anomalous flows, term5 and term6 represent the divergence term, and term7 is the total eddy vorticity forcing (TEVF) term. It is noted that the first six terms represent linear processes, while term7 is a nonlinear term. Note that the TEVF term can be further decomposed to a high-frequency eddy vorticity forcing term (HFEVF, 10-days high pass) and low frequency eddy vorticity forcing term (LFEVF, 10-days low pass). -
The autocorrelations of the daily NAM index and NAO index shown in Song (2019, see his Fig. 20) have indicated that the persistence of the NAM is longer than that of the NAO. However, we cannot rule out the possibility that the persistence of the NAO is only coincidentally shorter than that of the NAM. To confirm the relationship between the persistence and zonal scale of the atmospheric DMs, in this section, we examine the persistence of more atmospheric DMs with different zonal scales not only in the reanalysis but also in the idealized model data.
-
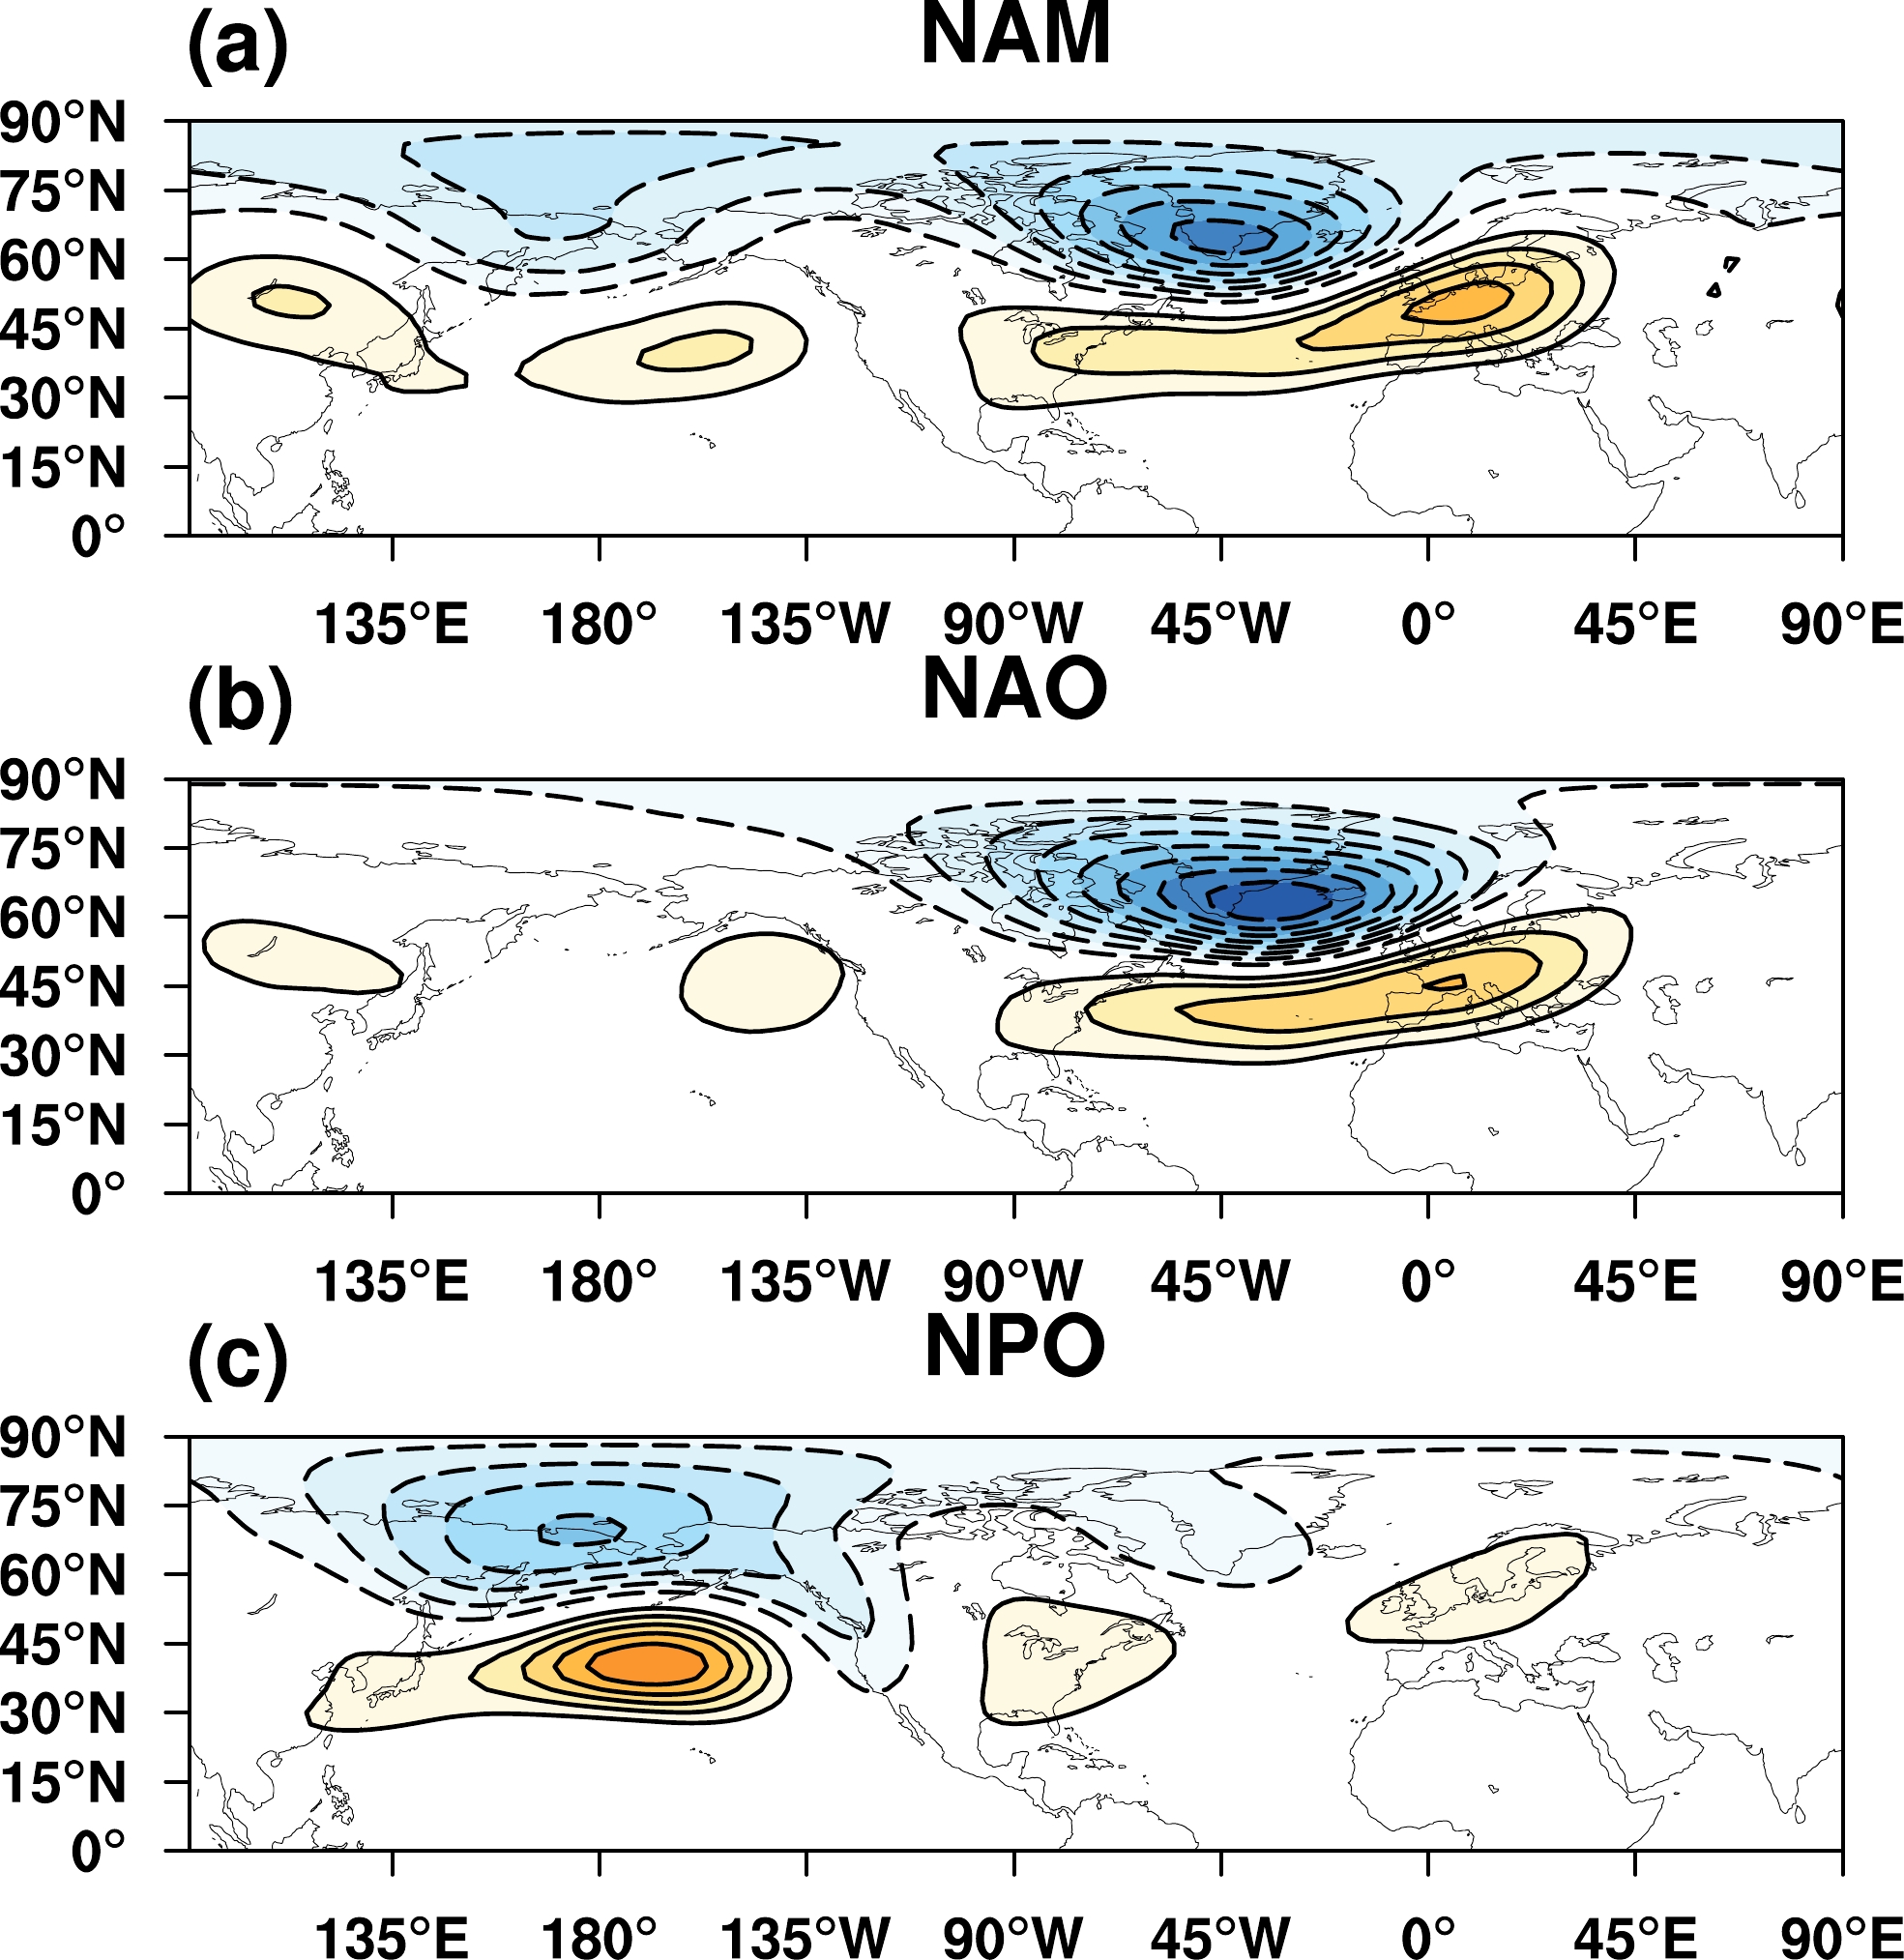
Figure 1 shows the daily NAM, NAO, and North Pacific Oscillation (NPO, Rogers, 1981) indices regressed onto the 300-hPa geopotential height anomalies in the ERA5 data, which represent the spatial patterns of the observed NAM, NAO, and NPO, respectively. The daily NAM and NAO indices are defined as the normalized first principal component (PC) of the 3510-days ERA5’s sea level pressure (SLP) anomalies over the northern hemisphere (20°–90°N, 0°–360°,) and the North Atlantic (20°–90°N, 90°W–50°E). While, the daily NPO index is defined as the normalized second PC of the 3510-days ERA5’s SLP anomalies over the North Pacific (20°–90°N, 120°E–100°W). Clearly, the NPO pattern is a zonally elongated meridional dipole. The daily NPO index regressed onto the 300-hPa zonal wind anomalies also shows that the NPO corresponds to a meridional migration of the mid-latitude Pacific jet (not shown). Therefore, the NPO, like the NAM and NAO, is also a typical atmospheric DM.
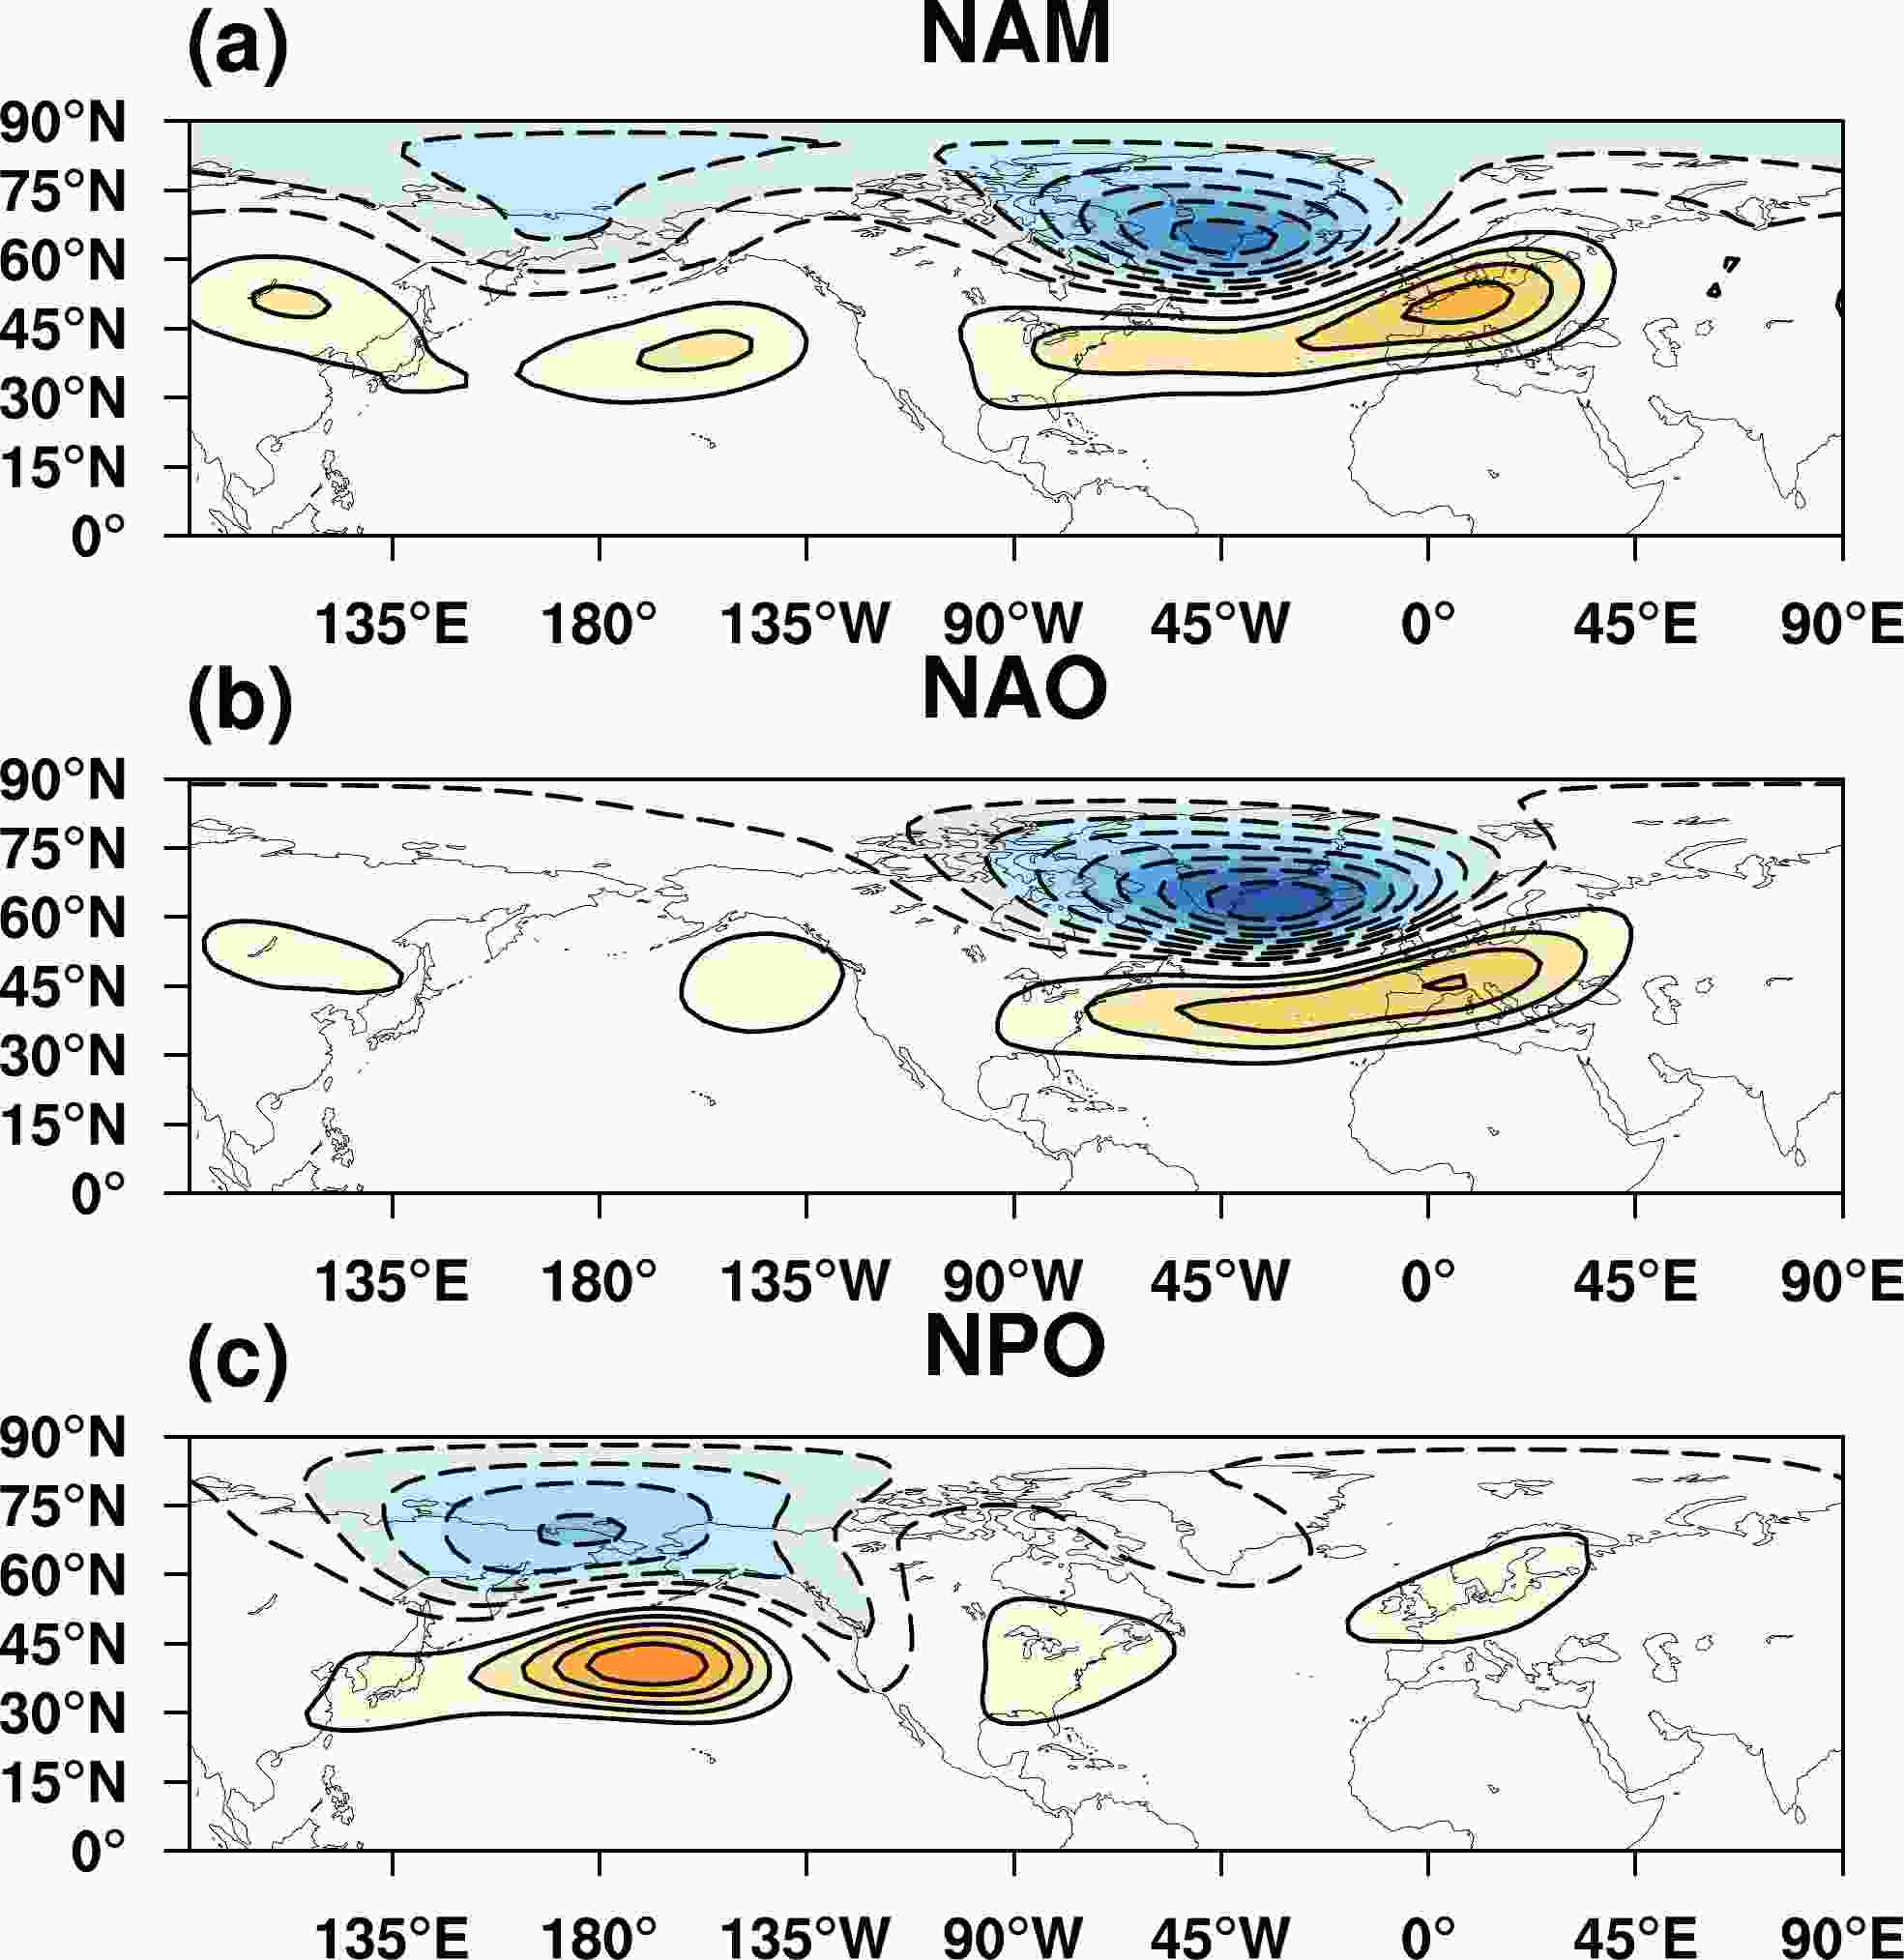
Figure 1. The daily (a) NAM, (b) NAO, and (c) NPO index regressed 300-hPa geopotential height anomalies. Solid (dashed) contours represent positive (negative) values; zero contours are omitted. The contour interval is 20 gpm.
Figure 1 shows that, among these three observed atmospheric DMs, the zonal scale of the NAM is the broadest, followed by the NAO and the NPO
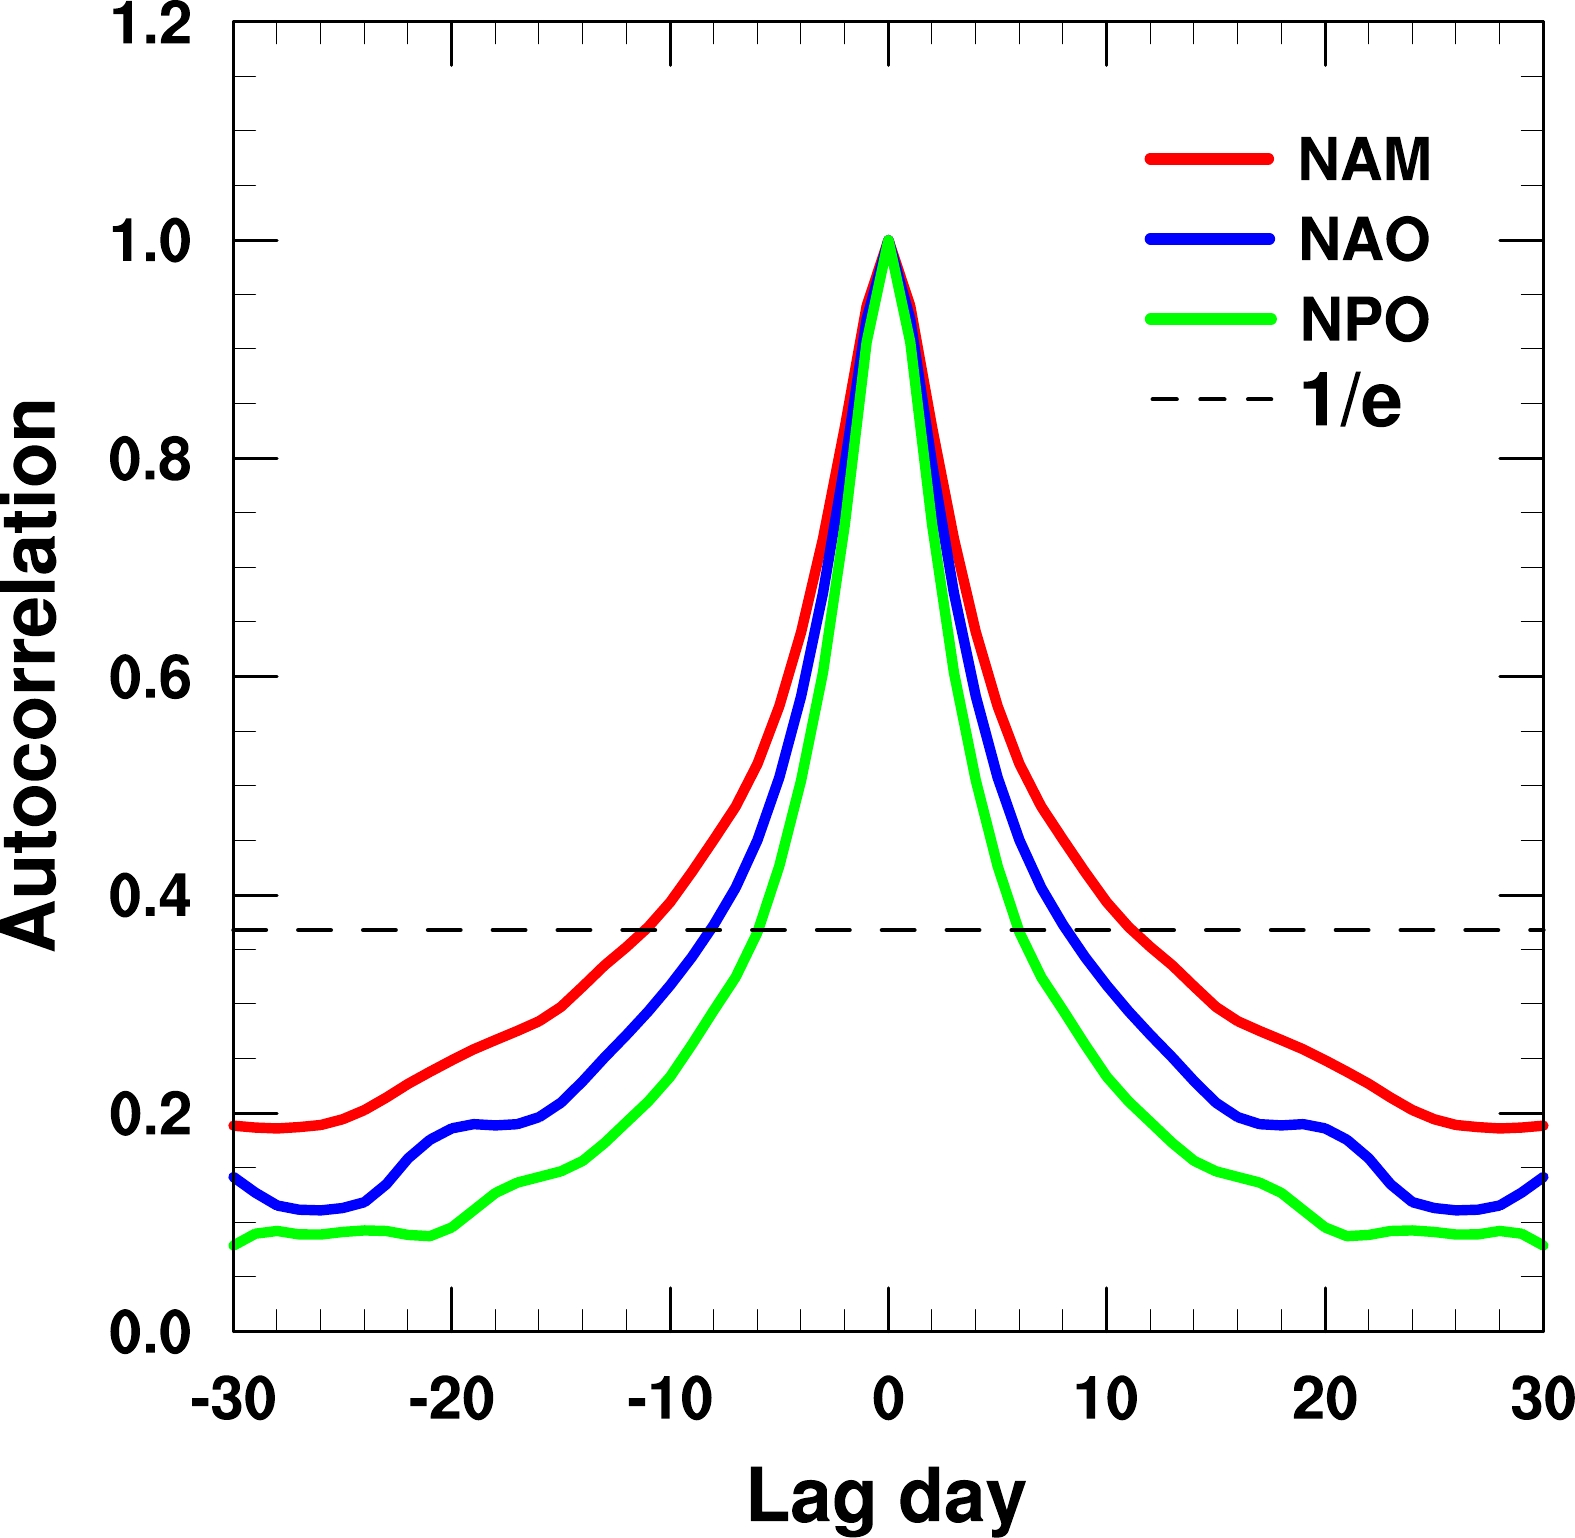
2 . Therefore, if our conclusion about the relationship between the persistence and zonal scale of the atmospheric DMs is correct, then, the persistence of the NPO index should be shorter than the NAM as well as the NAO. To test this hypothesis, the autocorrelations of the NAM, NAO, and NPO daily indexes from lag –30 to 30 days are shown in Fig. 2. The e-folding timescales of the autocorrelations of the NAM, NAO, and NPO are around 11, 8, and 6 days, respectively. Obviously, the persistence of the NPO is the shortest among these three observed atmospheric DMs.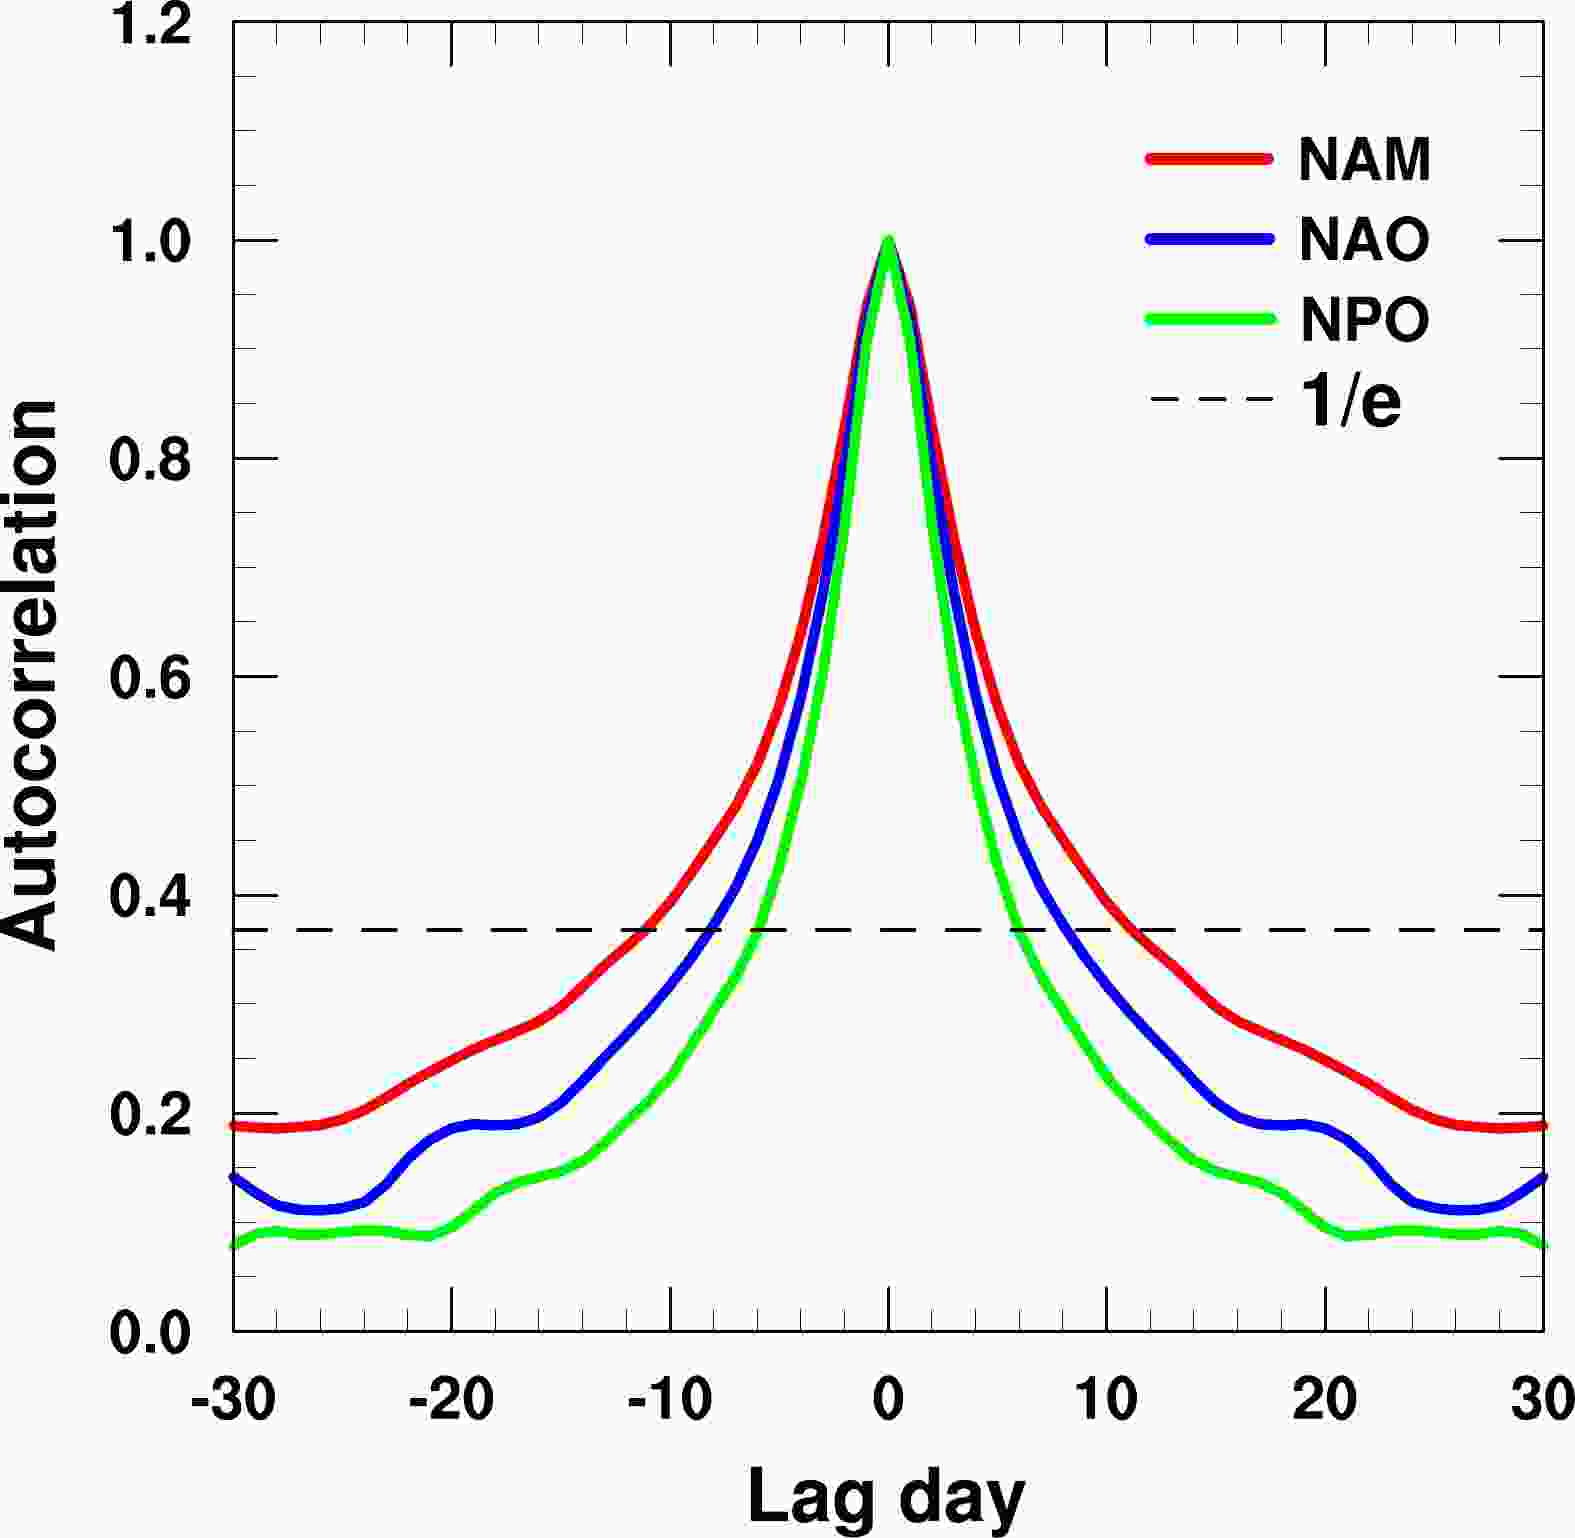
Figure 2. The autocorrelations of the daily NAM, NAO, and NPO index from lag –30 to 30 days. The black dashed line denotes the value of 1/e.
-
Notably, the NAM, NAO, and NPO are embedded in the different tropospheric background flows due to the zonally asymmetric nature of the NH atmospheric circulations. Aside from different tropospheric background flows, there are many external factors such as tropical forcing (Cassou, 2008), sea surface temperature (Czaja and Frankignoul, 2002), and stratospheric variability (Song and Zhao, 2020) that have the potential to influence the persistence of the observed atmospheric DMs. Therefore, one might argue that the differences in the persistence of the NAM, NAO, and NPO might be attributed to the different tropospheric background flows and/or those external factors rather than their different zonal scales.
To further confirm the relationship between the persistence and zonal scale of the atmospheric DMs, we also examine the persistence of the atmospheric DMs with different zonal scales in the idealized model with a zonally uniform background flow. Clearly, if the idealized model results also show that those atmospheric DMs with a broader (narrower) zonal scale dipolar structure possess a longer (shorter) persistence, then we would be more confident in our conclusion since the model has precluded the zonally asymmetric tropospheric background flows and the external factors that might impact the persistence of the atmospheric DMs.
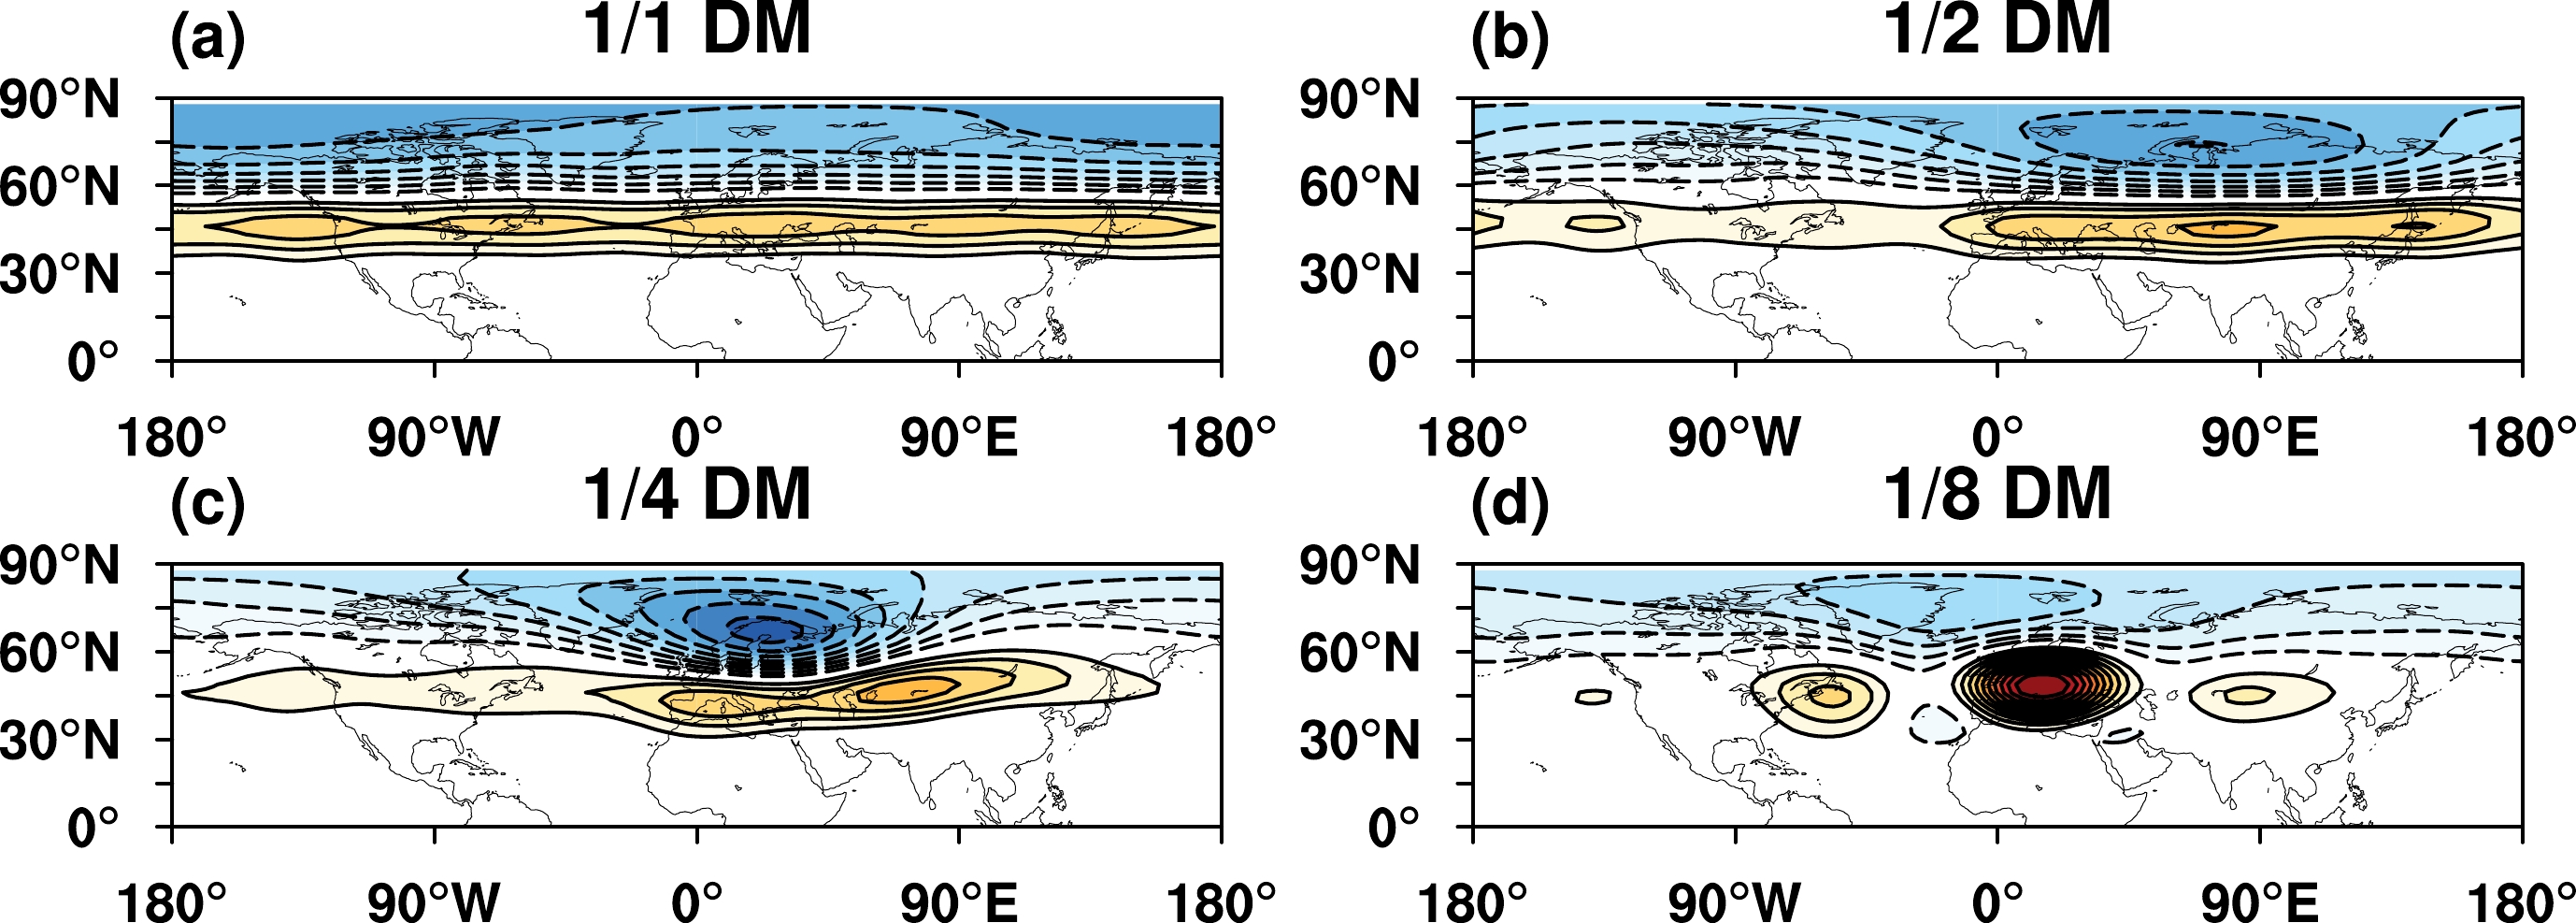
First, four atmospheric DMs associated with different zonal scales are acquired by applying EOF analyses to the 20 000-days modeled SLP anomalies over the NH with four different longitudinal ranges. They are named 1/1 DM, 1/2 DM, 1/4 DM, and 1/8 DM, respectively. 1/1 means the EOF domain covers the longitudinal range of the entire hemisphere (20°–90°N, 180°E–180°W), 1/2 means the EOF domain covers half of the longitudinal range of the entire hemisphere (20°–90°N, 0°–180°E) and so on for 1/4 and 1/8. It should be pointed out that a 1/1 DM, 1/2 DM, and 1/4 DM correspond to the first EOF mode (EOF1). While a 1/8 DM corresponds to the second EOF mode (EOF2). This is because the EOF1 corresponds to a change in the intensity of the jet core rather than a latitudinal shift of the jet when the EOF domain zonal scale region is smaller than 1/4 of the longitudinal range of the entire hemisphere.
As for the observed atmospheric DMs, the spatial patterns of the four model’s atmospheric DMs are obtained by regressing their daily indices onto the 300-hPa geopotential height anomalies, as illustrated in Fig. 3. Obviously, the 1/1 DM corresponds to a hemispheric scale zonally symmetric dipolar mode which is equivalent to the NAM in the model, while other DMs have a regional or sectoral dipolar pattern which can be considered as the NAO or NPO in the model. Generally speaking, for a 1/1 DM to 1/8 DM, the respective zonal scales of the dipolar structures synchronously become narrower as the longitudinal range of the EOF domain gradually shrinks. It is interesting to note that, similar to the NAM and NAO shown in Fig. 1, the 1/4 DM and 1/8 DM have a tilted axis. One might argue that the tilted axis associated with the NAM and NAO is related to the titled Atlantic storm tracks. However, in the 20 200-days long-term run, the spatial distribution of the time mean storm tracks appears relatively straight in the zonal direction. Therefore, we argue that the tilted axis of the 1/4 DM and 1/8 DM should be related to the gradually shrinking longitudinal range of the EOF domain. When the longitudinal range is narrower, the local wave propagation characteristics become more pronounced, which results in the appearance of a tilted axis feature for a 1/4 DM and 1/8 DM.
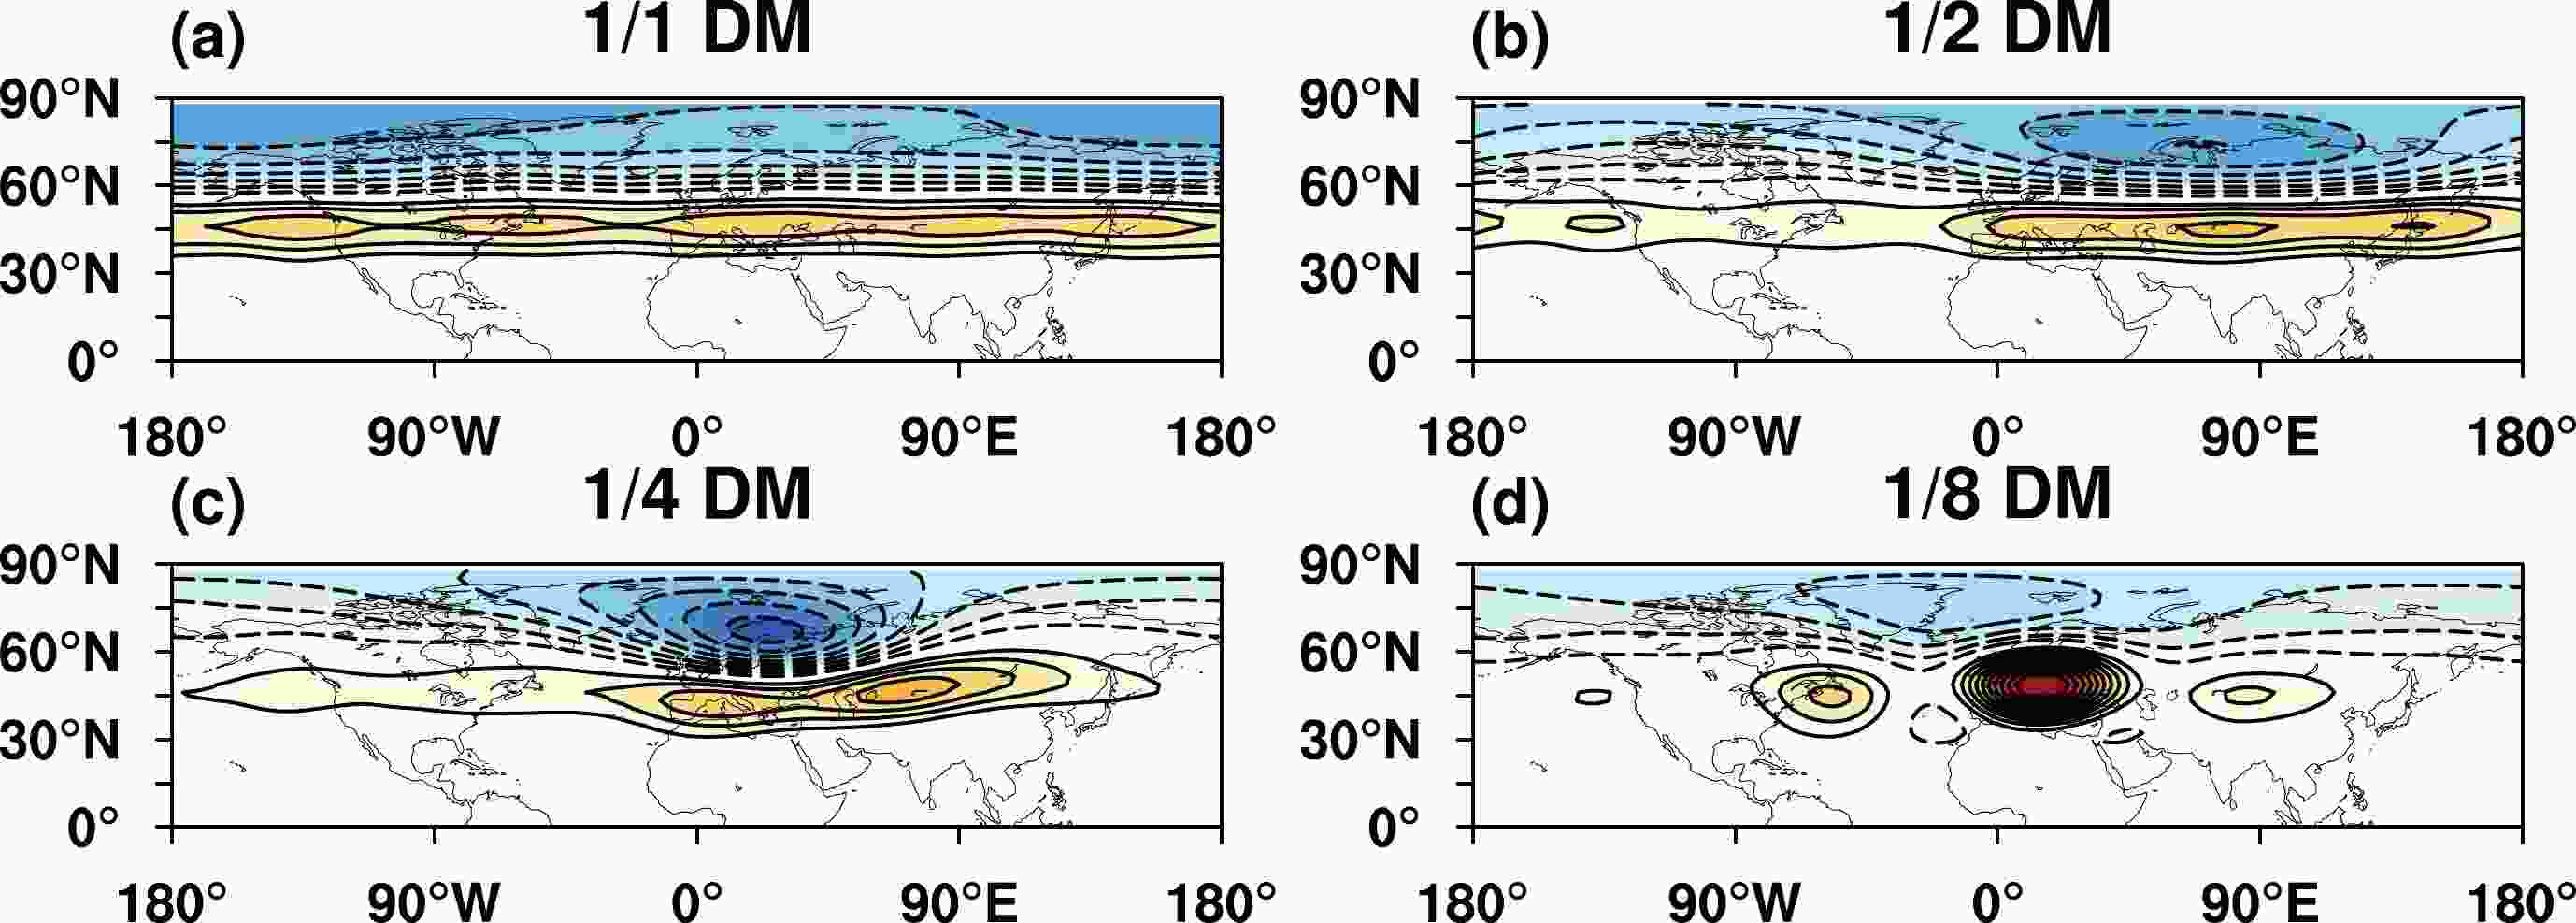
Figure 3. Same as in Fig. 1, but for the daily (a) 1/1 DM, (b) 1/2 DM, (c) 1/4 DM, (d) 1/8 DM index regressed onto the 300-hPa geopotential height anomalies.
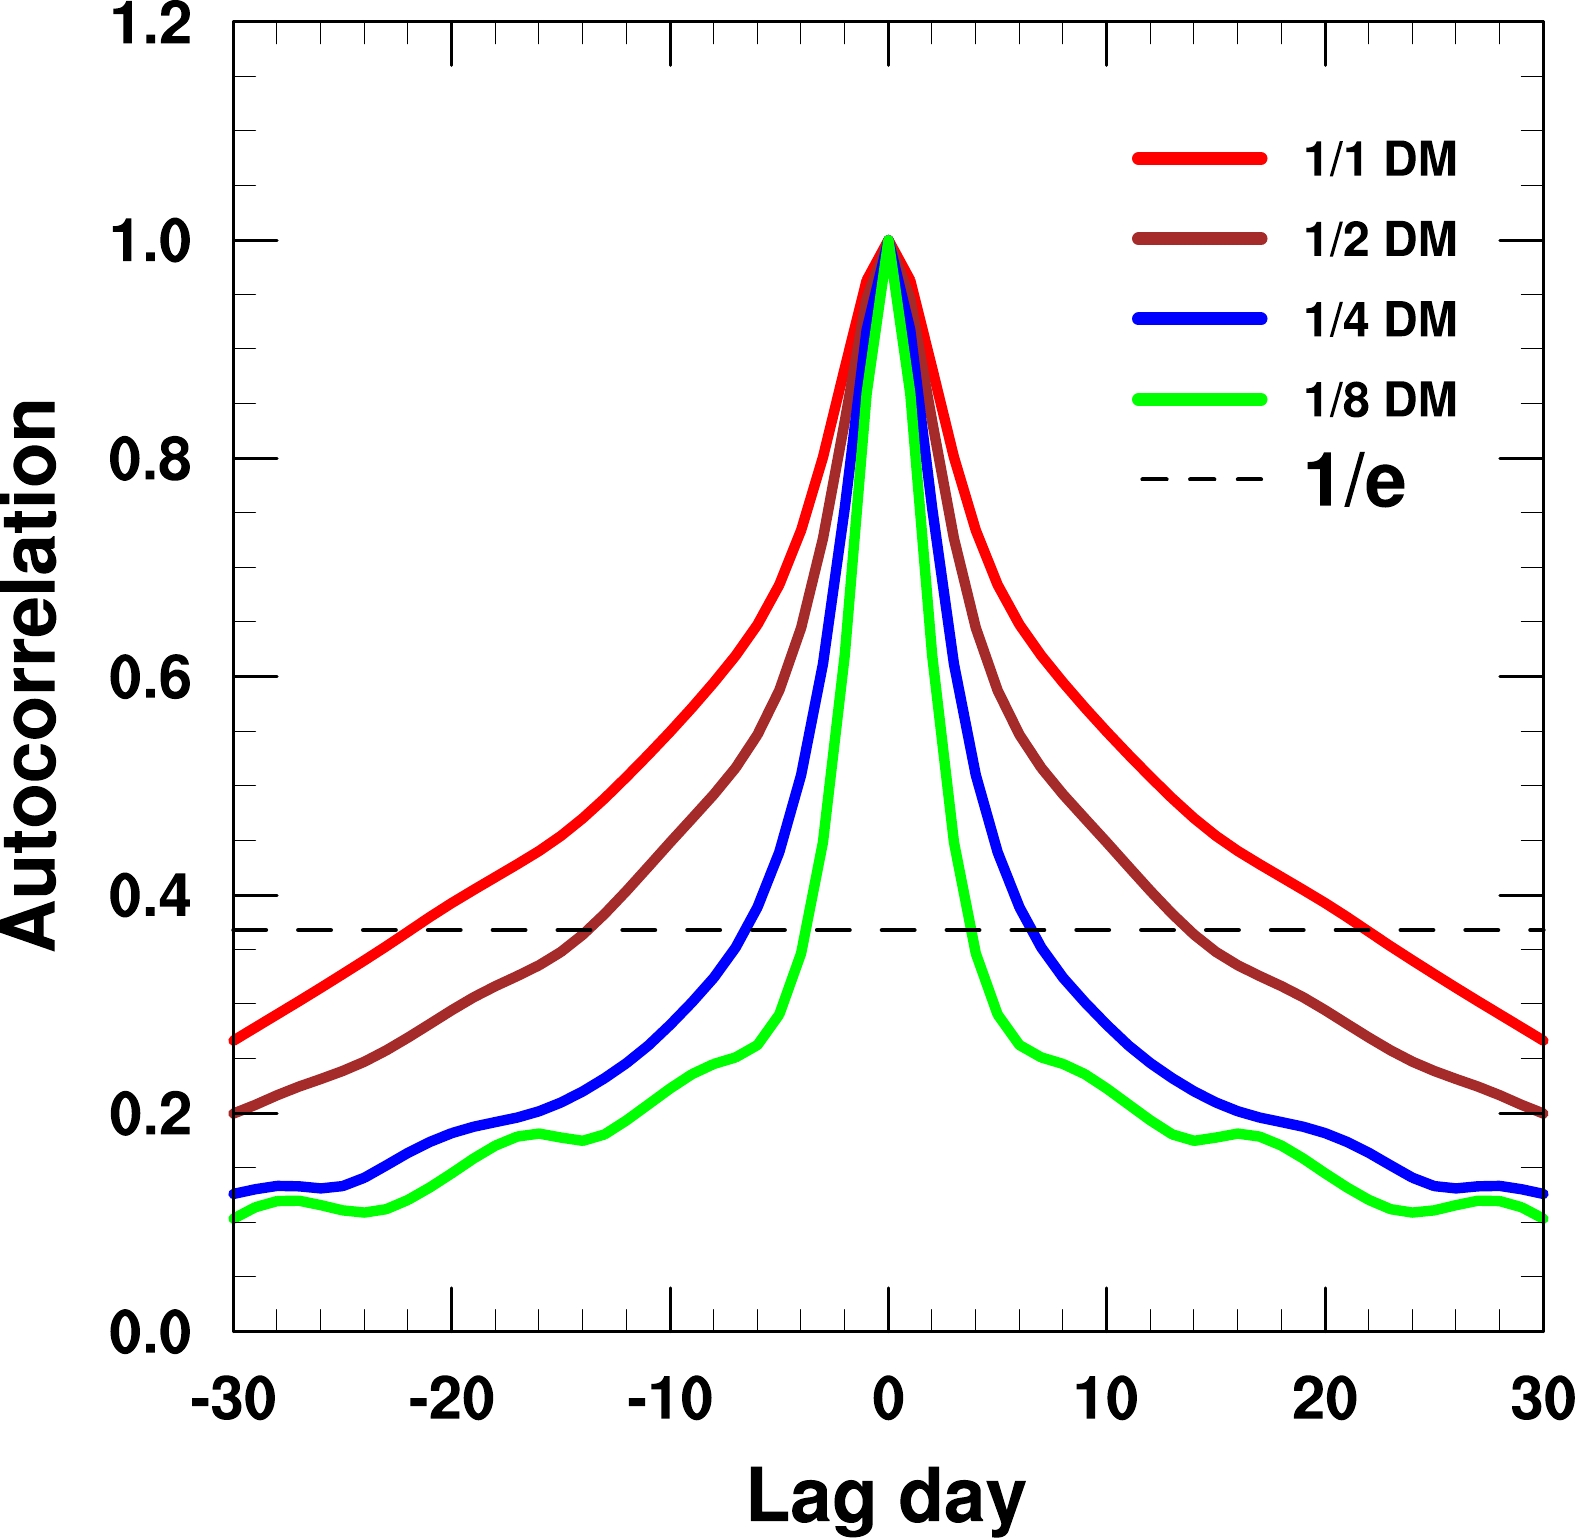
Based on the relationship between the persistence and the zonal scale of the atmospheric DMs, we hypothesize that the order of the persistence of the atmospheric DMs (from long to short) should be 1/1 DM, 1/2 DM, 1/4 DM, and 1/8 DM. This hypothesis is confirmed by the autocorrelations of the 1/1 DM, 1/2 DM, 1/4 DM, and 1/8 DM daily indexes from lag –30 to 30 days, as shown in Fig. 4. The e-folding timescales of their autocorrelations are around 22, 14, 7, and 4 days respectively. The results shown in Figs. 3 and 4 indicate that the relationship between the persistence and the zonal scale of the atmospheric DMs is robust and stable.
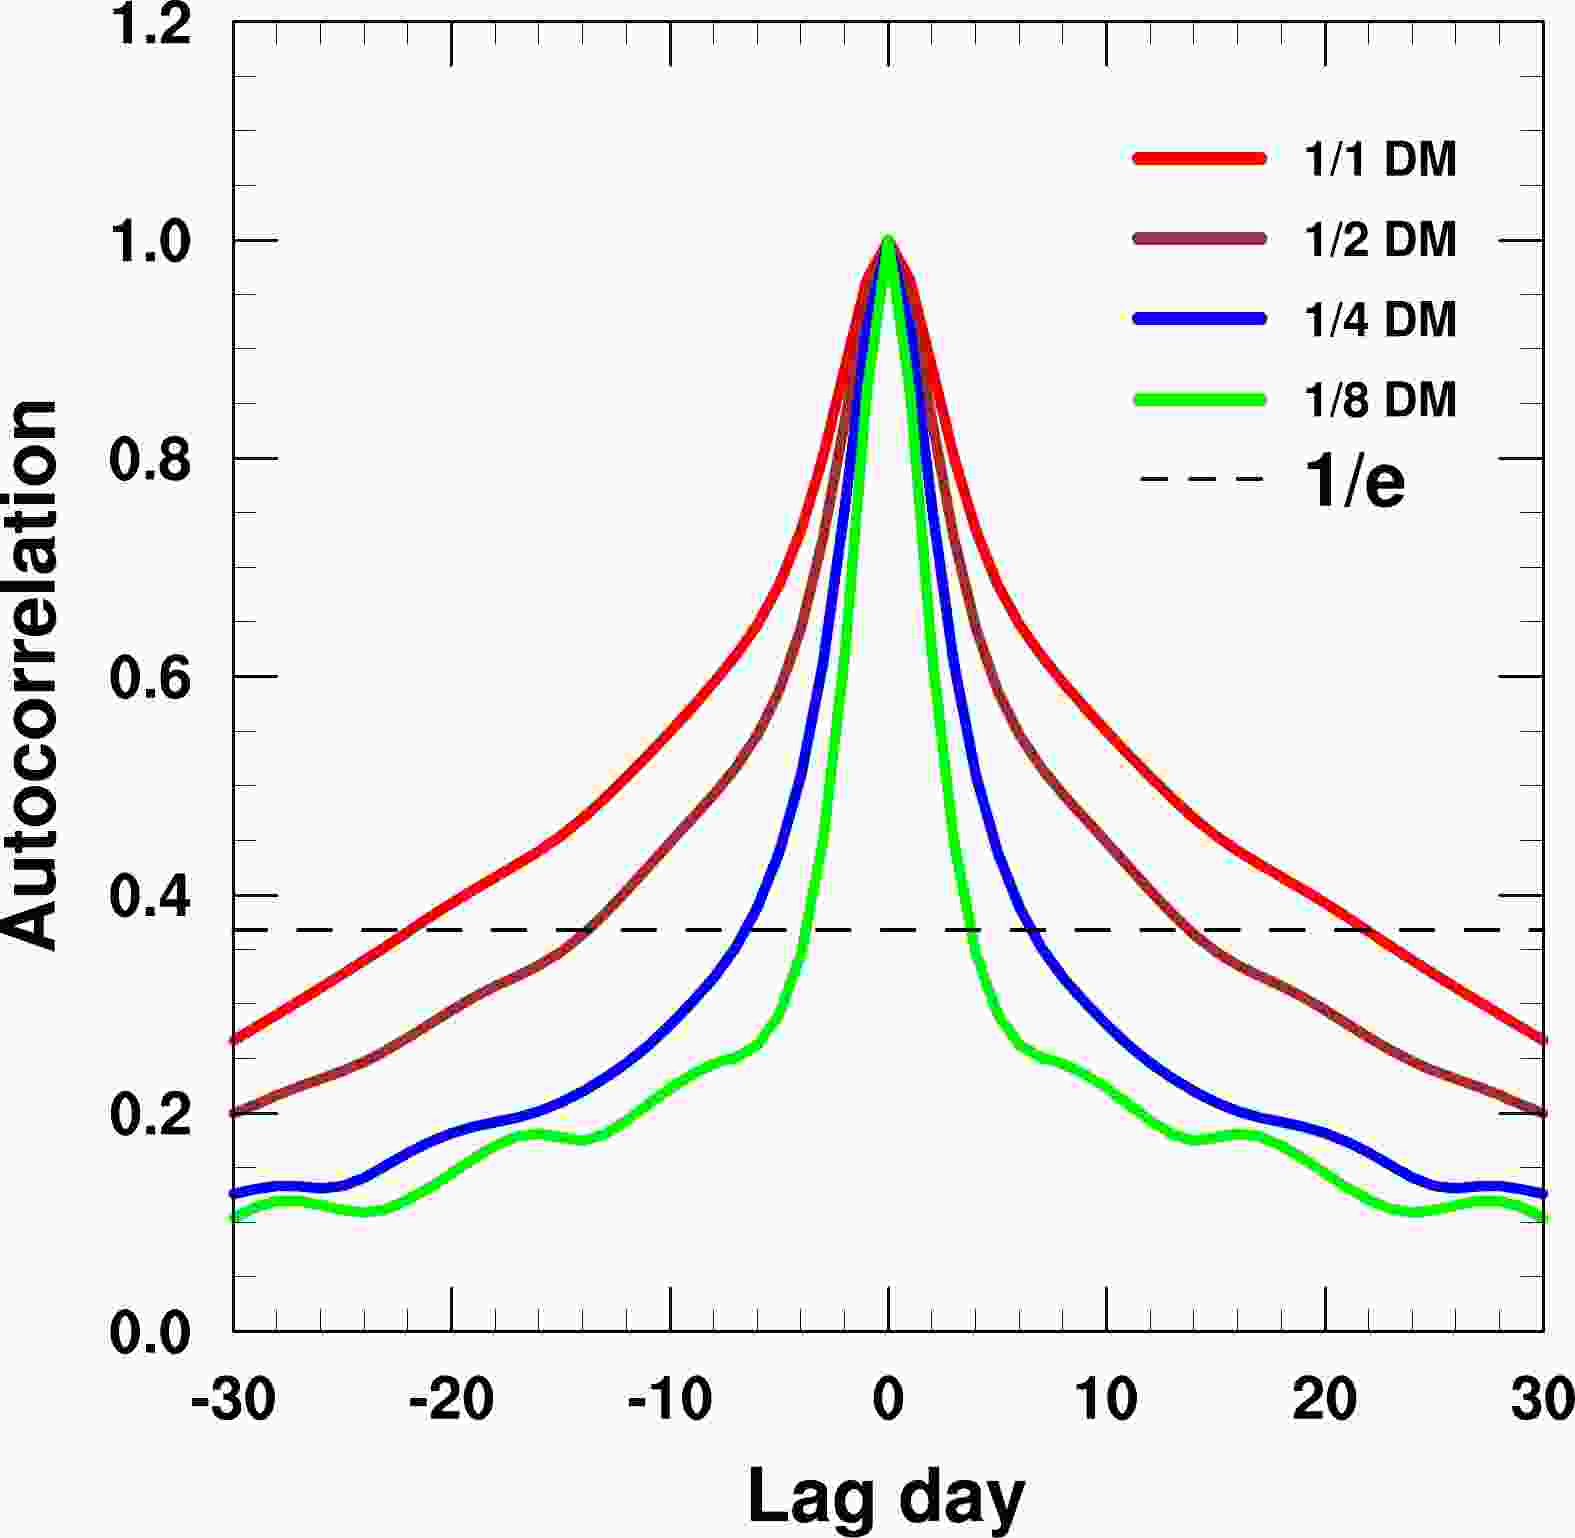
Figure 4. The autocorrelations of the daily 1/1 DM, 1/2 DM, 1/4 DM, and 1/8 DM indexes from lag –30 to 30 days.
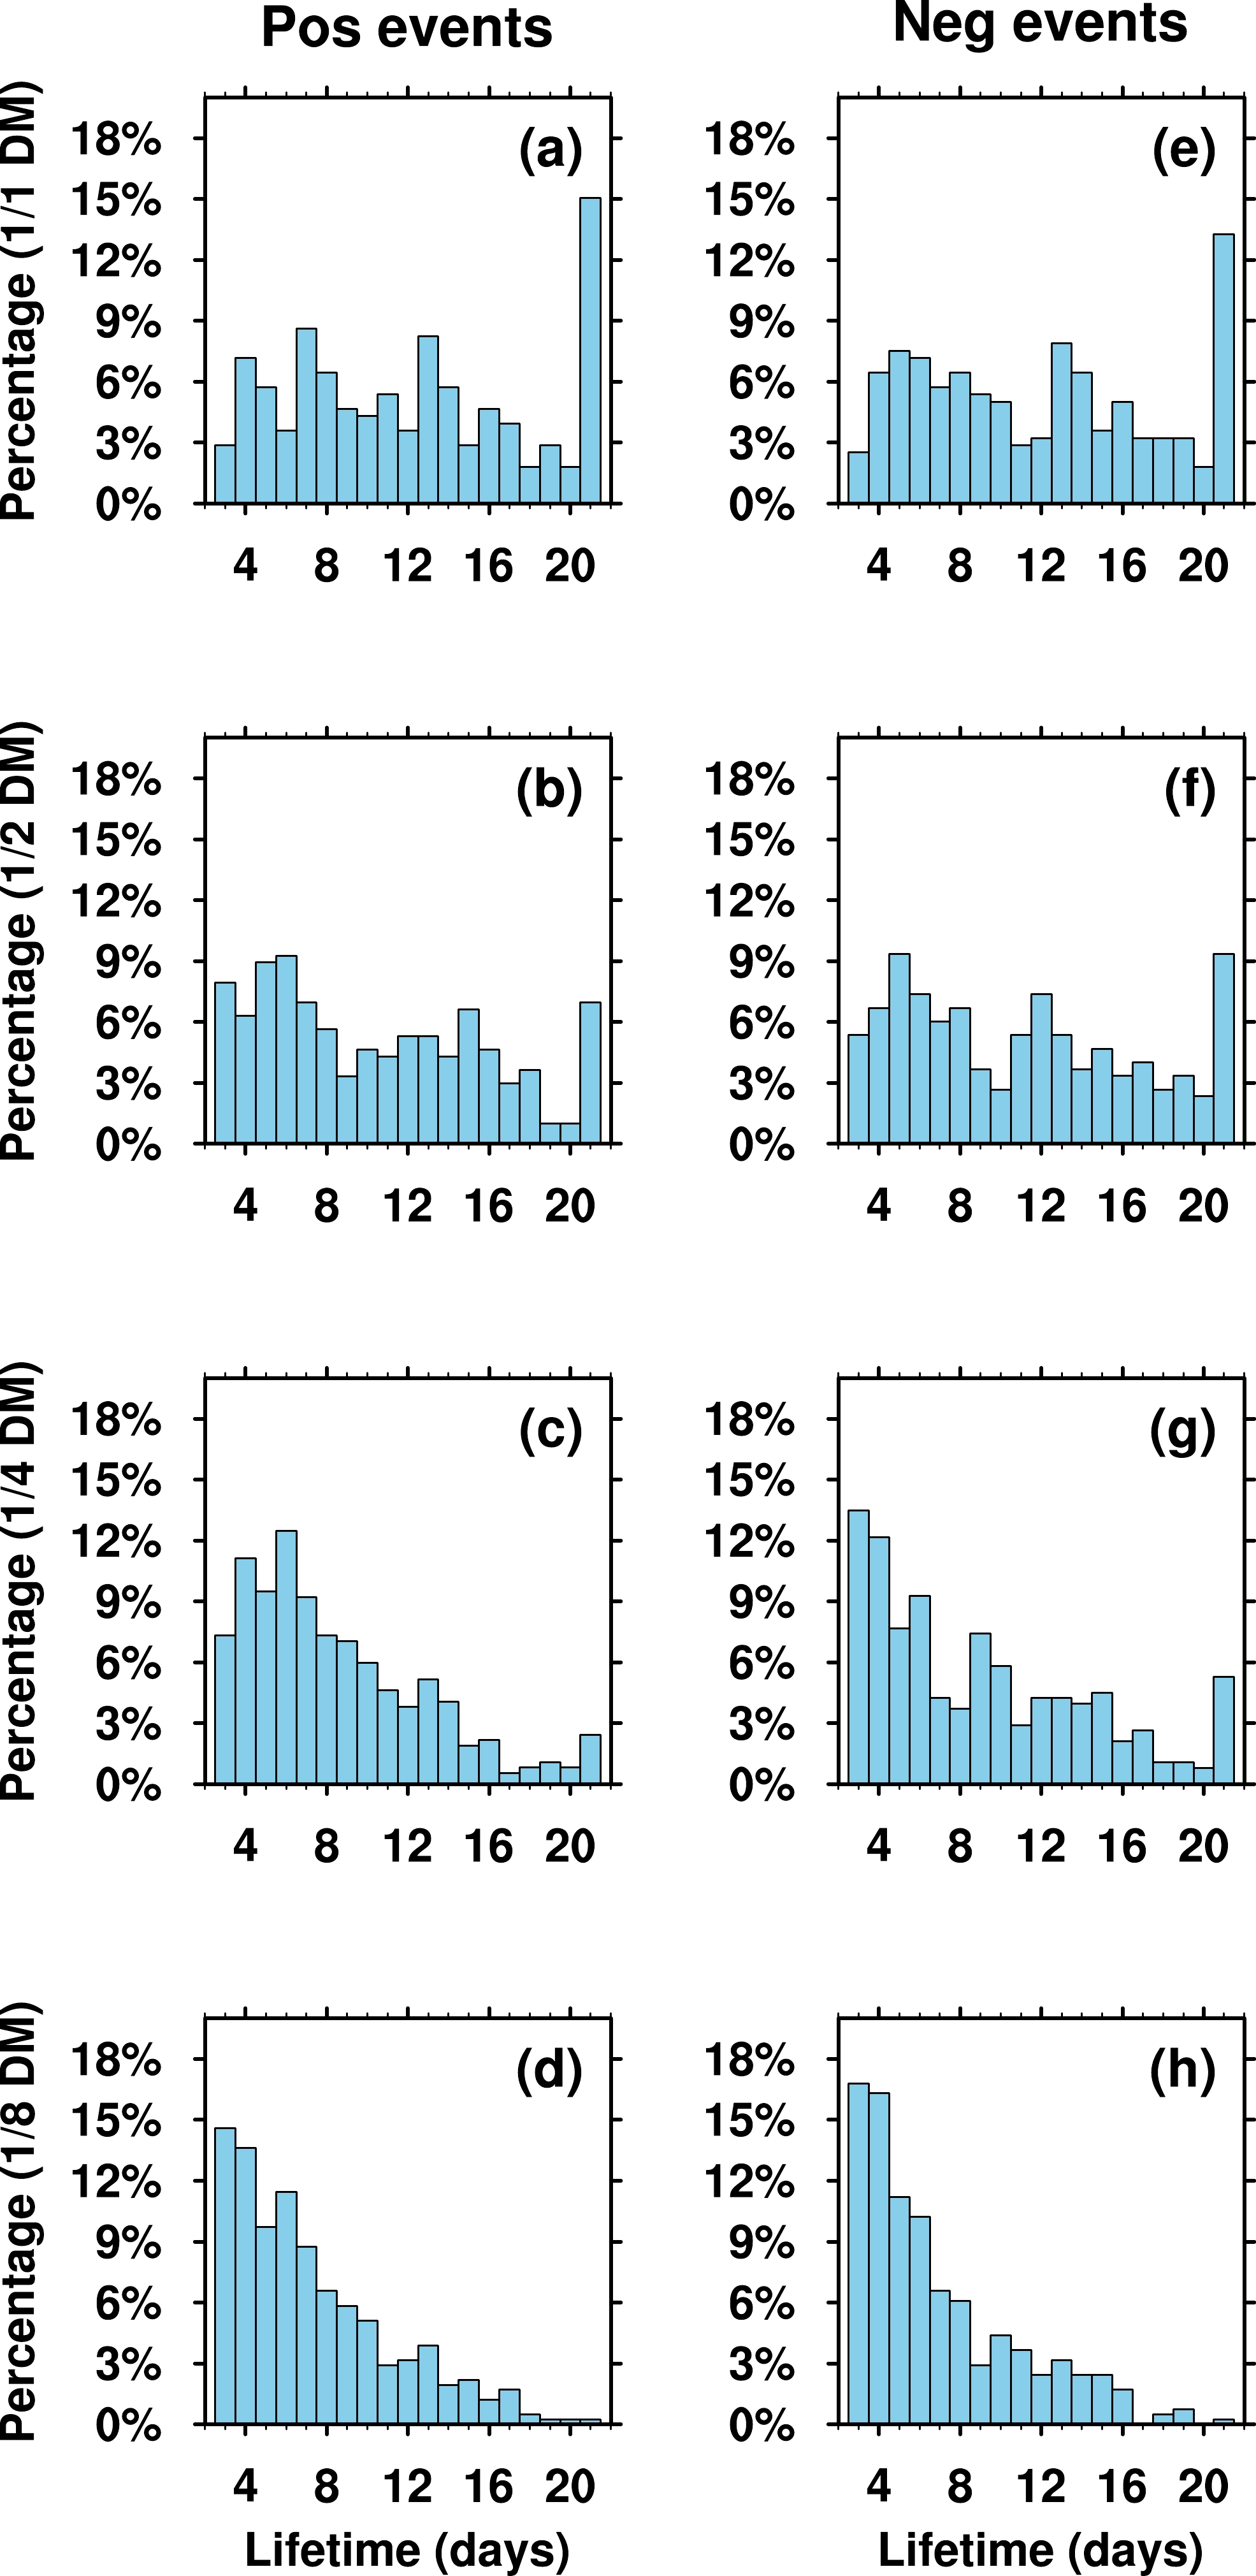
In an intuitive sense, a longer (shorter) persistence of the atmospheric DM should correspond to a longer (shorter) lifetime of the DM event. To further illustrate the differences between the persistence of a 1/1 DM, 1/2 DM, 1/4 DM, and 1/8 DM, Fig. 5 shows the percentages of occurrence of the 1/1 DM, 1/2 DM, 1/4 DM, and 1/8 DM positive and negative events with a lifetime of 3 to 21 days. The identification of the positive and negative DM events and the definition of the lifetime of an event are the same as Song (2019) and Song and Zhao (2020). To avoid tedious repetition, these details are not elaborated upon here. The most conspicuous information in Fig. 5 is that, indeed, for a 1/1 DM to 1/8 DM, the frequency of occurrence of the DM events with a relatively long (short) lifetime gradually decreases (increases)
3 . In fact, the most frequently occurring 1/8 DM events have a lifetime typical of synoptic timescales. These results consolidate the conclusion that atmospheric DMs with a broader (narrower) zonal scale dipolar structure possess a longer (shorter) persistence.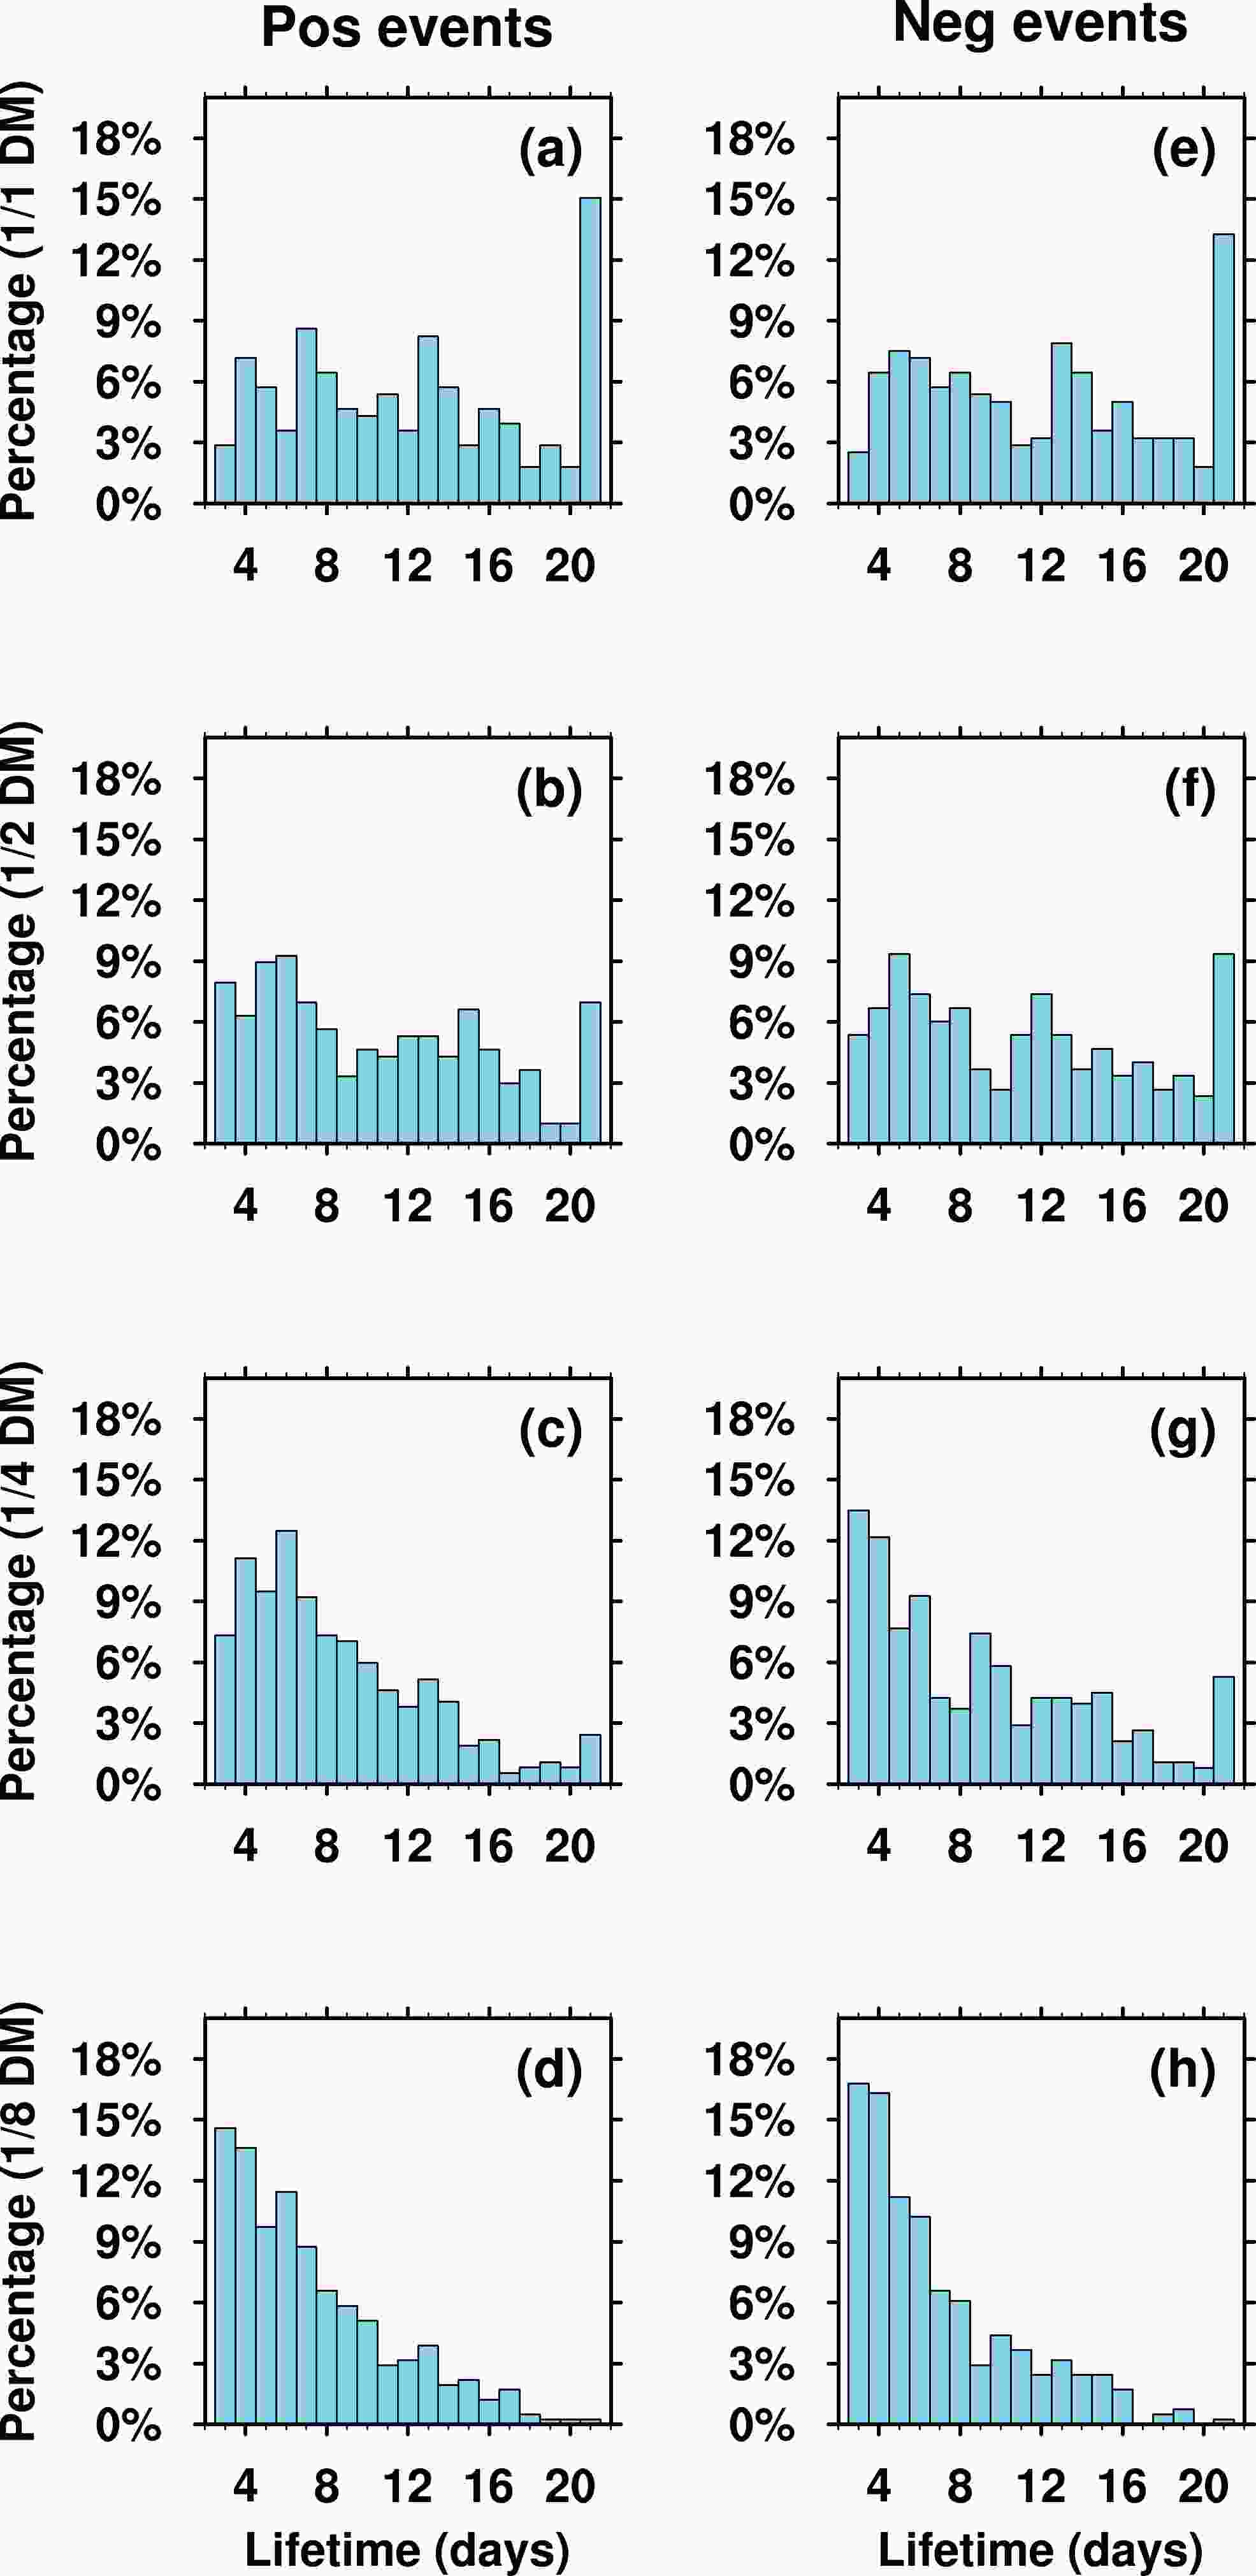
Figure 5. The percentage of occurrence of positive and negative events with a lifetime of 3, 4, 5, ……,21 days for a 1/1 DM (top row), 1/2 DM (second row), 1/4 DM (third row), and 1/8 DM (bottom row).
-
What causes the atmospheric DMs that have a broader (narrower) zonal scale dipolar structure to possess a longer (shorter) persistence? In this section, we conduct a detailed vorticity budget diagnosis based on Eq. (2) for the composite events of DMs which prove useful in revealing the key physical processes responsible for the different persistence of DMs. To simplify our discussions, the delivered results are solely based on the model’s DMs and we only focus on the two extreme scenarios of a 1/1 DM and 1/8 DM hereafter
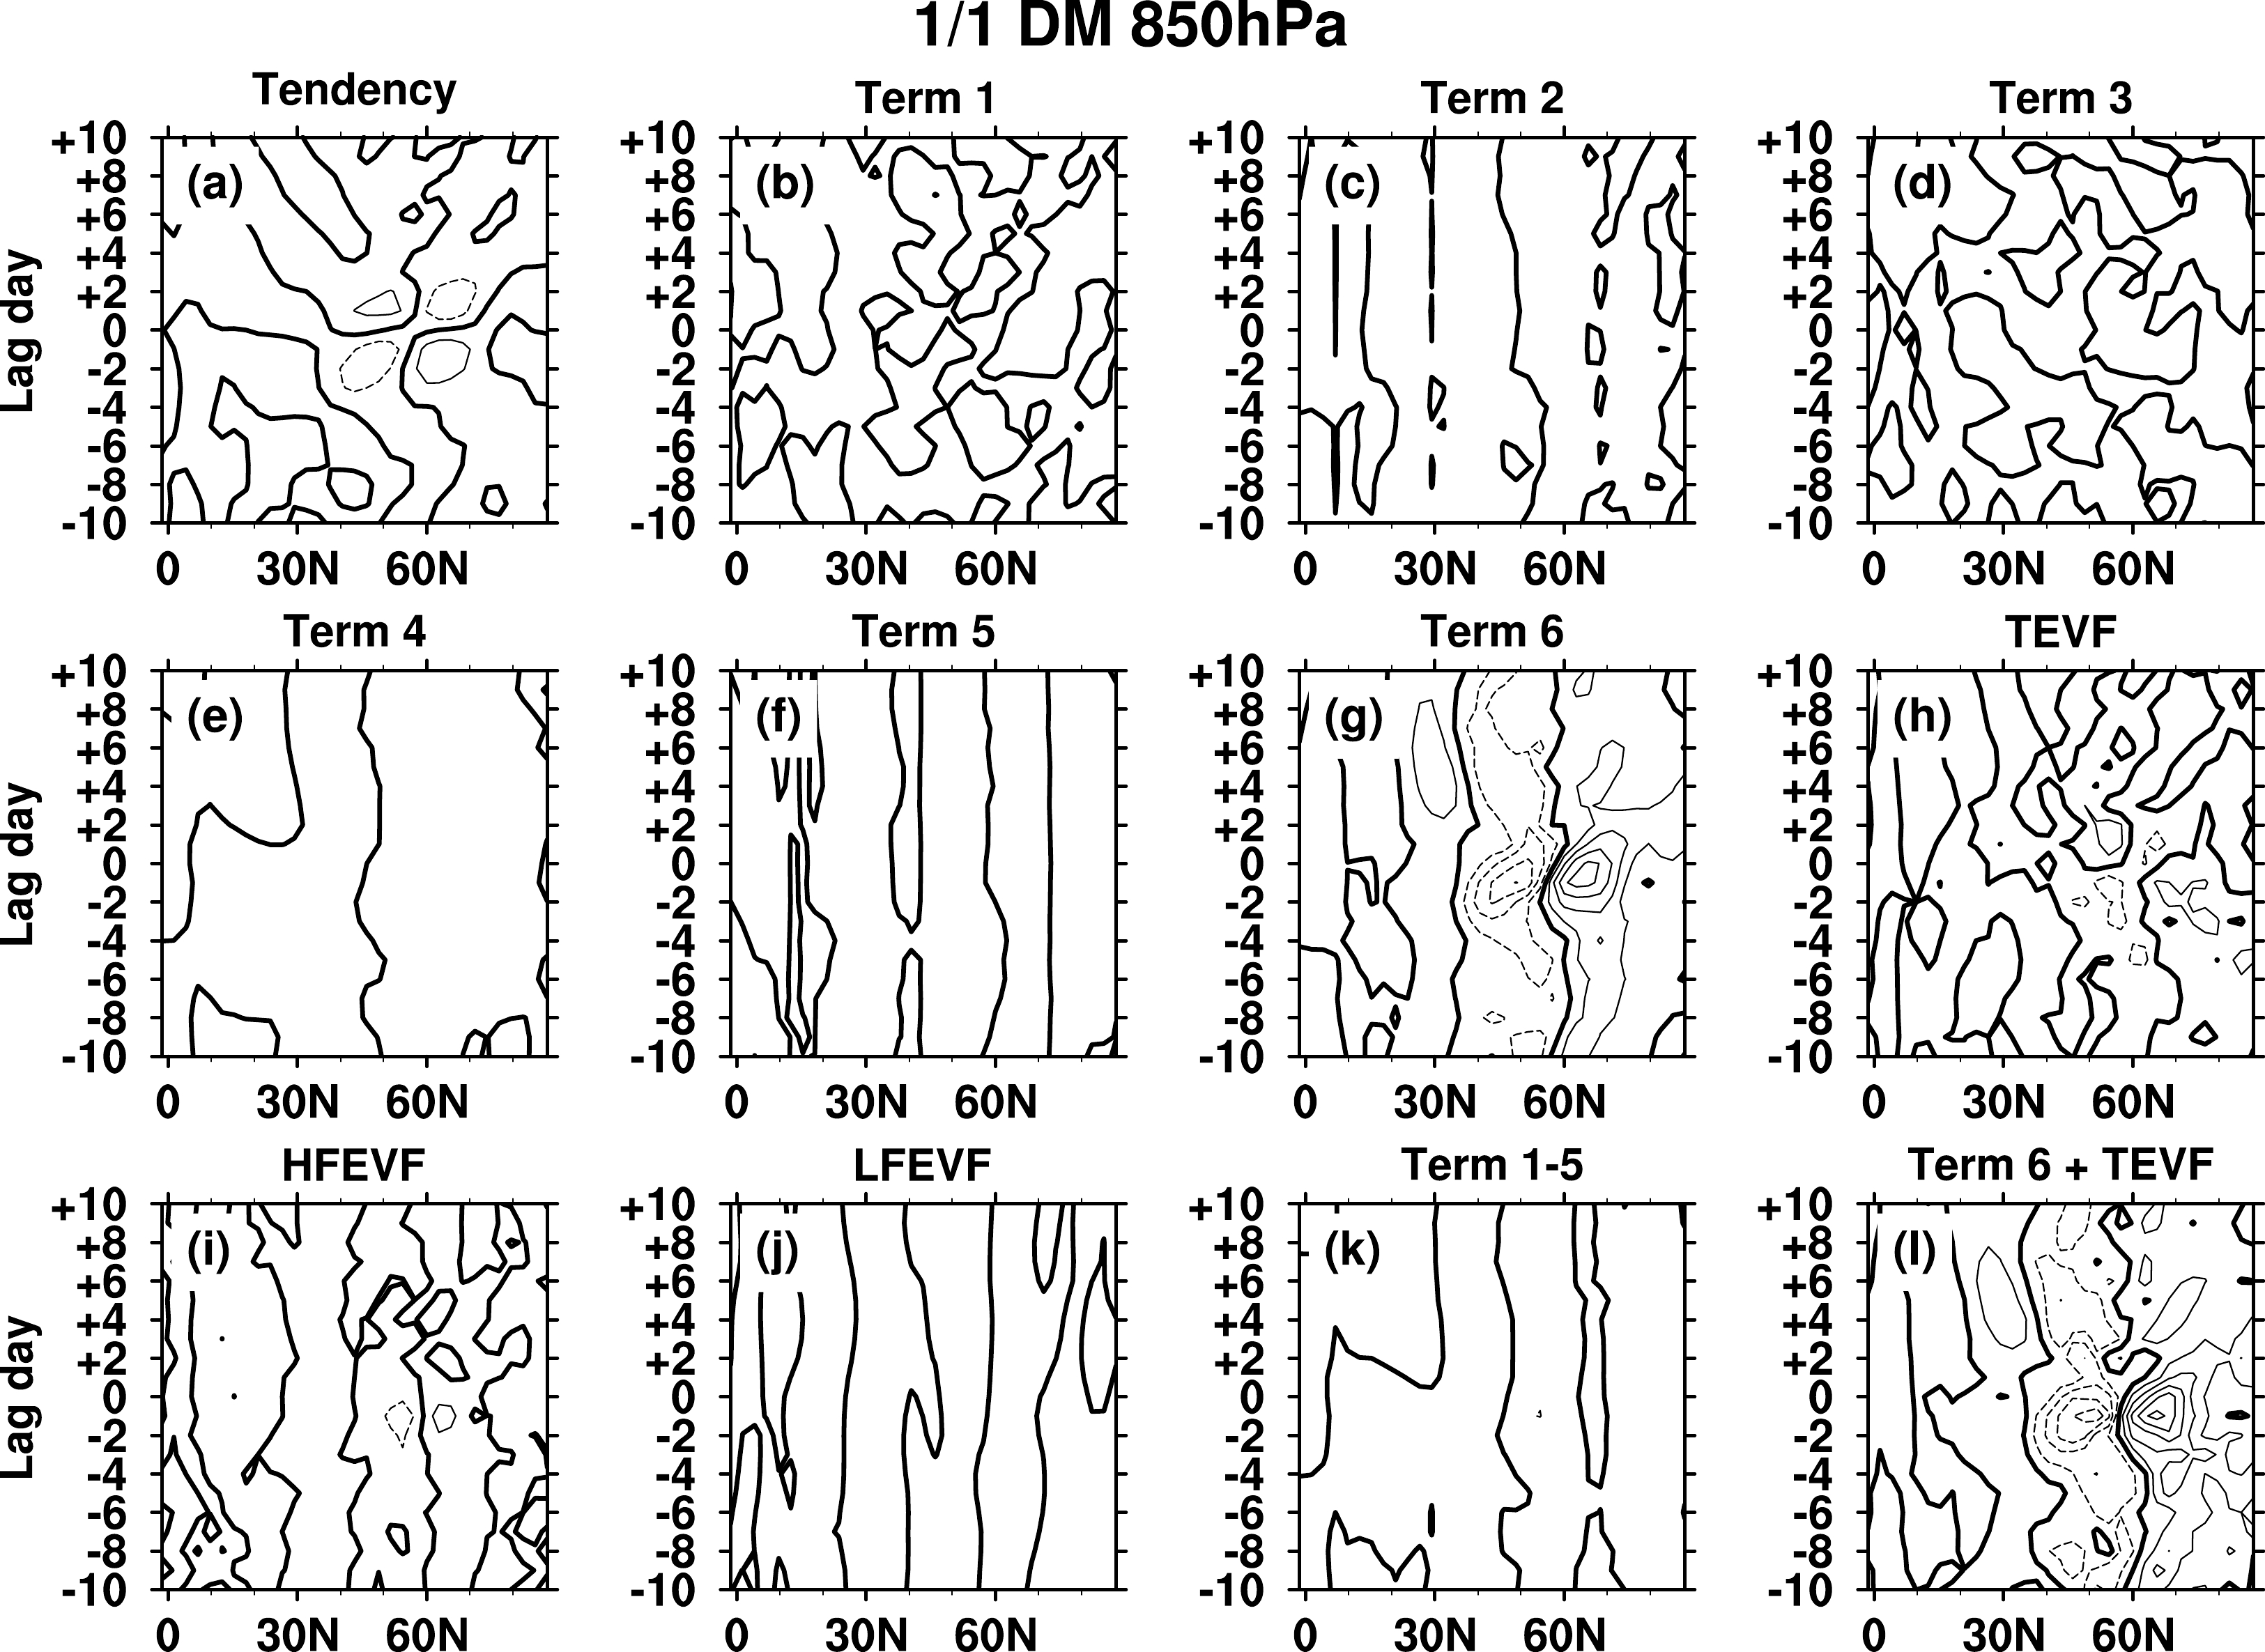
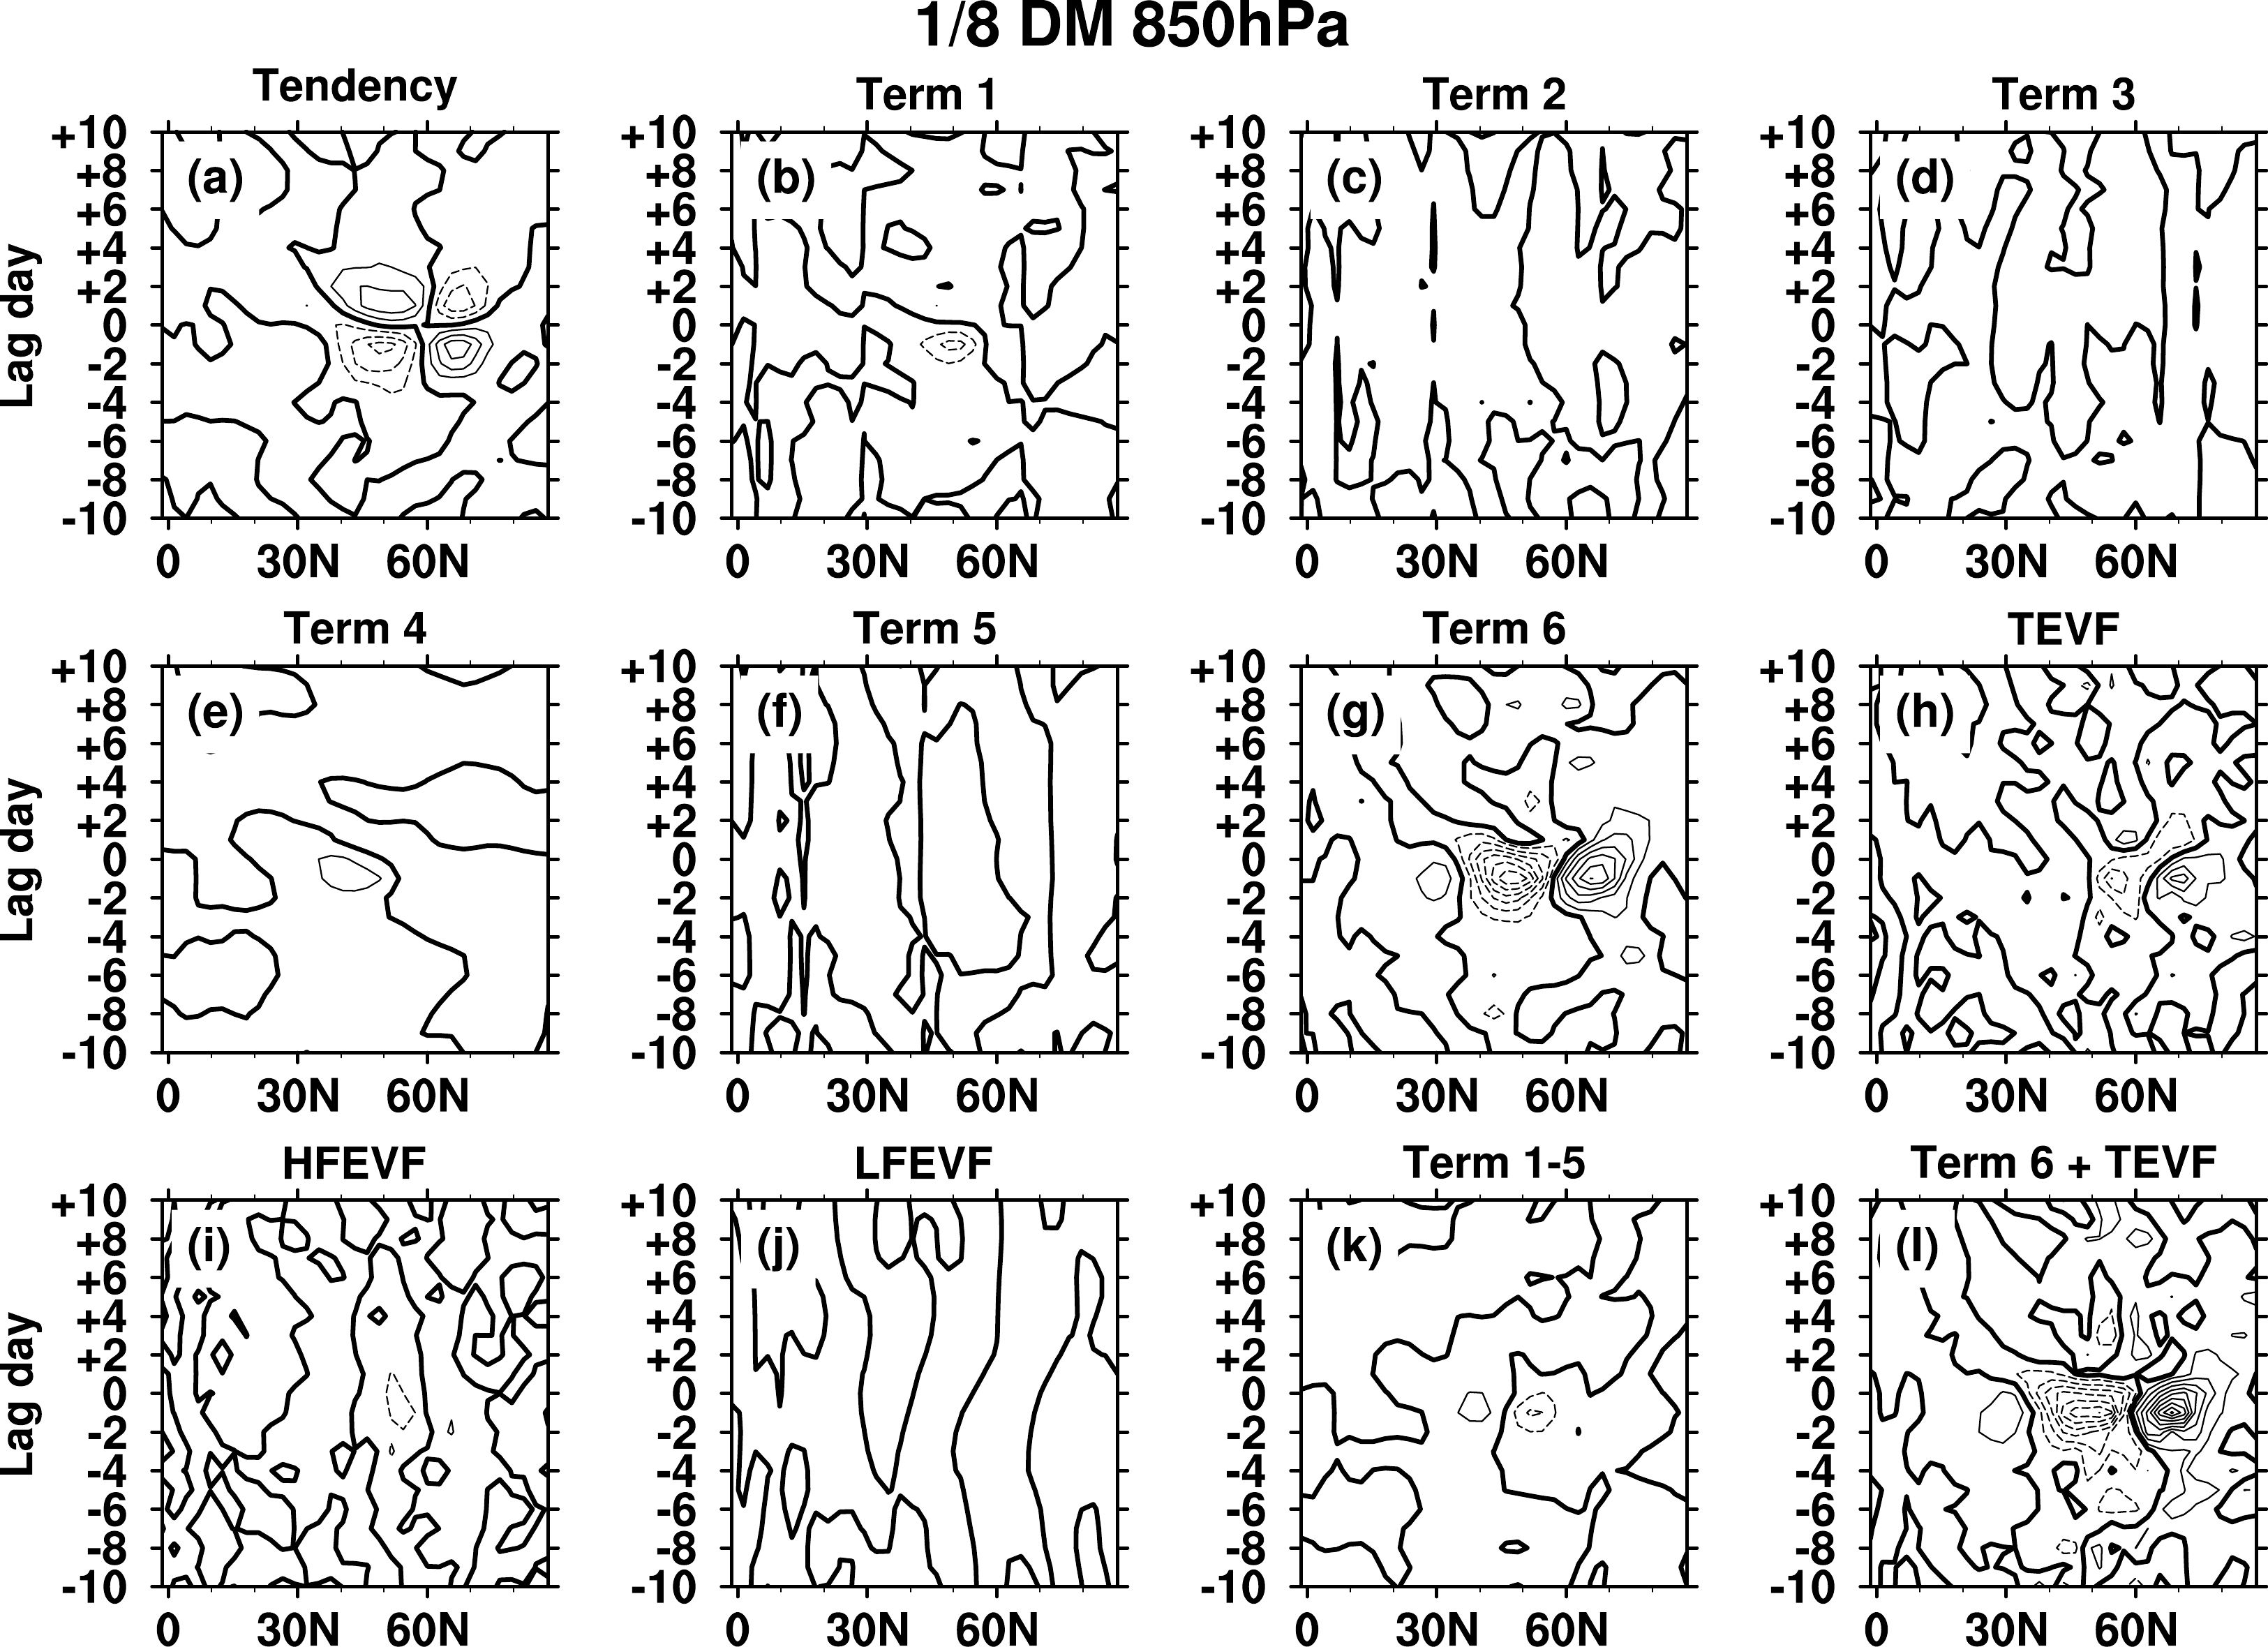
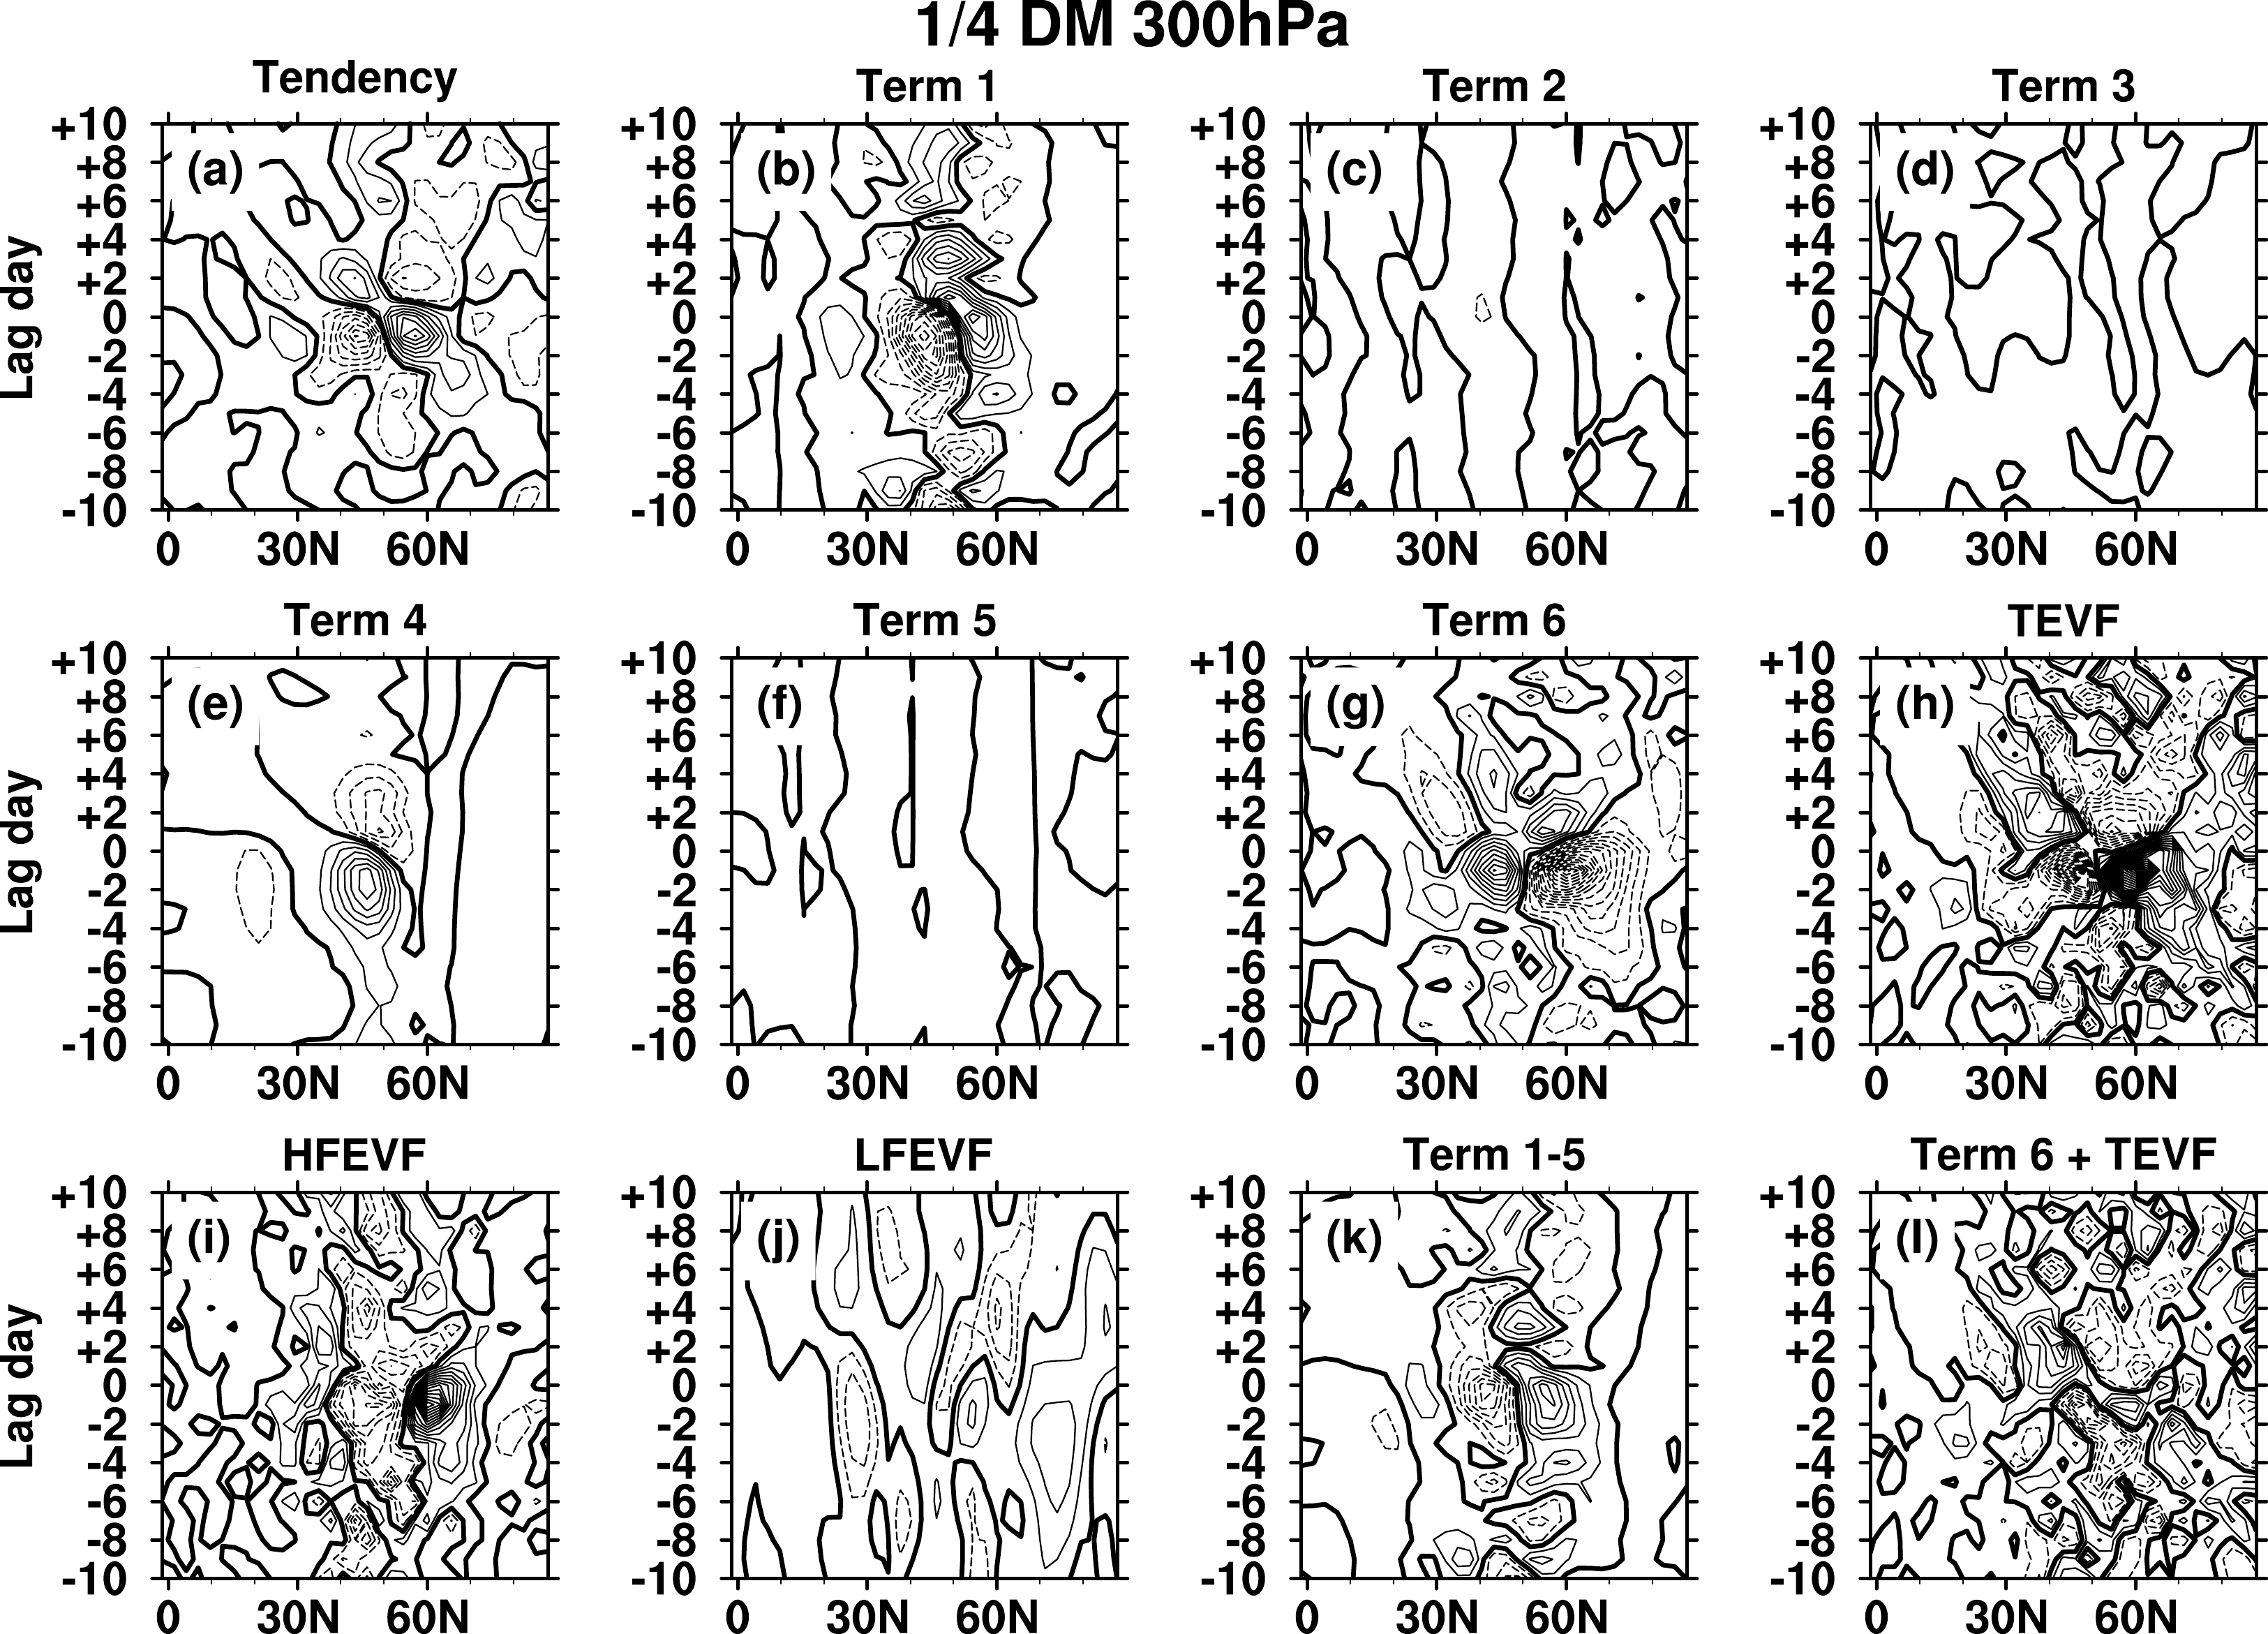
4 .First, we calculate the composite results of each term in Eq. (2) at 300 and 850 hPa for the 1/1 and 1/8 DM events. Then, for the purpose of a convenient display, those composite results are conducted a zonal mean (0°–360°) calculation for the 1/1 DM events and a sectoral mean (0°–45°E) calculation for the 1/8 DM events. To avoid unnecessary repetition, we only discuss the results of their positive events in the following paragraphs. Figures 6 and 7 respectively show the 300- and 850-hPa zonal mean results of the composite tendency term, term1, term2 …, term6, TEVF, HFEVF, LFEVF, the sum of terms 1−5
$\left(\sum\nolimits_{i = 1}^5 {{\text{term}}(i)}\right)$ and the sum of term6 and TEVF$ \left({\text{term}}6 + {\text{TEVF}}\right) $ for 1/1 DM positive events from –10 to 10 days.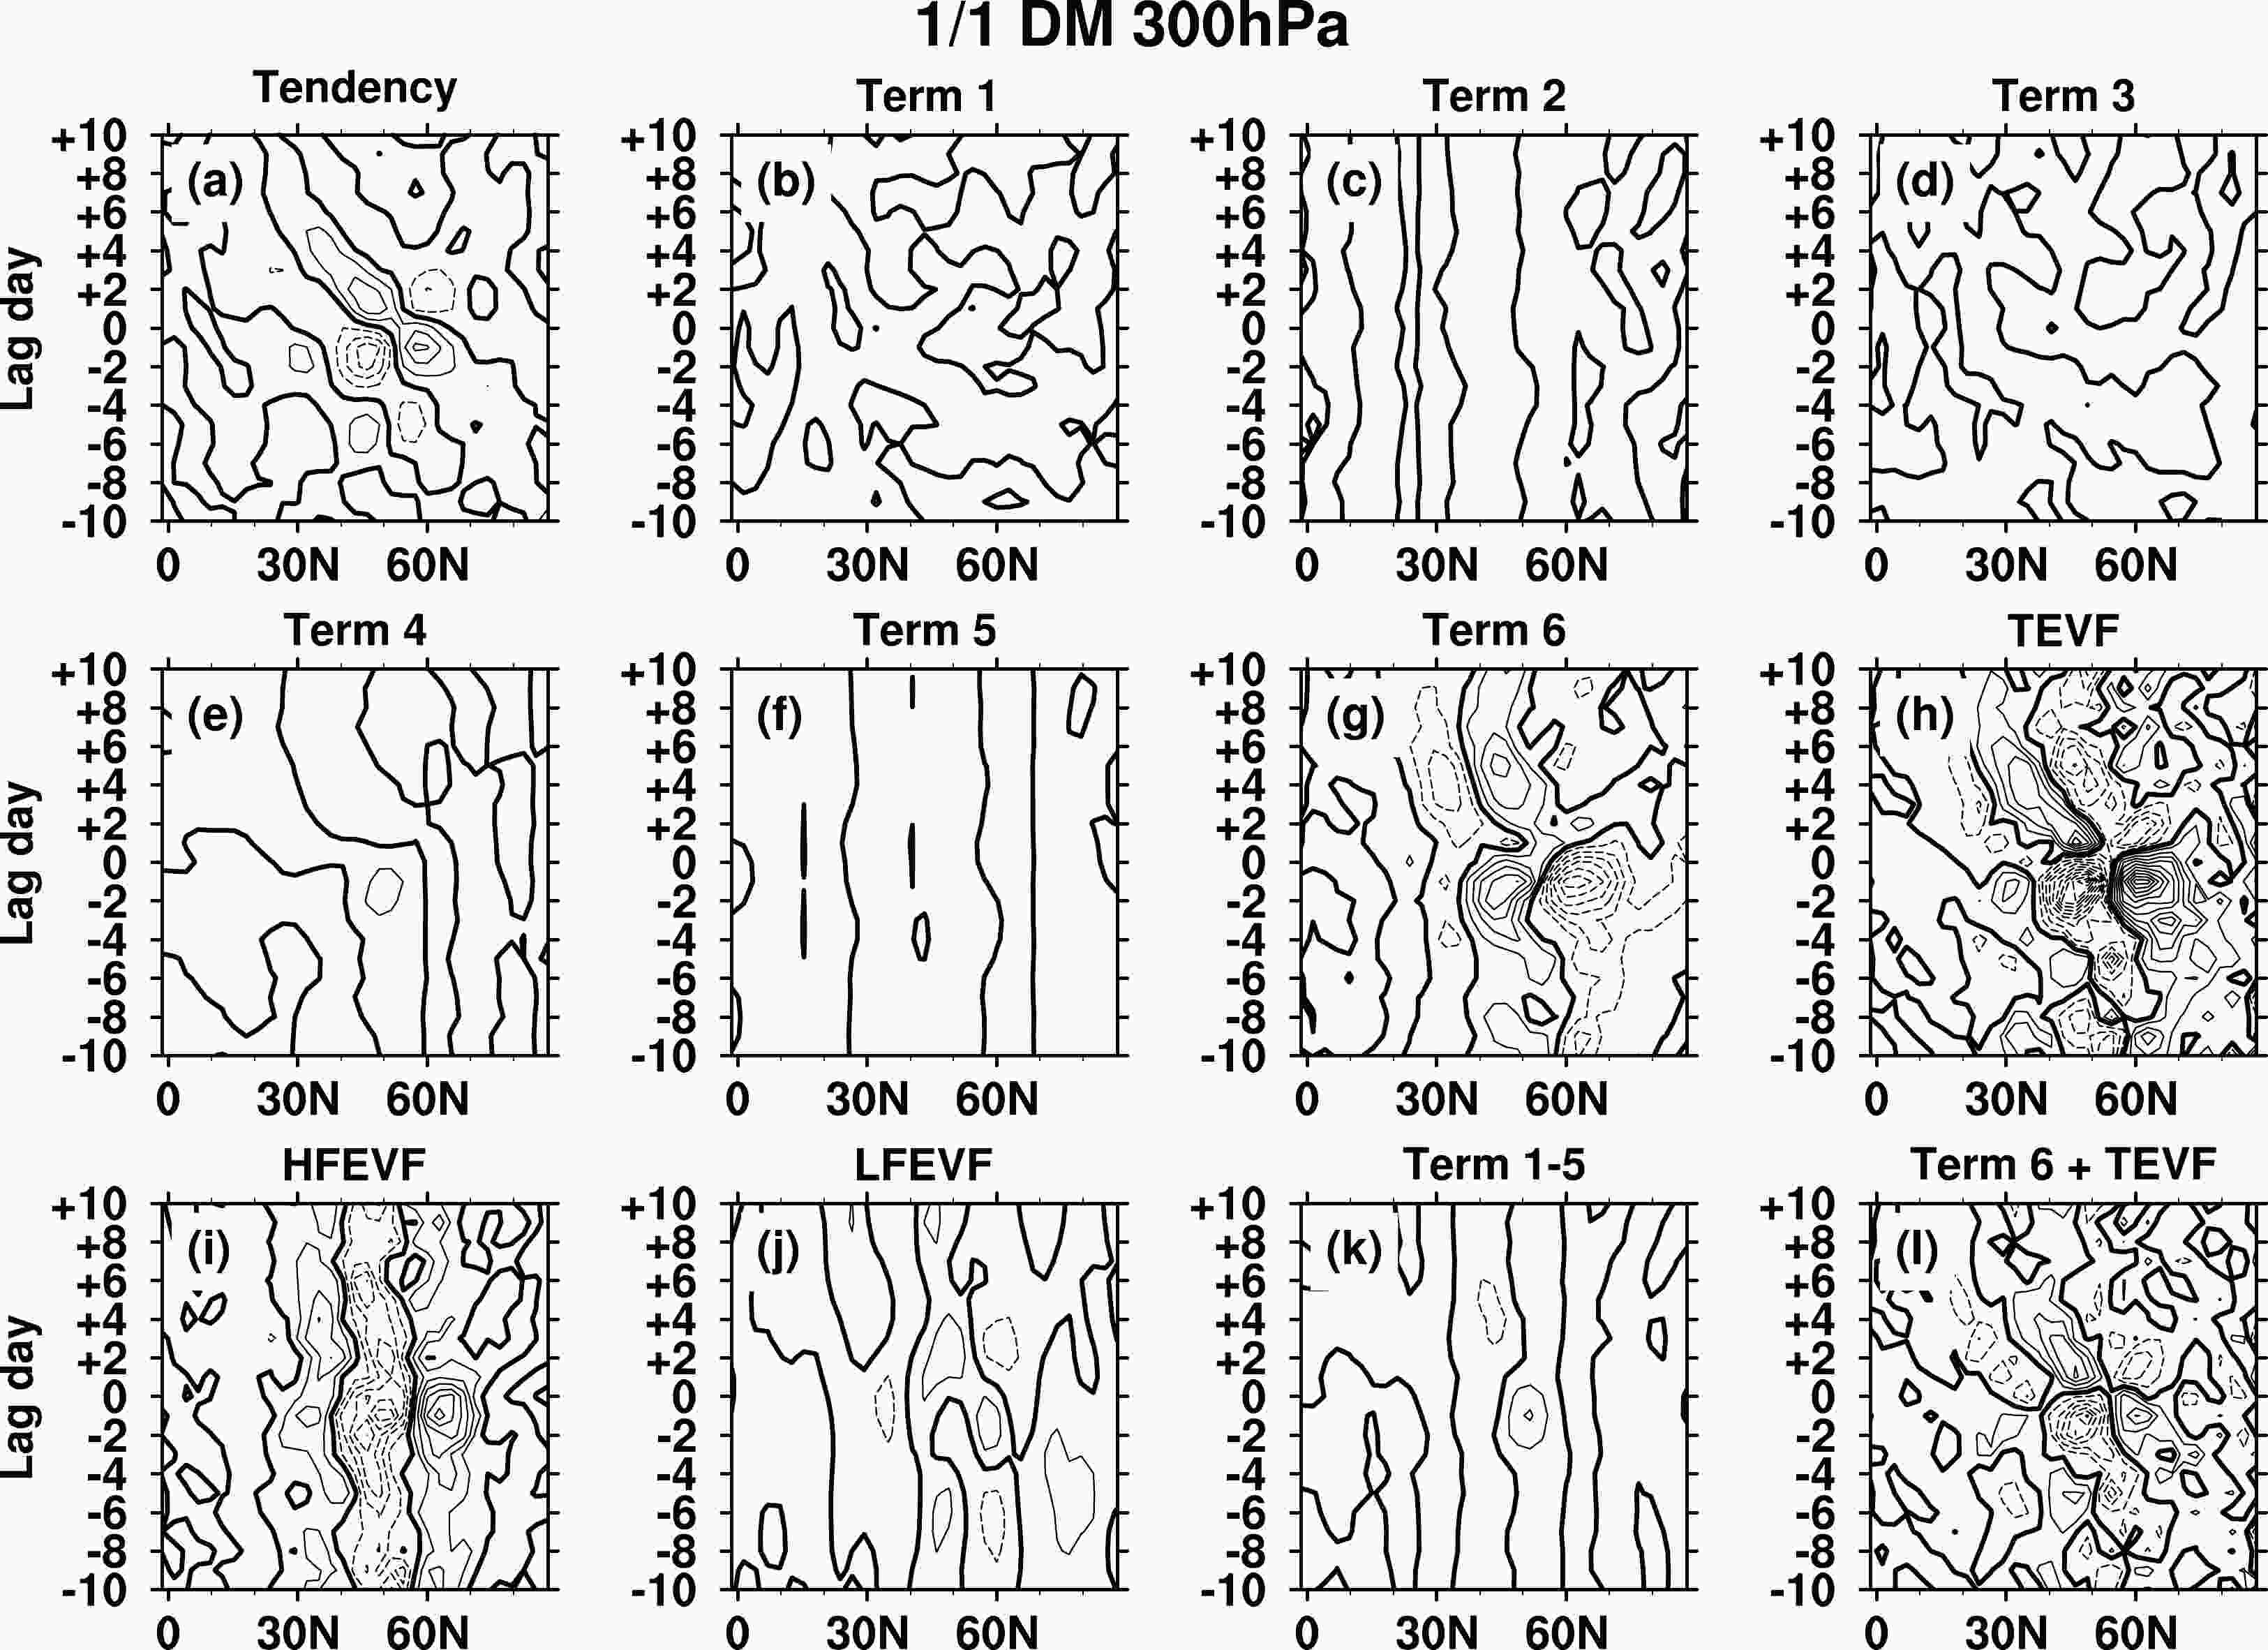
Figure 6. The temporal evolution of zonal mean results of the composite tendency term, term1, term2 …term6, TEVF, HFEVF, LFEVF, the sum of terms 1–5, and the sum of term6 and TEVF (term6 + TEVF) for 1/1 DM positive events from –10 to 10 days at 300 hPa. Solid (dashed) contours represent positive (negative) values; zero contours are bolded. The contour interval is 8 × 10–12 s–2.

Figure 7. Same as in Fig. 6 but for the results at 850 hPa.
In the upper troposphere, the 300-hPa composite tendency term of 1/1 DM positive events depicts a longitudinal dipolar structure with positive (negative) values at around 55°–70°N and negative (positive) values near 40°–55°N during negative (positive) lag days representing the growth (decay) of 1/1 DM positive events (see Fig. 6a). Obviously, the first five linear terms (terms 1–5) play a negligible role on the formation of the tendency term of 1/1 DM positive events (see Figs. 6b–f and Fig. 6k). This should be due to the zonally symmetric feature of a 1/1 DM.
TEVF produces a meridional dipolar structure of tendency with positive values near 55°–75°N and negative values near 35°–55°N during negative lag days; while TEVF produces a tilting meridional dipolar pattern of tendency with negative values at around 40°–60°N and positive values at around 25°–50°N during positive lag days (see Fig. 6h). The effects of TEVF are greatly neutralized by term6 (see Fig. 6g). Generally speaking, the tendency term for 1/1 DM positive events can be well depicted by using the sum of term6 and TEVF only (see Fig. 6l). HFEVF tends to produce a “positive-negative-positive” tripolar structure of tendency from 25°–70°N during the entire lifetime of 1/1 DM positive events (see Fig. 6i). While the contributions of LFEVF on the formation of 1/1 DM positive events are less important and somewhat complicated (see Fig. 6j). Therefore, HFEVF is a major contributor to TEVF.
Figure 7 shows that term6 assumes an overwhelming position in the 850-hPa vorticity budget results. Term6 at 850 hPa produces positive vorticity tendencies at high latitudes and negative vorticity tendencies at mid-latitudes from lag –10 to 10 days indicating that 1/1 DM positive events in the lower troposphere are dominantly driven and maintained by term6 against dissipation. We also notice an inverse association between the positive (negative) tendency of term6 at 850 hPa to the negative (positive) tendency of term6 at 300 hPa.
The results shown in Figs. 6 and 7 indicate that a 1/1 DM, from the upper troposphere to the lower troposphere, is primarily driven by term6 and nonlinear TEVF. Note that the cyclonic (anticyclonic) circulations aroused by the convergence (divergence) of eddy vorticity flux at the upper troposphere will spontaneously induce a horizontal divergence (convergence) of mass due to the Coriolis force. To balance the divergence (convergence) of mass in the upper troposphere, an upward (downward) vertical velocity at the middle troposphere is required, which naturally induces mass convergence (divergence) at the lower troposphere. Therefore, as observed in Figs. 6 and 7, the TEVF and term6 tend to balance each other at 300 hPa, and term6 at 850 hPa and 300 hPa are closely related to each other. Of course, eddy heat fluxes can also affect the 300- and 850-hPa divergence, noting that their contributions are implicitly included in Eq. (2). Thus, term6 in the upper and lower troposphere are actually slaved by eddies. Therefore, from the upper to lower troposphere, a 1/1 DM is entirely a nonlinear eddy-driven mode although a linear term (term6) also plays a non-negligible role in its tendency term. Therefore, the persistence of 1/1 DM events relies on the persistence of the nonlinear terms TEVF or HFEVF.
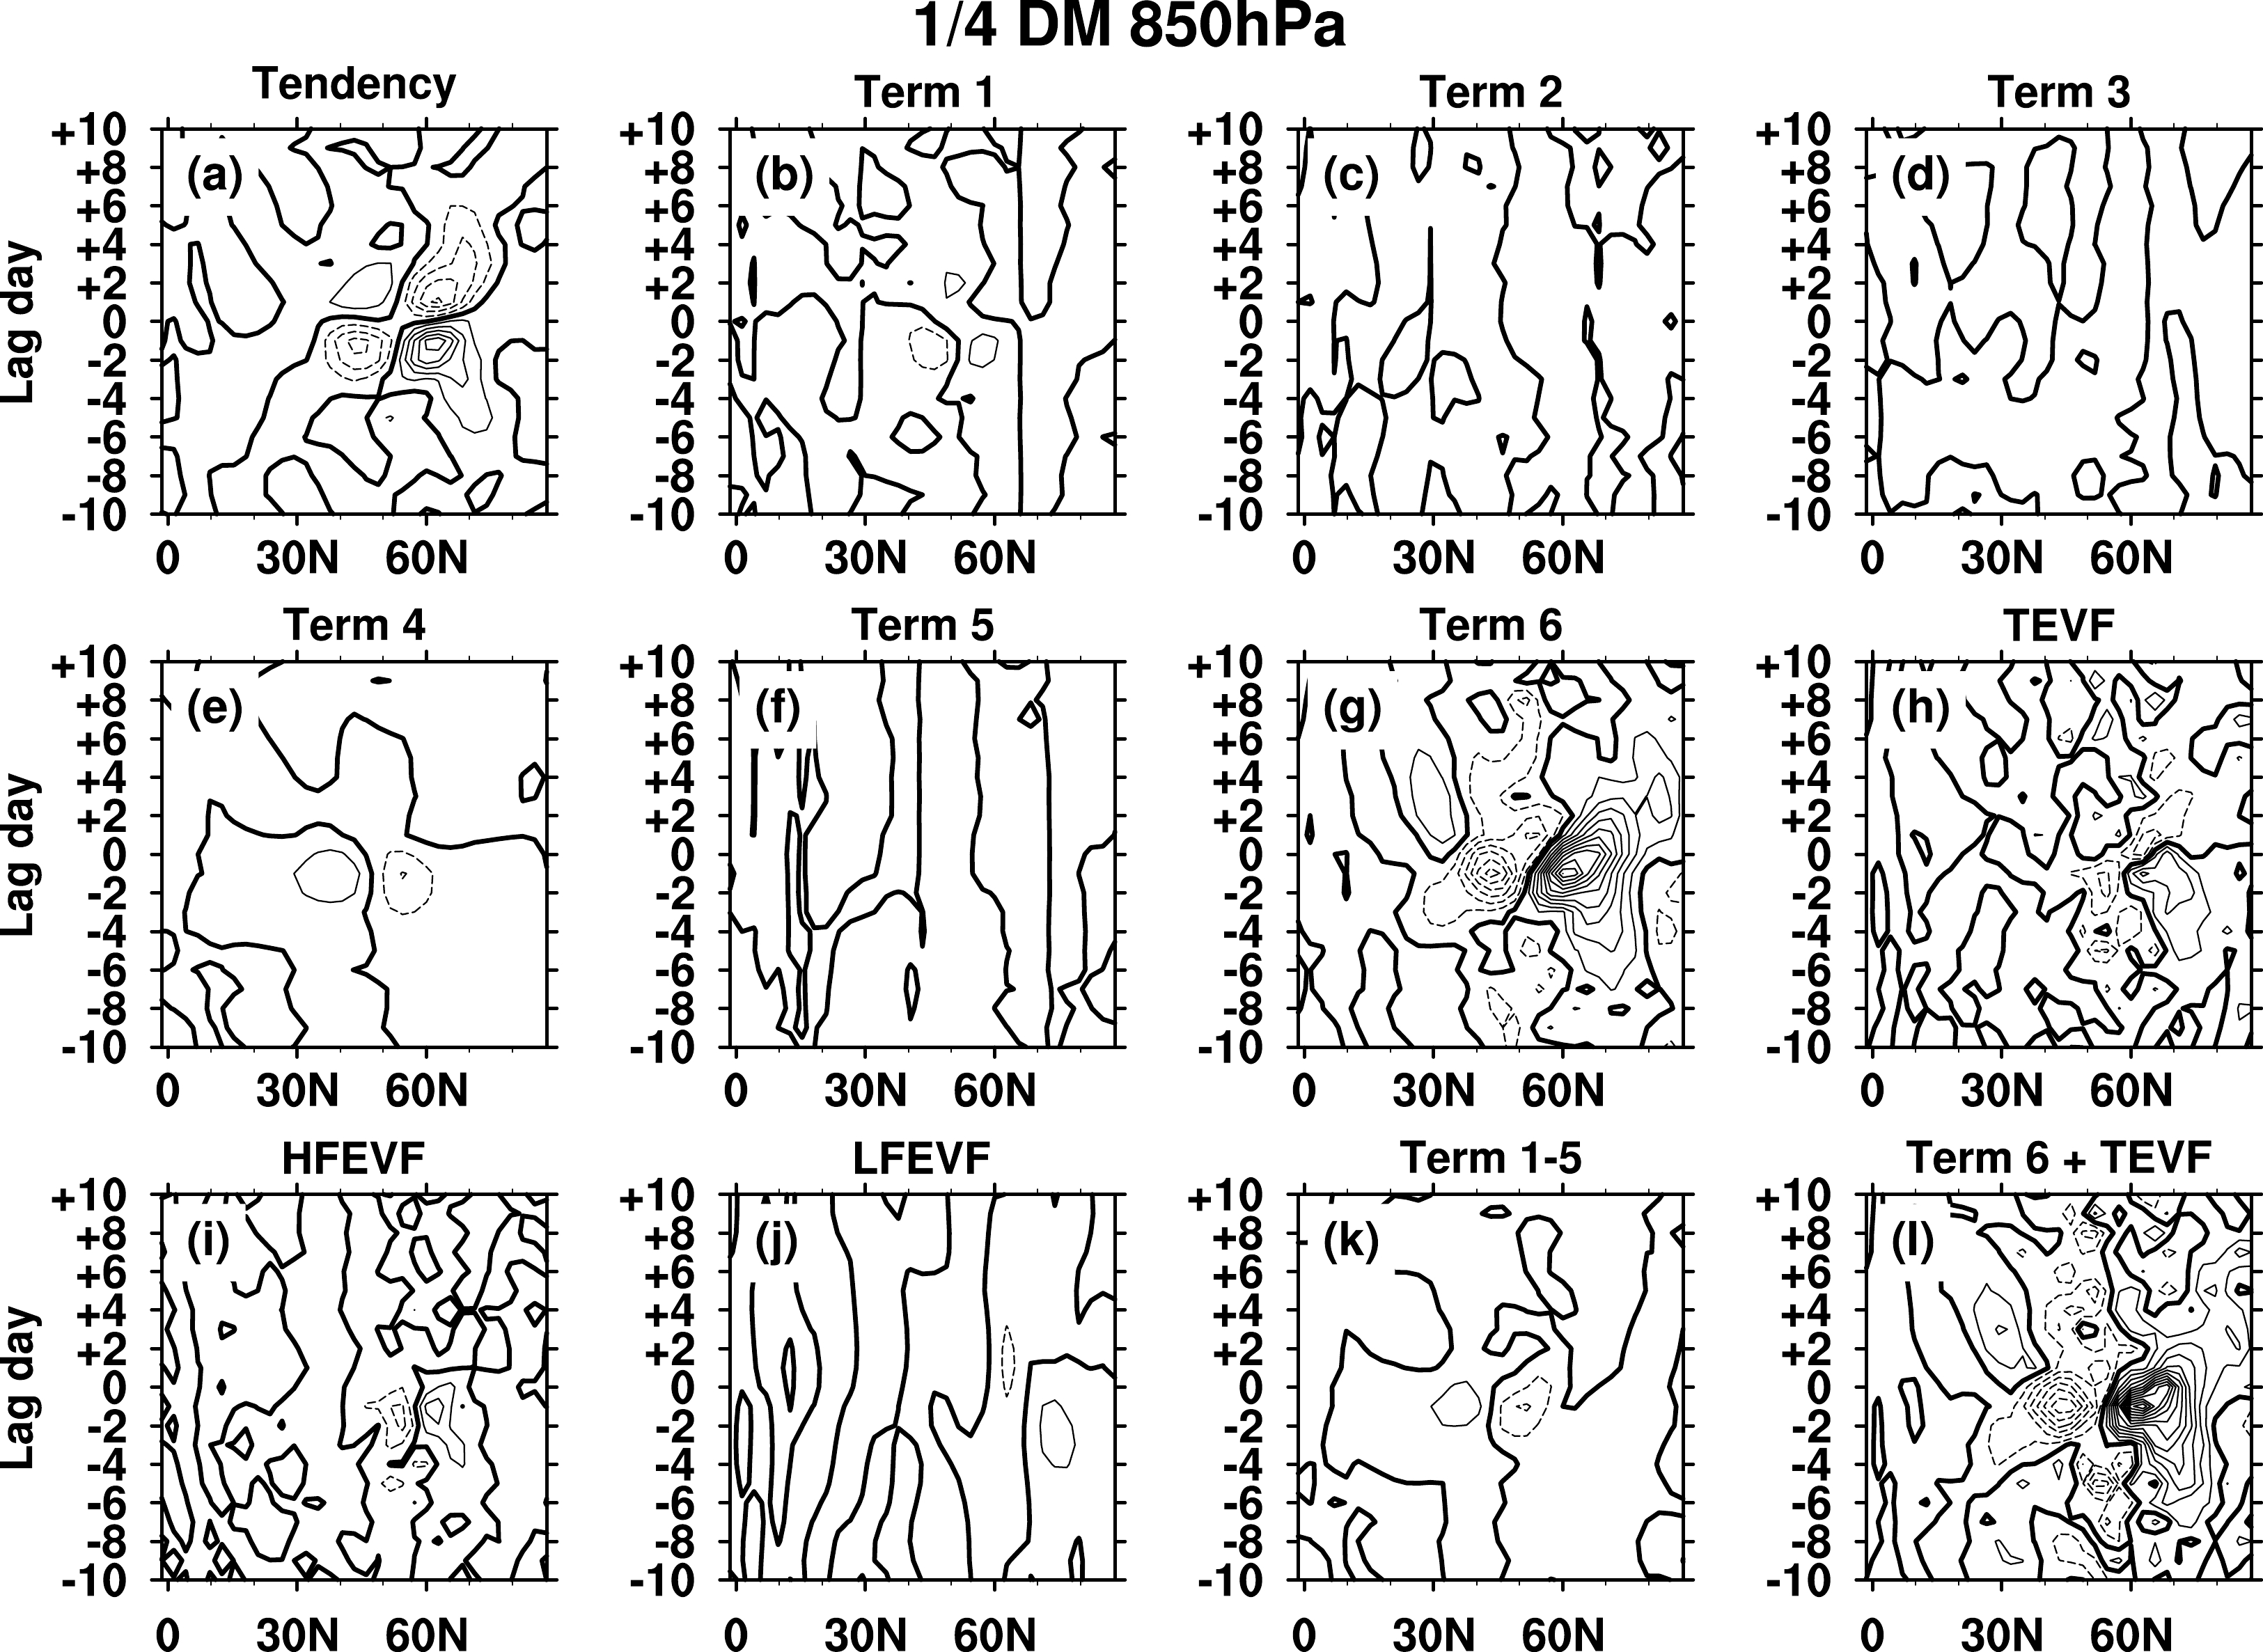
Similar to Figs. 6 and 7 but for the 1/8 DM positive events, the 300- and 850-hPa sectoral mean results of the diagnosed vorticity budget are shown in Figs. 8 and 9. As in the case of 1/1 DM positive events, the nonlinear term TEVF of 1/8 DM positive events also produces a similar meridional dipolar structure of tendency but with a much stronger amplitude during negative lag days (see Fig. 8h); while the signs of the meridional dipolar structure of tendency produced by TEVF are immediately reversed during positive lag days (see Fig. 8h). Still, the effects of TEVF are strongly balanced by term6 (see Fig. 8g), but in this case, the net contributions of the sum of term6 and TEVF on the tendency of 1/8 DM positive events are rather noisy and less important compared to the linear terms (see Fig. 8l). In fact, unlike 1/1 DM positive events, the pattern and temporal evolution of 300-hPa tendency term of 1/8 DM positive events are primarily determined by the linear terms (see Fig. 8k), especially terms 1 and 4 (see Figs. 8b, e). These results are consistent with Athanasiadis and Ambaum (2010) who found that the potential vorticity (PV) variability of the NAO at the 315 K isentropic level is dominantly driven by advection and the eddy forcing only explains a small amount of the tendency variance.
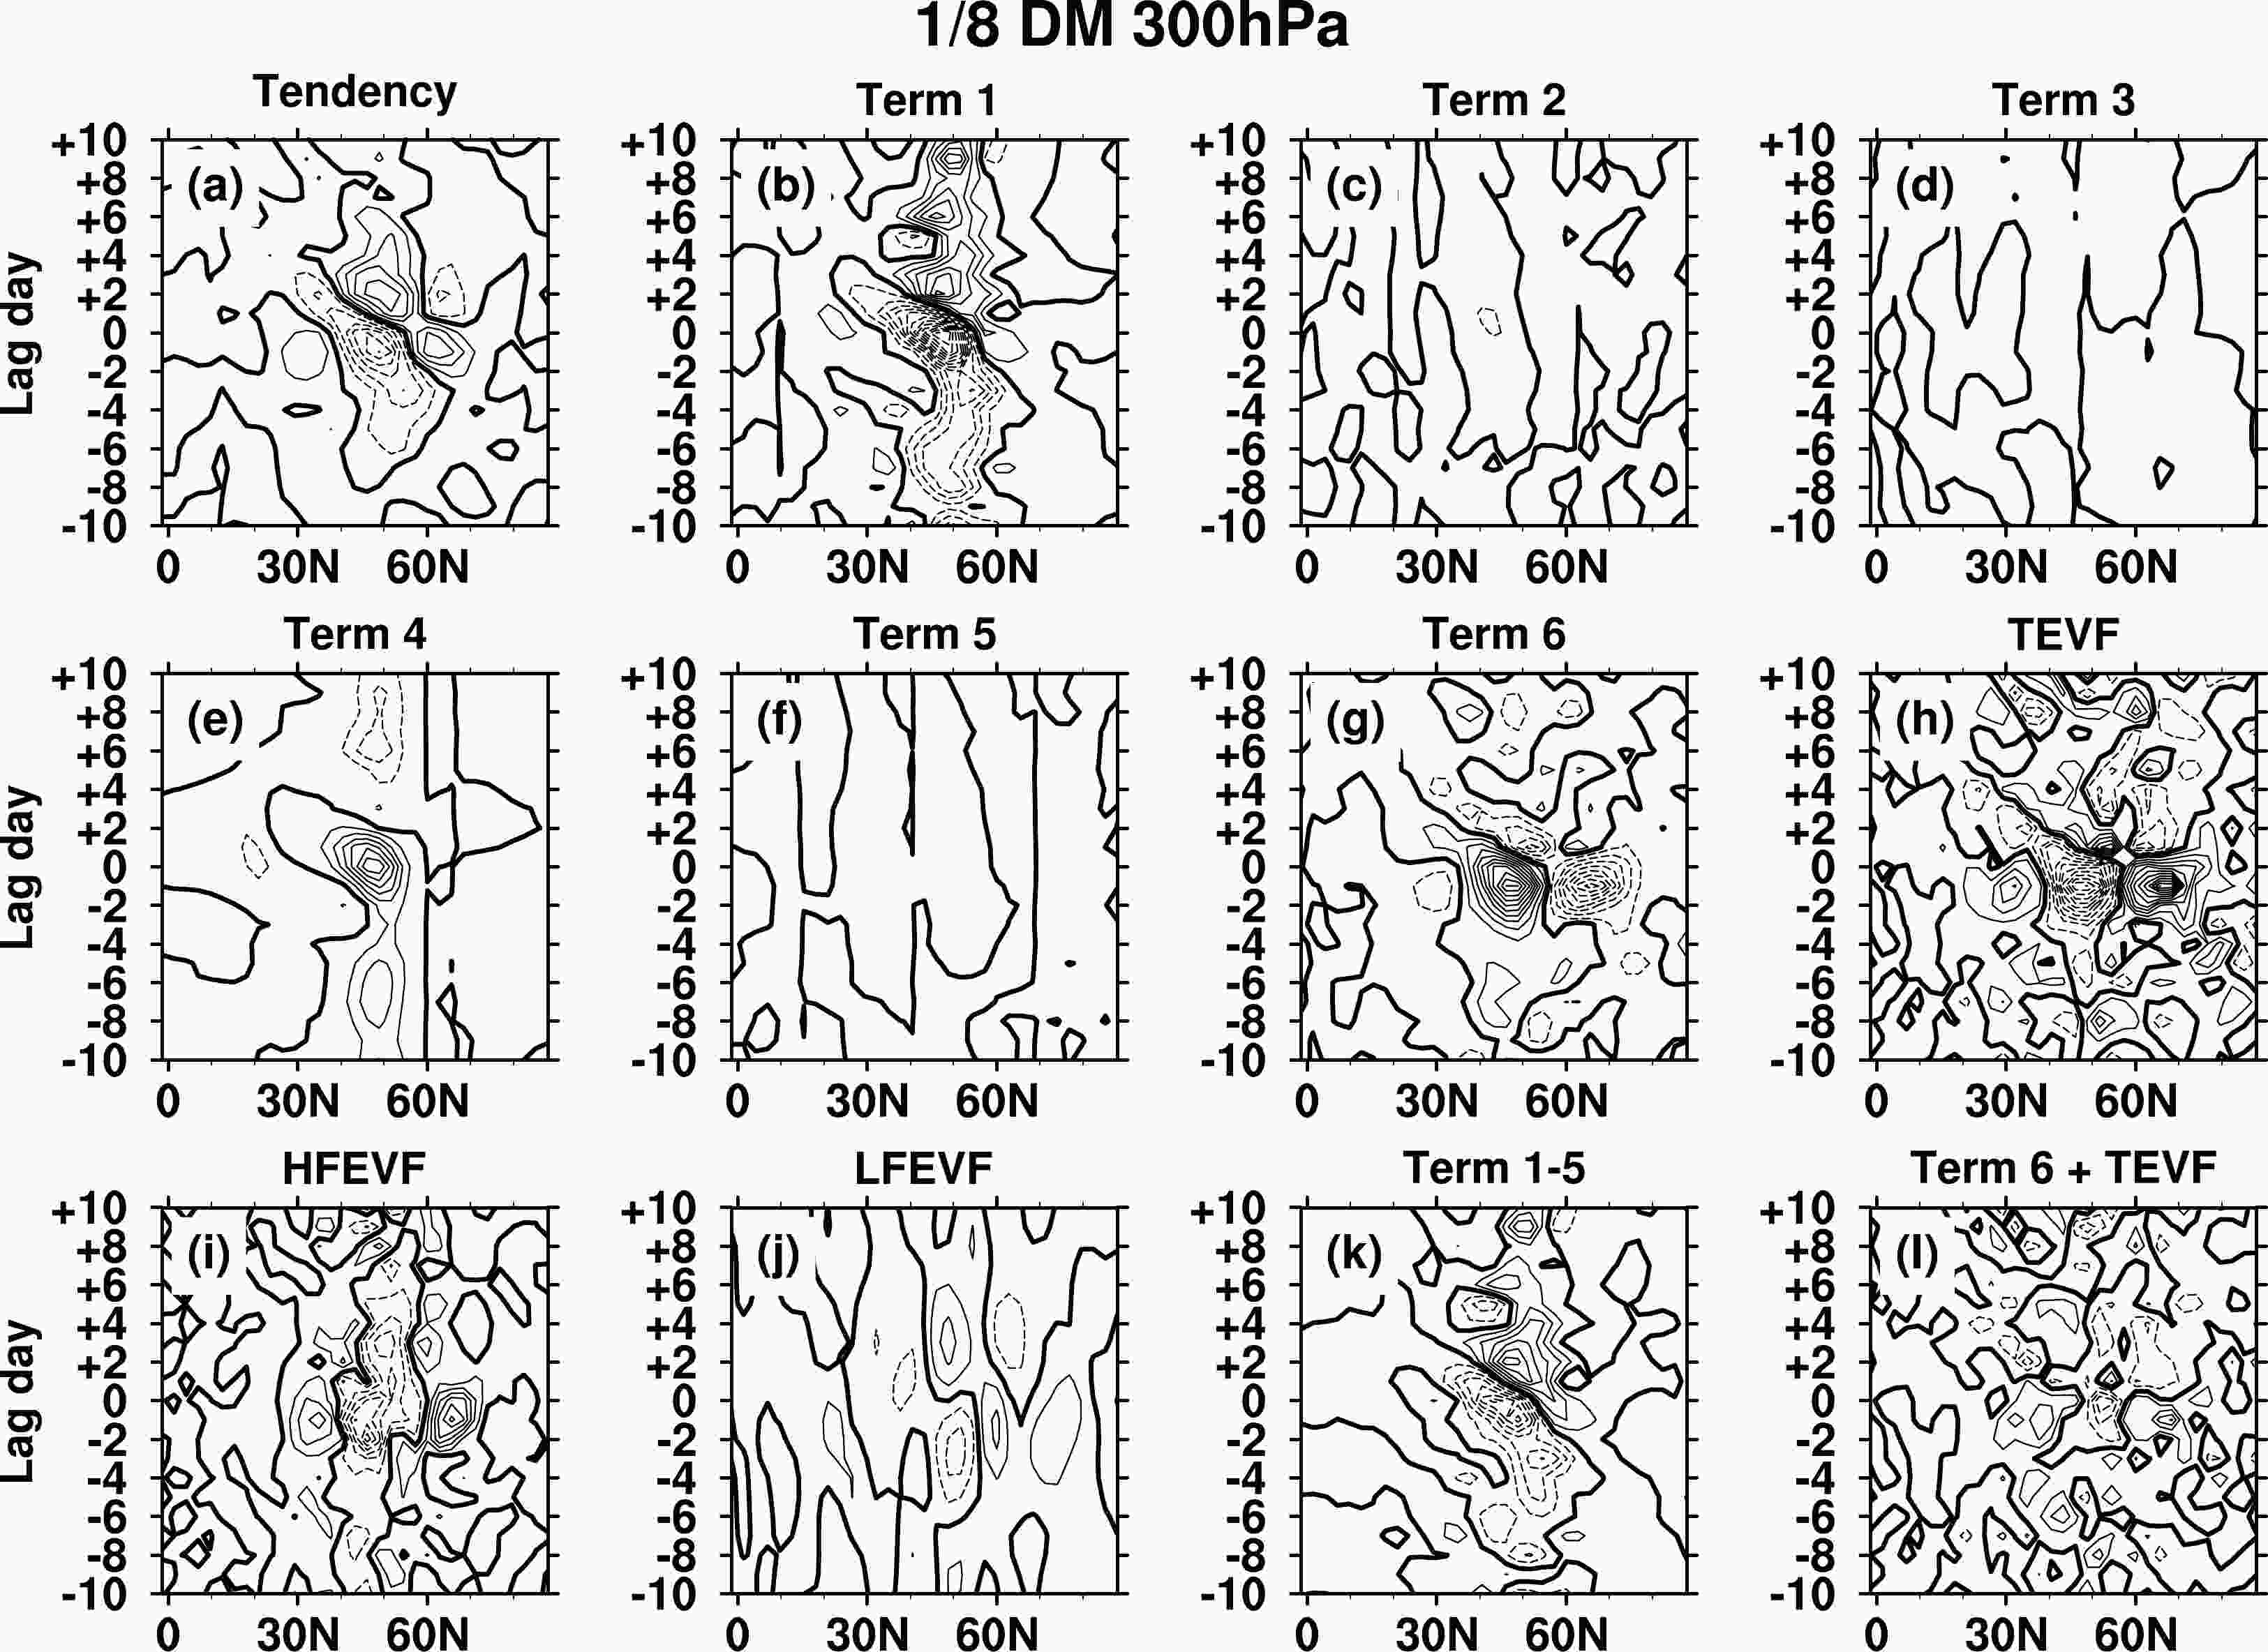
Figure 8. The temporal evolution of zonal mean results of the composite tendency term, term1, term2 …term6, TEVF, HFEVF, LFEVF, the sum of terms 1–5 and the sum of term6 and TEVF (term6 + TEVF) for 1/8 DM positive events from –10 to 10 days at 300 hPa. Solid (dashed) contours represent positive (negative) values; zero contours are bolded. The contour interval is 16 × 10–12 s–2.

Figure 9. Same as in Fig. 8, but for the results at 850 hPa.
Figure 9 shows that in the lower troposphere, 1/8 DM positive events, similar to 1/1 DM positive events, are also primarily driven by term6 at 850 hPa. Note that this term is closely related to the eddy forcing in the upper troposphere as discussed in the previous paragraphs. Thus, the results shown in Figs. 8 and 9 indicate that 1/8 DM positive events are mainly driven by the linear terms in the upper troposphere, while, in the lower troposphere, 1/8 DM positive events are indirectly driven by the nonlinear eddy forcing. Therefore, unlike the 1/1 DM, the 1/8 DM is a linear and nonlinear mixed-driven mode. Still, the persistence of a 1/8 DM should largely depend on the persistence of the nonlinear terms because the persistence of the nonlinear eddy forcing is still the key factor that determines the persistence of a 1/8 DM in the lower troposphere.
Compared to 1/1 DM positive events, the persistence of the nonlinear eddy forcing in 1/8 DM positive events is apparently shorter. Therefore, the persistence of a 1/8 DM is naturally shorter than that of a 1/1 DM. Now, we need to understand why the persistence of the nonlinear eddy forcing is shorter in a 1/8 DM. Figure 10 shows the composite anomalous 300-hPa storm tracks (V variance), 300-hPa divergence, 850-hPa divergence, and 500-hPa vertical velocity (omega) zonal mean results for 1/1 DM positive events and sectoral mean results for 1/8 DM positive events from lag –10 to 10 days. Both 1/1 and 1/8 DM positive events are associated with a northward displacement of storm tracks. Still, the persistence of the northward displacement of storm tracks is better (worse) for 1/1 (1/8) DM positive events, which naturally produce a more (less) persistent anomalous nonlinear eddy forcing.
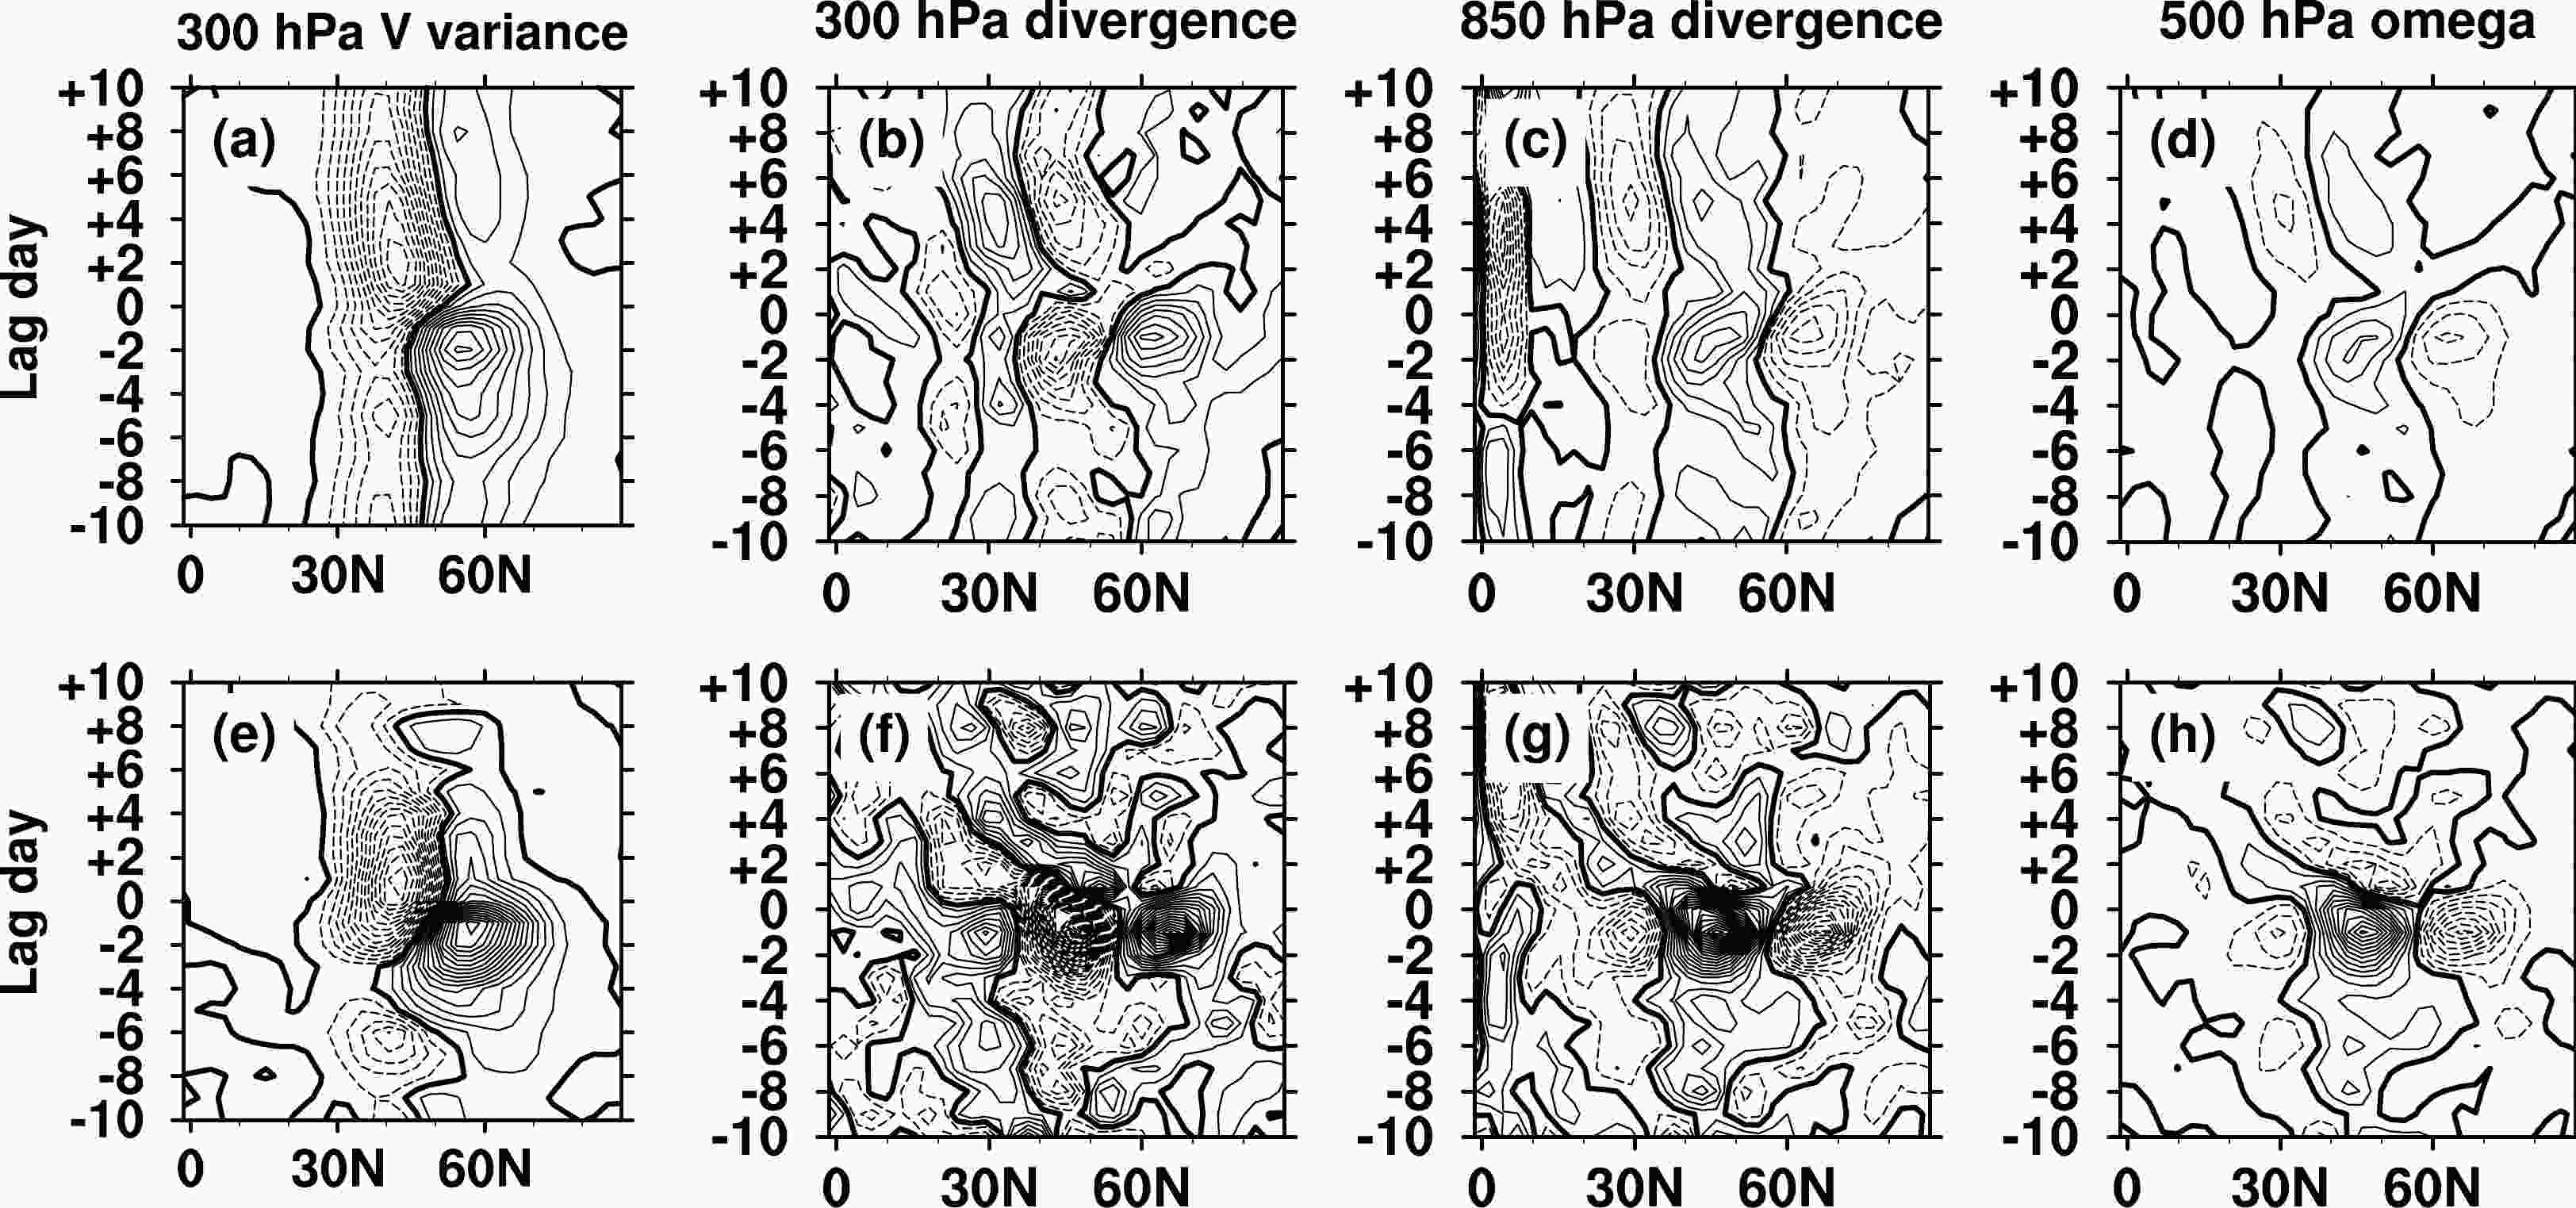
Figure 10. The temporal evolution of the composite anomalous 300-hPa storm tracks (V variance, contour interval is 5 m2 s–2), 300-hPa divergence (contour interval is 5 × 10⁻⁸ s–1), 850-hPa divergence (the contour interval is 5 × 10⁻⁸ s–1), and 500-hPa vertical velocity (omega, the contour interval is 3 × 10⁻³ Pa s–1) zonal mean results for 1/1 DM positive events (top row) and sectoral mean results for 1/8 DM positive events (bottom row) from lag –10 to 10 days.
A baroclinic positive eddy feedback mechanism proposed by some previous studies underscores that the adiabatic cooling or heating due to the anomalous vertical motion associated with the anomalous secondary circulation driven by the anomalous eddy forcing serves to enhance the baroclinicity, which acts to sustain the anomalous displacement of the storm tracks, and thus, maintain the anomalous eddy forcing aloft (Robinson, 2006; Barnes and Hartmann, 2010). In Fig. 10, we observe anomalous vertical downward motions at around 35°–55°N and anomalous vertical upward motions at around 55°–70°N at the most of lag days of 1/1 DM positive events (see Fig. 10d). Obviously, this kind of distribution of anomalous vertical motions will enhance the baroclinicity at around 55°N which favors the northward displacement of storm tracks shown in Fig. 10a. Such a distribution of anomalous vertical motions is closely related to the anomalous divergence or convergence in the upper and lower troposphere (see Figs. 10b, c). However, for 1/8 DM positive events, this kind of distribution of anomalous vertical motions only presents itself during negative lag days (see Fig. 10h). From lag 0 to 4 days, anomalous vertical downward motions in the vicinity of 35°–55°N abruptly change to anomalous vertical upward motions (see Fig. 10h), which reduce the baroclinicity at around 55°N, and thus oppose the surviving northward displacement of storm tracks as well as the anomalous nonlinear eddy forcing there. Therefore, the persistence of the nonlinear eddy forcing is shorter for a 1/8 DM.
For 1/8 DM positive events, the abrupt change of vertical motion after lag 0 day is closely related to the sudden emergence of anomalous divergence in the upper troposphere and convergence in the lower troposphere at around 35°– 55°N from lag 0 to 4 days (see Figs. 10f, g). The consequent sudden emergence of three-dimensional circulation anomalies cannot be initiated by the anomalous eddy forcing during those lag days, because HFEVF at those lag days still tends to generate negative vorticity tendency in the mid-latitudes at the upper troposphere (see Fig. 8i), which arouses anomalous convergence in the upper troposphere and divergence in the lower troposphere at those locations. We notice that the linear terms produce a positive vorticity tendency in the mid-latitudes right after lag 0 day (see Fig. 8k). To account for this positive vorticity tendency, there should be divergence in the upper troposphere and convergence in the lower troposphere in the mid-latitudes. Therefore, we argue that the sudden emergence of anomalous vertical upward motion near 35°–55°N from lag 0 to 4 days, as shown in Fig. 10h, is indirectly caused by the linear terms. Thus, it is the linear terms that reduce the persistence of the northward displacement of storm tracks and consequently the persistence of the anomalous nonlinear eddy forcing there.
Note that the broader the zonal scale of the atmospheric DM, the greater the zonal symmetry, the less influential the linear terms, and the longer the persistence of anomalous nonlinear eddy forcing. Therefore, the atmospheric DMs with a broader (narrower) zonal scale naturally possess a longer (shorter) persistence.
-
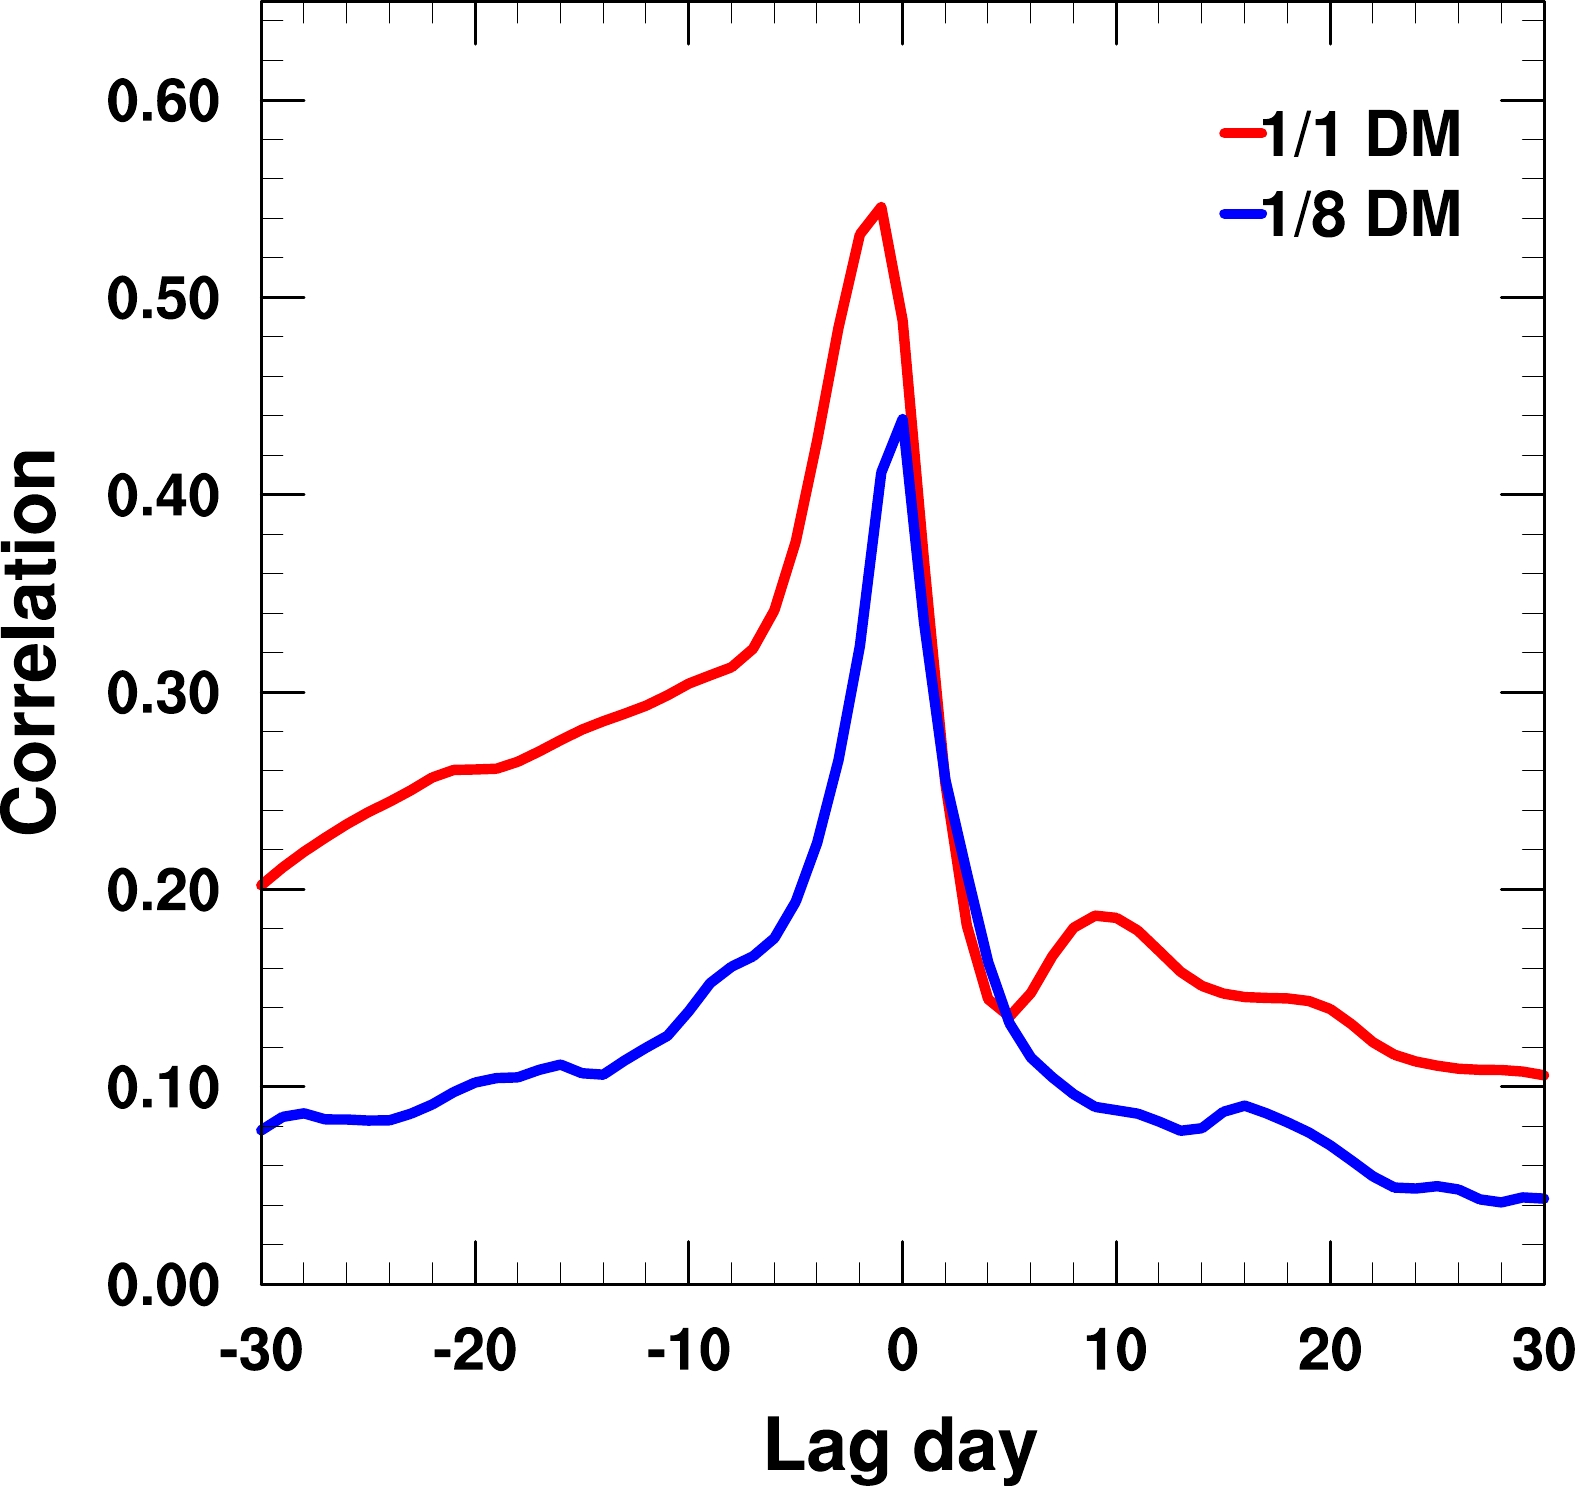
Many previous studies have underscored that positive eddy feedback is the key mechanism responsible for extending the atmospheric DM’s persistence (Lorenz and Hartmann, 2001, 2003; Barnes and Hartmann, 2010). Therefore, those zonally broader (narrower) atmospheric DMs should correspond to a stronger (weaker) eddy feedback strength. In this section, we briefly examine the eddy feedback intensities of a 1/1 DM and 1/8 DM. We calculate lead-lag cross-correlations between the daily DM index and daily projection index of HFEVF for a 1/1 DM and 1/8 DM, respectively. Here, the daily projection indices of HFEVF are acquired by projecting the daily results of the 300-hPa HFEVF onto the corresponding DM pattern. This analysis method is a classical method to evaluate the intensity of the eddy feedback and has already been adopted in much of the previous literature (e.g., Lorenz and Hartmann, 2001, 2003; Barnes and Hartmann, 2010). The cross-correlation curves for a 1/1 DM and 1/8 DM from lag –30 to 30 days are shown in Fig. 11 where negative (positive) lags imply that the projection index of HFEVF leads (lags) the daily DM index.
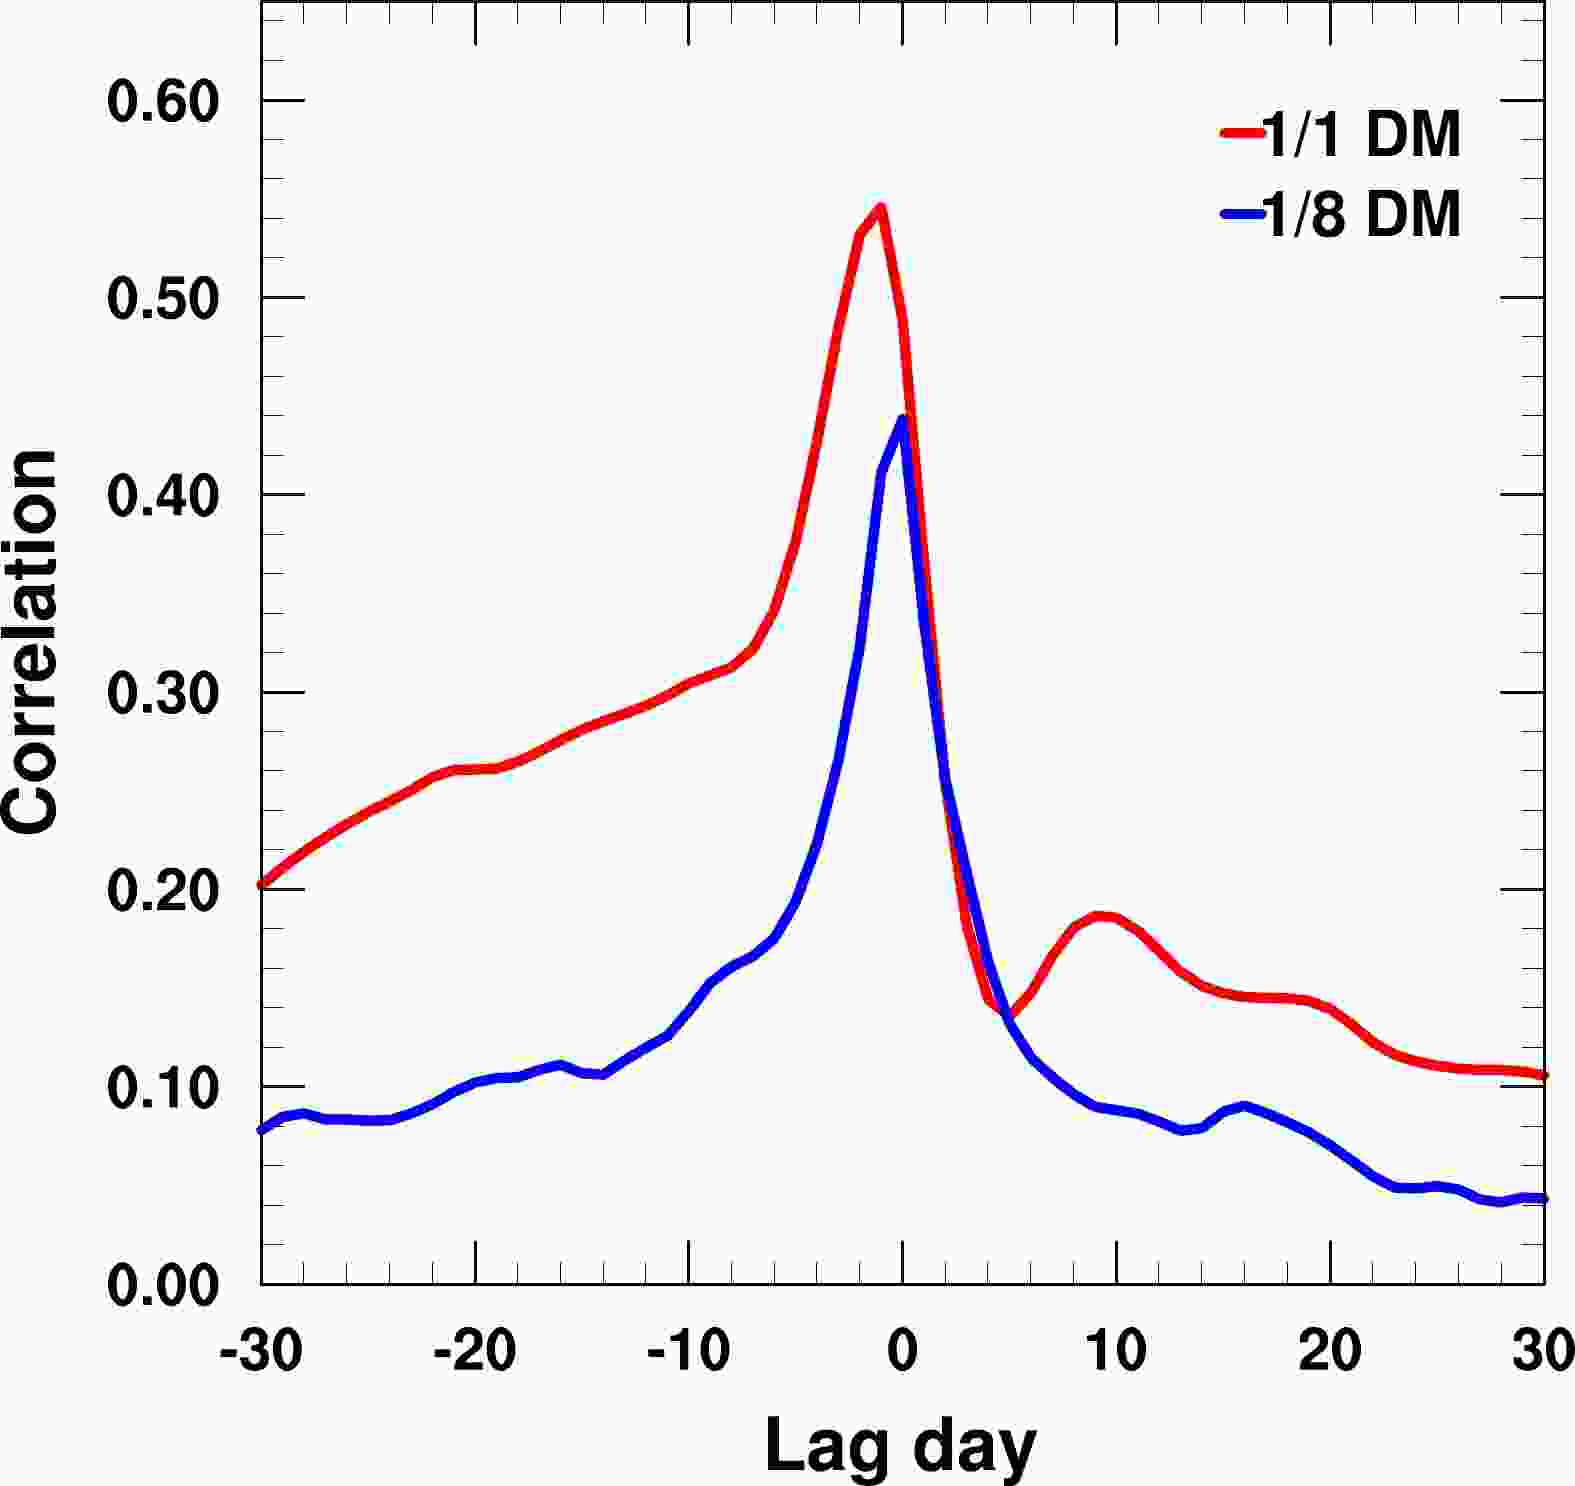
Figure 11. The lead-lag cross-correlations between the daily DM index and daily projection index of HFEVF for a 1/1 DM and 1/8 DM from lag –30 to 30 days.
The values of these two cross-correlation curves gently increase at the long negative lag days and then begin to shoot up at about lag –6 days, peaking at lag –1 and lag 0 day, respectively, and then decline rapidly at the subsequent short positive lag days. Still, the values of the cross-correlations curves remain positive at the long positive lag days. We also calculate autocorrelations of the projection index of HFEVF for a 1/1 DM and 1/8 DM from lag –30 to 30 days (not shown). The e-folding timescales of their autocorrelations are both less than three days indicating that HFEVF itself has no long-term memory. Thus, the positive cross-correlations at the long positive lag days should not be considered as “residual memory” or “a tail” of the high positive cross-correlations at the short positive lag days. Thus, they denote the positive eddy feedback effect. Generally speaking, the values of the cross-correlation curve of a 1/8 DM are smaller than the values of the cross-correlation curve of a 1/1 DM at the long positive lag days. Aside from that, the cross-correlation curve of a 1/1 DM shows a clear rebound from a lag 3 to lag 9 days. However, the cross-correlation curve of 1/8 DM gradually decreases without any notable rebound during those lag days. These differences clearly indicate that the positive eddy feedback effect is weak or even absent in the 1/8 DM situation.
Although the leading phase difference is very small (only one day), the largest positive cross-correlation at lag –1 day indicates that the variations of a 1/1 DM are closely related to the preceding transient eddies suggesting HFEVF is a leading driving factor for the formation of a 1/1 DM, while the peak day of the 1/8 DM cross-correlation curve is lag 0 day instead of lag –1 day. This difference seems insignificant but indicates that the variations of a 1/8 DM and HFEVF are synchronous. For a 1/8 DM, HFEVF acts more like a concomitant phenomenon rather than a leading driving factor. This result is consistent with the vorticity budget results shown in Fig. 8 in that the pattern and temporal evolution of the 300-hPa tendency term of the 1/8 DM positive events are primarily determined by the linear terms.
-
Motivated by Song (2019), who found the persistence of the daily NAM index to be longer than that of the daily NAO index, this study investigates the relationship between the persistence and the zonal scale of atmospheric DMs. By utilizing the daily data of ERA5 of 39 boreal winters (DJF) and 20,000-days output of the GFDL dynamical core model with a zonally uniform background flow, the persistence of the observed NAM, NAO, NPO, and four atmospheric DMs associated with different zonal scales in the model (1/1 DM, 1/2 DM, 1/4 DM, and 1/8 DM) is examined. The e-folding timescale of the autocorrelations of the daily NAM, NAO, and NPO indexes are around 11, 8, and 6 days, respectively. The e-folding timescales of the autocorrelations of the daily 1/1 DM index, 1/2 DM index, 1/4 DM index, and 1/8 DM index are around 22, 14, 7, and 4 days, respectively. These results confirm a relationship between the persistence and the zonal scale of the atmospheric DMs in that the atmospheric DMs with a broader (narrower) zonal scale dipolar structure possess a longer (shorter) persistence.
To comprehend what causes the atmospheric DMs that have a broader (narrower) zonal scale dipolar structure to possess a longer (shorter) persistence, a detailed vorticity budget analysis based on the vorticity equation for 1/1 DM and 1/8 DM positive events from the upper to lower troposphere is conducted. The results indicate that a 1/1 DM, from the upper troposphere to the lower troposphere, is entirely a nonlinear eddy-driven mode. However, a 1/8 DM is a linear and nonlinear mixed-driven mode because 1/8 DM positive events are mainly driven by the linear terms in the upper troposphere, while, in the lower troposphere, 1/8 DM positive events are indirectly driven by the nonlinear eddy forcing. The persistence of both 1/1 DM and 1/8 DM largely relies on the persistence of the nonlinear eddy forcing. Compared to 1/1 DM positive events, the persistence of the nonlinear eddy forcing in 1/8 DM positive events is shorter. Therefore, the persistence of a 1/8 DM is shorter than that of a 1/1 DM.
Further analysis shows that anomalous vertical downward motions near 35°–55°N and anomalous vertical upward motions near 55°–70°N are present the most of time of 1/1 DM positive events, which can sustain the anomalous nonlinear eddy forcing by enhancing baroclinicity at around 55°N. However, for 1/8 DM positive events, from lag 0 to 4 days, the anomalous vertical downward motions at around 35°–55°N abruptly change to anomalous vertical upward motions which tends to reduce the baroclinicity at around 55°N and dissipate the anomalous nonlinear eddy forcing. Therefore, the persistence of the nonlinear eddy forcing is shorter in a 1/8 DM. For 1/8 DM positive events, the sudden appearance of vertical upward motions near 35°–55°N is closely related to the sudden emergence of anomalous divergence in the upper troposphere and anomalous convergence in the lower troposphere at that location from lag 0 to 4 days. This three-dimensional anomalous divergence field serves to balance the positive vorticity tendency produced by the linear terms in the mid-latitudes right after lag 0 day. Therefore, the sudden emergence of anomalous vertical upward motion at around 35°–55°N from lag 0 to 4 days is indirectly caused by the linear terms. Thus, the linear terms indirectly reduce the persistence of the anomalous nonlinear eddy forcing in 1/8 DM positive events. Obviously, the effects of the linear terms are less (more) pronounced when the atmospheric DMs have a broader (narrower) zonal scale which corresponds to better (worse) zonal symmetry. Therefore, the atmospheric DMs with a broader (narrower) zonal scale possess a longer (shorter) persistence.
The eddy feedback intensities of a 1/1 DM and 1/8 DM are also briefly examined by calculating the lead-lag cross-correlations between the daily DM index and daily projection index of HFEVF. The cross-correlation curve for a 1/1 DM has a clear rebound from lag 3 to 9 days. While the cross-correlation curve of 1/8 DM declines gradually without any notable rebound at those lag days. The values of the cross-correlation curve of a 1/8 DM are also smaller than those of a 1/1 DM at long positive lag days. These results suggest that the positive eddy feedback effect is weak or even absent in a 1/8 DM situation. The peak day of cross-correlation for a 1/1 DM and 1/8 DM is lag –1 and lag 0 day, respectively. These results indicate that HFEVF acts more like a concomitant phenomenon rather than a leading driving factor for a 1/8 DM. Thus, the hemispheric-scale DM and the regional or sectoral DMs are different not only in their persistence but also in their dynamics. Therefore, the NAM and NAO may not be considered as “one phenomenon two paradigms” or “redundant to each other”.
Acknowledgements. The author would like to thank two anonymous reviewers for their helpful comments and suggestions. This work was supported by the National Key Research and Development Program of China (mechanism for disaster-causing Northeast cold vortex and key technologies for its forecast, Grant No. 2023YFC3007700).
APPENDIX
Figures A1 and A2 (A3 and A4) show the 300- and 850-hPa zonal mean results of the composite tendency term, term1, term2 …, term6, TEVF, HFEVF, LFEVF, the sum of terms 1–5
$\left(\displaystyle\sum\nolimits_{i = 1}^5 {{\text{term}}(i} )\right)$ , and the sum of term6 and TEVF ($ {\text{term}}6 + {\text{TEVF}} $ ) for the 1/2 DM (1/4 DM) positive events from –10 to 10 days. It is clear that the results for 1/2 DM and 1/4 DM fall between the results for a 1/1 DM and 1/8 DM. In the upper troposphere, as the longitudinal range of the EOF domain decreases, the importance of the linear terms (especially terms 1 and 4) in the formation of the tendency term gradually increases. The domination of term6 in the vorticity budget of the lower troposphere is similar to what is shown by the results for a 1/1 DM and 1/8 DM.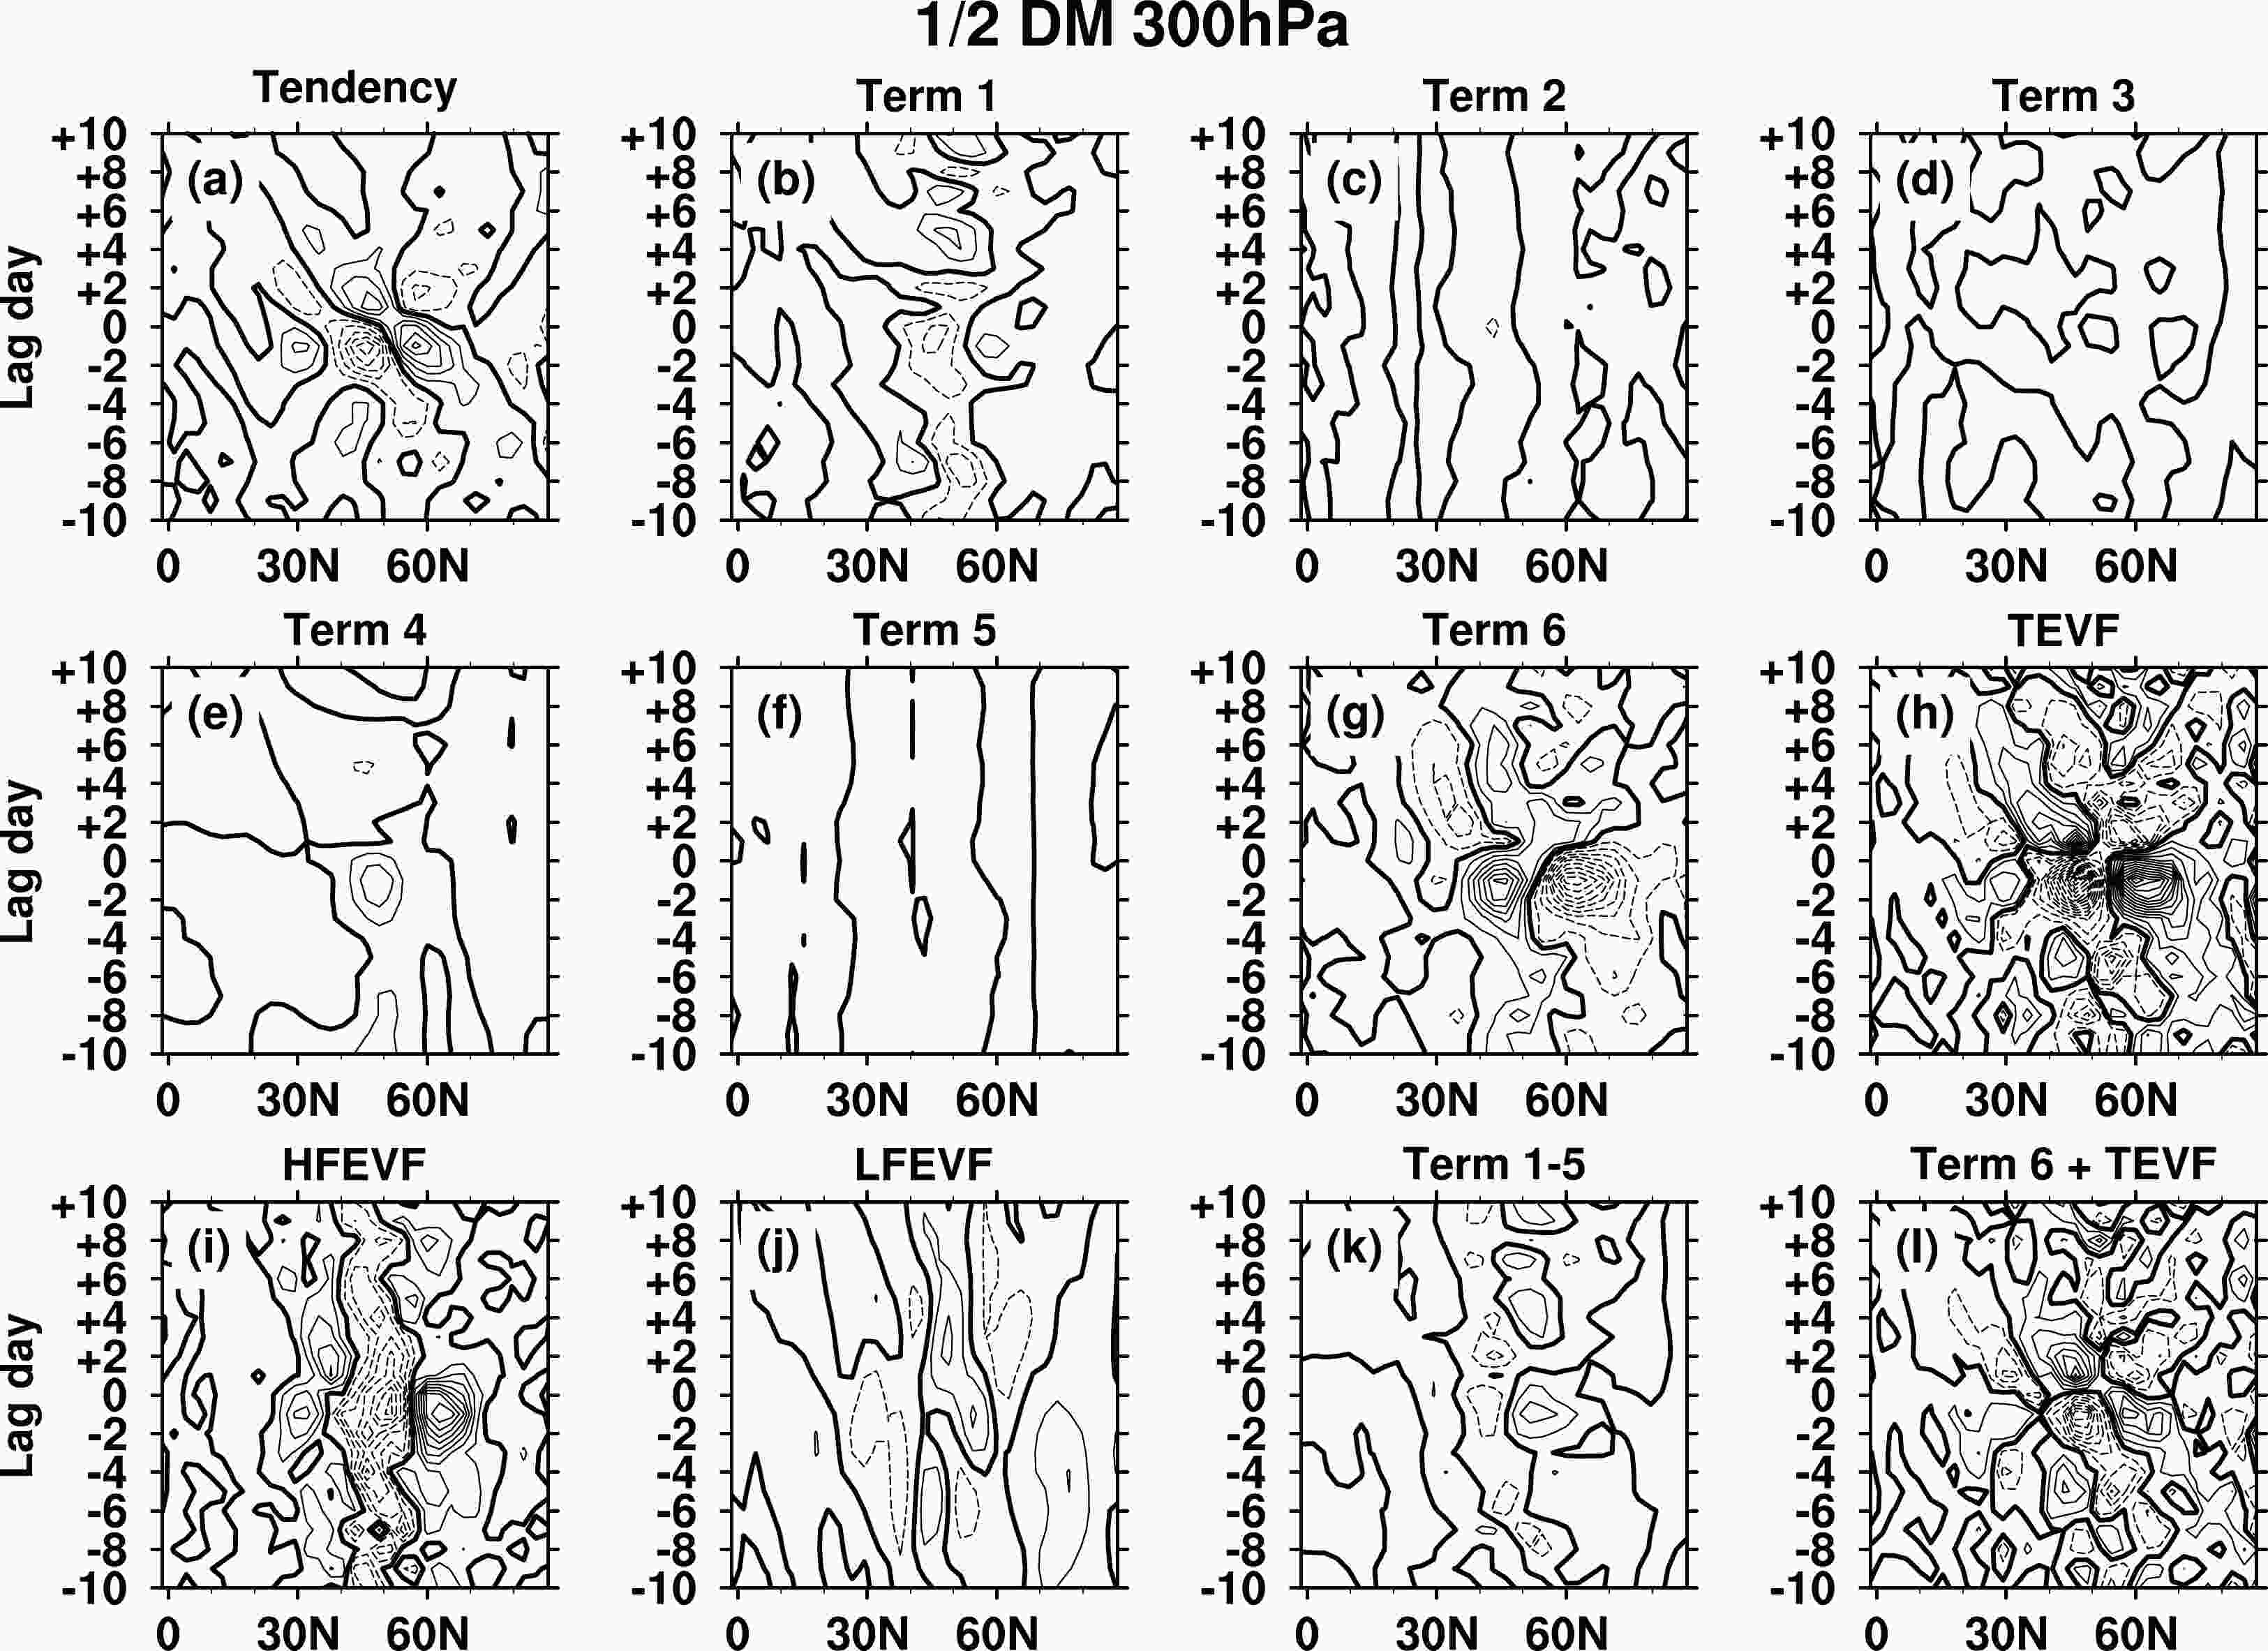
Figure A1. The temporal evolution of zonal mean results of the composite tendency term, term1, term2 …term6, TEVF, HFEVF, LFEVF, the sum of terms 1–5 and the sum of term6 and TEVF (term6 + TEVF) for the 1/2 DM positive events from –10 to 10 days at 300 hPa. Solid (dashed) contours represent positive (negative) values; zero contours are bolded. The contour interval is 8 × 10–12 s–2.
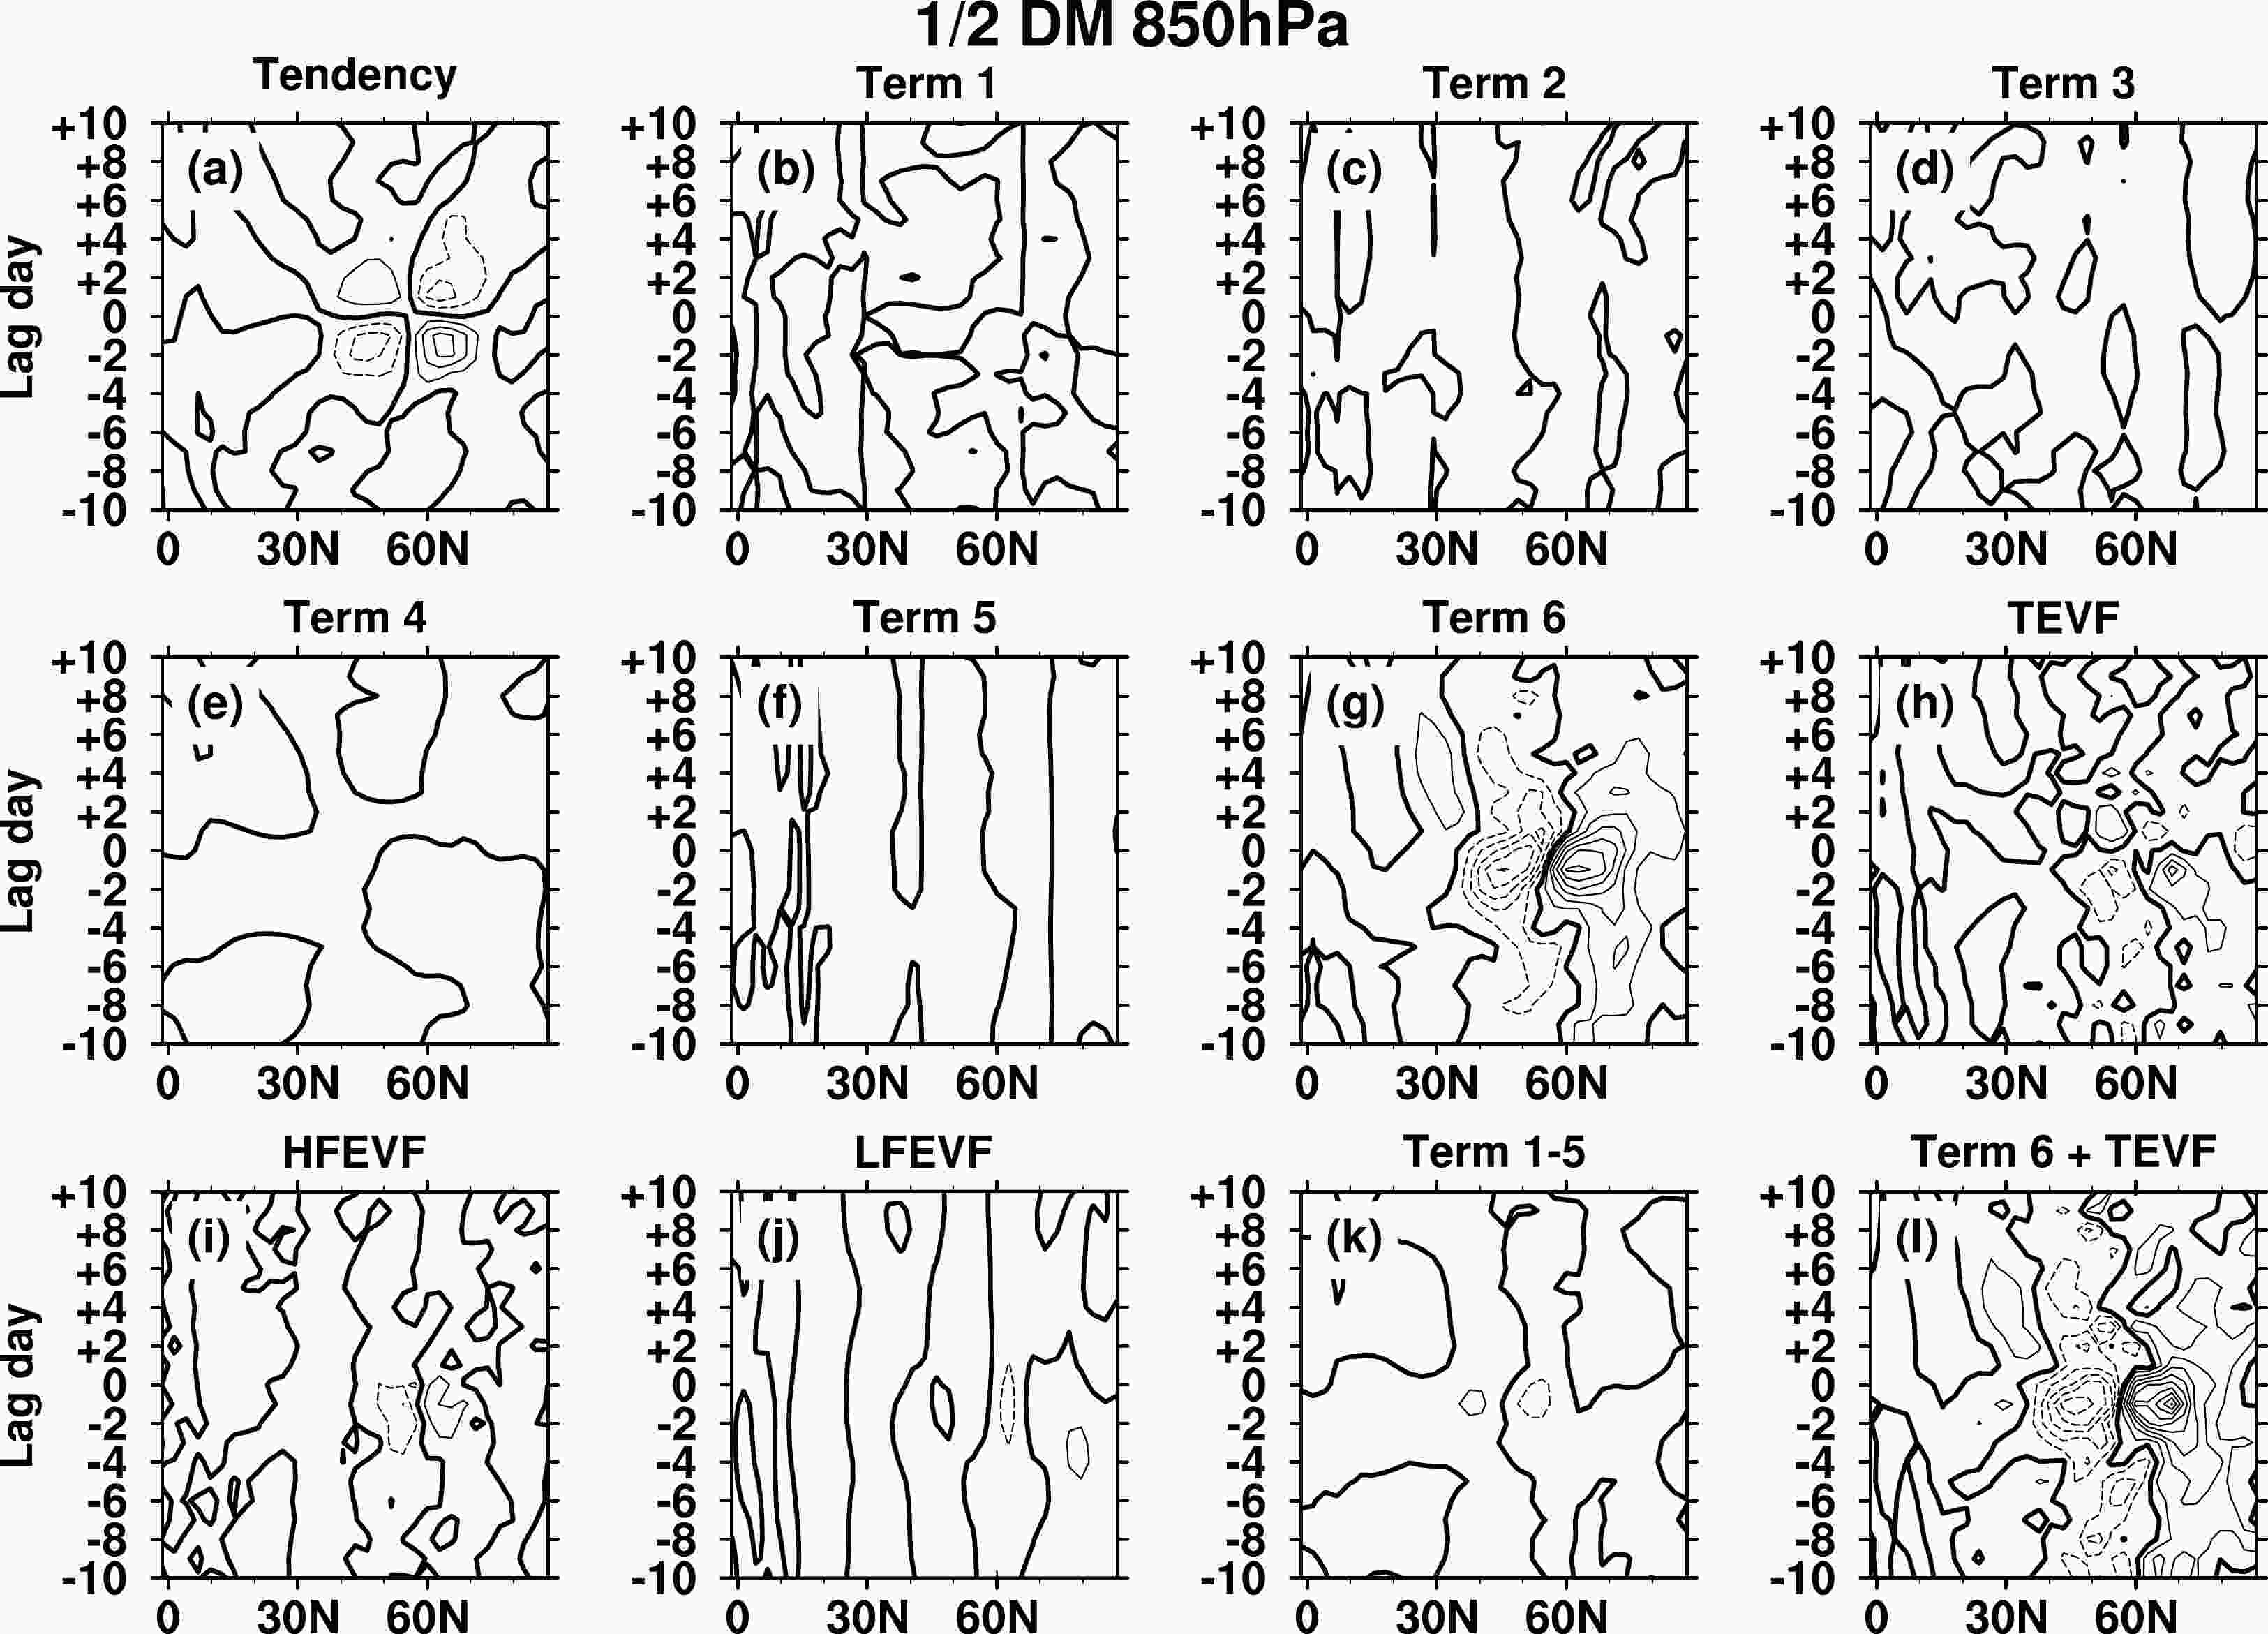
Figure A2. Same as in Fig. A1, but for the results at 850 hPa.

Figure A3. The temporal evolution of zonal mean results of the composite tendency term, term1, term2 …term6, TEVF, HFEVF, LFEVF, the sum of terms 1–5, and the sum of term6 and TEVF (term6 + TEVF) for the 1/4 DM positive events from –10 to 10 days at 300 hPa. Solid (dashed) contours represent positive (negative) values; zero contours are bolded. The contour interval is 8 × 10–12 s–2.
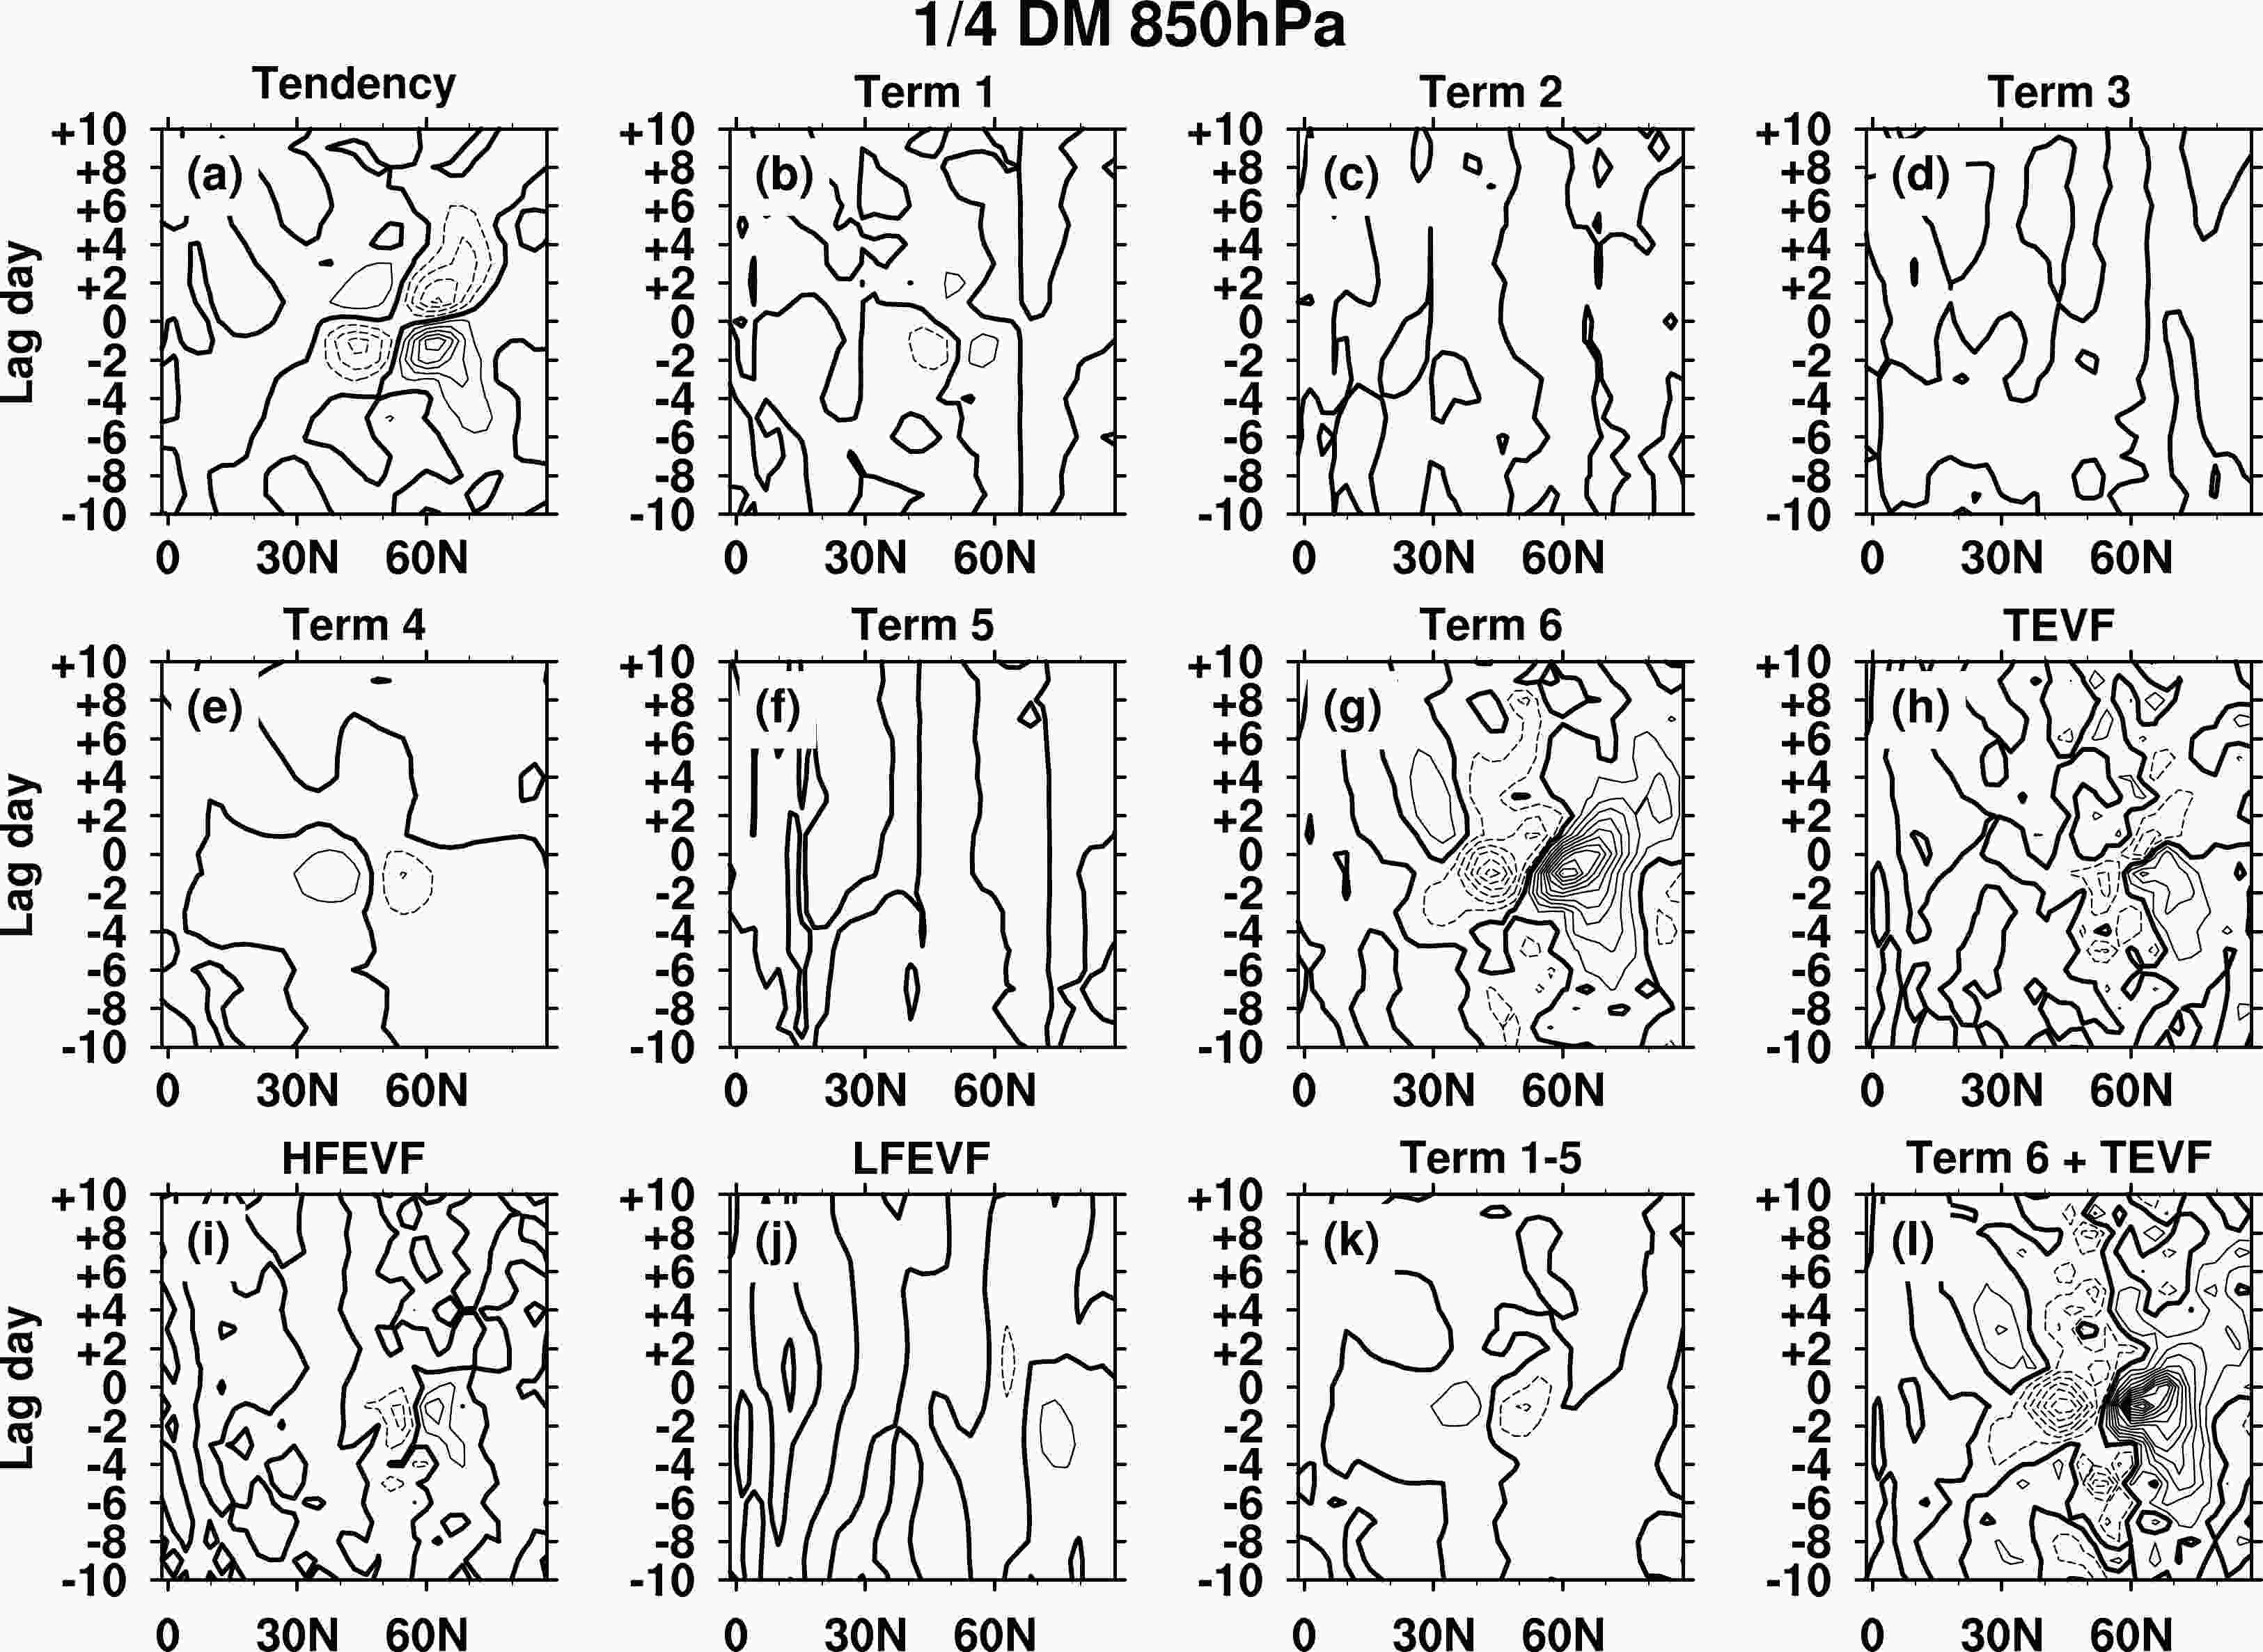
Figure A4. Same as in Fig. A3, but for the results at 850 hPa.
The Persistence and Zonal Scale of Atmospheric Dipolar Modes
- Manuscript received: 2023-02-07
- Manuscript revised: 2023-05-20
- Manuscript accepted: 2023-06-12
Abstract: This study investigates the relationship between the persistence and the zonal scale of atmospheric dipolar modes (DMs). Results from the daily data of ERA5 and the long-term output of an idealized atmospheric model show that the atmospheric DMs with a broader (narrower) zonal scale dipolar structure possess a longer (shorter) persistence. A detailed vorticity budget analysis indicates that the persistence of a hemispheric-scale DM (1/1 DM) and a regional or sectoral DM (1/8 DM) in the model both largely rely on the persistence of the nonlinear eddy forcing. Linear terms can indirectly reduce the persistence of the anomalous nonlinear eddy forcing in a 1/8 DM by modifying the baroclinicity via the arousal of anomalous vertical motions. Therefore, the atmospheric DMs with a broader (narrower) zonal scale possess a longer (shorter) persistence because the effects of the linear terms are less (more) pronounced when the atmospheric DMs have better (worse) zonal symmetry. Further analyses show that the positive eddy feedback effect is weak or even absent in a 1/8 DM and the high-frequency eddy forcing acts more like a concomitant phenomenon rather than a leading driving factor for a 1/8 DM. Thus, the hemispheric-scale DM and the regional or sectoral DMs are different, not only in their persistence but also in their dynamics.
-
Keywords:
- NAM,
- NAO,
- eddy feedback,
- persistence,
- linear term
摘要: 本研究探讨了大气偶极模的持续性和其纬向尺度之间的联系。ERA5的逐日再分析资料和一个理想化的大气模式的长期输出的结果表明,具有较宽(较窄)纬向尺度的偶极模拥有较长(较短)的持续性。详细的涡度收支诊断分析表明,模式中半球尺度的偶极模(1/1 DM)和区域尺度的偶极模(1/8 DM)的持续性在很大程度上均依赖于非线性涡旋强迫的持续性。线性项可以通过引起异常的垂直运动改变斜压性从而间接减少1/8 DM中异常非线性涡旋强迫的持续性。当大气偶极模具有较好的(较差)的纬向对称性时,线性项的影响较不(较为)显著。因此,具有较宽(较窄)纬向尺度的偶极模拥有较长(较短)的持续性。进一步的分析表明,涡旋正反馈效应在1/8 DM中较弱甚至不存在,高频涡旋强迫更像是1/8 DM的伴随现象而不是它的前驱因子。因此,半球尺度和区域尺度的偶极模不仅在持续性上有区别,在动力学上也存在差异。


 AAS Website
 AAS WeChat