


 DownLoad:


-
Torrential rainfall events can have severe, adverse socioeconomic consequences. Government decision-making relies on accurate forecasting of such events, which in turn depends to a large extent on the predictions of numerical models. The improvement of numerical prediction requires better understanding of the physical processes responsible for the formation and development of extreme rainfall events. Mei-yu torrential rainfall often occurs along the basin of the Yangtze and Huaihe rivers in eastern China in the early summer season. During the mei-yu season, a southwesterly low-level jet, upper-level trough, subtropical high, and the quasi-stationary mei-yu front are the main weather systems for the production of heavy rainfall (e.g., Tao and Ding, 1981; Ding, 1992). Previous studies have revealed that the heavy rainfall during this period is generated by continuous lifting of moist monsoonal air along the mei-yu front (Ding and Chan, 2005). Meanwhile, many previous studies also suggest that extreme rainfall events result from mesoscale convective systems (MCSs), especially from slow-moving or quasi-stationary MCSs (e.g., Maddox et al., 1979; Bluestein and Jain, 1985; Doswell III et al., 1996; Moore et al., 2003). The mei-yu rainfall has an obvious quasi-stationary feature, so many mei-yu rainfall events have large rainfall accumulation. Some studies have shown that linear MCSs are more likely to produce extreme rainfall than nonlinear MCSs (e.g., Houze et al., 1990; Parker and Johnson, 2000; Schumacher and Johnson, 2005; Ducrocq et al., 2008). Schumacher and Johnson (2005) described two patterns of linear MCSs: “training line-adjoining stratiform” and “back building/quasi-stationary”. The back-building process is a pattern when new cells form repeatedly on the upstream side of the old ones and produce stratiform rain downstream. Besides, Schumacher and Johnson (2005) also suggested that the back-building process is less predictable for the initiation and maintenance of this process because of the nonlinear convective-scale processes involved.
For repeated formation of new cells upstream, a continuous triggering mechanism and continuous supply of instability and moisture are required. Merritt and Fritsch (1984) studied the motion of hundreds of MCSs, and found some cases moved upstream. The upstream development of MCSs was not explained at that time. Bluestein and Jain (1985) first identified the periodic appearance of new cells upstream that moved into the pre-existing convective line as a back-building process. There are many factors for triggering and maintaining back-building MCSs, including orographic lift (e.g., Barthlott and Davolio, 2016), outflow boundaries (e.g., Doswell III et al., 1996; Corfidi, 2003; Wang et al., 2014), and frontal-zone forcing (e.g., Houston and Wilhelmson, 2007, 2012). Among them, one of the most common mechanisms to generate back-building MCSs is the forcing by the outflow boundary (or gust front of the convective cold pool) produced by older cells. Corfidi (2003) revealed that the cold pool plays an important role in MCS propagation. Schumacher and Johnson (2005) noted that some back-building MCSs are formed and maintained by their own storm-generated outflow boundaries/cold pools. A convective cold pool can lift the low-level air parcel at its leading edge (e.g., Wilson et al., 1998; Ducrocq et al., 2008) or change the low-level circulation locally and enhance convergence areas so as to initiate new cells (Houze, 1993; Dahl and Xue, 2016; Duffourg et al., 2018). Sometimes, these outflow boundaries will combine with other factors (e.g., the cold front, terrain) to produce back-building MCSs. Moore et al. (2012) documented a back-building MCS generated by the interaction of the cold front and convectively generated outflow boundaries. Xu et al. (2012) found that a back-building MCS was caused by a cold pool that was trapped by high terrain over Taiwan. The collision of air masses can also produce back-building MCSs (e.g., Houston and Wilhelmson, 2012; Dahl and Xue, 2016).
Some studies have shown that the cold pool lifting mechanism will be impacted by the characteristics of the upstream flow and the environment so as to influence the location and intensity of the convective systems (e.g., Sun, 2005; Bresson et al., 2012; Davolio et al., 2016; Li et al., 2021). Duffourg et al. (2018) showed that the environmental moisture structure can influence the development and maintenance of the back-building MCSs. Studies have also found back-building processes associated with the mei-yu front in the China region (e.g., Luo et al., 2014; Wang et al., 2014, 2016, 2021). The quasi-stationary mei-yu front is favorable for the occurrence of heavy rainfall. When it is accompanied by quasi-stationary or slow-moving back-building MCSs, it is easy to produce extreme rainfall. However, few studies have examined the back-building processes that occur during the mei-yu season that are caused by the interaction of an existing low-level mesoscale convergence line and the convective cold pool. This is true with the extreme rainfall event studied here.
Specifically, the objective of this study is to investigate the back-building processes in an extreme rainfall event (Fig. 1) that occurred over the capital city, Hangzhou, of Zhejiang Province, China. The maximum 4-h accumulative rainfall was over 150 mm. The accumulative rainfall amount during the back-building process, which lasted about 2 h, was over 140 mm. According to the climatological study of Zheng et al. (2016), the standard thresholds are divided into three grades according the 70th and 90th percentiles for each of the accumulation periods: Grade I, Grade II and Grade III extreme rainfall. For 3-h extreme rainfall, the thresholds are 125 mm and 155 mm, respectively. Thus, 3-h rainfall between 125 and 155 mm is defined as Grade II extreme rainfall in China, so this case belongs to that category. The event caused massive floods in the northern region of Hangzhou, resulting in significant economic losses including extensive damage to property. Zhai et al. (2015) conducted an observational study of this rainfall event, and found that a surface mesoscale convergence line and a meso-γ-scale vortex formed before the occurrence of the rainfall event. Their observational study suggested the importance of the vortex in the production of the torrential rainfall. However, the special propagation and organization of the MCS were not studied. The extreme rainfall was mainly caused by the back-building processes, and the propagation direction of the MCS was opposite to the common spread direction of the cold pool. To examine more closely the physical processes responsible for the extreme rainfall in this case, in particular the back-building processes in the MCS and their role in producing extreme rainfall, the high-resolution Weather Research and Forecasting (WRF) model is used to simulate and analyze this event.
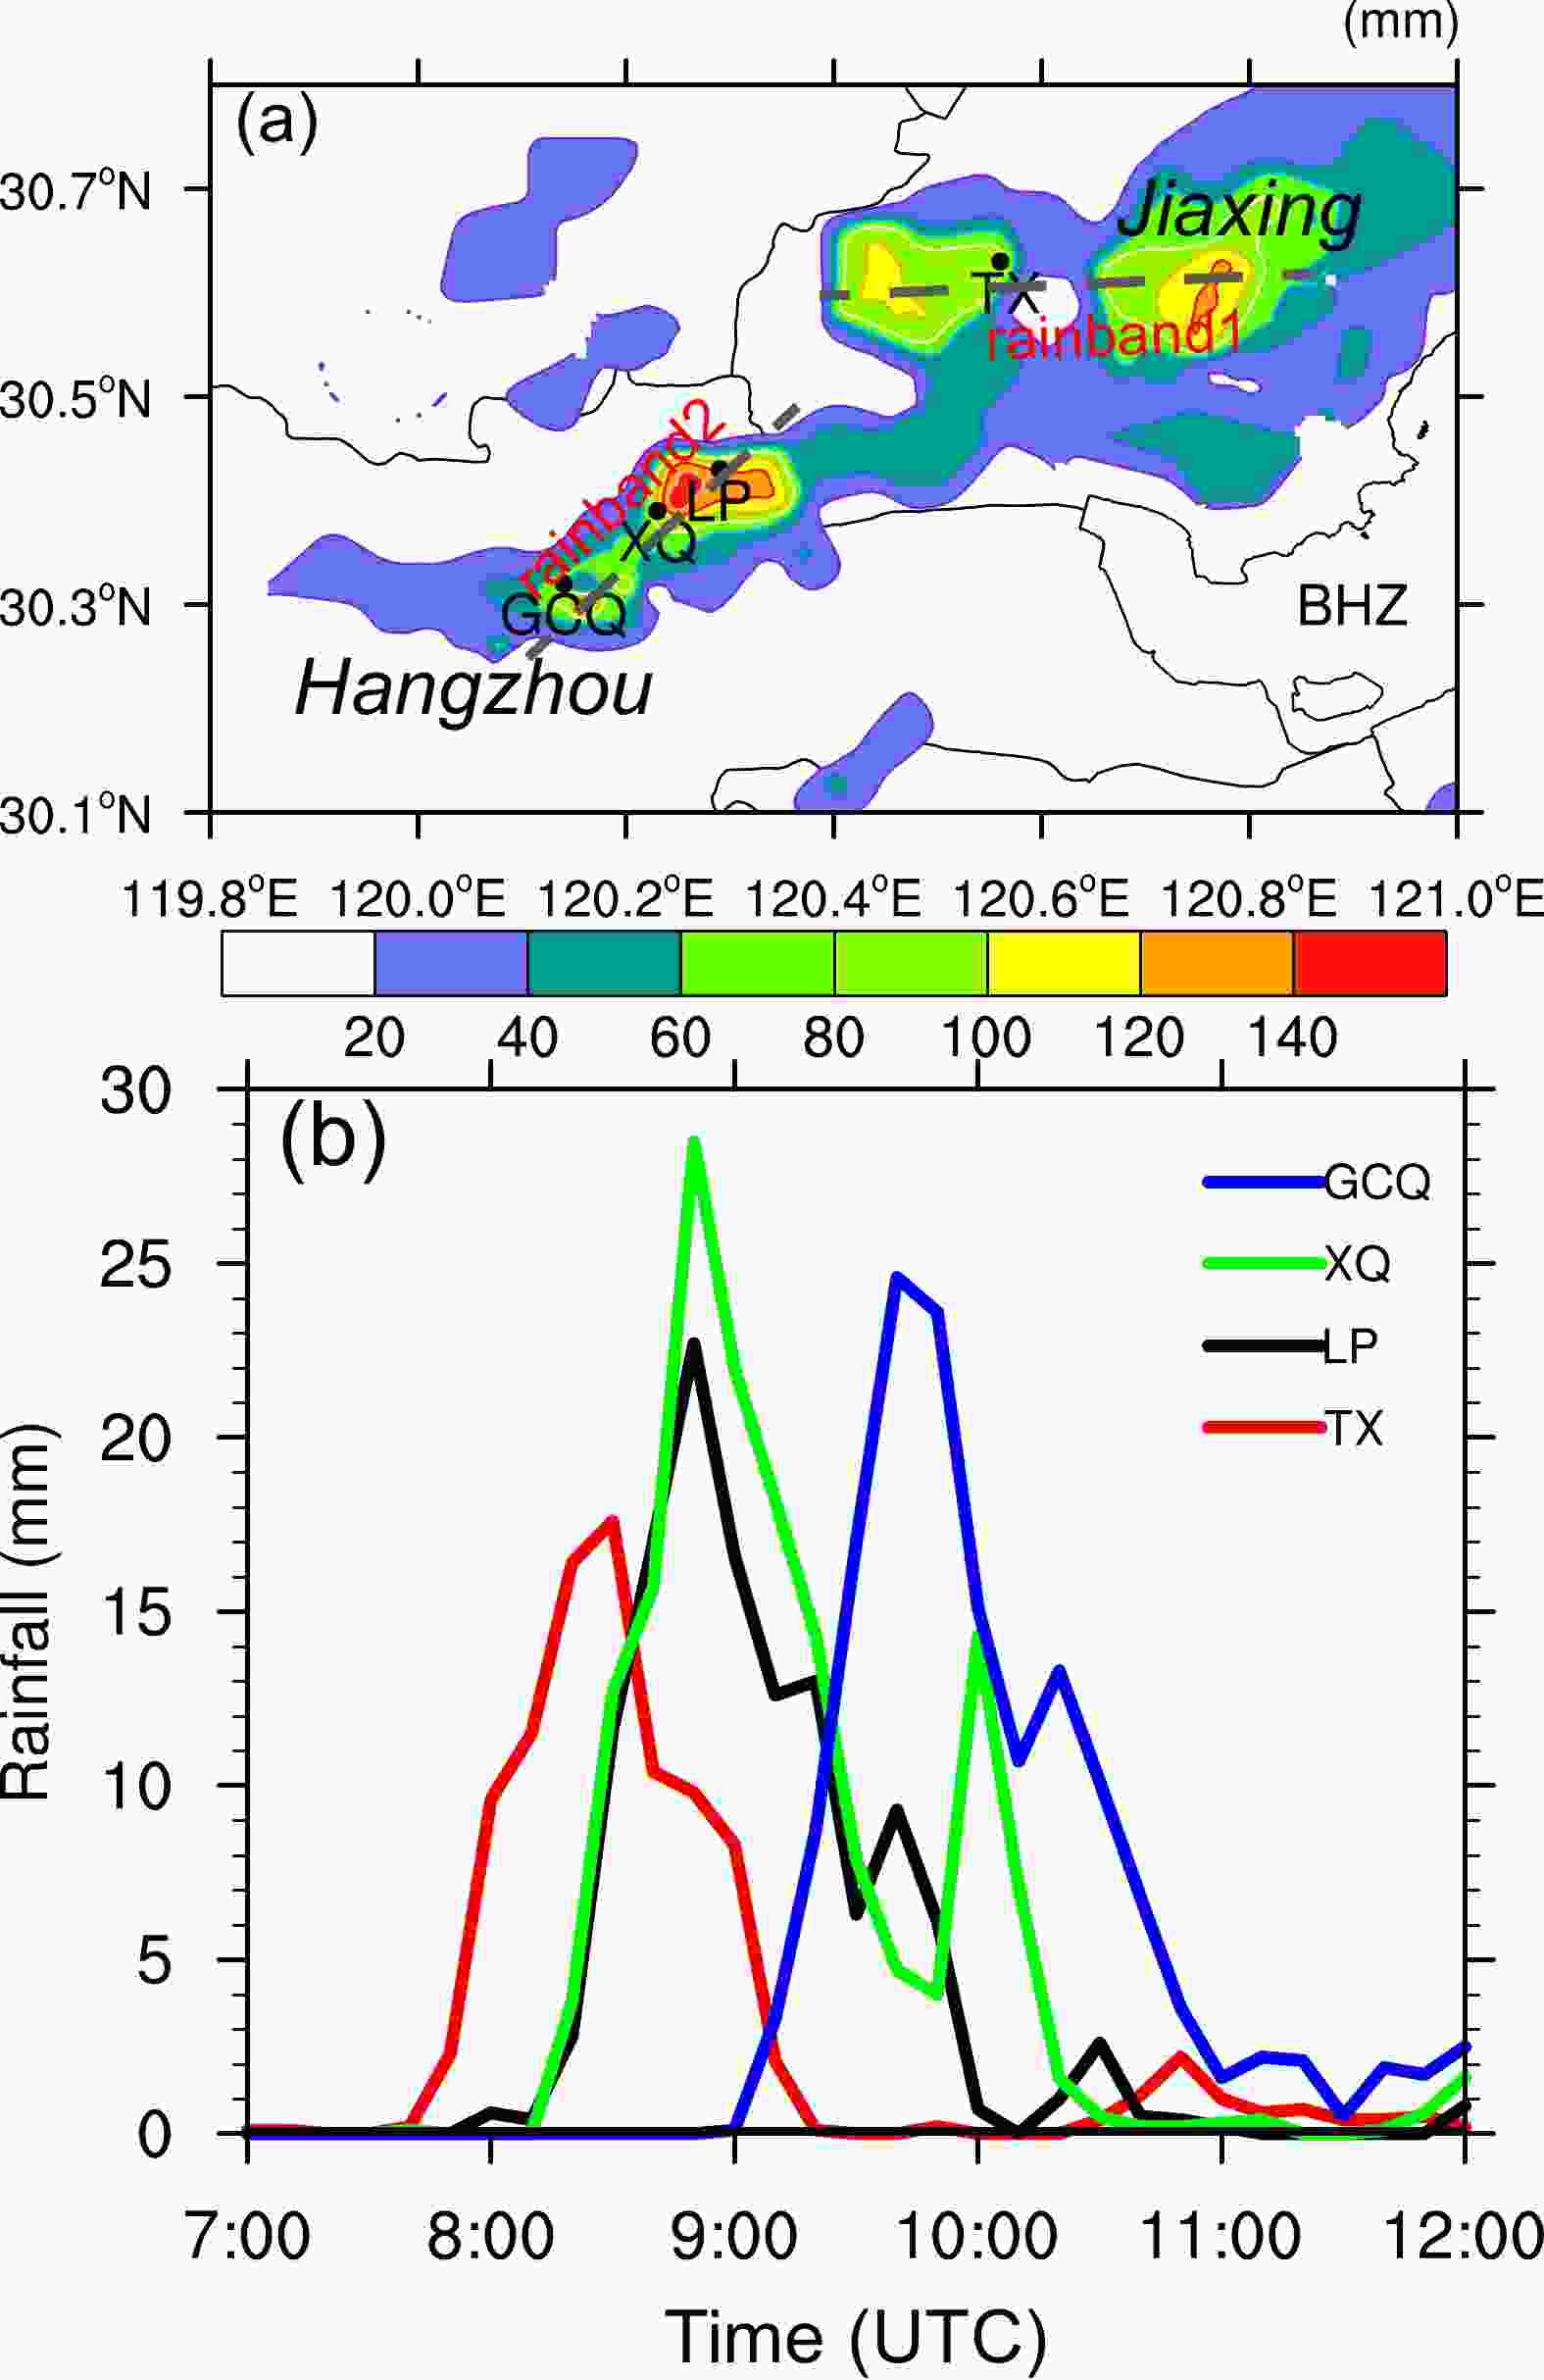
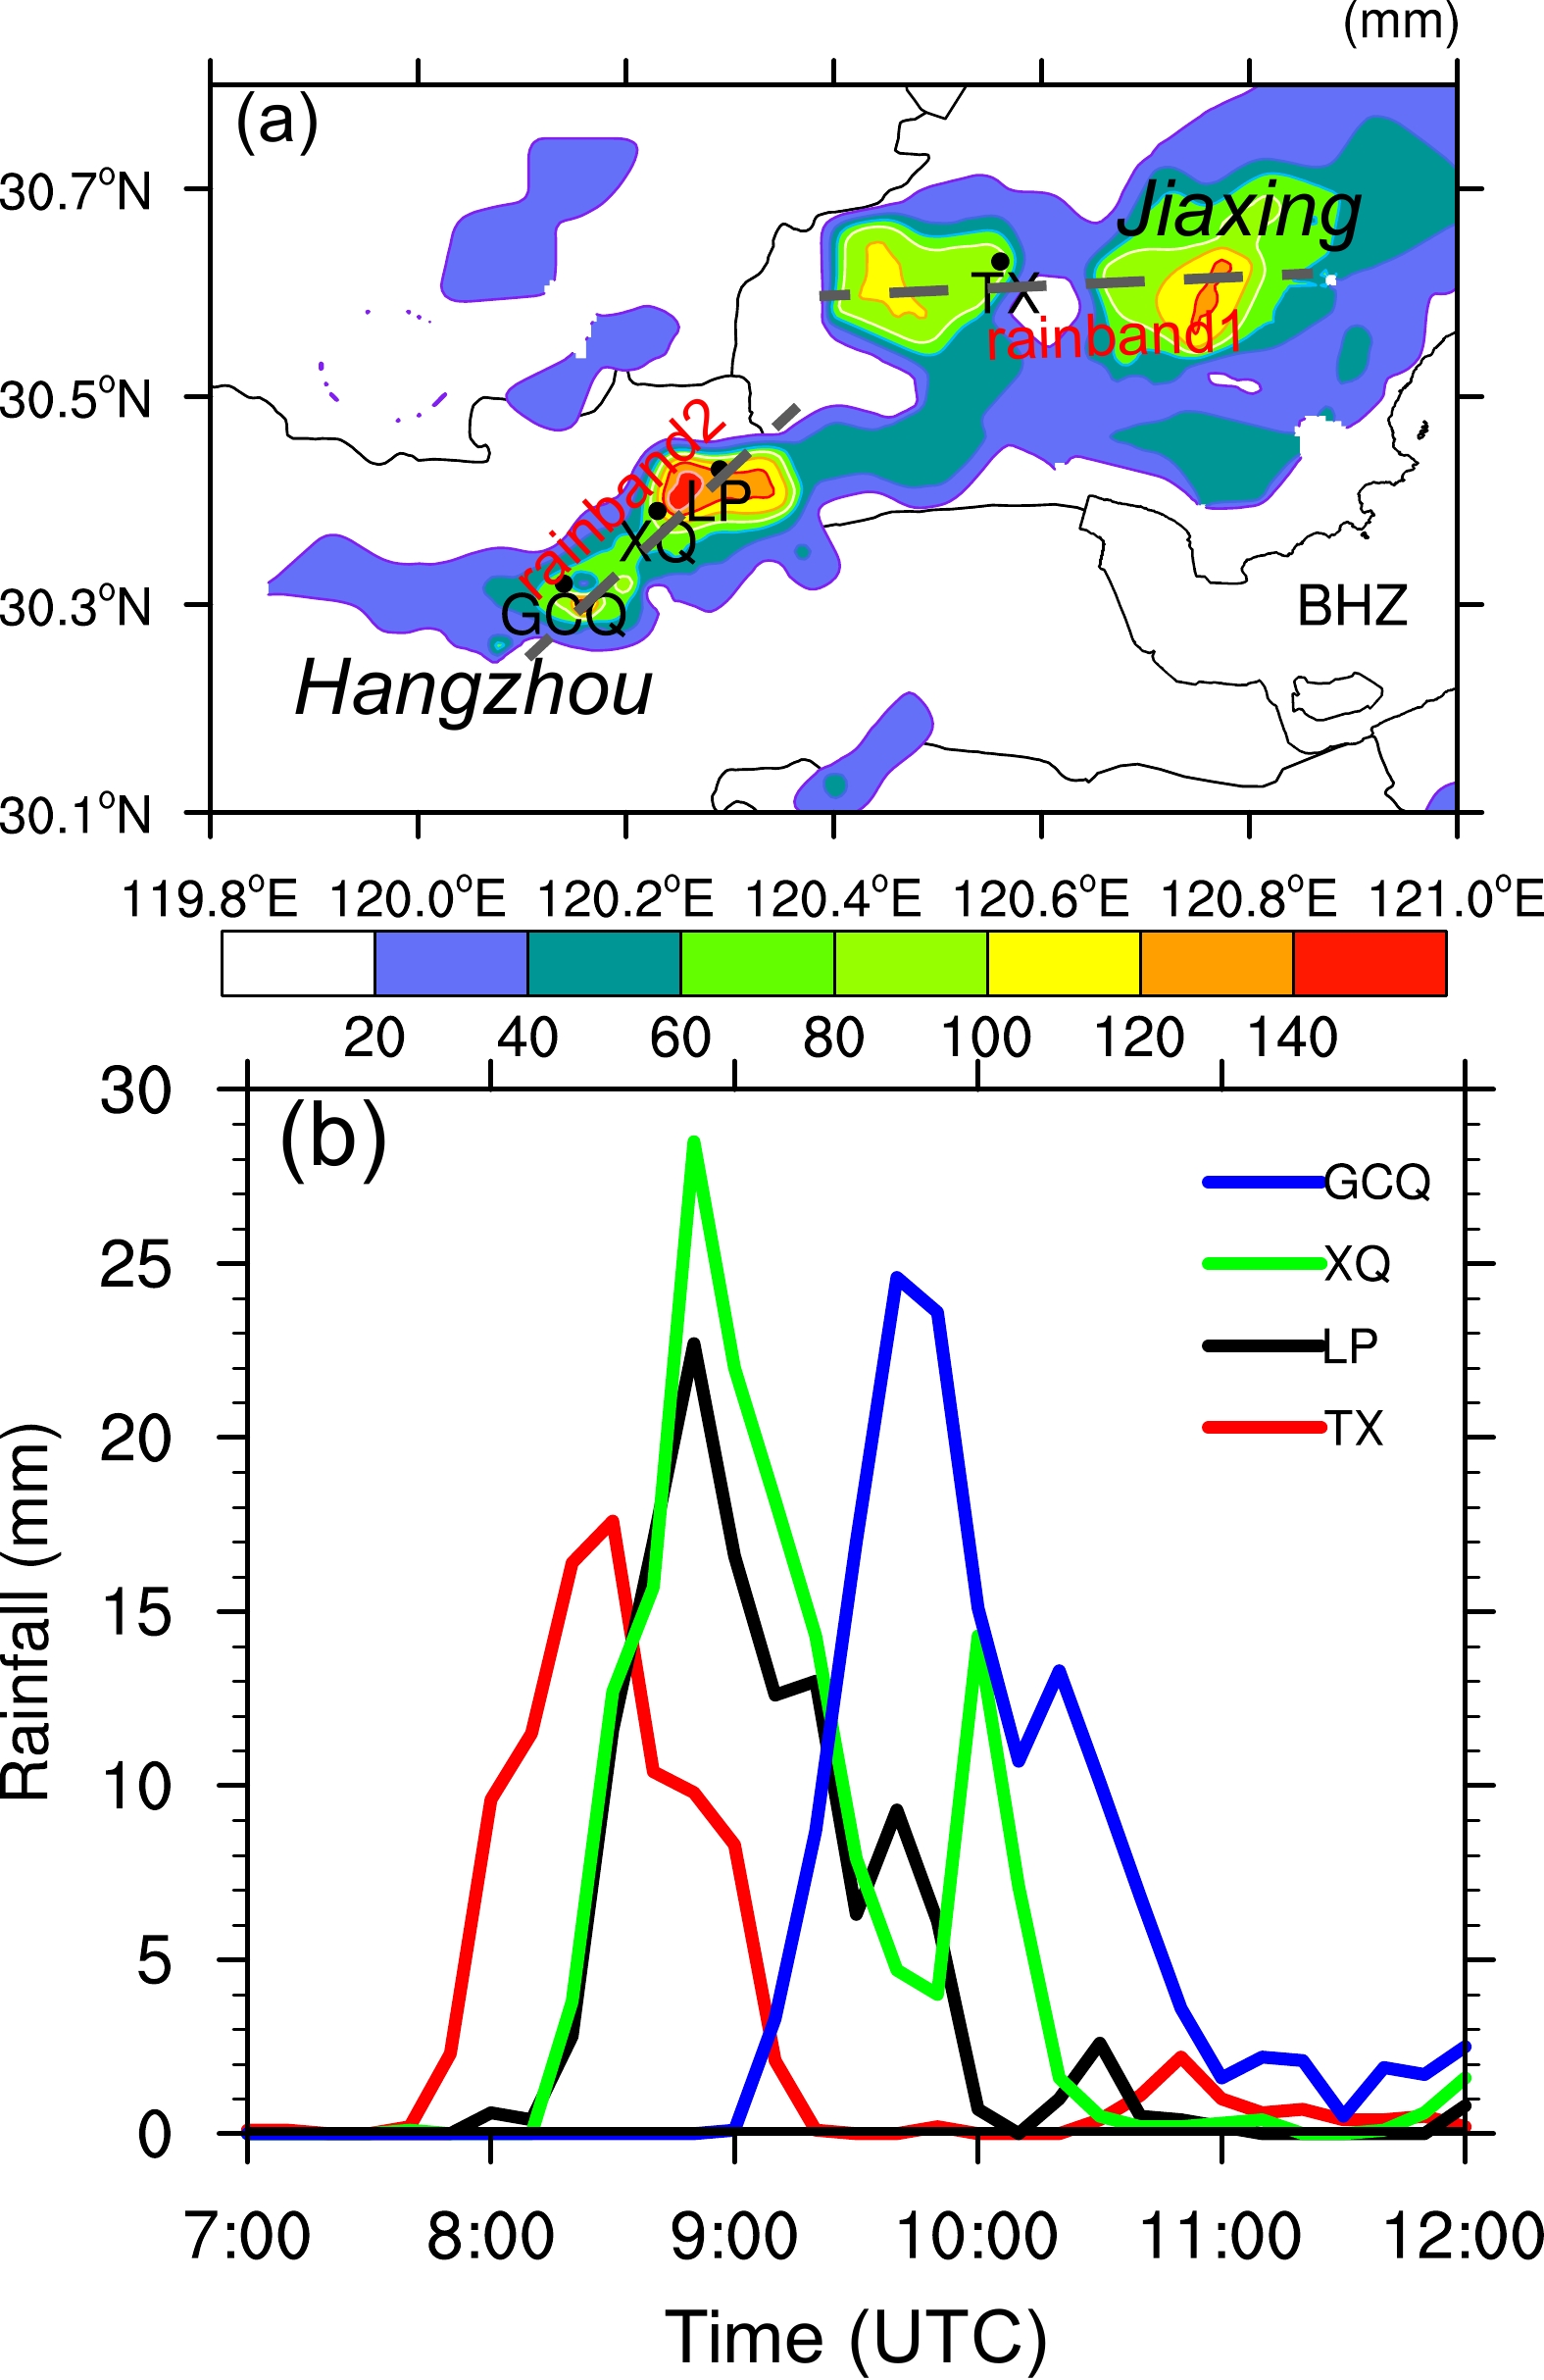
Figure 1. (a) Distribution of the 4-h accumulated rainfall (shaded; units: mm) from 0700 to 1100 UTC 24 June 2013. The station names are abbreviated as Tongxiang (TX), Linping (LP), Xingqiao (XQ), and Gongchenqiao (GCQ). Jiaxing and Hangzhou are the names of two cities in Zhejiang Province. The gray lines denote the two rainbands. (b) Temporal variation of 10-min accumulated rainfall (units: mm) at four stations [TX (red line), LP (black line), XQ (green line), and GCQ (blue line)] during 0700–1200 UTC 24 June 2013. The dashed grey circles in the figures delineate the 60° N latitude circles.
The rest of this paper is organized as follows: Section 2 provides an overview of the extreme rainfall event. Section 3 describes the data used in the numerical model and the design of the simulation experiments. The numerical simulations are validated with the observations in section 4. The results on the back-building processes, the interaction of the convective cold pool and a mesoscale convergence line, and the effect of the cold pool, are presented in section 5. A summary and some discussion are given in the concluding section.
-
In this section, dense automatic weather station observations provided by the China Meteorological Administration are used for surface analysis and documenting the rainfall evolution. Synoptic analysis is presented using the ECMWF interim reanalysis (ERA-Interim) with a 0.75° resolution (http://apps.ecmwf.int/datasets/data/interim-full-daily/). Radar data from the Hangzhou Meteorological Bureau are used to document the evolution of the MCS and the back-building processes.
-
The 4-h accumulated rainfall field (Fig. 1a) shows there are two main rainbands in this case. One has a near east–west orientation (referred to as rainband 1 hereafter) and the other (rainband 2) is located to its southwest and has a northeast–southwest orientation (as marked by the two gray dashed lines in Fig. 1a). Rainband 1 is associated with a quasi-stationary MCS, while rainband 2 is related to a back-building MCS that is the focus of this study. The maximum rainfall associated with rainband 2 exceeds 150 mm and the maximum is located near the northeast end of the band (Fig. 1a). To visualize the temporal evolution of the rainfall associated with the rainbands, the 10-min accumulated rainfall at four stations (Tongxiang, Linping, Xingqiao, and Gongchenqiao, marked as TX, LP, XQ, and GCQ in Fig 1a, respectively) are plotted in Fig. 1b. The maximum rainfall of 162.1 mm occurs at GCQ station. Rainband 1 plays an important role in the generation of rainband 2, so TX station in the western portion of rainband 1 is also plotted. The time series of rainfall (Fig. 1b) show that both the initiation times and the times of maximum accumulated rainfall at the four stations have sequential delays as we move from the northeast-most station (TX) through to the southwest-most station (GCQ), suggesting a southwestward propagation of the precipitation systems through this period (from 0740 UTC to 1200 UTC). The rainfall at the three stations along rainband 2 lasts for about 3 h and shows a primary peak at 0850 UTC for LP and XQ stations and at 0940 UTC for GCQ station, followed by one or two secondary peaks about one hour later (Fig. 1b). The maximum 10-min rainfall at these three stations is between 23 mm and 29 mm. Rainfall starts abruptly, intensifies quickly, and reaches a peak at about 30–40 min.
-
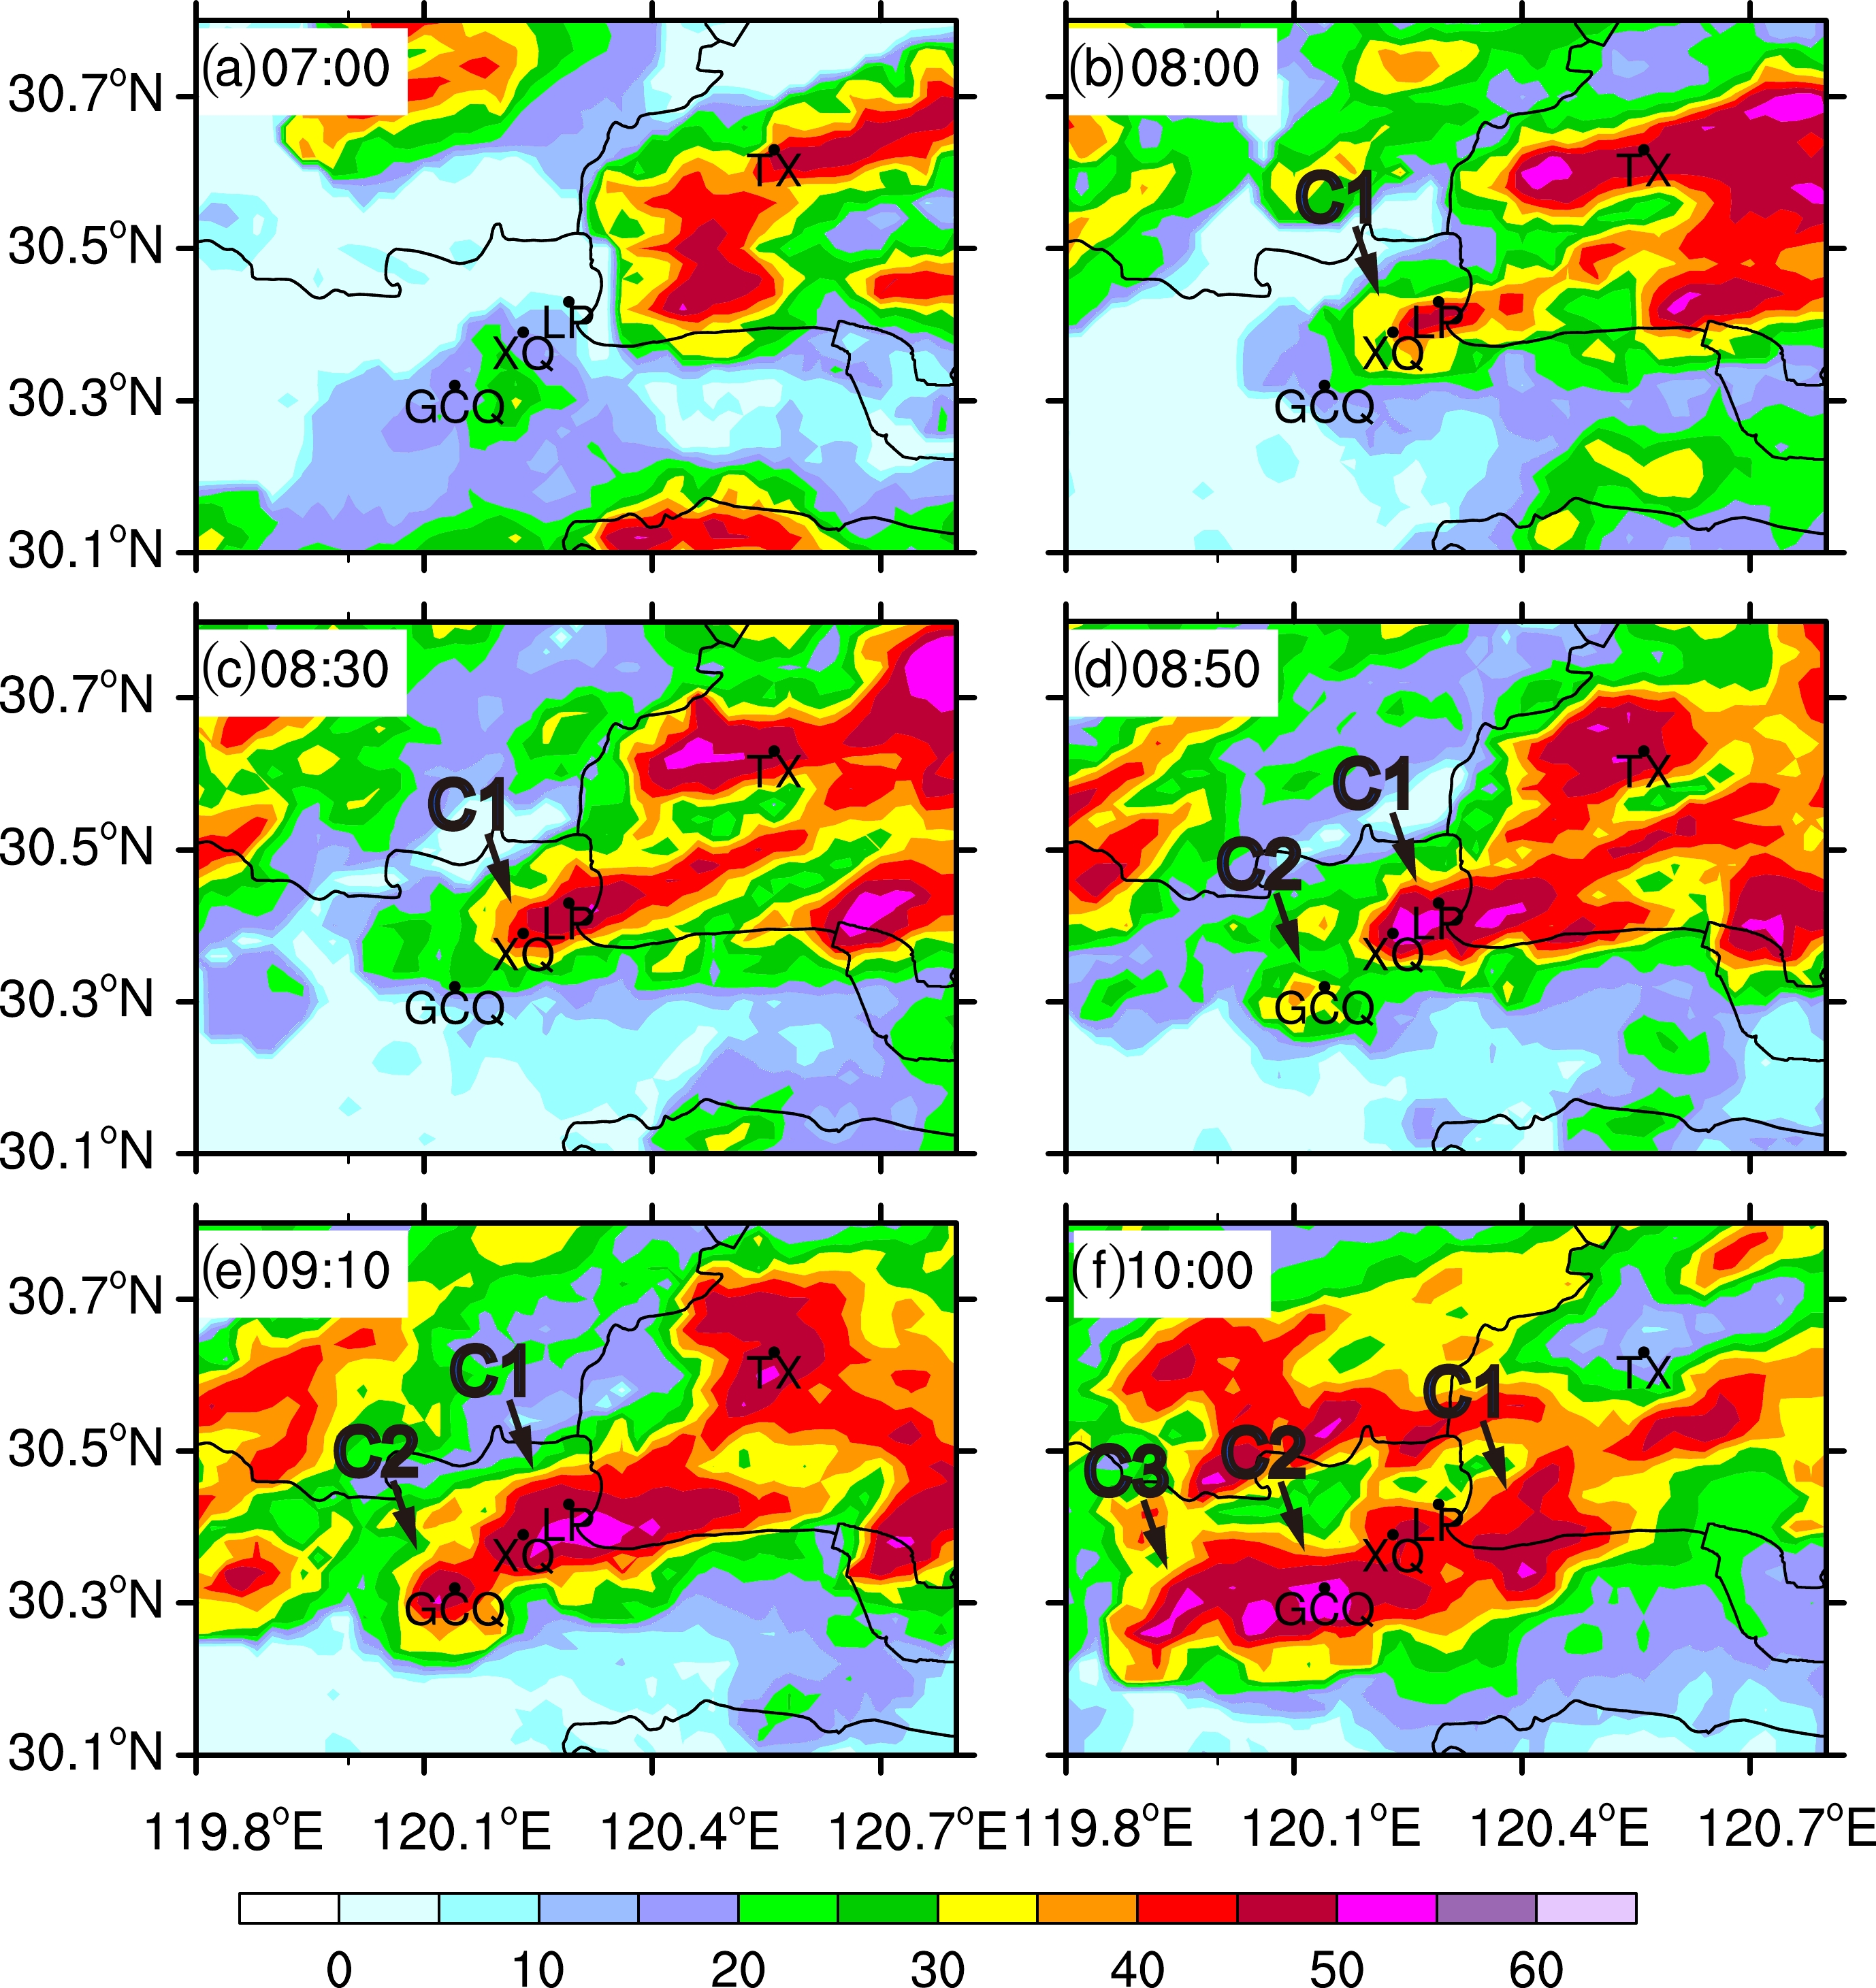
The observed radar reflectivity is used to show the evolution of the rainbands and the back-building processes of rainband 2. At 0700 UTC, in the northeast part of the plotted domain (Fig. 2a) was a line of high reflectivity in the east–northeast to west–southwest direction and it passed through station TX. This line intensified over the next 90 min (Fig. 2c), corresponding to the rainfall reaching peak intensity at station TX (Fig. 2b). The reflectivity near TX maintained its intensity over the next 40 min (Fig. 2e) and then moved southeastward and weakened by 1000 UTC (Fig. 2f). This line of convection was responsible for the precipitation along rainband 1 and also played an important role in the initiation of convection along rainband 2, as will be discussed later.
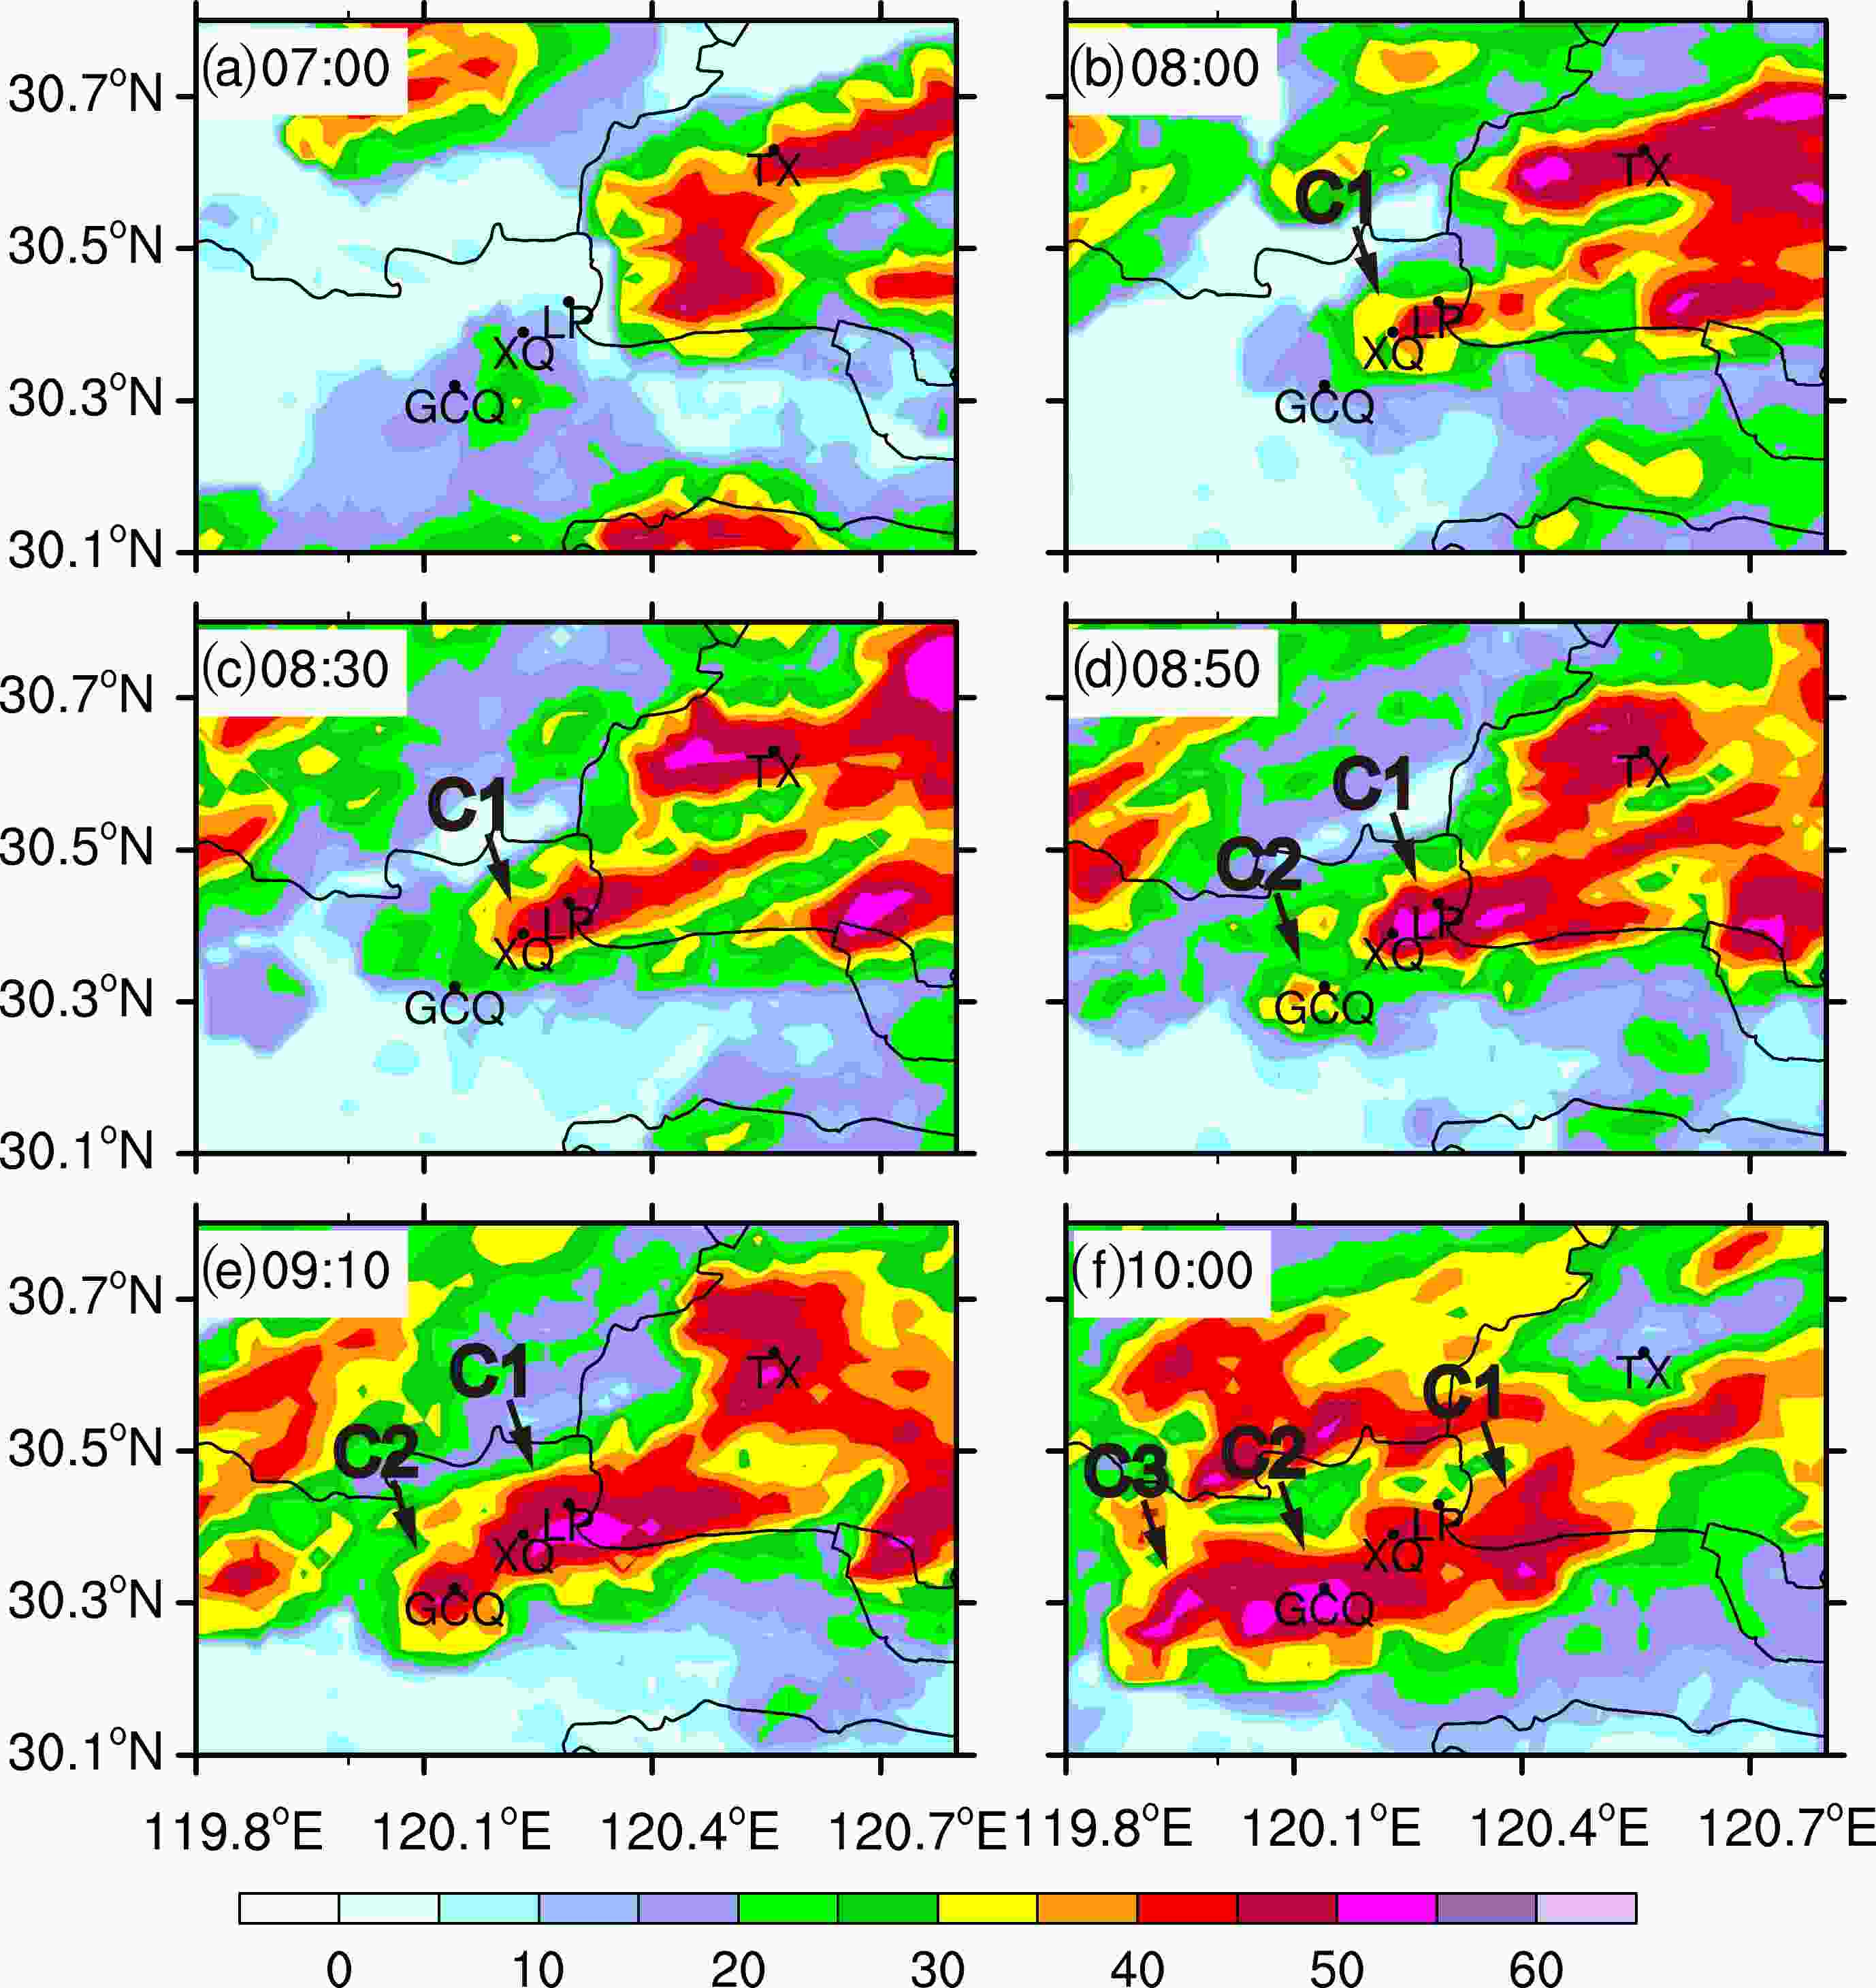
Figure 2. Composite radar reflectivity (units: dBZ) observed by radar at Hangzhou and Ningbo. Convective cells are indicated by C1, C2 and C3 from 0700 to 1200 UTC 24 June 2013.
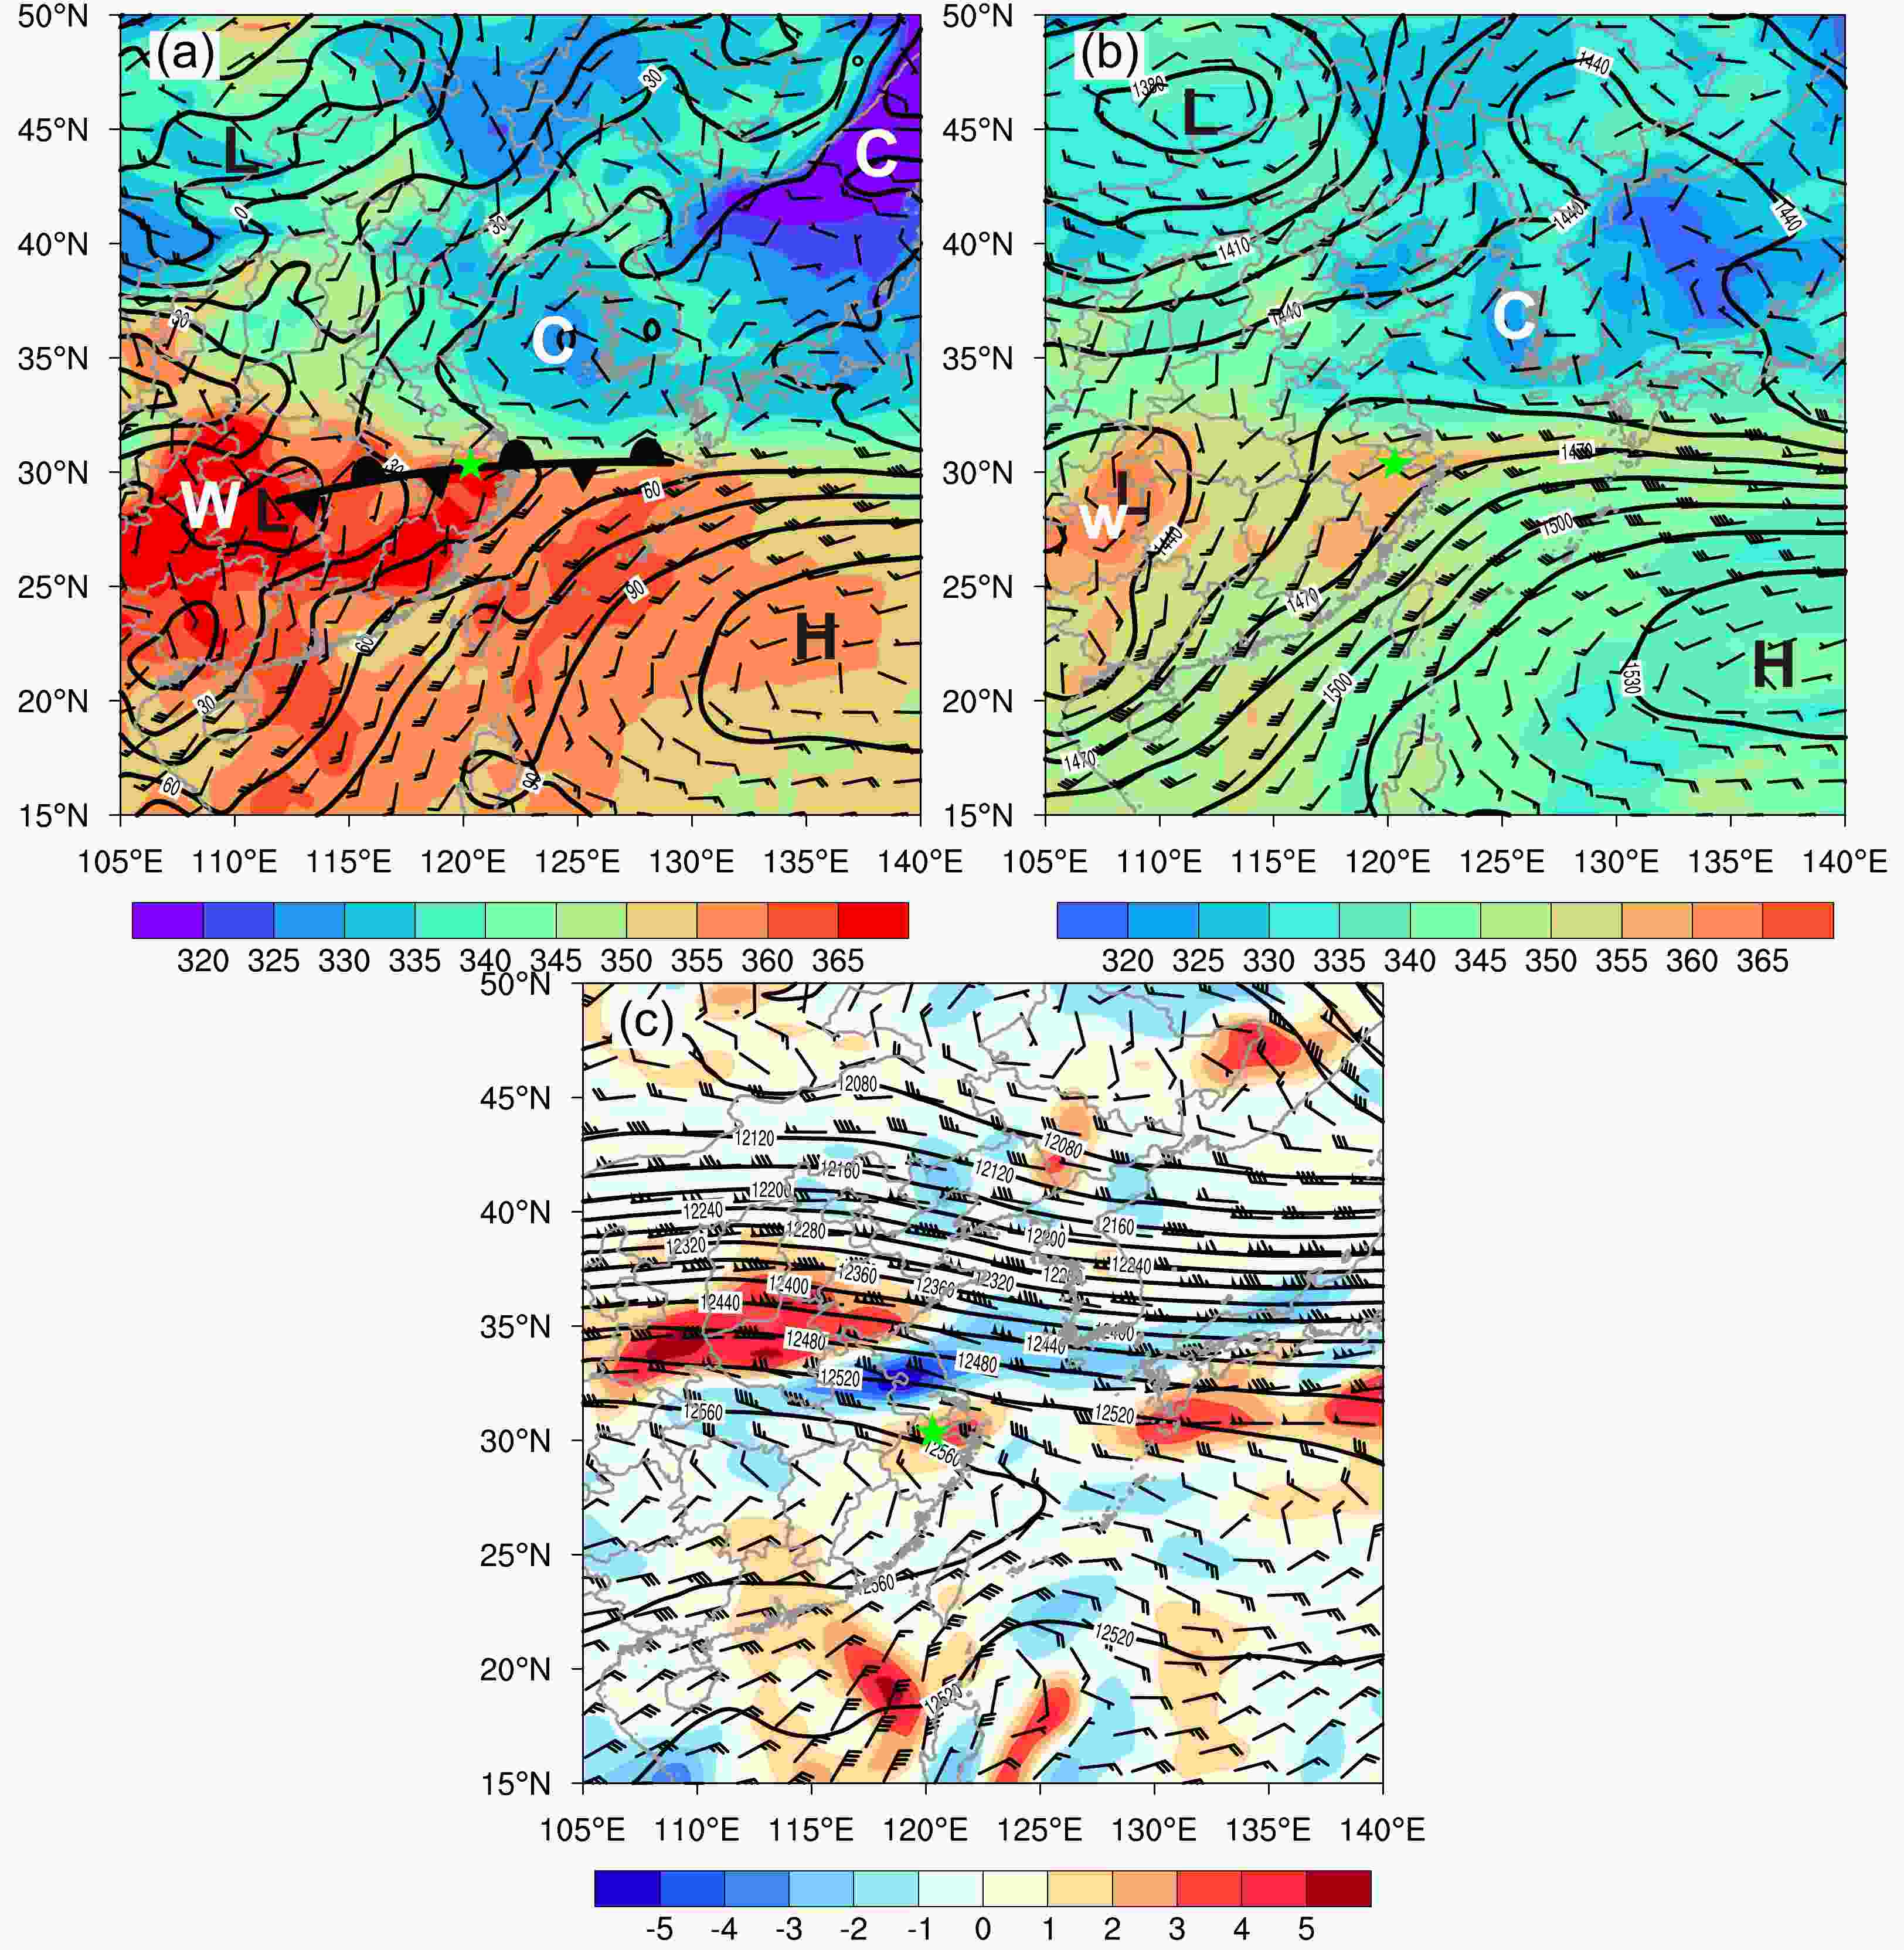
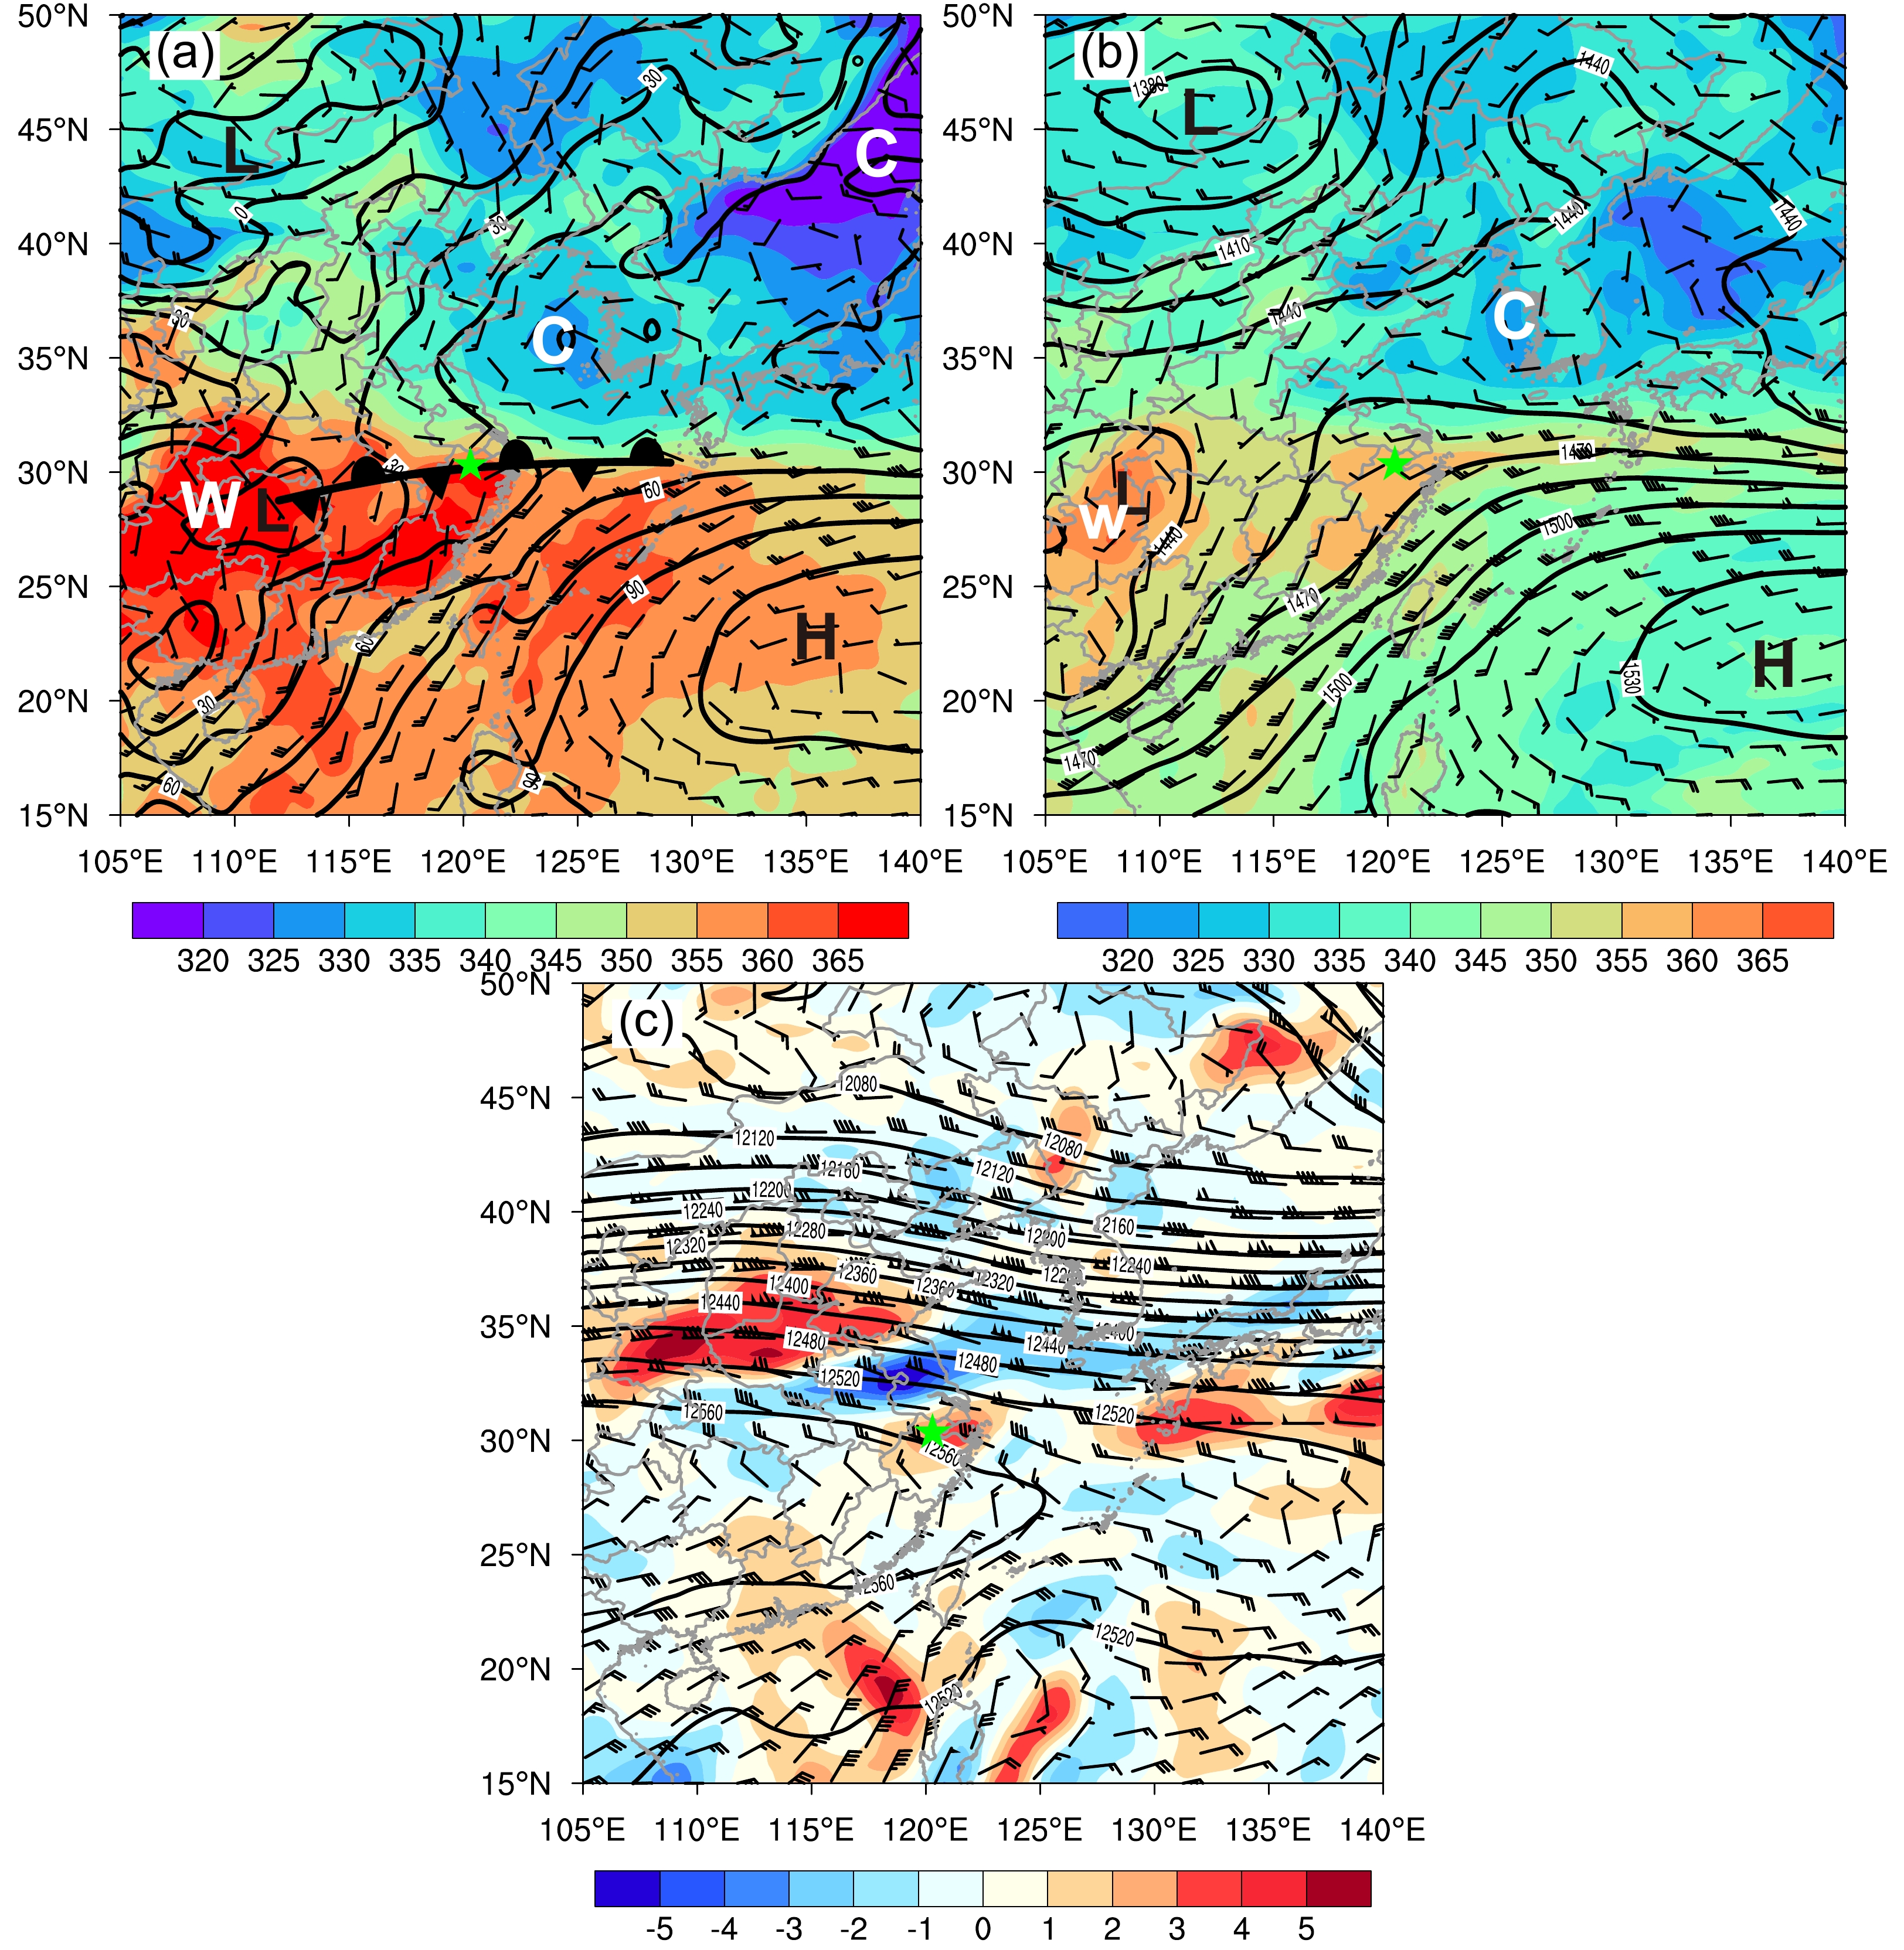
Figure 3. Environmental features based on ERA-Interim at 0600 UTC 24 June 2013. The geopotential height (black solid lines, contour interval of 20 gpm), equivalent potential temperature (shaded), and winds (full barb is 4 m s−1) at (a) 1000 hPa and (b) 850 hPa, and (c) the 200-hPa geopotential height (black solid lines, contour interval of 20 gpm), horizontal divergence (shaded), and winds (full barb is 4 m s−1). The distribution of a surface stationary front indicates the location of the mei-yu front. The letters H, L, W and C denote the centers of a high and low pressure system, and the warm and cold air, respectively.
Convection along rainband 2 first developed when cell C1 first formed near station LP at 0800 UTC (Fig. 2b). The cell core stayed more or less stationary and intensified over the next 50 min (Figs. 2c and 2d) and then started to propagate southeastward and became weaker by 1000 UTC (Fig. 2f). Cell C1 was primarily responsible for the heavy rainfall at stations LP and XQ (Fig. 1), while the secondary peaks at these two stations also appeared to have been influenced by cell C2 as it formed to its southwest and expanded northeastwards (Fig. 2f).
At 0850 UTC, a new cell (C2) appeared southwest of C1 (Fig. 2d) and became stronger by 0910 UTC (Fig. 2e). It expanded in spatial extent and linked up with cell C1 to establish a convective line that qualified as an MCS over the next hour (Fig. 2f). C2 was clearly responsible for most of the precipitation at station GCQ between 0900 and 1100 UTC (Fig. 2 and Fig. 1b). Meanwhile, a third convective cell became established further southwest of C2 (Fig. 2f), and the three cells moved slowly along the connected line northeastwards. The continuous generation of new convective cells upstream of older cells, relative to low-level flow, and the organization of the cells into a southwest–northeast-oriented convective line in this case are the typical characteristics of back-building MCSs, and the movement of cells along the line, passing over the same locations, often results in extreme precipitation.
-
The geopotential height, equivalent potential temperature, and wind fields at the 1000-, 850- and 200-hPa levels are shown in Fig. 3 at 0600 UTC 24 June 2013, or about 2 h before the heavy rainfall occurred in Hangzhou. At 1000 hPa (Fig. 3a), a cold high-pressure/anticyclone system occupied the Bohai Sea, and the subtropical high was located to the south over the northwestern Pacific, while a low-pressure system was located over the Sichuan Basin to the west, which extended eastward along a quasi-stationary front. This quasi-stationary front is the mei-yu front of this season, which is also a wind shear line with cyclonic flow curvature. The front passed through Hangzhou City in northern Zhejiang Province. Studies have found that such horizontal wind shear is often more significant than the thermal gradient over southern China for producing precipitation (e.g., Chen and Chang, 1980). South of the mei-yu front, the surface equivalent potential temperature was much higher and south-southwesterly flows brought warm, moist air towards the heavy precipitation region.
At the 850-hPa level (Fig. 3b), the heavy precipitation region was also located within the southwesterly flows that provided low-level moisture in the region (Fig. 3b). At the 200-hPa level, the precipitation region was located underneath strong west-northwesterly flows at the southern edge of a mid-latitude upper-level jet where anticyclonic divergence flows existed (Fig. 3c). The coupling of convergence at the lower level and divergence at the upper level provided favorable conditions for convective systems in the region.
-
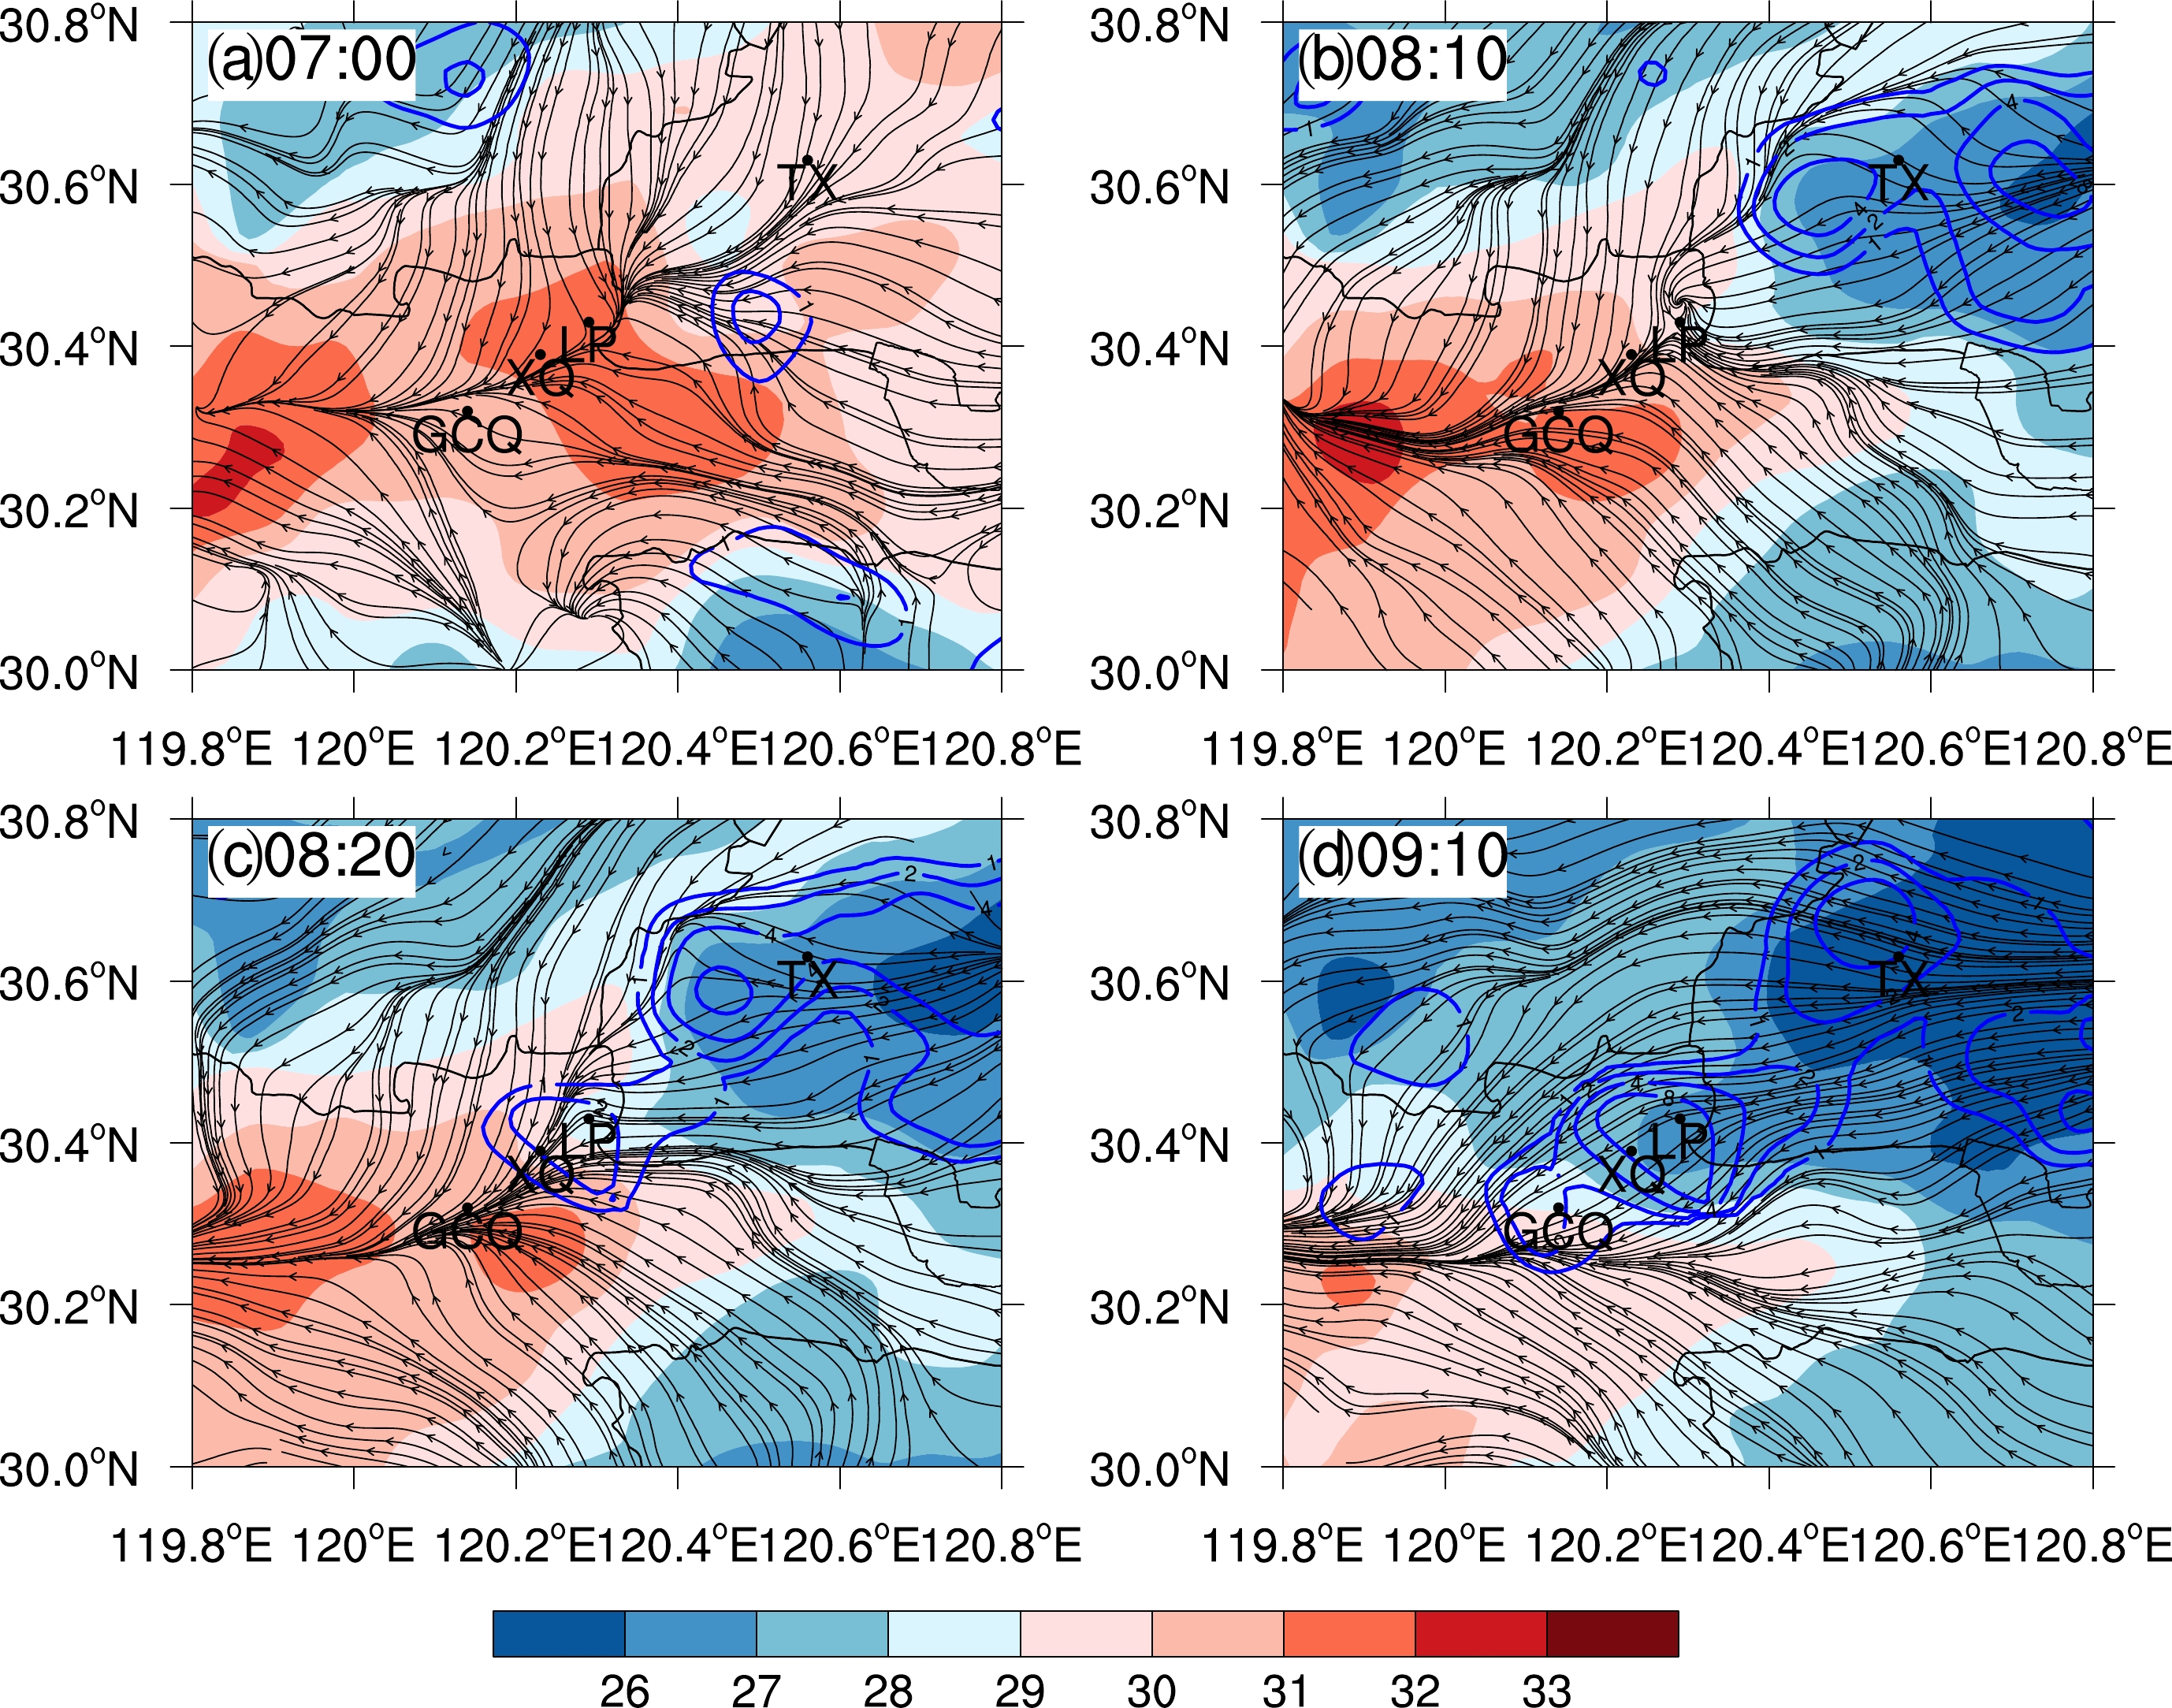
Figure 4 shows analyses of the surface temperature and flow fields together with the 10-min accumulated precipitation as observed by automatic weather stations. At 0700 UTC (Fig. 4a), a mesoscale surface convergence line clearly passed through the four stations discussed earlier. Weak precipitation existed slightly south of the convergence line. According to the synoptic analysis, this mesoscale surface convergence line was a part of the mei-yu front. For convenience and consistency, we use “convergence line” or “near-surface convergence line” to describe this part of the mei-yu front in the ensuing analysis.
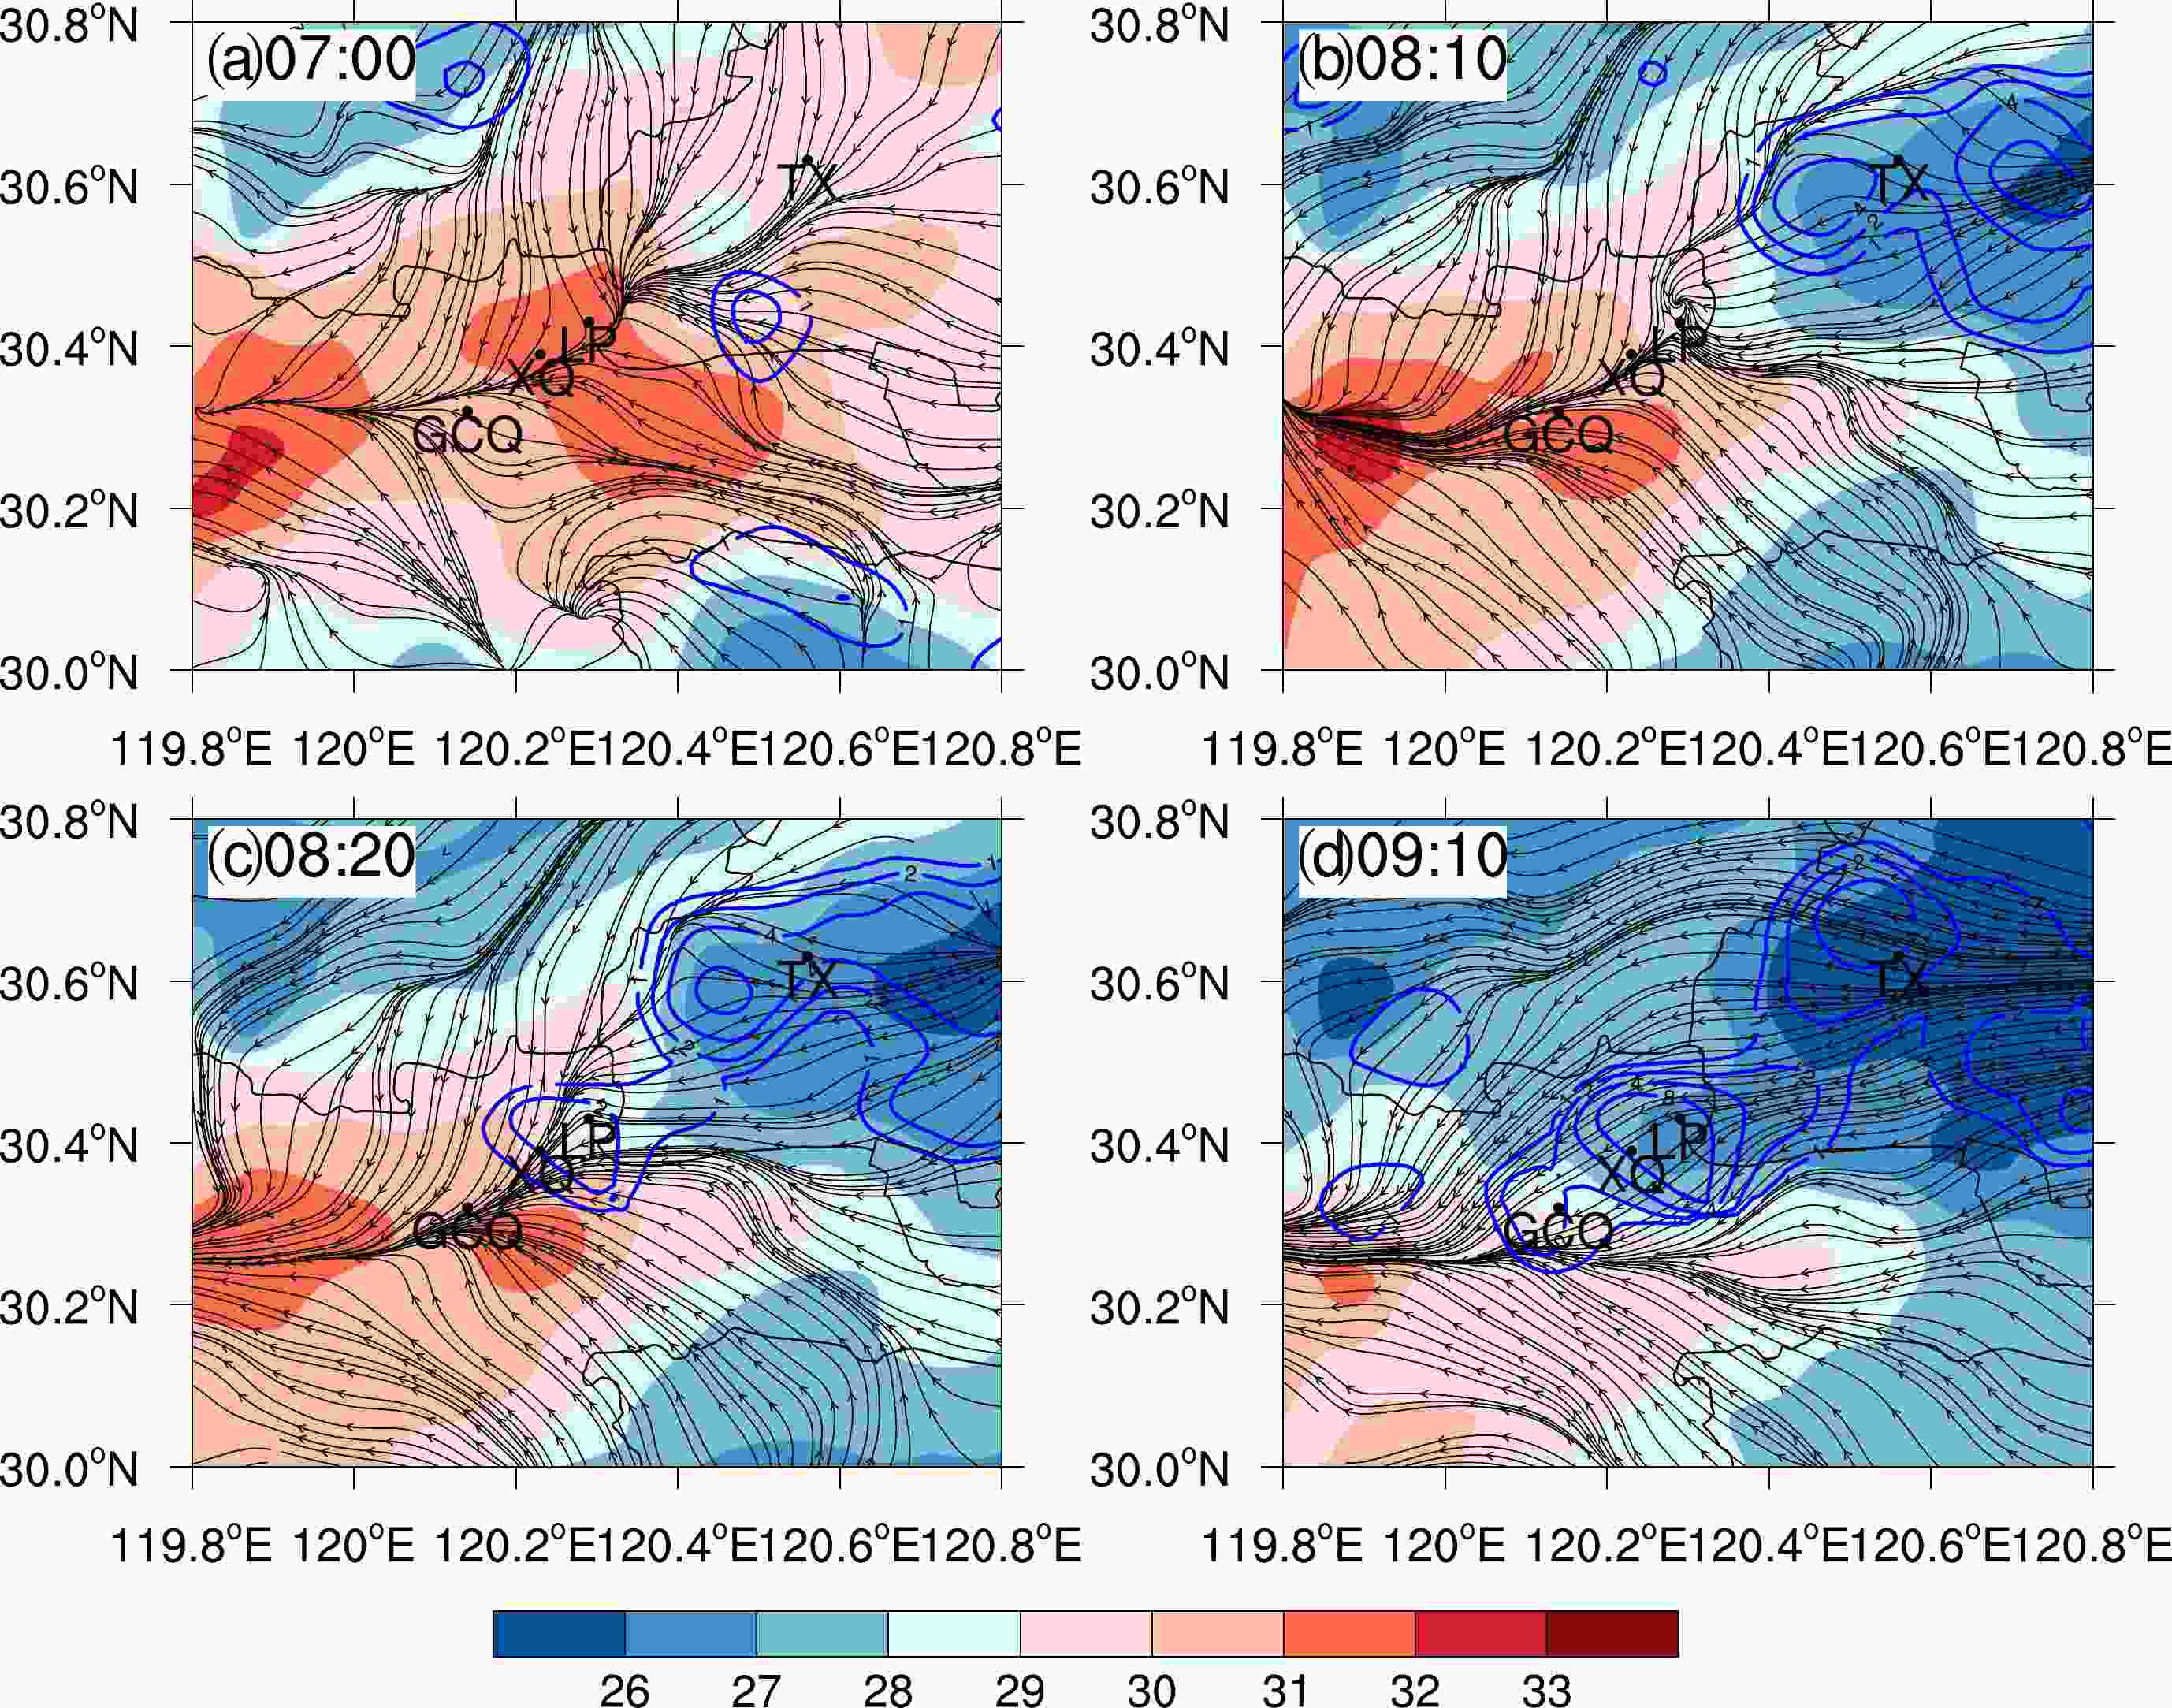
Figure 4. Objective analyses of 2-m temperature (shaded; units: °C), 10-min accumulated rainfall (blue contours at 1×2N mm, where N = 0, 1, 2, 3,…), and streamlines of 10-m winds observed by automatic weather stations at the times shown (in UTC) on 24 June 2013.
By 0810 UTC, rainband 1 had fully developed into a linear MCS, producing significant precipitation and associated surface cold outflow that split the convergence line (Fig. 4b). The western edge of the cold outflow or gust front reached station LP at 0810 UTC, and 10 min later, at 0820 UTC, a new precipitation center formed at the station (Fig. 4c) that was associated with cell 1 shown in Fig. 2. By 0910 UTC (Fig. 4d), significant precipitation was found over stations LP, XQ and GCQ, establishing rainband 2 that further extended southwestward later via back-building. The surface flows changed to easterly at the location of the original convergence line, due to the southwestward spreading of the outflows along the convergence line.
The above observational results suggest that the cold outflows generated by rainband 1 played significant roles in the initiation of the initial cells of rainband 2, while the effects of outflows from additional cells on rainband 2 promoted the back-building processes. Still, due to the limited availability of data, a full understanding of the exact processes of the outflow–convergence line interaction, the triggering of new cells via back-building, and the production of extreme precipitation, requires high-resolution numerical simulations that provide more complete information. The model configuration and simulation results are presented next.
-
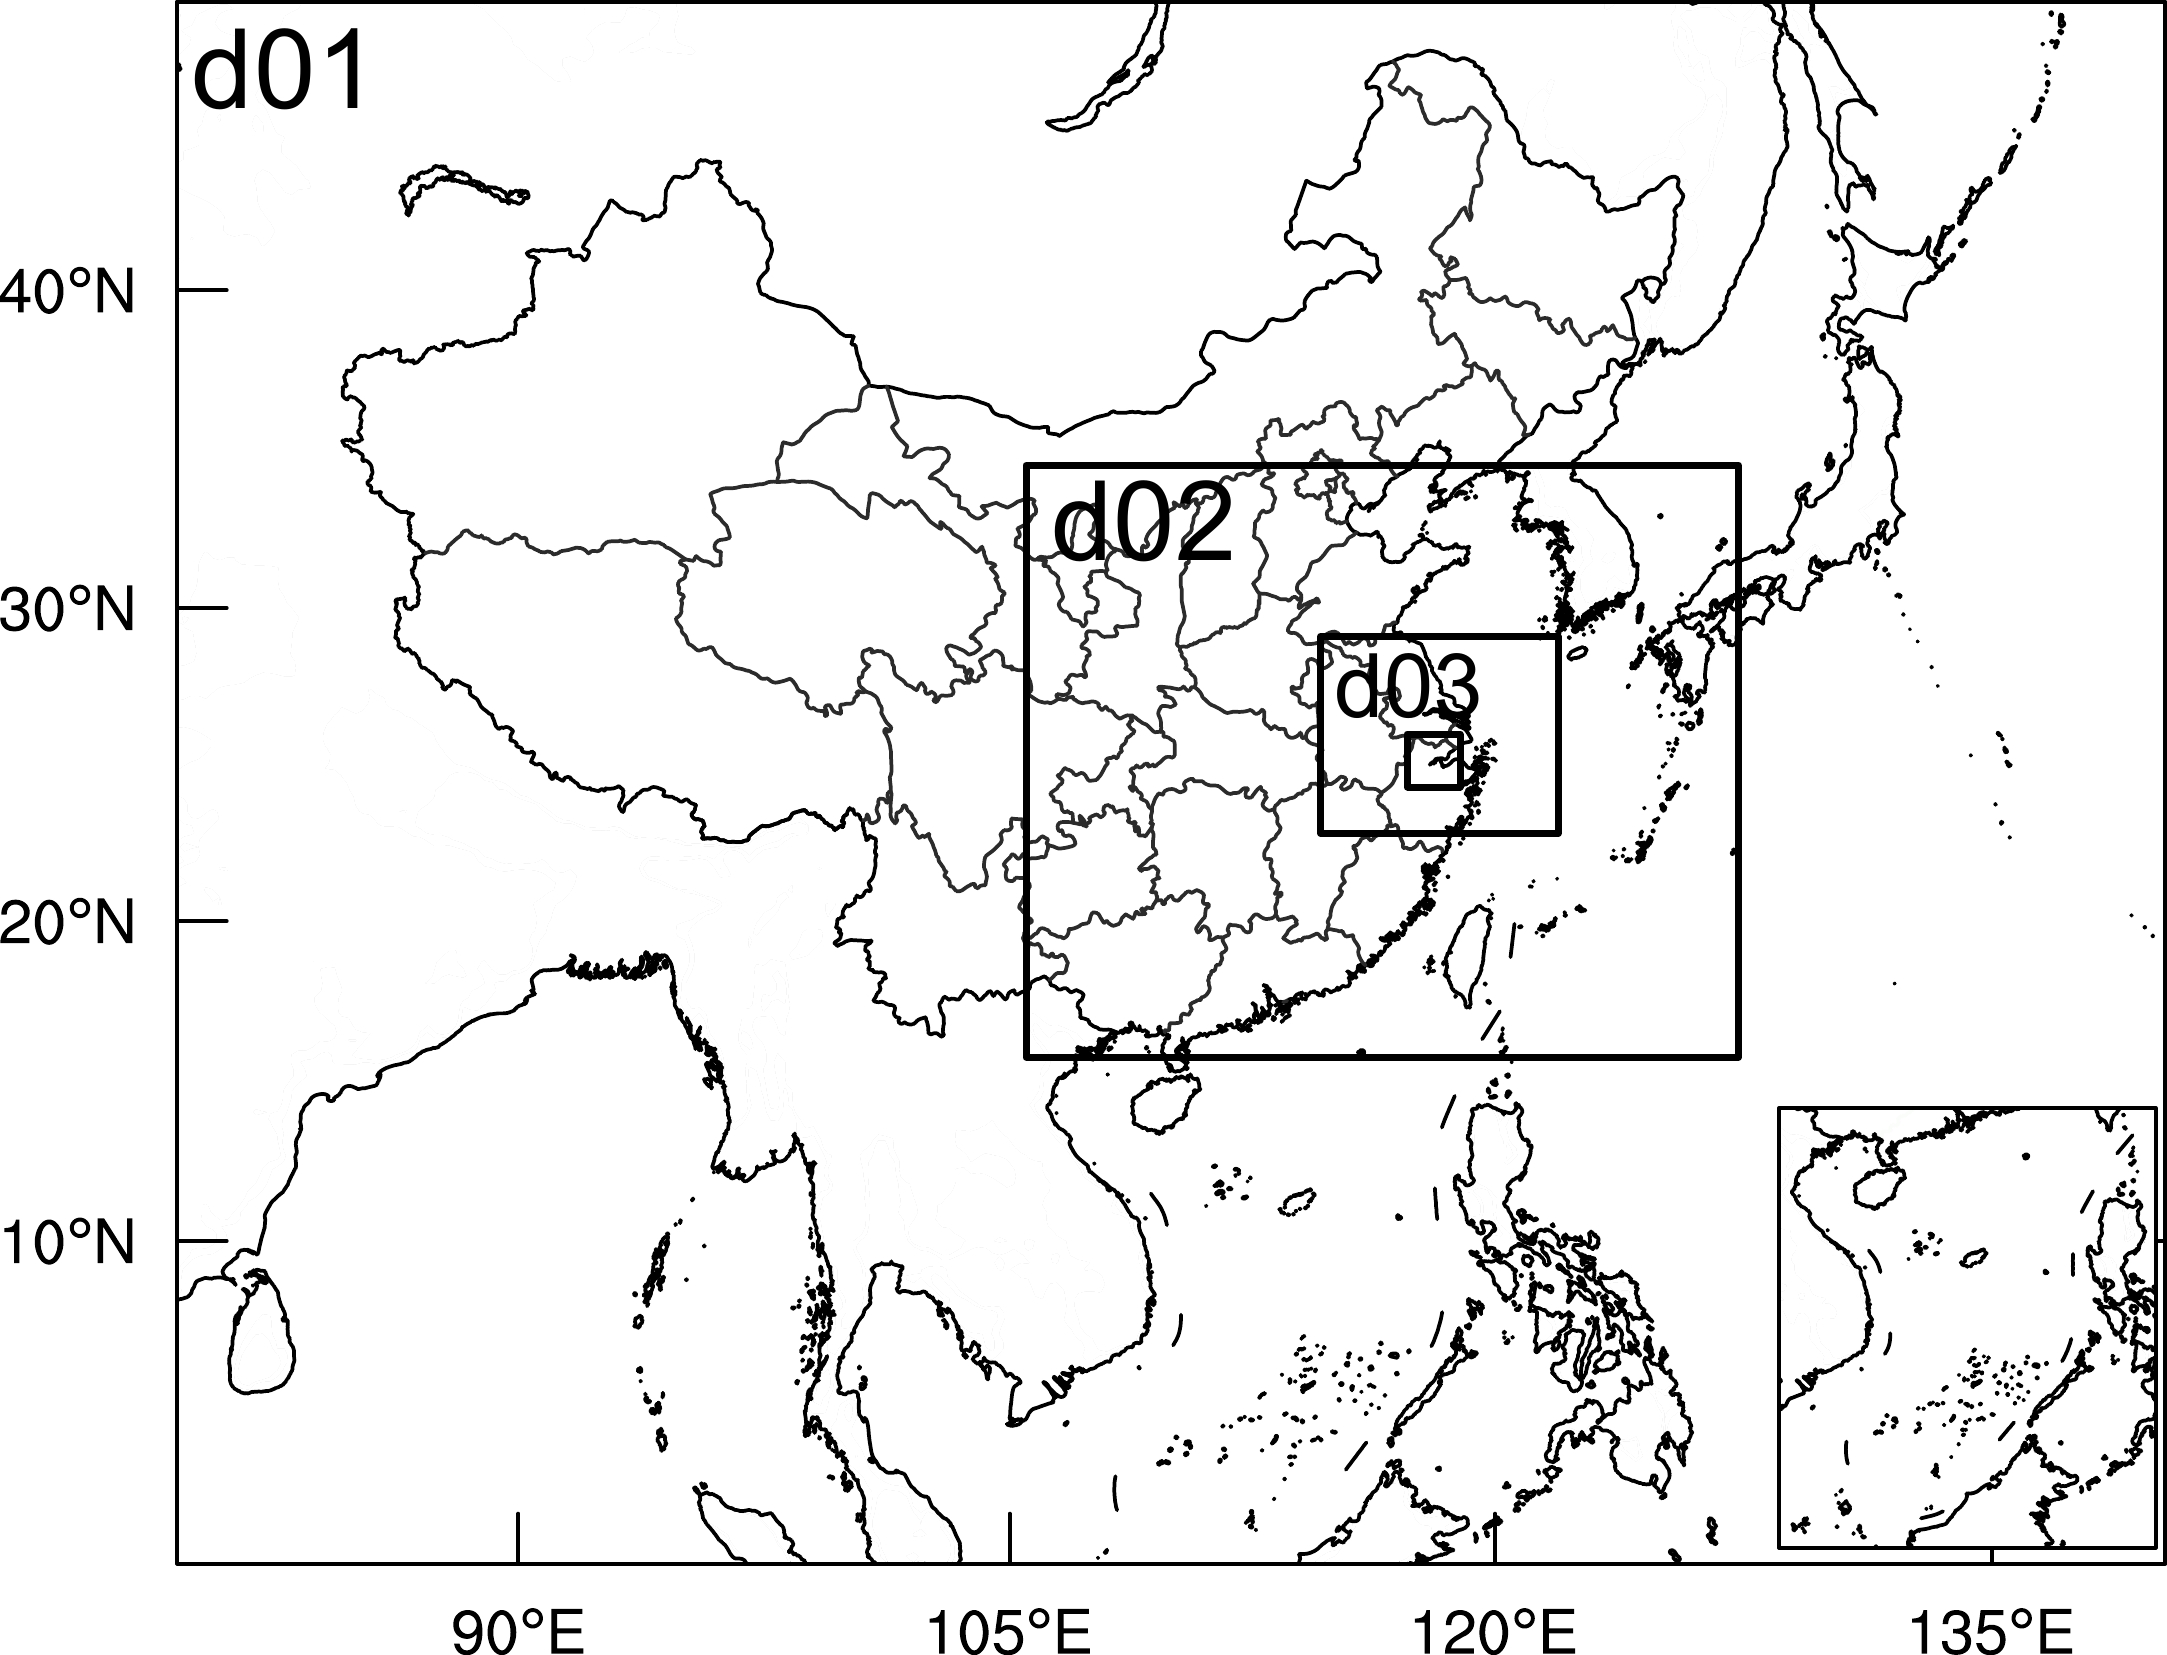
The Advanced Research version of the WRF model (WRF-ARW; Klemp et al., 2007; Skamarock et al., 2007), version 3.7.1, is used to simulate this rainfall event. Four, two-way nested domains are used (Fig. 5), consisting of grids of 27-, 9-, 3- and 1-km grid spacings with horizontal mesh sizes of 280 × 220, 301 × 250, 301 × 250, and 202 × 202 (Lat. × Lon.), respectively. Except the synoptic-scale fields, the model results in this paper are from the innermost domain. The number of vertical levels is 57. Since this study focuses on low-level features, 19 levels are configured below 3 km. The model uses the Thompson microphysics scheme (Thompson et al., 2004, 2006, 2008), the RRTM longwave radiation scheme (Mlawer et al., 1997), the Duhdia shortwave radiation scheme (Dudhia, 1989), the MYJ planetary boundary layer scheme (Janjić, 1994), the Noah-MP land surface model, and the Eta surface layer scheme (Janjić, 1996) based on Monin–Obukhov similarity theory in all domains, while the Grell 3D cumulus scheme (Grell and Dévényi, 2002) is used in domains 1 and 2 only. ERA-Interim is used to provide the initial and boundary conditions. The simulations are integrated from 0000 to 1200 UTC 24 June 2013. To examine the impact of the cold pool, we perform an additional experiment named NOEVAP, in which the cooling from the evaporation of rainwater is removed from the microphysics scheme.
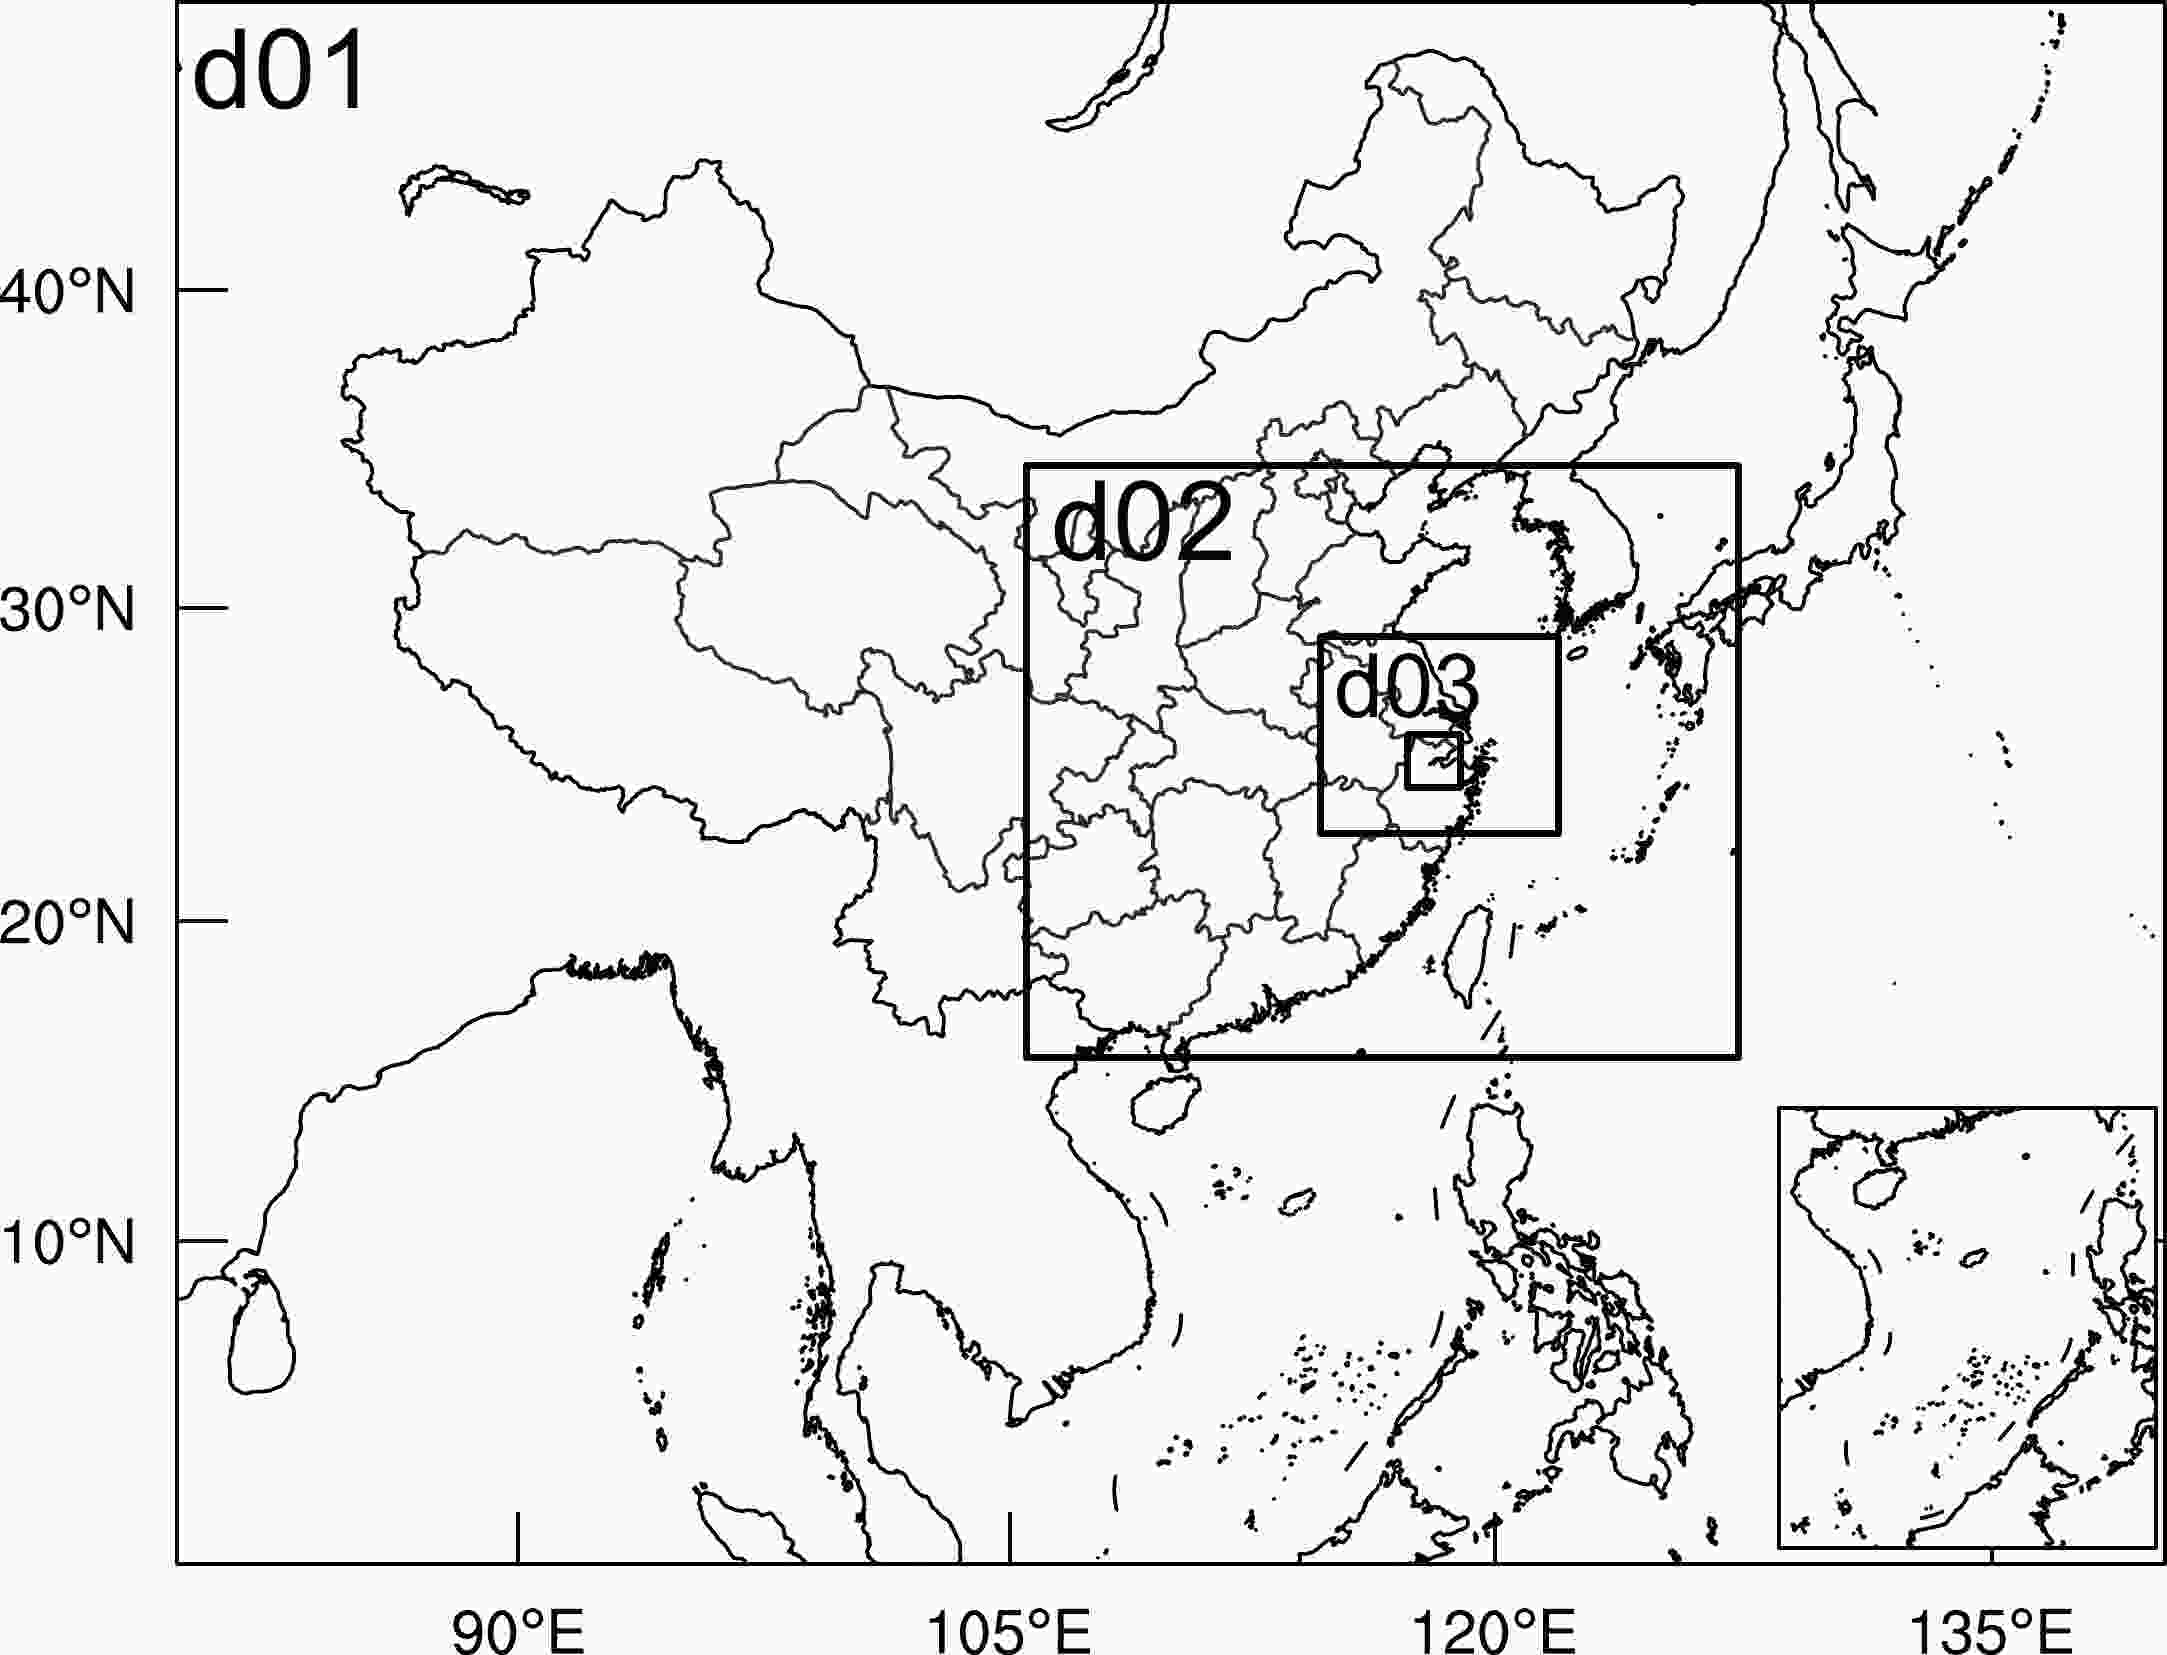
Figure 5. The four nested domains for numerical simulations. Domains d01, d02 and d03 have 27-, 9- and 3-km grid spacing, respectively. The innermost black rectangle is for the 1-km grid spacing domain d04.
-
We compare the synoptic-scale fields in the outermost domain with the ERA-Interim data and find that the model reproduces well the large-scale environment before convection occurred in Hangzhou, including the wind shear line extending eastwards from Sichuan Province, the mei-yu front, the subtropical high over the ocean, and the southwesterly flows on its northwest side at 850 hPa (not shown).
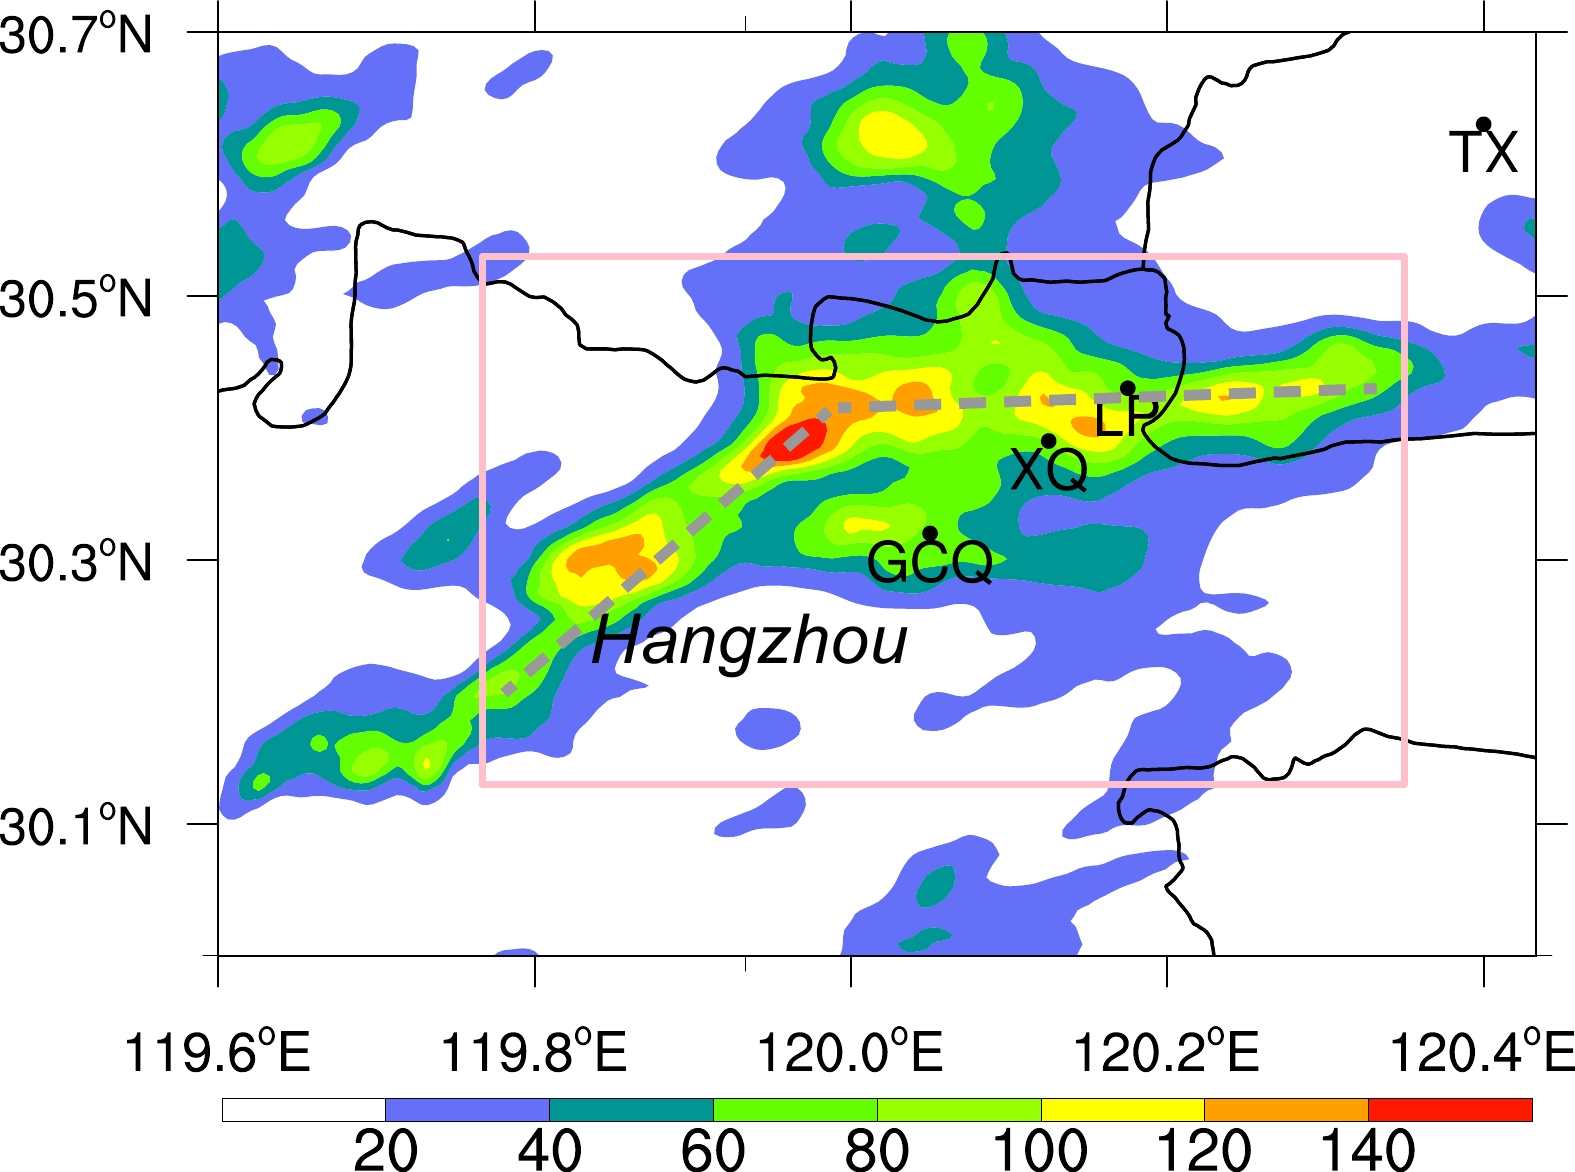
Comparison of the 4-h accumulated rainfall between the simulation (Fig. 6) and the observational data (Fig. 1) shows that the model successfully captures two rainbands but their locations are shifted southward and westward by about 20 km (Fig. 6). The maximum accumulated rainfall center of over 140 mm is reproduced, and is located at the intercepting point of the two rainbands. The simulated rainfall occurs about two hours too early. Because the rainfall in this event was associated with a mesoscale convergence line and the mei-yu frontal system rather than local land-surface features, timing and location errors of precipitation often occur owing to errors associated with larger-scale features. For our purposes, the most important is that the key physical processes are correctly reproduced in the simulation. Timing and position errors of simulated/predicted mesoscale and convective-scale systems have also been encountered in many earlier process studies, such as Weisman et al. (2013) and Xu et al. (2015).

Figure 6. The distribution of 4-h accumulated rainfall (shaded; units: mm) during the period 0500–0900 UTC from the finest-resolution (1-km) domain. The gray lines denote the two rainbands. The pink rectangle indicates the region for calculation of area-averaged hourly rainfall.
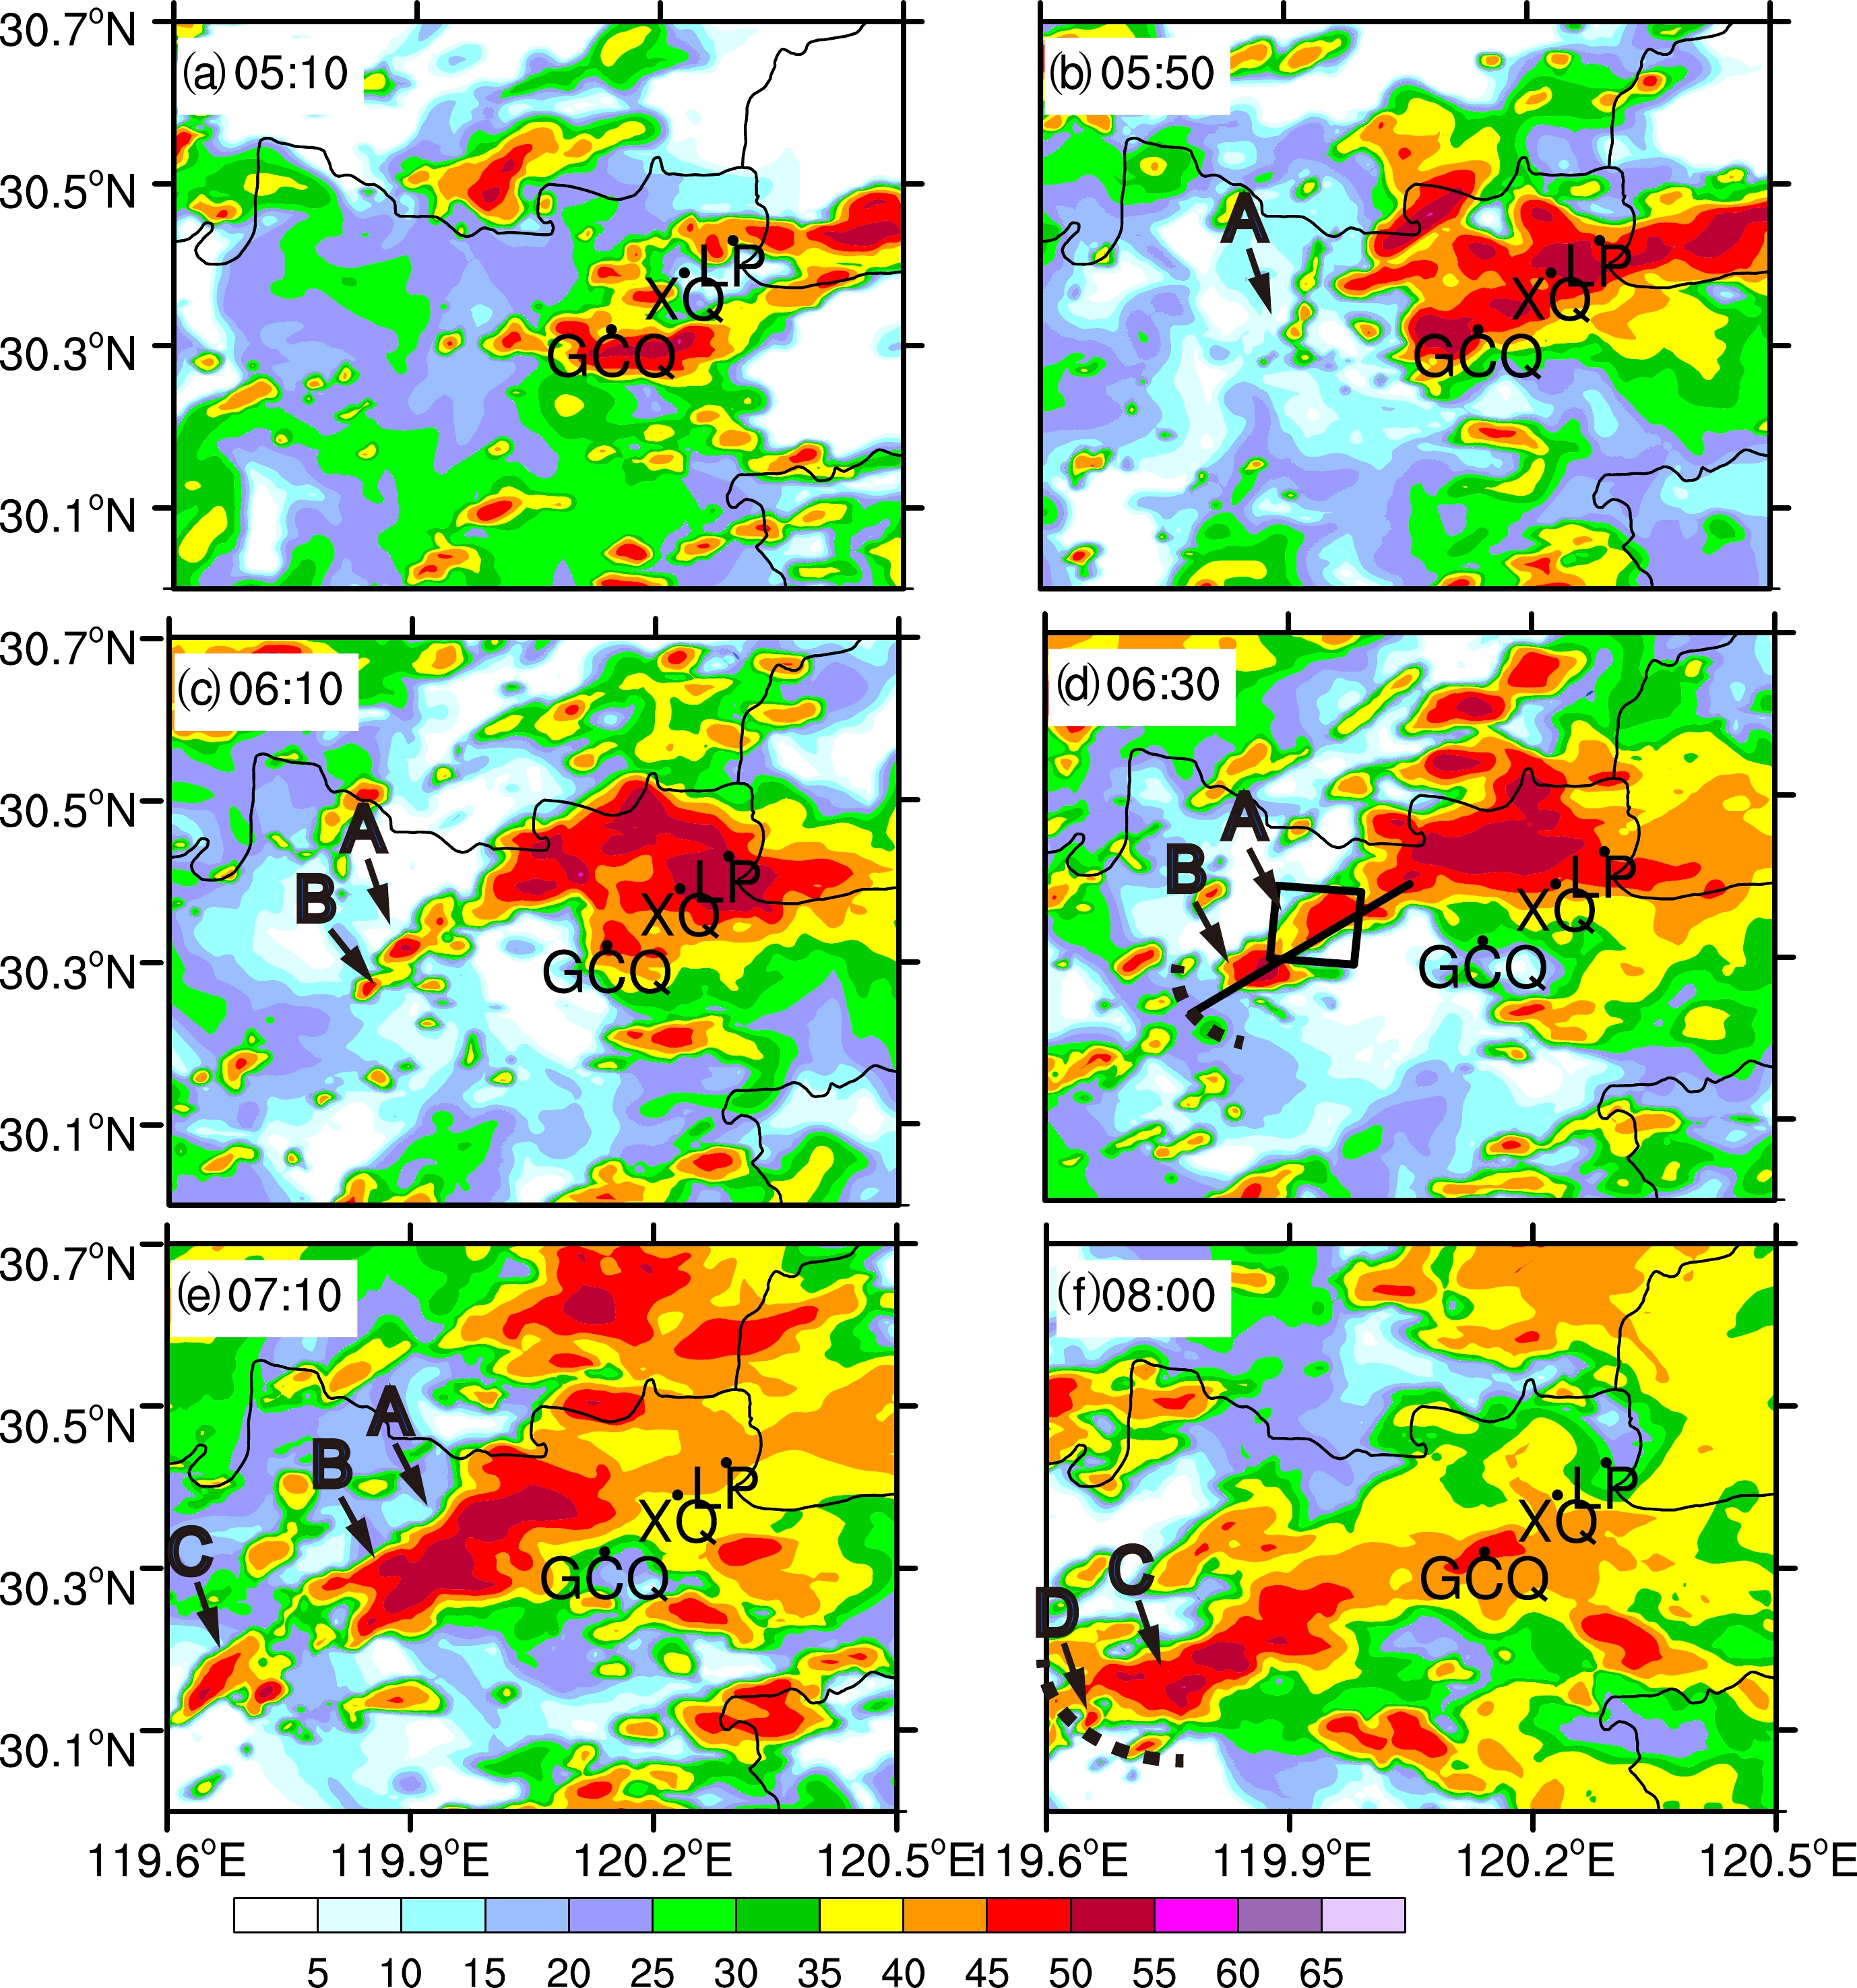
Figure 7 shows the simulated radar composite reflectivity fields, which should be compared to those in Fig. 2. Because of the model timing error, the simulated fields shown are 2 h earlier than observed. The model reproduces the near west–east-oriented quasi-stationary convective line associated with rainband 1 at 0510 UTC (Fig. 7a), which has increased in intensity and coverage in later hours (Fig. 7). Later, a sequence of new cells forms to the southwest of this line (Figs. 7b–f), similar to observed (Figs. 2b–f). To differentiate from the observations, we use A, B, C and D to label the simulated cells that form via back-building. Cell A is first initiated west of the convection line associated with rainband 1 at 0550 UTC (Fig. 7b). Cell B forms further southwest of cell A by 0610 UTC (Fig. 7c). The two cells reach their maximum intensity by 0710 UTC (Fig. 7e). At 0630 UTC, the gust front from cells B and A is indicated by the thick dashed line in Fig. 7d, while at this time a new cell ahead of the gust front is found along the convergence line. By 0710 UTC, this new cell is fully established and is labeled cell C in Fig. 7e. The formation of cell C is somewhat different from cell C3 in the observation, which formed closer to cell C2 (Fig. 2), but the process is still physical. Later, cell C merges with cells B and A to form a connected line, and a gust front is found southwest of cell C, and new cells are further triggered at the gust front (Fig. 7f). Overall, the back-building processes where new cells are triggered by the rearward propagating gust front and eventually organized into a line-oriented MCS are reasonably well reproduced in the simulation, despite certain timing and position errors. In the next section, the cell initiation processes within the model are examined in more detail.
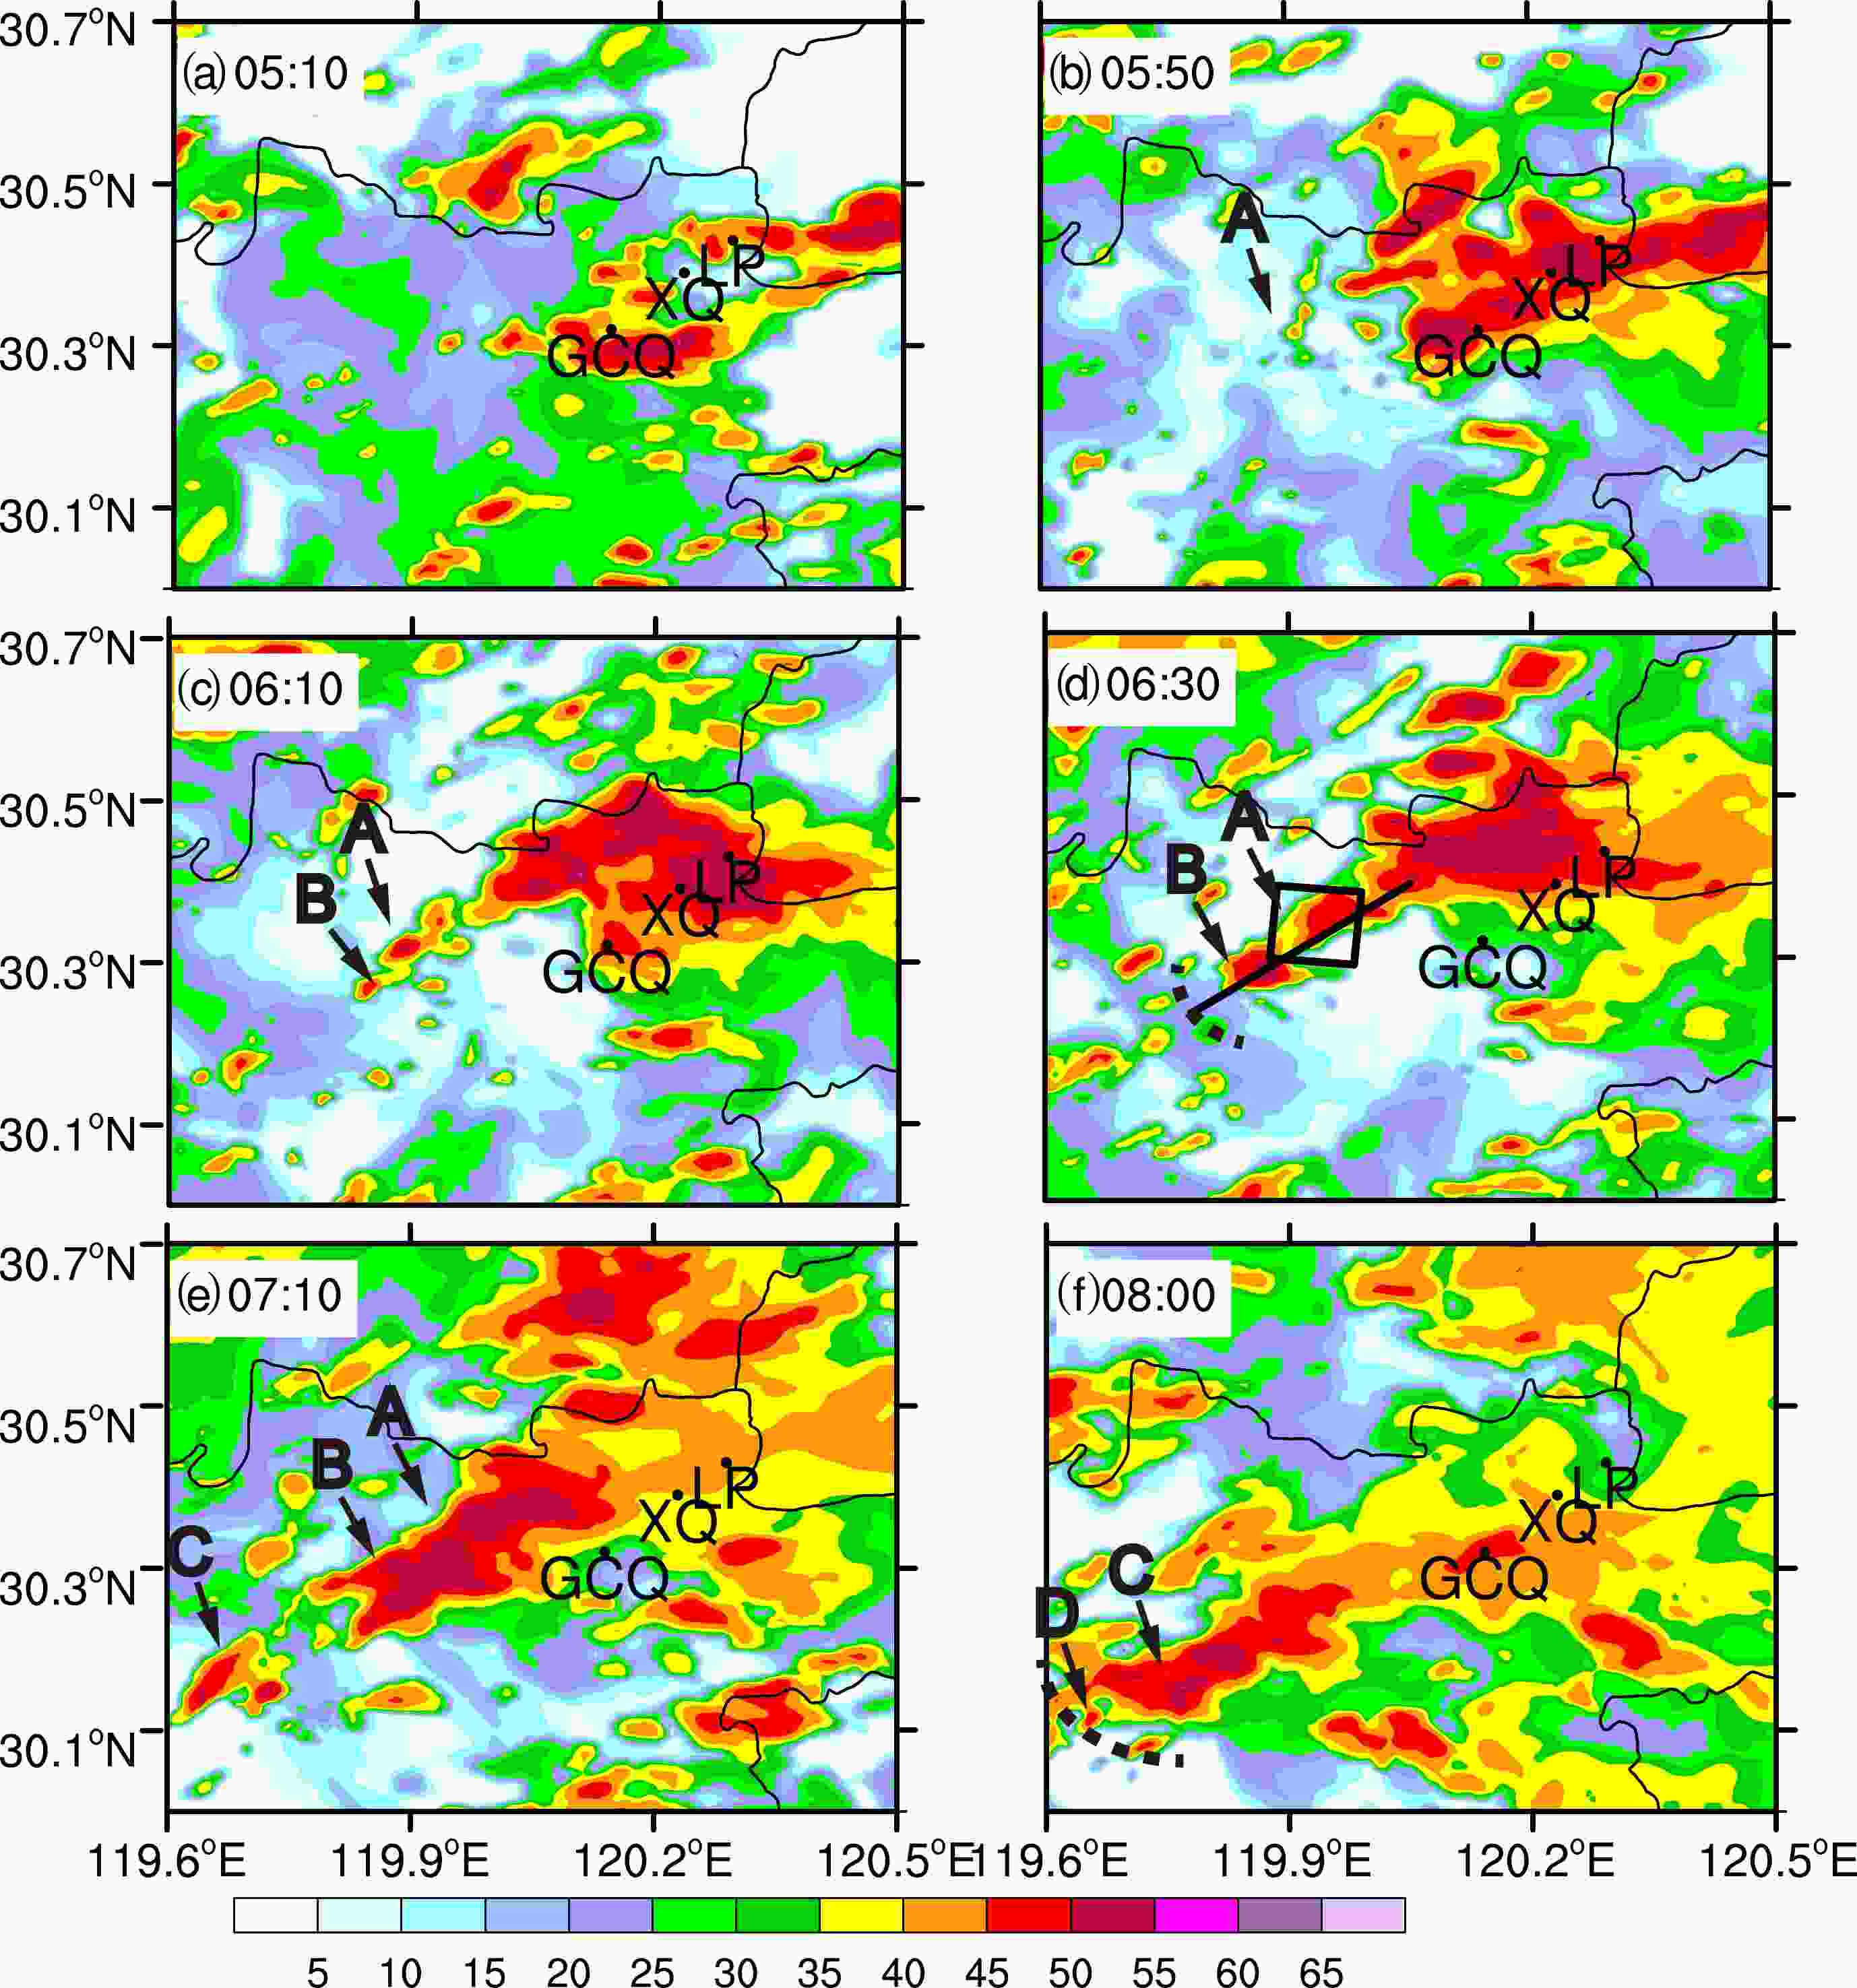
Figure 7. As in Fig. 2 but for the control simulation of the 1-km grid. The simulated convective cells are denoted by A, B, C and D. The black dashed line denotes the gust front, which was simply defined by the wind field. The black rectangle in (d) denotes the region used to calculate precipitation efficiency and lateral water vapor flux. The black line in (d) denotes the location of the cross-section shown in Figs. 10 and 11.
-
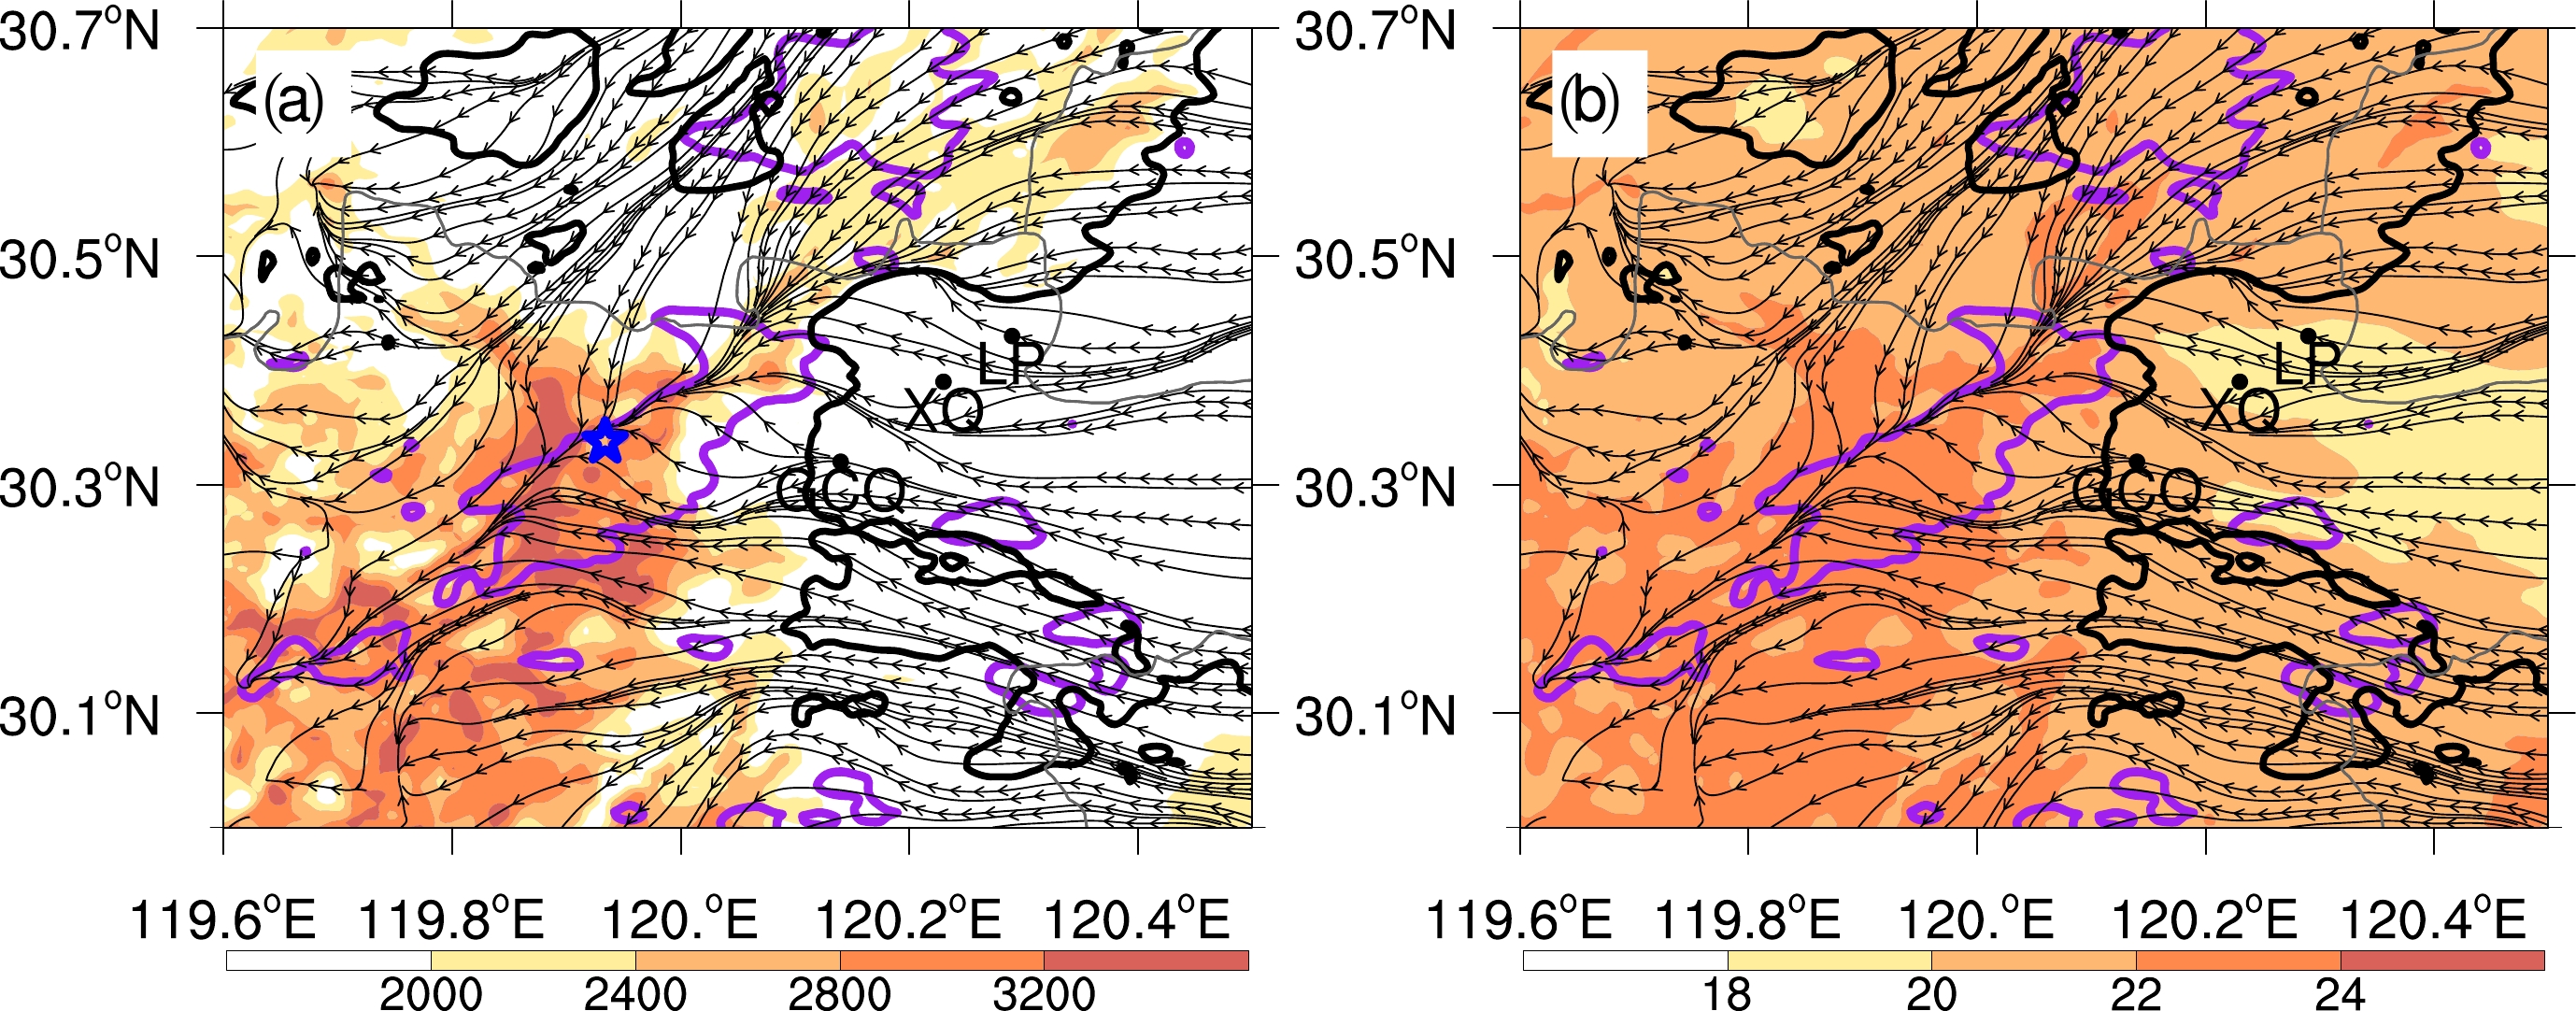
Figure 8 shows surface features including streamlines, cold pool outflow boundaries, composite reflectivity, convective available potential energy (CAPE), and water vapor mixing ratio at 0540 UTC, about 10 min prior to when cell A formed (c.f., Fig. 7b). The cold pool boundary is defined where the perturbation potential temperature (
$ {\theta }'_{e} $ ) is −1 K, and$ {\theta }'_{e}{{}} $ is defined as the departure from the domain-average of$ {\theta }_{e} $ (Dawson II et al., 2010). The average domain is the whole domain 4. Figure 8 shows that the arc-shaped convectively generated cold pool is located east of the high CAPE region. The CAPE in the region of interest is over 3200 J kg−1. The near-surface water vapor mixing ratio (Fig. 8b) in the back-building formation region is over 22 g kg−1. The level of free convection (LFC) is mostly lower than 600 m, so air parcels can be easily lifted to their LFC, especially in the presence of convergence forcing. Besides, convective inhibition (CIN) is nearly zero. The large CAPE, weak CIN, and low LFC provide favorable conditions for convective initiations and production of heavy rainfall. The radar reflectivity shows that the storms develop along the convergence line having high CAPE and low LFC. As shown in Fig. 7, this convective line is comprised of cells A–D, which are initiated one by one starting from northeast to southwest along the convergence line. As the cold pool extends southwestward, lifting at the gust front and convergence line intercept point initiates new convection.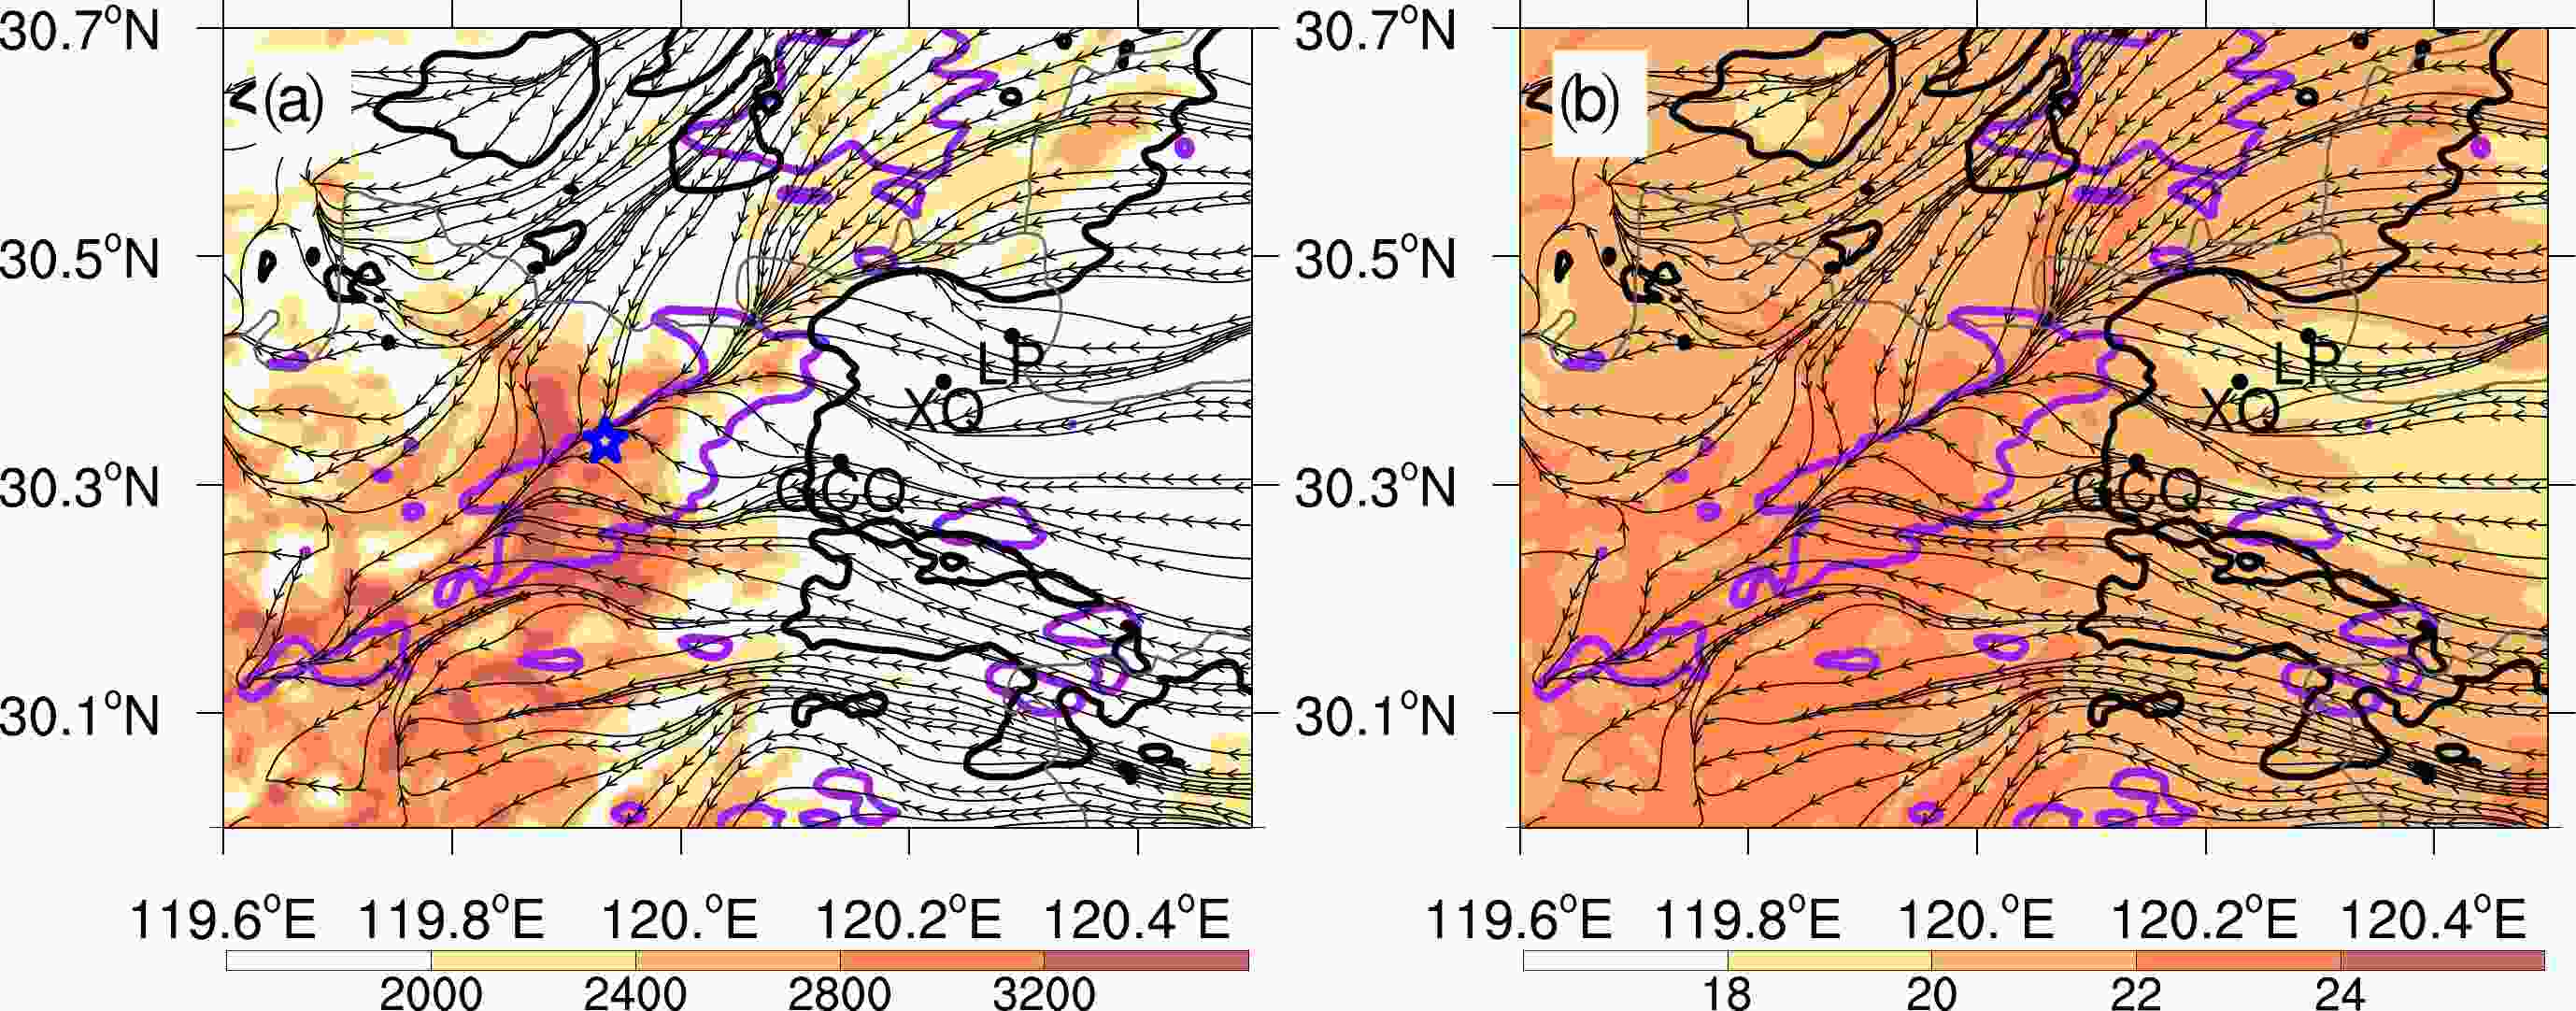
Figure 8. Surface potential temperature perturbation of −1 K (black contours, indicating the cold pool edge), and streamlines at 0540 UTC. The shading in (a) shows the CAPE (units: J kg −1), and in (b) the water vapor mixing ratio (units: g kg−1) at 0540 UTC. The purple contours are the 45-dBZ composite radar reflectivity at 0720 UTC. The blue star in (a) indicates the location of the extracted sounding shown in Fig. 9.
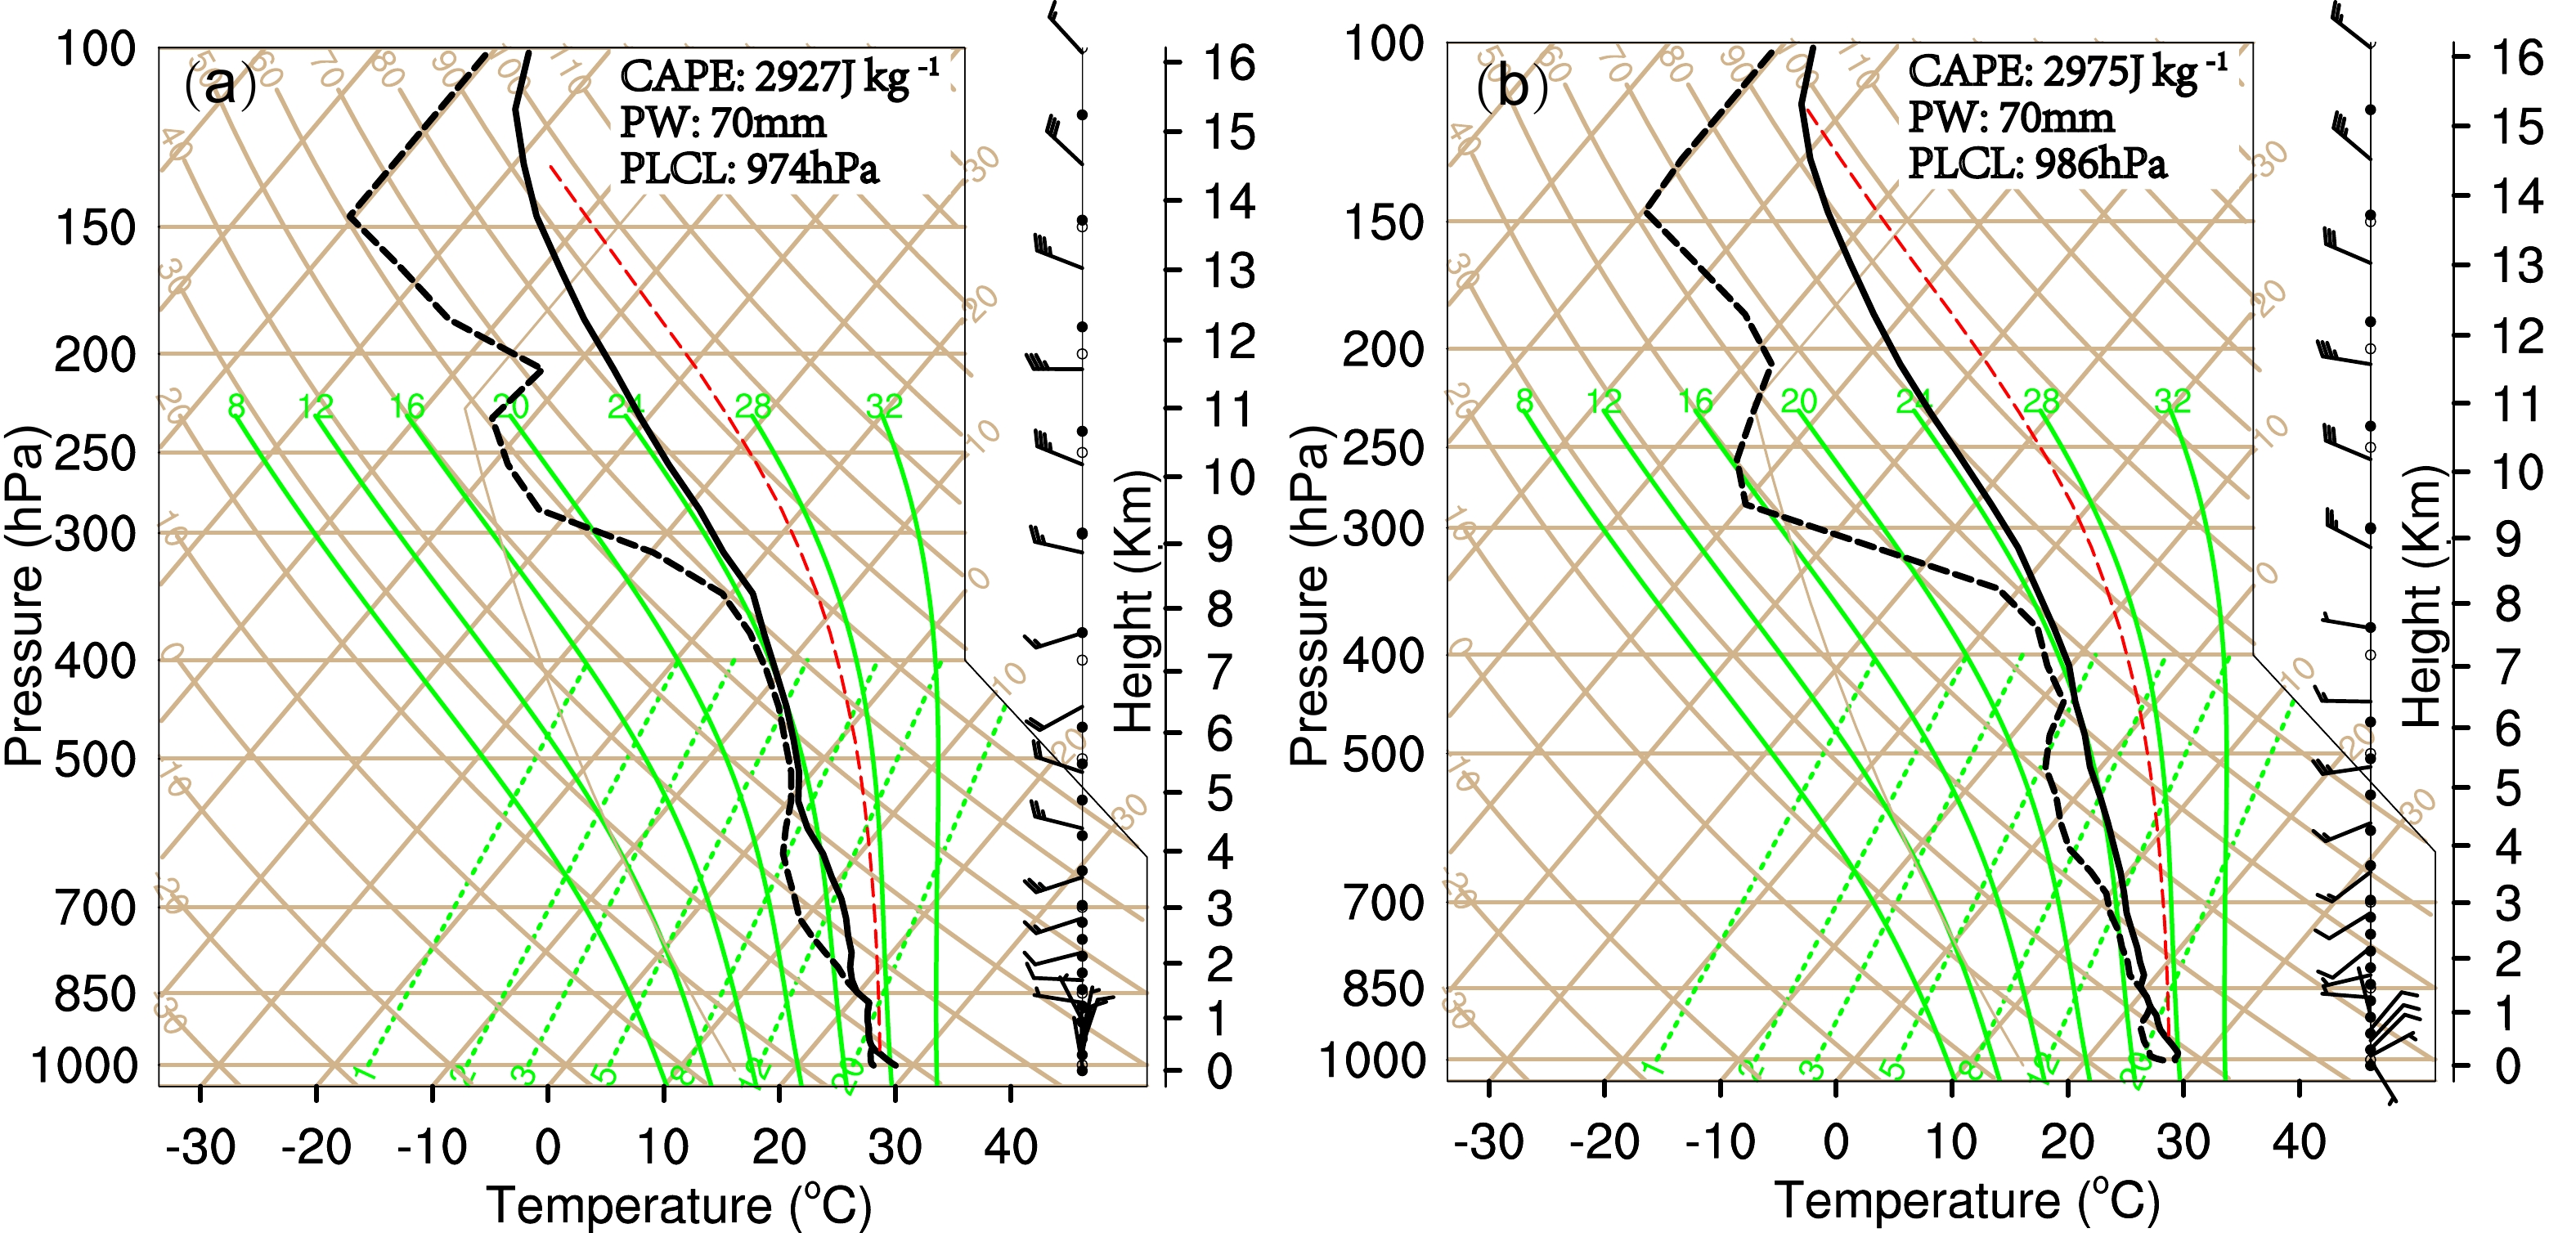
To see how the environment changes near and upstream of the convection initiation location, skew-T diagrams for soundings extracted from the blue star location in Fig. 8a are shown in Fig. 9. The sounding at 0440 UTC (Fig. 9a), which is an hour before the back-building process occurred, shows a moist low-level environment with large CAPE (2927 J kg−1) and a low LCL (at 974 hPa). The flow is mostly northerly below 1.5 km but changes to westerly to southeasterly above. An hour later, the flow below 1.5 km turns to mostly easterly, which is mainly caused by the outflow from rainband 1. The low-level air is still very moist, with the mixing ratio exceeding 20 g kg−1, and the total precipitable water is 70 mm. The CAPE increases to 2975 J kg−1 and the LCL becomes lower at 986 hPa, and thus it does not take much lifting for convection to initiate.
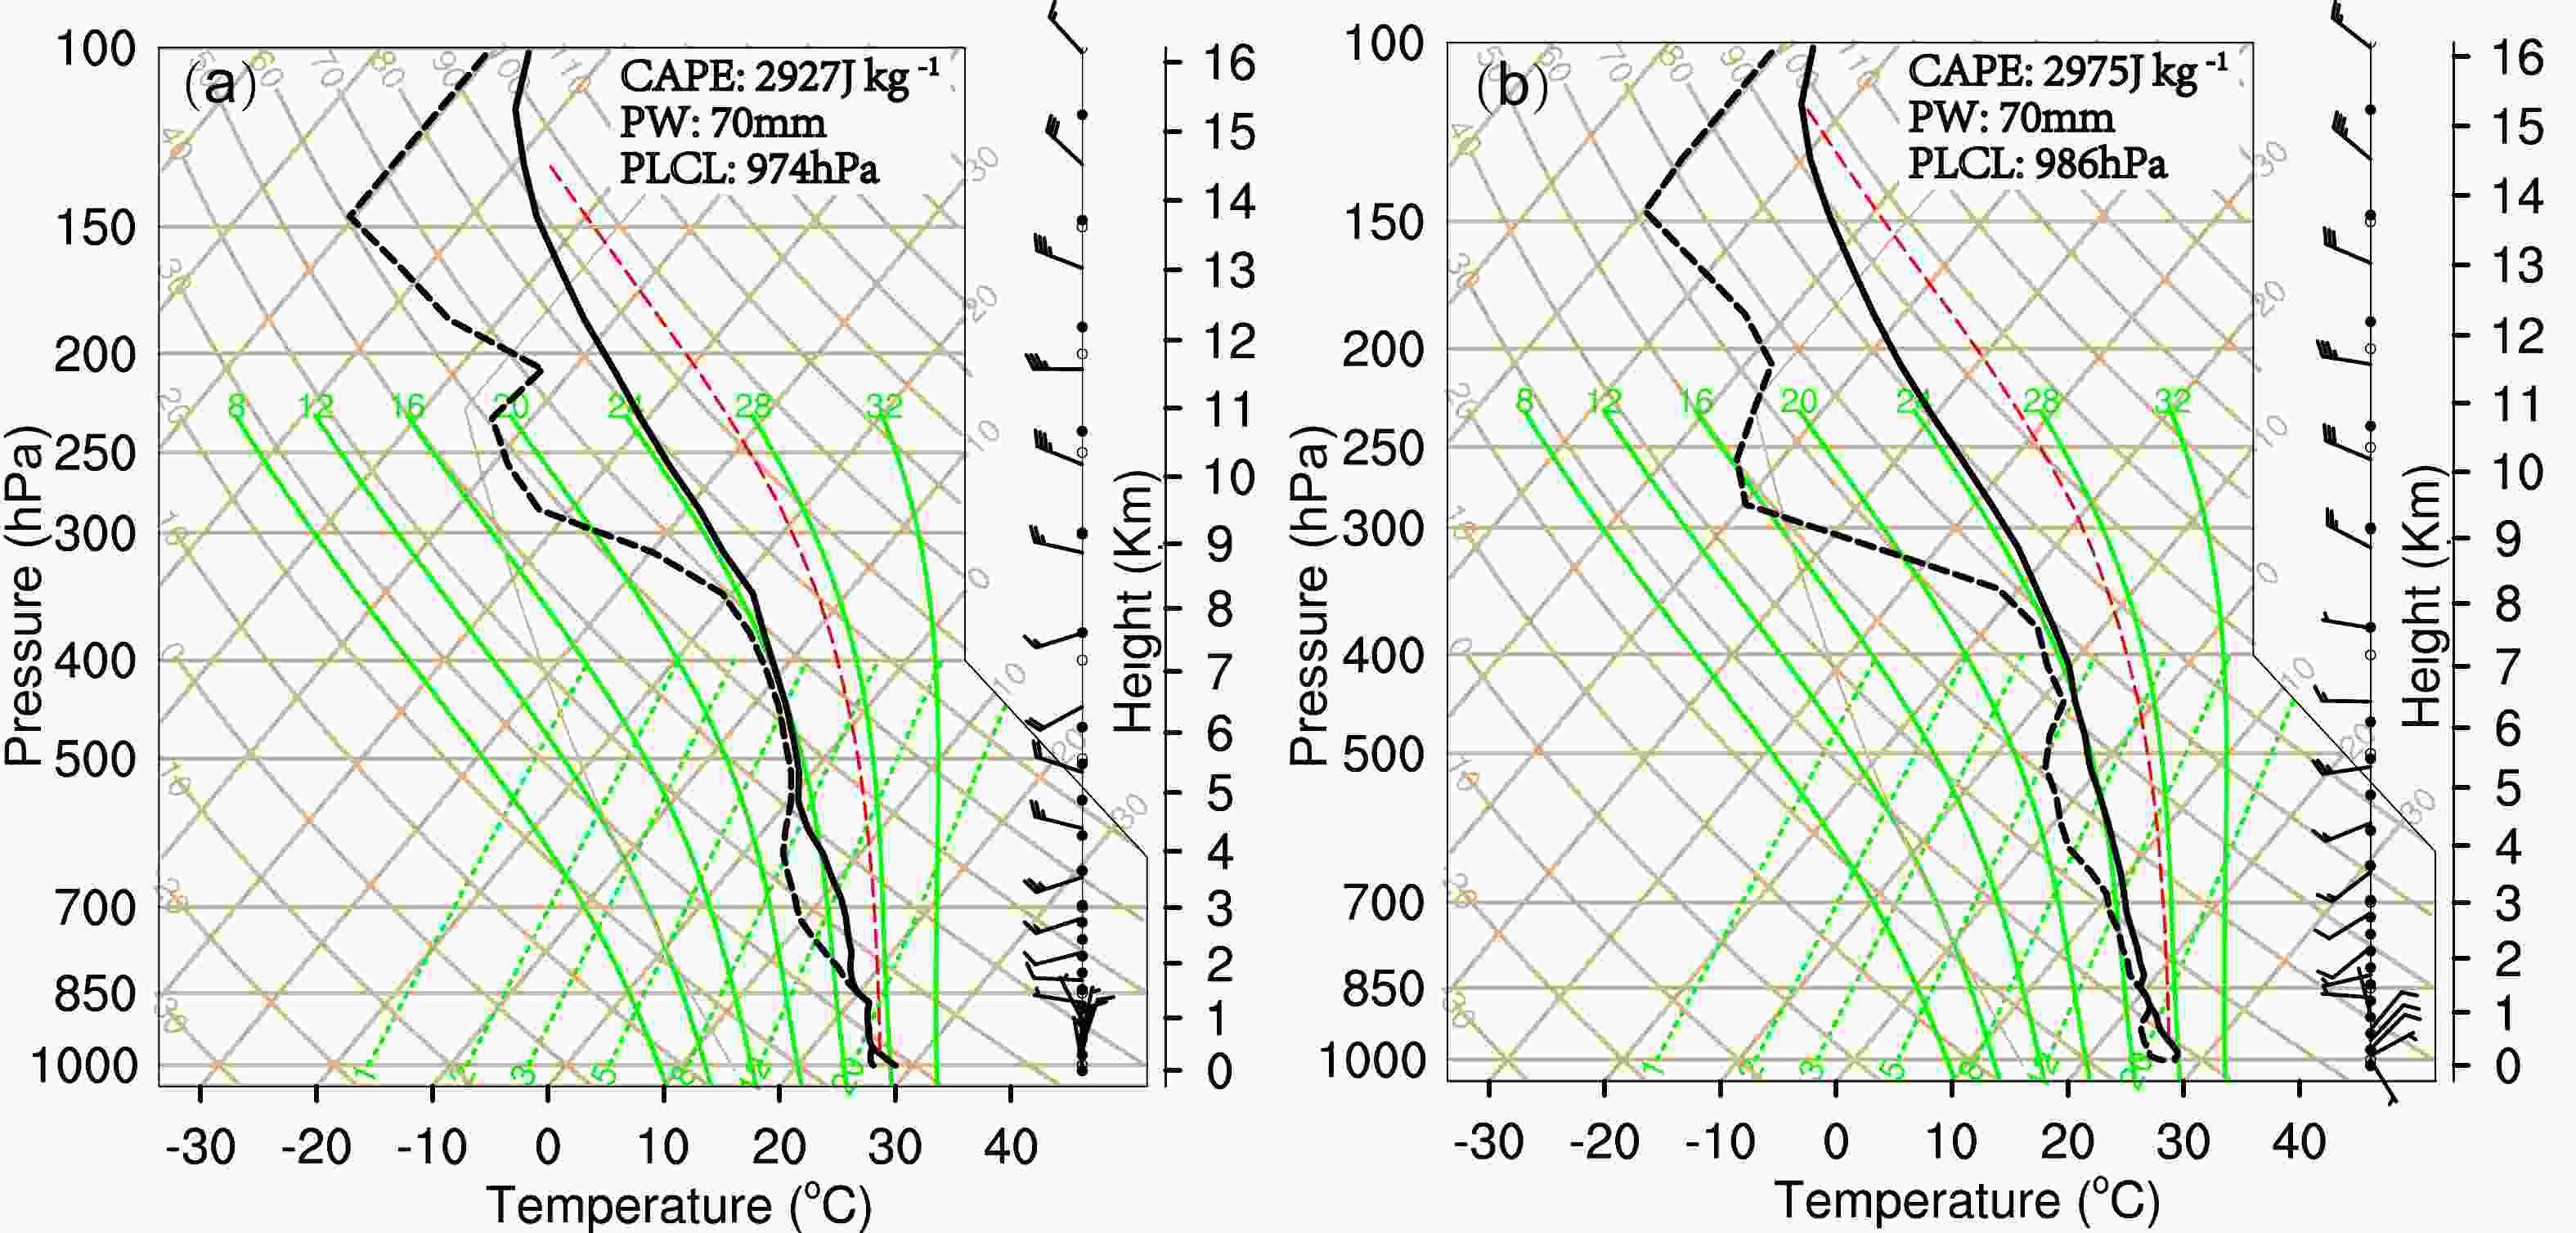
Figure 9. Sounding extracted from the simulation at (a) 0440 UTC and (b) 0540 UTC, at the location of the blue star in Fig. 8a. PW is the abbreviation for Precipitable Water; PLCL is the abbreviation for Pressure of the lifting condensation level.
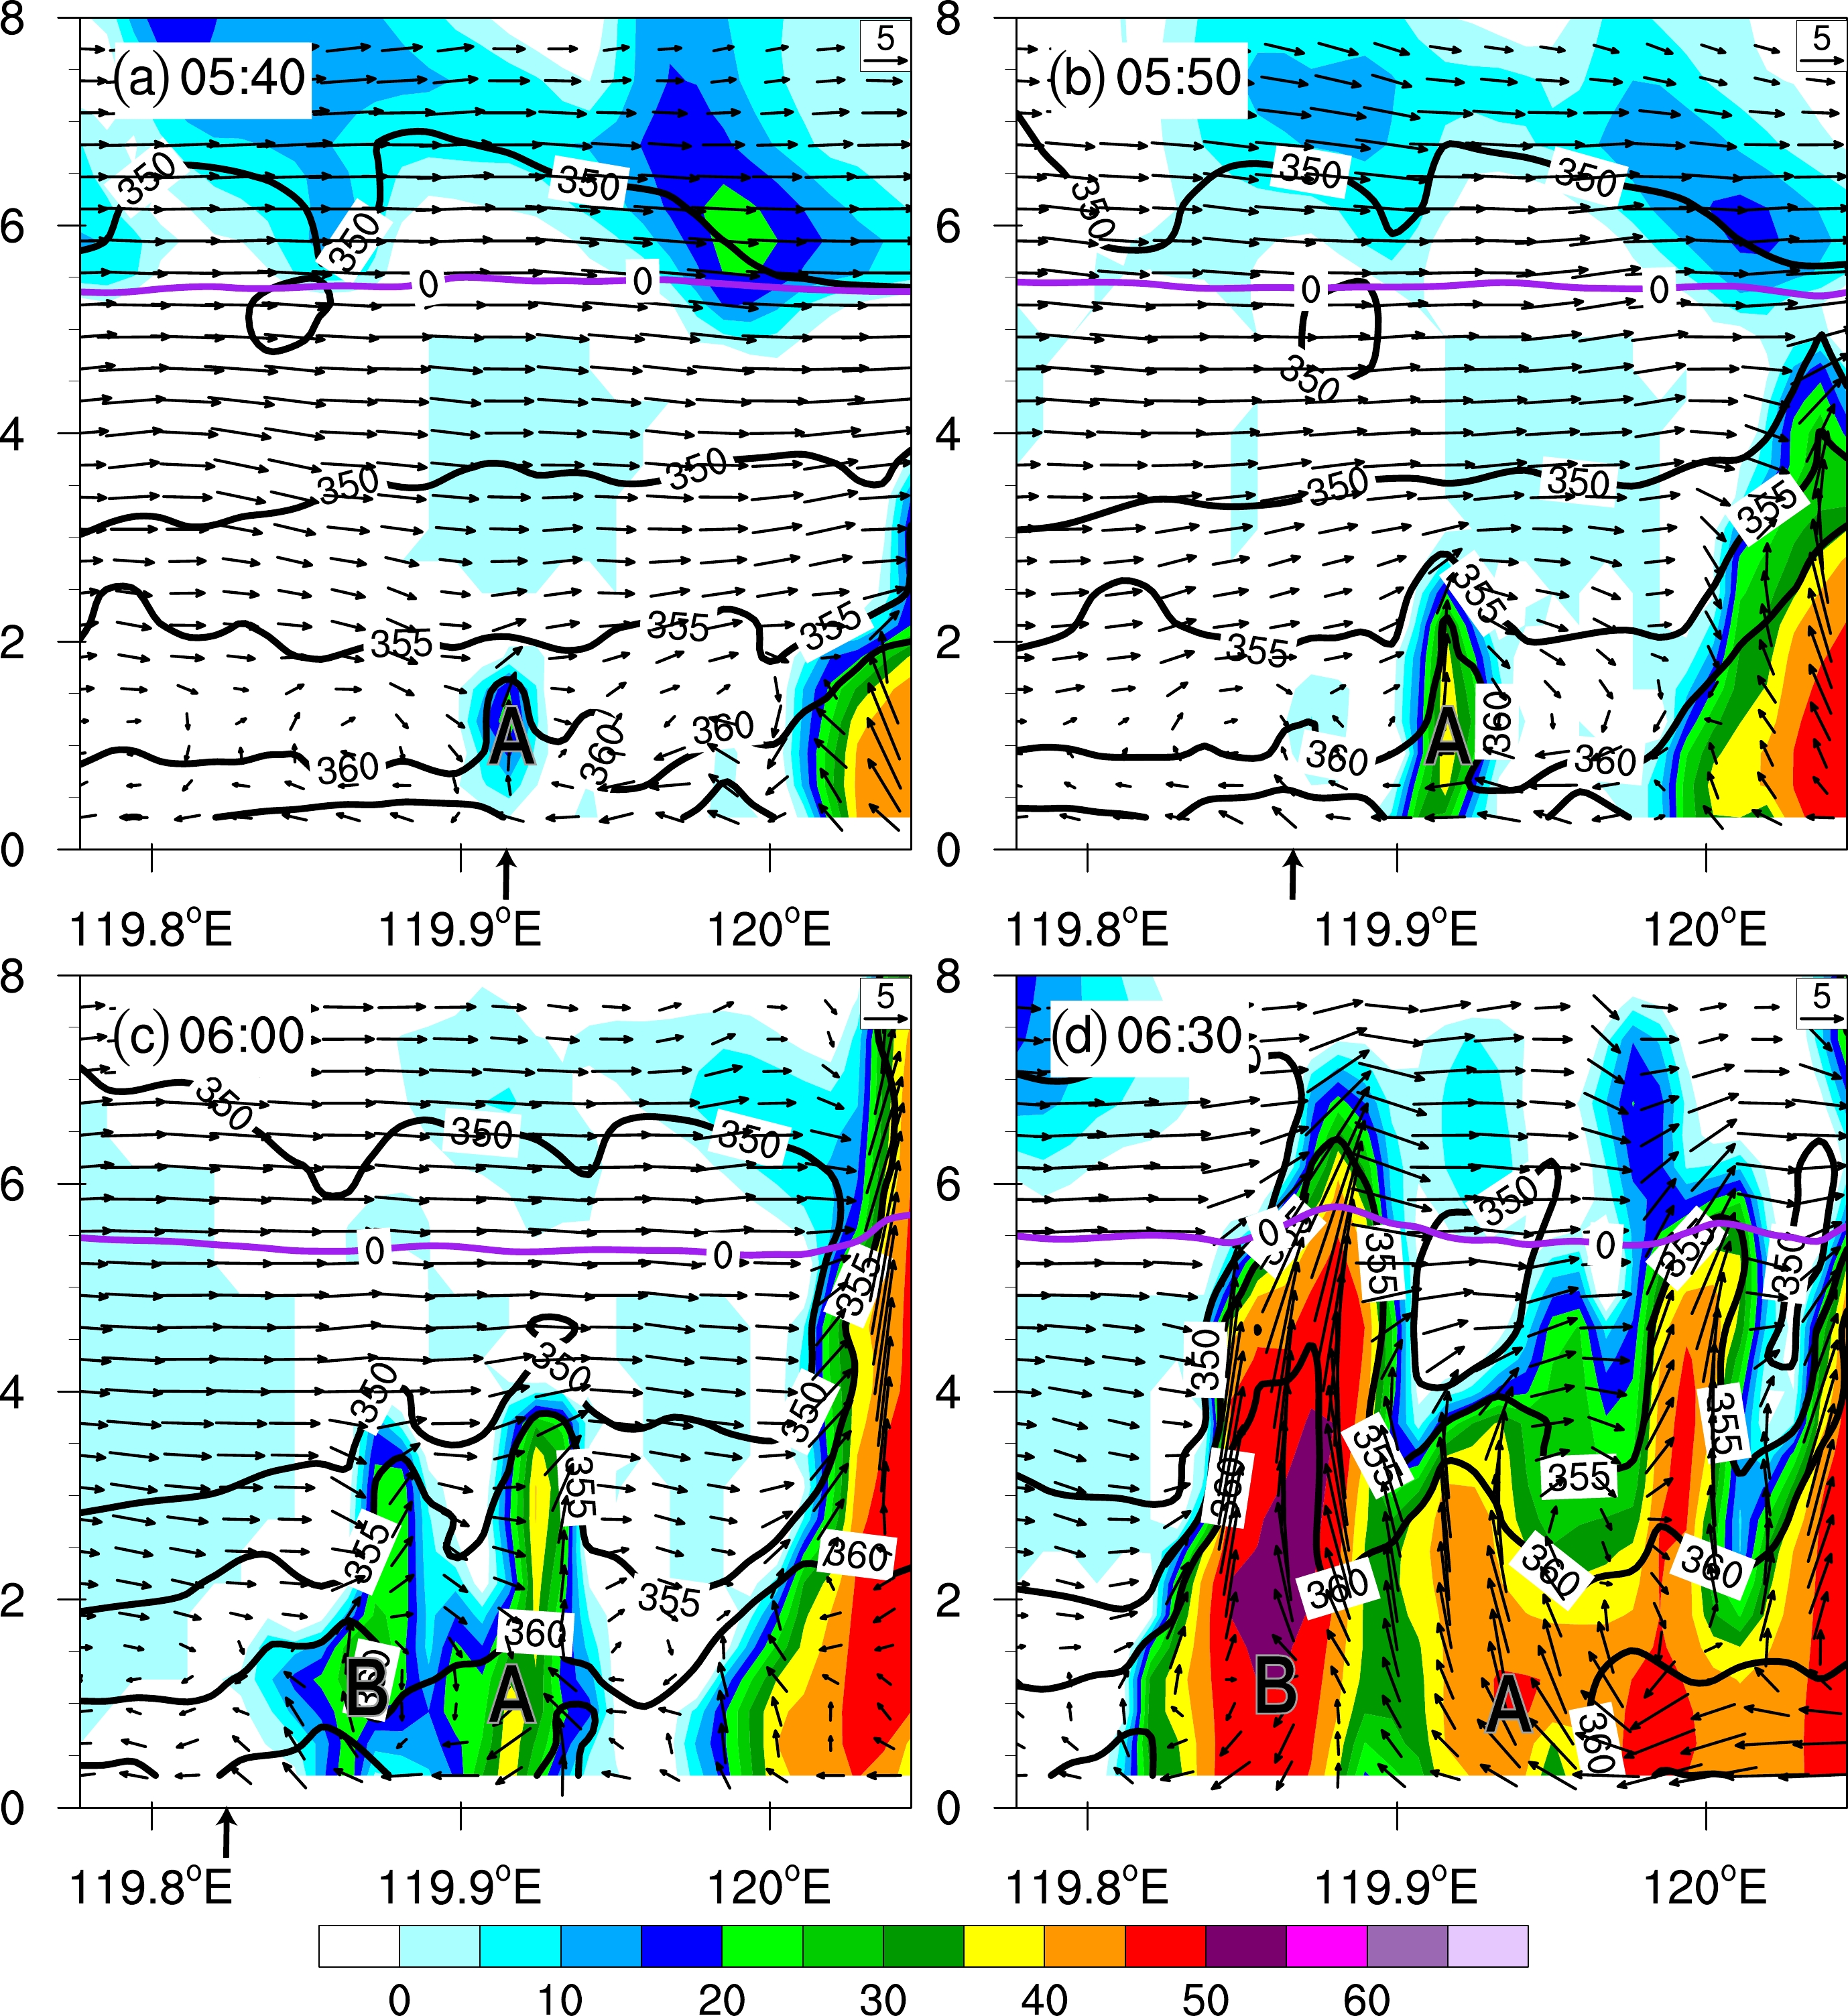
To visualize the initiation process more clearly, we plot vertical cross sections across cells A and B through their initiation and development stages in Figs. 10 and 11 (see Fig. 7d for location). As shown in Figs. 3 and 7 (horizontal dBZ), this back-building convective line consists of some discrete echo centers, suggesting a multicell storm. In Figs. 10a and 11a, at 0540 UTC, there is enhanced northeasterly flow (from right to left in the cross sections) near the surface with origination from the convection near the right edge of the cross section (which is part of rainband 1). Clouds have developed with cloud water reaching 1.8 km (Fig. 11a) at the leading edge of the enhanced surface flow or the gust front, with weak reflectivity forming at around the 1-km level (Fig. 10a). Vertical velocity is evident at the location of clouds. This is the beginning of cell A.

Figure 10. Vertical cross-sections along the line in Fig. 7d of simulated radar reflectivity (shaded; units: dBZ), equivalent potential temperature
$ {\theta }_{e} $ (black contours at 4 K intervals), 0°C temperature (purple contours), and in-plane wind vectors with vertical velocity amplified by a factor of 3. The upward arrows below the panels denote the location of the gust front.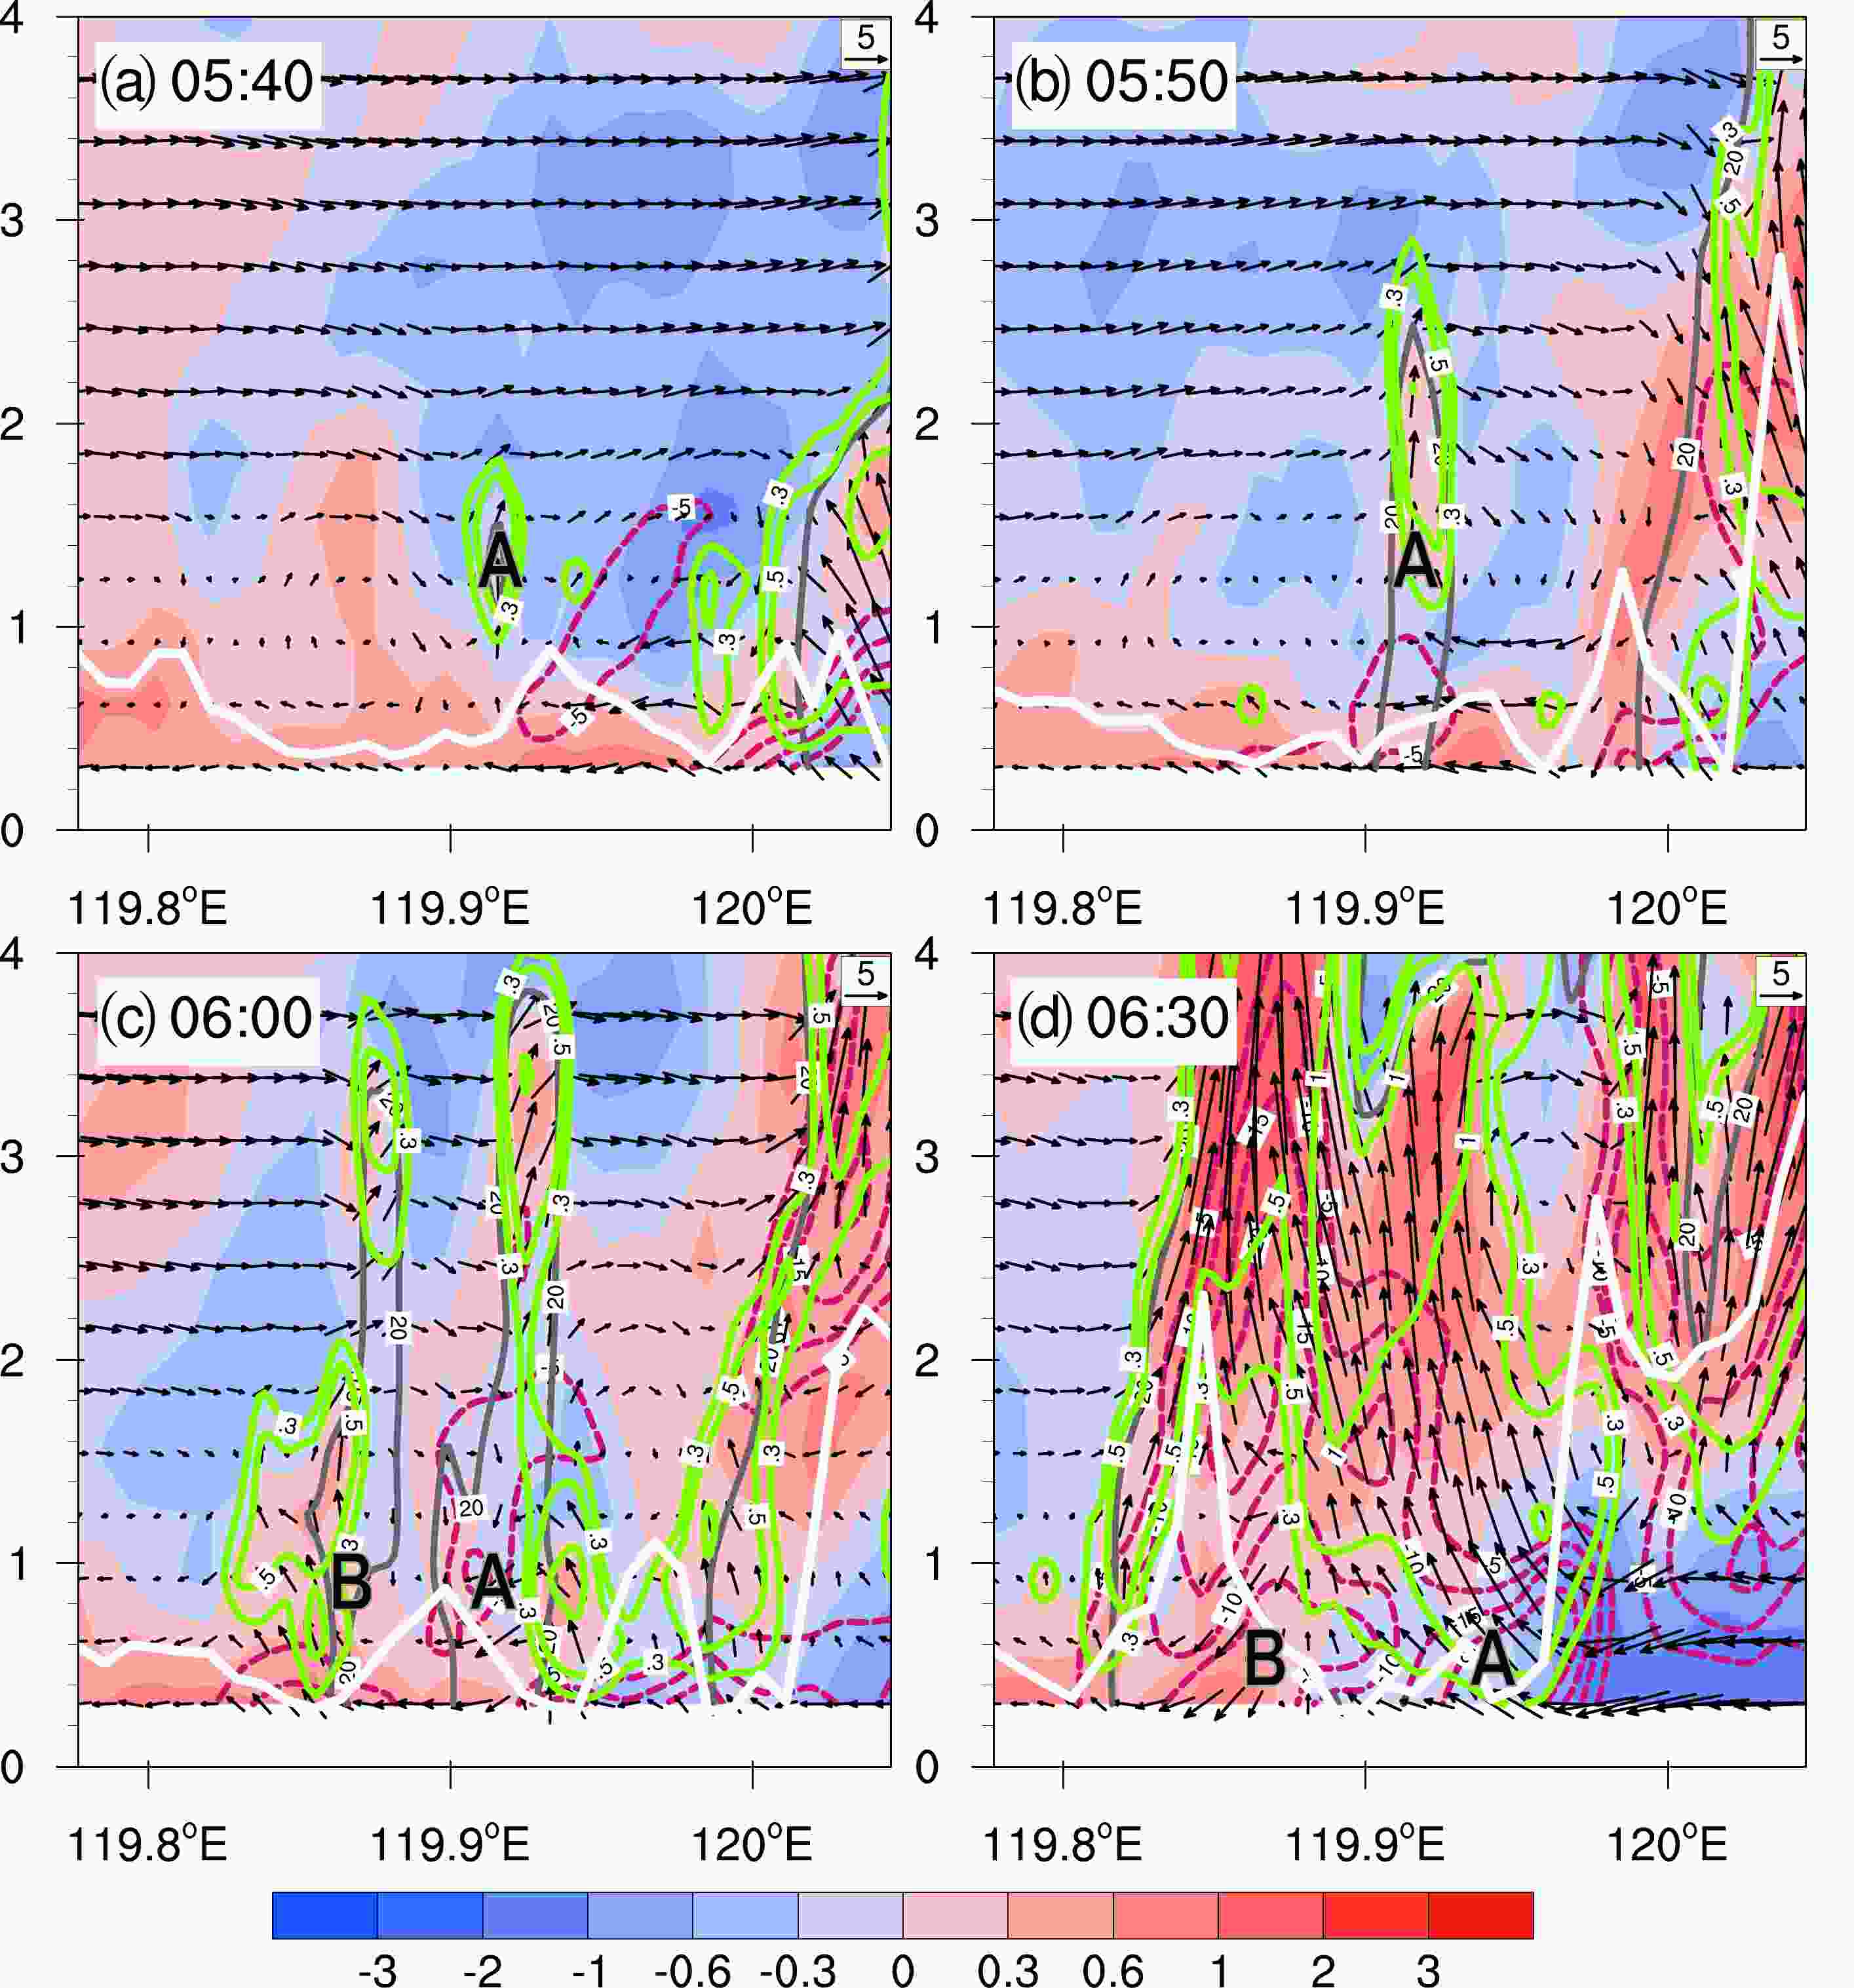
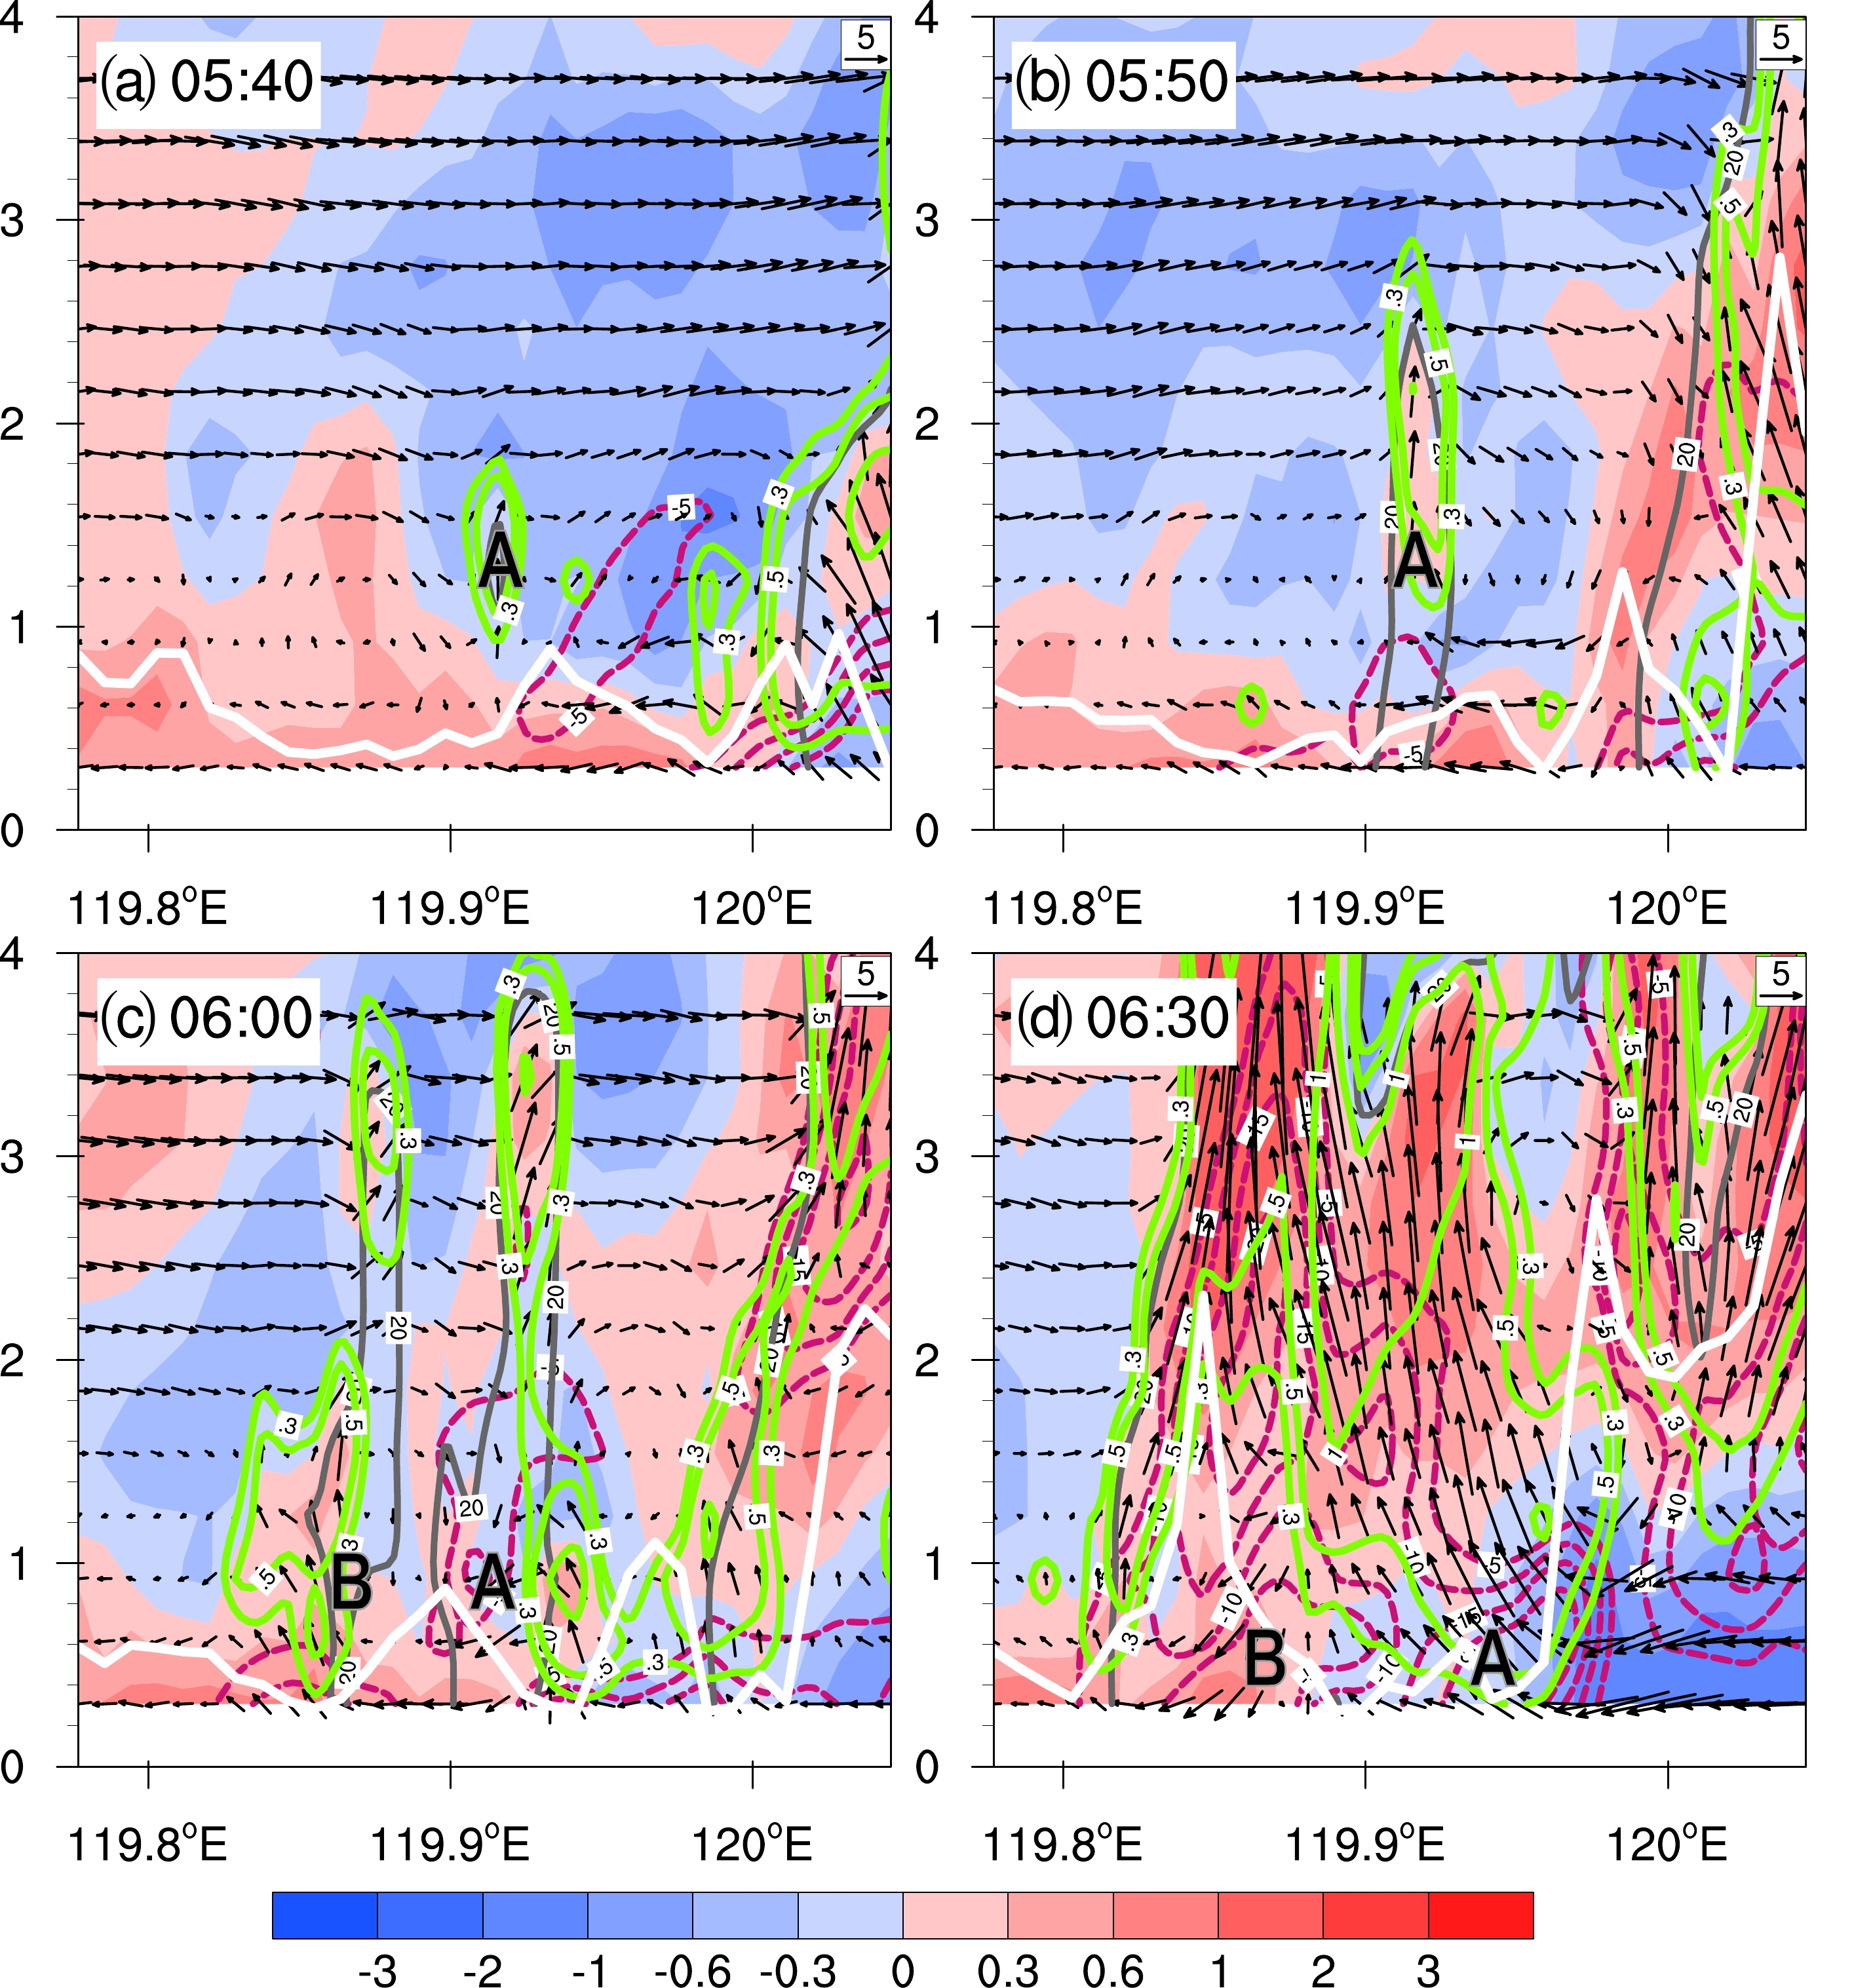
Figure 11. Vertical cross-sections along the line in Fig. 7d of potential temperature perturbation (shaded; units: K), cloud water (contoured in green at 0.3, 0.5, 1 g kg−1), horizontal divergence (contoured in purple starting at −5 × 10⁻⁴ s−1, at intervals of 5 × 10⁻⁴ s−1), 20-dBZ composite radar reflectivity (gray contours), LFC (white line; units: m), and in-plane wind vectors with vertical velocity amplified by a factor of 3.
Over the next 10 min, by 0550 UTC, the clouds of cell A have reached the 2.8-km level (Fig. 11b), while precipitation has reached the ground, based on the reflectivity (Fig. 10b). The outflow of cell A combined with the old gust front increases the westerly winds near the surface and pushes the surface gust front upstream (in terms of upper-level flow) to the location marked in Fig. 10b. At this time, there is a small blob of cloud water at the level of ~600 m at the location of the gust front, which corresponds to very weak reflectivity at the same location in Fig. 10b. This is the very beginning of cell B. At the location of cell B, the LFC is also very low (Fig. 11b).
Over the next 10 min, cell A further develops, with the clouds and reflectivity reaching nearly the 4-km level (Figs. 10c, 11c), and the cell moves northeastward slightly owing to mid-level flow advection. The new cell B upstream of cell A has developed significantly, with clouds and reflectivity reaching the 3.7-km level. The gust front has moved further upstream to the left of cell B in the cross section. Over the next 30 min, by 0630 UTC, the strength of the cold pool increases. The depth of the cold pool is now over 1 km. Cell A becomes broader and maintains its echo top height at about 4 km, and becomes connected with convection to its northeast (Figs. 10d and 11d). Cell B has greatly intensified, its echo top has reached above 7 km, and the maximum reflectivity reaches 55 dBZ. Most of the strong echo remains below the freezing level (Fig. 10d), suggesting the precipitation is dominated by warm rain processes, as many heavy-precipitation MCSs in the warm season of China are (e.g., Huang et al., 2019).
Due to the vertical wind shear, the convective cells tilt slightly towards the northeast, and both cells also move slightly towards the northeast (Fig. 10). As cells A and B mature, the surface cold pool spreads further upstream (southwestward), and later triggers cell C that forms further upstream (Fig. 7). The processes are similar to the gust-front pulsation mechanism described in Lin et al. (1998), who used an advection mechanism to explain how new cells regenerated at the gust front moved rearwards (relative to the low-level flow) in a multi-cell system. The near-surface convergence ahead of the gust front forced an updraft and developed into a convective cell in their study. However, the environmental conditions in our case are different to those in Lin et al. (1998). In our case, the gust front produced by earlier convective cells propagates upstream (relative to mid-level flows), and triggers new convective cells that subsequently move downstream, producing heavy precipitation given favorable thermodynamic conditions. This is the typical back-building process.
-
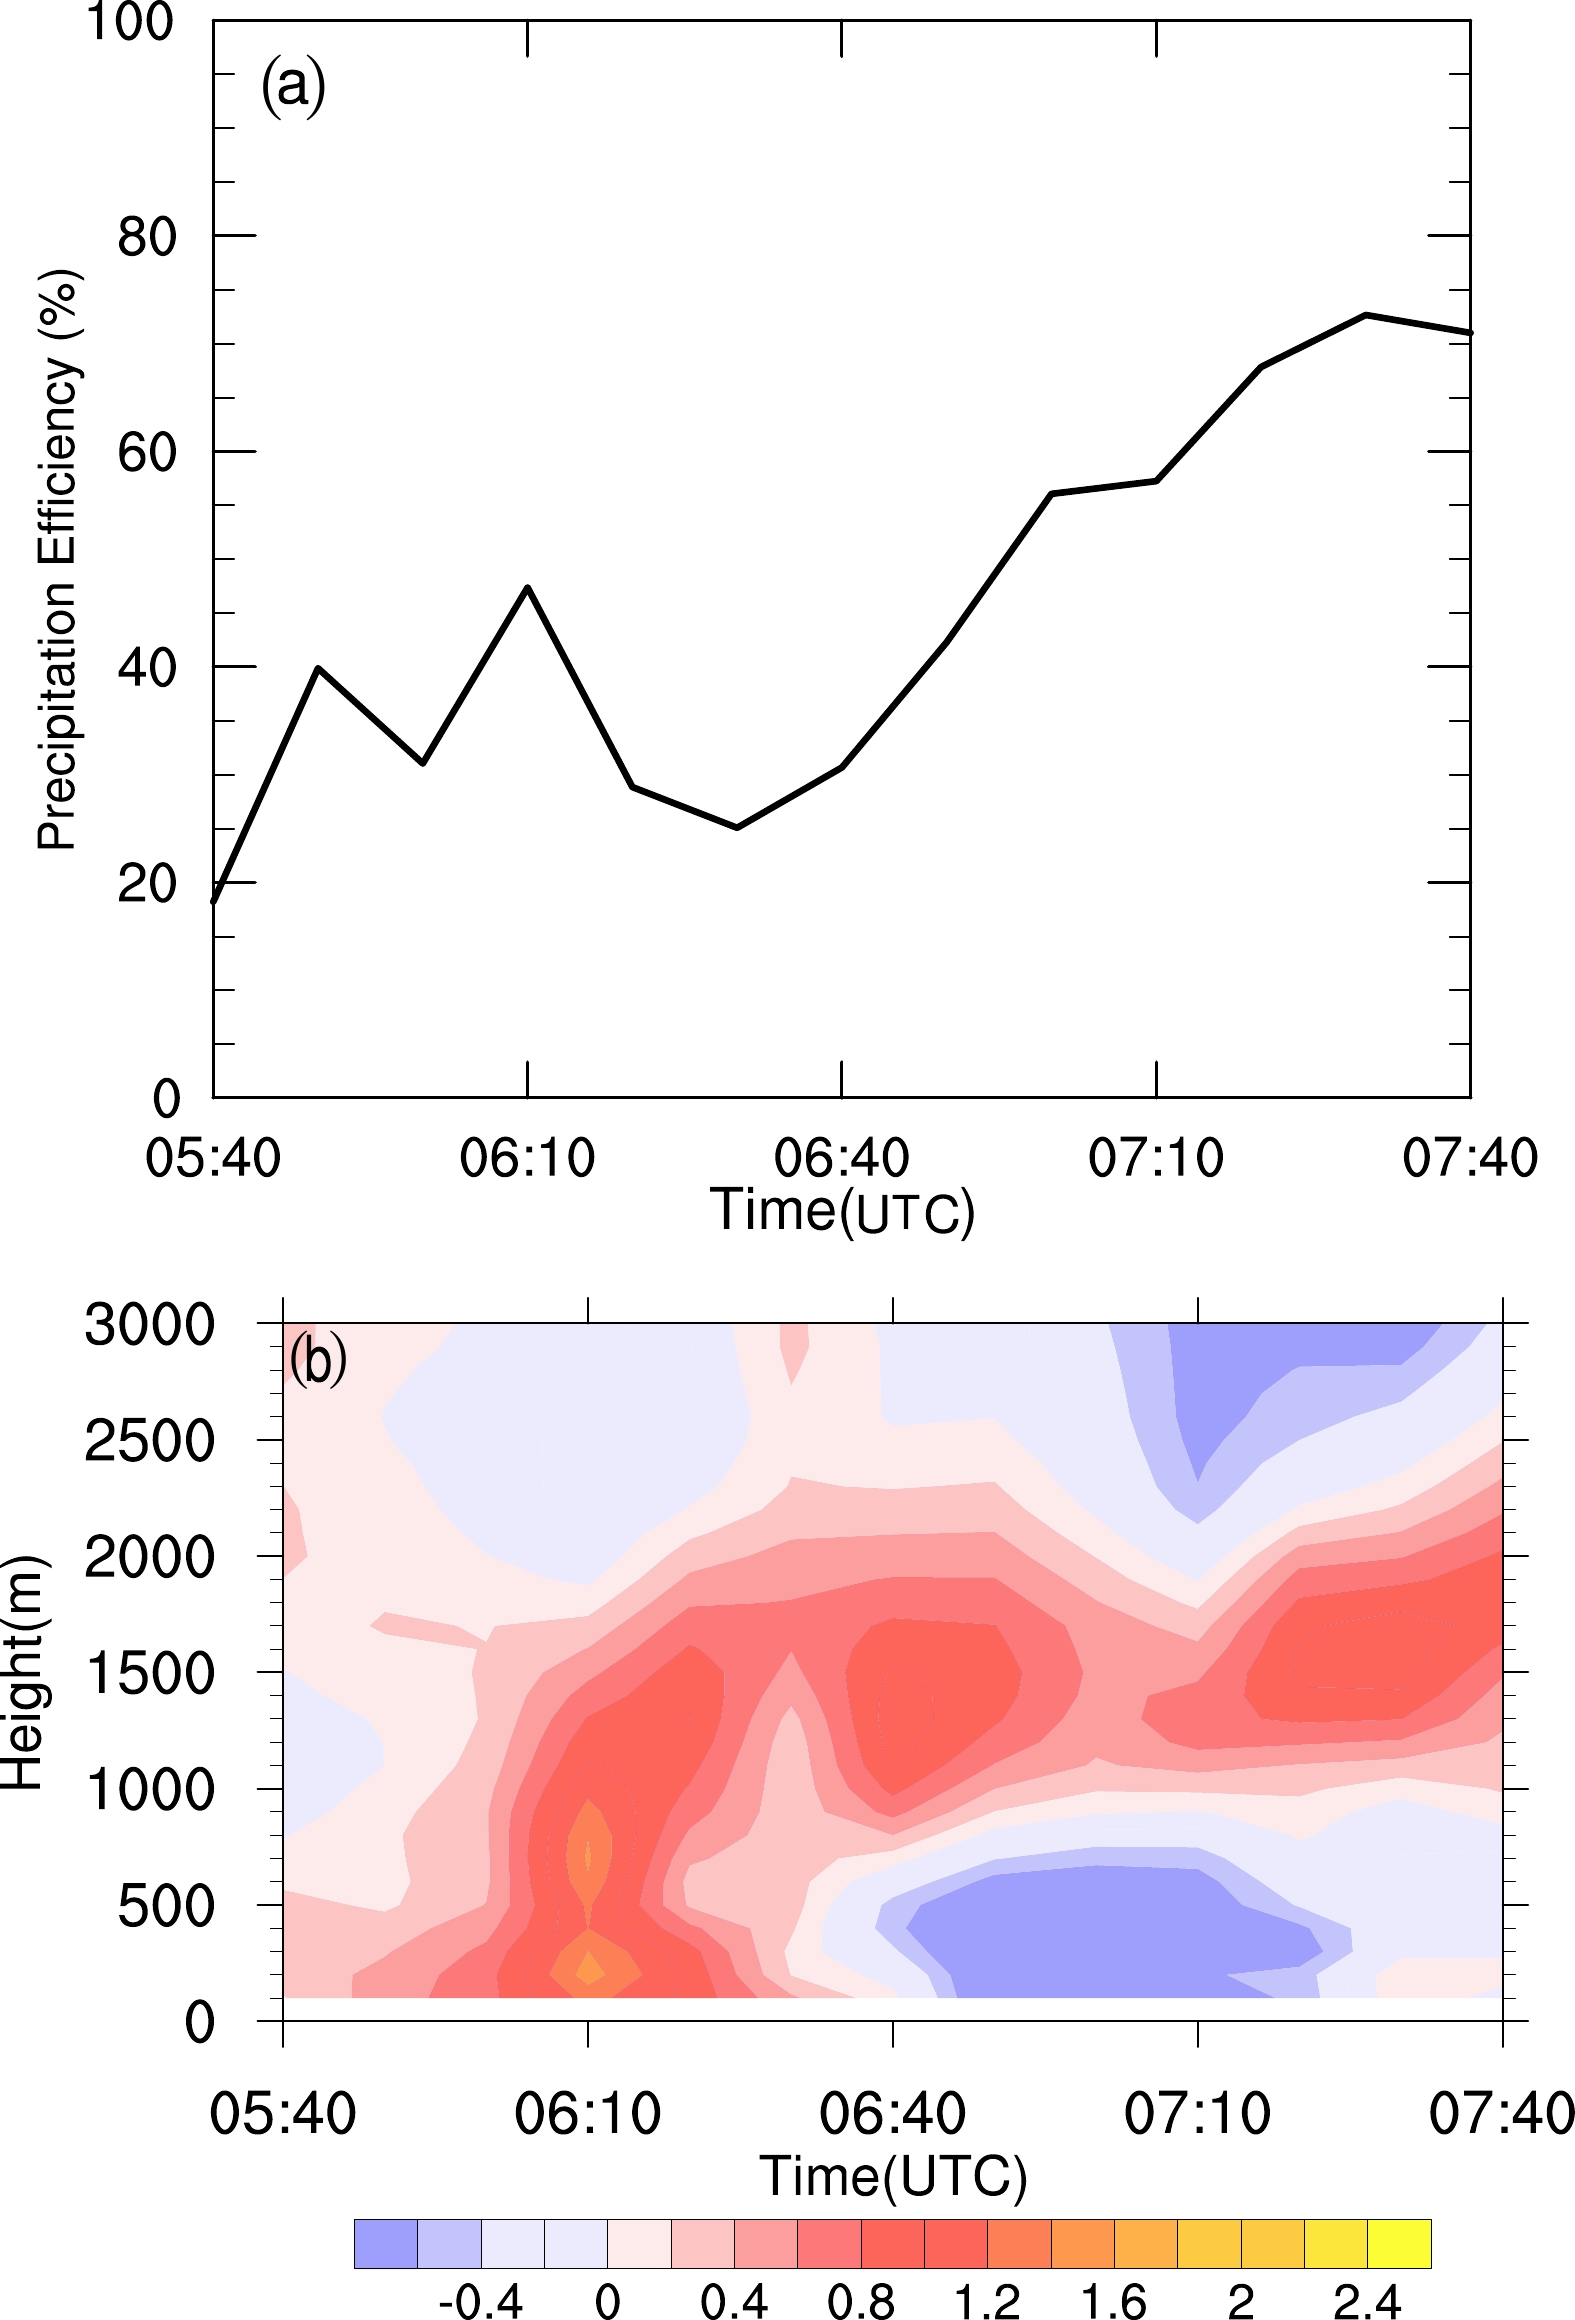
Because this case produces extreme precipitation rates of more than 20 mm over 10 min (c.f., Fig. 1) and most strong echoes are below the 0° isotherm (Fig. 10), how the low top convective cells produce such extreme rainfall is a question worth investigating. How high is the precipitation efficiency of these cells? Huang et al. (2014) found that high rainfall rates usually correspond to high precipitation efficiency. Figure 12a shows the precipitation efficiency during the back-building process, following the calculations of Sui et al. (2007) and Huang et al. (2014). They defined the cloud microphysical precipitation efficiency as PE = P/CondT, where P is the time-averaged and volumetrically integrated amount of total precipitation flux, and CondT is the total condensation and deposition, which can be decomposed into the vapor deposition rates for the growth of cloud ice, snow and graupel, the vapor condensation rate, and the local hydrometeor change and hydrometeor convergence.
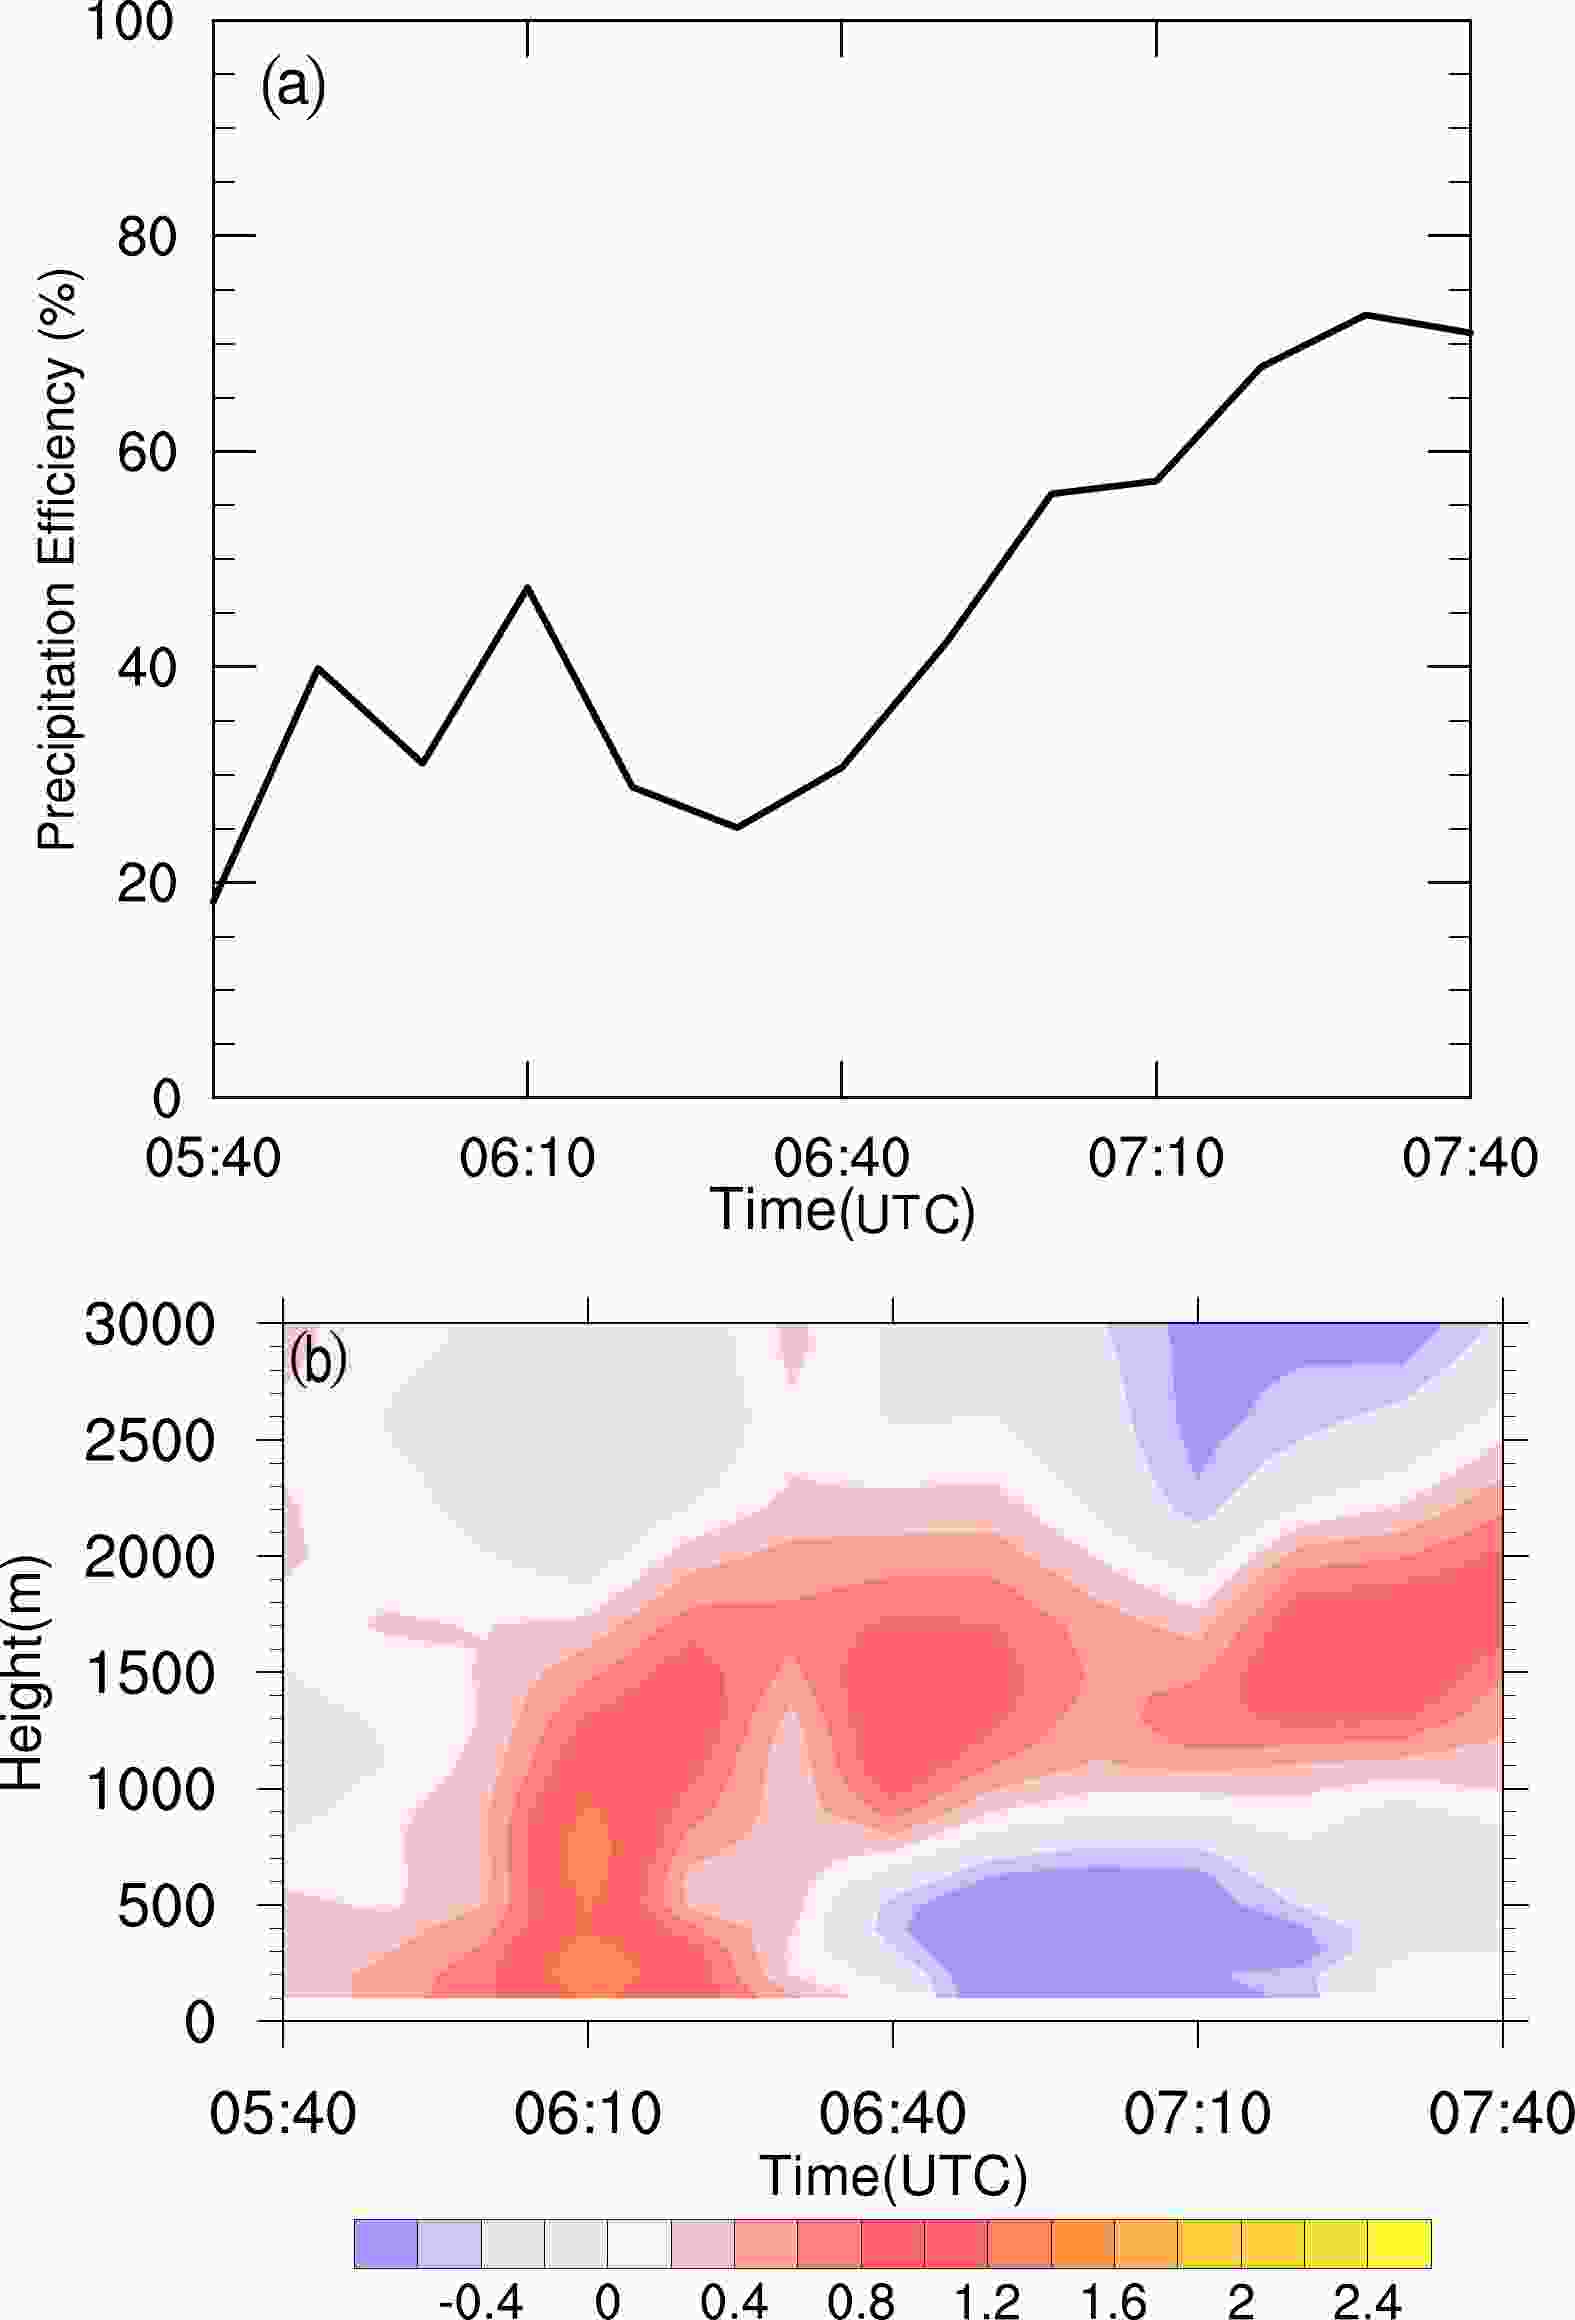
Figure 12. (a) Time series of precipitation efficiency and (b) time–height plot of lateral water vapor flux (10−6 kg s−1) from 0540 to 0740 UTC.
To understand the evolution of one cell along the back-building convective line, we focus on cell A and check its precipitation efficiency during its lifetime. For the seldom movement of cell A from 0540 to 0740 UTC, we choose a 10 km × 10 km region (black box shown in Fig. 7d) to represent the cell A region. The time series of precipitation efficiency (Fig. 12a) shows that, at the onset stage of cell A, the precipitation efficiency is about 20%–40%. During its mature period, the precipitation efficiency can reach 80%. From Fig. 7 and Fig. 10d, cell A does not develop much deeper (below 4 km) but becomes broader and begins to weaken at 0630 UTC. In the meantime, both P and CondT have decreased. The decrease in CondT is greater than that in P, and thus there is an increase in precipitation efficiency. Though the cells are not very deep, the precipitation efficiency is high enough to produce extreme rainfall. The high CAPE, very high low-level humidity, and the presence of mesoscale convergence should also contribute to the extreme rainfall.
The time–height plot of net water vapor flux into the black box shown in Fig. 7d surrounding the cell A region is shown in Fig. 12b. Large inward water vapor fluxes are found below 2 km at 0610 UTC. According to early figures, cell A is in its development stage at this time (Fig. 7c). Negative outward net flux at the low levels starts to appear at 0630 UTC. The main negative flux comes from the west boundary that is close to cell A. From 0630 UTC, cell B develops quickly (Fig. 10d), which might have drawn more air into itself and away from cell A. Development of the downdraft in cell A should have also contributed to the negative fluxes. Despite the negative water vapor fluxes at the low levels, large positive fluxes continue to exist between the levels of 1 and 2 km, and the precipitation efficiency becomes even higher.
-
To further confirm the role of the cold pool in the back-building process, we examine the results of experiment NOEVAP, which has the evaporative cooling turned off within the microphysics scheme. Figure 13 shows the evolution of the simulated radar reflectivity and surface streamlines. The composite reflectivity in panels (b) through (f) of Fig. 13 can be directly compared to those in panels (a) through (e) of the control experiment in Fig. 7. The quasi-stationary convective line corresponding to rainband 1 is still produced, and it moves southward somewhat away from the surface convergence line later on, but no sequential development of new cells further southwest along the convergence line as in the control experiment. Though previous studies have shown that a cold pool is not necessary to organize and maintain convection if large-scale conditions are suitable (Schumacher and Johnson, 2009; Peters and Schumacher, 2016), in experiment NOEVAP, the lack of a cold pool from earlier convection does influence the later evolution of the convective systems. This was also shown in Jeong et al. (2016), who suggested that evaporative cooling led to cold outflow that pushed convection progressively toward the oncoming flow. In our case, the lack of cold outflow prevents the redevelopment of new cells upstream of the gust front via back-building processes.
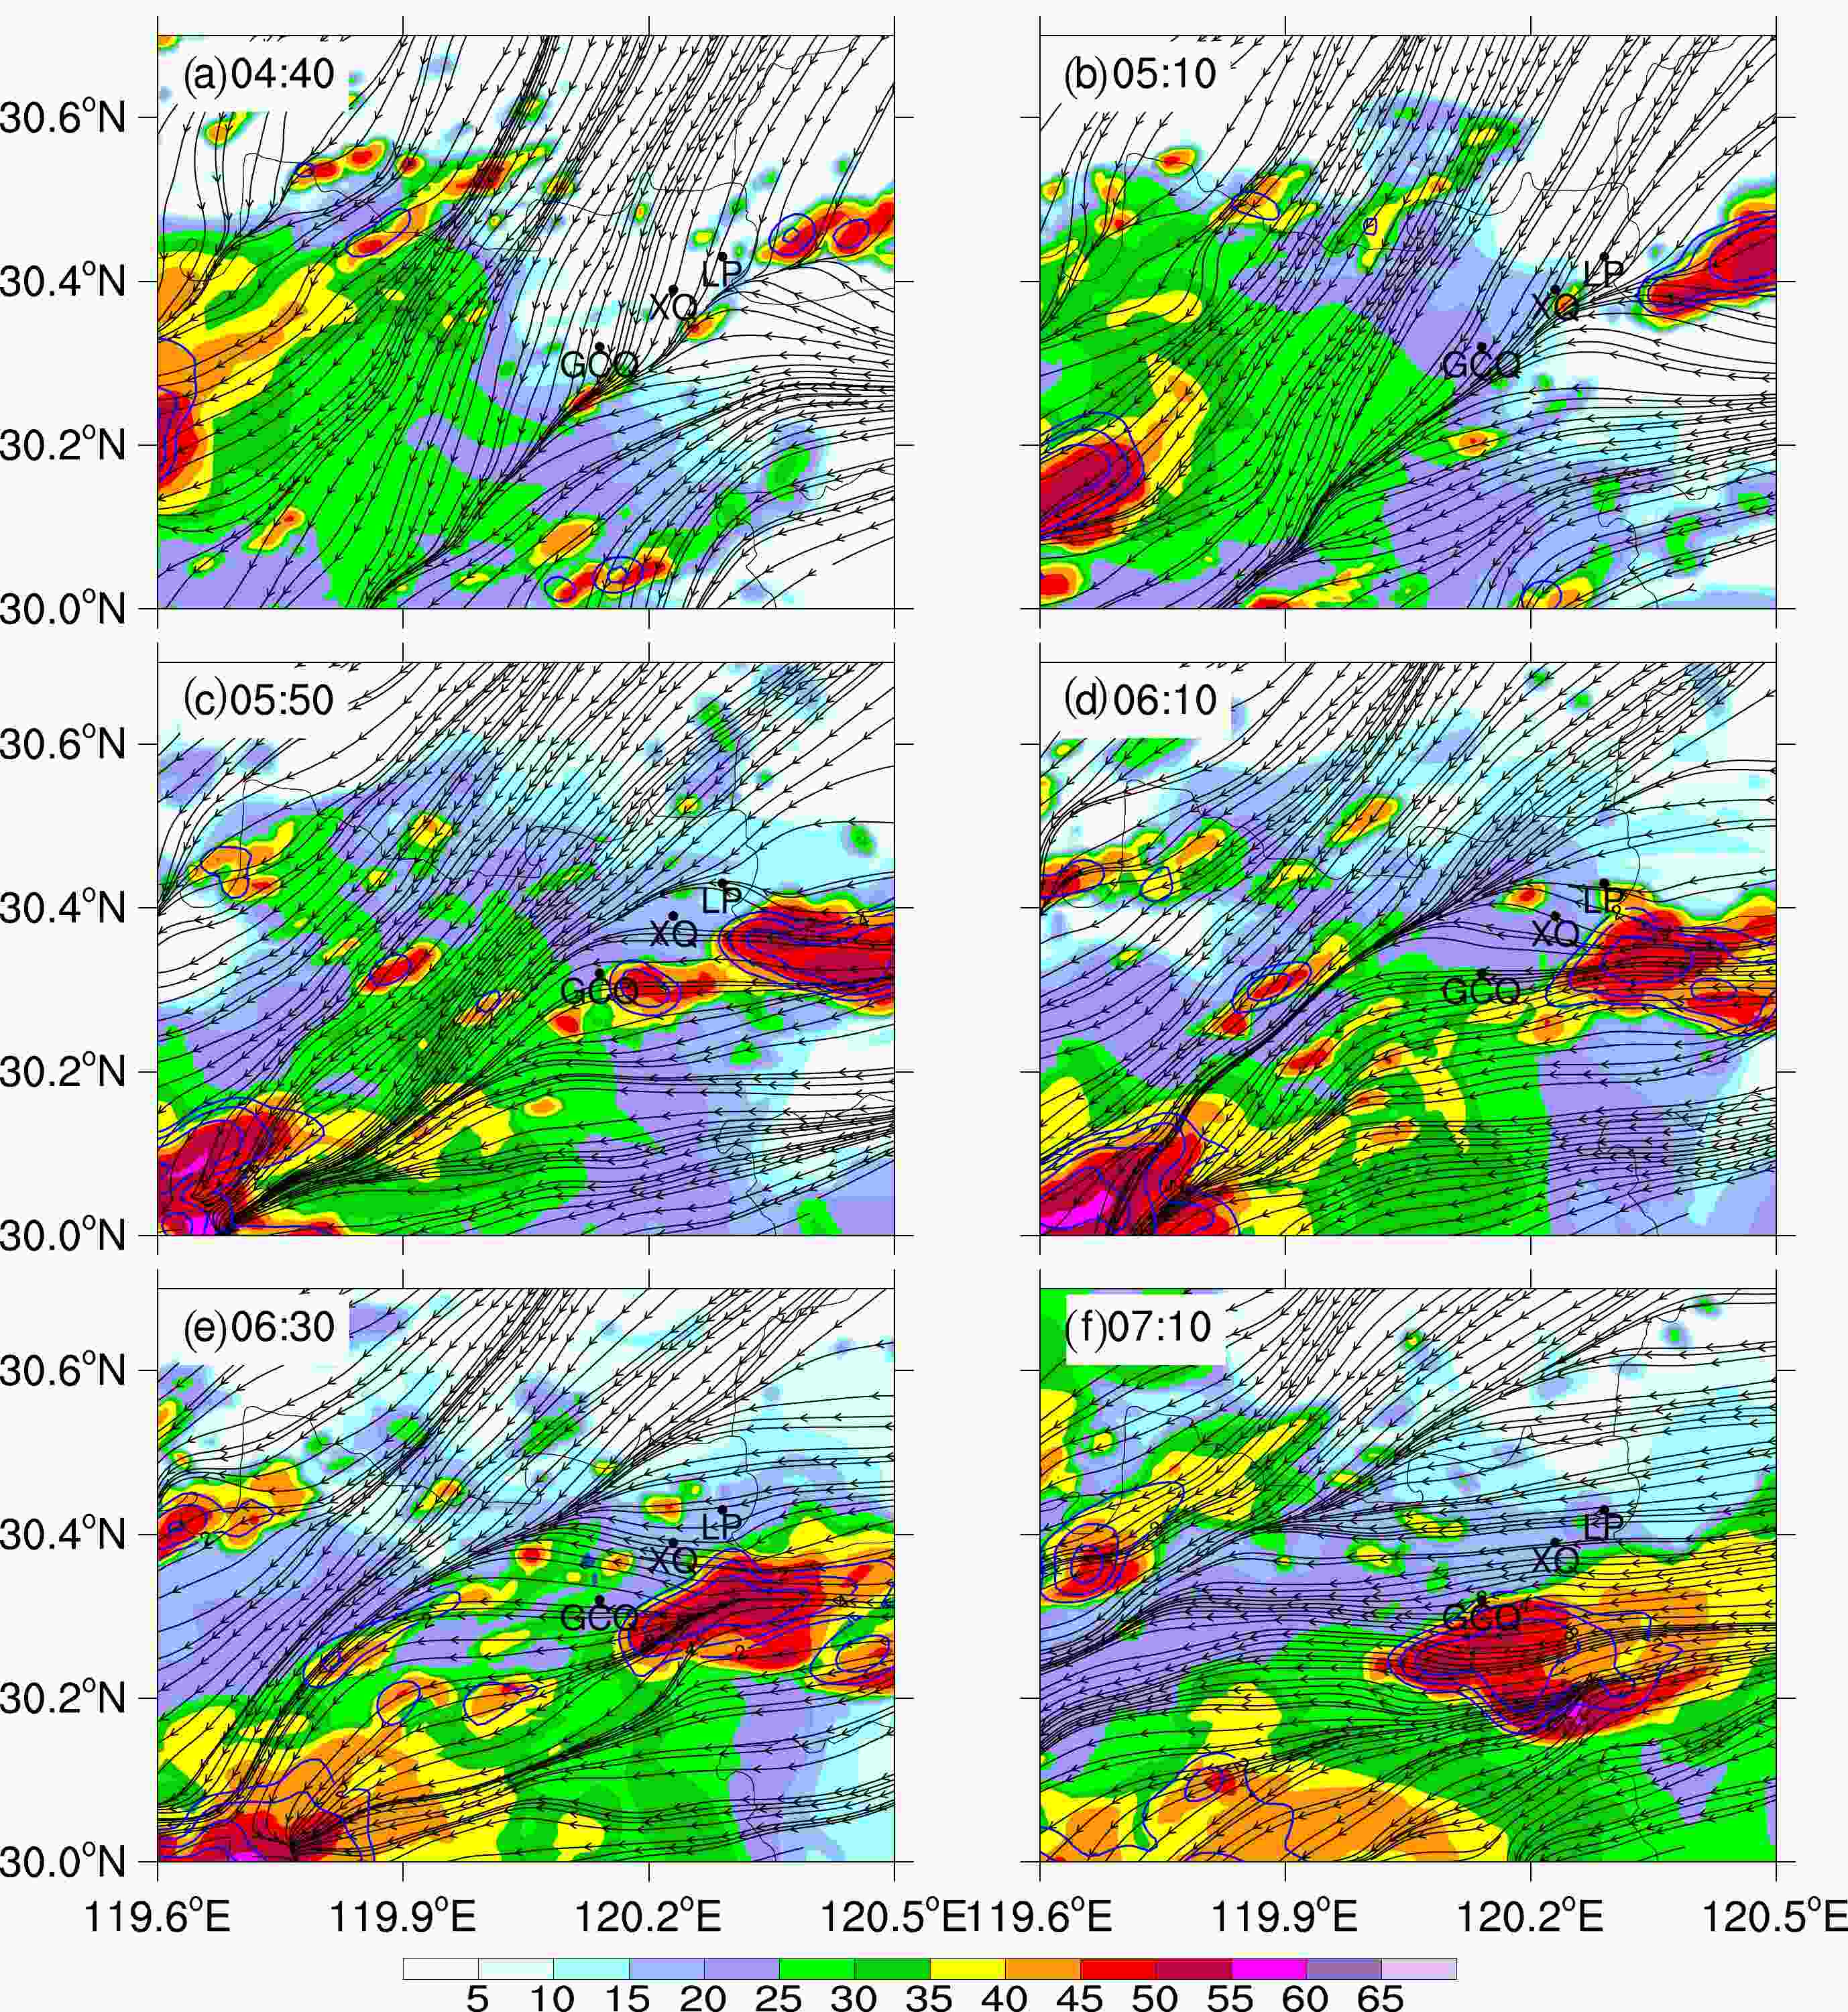
Figure 13. Simulated composite radar reflectivity (shaded; units: dBZ) and the streamlines of 10-m winds of experiment NOEVAP at different times of simulation.
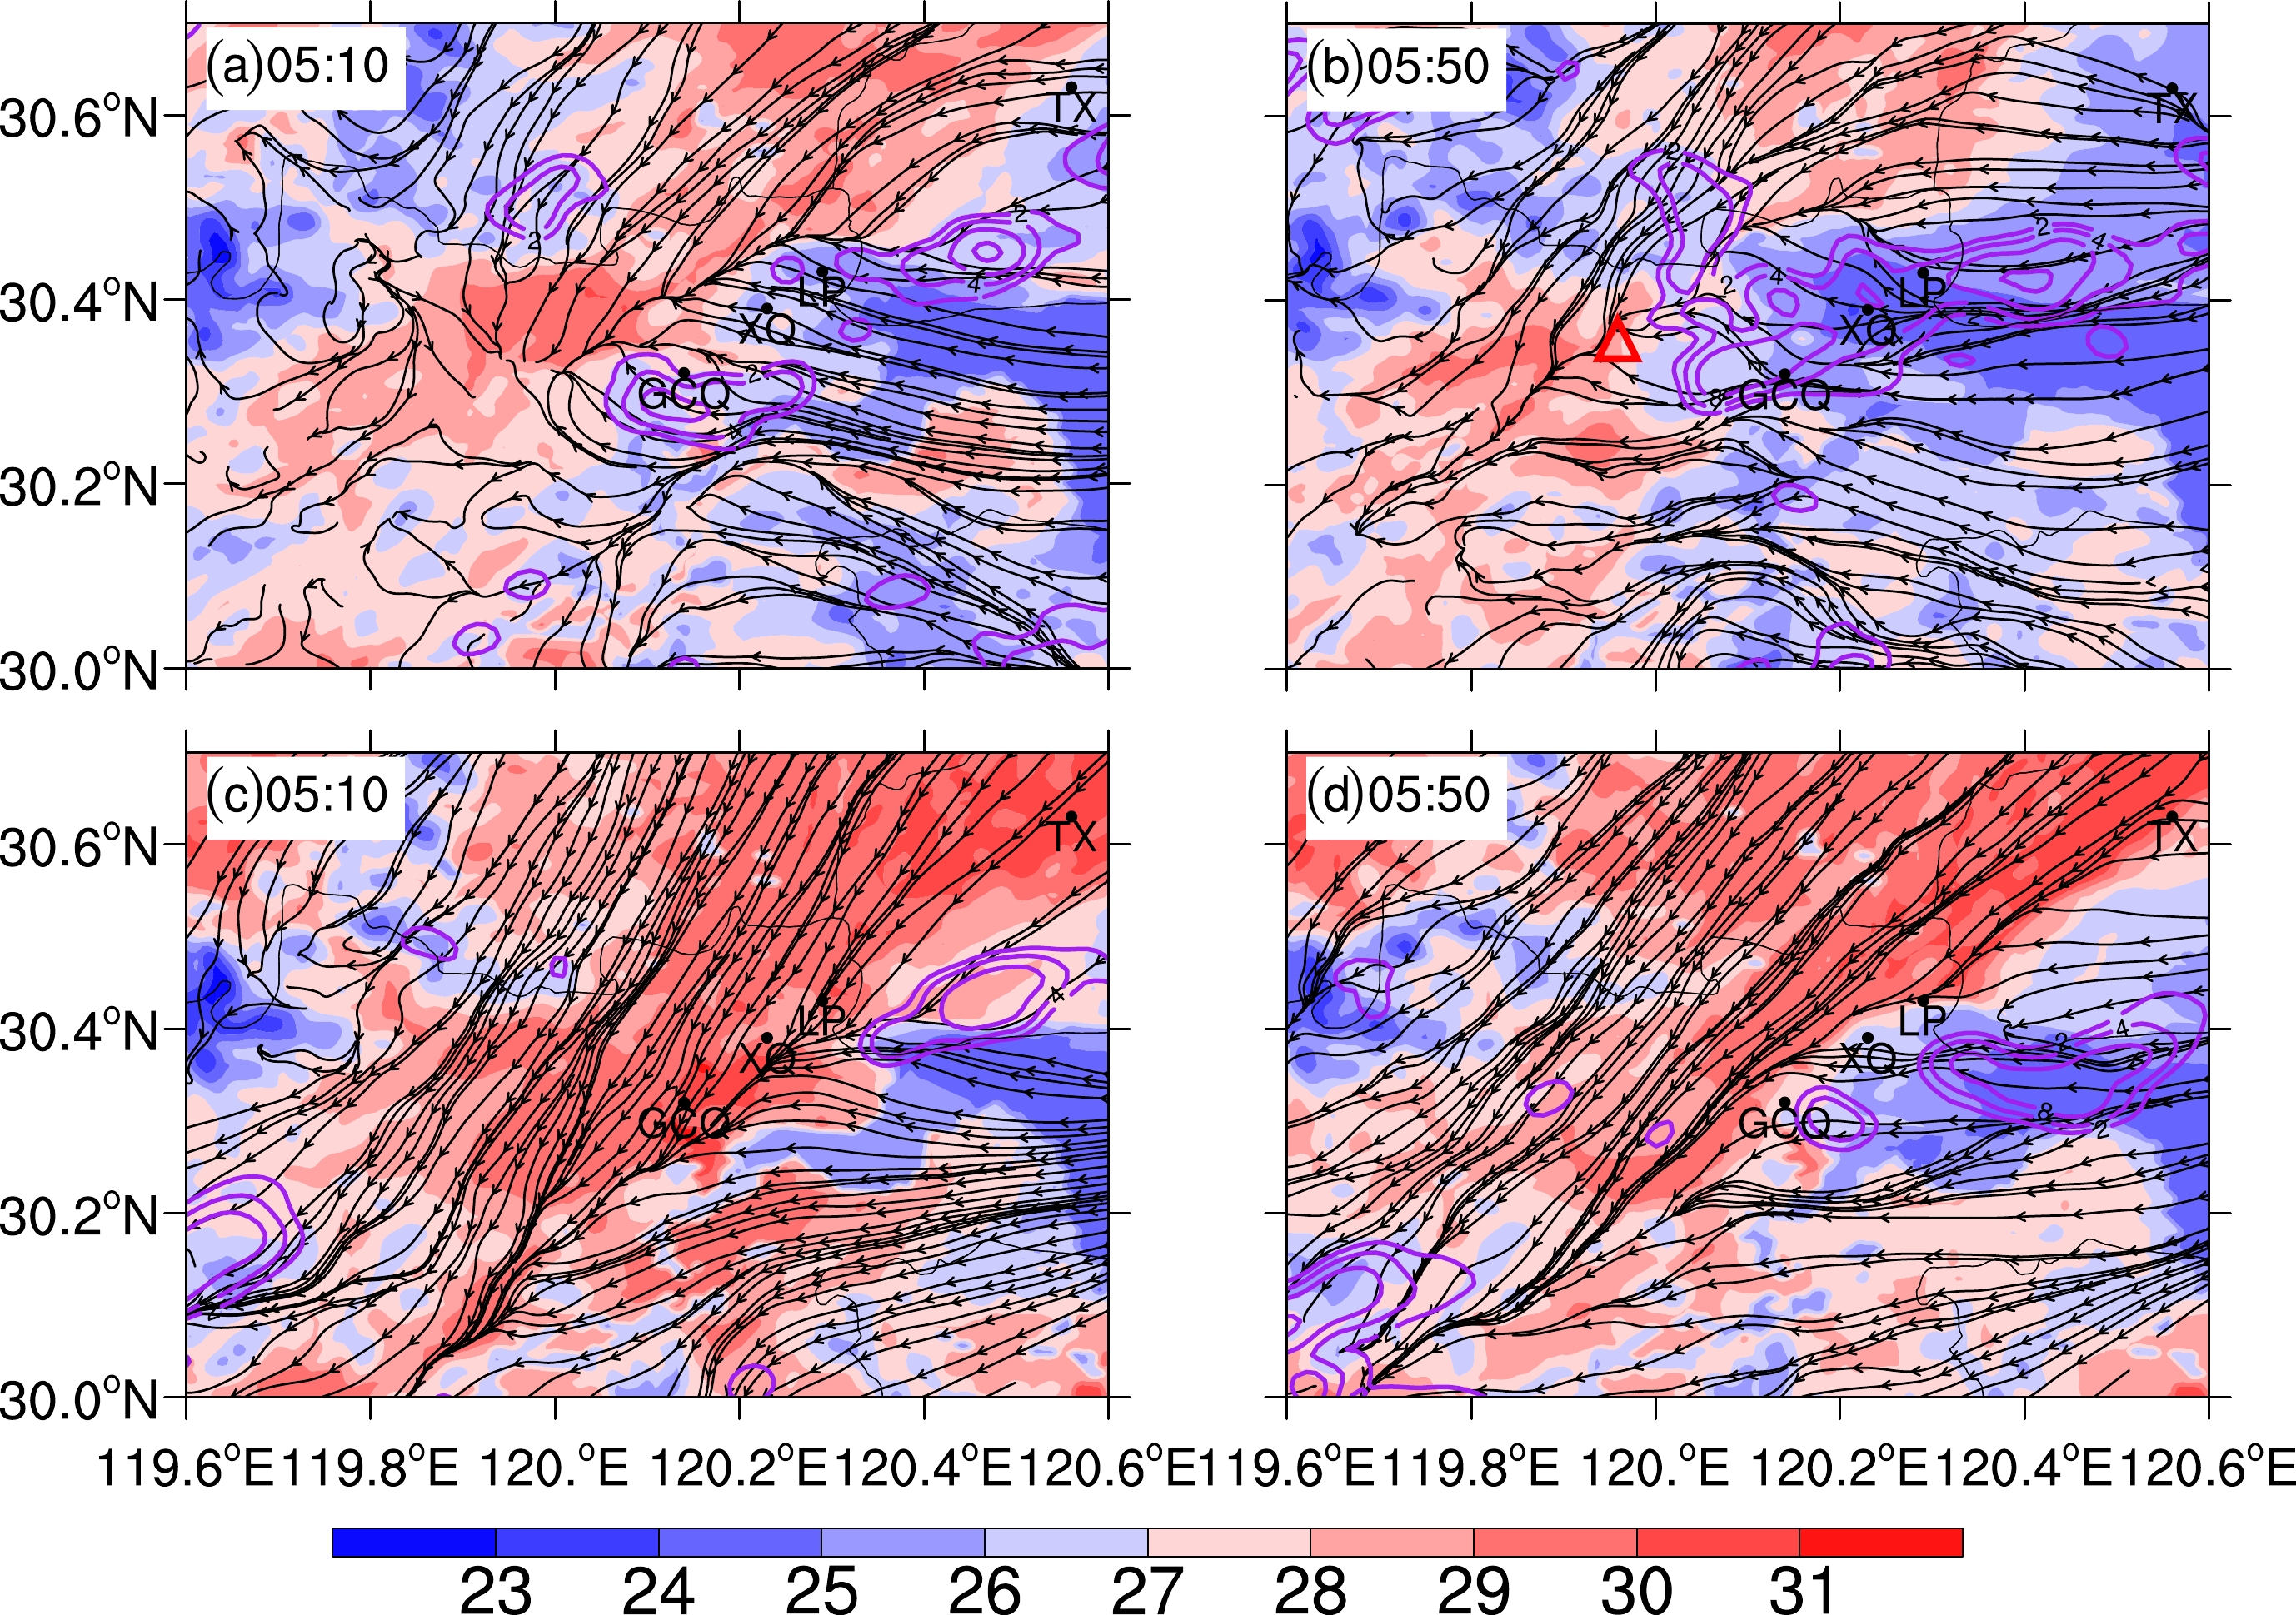
Figure 14 compares the surface fields from the control and NOEVAP experiments. At 0510 UTC (Fig. 14a), the control run has produced several areas of precipitation south of the surface convergence line, which expands and becomes a connected line by 0550 UTC (Fig. 14b). Besides, cell A is initiated at the intersectional point of the gust front and convergence line (red rectangle in Fig. 14b). This corresponds to the observed rainband 1 but with timing and spatial errors (c.f., Fig. 7). In these regions of precipitation, the surface temperature is 3°C–6°C colder than warmer regions (Fig. 14b), and the northward spreading of the cold pool has helped to keep the convergence line in place. In contrast, in experiment NOEVAP, precipitation only exists near the northeast end of the convergence line and the surface cold pool is very weak (Figs. 14c and d). The convergence line is located further south compared to the control experiment. These results suggest that, even for rainband 1, the cold pool plays an important role in convection initiation and organization in the eastern part of the band, and the cold outflow from rainband 1 helps to keep the convergence line stationary. In later hours in the control experiment, the cold pool spreads further upstream and triggers cells A through D (c.f., Fig. 7).
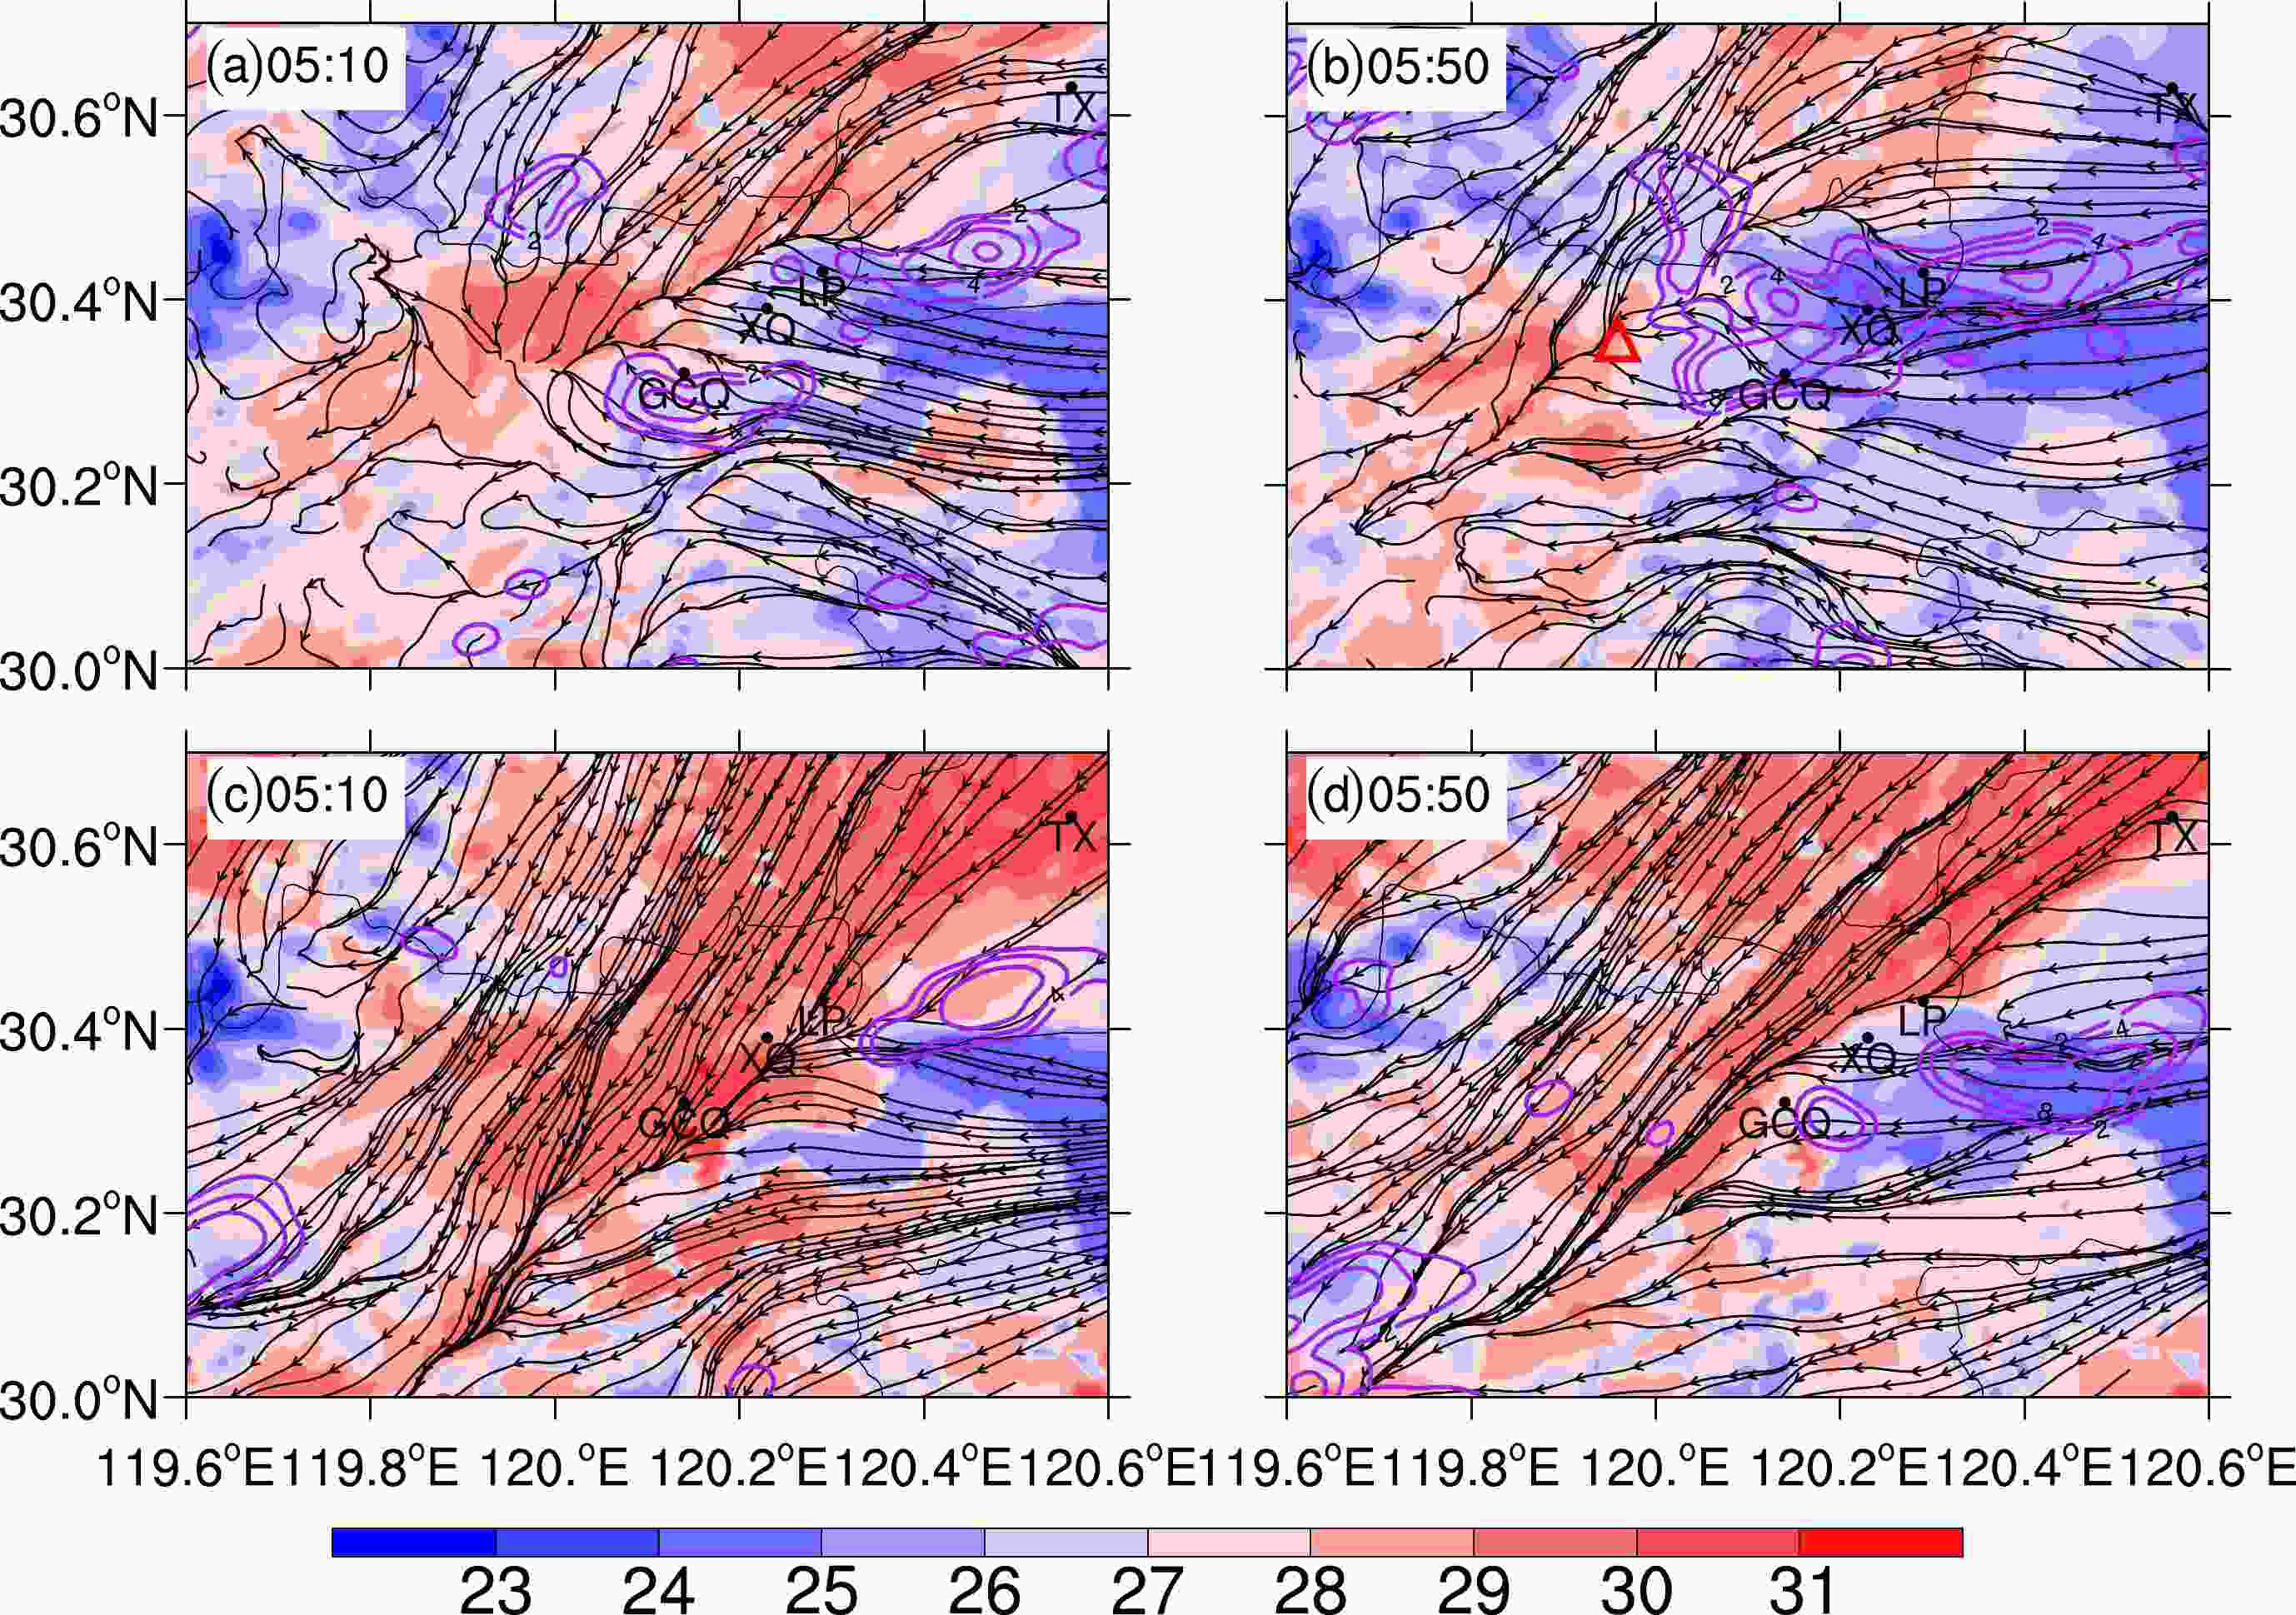
Figure 14. The 2-m temperature (shaded; units: °C), 10-min accumulated rainfall (purple contours at 1×2N mm, where N = 0, 1, 2, 3,…), and streamlines of 10-m winds from the control experiment (upper panels) and experiment NOEVAP (lower panels) at the times (in UTC) labeled in the figure. The red triangle in (b) denotes the location of cell A’s initiation.
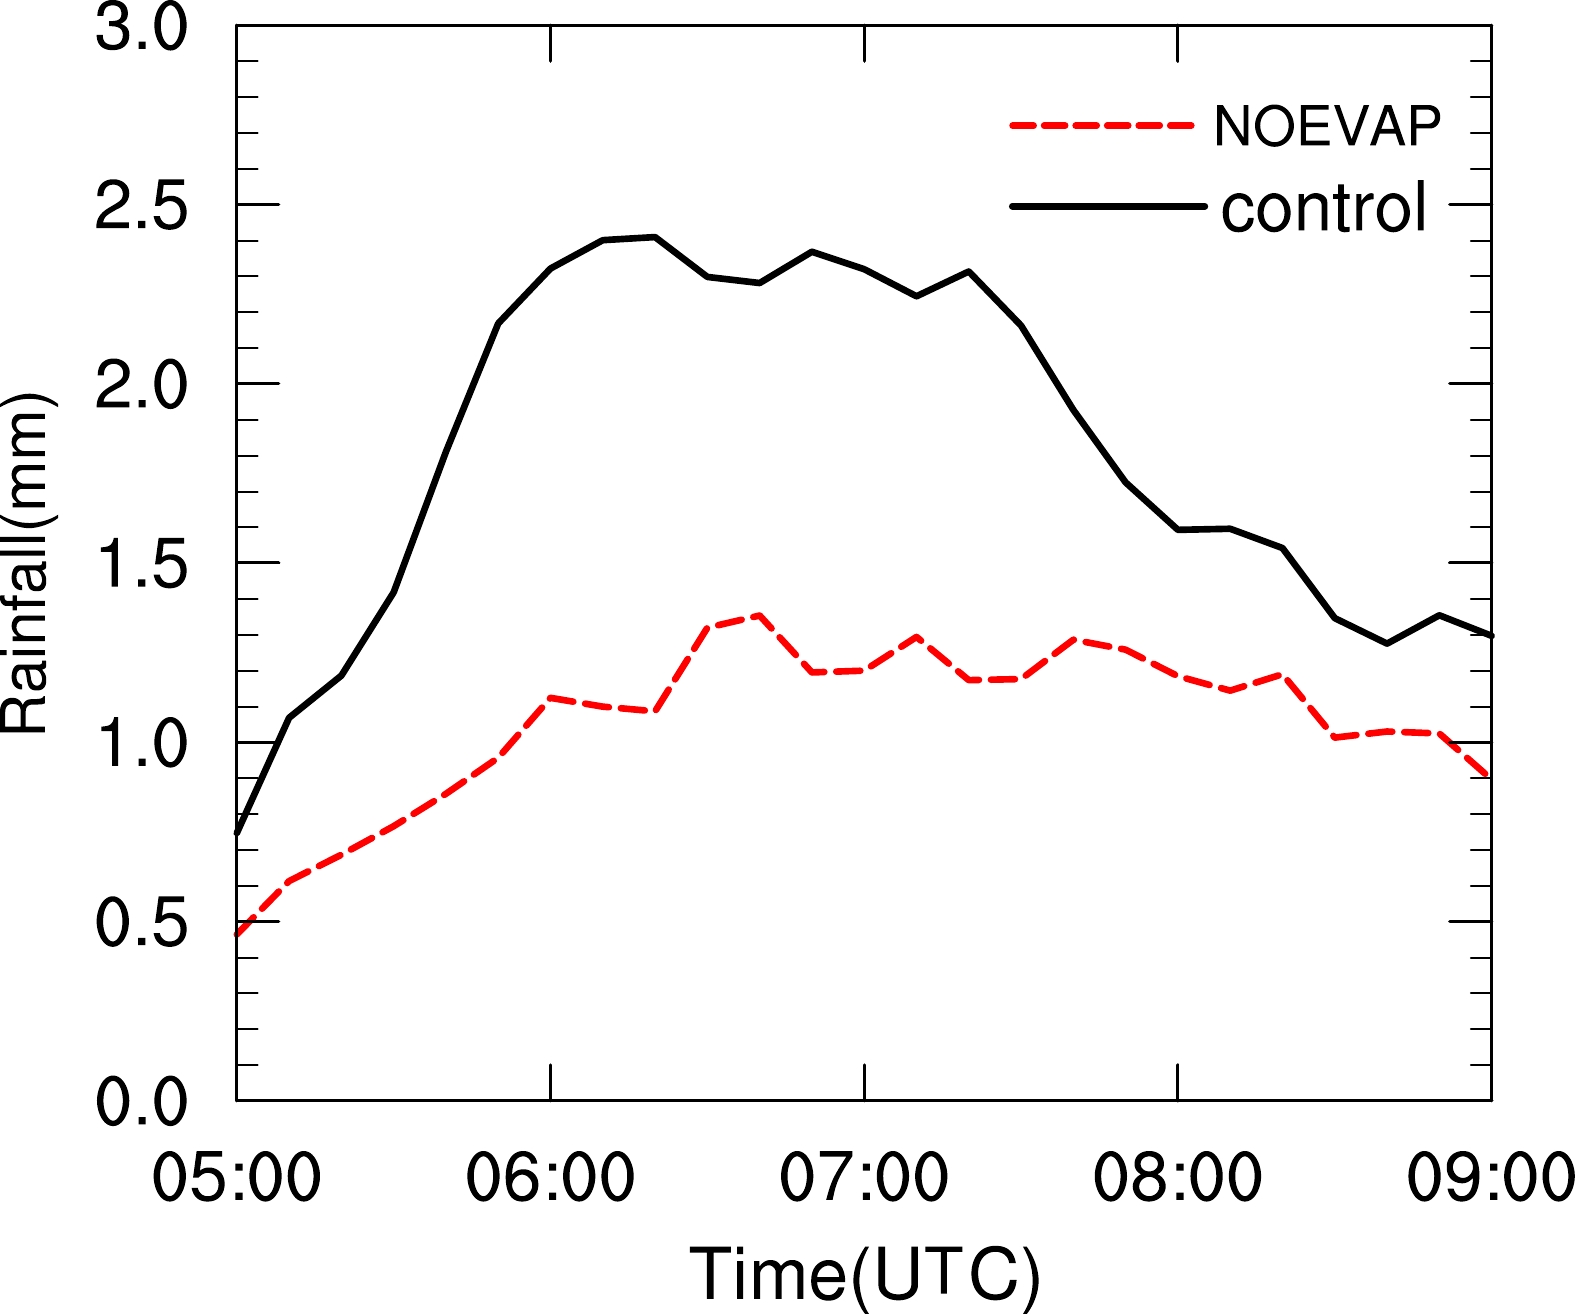
To further analyze the impact of the cold pool and the associated back-building process on rainfall, the 10-min rainfall averaged over the pink rectangular region inFig. 6, for the control and NOEVAP experiments, is plotted in Fig. 15. The maximum average rainfall rate in experiment NOEVAP is reduced from about 2.4 mm to about 1.35 mm over 10 min, or by about 44%. The peak in NOEVAP is reached at a slower rate. These results further confirm the critical role of convective cold pools in triggering and supporting new convection, and in producing the extreme rainfall of this case. The cold pool and associated gust front are critical components of the back building process.
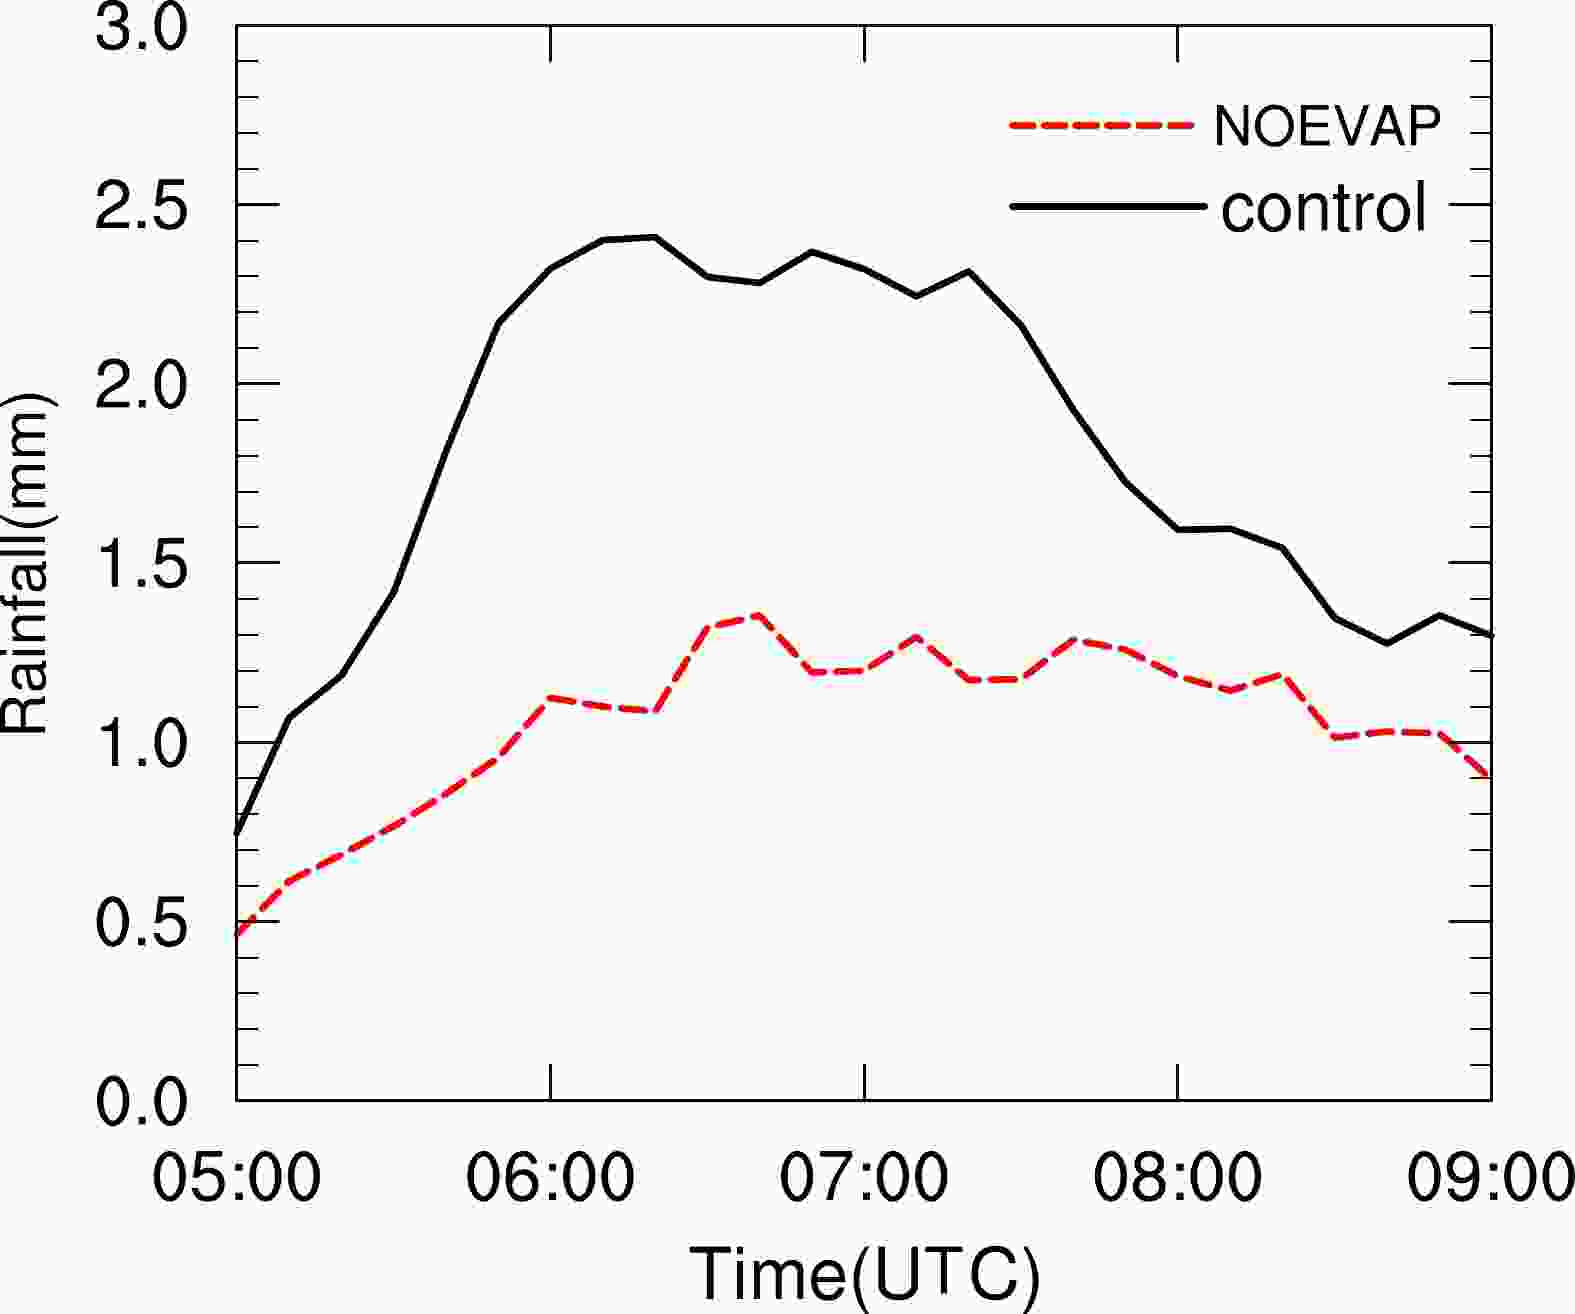
Figure 15. Time series of area-averaged 10-min rainfall over the pink rectangular region in Fig. 6 for the control run (black) and NOEVAP run (red) from 0500 UTC and 0900 UTC.
-
An extreme rainfall event occurred over Hangzhou, Zhejiang Province, China, in the afternoon of 24 June 2013, and produced maximum cumulative rainfall of more than 150 mm in 4 h. The rainfall was primarily produced by convection organized into two major rainbands and both bands were linked to the mesoscale convergence line at the low levels that was part of the mei-yu frontal system of the season.
This extreme rainfall case, including the initiation and organization of convection, is studied using radar and surface observations, and output from numerical simulations at 1-km grid spacing (nested within three coarser resolution grids). Both the observed and simulated data show the importance of the cold pool and the mesoscale convergence line in producing this torrential rainfall. The extreme rainfall was mainly produced by a sequence of convective cells that developed southwest of the older cells, as the cold pool from the older cells spread upstream (relative to the middle and upper-level flows) along the mesoscale convergence line and triggered new convection. These cells, after forming, moved very slowly northeastward and produced 10-min rain rates of over 20 mm. Such processes are commonly referred to as back-building processes.
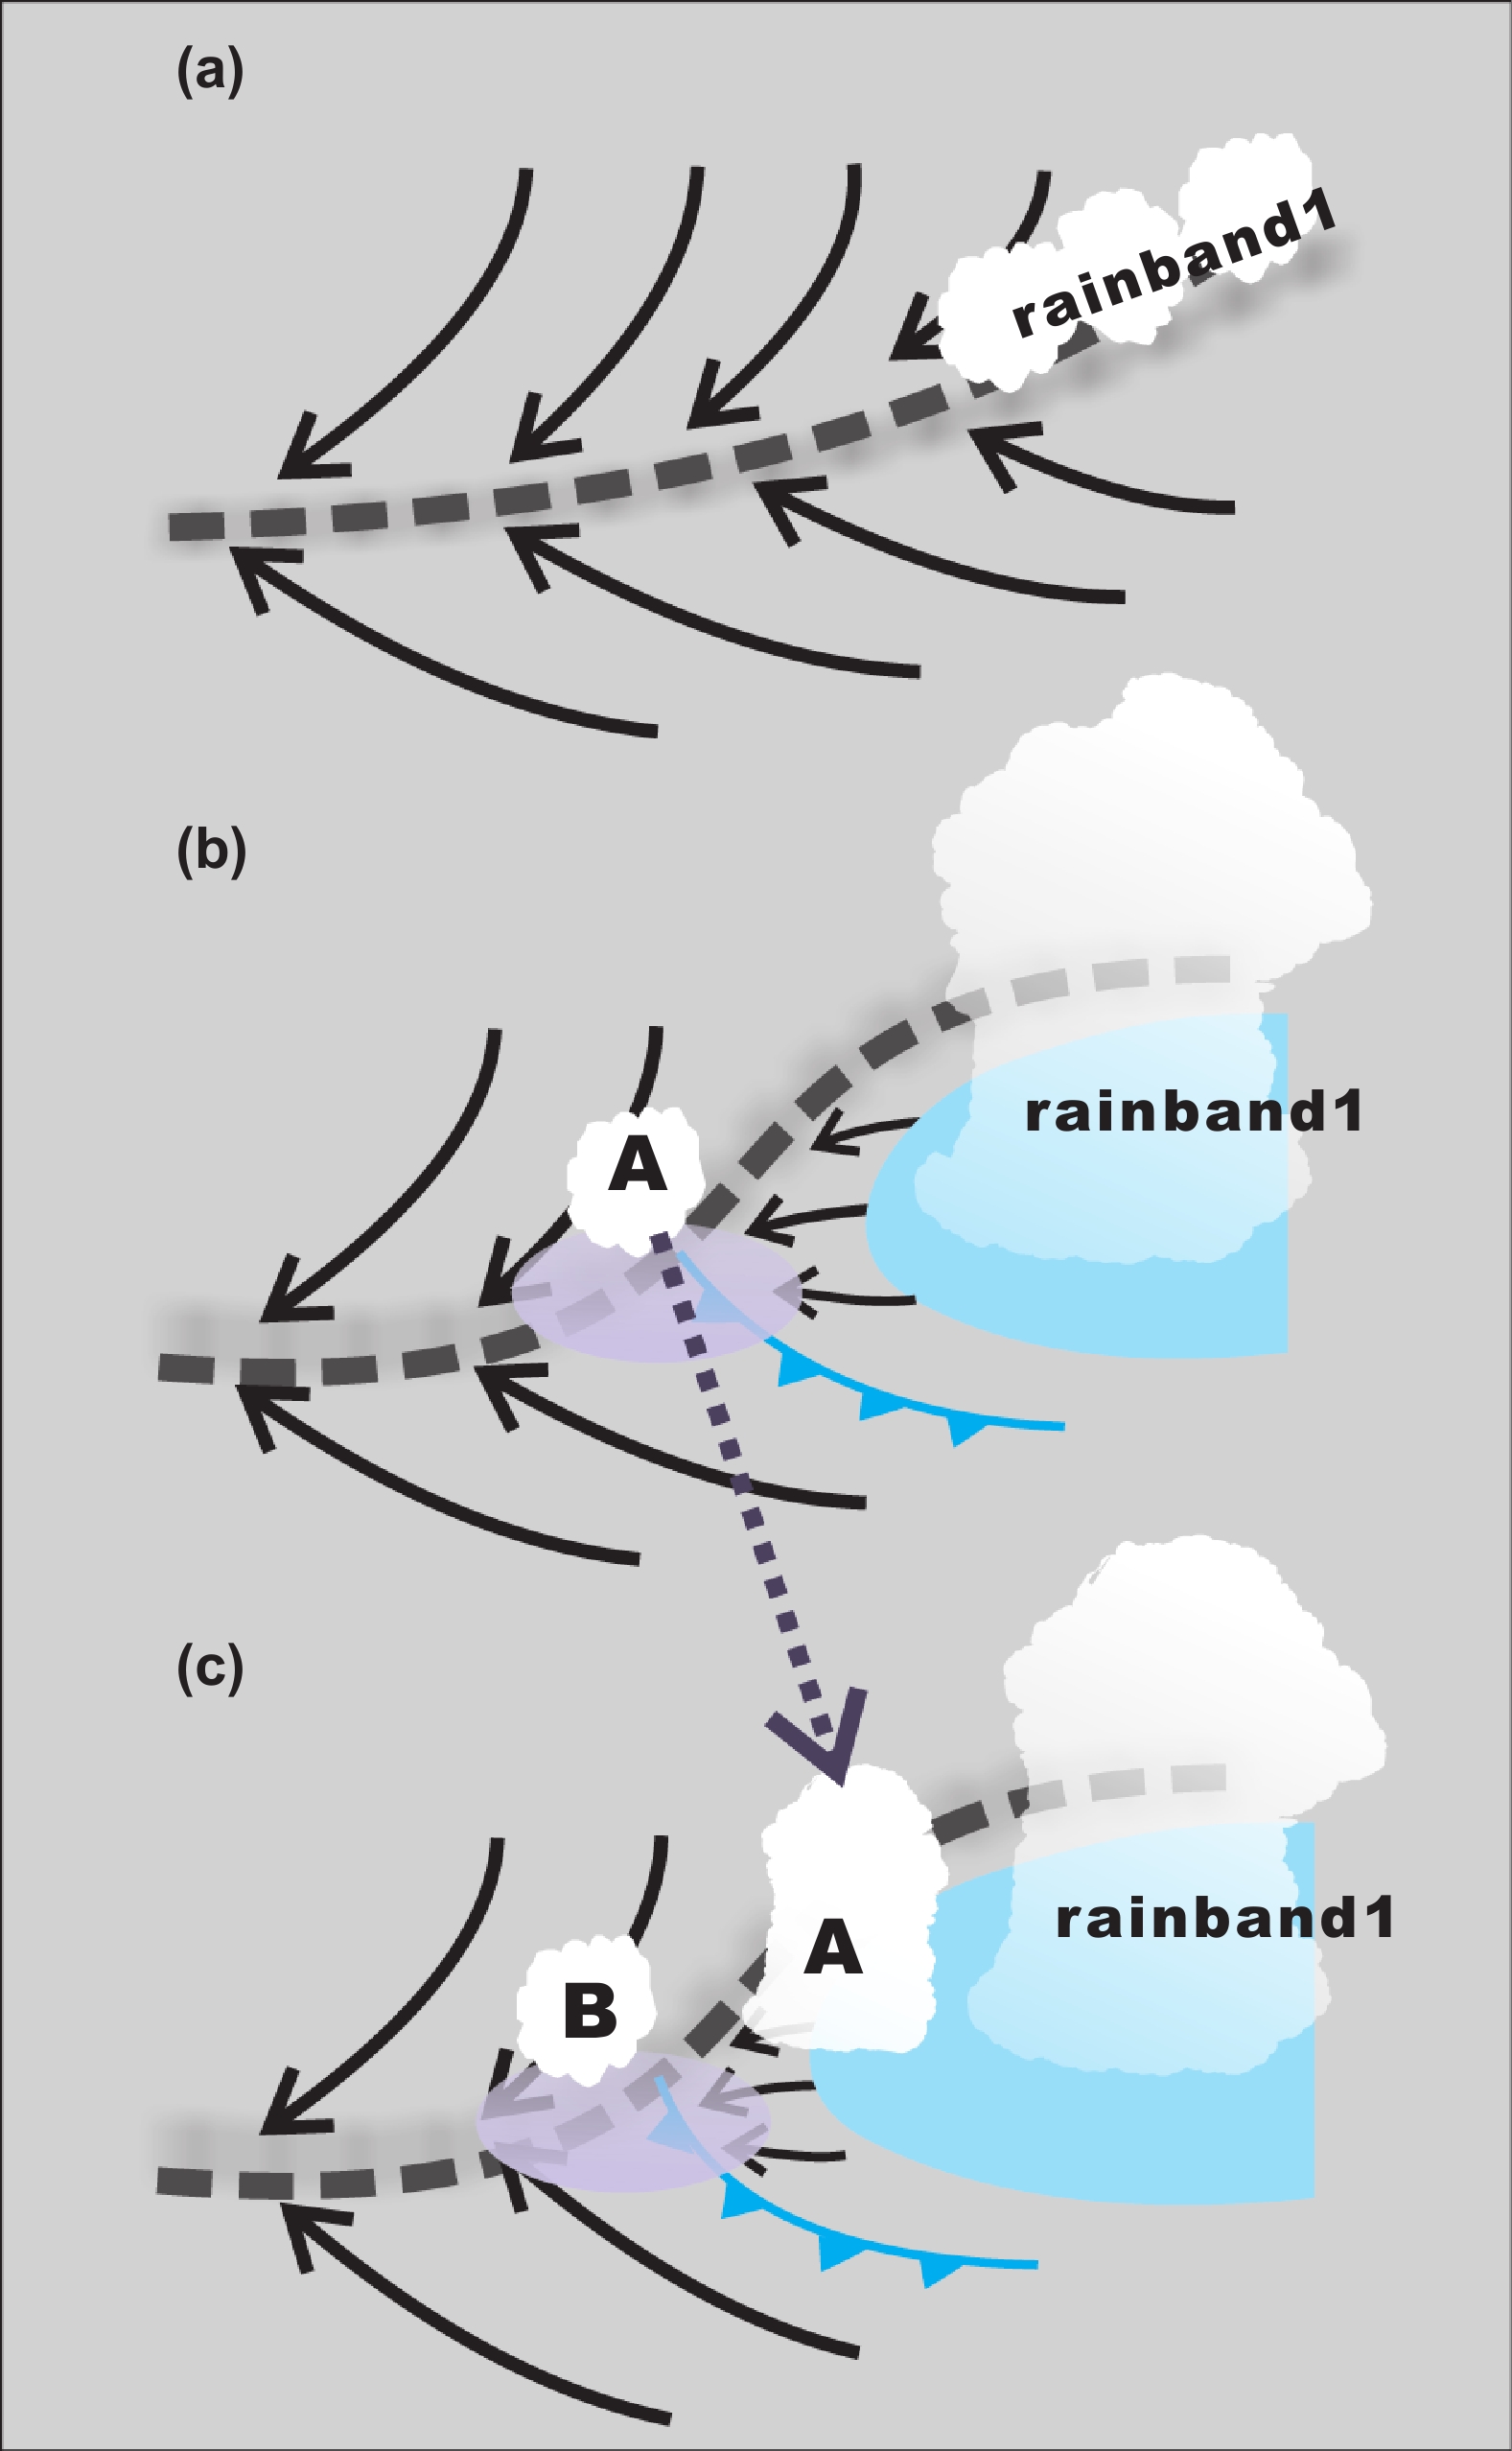
A conceptual model is proposed to summarize the evolution of the key processes involved (Fig. 16). A mesoscale convergence line is found between northeasterly flows on the north side and southeasterly flows on the south side. The convergence line is associated with the mei-yu front and remains quasi-stationary. At the beginning of this rainfall event, light rainfall forms near the east end of the convergence line and strengthens to become rainband 1 (Fig. 16a). As the precipitation of rainband 1 increases, a cold pool due to evaporative cooling is established that spreads mainly westward given the easterly surface flows. The cold pool that tries to spread northward also helps to keep the convergence line in place (Fig. 16b). As the gust front moves westwards and southwestwards, convergence lifting is strongest at the intercepting point of the gust front and convergence line, and the air ahead of the gust front to its southwest has large CAPE, high humidity and low LFC, so it does not take much effort to lift near-surface air to its level of free convection for deep convection to develop. In fact, the cells develop very quickly after initiation and produce heavy rainfall.
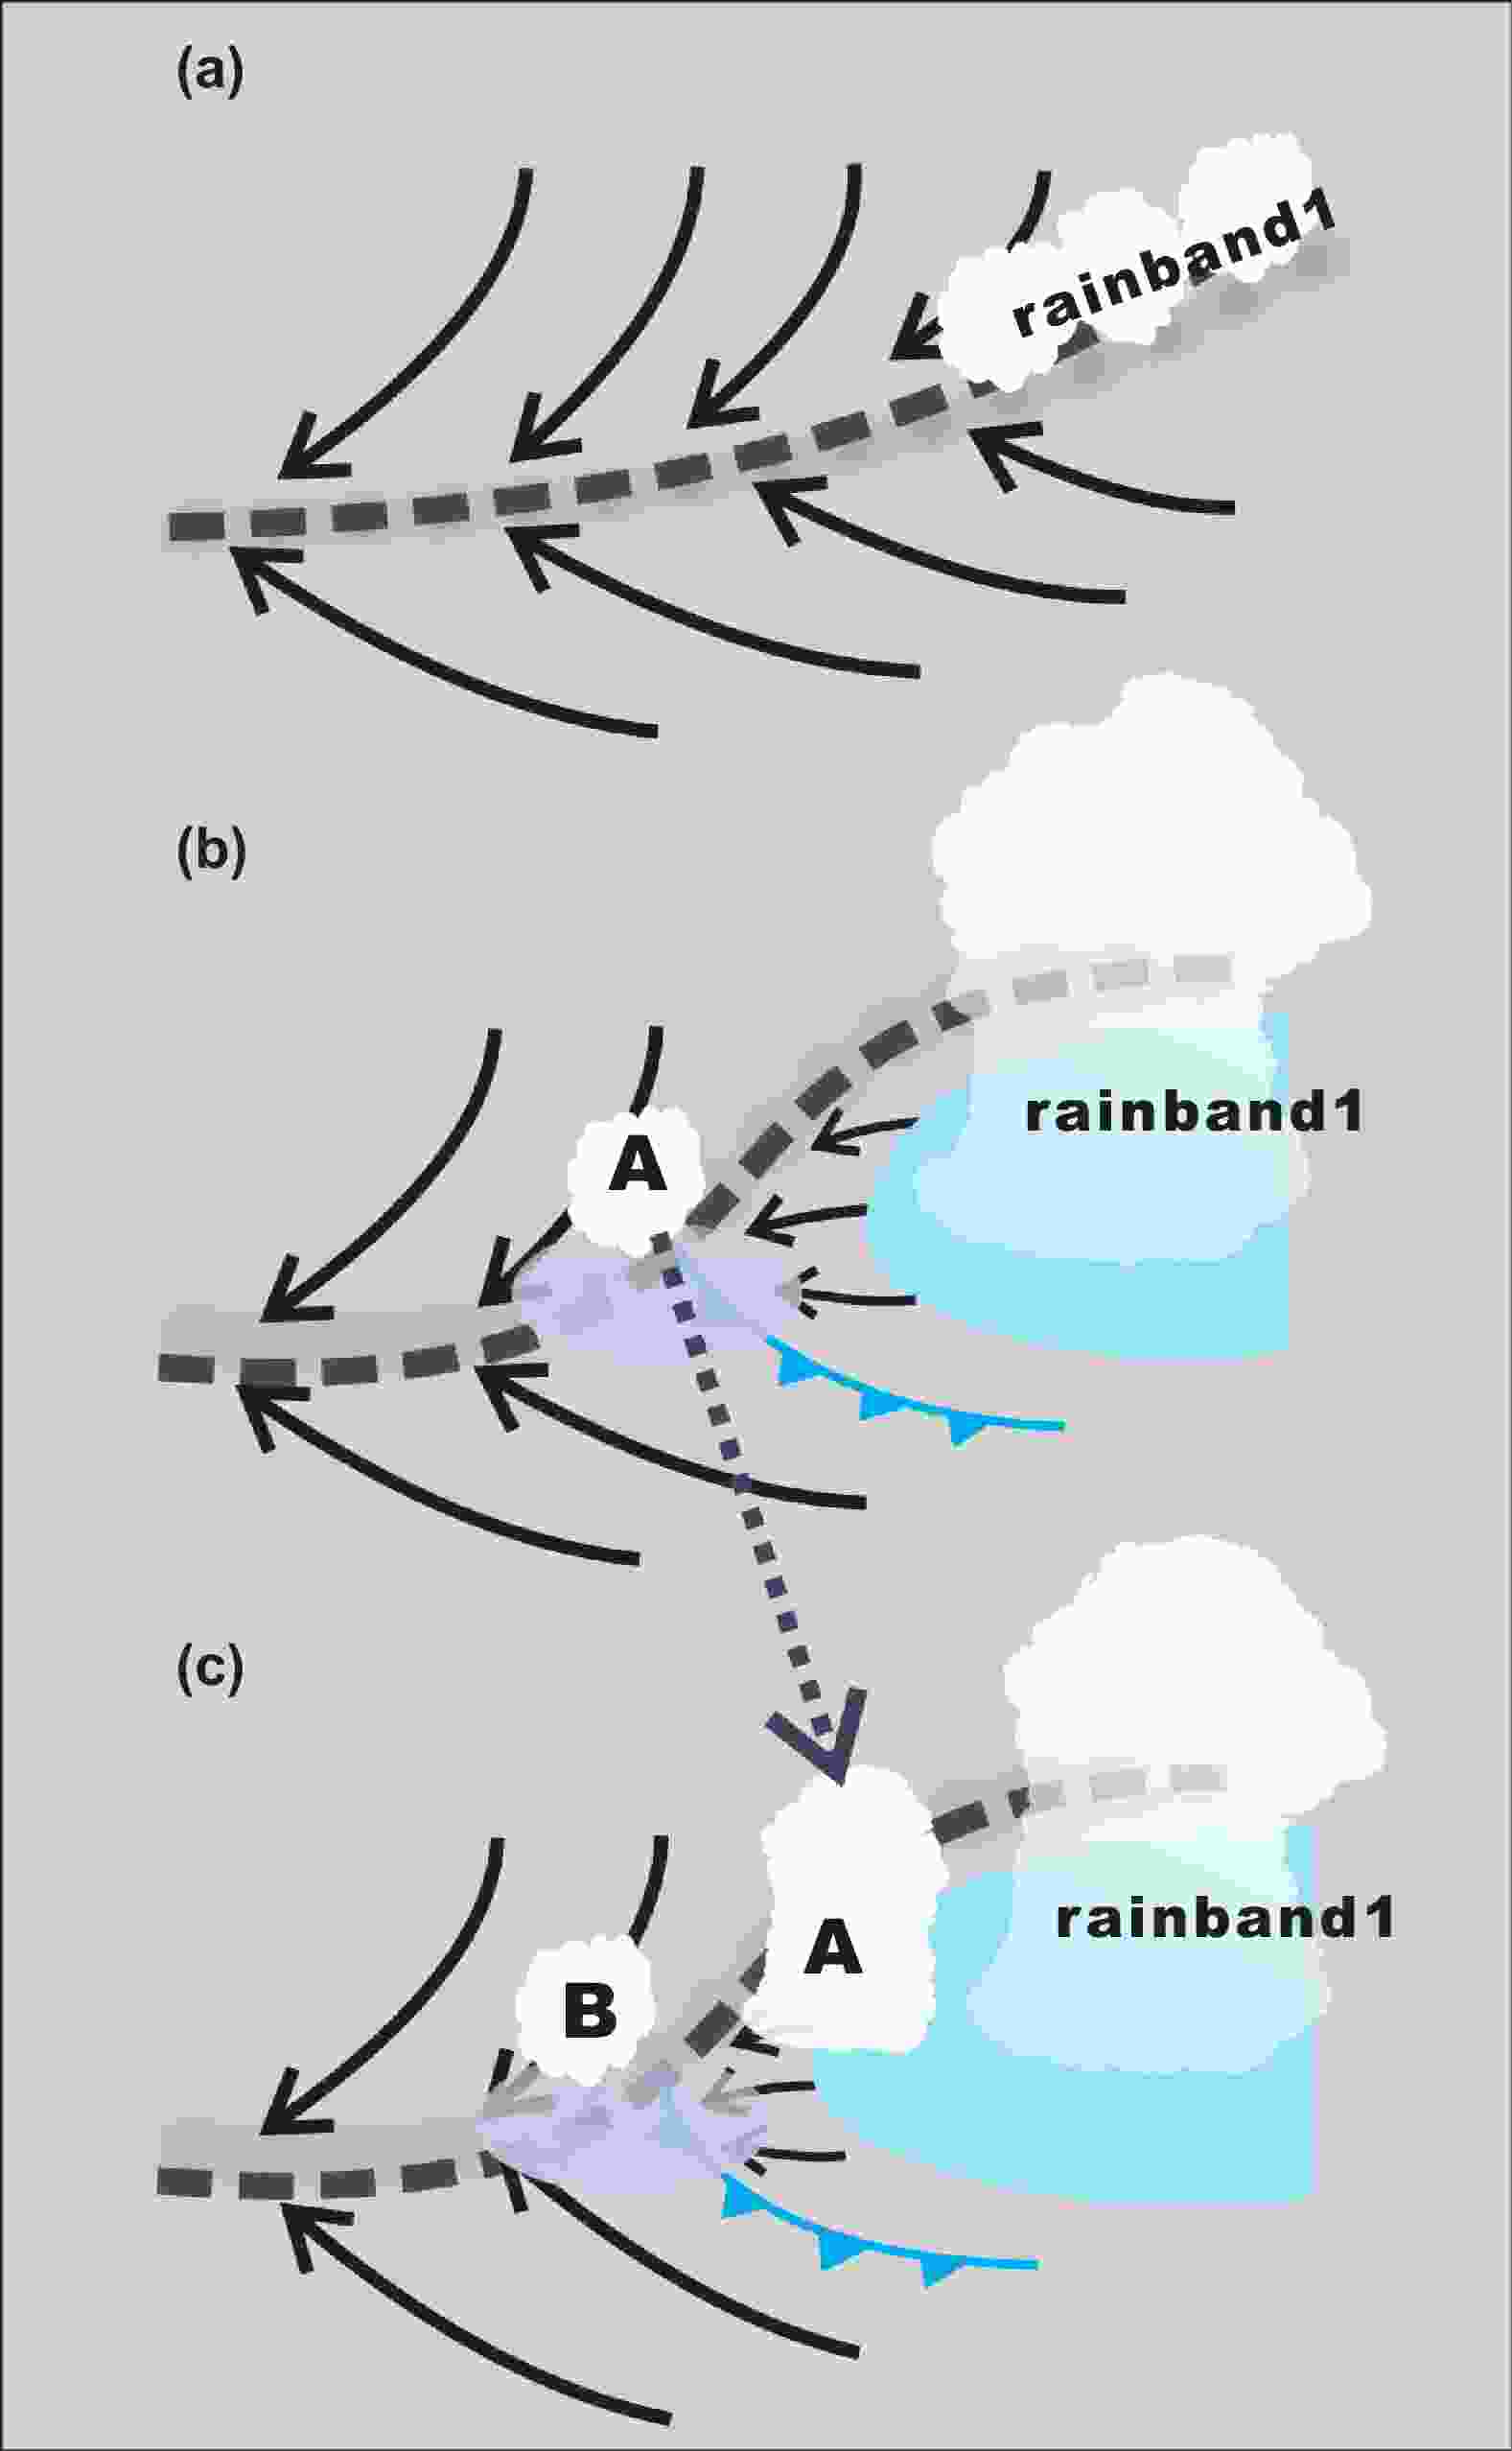
Figure 16. Conceptual model illustrating the back-building processes in the extreme rainfall event. The blue ellipse indicates the surface cold pool. The dark gray dashed lines indicate the mesoscale convergence boundary. The blue cold front symbols indicate the gust front on the southwest side of the cold pool. The light gray ellipses indicate the convergence region forced by the gust front and mesoscale convergence boundary. Panels (a), (b) and (c) illustrate different stages of the back-building MCS.
After a new cell is triggered, which is labeled cell A (Fig. 16b), it intensifies and produces a cold pool underneath, which merges with the cold pool of earlier cells and pushes the gust front westwards. The gust front subsequently triggers the next cell along the convergence line (cell B) as cell A moves slightly downstream away from the gust front (Fig. 16c). The process can repeat several times, and produce a sequence of convective cells that eventually merge to form a linear MCS. The repeated triggering of new cells upstream of an MCS is commonly referred to as back-building since it occurs on the back side of the MCS. As the cells move slowly along the same line, extreme precipitation can be produced under favorable environmental conditions, as in the current case.
The strong radar echoes of the cells that can exceed 50 dBZ are mostly found below the freezing level or about 4 km height, suggesting that warm rain dominates the precipitation processes. A low echo centroid is often found in extreme precipitation cases during the warm season in China where low-level moisture is abundant. The precipitation efficiency of the convective cells can reach 80%, i.e., 80% of the water vapor fluxes into the convective storm is rained out to the ground, which is another important factor of the extreme precipitation. The generally very humid environment in the middle to lower troposphere likely contributed to the high precipitation efficiency.
The effects of the cool pool and the associated back-building process were further confirmed by a sensitivity experiment in which evaporative cooling within the microphysics was turned off. In this case, the quasi-stationary convergence line shifted southward in the absence of the cold pool generated by the earlier rainband, and no new cells were initiated along the convergence line upstream or west of the rainband. The cold pool and associated gust front were essential components of the back-building MCS.
Acknowledgements. This work was supported by the National Natural Science Foundation of China (Grant Nos. 41730965, U2242204, and 41175047), the National Key Basic Research and Development Project of China (Grant No. 2013CB430104), and the Key Project of the Joint Funds of the Natural Science Foundation of Zhejiang Province (Grant No. LZJMZ23D050003. The first author gratefully acknowledges financial support from the China Scholarship Council for her visit to CAPS, University of Oklahoma.
Local Torrential Rainfall Event within a Mei-Yu Season Mesoscale Convective System: Importance of Back-Building Processes
- Manuscript received: 2023-02-15
- Manuscript revised: 2023-09-22
- Manuscript accepted: 2023-10-09
Abstract: An extreme rainfall event occurred over Hangzhou, China, during the afternoon hours on 24 June 2013. This event occurred under suitable synoptic conditions and the maximum 4-h cumulative rainfall amount was over 150 mm. This rainfall event had two major rainbands. One was caused by a quasi-stationary convective line, and the other by a back-building convective line related to the interaction of the outflow boundary from the first rainband and an existing low-level mesoscale convergence line associated with a mei-yu frontal system. The rainfall event lasted 4 h, while the back-building process occurred in 2 h when the extreme rainfall center formed. So far, few studies have examined the back-building processes in the mei-yu season that are caused by the interaction of a mesoscale convergence line and a convective cold pool. The two rainbands are successfully reproduced by the Weather Research and Forecasting (WRF) model with four-level, two-way interactive nesting. In the model, new cells repeatedly occur at the west side of older cells, and the back-building process occurs in an environment with large CAPE, a low LFC, and plenty of water vapor. Outflows from older cells enhance the low-level convergence that forces new cells. High precipitation efficiency of the back-building training cells leads to accumulated precipitation of over 150 mm. Sensitivity experiments without evaporation of rainwater show that the convective cold pool plays an important role in the organization of the back-building process in the current extreme precipitation case.
-
Keywords:
- torrential rainfall,
- back-building processes,
- numerical simulation,
- trigger mechanism,
- convergence line,
- convective cold pool
摘要: 2013年6月24日浙江杭州地区发生了一次短时强降水过程,最大4小时累计降水超过150mm,本研究利用实况和高分辨率数值模式预报结果,研究强降水的成因。此次过程主要由两条对流雨带造成,一条是过程初期的准静止雨带,一条是由第一条雨带出流边界与梅雨锋的中尺度幅合带相互作用下向上游后向发展的对流雨带。此次降水持续时间为4小时,强降水中心主要发生在后向发展对流雨带出现的2小时内。目前,对于梅雨季由中尺度对流云线及对流冷池相互作用对对流系统发生后向发展过程研究相对较少。利用Weather Research and Forecasting(WRF)模式成功再现了此次过程的两条雨带。基于模式结果,对于后向发展雨带成因及其作用进行分析。从模式结果中清晰地看到新单体不断在老单体的西侧生成,且其发生环境为高对流有效位能(CAPE),低自由对流高度(LFC),并具有充足水汽。老对流的辐出气流加强了原有梅雨锋的低层辐合带的辐合强度,触发新单体。后向发展对流雨带上的高降水效率的单体组成,是造成此次150mm强降水中心的另一个重要因素。此外,去除冷池效应的敏感性试验结果表明,对流冷池是后向发展雨带组织形成的主要影响系统,且本次短时强降水过程的强降水中心与对流系统发生后向发展关系密切。


 AAS Website
 AAS WeChat