


 DownLoad:


-
The Yangtze River basin (YRB) is the largest economic belt in China, famous for its developed industry, agriculture, and high population density. The YRB is characterized by complex terrain, including plateaus, mountains, transition zones, and plains, from west to east. In recent years, heavy rainfall has occurred frequently (Zhao et al., 2012; Zhang et al., 2014a; Ding et al., 2021) and induced an increase in severe flooding over the YRB (Chen et al., 2014; Guan et al., 2017; Ali et al., 2019), posing a great threat to the safety of people’s lives and property (Gong et al., 2021). Previous studies have found that the spatial and temporal variability of the total rainfall (TR) over the YRB is remarkable (Zhang et al., 2013). A significant increasing trend of rainfall events has been observed in the middle-to-lower reaches of the YRB since 1960 (Fu et al., 2013; Wu et al., 2016; Hu et al., 2021). The rainfall intensity gradually increases from the upper to the lower YRB (Chen et al., 2014; Guan et al., 2017). In the middle-to-lower reaches of the YRB, moderate and extreme rainfall events contribute to most of the local rainfall amount (Qian et al., 2007; Hu et al., 2021).
Short-duration heavy rainfall (SDHR; hourly rainfall ≥ 20 mm) refers to a kind of severe convective weather that frequently causes substantial loss of life and property damage (Zheng et al., 2017). SDHR occurs directly from mesoscale and microscale systems with a short lifetime, and rapid variations in atmospheric elements (Tian et al., 2015). In recent years, the frequency of severe convective weather has increased over contiguous China, and the spatiotemporal patterns of SDHR have also changed significantly over the YRB (Zheng et al., 2017; Yu and Zheng, 2020). Meanwhile, hourly rain gauge data with high spatiotemporal resolution have been used to examine the characteristics of SDHR events in more detail (Chen et al., 2013b; Yu and Li, 2016; Tian et al., 2017). Due to the continuous improvement in high-resolution rain gauge data, studies can focus on the distribution of SDHR events in different subregions of the YRB, such as the provinces of Hubei, Hunan, and Jiangxi (Zhou et al., 2018; Lei et al., 2020; Liu et al., 2020; Yao et al., 2020). Tang et al. (2022) found that topographic effects caused an increase in the frequency and amount of SDHR in mountainous areas over the YRB in the summer of 2020, especially for high rainfall rates around the Dabie Mountains.
Some statistical and case studies of rainfall have examined the diurnal variation driven by solar radiation. Influenced by the forcing of the complex topography and the underlying surface, the summer precipitation over contiguous China shows remarkable diurnal variations with considerable regional characteristics. In different regions, the diurnal peak of rainfall can occur around late afternoon, midnight, early morning, or both late afternoon and early morning (Yu et al., 2007c; He and Zhang, 2010; Chen et al., 2012, 2019; Zhuo et al., 2014; Yu and Li, 2016; Li et al., 2017, 2022; Mu et al., 2021; Xia et al., 2021). The diurnal variations of rainfall over the YRB also show a spatial diversity due to the influence of synoptic circulations and local topography. Specifically, the diurnal phase is delayed eastward along the YRB, with a midnight maximum appearing over the upper basin, an early-morning peak over the middle basin, and a late-afternoon peak over the lower basin (Yu et al., 2007c). This west-to-east lagging phenomenon was proven to be inextricably related to the contribution of persistent precipitation (Chen et al., 2010). According to the previous studies (Yu et al., 2007b; Chen et al., 2010), the hourly rainfall of long-duration rainfall events tends to peak in the early morning, while that of short-duration rainfall events usually peaks in the late afternoon. The late-afternoon peak of short-duration rainfall events is probably related to the diurnal cycle of local solar heating, which can significantly affect low-level atmospheric instability, while the mechanisms of the early-morning precipitation are more complex. In addition, the diurnal variation of rainfall over the YRB in non-typical mei-yu years appears as a bimodal structure with peaks in the early morning and afternoon, while that in normal mei-yu years exhibits a single morning peak (Zhang et al., 2020).
As mentioned above, previous studies have already gained an understanding of the general characteristics of rainfall over the YRB. However, most were mainly based on the mean precipitation (averaged over the entire study area). It is noteworthy that orographic factors greatly influence the spatial variability of rainfall over complex topographies (e.g., areas near mountains) by initiating and enhancing rainfall (Basist et al., 1994; Goovaerts, 2000; Al-Ahmadi and Al-Ahmadi, 2013; Zhang et al., 2017; Yu et al., 2018; Sarmadi et al., 2019). Previous studies have revealed that the mean and maximum rainfall of station observations increase, reach a maximum, and then decrease as the elevation becomes higher (Fo, 1992; Bookhagen and Burbank, 2006; Nikolopoulos et al., 2015; Salerno et al., 2015; Zhou et al., 2019). When the climate is very wet, the occurrence height of the maximum rainfall over the windward slope will occur in the foothills (Fo, 1992), where a notable enhancement of rainfall can be observed (Frei and Schär, 1998). Therefore, the orographic effects of foothills and mountains on rainfall play a profound role in the final distribution of rainfall over land (Houze, 2012). In the YRB, the relationship between the rainfall and the local topography has been investigated using numerical simulations and other methods (Feng and Zhang, 2007; Shi et al., 2012). In addition, the mesoscale features of the topography over the Tibetan Plateau also play an important role in generating mesoscale disturbances, which propagate eastward to enhance convection and precipitation over the YRB (Shi et al., 2008). These studies demonstrate that the complex terrain over the YRB also has significant influences on the regional rainfall distribution. In conclusion, a thorough understanding of the spatiotemporal rainfall characteristics over the different terrain features of the YRB is necessary to understand how the terrain impacts the rainfall distribution over the YRB.
The present paper is dedicated to exploring in detail the spatiotemporal rainfall characteristics over different underlying features in the middle reaches of the YRB. Hourly rain gauge data are used to analyze the spatiotemporal characteristics of TR and SDHR during the warm season (May–September) from 2016 to 2020. The main differences between TR and SDHR are also discussed.
The remainder of this paper is organized as follows: Section 2 introduces the data and methods. Section 3 presents the statistical results of TR and SDHR, including their spatial distributions, annual and monthly variations, as well as the evolution of their diurnal variations. Finally, a summary is given in section 4.
-
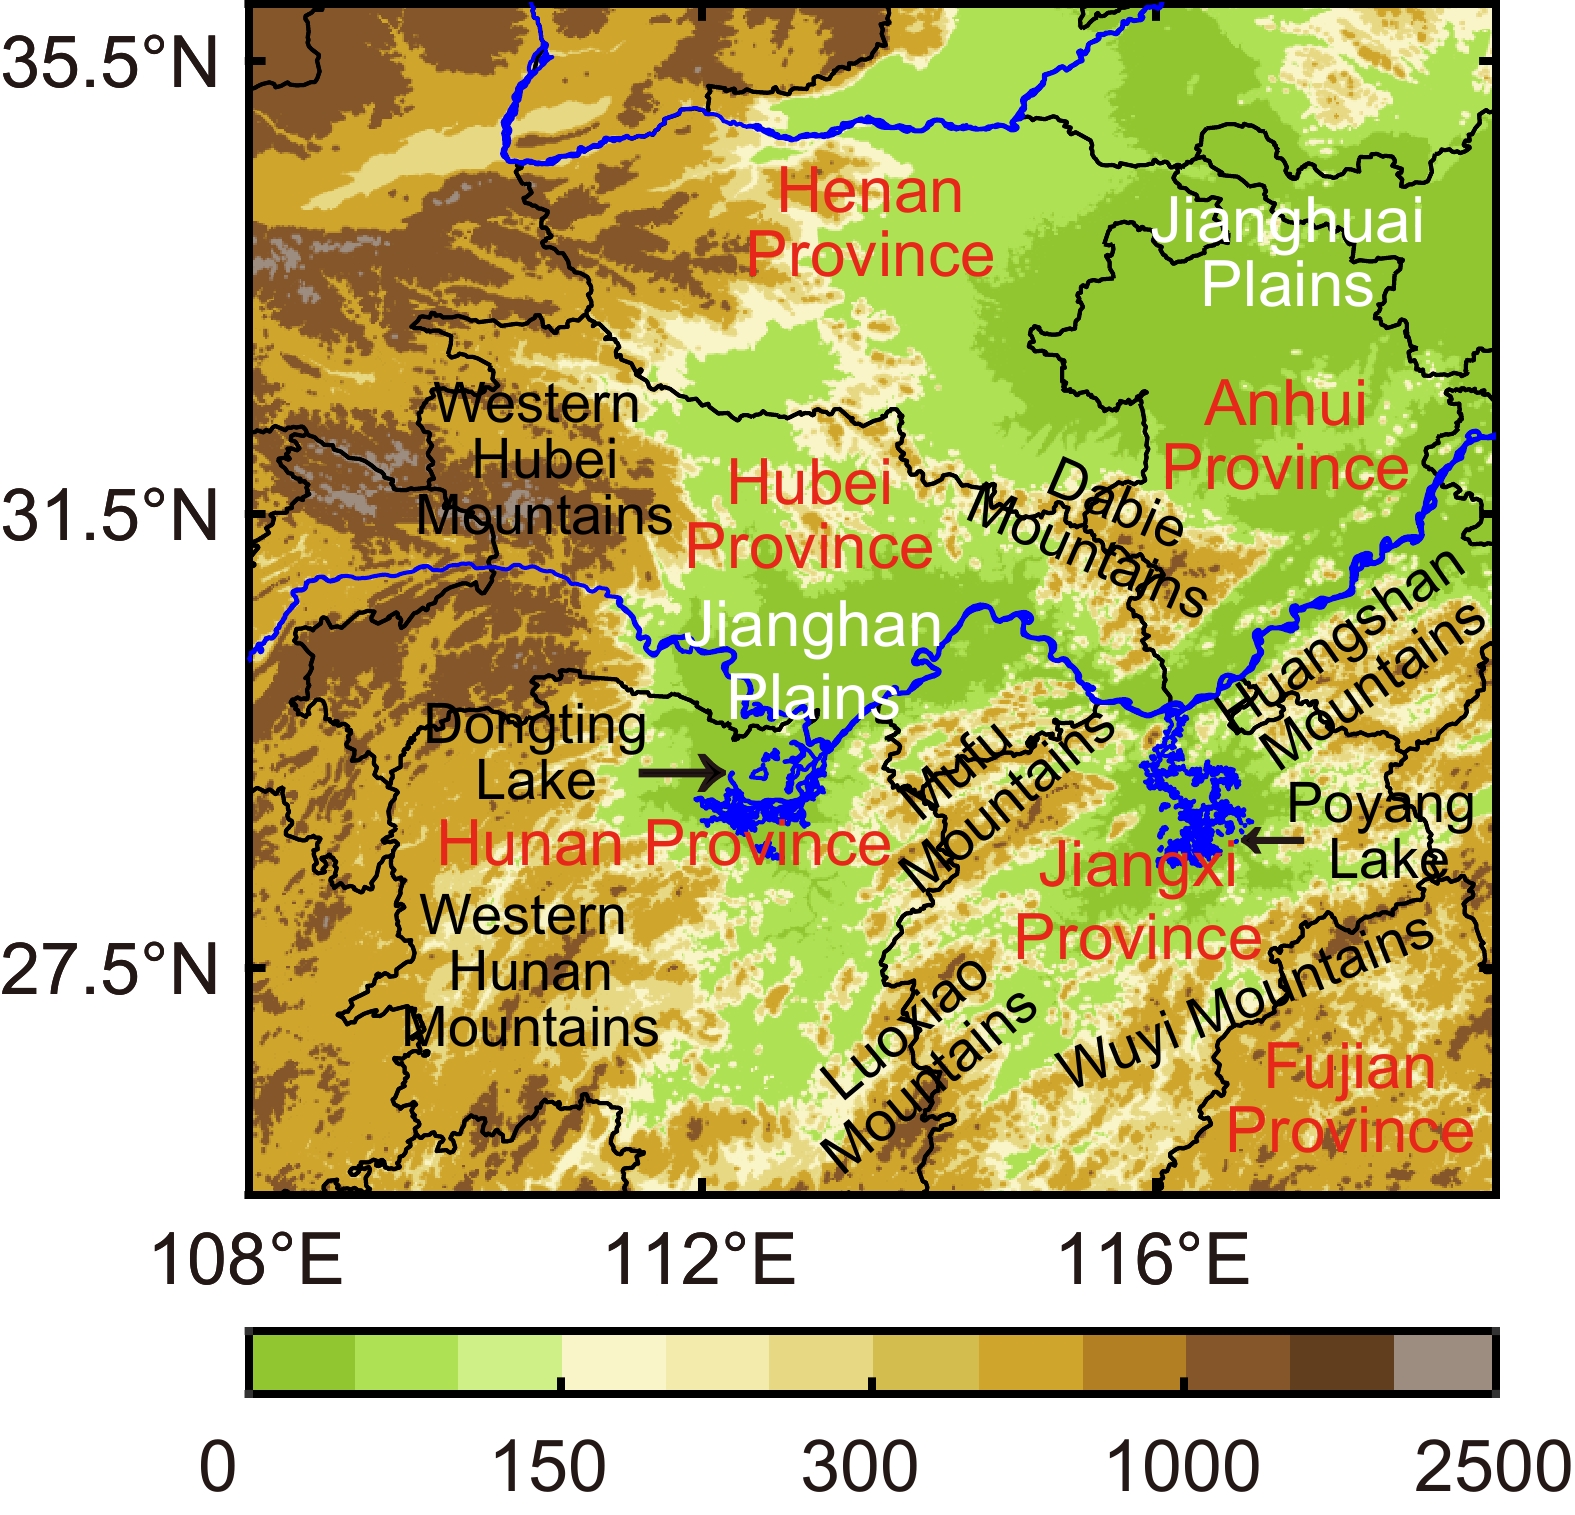
In this study, we define the middle reaches of the YRB as the region within 25.5°–36.0°N and 108°–119°E (Fig. 1). The underlying surface of this region is complex, due to the dense distribution of cities, rivers and lakes, as well as the unique terrain with low elevation in the central part but high elevation in the eastern and western parts (Fig. 1). The mountains located in the western part are the second-step terrain over the YRB, which has an elevation greater than 700 m (Yang et al., 2020). Hourly rain gauge data during the warm season (May–September) from 2016 to 2020 were obtained from the National Climate Center of the China Meteorological Administration. There are a total of 2596 assessment rain gauge stations over the middle reaches of the YRB. To reduce the influence of missing values on the statistical results, stations were selected using the following criteria. For a given station, a month with at least one rainfall record was treated as an effective month, and a year with more than three effective months was treated as an effective year. Based on the above procedures, a total of 2529 stations (Fig. 2a), including 664 national stations (Fig. 2b), were selected. Then, the observational data from these stations were subjected to quality control by applying a spatiotemporal consistency check (Ren et al., 2010), which consists of a climatological and regional limit value test (Step 1), a time consistency test (Step 2), and a spatial consistency test (Step 3). The three steps can eliminate possible false rainfall records, including abnormally high values (Step 1), continuously unchanged values (Step 2), and abnormal high values of a station compared with its nearby stations (Step 3). In the analysis that follows, TR represents all hourly rainfall events, while SDHR only includes events with hourly rainfall no less than 20.0 mm. Rainfall frequency for a period of time is defined as the accumulated number of hours with a rainfall amount of no less than 0.1 mm. Rainfall intensity is obtained by dividing the rainfall amount by the rainfall frequency.
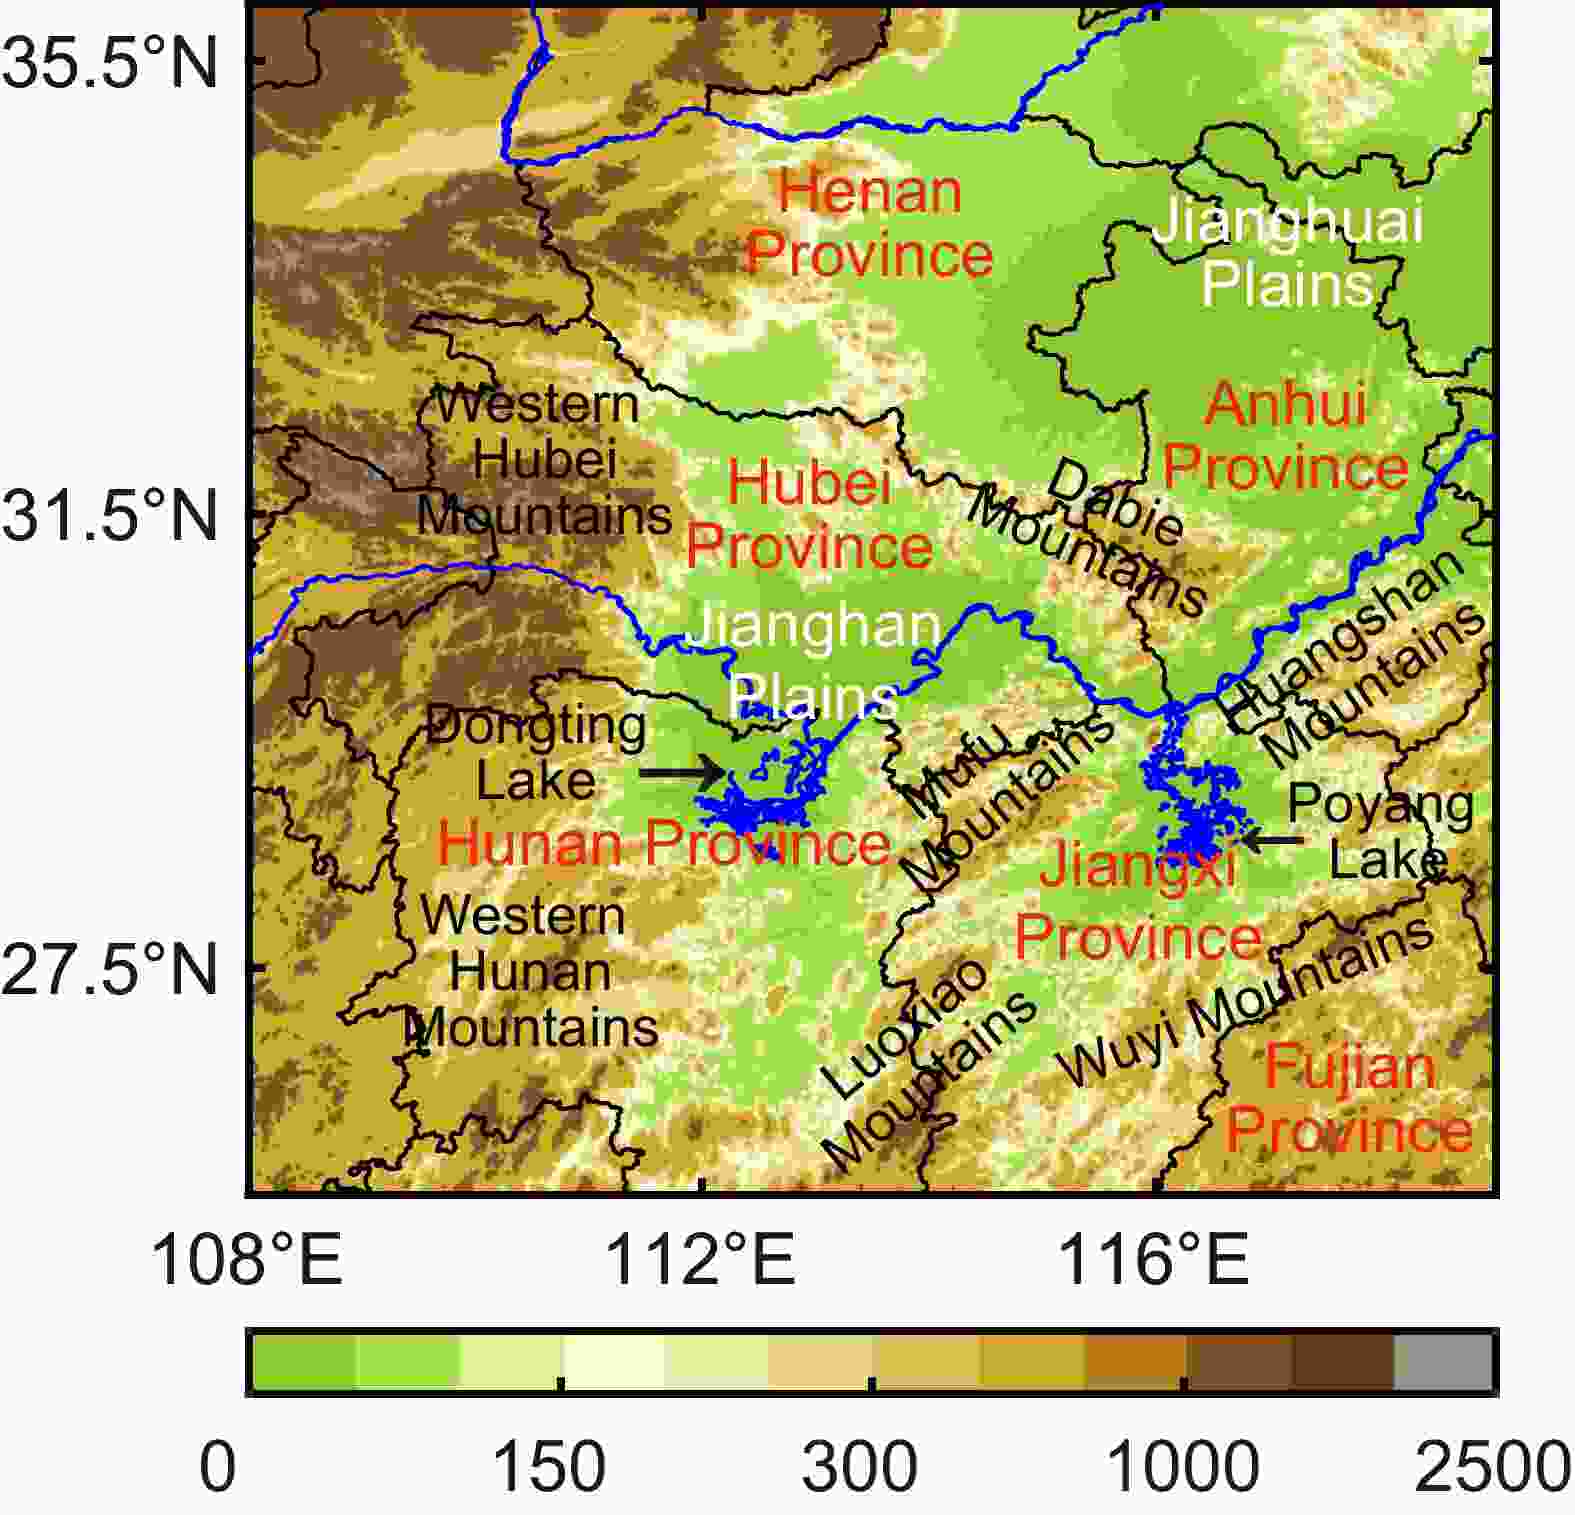
Figure 1. Topographic map (shading; units: m) of the middle reaches of the YRB. Blue lines denote rivers. Black lines denote provincial boundaries. Lakes are labeled with black arrows. Provinces are labeled in red. Plains are labeled in white.
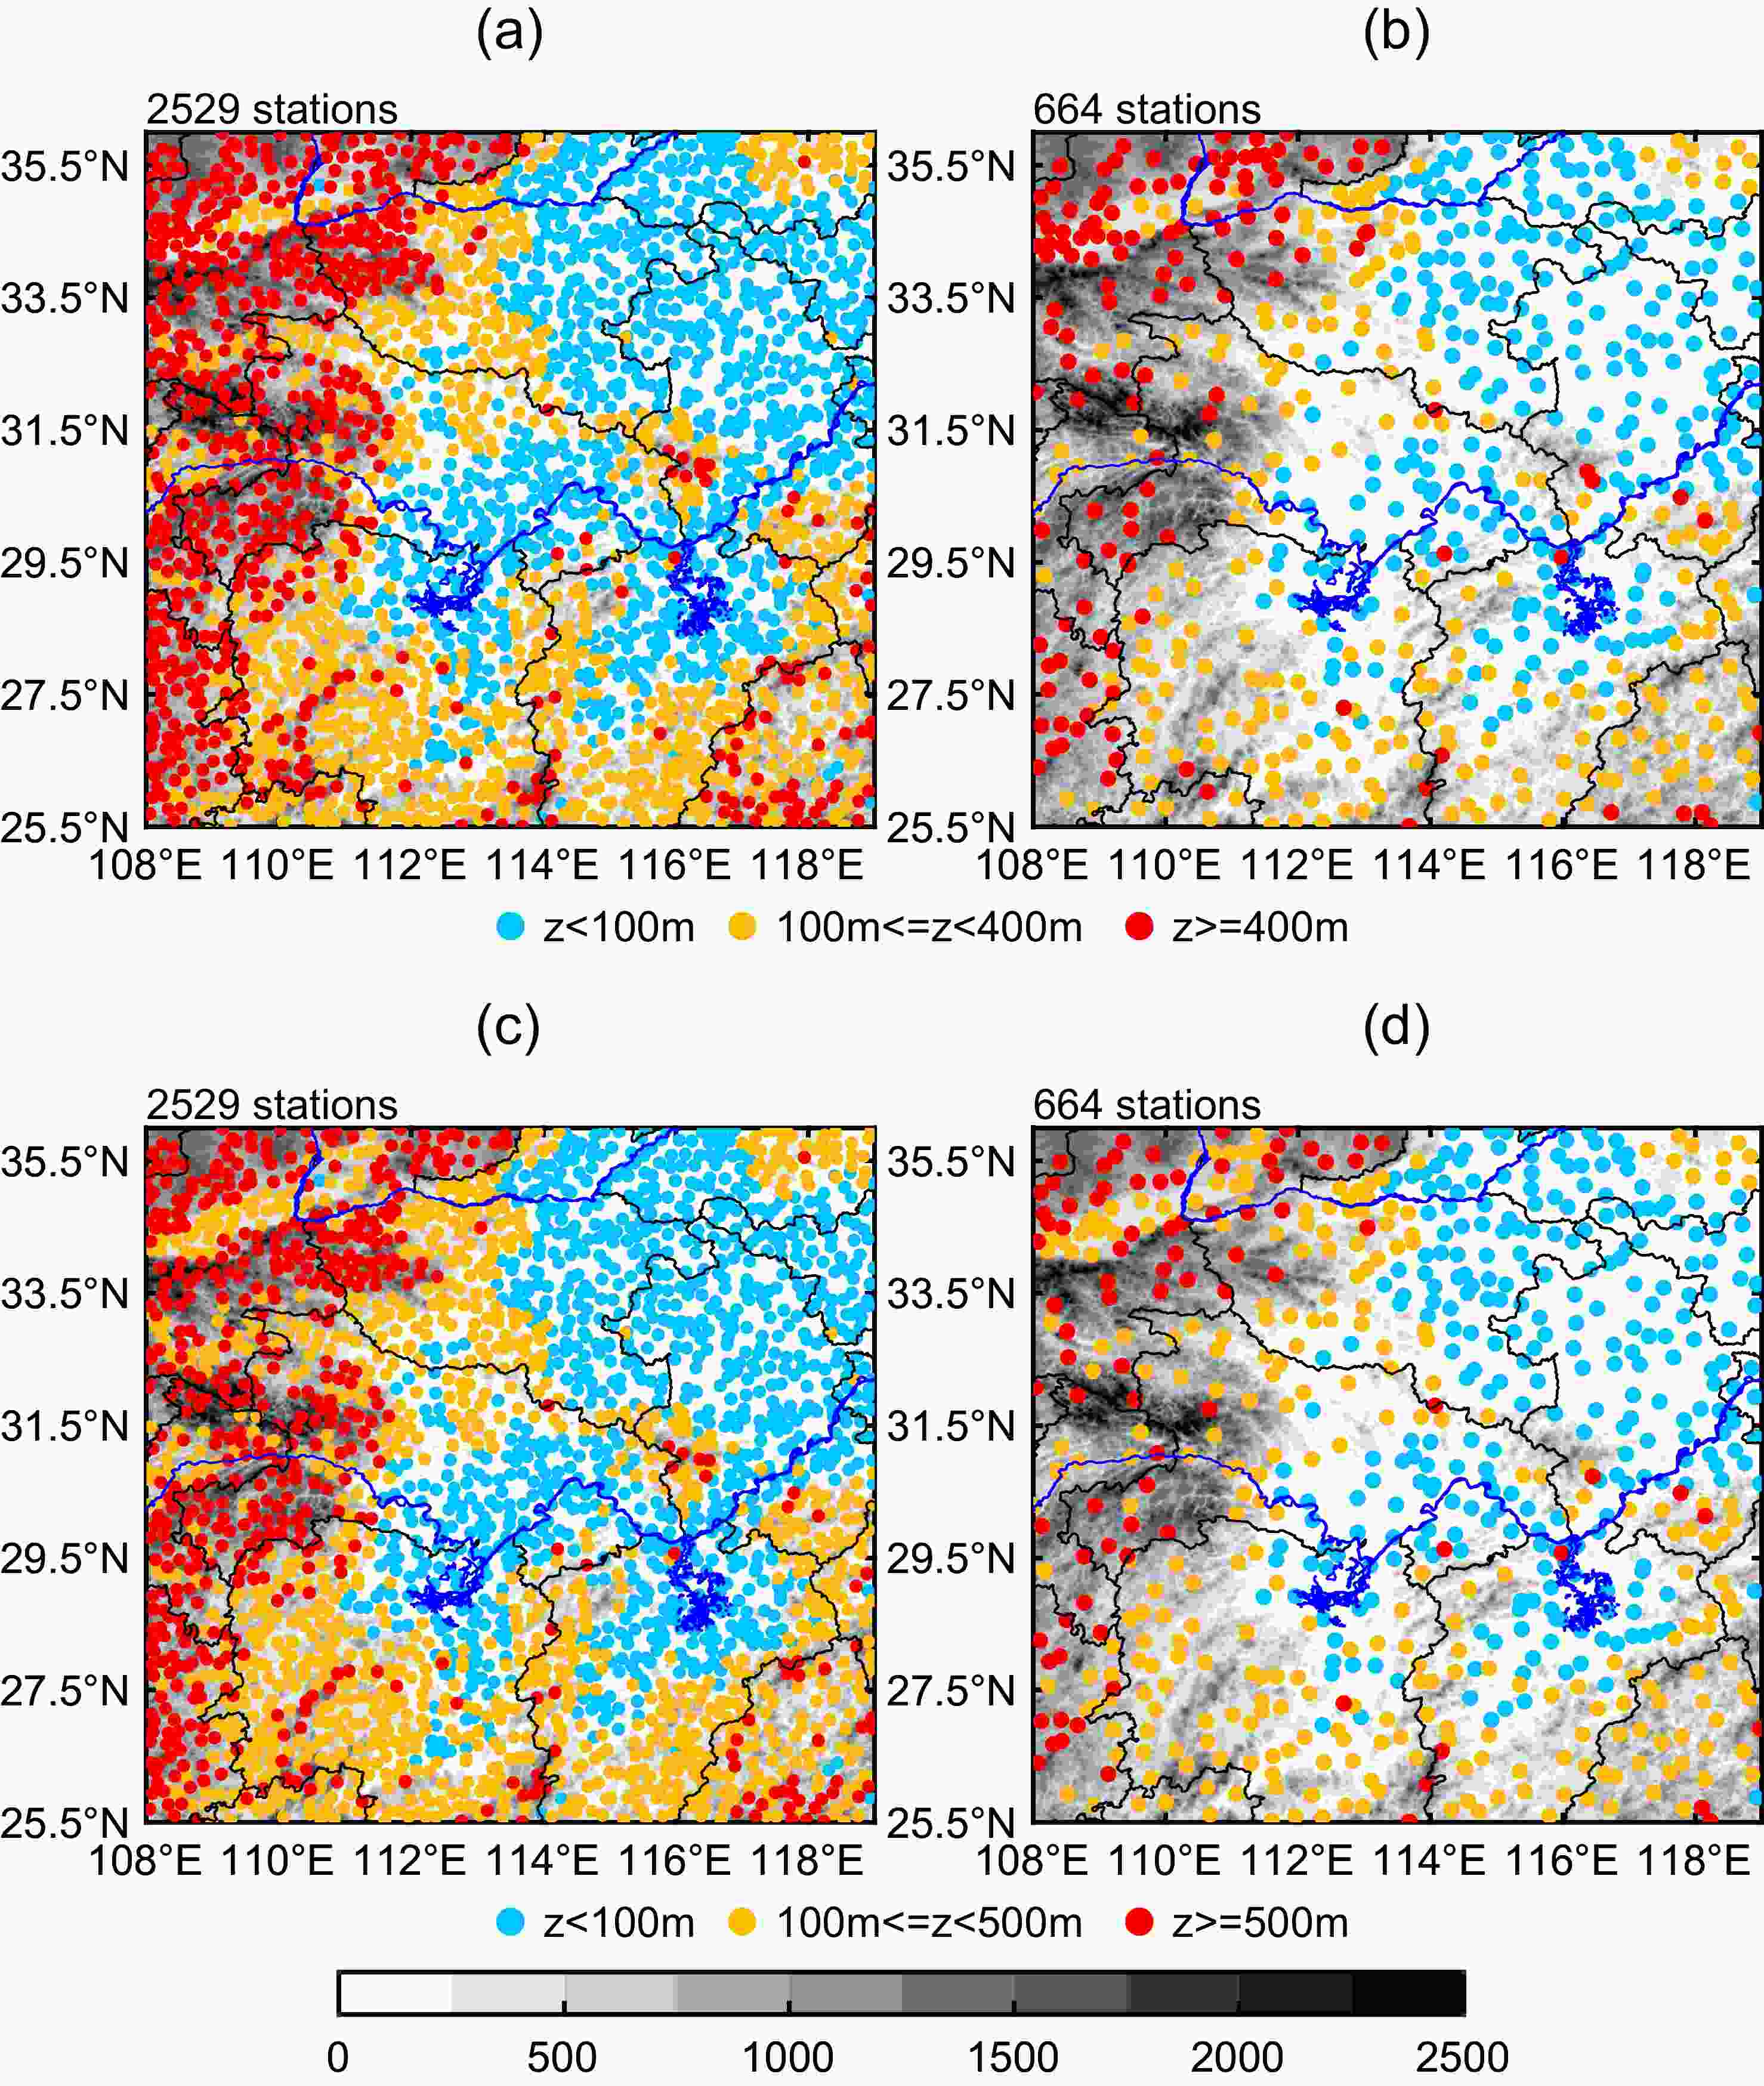
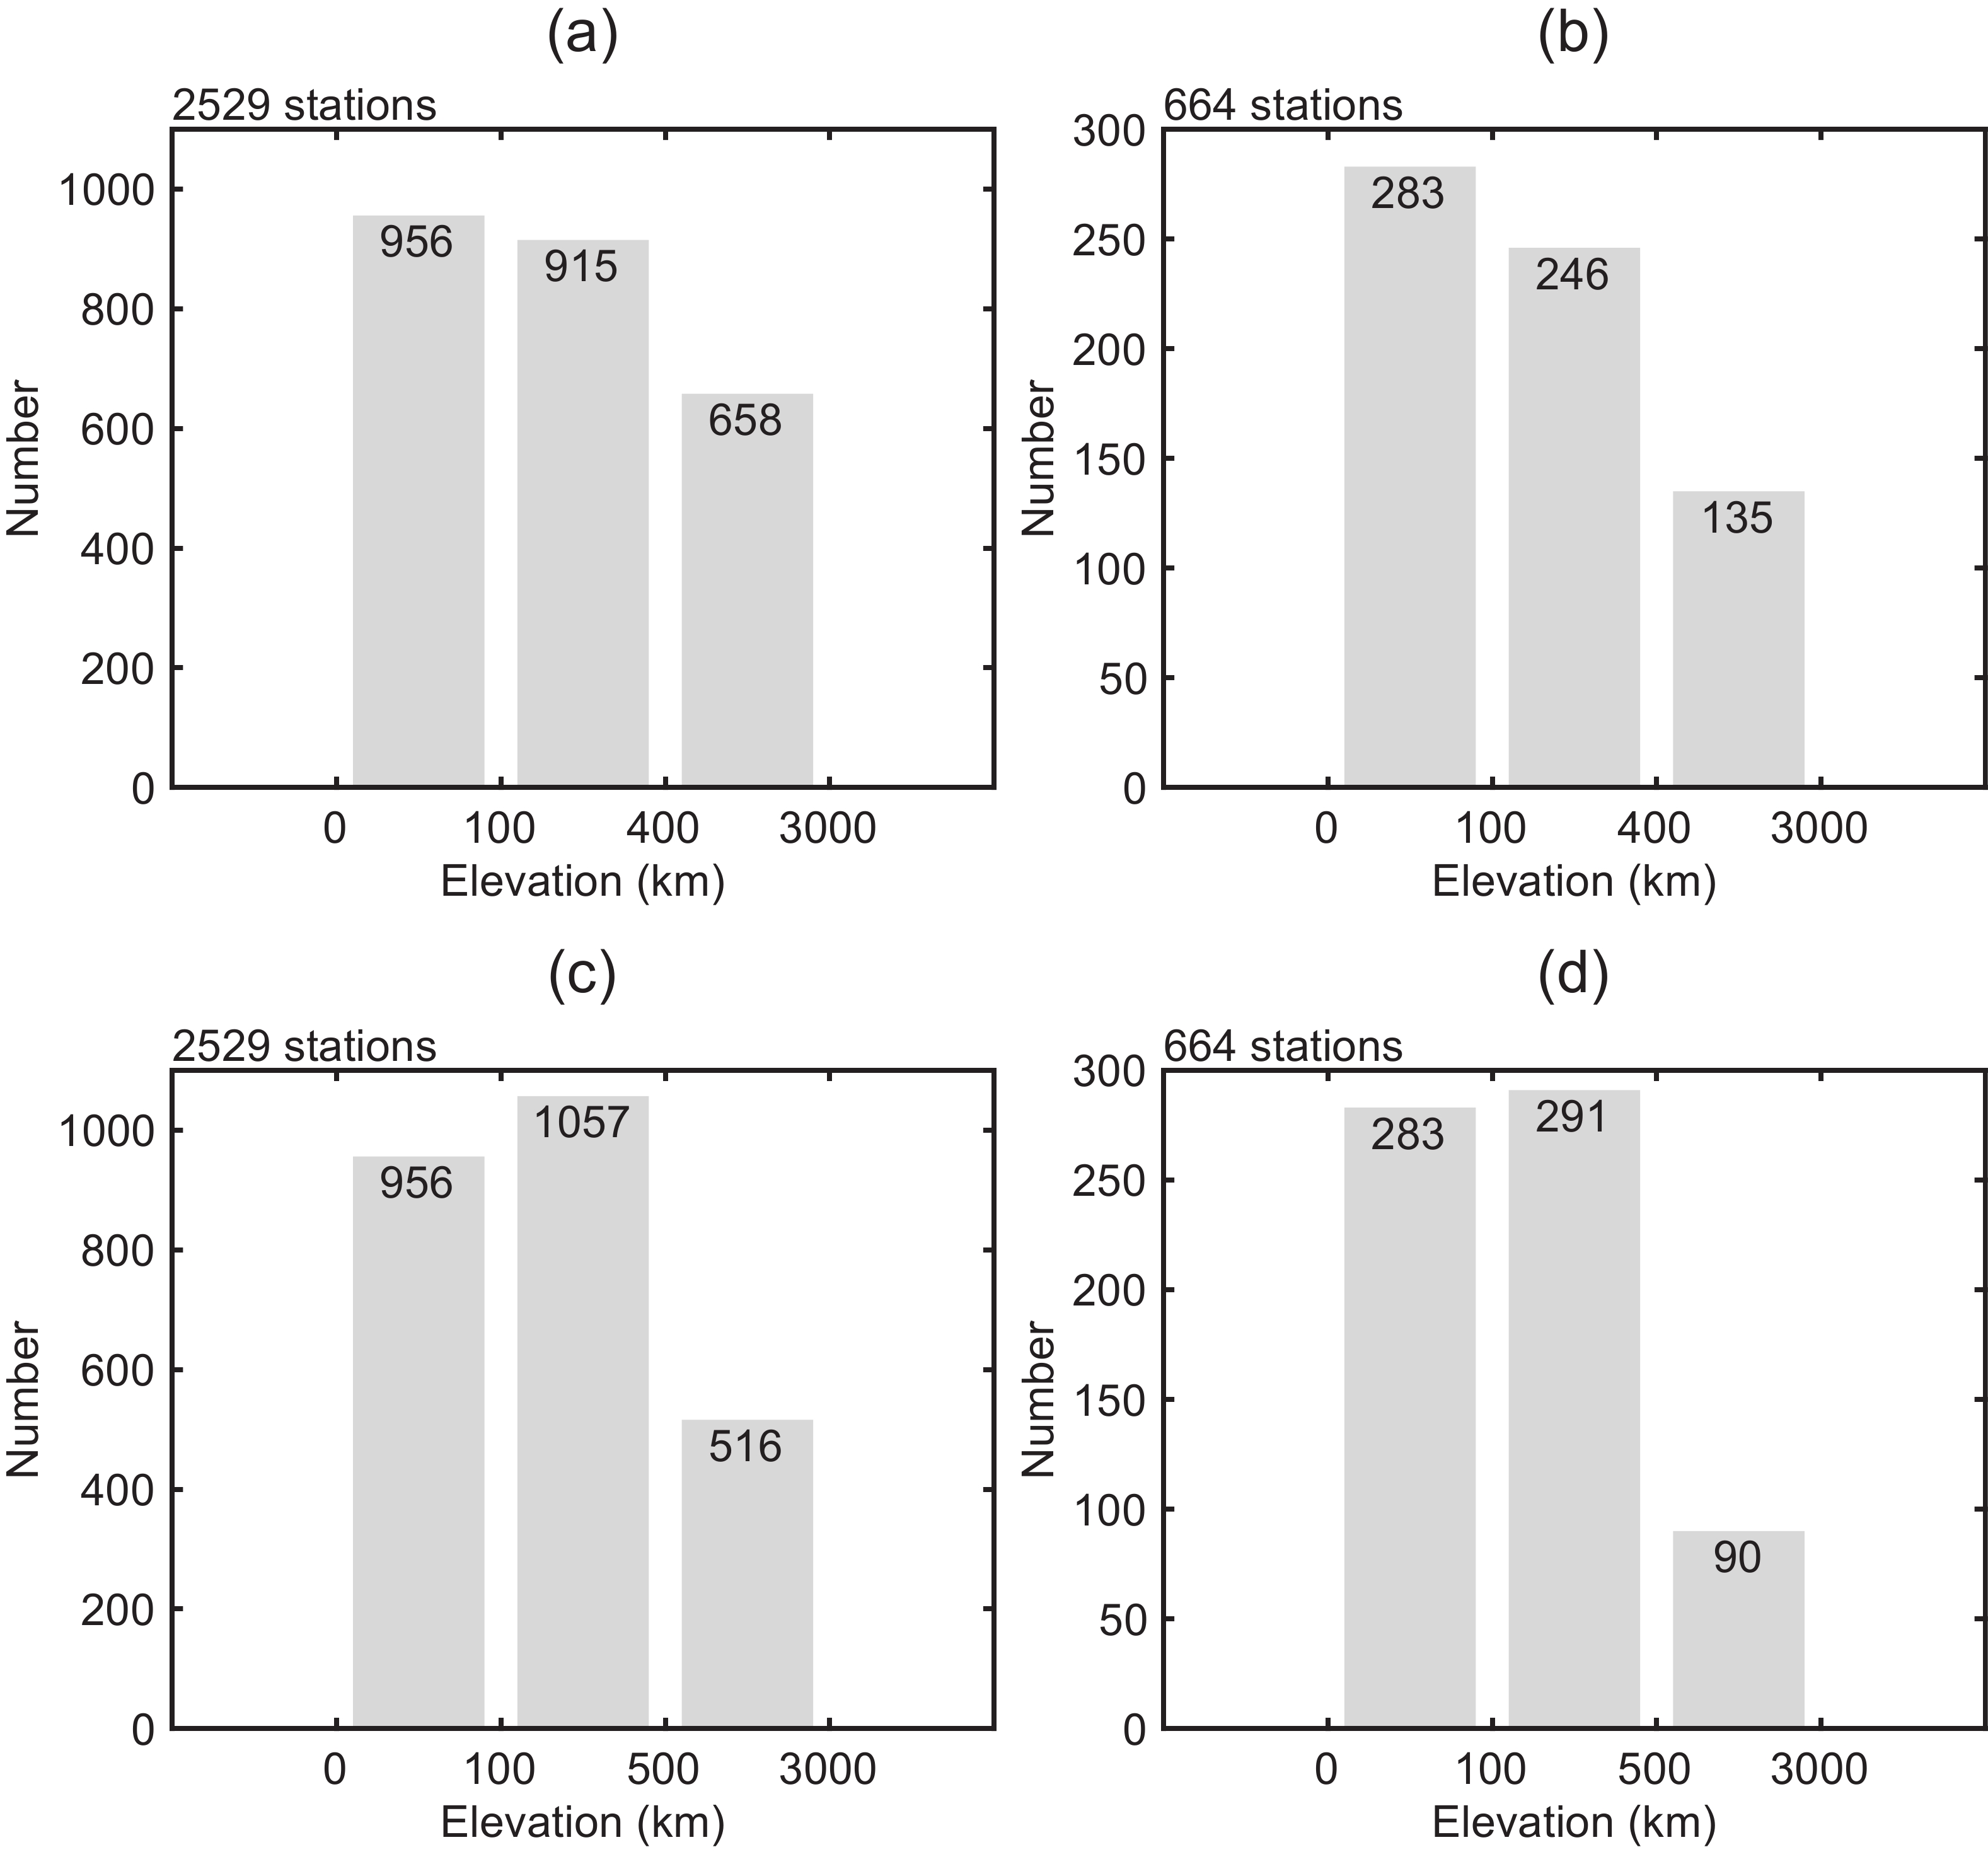
Figure 2. Locations of rivers (blue lines) and meteorological stations: (a) assessment stations for Criteria 1; (b) national stations for Criteria 1; (c) assessment stations for Criteria 2; (d) national stations for Criteria 2. The red dots denote mountain stations with elevations higher than 400 m (Criteria 1) or 500 m (Criteria 2). The orange dots denote foothill stations with elevations between 100 m and 400 m (Criteria 1) or 100 m and 500 m (Criteria 2). The light blue dots denote plain stations with elevations lower than 100 m. The black lines denote provincial boundaries. Gray shading indicates the elevation (units: m).
To analyze the impacts of terrain on rainfall, previous studies have used different criteria to classify stations into different categories. Some of them distinguished between mountains and plains with a threshold of 500 m (Yang and Sun, 2018; Ma et al., 2021). Other studies defined areas with an elevation below 100 m as plains, areas with an elevation above 400 m as mountains, and areas with an elevation between 100 and 400 m as foothills (Wang et al., 2020; Yu et al., 2021). To obtain a reasonable classification criterion in the present study area, station numbers (Fig. 3) and spatial distribution (Fig. 2) from two sets of criteria (Criteria 1: 0–100 m defines “plain”, 100–400 m defines “foothill”, and more than 400 m defines “mountain”; Criteria 2: 0–100 m defines “plain”, 100–500 m defines “foothill”, and more than 500 m defines “mountain”) are compared. The results obtained by Criteria 2 show that the percentage of mountain stations to foothill or plain stations is only about 50%. However, this ratio increases up to 70% when Criteria 1 is used. The spatial distribution related to the different stations from the two sets of criteria are similar (Fig. 2). Therefore, Criteria 1 is used to classify the stations into mountain, foothill, and plain stations in the present study. Thus, the limitation on the statistical results due to the uneven sample sizes could be reduced as much as possible, and at the same time the topographic characteristics of the middle reaches of the YRB could be reasonably manifested. The spatial distributions of these classified stations are shown in Figs. 2a and b. Mountain stations, plain stations, and foothill stations are mainly concentrated in the western, northeastern, and southern parts of the study area, respectively.
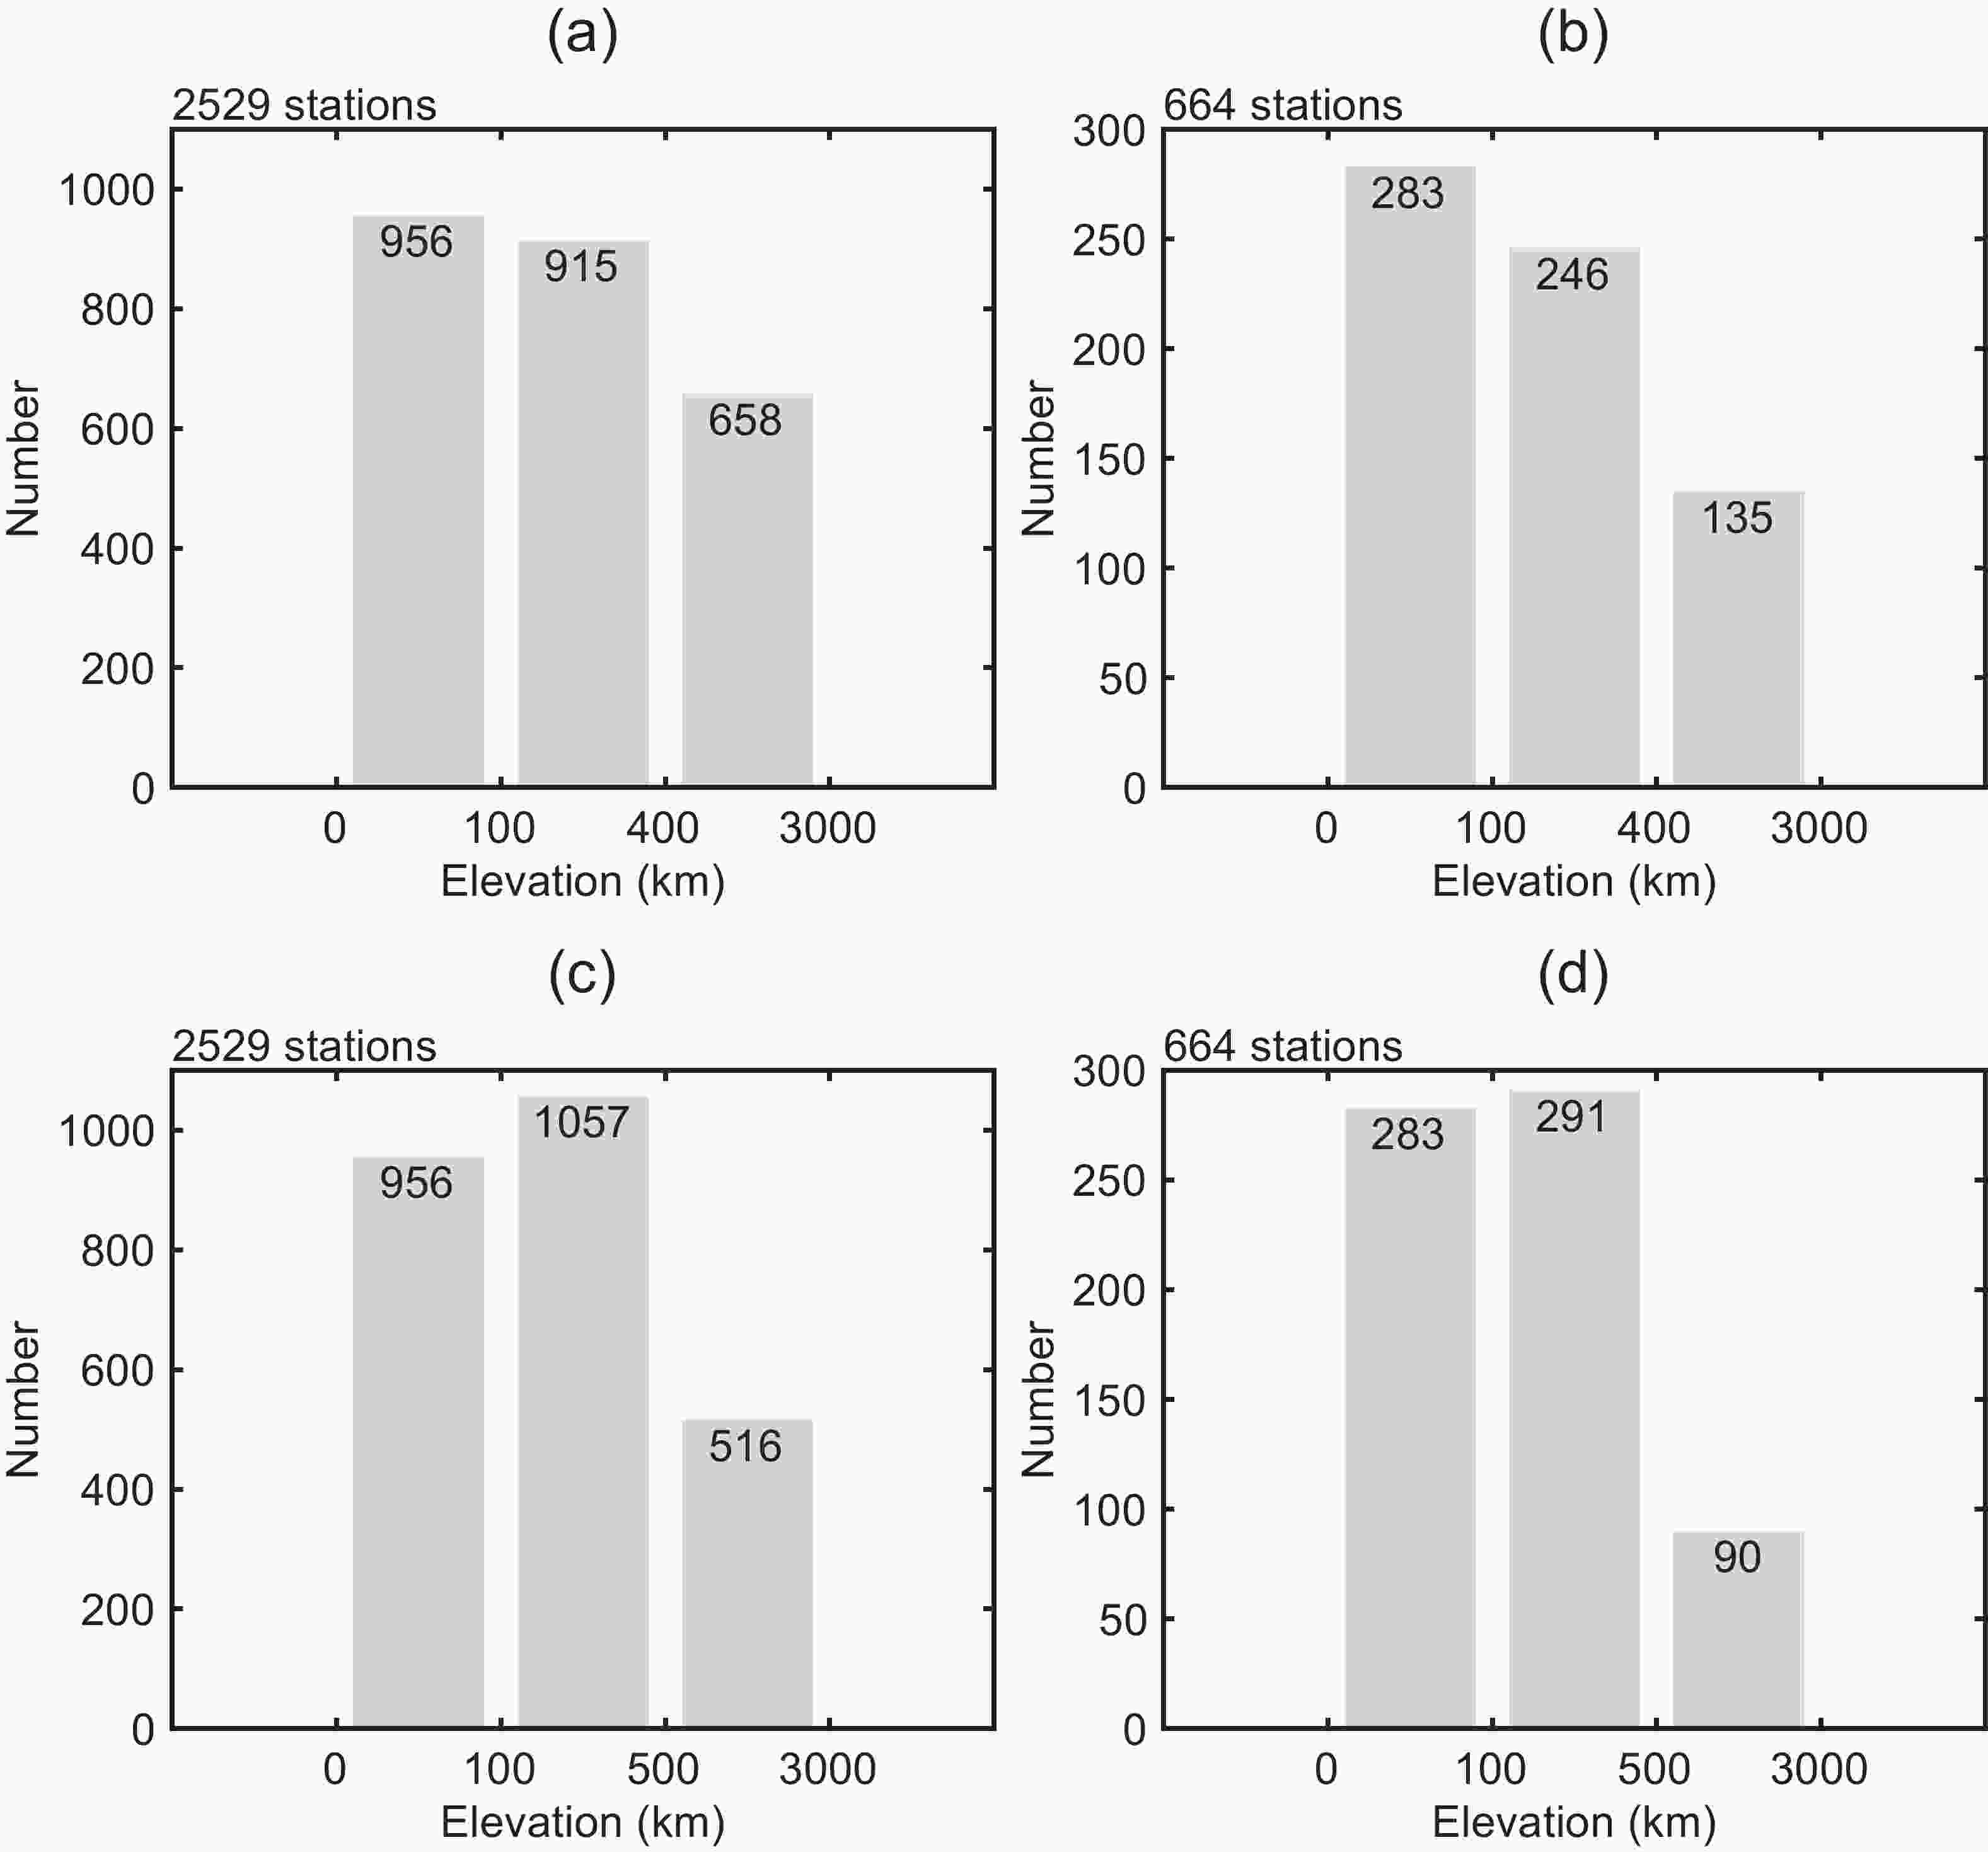
Figure 3. Numbers of mountain, foothill, and plain stations corresponding to (a, c) assessment stations and (b, d) national stations, based on (a, b) Criteria 1 and (c, d) Criteria 2. Criteria 1 defines areas with elevations lower than 100 m as plains, between 100–400 m as foothills, and higher than 400 m as mountains. Criteria 2 is slightly different from Criteria 1 in the threshold distinguishing mountains from foothills, which is substituted as 500 m.
-
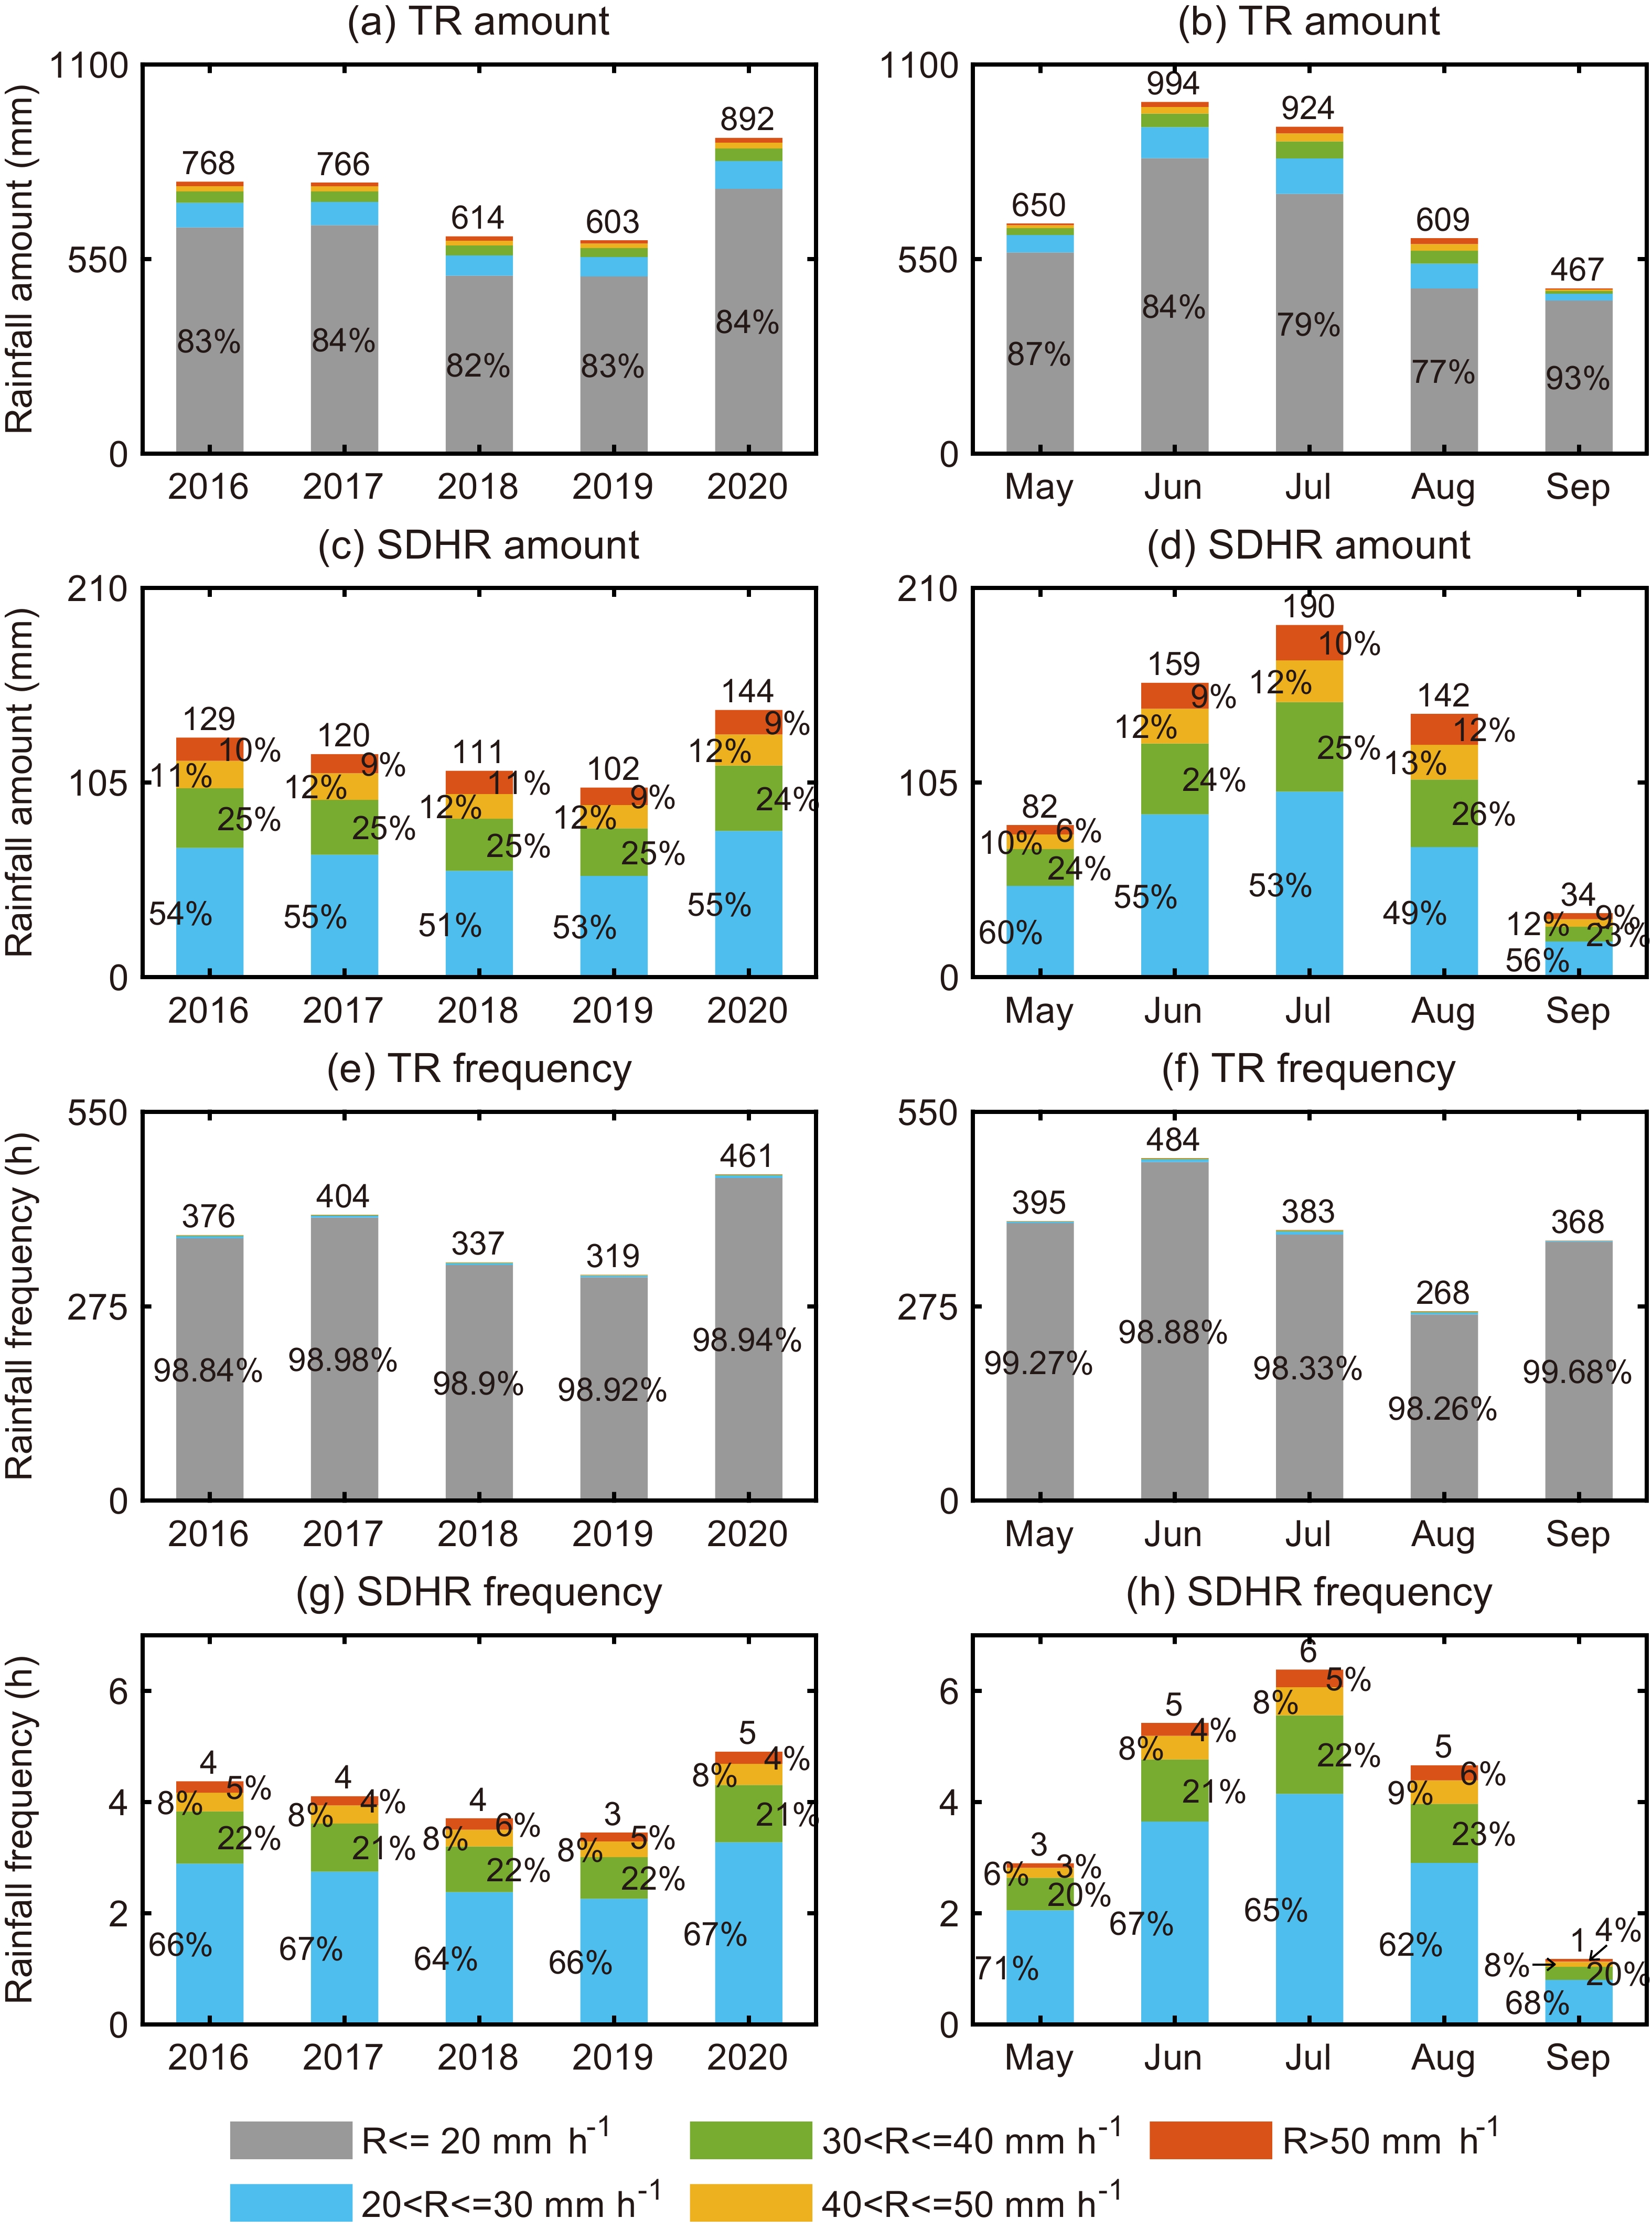
Figure 4 shows the annual and monthly variations of TR and SDHR based on the averaged results of all stations over the middle reaches of the YRB during the warm season (May–September) from 2016 to 2020. The annual variations of both TR and SDHR show a consistent pattern in terms of the amount and frequency (Figs. 4a, c, e and g), with a low rainfall amount (frequency) occurring in 2018 and 2019 and the highest rainfall amount (frequency) occurring in 2020. The peak values are related to the frequent occurrence of long-duration heavy rainfall events over the YRB during June–August in 2020 (Ding et al., 2021; Fang et al., 2021; Wang et al., 2021; Tang et al., 2022). The annual rainfall-amount contribution of SDHR to TR (CST) falls within the range of 16% to 18% (Fig. 4a). However, when considering the occurrence frequency, it is noteworthy that the annual CST remains at about 1% (Fig. 4e), indicating the low frequency of SDHR. To further analyze the contribution of the different grades of SDHR, SDHR is divided into four parts according to the hourly rainfall intensity (20–30 mm h−1, 30–40 mm h−1, 40–50 mm h−1, and above 50 mm h−1). It is found that the four grades of rainfall account for about 51%–55% (64%–67%), 25% (21%), 12% (8%), and 10% (5%) of the total SDHR in terms of amount (frequency), respectively (Figs. 4c and g).
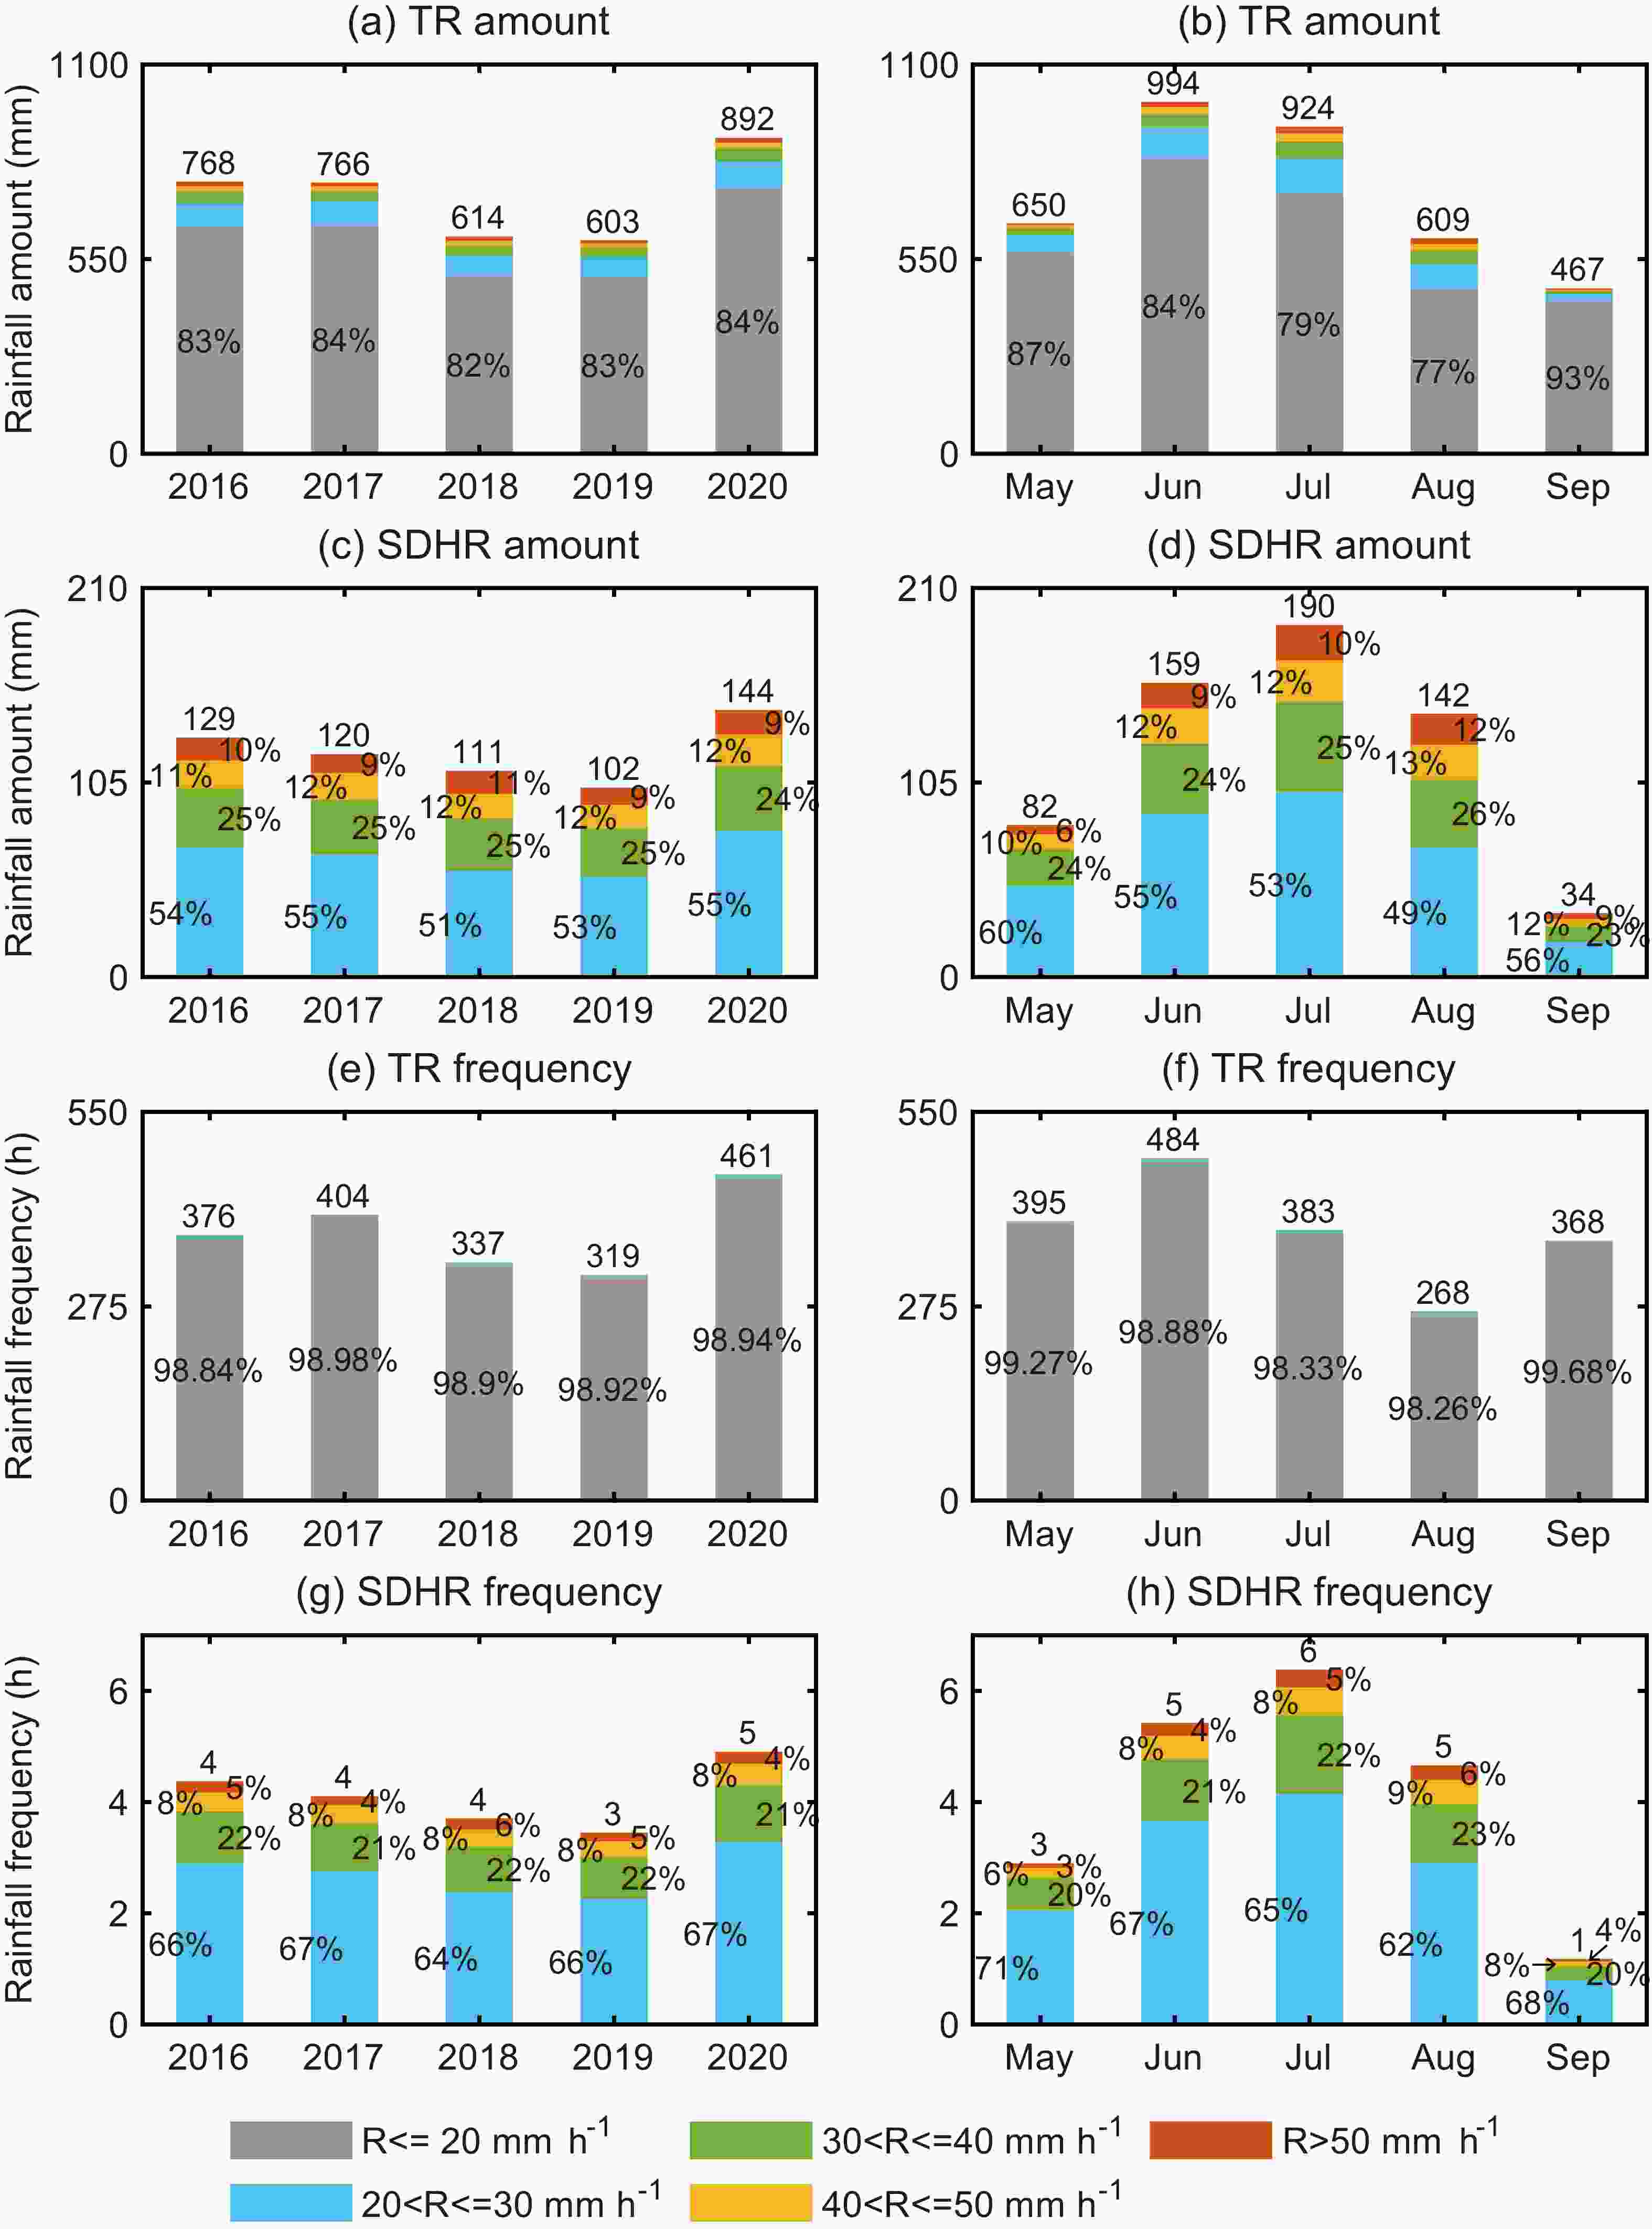
Figure 4. The (a, c, e, g) annual and (b, d, f, h) monthly variations of the (a, b) TR amount, (c, d) SHDR amount, (e, f) TR frequency, and (g, h) SHDR frequency, based on the averaged results of all 2529 stations over the middle reaches of the YRB during the warm season (May–September) from 2016 to 2020. In the histogram, gray, green, orange, and red shading indicates hourly precipitation of 0–20 mm, 20–30 mm, 30–40 mm, 40–50 mm, and above 50 mm, respectively. The number in each shaded part indicates its proportion.
It is well-known that rainfall in eastern China is closely related to the migration of the East Asian summer monsoon (EASM) in the warm season (Tao, 1987; Ding and Chan, 2005; Ding and Wang, 2008). With the onset and northward advancement of the EASM, the rainband moves from South China to North China from May to August. Generally, a quasi-stationary rainband (mei-yu front) is located over the YRB from mid-June to mid-July (Tao, 1987; Ding, 1992). The monthly variations of TR and SDHR over the middle reaches of the YRB therefore increase first and decline afterwards during May to August in both amount and frequency (Figs. 4b, d, f and h). The difference between TR and SDHR primarily lies in the peak month, with the former in June (Figs. 4b and f) but the latter in July (Figs. 4d and h). The July peak of SDHR is possibly associated with the stronger thermal effects in July compared to June. These thermal effects primarily control the local mesoscale weather systems that cause local precipitation (Houze, 1993; Guo et al., 2017). The monthly CST (in frequency) remains within the range of 0.32%–1.74% (Fig. 4f), while the monthly CST (in amount) increases from 13% to 23% from May to August and then decreases to 7% in September (Fig. 4b). Compared with the annual variation of the CST (in amount) with a range of 16%–18% (Fig. 4a), its monthly variation is more significant during the warm season. The contribution of the four grades of SDHR to total SDHR also varies widely from May to September (Figs. 4d and h). The four grades of hourly SDHR intensity account for 49%–60% (62%–71%), 23%–26% (20%–23%), 10%–13% (6%–9%), and 6%–12% (3%–6%) of the total SDHR in terms of amount (frequency), respectively. In addition, the annual and monthly variations of the SDHR amount (Figs. 4c and d) show similar patterns to those of SDHR frequency (Figs. 4g and h).
In general, precipitation can be divided into convective and stratiform precipitation according to their cloud properties (Houze, 1993). Convective precipitation usually corresponds to severe upward motion and unstable stratification, while stratiform precipitation usually occurs in relatively stable stratification (Tao et al., 1993; Houze, 1997). Previous studies have pointed out that it is impossible to completely distinguish convective precipitation from stratiform precipitation simply by setting a threshold of precipitation intensity (Wallace, 1975; Steiner et al., 1995). However, hourly precipitation of less than 2.5 mm can generally represent stratiform precipitation (Wallace, 1975; Fu and Liu, 2003). Hourly precipitation of between 5 mm and 10 mm can belong to either stratiform precipitation or convective precipitation, or a mixture of both (Steiner et al., 1995; Fu and Liu, 2003; Chen et al., 2013a). Hourly precipitation up to 20 mm and above can only be caused by convective clouds (Davis, 2001; Fu and Liu, 2003; Zhang and Zhai, 2011; Chen et al., 2013a; Zheng et al., 2019). Therefore, according to the definition of SDHR, the statistical results related to SDHR in this study can reasonably represent the changes of convective precipitation and its contribution to total precipitation. Consequently, the results in Fig. 4 further indicate that the annual contribution of convective precipitation to total precipitation could reach at least 16% in terms of amount during the warm season over the middle reaches of the YRB, and the monthly contribution increases from May to August with a peak of at least 23% in August. The annual or monthly contribution of convective precipitation frequency to total precipitation frequency is below 2%.
-
The topography of the middle reaches of the YRB is characterized by high elevation in the east and west, but low elevation in the central part (Fig. 1). Such topographic features are usually an important factor affecting the distribution of local rainfall, especially heavy rainfall (Yao et al., 2020; Chen et al., 2022; Tang et al., 2022). In order to investigate the temporal and spatial distribution characteristics of TR, SDHR, and CST, in both amount and frequency, over the different terrain features of the middle reaches of the YRB, the rainfall characteristics over the mountains, in the foothills, and over the plains are analyzed based on the hourly data from mountain, foothill, and plain stations.
-
Figure 5 shows the spatial distribution of TR, SHDR, and CST over the middle reaches of the YRB during the warm seasons of 2016–20. The areas with a high TR amount are mainly located where the mountain and foothill stations are, near the mountainous area (Fig. 5a), which are referred to as the western Hubei Mountains, the western Hunan Mountains, the Mufu Mountains, the Dabie Mountains, the Huangshan Mountains, and the Wuyi Mountains (Fig. 1). The spatial distribution of TR frequency is consistent with that of TR amount (Fig. 5d), except for a high-value area (marked with red triangles) in the western Hubei Mountains, which indicates the frequent occurrence of weak rainfall in this region as shown in Fig. 5g. The intensity of TR in the study area shows a pattern of low intensity in the west (most areas are mountains) and relatively high intensity in the east (most areas are foothills and plains). The spatial distribution of SDHR has some different characteristics compared with TR. The areas with a high SDHR amount are concentrated in the foothills and over the plains near the above-mentioned mountainous areas (Fig. 5b). These regions are also characterized by high CST in terms of amount (Fig. 5c). However, for the plain stations located in the northern part of Anhui Province, the eastern part of Henan Province, and the central part of Hubei Province, the CST in terms of amount can reach more than 30%. The SDHR frequency and its contribution to the TR frequency have similar spatial characteristics to the SDHR amount and its CST (Figs. 5e and f). The intensity of SDHR in the northern part of the study area is higher than that in the southern part (Fig. 5h). The monthly spatial distribution of SDHR frequency displays northward movement of the heavy rainbands from May to August (Fig. 6). In June and July, when heavy precipitation occurs frequently, the high-value areas (SDHR frequency more than 15) are mainly distributed where the foothill and plain stations are, near the mountainous areas in Hubei, Hunan, and Jiangxi provinces. The SDHR amount has a similar monthly spatial pattern (figure not shown). In short, the spatial characteristics of TR and SDHR suggest that the topography over the middle reaches of the YRB has a remarkable influence on the spatial distribution of the local precipitation.

Figure 5. Spatial distribution of the annual average (a) TR amount, (b) SHDR amount, (c) contribution rate of SHDR amount to TR amount, (d) TR frequency, (e) SHDR frequency, (f) contribution rate of SHDR frequency to TR frequency, (g) TR intensity, and (h) SHDR intensity, over the middle reaches of the YRB during the warm season (May–September) from 2016 to 2020. Triangles, circles, and crosses indicate mountain, foothill, and plain stations, respectively. The colors of symbols in (a) and (b) denote the rainfall amount (units: mm). The colors of symbols in (d) and (e) denote the rainfall frequency (units: h). The colors of symbols in (c) and (f) are denote ratios (%). The colors of symbols in (g) and (h) denote the intensity of hourly rainfall (units: mm h−1).
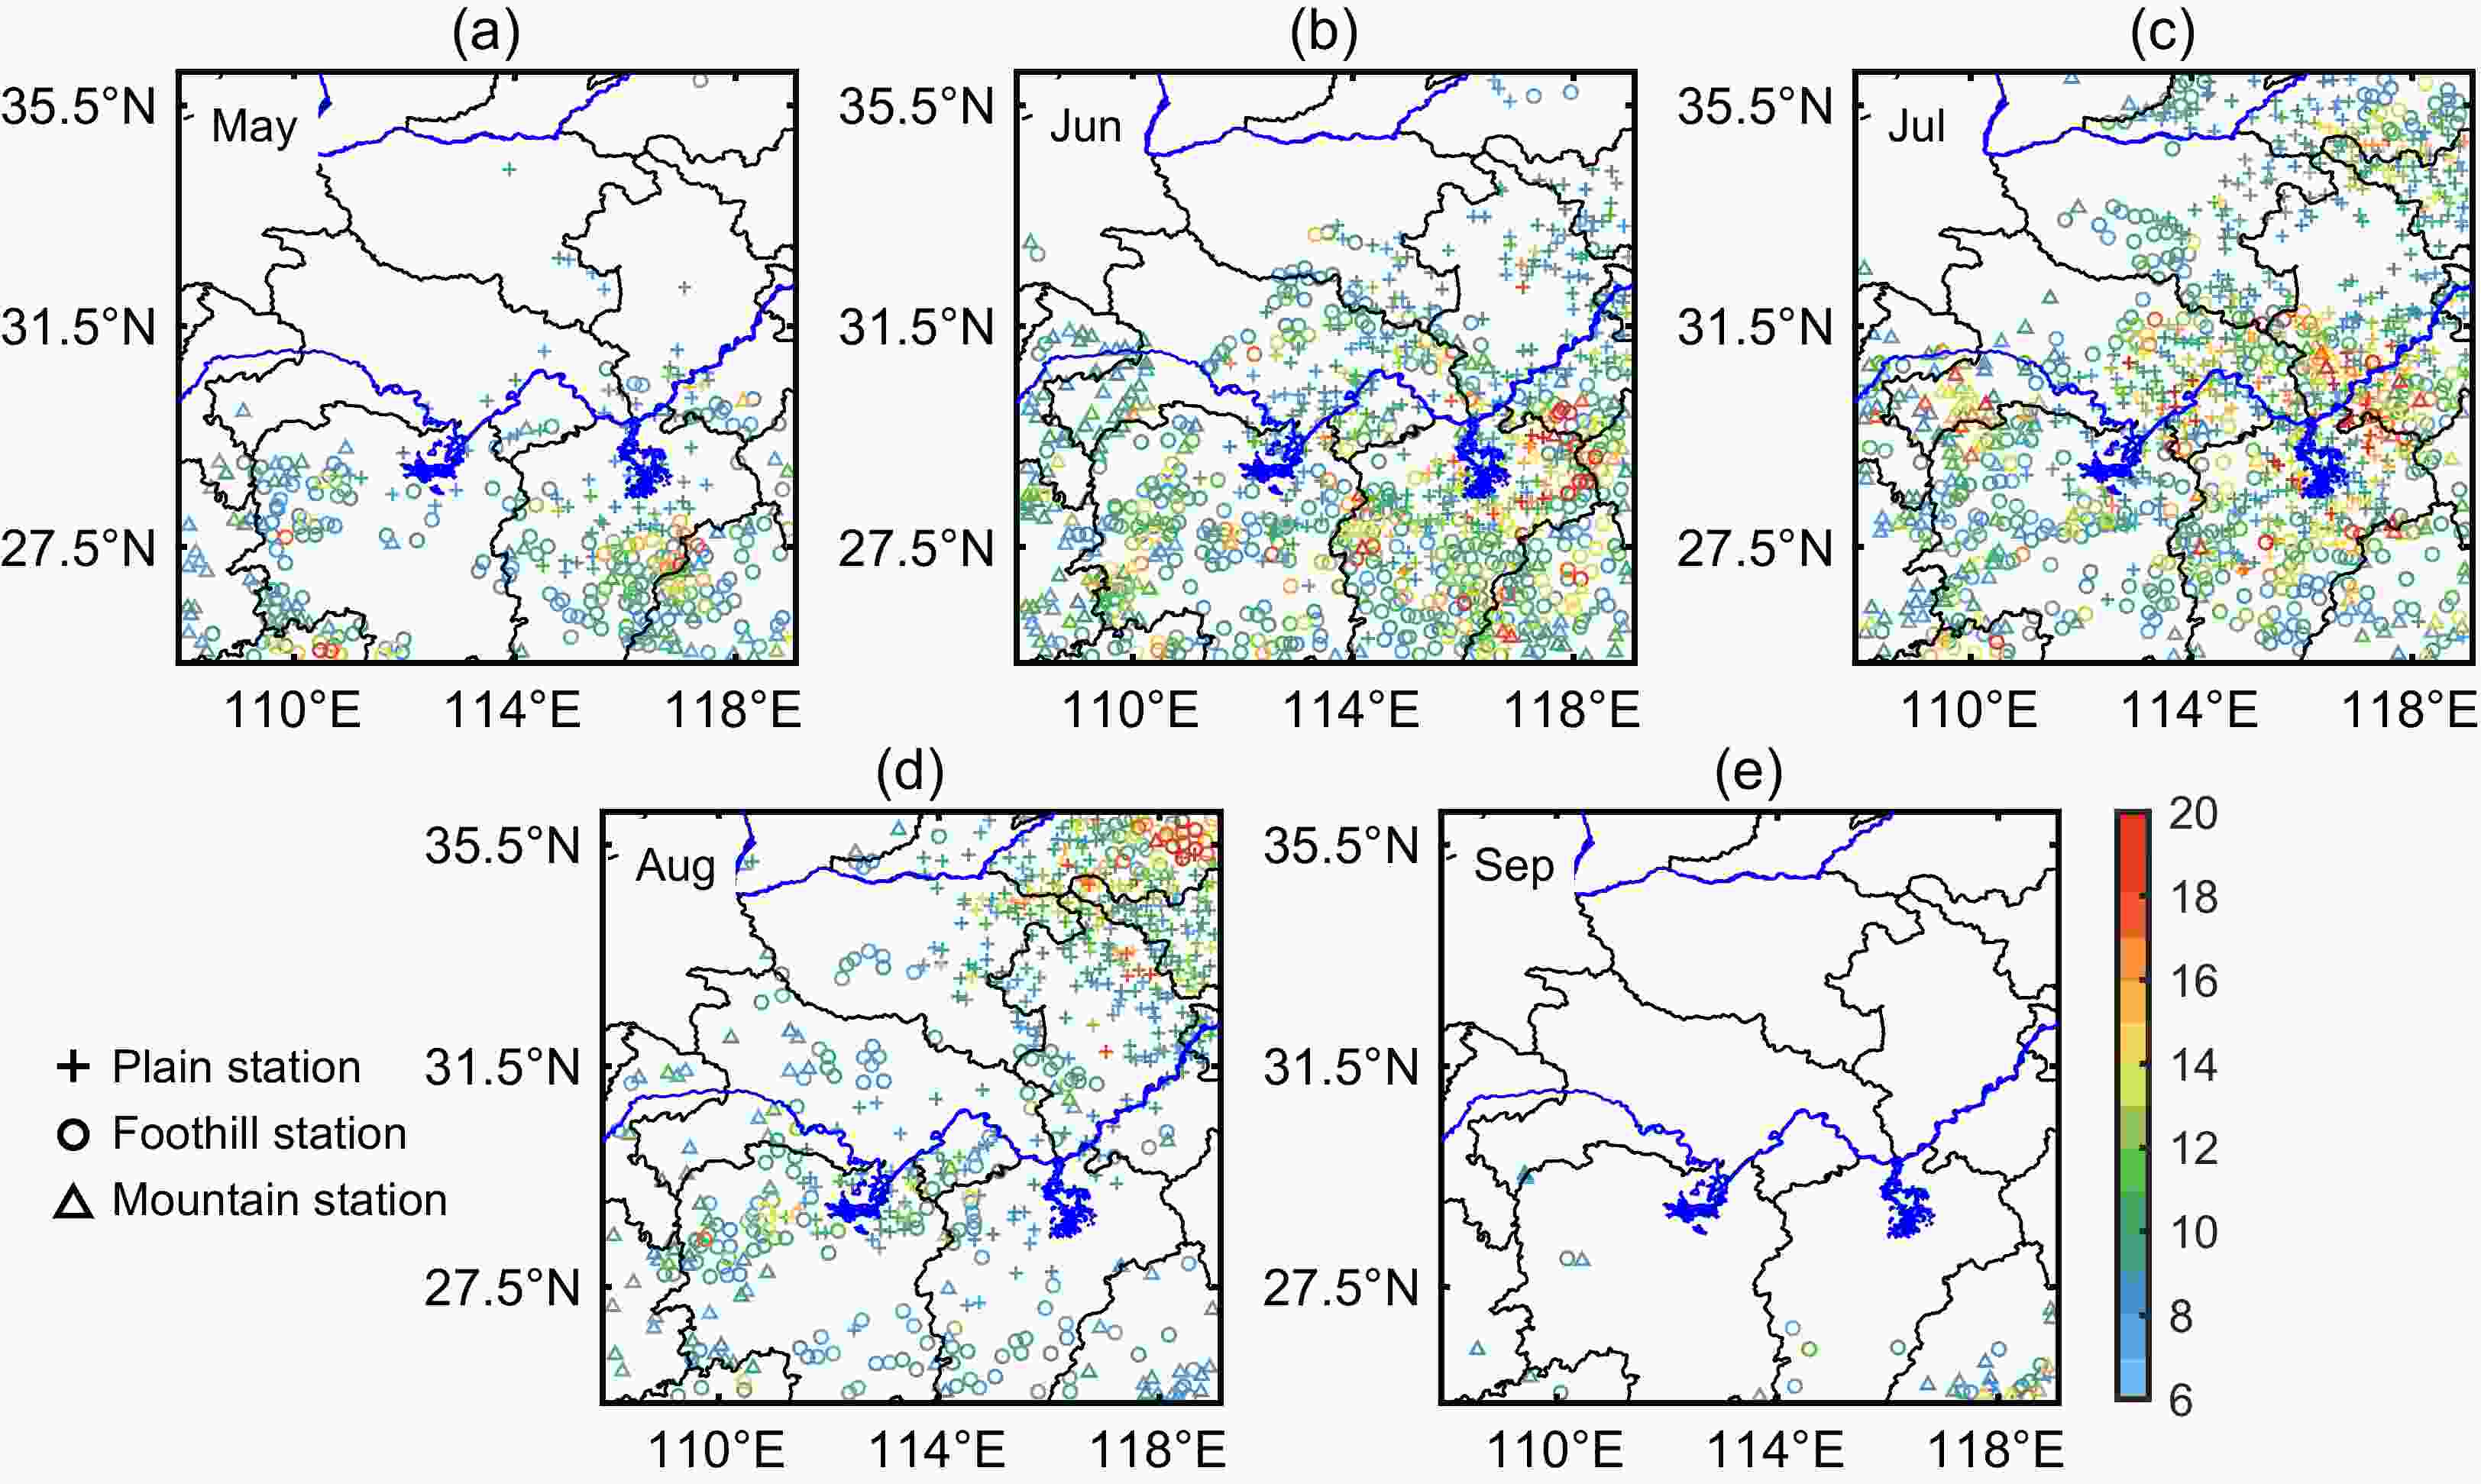
Figure 6. Monthly spatial distribution of the accumulated SHDR frequency over the middle reaches of the YRB in (a) May, (b) June, (c) July, (d) August, and (e) September. Triangles, circles, and crosses indicate mountain, foothill, and plain stations, respectively. The colors of symbols denote the rainfall frequency (units: h). Stations with SDHR frequency less than 6 h are not displayed.
-
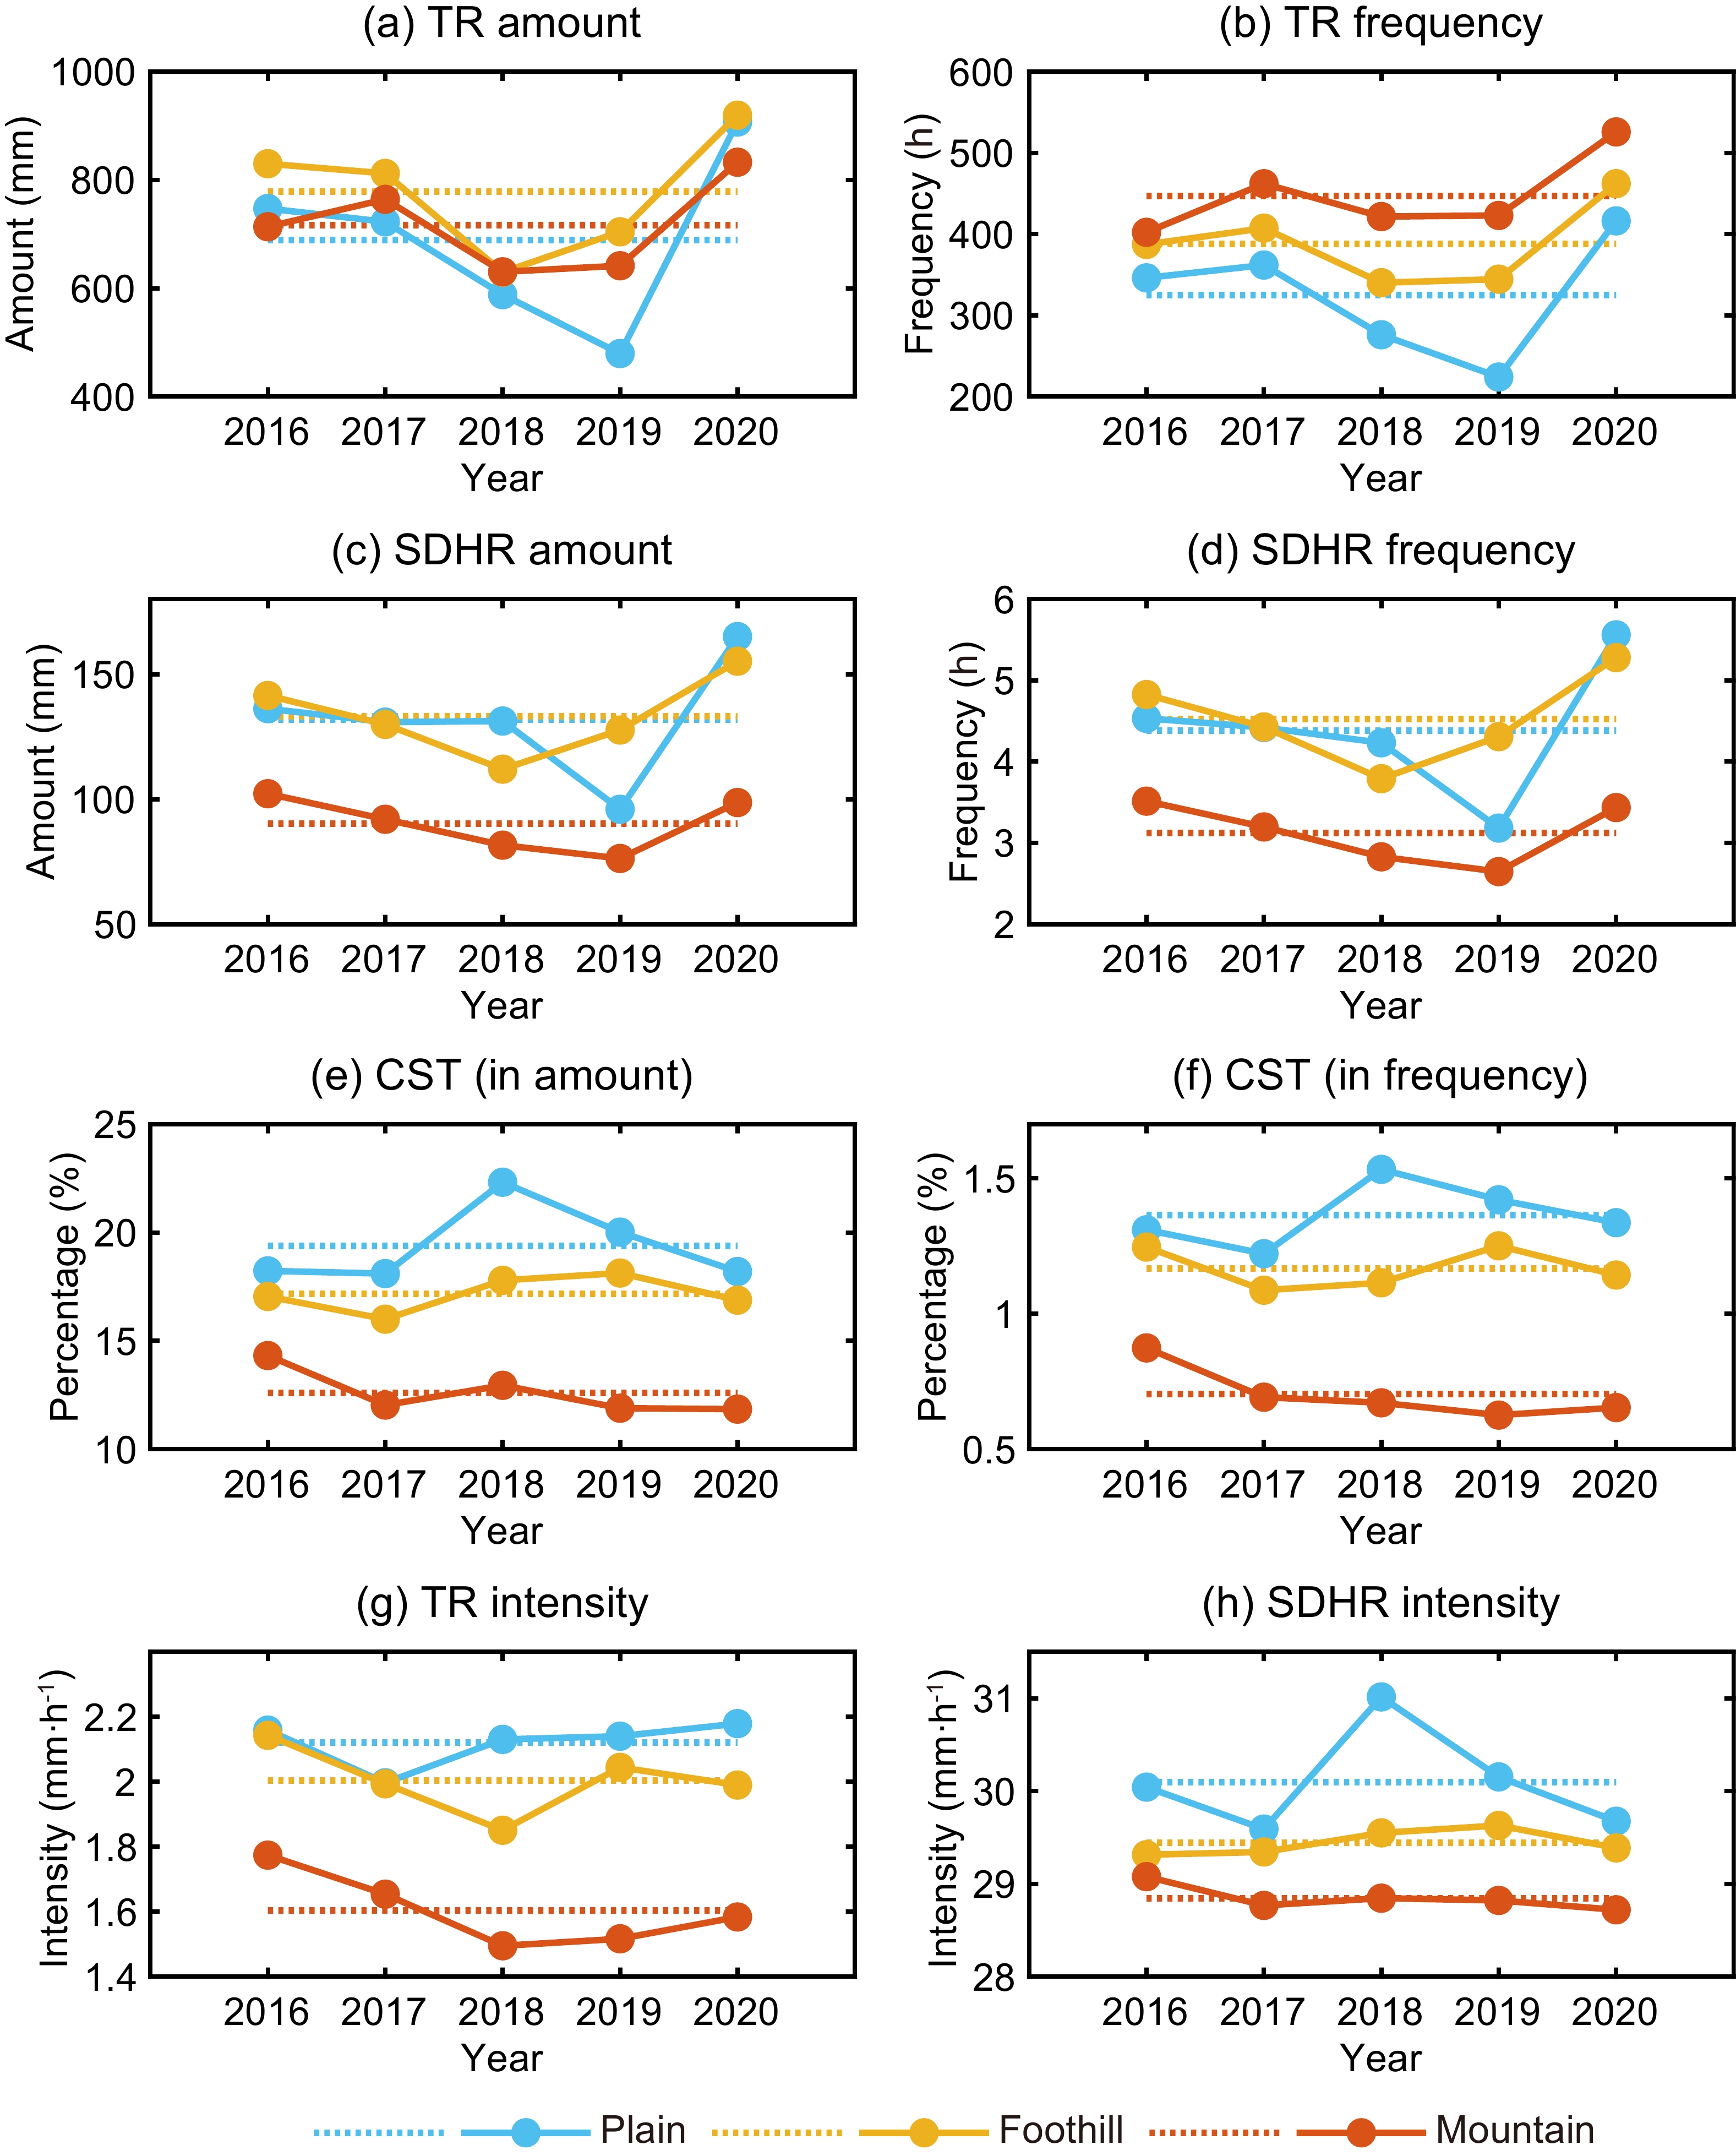
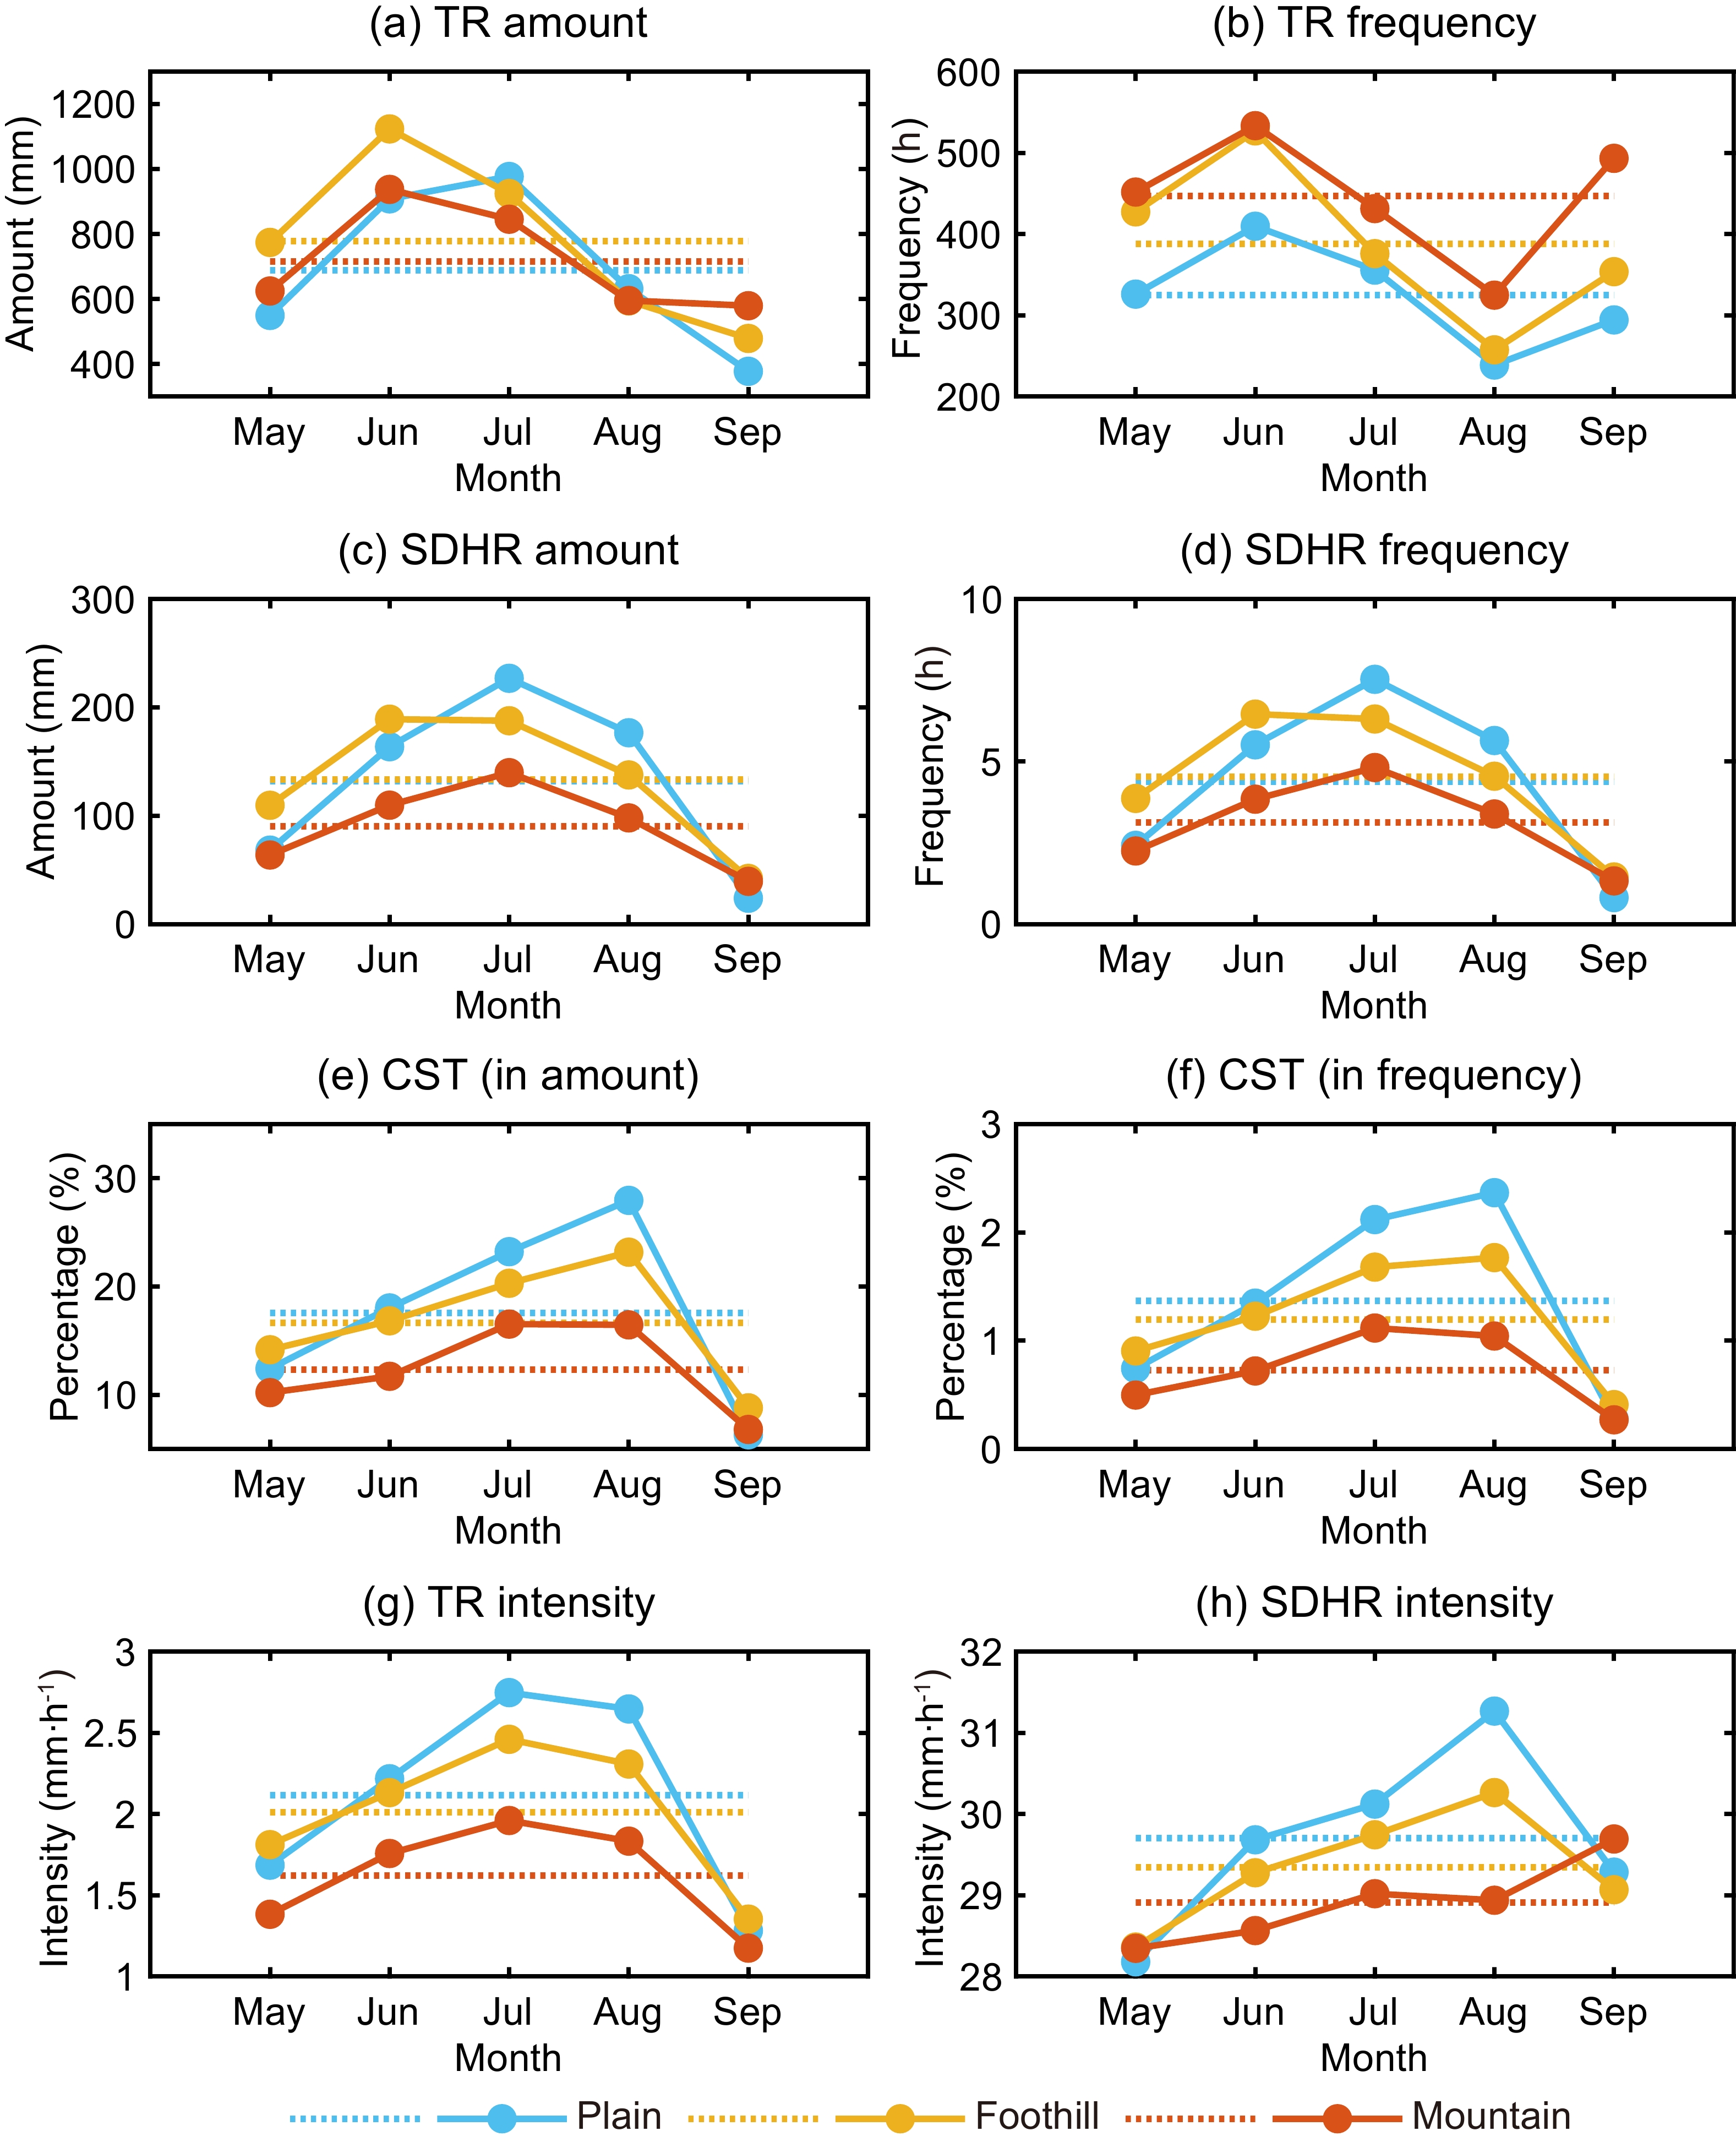
Figure 7 shows the annual variation of the TR amount (frequency) based on the respective averaged results of mountain, foothill, and plain stations. In terms of the 5-year averaged results, the TR amount is highest in the foothills and lowest over the plains, while the TR frequency is highest over the mountains and lowest over the plains (Figs. 7a and b). According to the annual variations of SDHR amount (frequency), the differences between the foothill rainfall and the plain rainfall are not significant, but both are larger than the mountain rainfall (Figs. 7c and d). For the CST, both in amount and frequency, the plains are characterized by the highest contribution, while the mountains are characterized by the lowest contribution (Figs. 7e and f). From the perspective of the average rainfall intensity of the five years, it is found that both TR and SDHR show high intensity over the plains and low intensity over the mountains (Figs. 7g and h). There are some differences in the distributions of mountain, foothill, and plain rainfall over the middle reaches of the YRB during the warm seasons of 2016–20. The plains are characterized by low TR frequency as well as high intensity and CST. The foothills are characterized by high TR amount and high CST. The mountains have high TR frequency and low CST, indicating that the rainfall intensity is weaker over the mountains. Frei and Schär (1998) revealed that there is a notable enhancement of precipitation in the foothills along the Alps. The results of the present study also show that the foothills over the middle reaches of the YRB have the highest TR amount, indicating that the enhancement of precipitation by mountains is mainly located in the foothills.
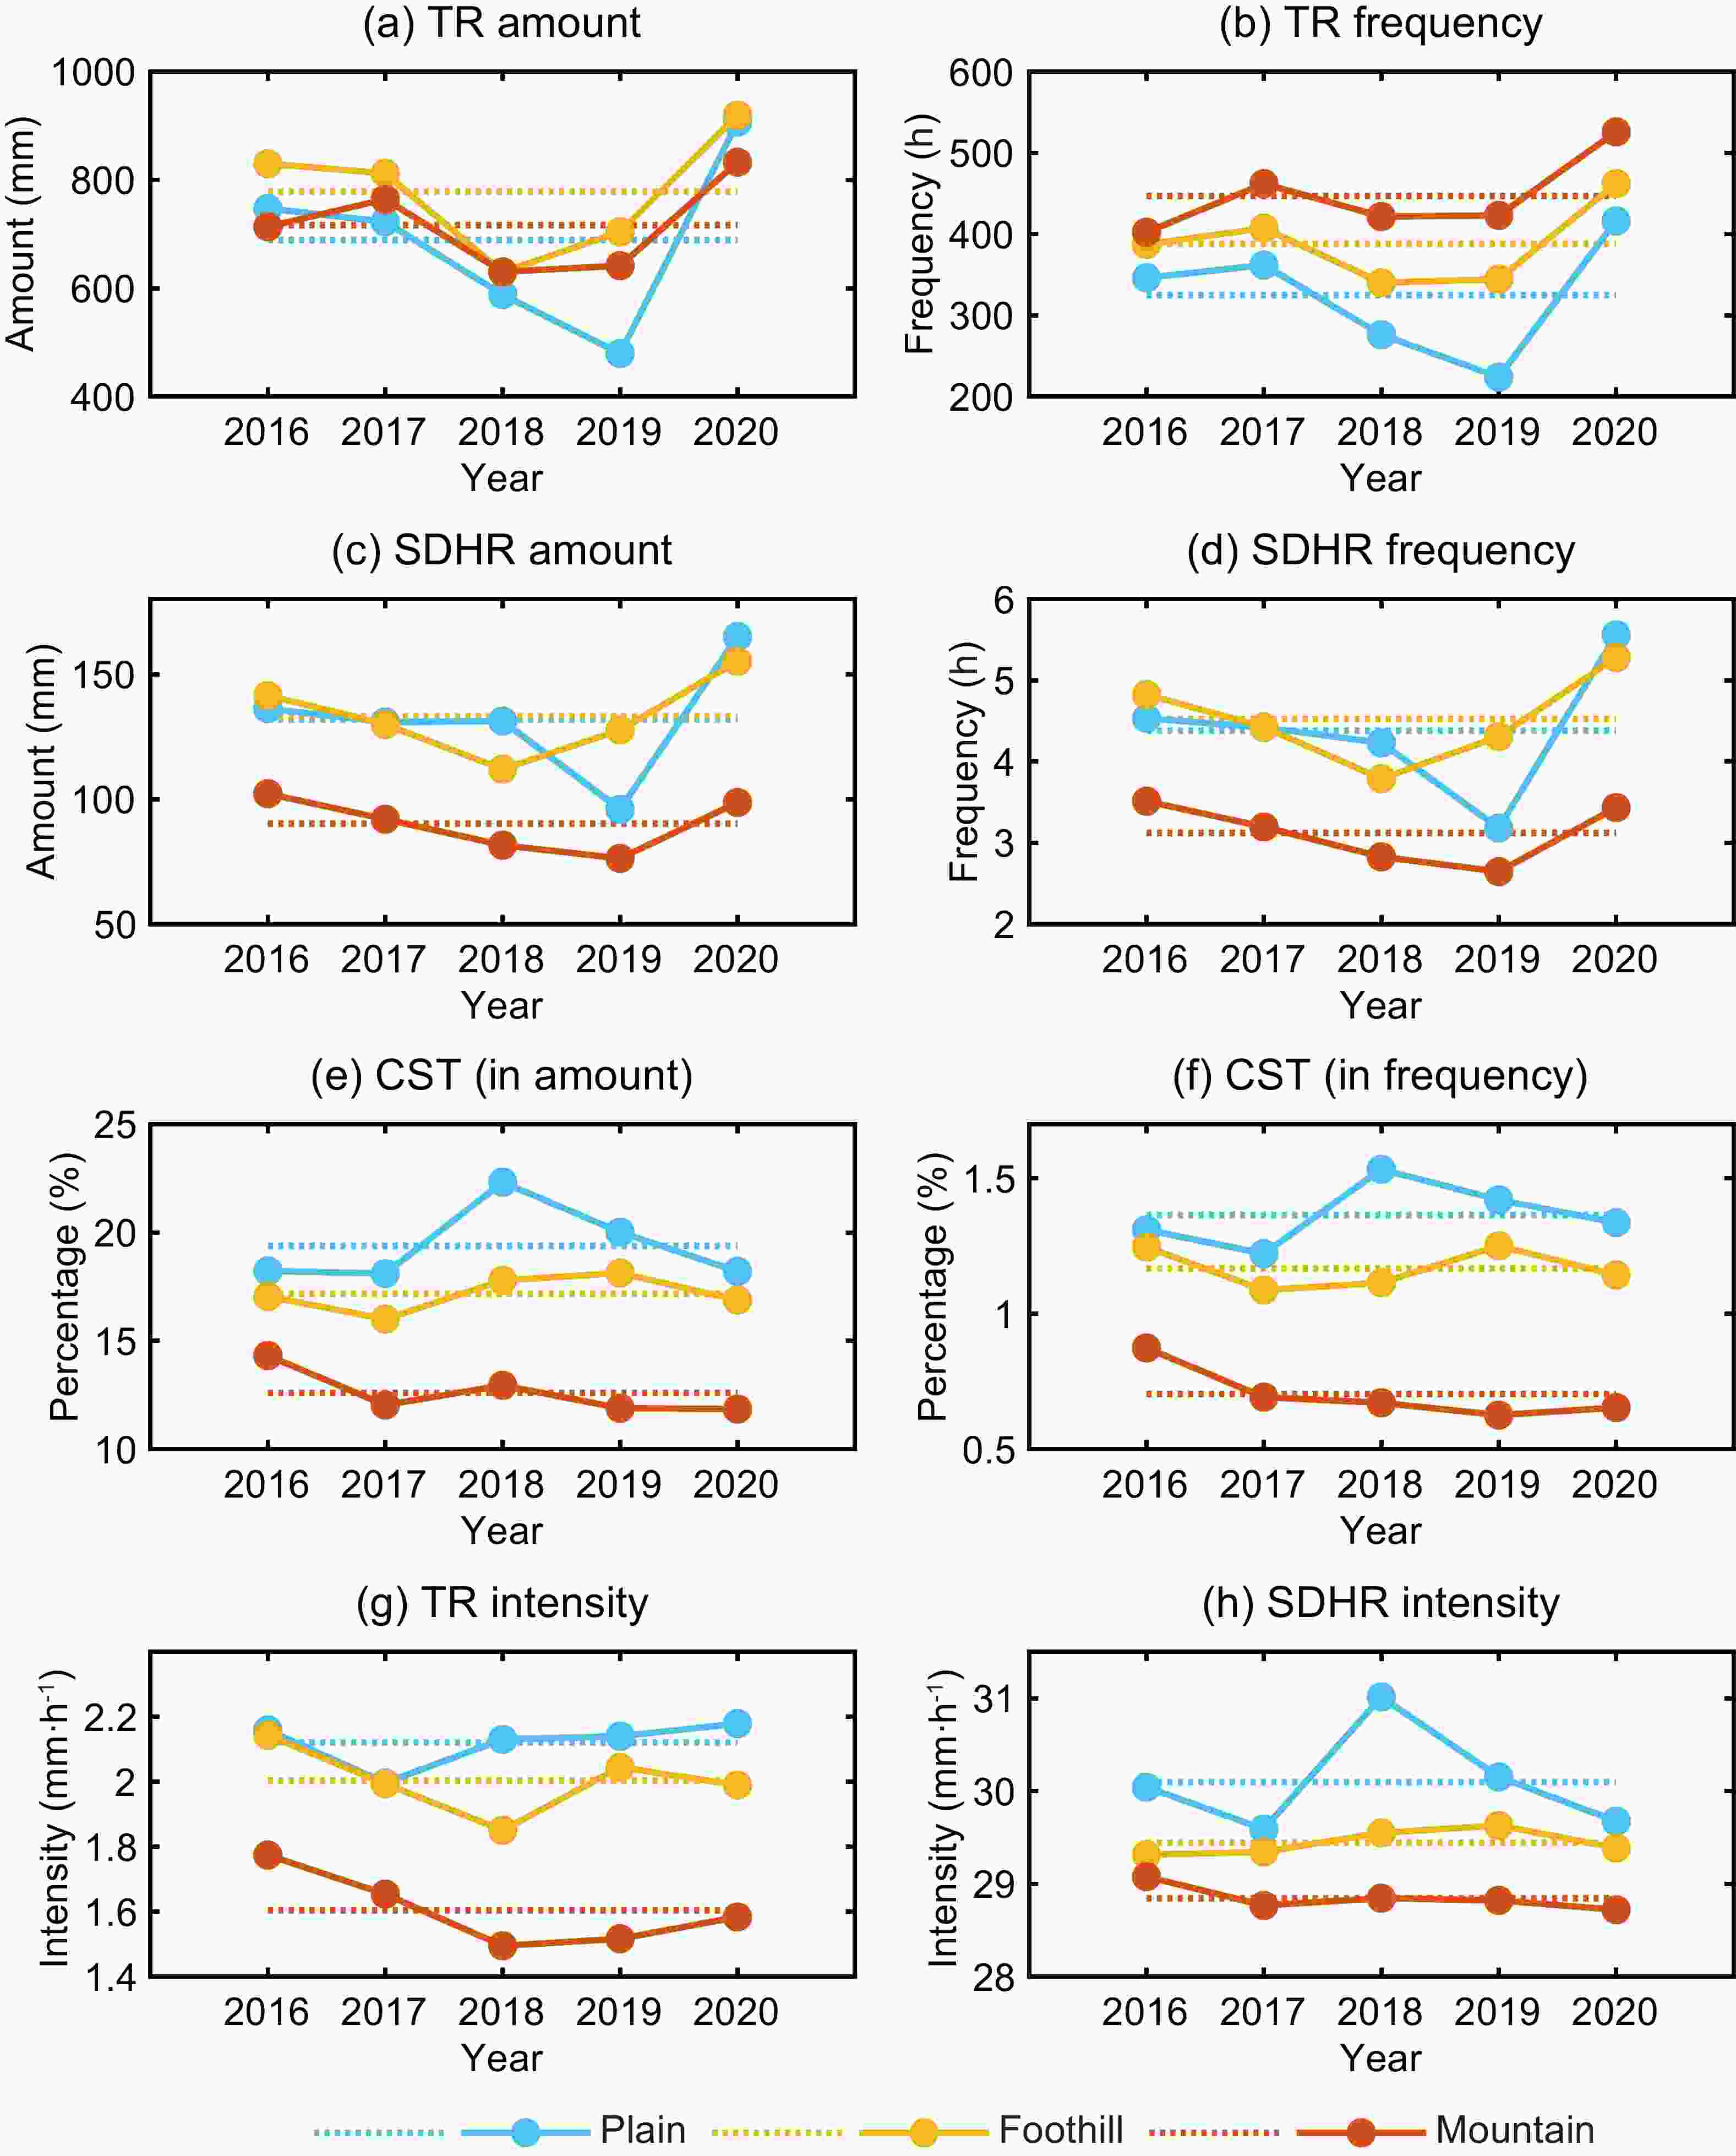
Figure 7. Annual variation of (a) TR amount, (b) TR frequency, (c) SHDR amount, (d) SDHR frequency, (e) contribution rate of SDHR amount to TR amount, (f) contribution rate of SHDR frequency to TR frequency, (g) TR intensity, and (h) SDHR intensity, over the middle reaches of the YRB during the warm season (May–September) from 2016 to 2020. The rainfall amount and frequency of each year is an accumulation from May to September. The dotted line denotes the mean value of five years.
The monthly variations of rainfall over the mountains, in the foothills, and over the plains also show notable differences (Fig. 8). In May and June, the TR amount in the foothills is much larger than that over the mountains and plains (Fig. 8a). In July, the TR amount over the plains is highest, followed by that in the foothills and over the mountains. In August, the TR amount over the plains is slightly higher than that over the mountains and in the foothills. In September, the differences among the TR amounts over the mountains, in the foothills, and over the plains increase, with the highest (lowest) rainfall amount over the mountains (plains). From May to September, the TR frequency is highest over the mountains, then in the foothills, and lowest over the plains (Fig. 8b). The monthly variations of the SDHR amount and frequency are consistent (Figs. 8c and d). In May and June, the foothills have the highest SDHR amount (frequency), while in July and August the plains have the highest SDHR amount (frequency). In September, the SDHR amount (frequency) in the foothills and over the mountains is slightly higher than that over the plains. The CST, both in amount and frequency (Figs. 8e and f), keeps increasing from May to August, and decreases sharply in September, with the highest in the foothills, then over the plains, and the lowest over the mountains. The intensity of TR and SDHR (except the SDHR intensity over the mountains) shows a single-peak pattern (TR intensity in July, and SDHR intensity in August) in the monthly variation. The highest intensity of TR and SDHR from June to August is over the plains, while the lowest is over the mountains (Figs. 8g and h).
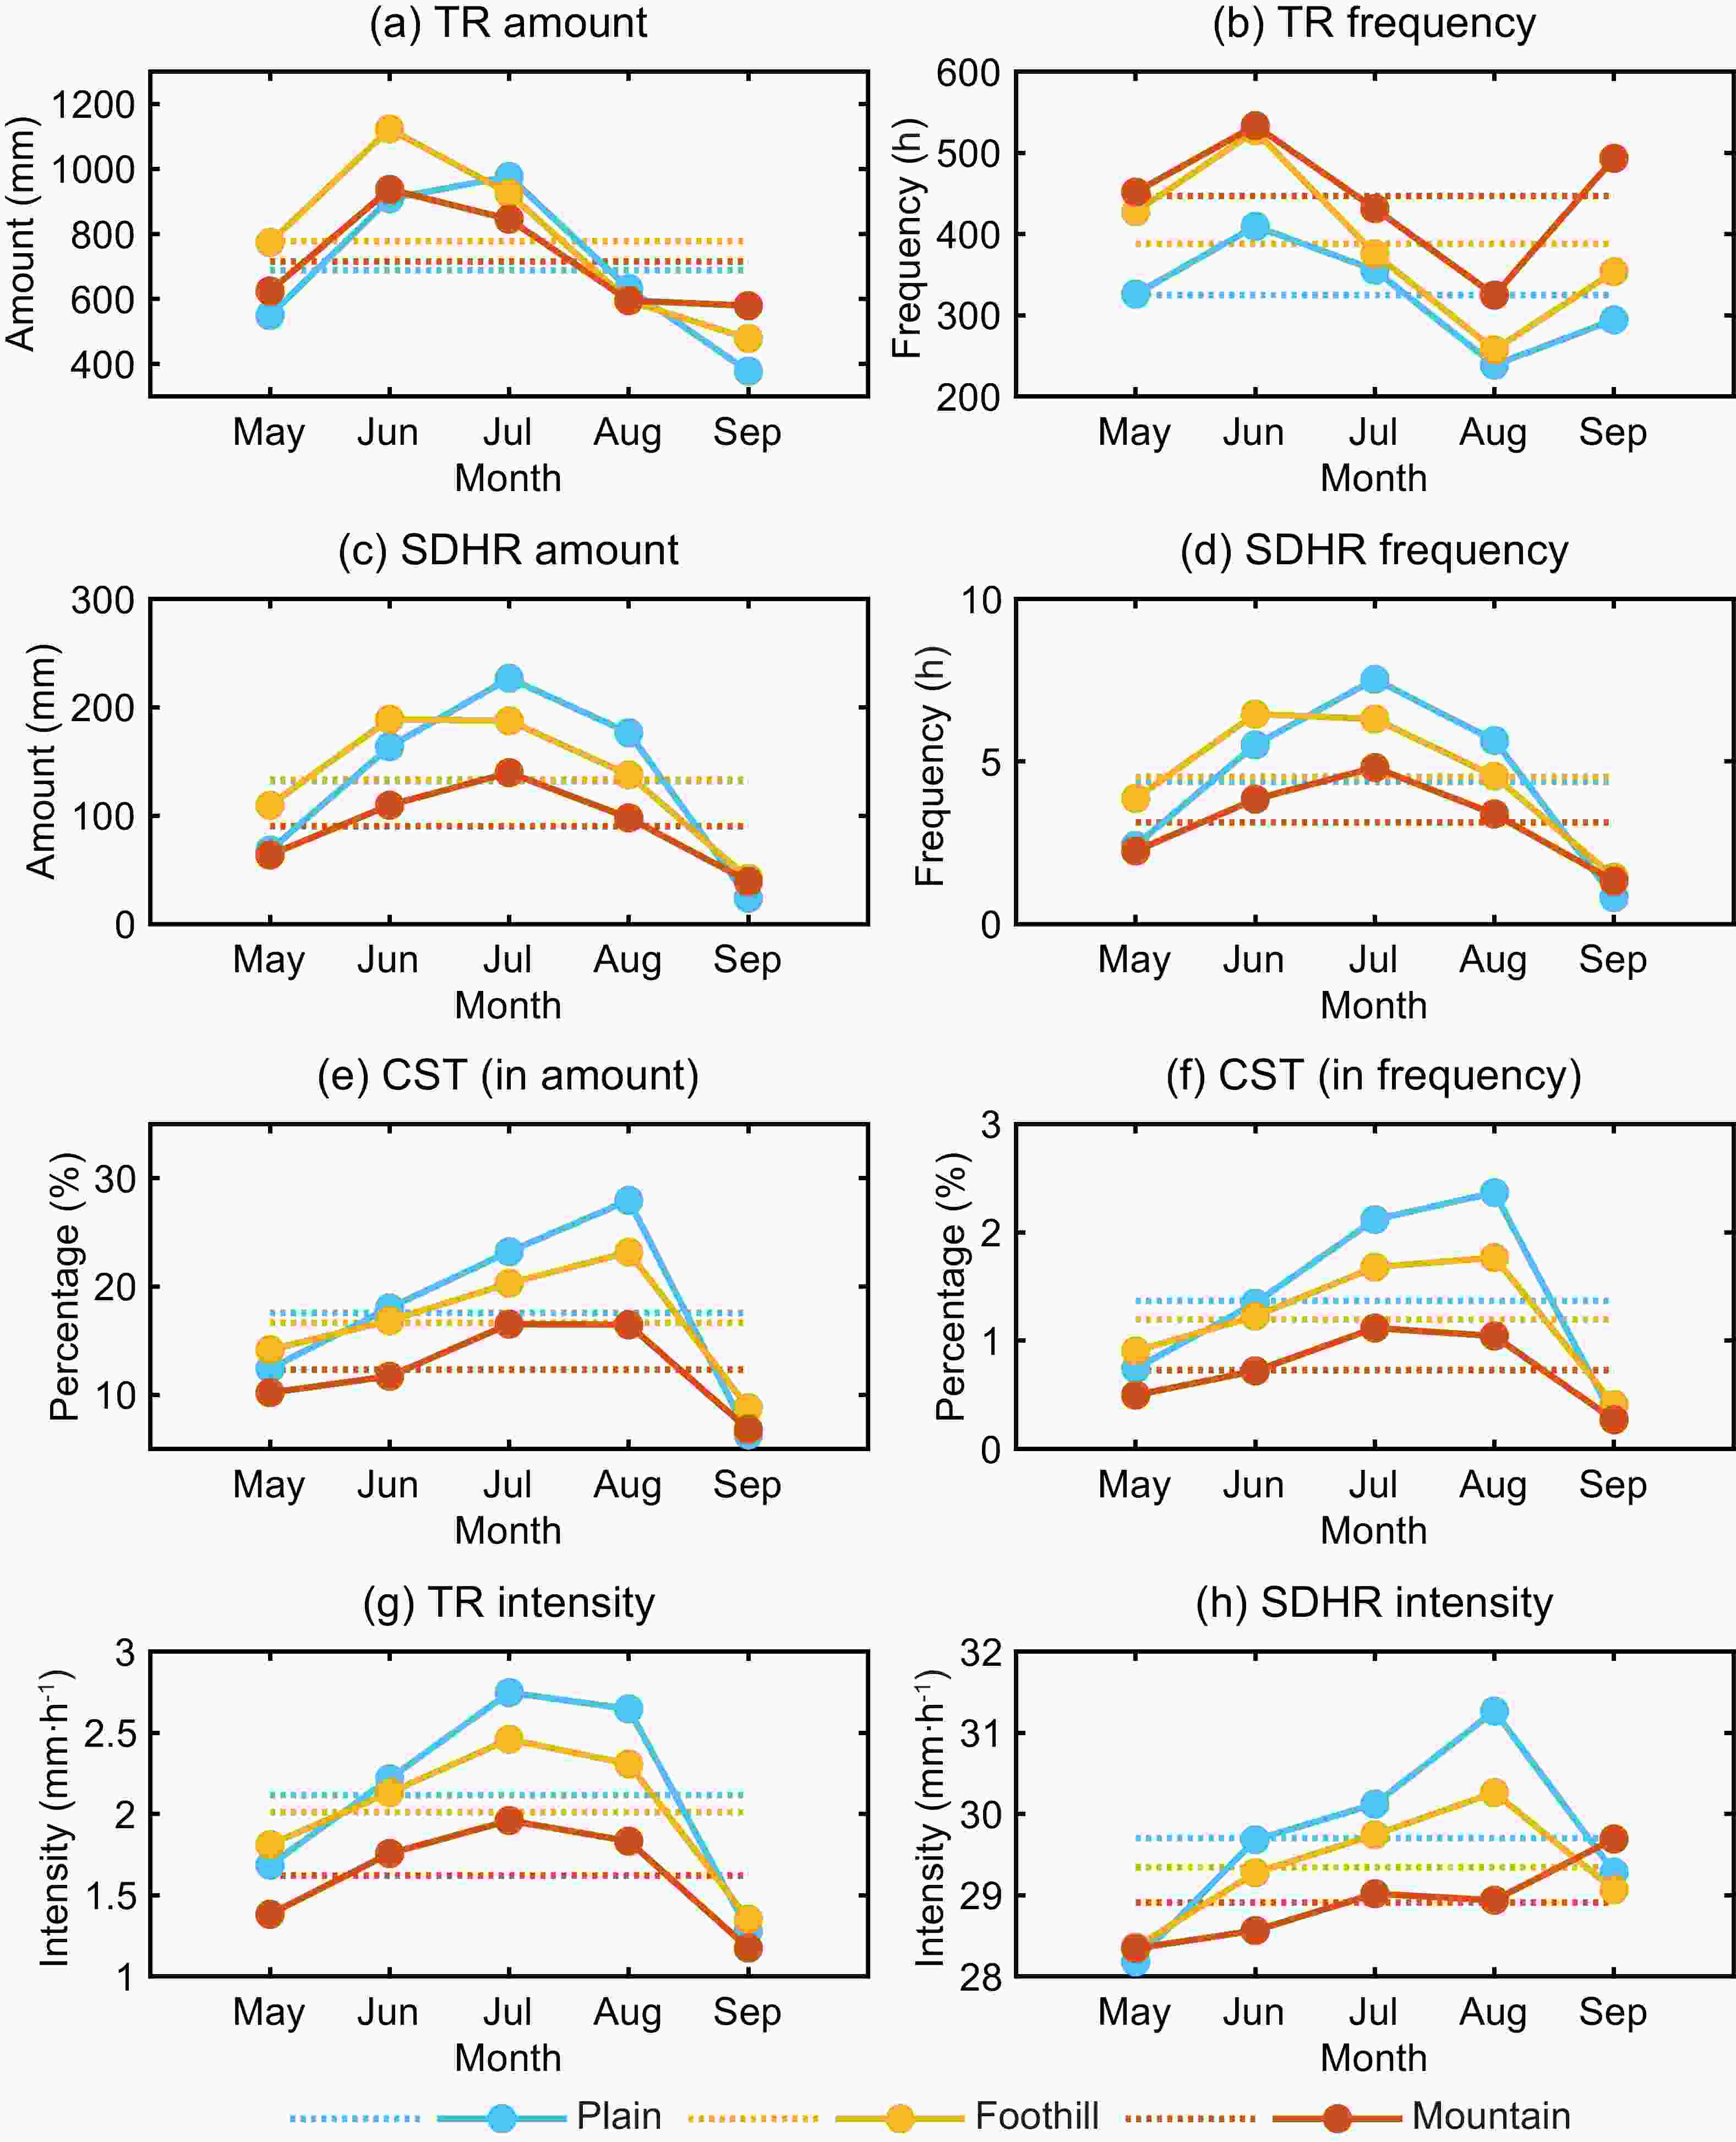
Figure 8. As in Fig. 7 but for monthly variation. The rainfall amount and frequency of each month is an accumulation from 2016 to 2020. The dotted line denotes the mean value of five months.
It is noticeable that the TR amount and SDHR amount (frequency) in the foothills are highest in May and June, while those over the plains are highest in July and August. This may be mainly due to the changes in the main synoptic circulations from May to August, implying that the effects of topography on the rainfall distribution are significantly different under the different synoptic circulations in the study area. The weather systems in May and June are likely to increase the precipitation in the foothills, while those in July and August tend to increase the precipitation over the plains. Synoptic systems related to heavy rainfall over the YRB include the mei-yu front with a subtropical frontal structure (Ding, 1994; Luo et al., 2014; Ng et al., 2021), southwesterly low-level jets that are embedded within monsoon airflows (Chen et al., 2005), low-pressure systems or mesoscale vortices moving along the mei-yu front (Zhang et al., 2018), midlevel troughs (Liu et al., 2008), and the western Pacific subtropical high (Ding, 1994; Ding and Chan, 2005). These synoptic systems provide different favorable dynamic and thermodynamic conditions for the formation of heavy rainfall during the mei-yu season (Chen and Yu, 1988; Luo et al., 2020). Under the impact of these favorable dynamic and thermal conditions, local topography can contribute to the initiation of deep convection and modulate the rainfall location and intensity (Liu et al., 2008). During July–August, the high rainfall amount over the plains may be produced by eastward-propagating mesoscale convective systems (MCSs) from second-step terrain (Yang et al., 2020), which are long in duration and produce severe rainfall. The enhancement of foothill rainfall in May and June is caused by the rainfall events associated with different mountains (i.e., the Dabie Mountains, second-step terrain). Therefore, the mechanism for the enhancement is complicated. It is closely related to the size and orientation of mountains, as well as the direction and intensity of airflow, which are important factors influencing the formation of rainfall near mountainous areas (Roe, 2005; Rotunno and Houze, 2007; Houze, 2012). These factors can cause the forced rising of airflow on the windward slope and the diversion of airflow around the mountain barrier (Yu et al., 2007a; Cheng and Yu, 2019).
-
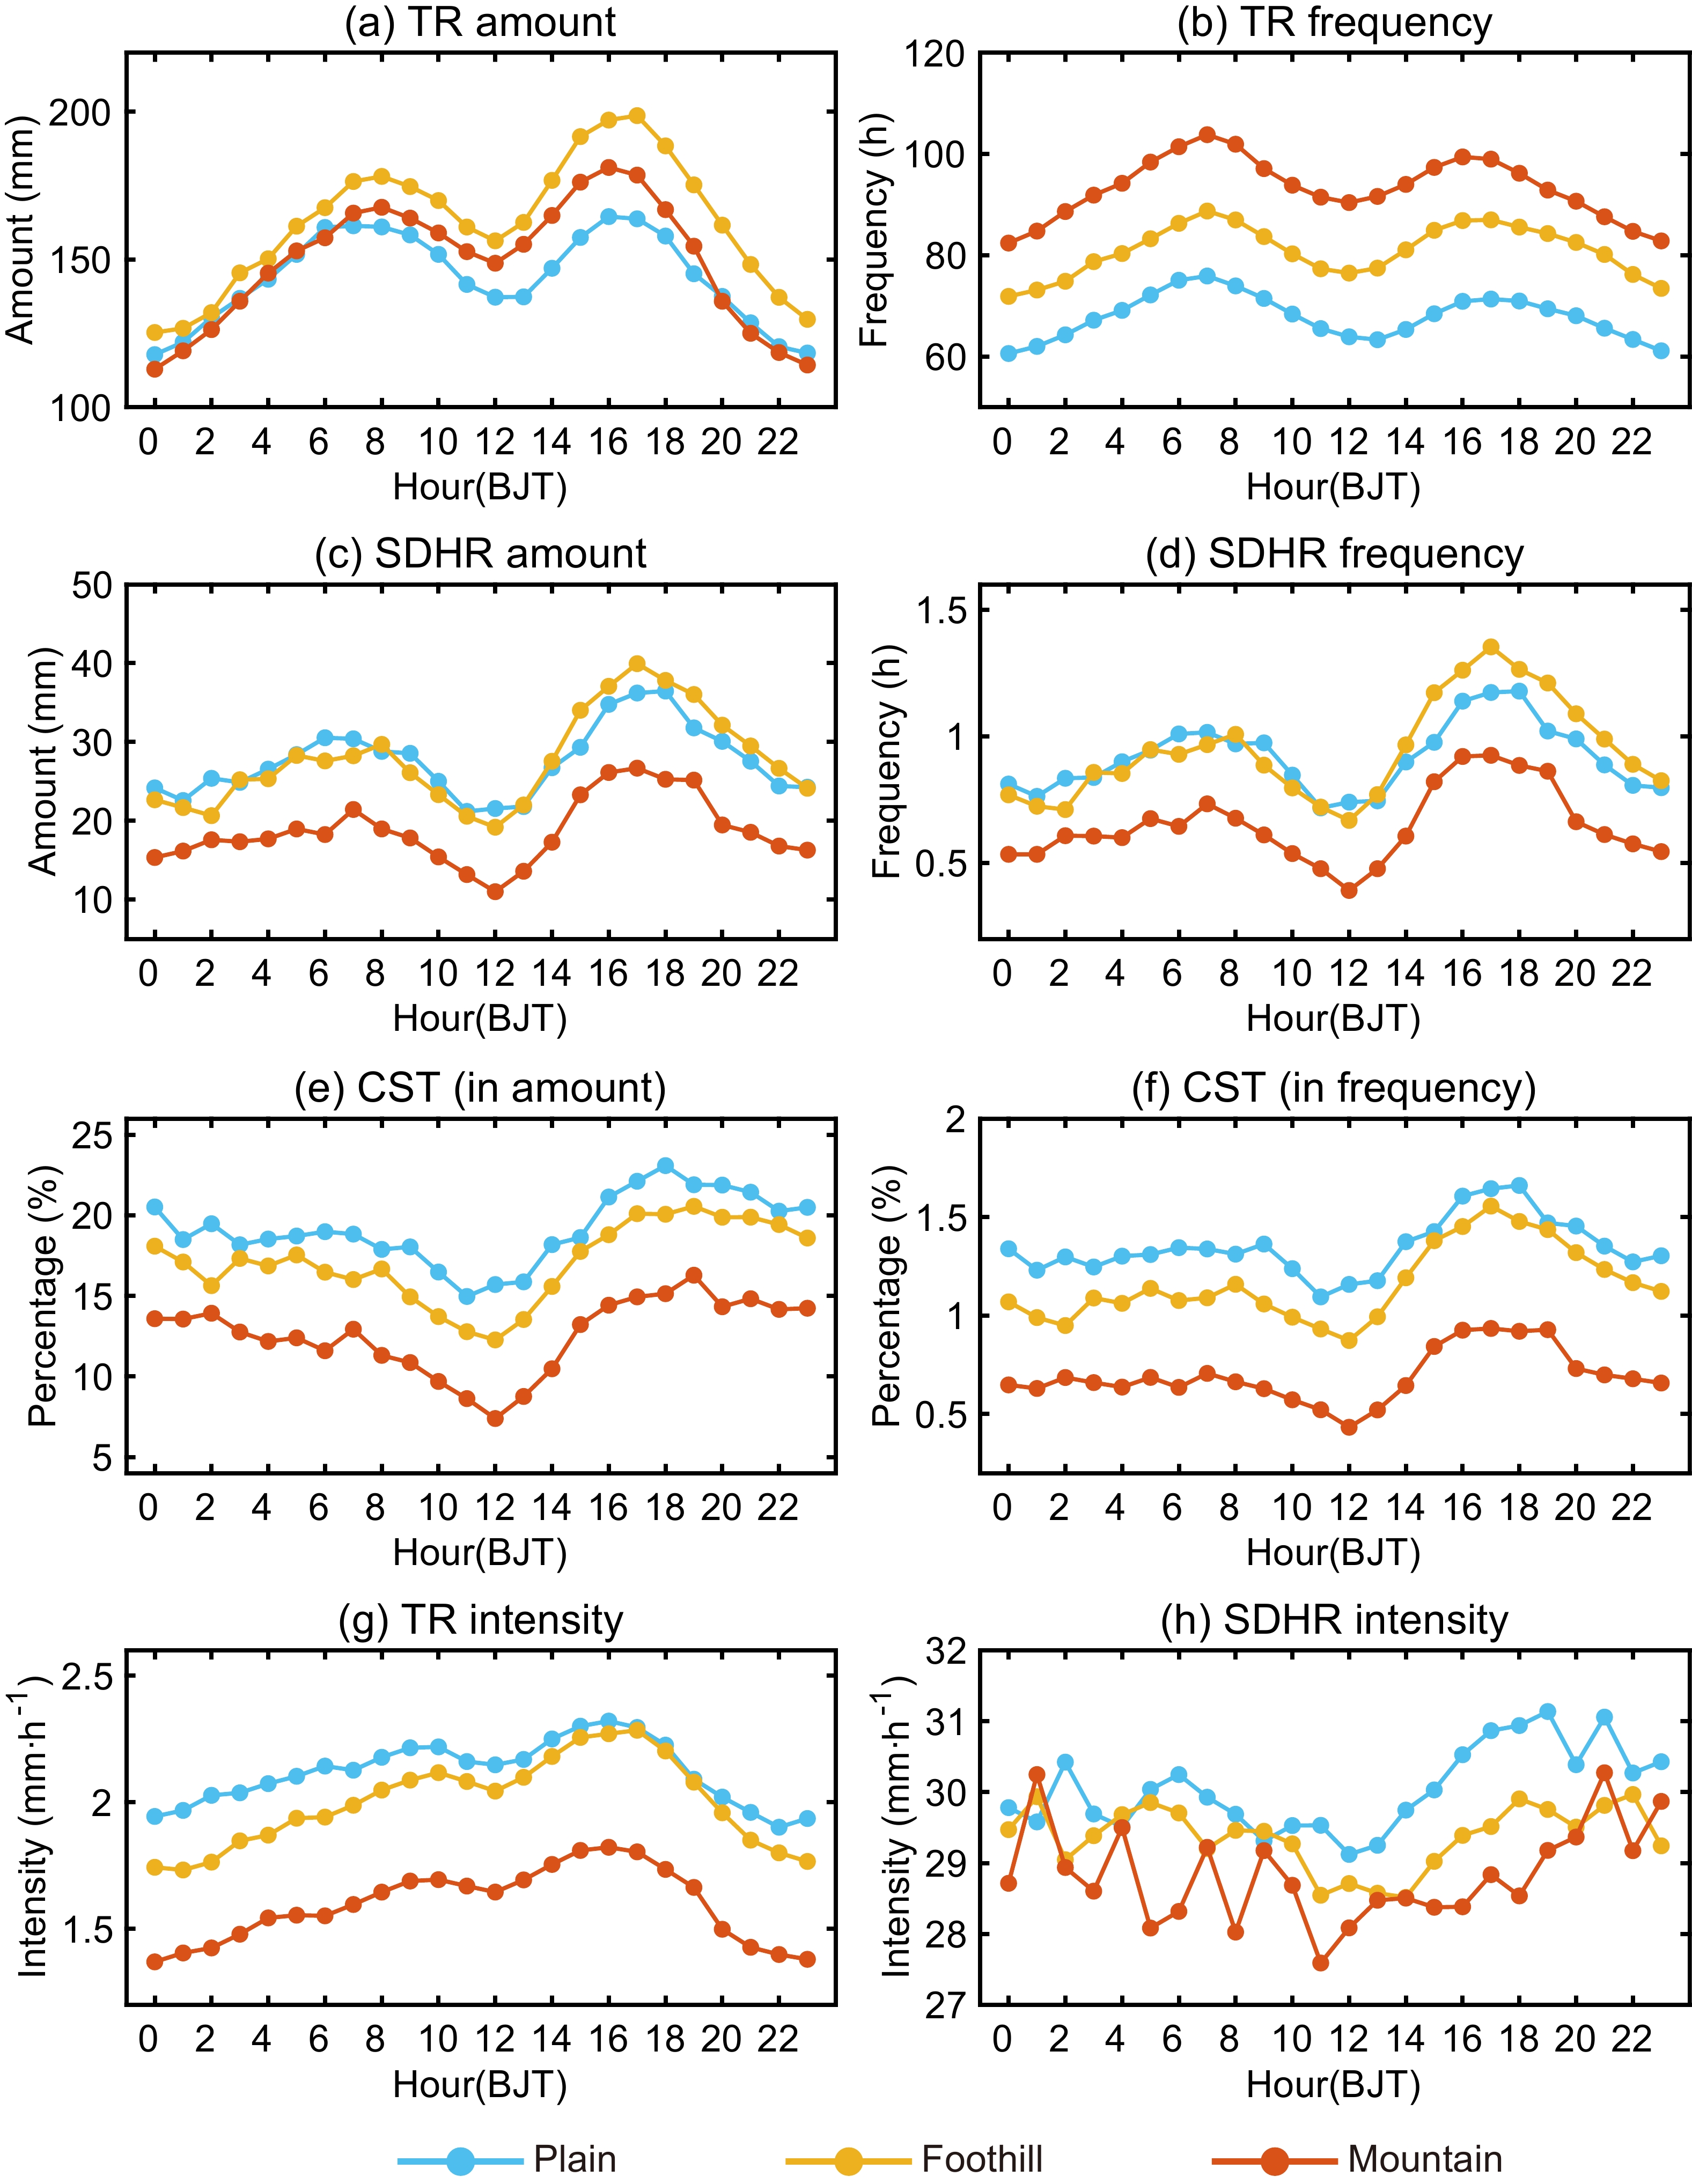
Figure 9 shows the diurnal variations of rainfall amount and frequency based on the mean states of mountain, foothill, and plain stations over the middle reaches of the YRB during the study period. The diurnal variations of TR amount (frequency) over the mountains, in the foothills, and over the plains show two peaks (Figs. 9a and b): one appears in the late afternoon [around 1600 BJT (Beijing Time), BJT=UTC+8], and the other appears in the early morning (around 0800 BJT). This is consistent with previous results on the diurnal variation of precipitation over the middle reaches of the YRB (Yuan et al., 2010; Sun and Zhang, 2012; Yu et al., 2014; Zhang et al., 2014b; Yu and Li, 2016; Tang et al., 2022). However, the dominant peaks for the amount and frequency of rainfall appear at different times: the former appears in the late afternoon and the latter in the early morning. Moreover, during the daytime, it is obvious that the TR amount in the foothills is the highest, followed by that over the mountains and plains, while this feature is not obvious at nighttime (Fig. 9a). The TR frequency of the three areas shows consistent characteristics of being highest over the mountains, then in the foothills, and lowest over the plains, during the whole day (Fig. 9b).
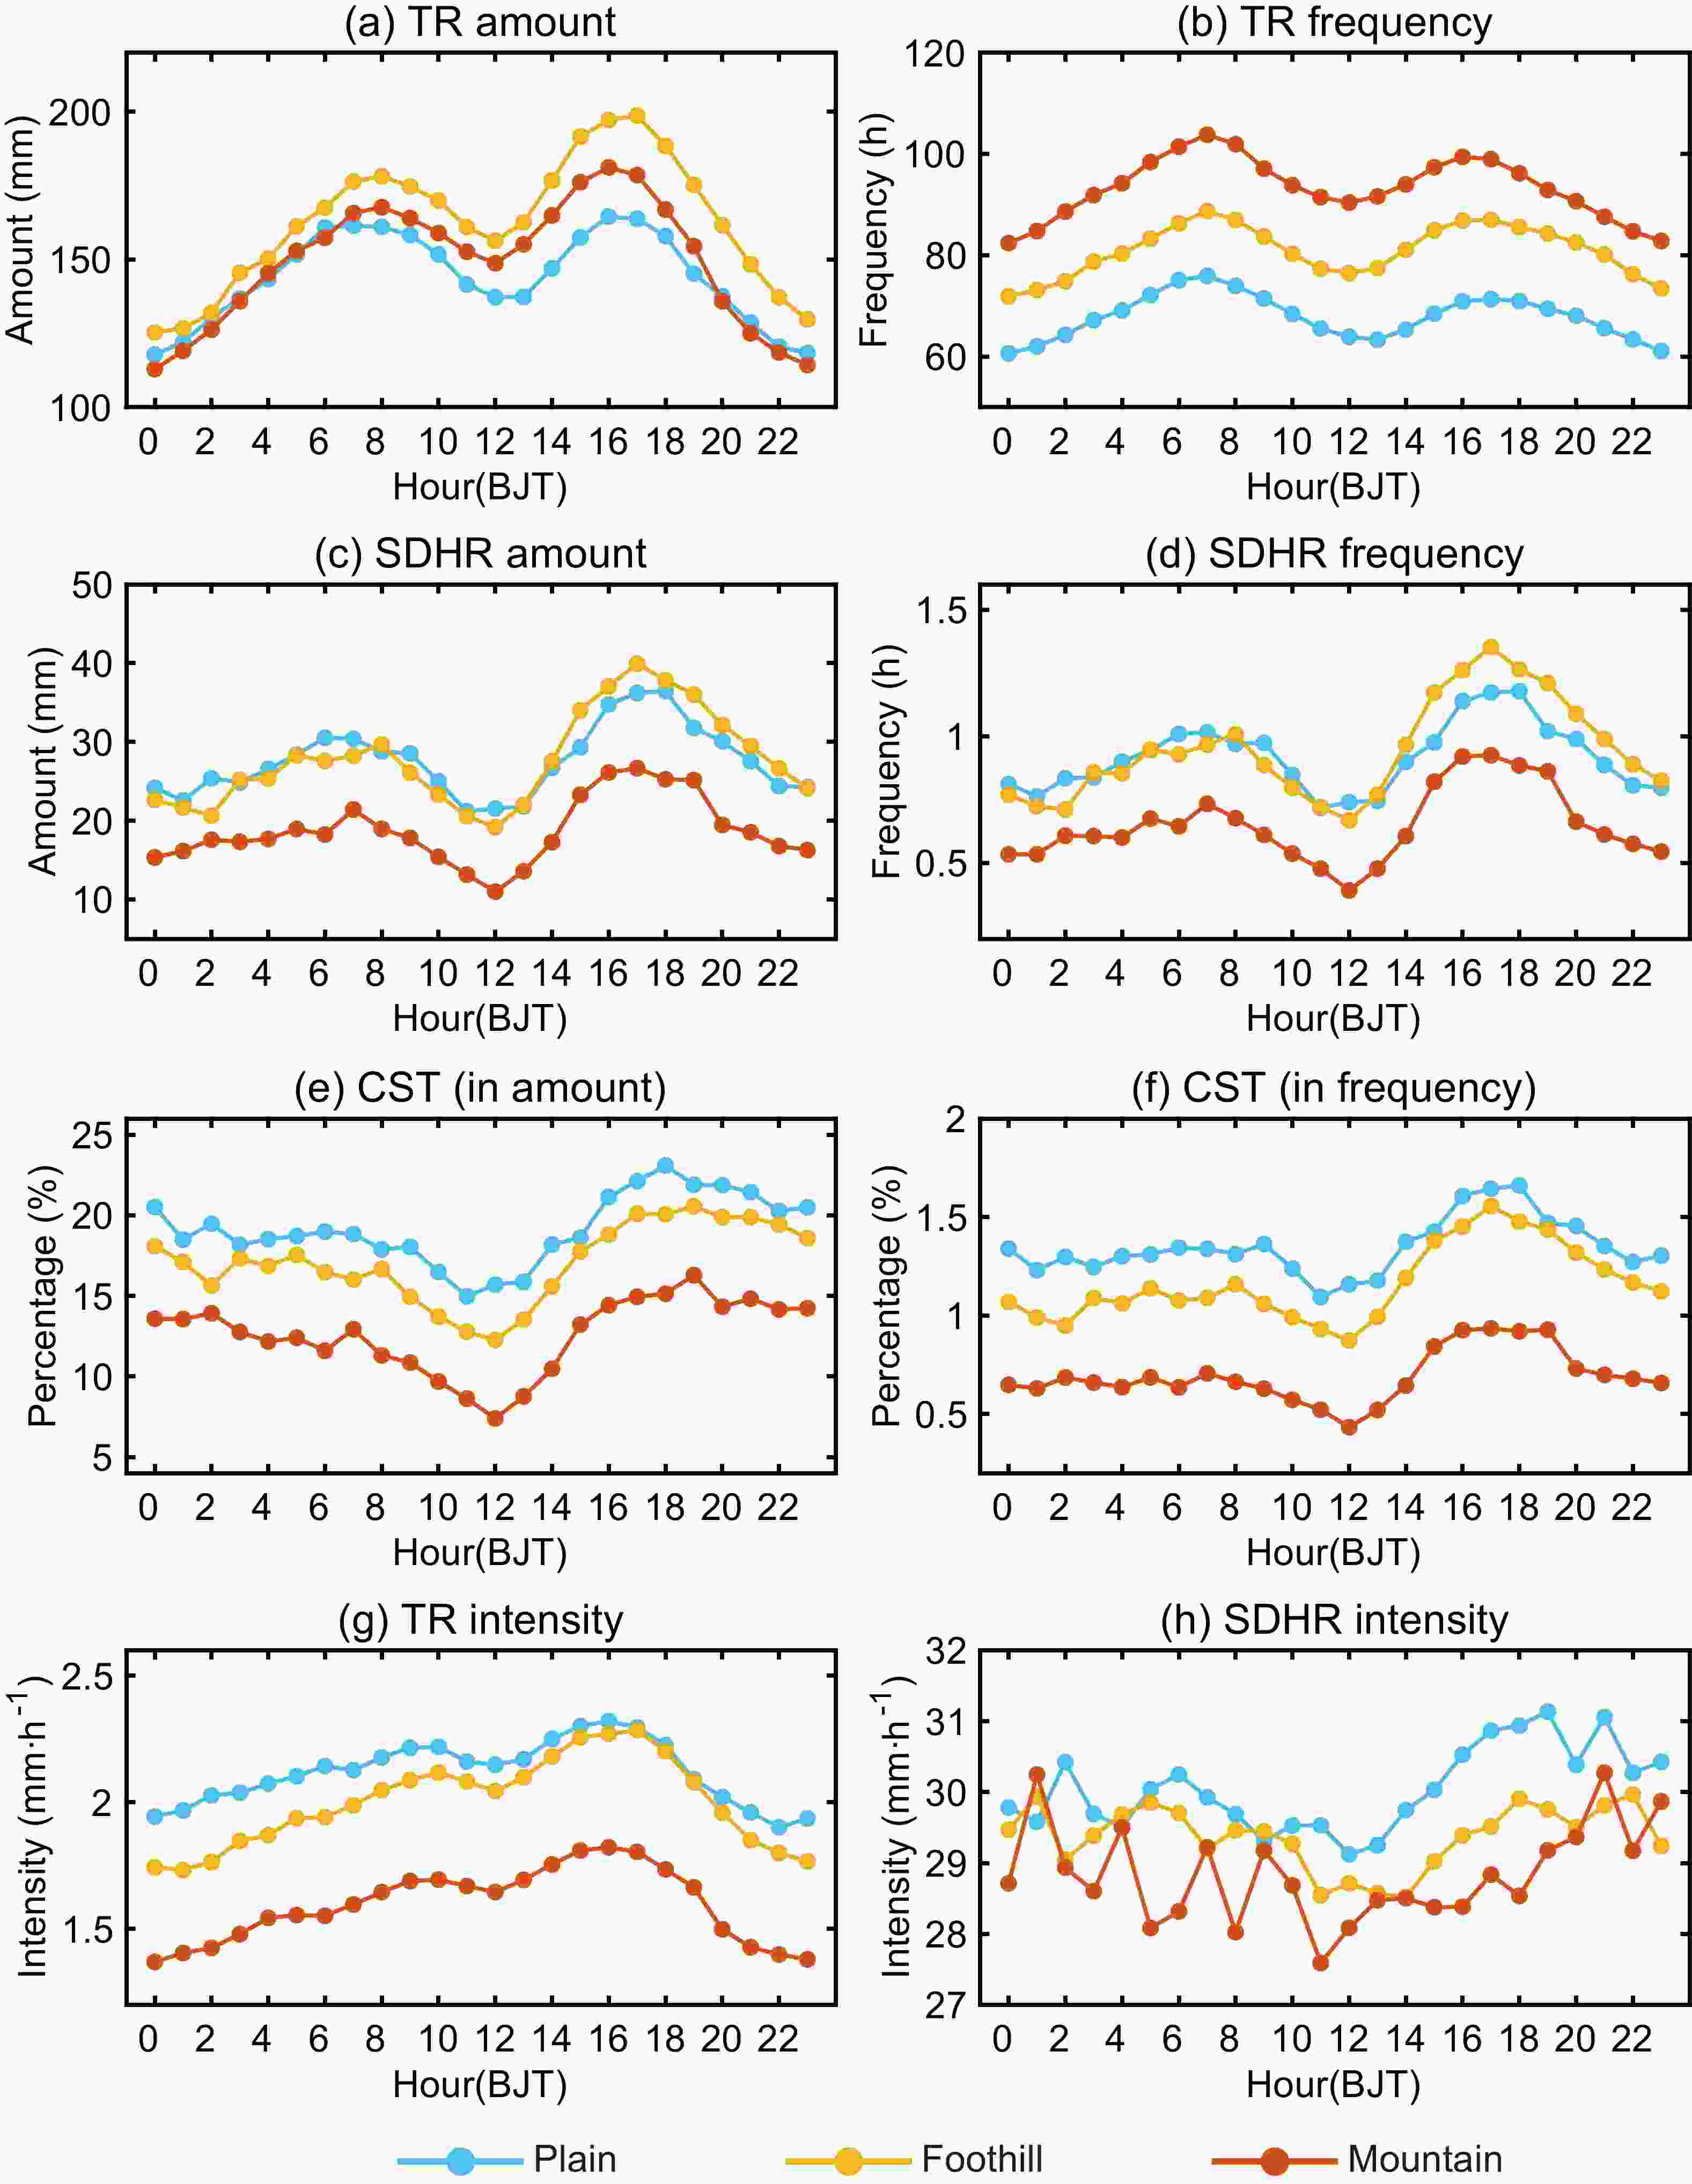
Figure 9. Mean diurnal variation of (a) TR amount, (b) TR frequency, (c) SHDR amount, (d) SDHR frequency, (e) contribution rate of SDHR amount to TR amount, (f) contribution rate of SHDR frequency to TR frequency, (g) TR intensity, and (h) SDHR intensity, over the middle reaches of the YRB during the warm season (May–September) from 2016 to 2020.
The diurnal variations of SDHR amount and frequency present a dominant peak in the late afternoon and a second dominant peak in the early morning (Figs. 9c and d). The SDHR amount (frequency) in the foothills is higher than that over the plains in the afternoon, while it is slightly lower than that over the plains during most of the time from night to early morning, and the SDHR amount (frequency) over the mountains is lowest during the whole day (Figs. 9c and d). The diurnal variation of CST (both in amount and frequency) over the mountains, in the foothills, and over the plains shows a single peak (around 1600 BJT) in the late afternoon, with the highest one appearing over the plains, followed by the foothills and then the mountains (Figs. 9e and f).
Further analysis shows that the intensity of TR in the three areas reaches its peak in the afternoon (around 1600 BJT). The highest (lowest) TR intensity is over the plains (mountains), which indicates that the average precipitation in the mountains is weaker than that in the foothills and over the plains. In addition, the difference in TR intensity between the plains and the foothills gradually decreases from night to afternoon (Fig. 9g). This indicates that the foothills are significantly more affected by the atmospheric environment in the afternoon compared to the plains, thus resulting in a greater increase in the TR intensity. The SDHR intensity is lowest at noon, and then it gradually reaches a peak during the afternoon to evening. In the late afternoon (1500–1900 BJT), the differences in SDHR intensity among the mountains, foothills, and plains are obvious, with the highest SDHR intensity appearing over the plains (Fig. 9h).
In general, both the TR amount (frequency) and SDHR amount (frequency) present an early-morning peak and a late-afternoon peak at plain, foothill, and mountain stations (Figs. 9a–d). The dominant peak of TR amount and SDHR amount (frequency) occurs in the late afternoon (Figs. 9a, c and d), while the main peak of TR frequency occurs in the early morning (Fig. 9b). At different times of the day, there are significant differences among the plain, foothill, and mountain rainfall. During the daytime, the TR amount is highest (lowest) in the foothills (over the plains), which is not obvious at nighttime (Fig. 9a). A significant increase in TR intensity from night to afternoon is observed in the foothills, which is more obvious than that over the plains (Fig. 9g). In the morning, the plains have the highest SDHR amount (frequency), which is slightly higher than that in the foothills. In contrast, in the afternoon, the foothills have the highest SDHR amount (frequency) (Figs. 9c and d). These features indicate that rainfall is more likely to form in the foothills in the afternoon under the strong thermal instability caused by solar heating, especially for SDHR. The intensification of TR in the foothills is also stronger in the afternoon. Overall, compared to the plains and mountains, the afternoon rainfall in the foothills of the middle reaches of the YRB shows the following characteristics: (1) TR is characterized by the highest rainfall amount, lower frequency, and higher intensity (slightly lower than that over the plains), and a significant intensification of the afternoon precipitation; (2) SDHR is characterized by both the highest rainfall amount and frequency, but medium intensity (significantly lower than that over the plains, but higher than that over the mountains).
The formation mechanisms of the afternoon rainfall peak are complicated. Some previous studies (Pielke, 1984; Yang and Smith, 2006) have highlighted the crucial influence of land surface heating. Diurnally modulated land surface heating has two major effects on the atmosphere, both of which can lead to the diurnal variation of rainfall: (i) the static destabilization of the atmosphere both in the planetary boundary layer and in the free troposphere (referred to as the land surface heating–static destabilization mechanism); (ii) the formation of regional mesoscale circulations driven by differential surface heating—that is, by horizontal variations in land surface heating. In addition, the distribution of rainfall near the mountains is complex, and it is related to both climatic conditions and regional circulations influenced by topography and elevation (Jiang, 1988; Fo, 1992). As the airflow rises along the mountain range, on the one hand, the original water content of the cloud is continuously reduced due to the formation/maintenance of rainfall (its precipitation on the mountain slope decreases with increasing elevation). On the other hand, the rising velocity generated by the topographic uplift transports moisture in the air below the cloud base (or condensation level) to the clouds, which increases the water content in the clouds and then increases the rainfall on the mountain slopes. Therefore, the combined effect of the abovementioned two factors affects precipitation at different elevations. When the latter exceeds the former, the rainfall increases with elevation; otherwise, it decreases (Fo, 1992). Overall, the formation of the afternoon rainfall—especially in the foothills—is a complex process influenced by various mechanisms.
-
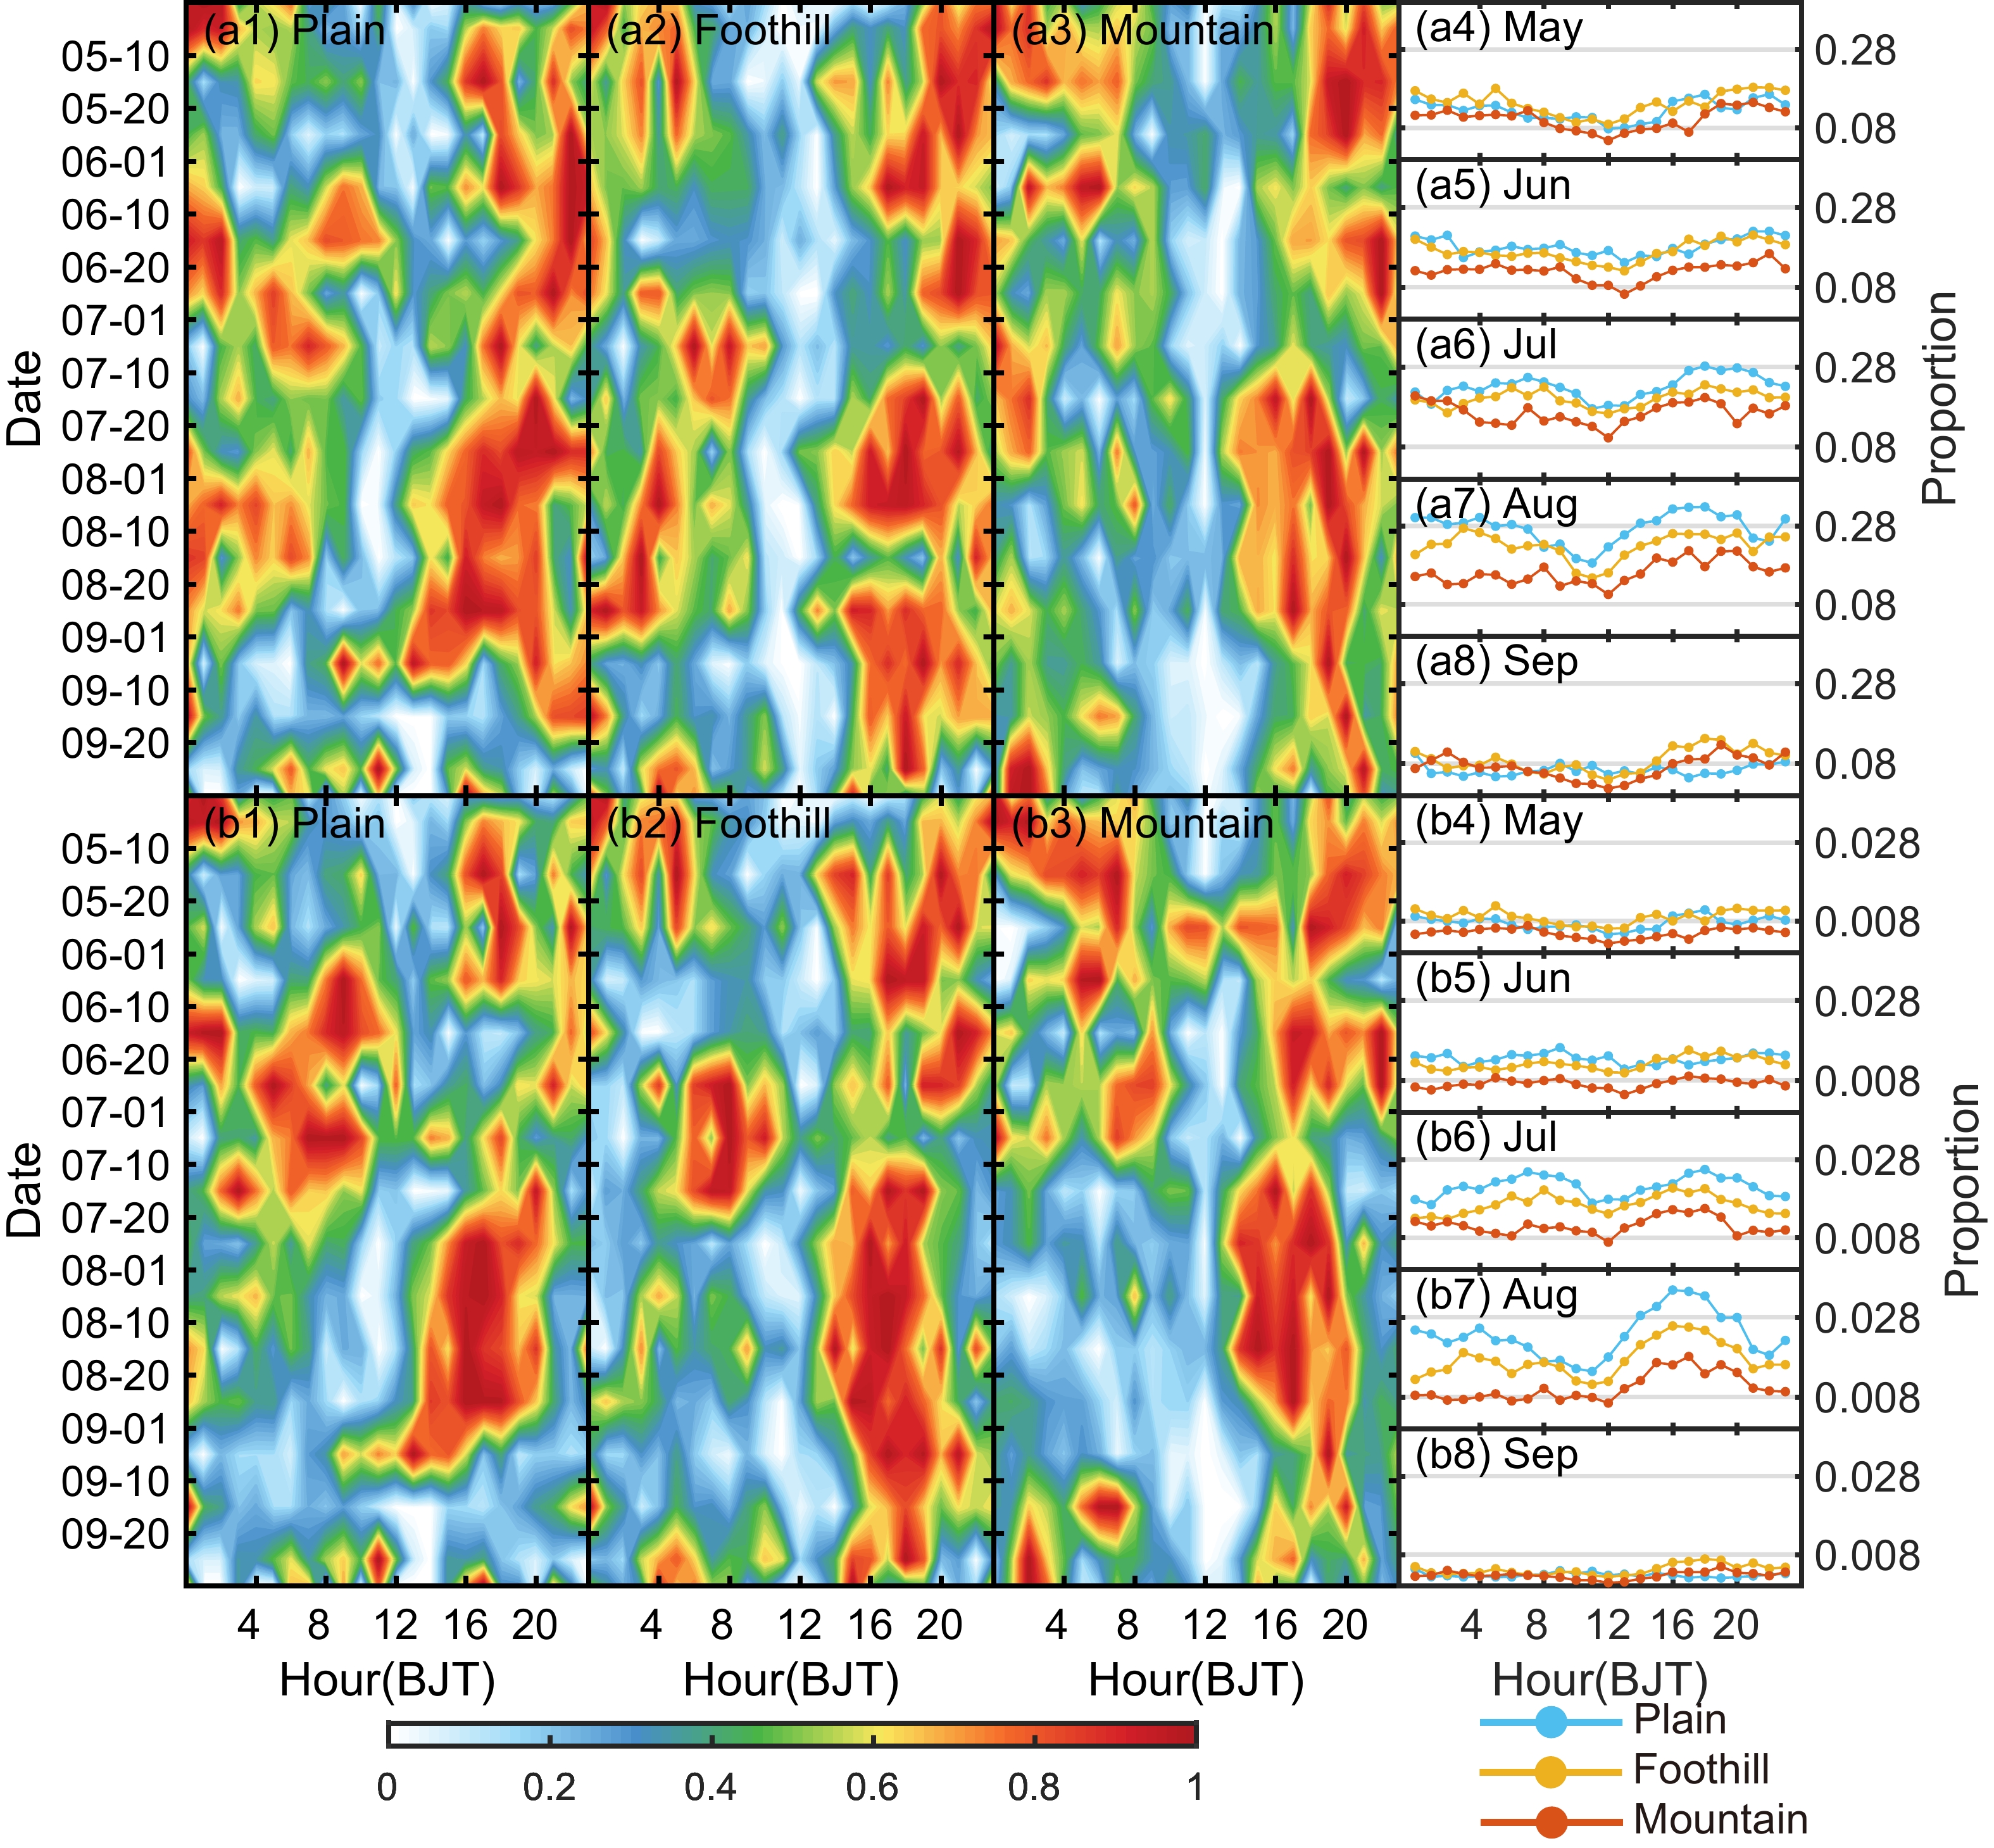
According to the mean state from May to September, the diurnal variations of TR amount (frequency) and SDHR amount (frequency) exhibit a double-peak pattern. In contrast, the diurnal variation of SDHR to TR, as well as the intensities of TR and SDHR, present a single-peak pattern (Fig. 9). It should be noted that the diurnal variations of rainfall are likely to be different in each month. To further illustrate the evolutionary characteristics of the diurnal variations of rainfall from May to September, the hourly rain gauge data are processed as follows: (i) The diurnal variations from 1 May to 30 September are divided into groups by every 10 or 11 consecutive days. The mean diurnal variations of each group are calculated and further normalized to represent their diurnal phases. Thus, a total of 15 data groups are obtained, corresponding to the evolution of the diurnal variations of rainfall from May to September. (ii) The diurnal variations from May to September are calculated month by month without normalization, so that the differences of rainfall over the mountains, in the foothills, and over the plains can be compared. A total of five data series are ultimately obtained, which we use to show the main diurnal features of rainfall in each month. Based on the above results, we find that three patterns—early-morning peak (EMP), early-morning and late-afternoon peak (EMLAP), and late-afternoon peak (LAP)—dominate the diurnal phases of rainfall in different periods from May to September.
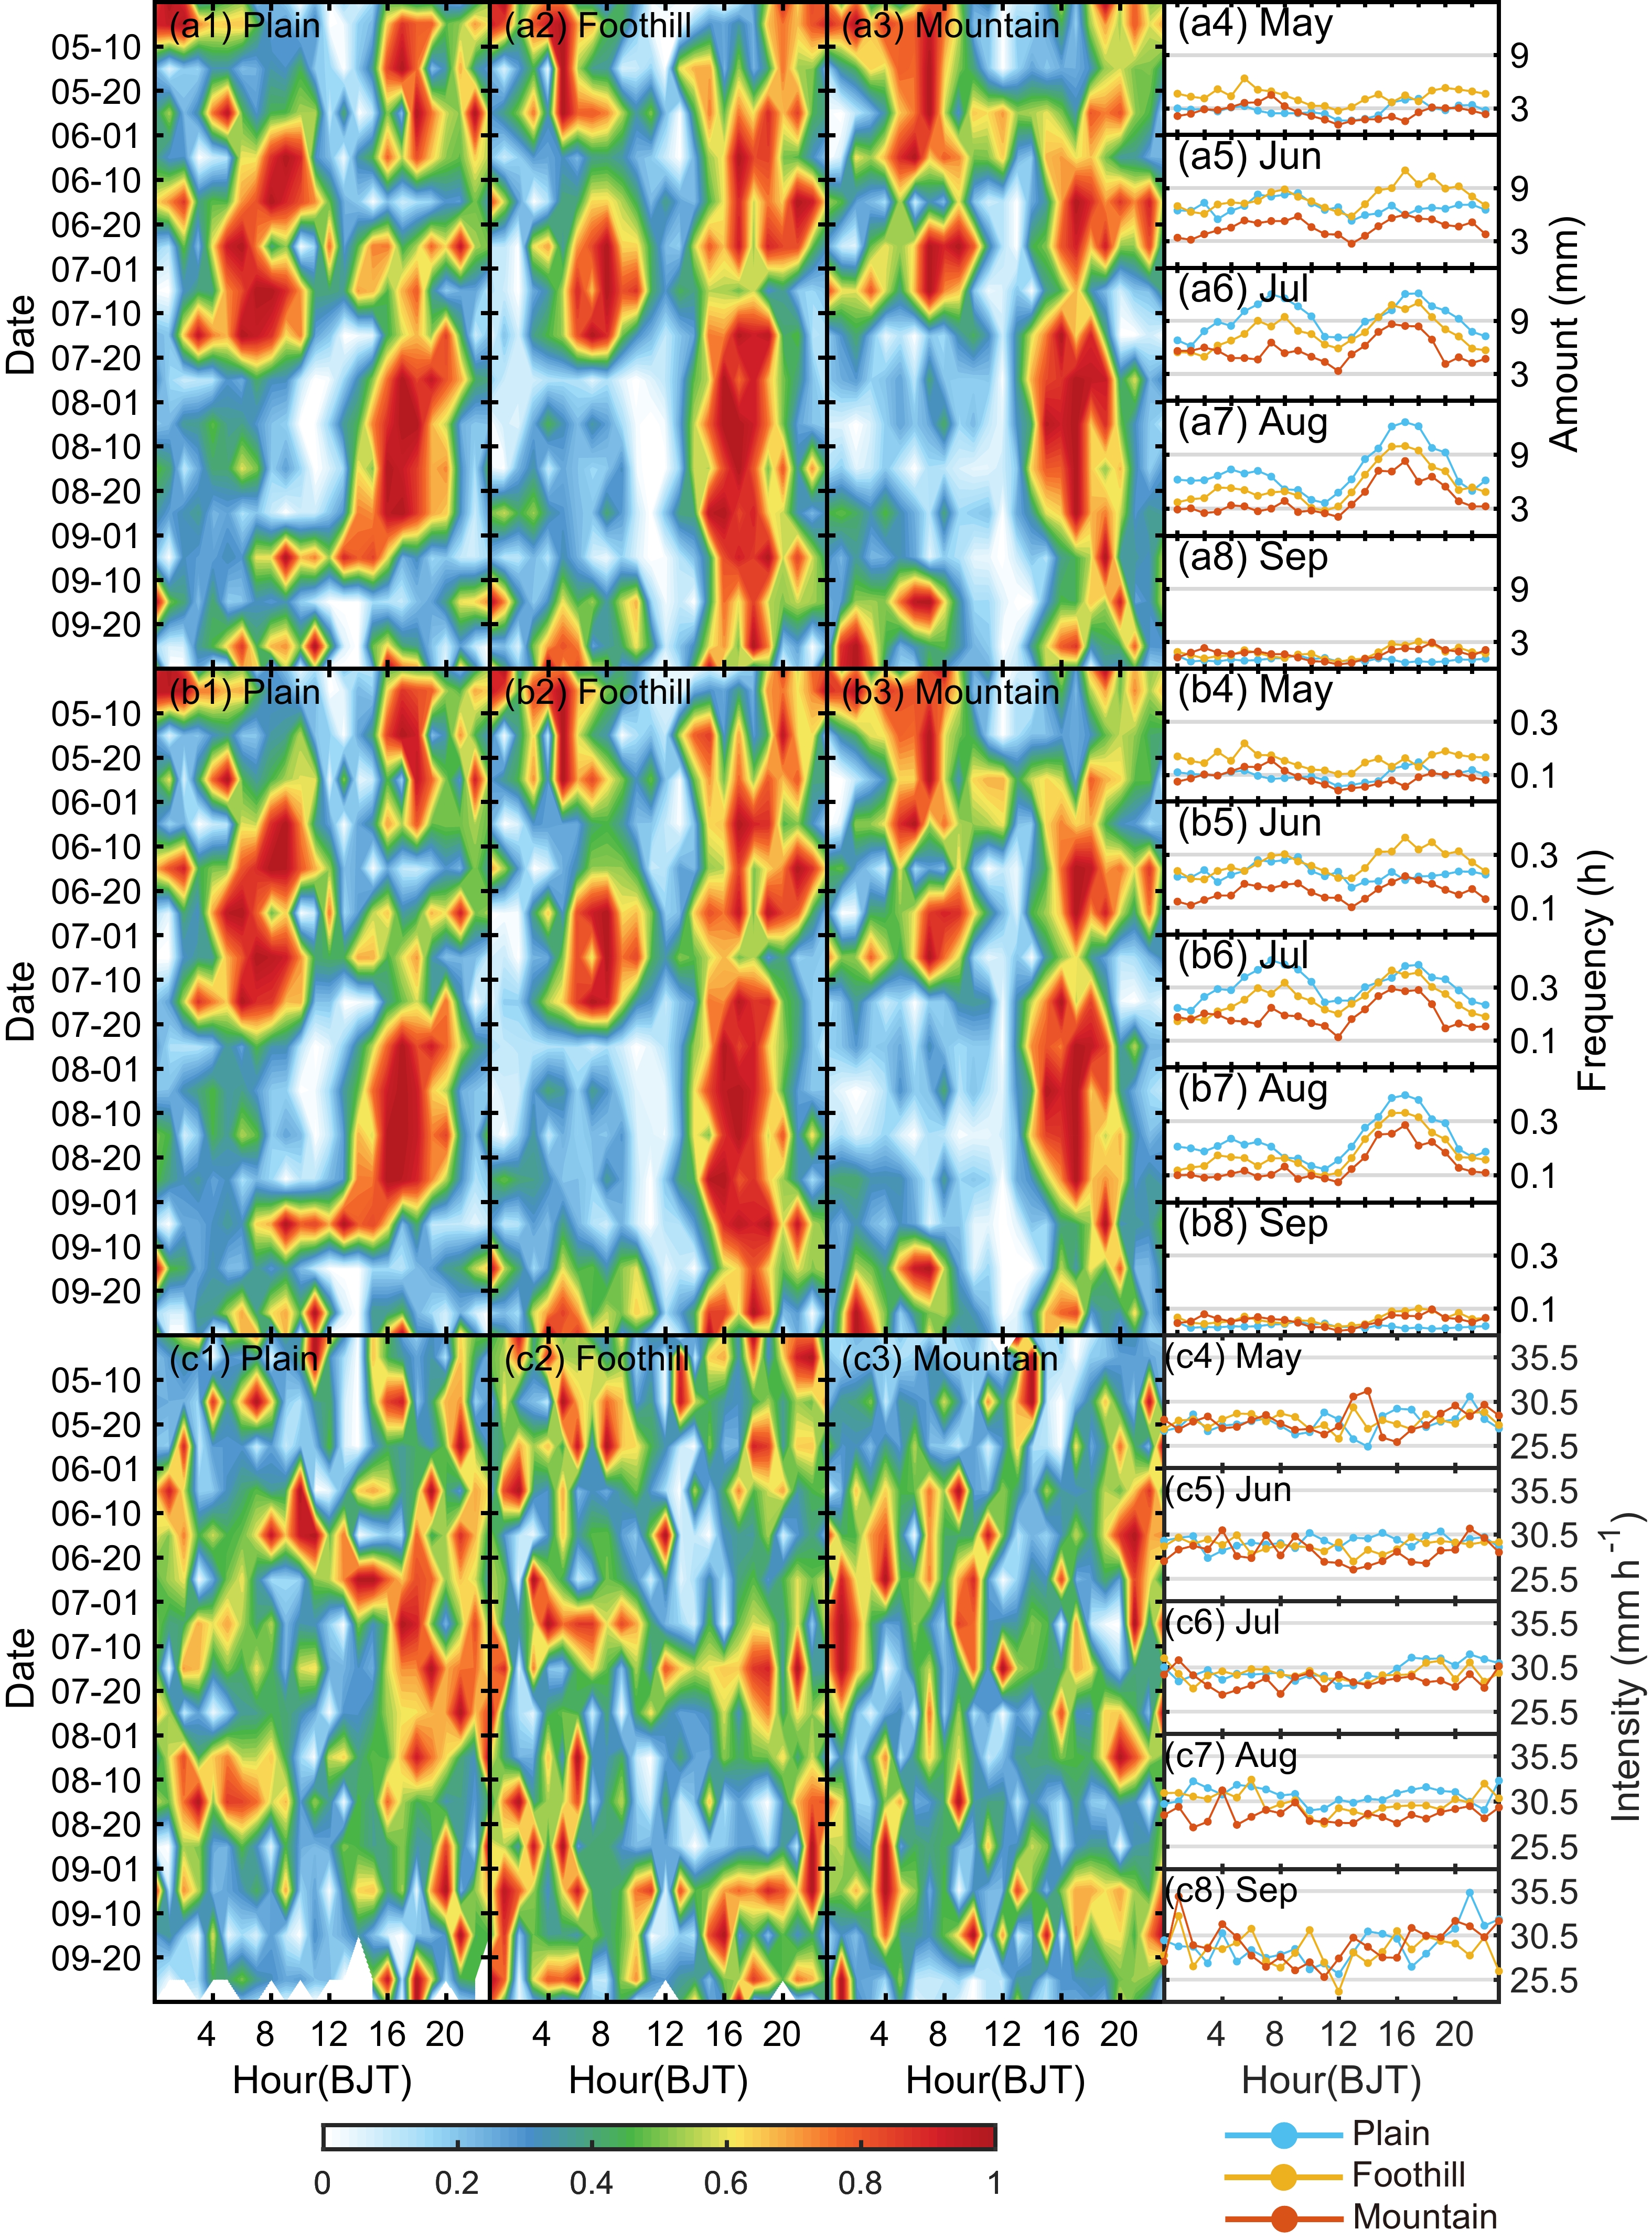
From May to August, the diurnal variation of TR amount has a phase transition for EMP (0501–0520, denoted in MMDD), EMLAP (0521–0720), and LAP (0721–0831) over the mountains and in the foothills (Figs. 10a2 and a3), and for EMLAP (0501–0520), EMP (0521–0620), EMLAP (0621–0720), and LAP (0721–0831) over the plains (Fig. 10a1). During this period, the difference in TR amount among the mountains, foothills, and plains decreases, and the diurnal variations over the mountains, in the foothills, and over the plains gradually become similar (Figs. 10a4–a7). In September, the diurnal variations in all areas switch to the EMLAP (0901–0930) pattern, with the dominant peak appearing in the early morning (Figs. 10a1–a3). The differences in TR amount among the mountains, foothills, and plains turn to be more evident (Fig. 10a8). The TR frequency shows a similar pattern to the TR amount in the evolution of the diurnal variation throughout the study period (Fig. 10b).

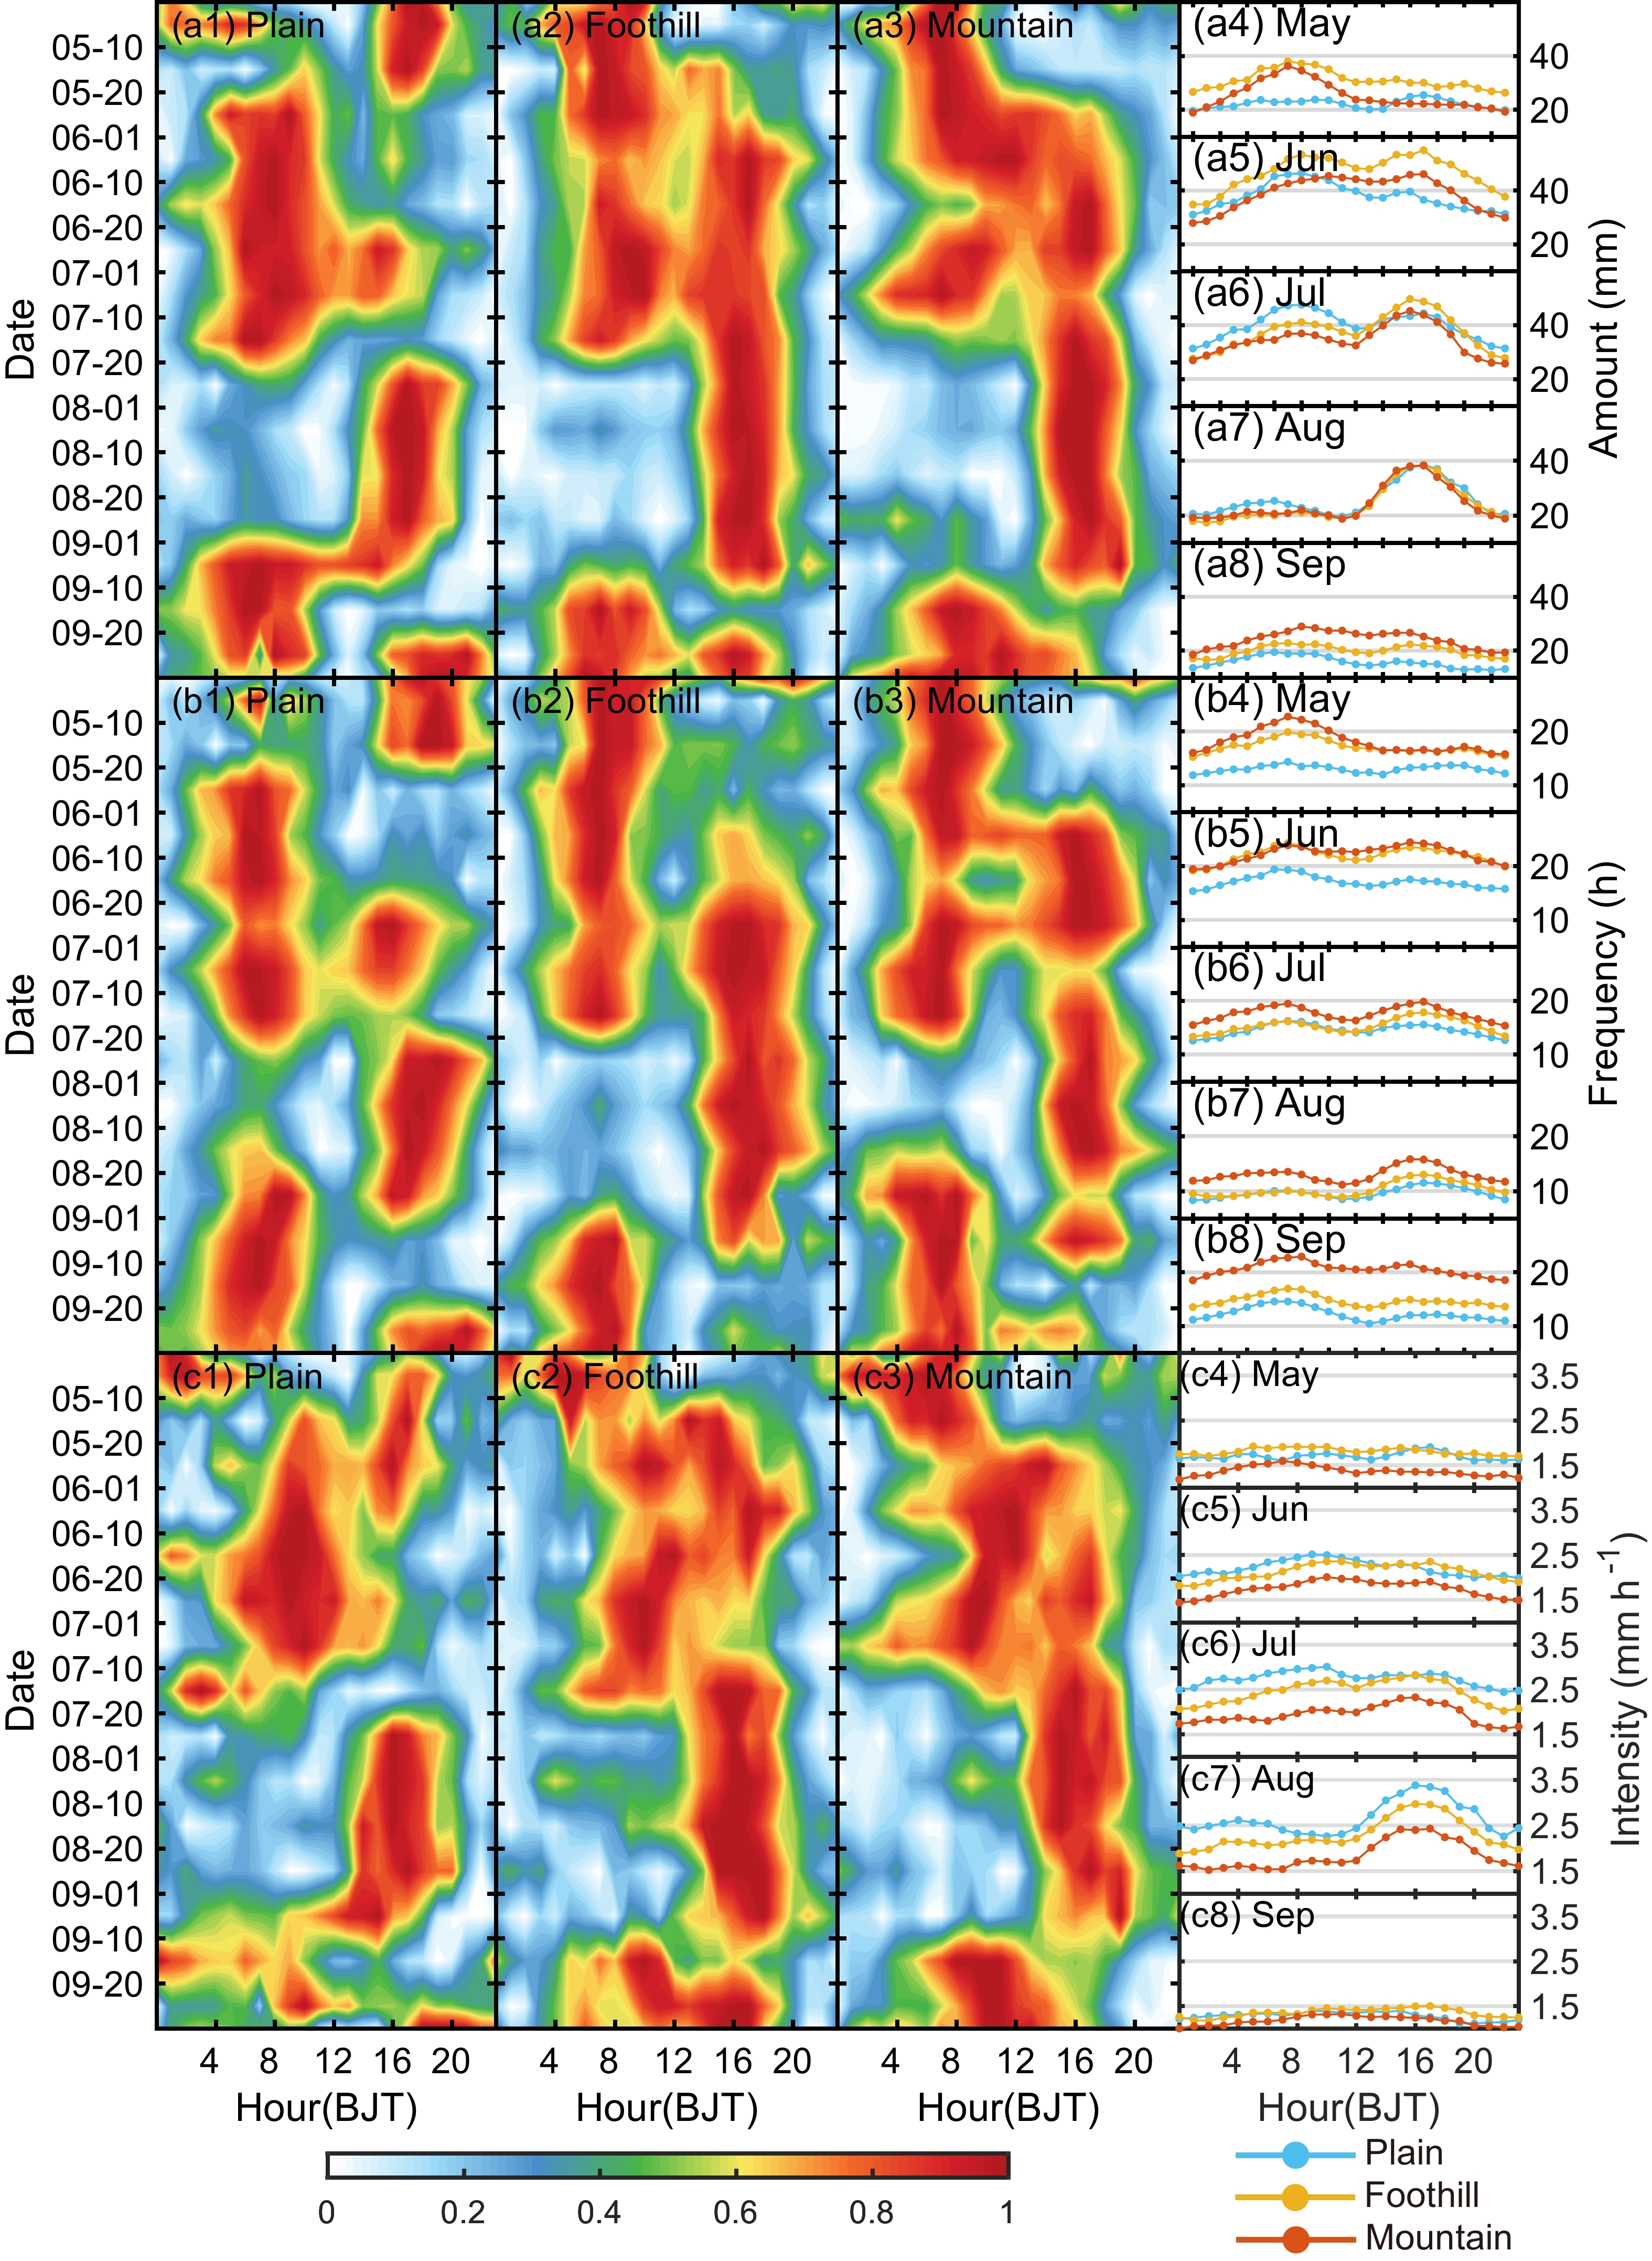
Figure 11. As in Fig. 10 but for the (a) SDHR amount, (b) SDHR frequency, and (c) SDHR intensity.
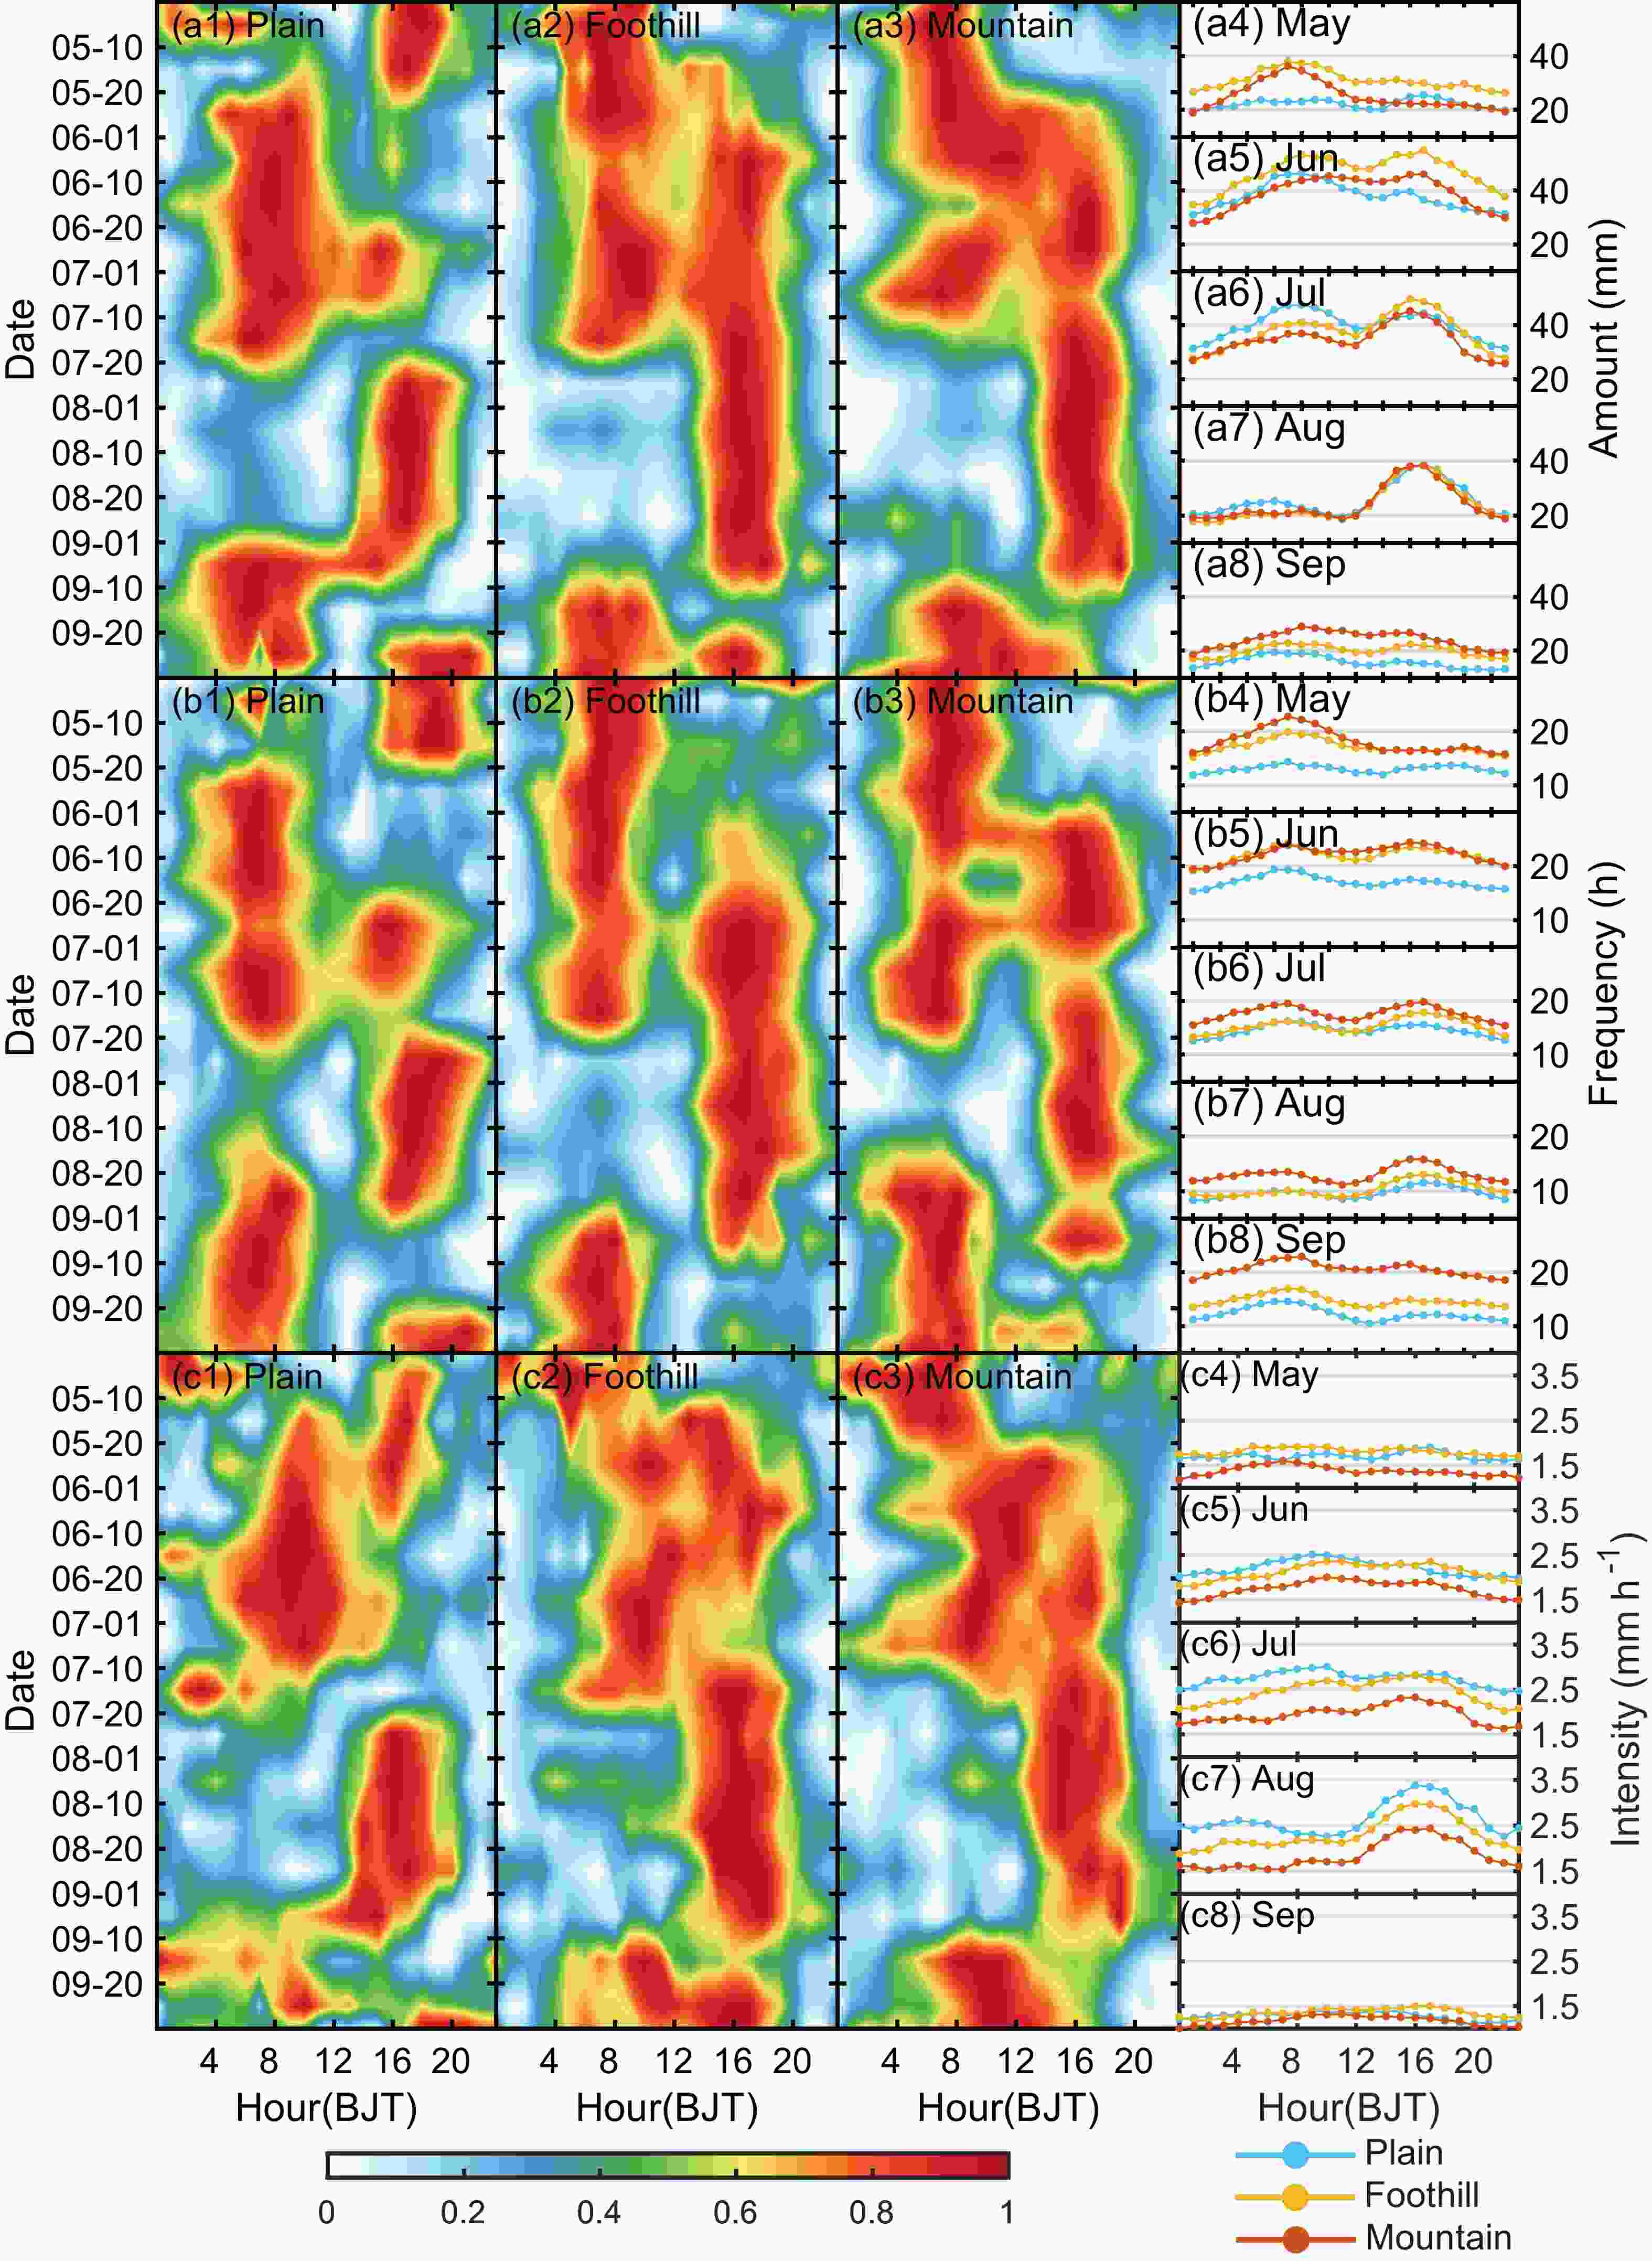
Figure 10. Evolution of the diurnal variation of (a) TR amount, (b) TR frequency, and (c) TR intensity, over the middle reaches of the YRB during the warm season (May–September) from 2016 to 2020. Panels (a1–a3), (b1–b3), and (c1–c3) show the evolution of mean normalized diurnal variation at mountain, foothill, and plain stations per 10 or 11 days. Panels (a4–a8), (b4–b8), and (c4–c8) show the mean diurnal variation of each month from May to September. The units in (a4–a8) are mm. The units in (b4–b8) are h. The units in (c4–c8) are mm h−1.
The evolution of the diurnal variation of TR intensity shows some differences (Fig. 10c). From May to August, the change of the diurnal phase is a gradual transition process from EMP to LAP over the mountains and in the foothills (Figs. 10c2–c3), while a more complex process appears over the plains (Fig. 10c1). During this period, the TR intensity in the foothills is higher than that over the mountains throughout the whole day, while that over the plains keeps increasing to a maximum in August. This enhances the differences among the mountains, foothills, and plains (Figs. 10c4–c7). In September, the diurnal phases over the mountains, in the foothills, and over the plains are very different from each other. The peak hours over the mountains and in the foothills are mainly concentrated in the period from morning to late afternoon (Figs. 10c2 and c3), while those over the plains are more complicated, with the afternoon peak almost disappearing during mid-to-late September (Fig. 10c1).
Compared with the TR amount (frequency), the SDHR amount (frequency) shows a similar transition process of the diurnal phase during May to August, albeit with a more sporadic distribution (Figs. 11a1–a3, b1–b3). The SDHR intensity has no obvious peak during its phase transition process from May to September (Figs. 11c1–c3). The differences among the mountains, foothills, and plains are also not evident (Figs. 11c4–c8). The diurnal variations of CST vary from May to September (Fig. 12): from May to August, high CST in terms of amount is mainly distributed in the period from afternoon to night (Figs. 12a1–a3), while high CST in terms of frequency is firstly mainly distributed in the period from afternoon to night from May to late July, and then turns to be mainly concentrated in the afternoon in August (Figs. 12b1–b3).
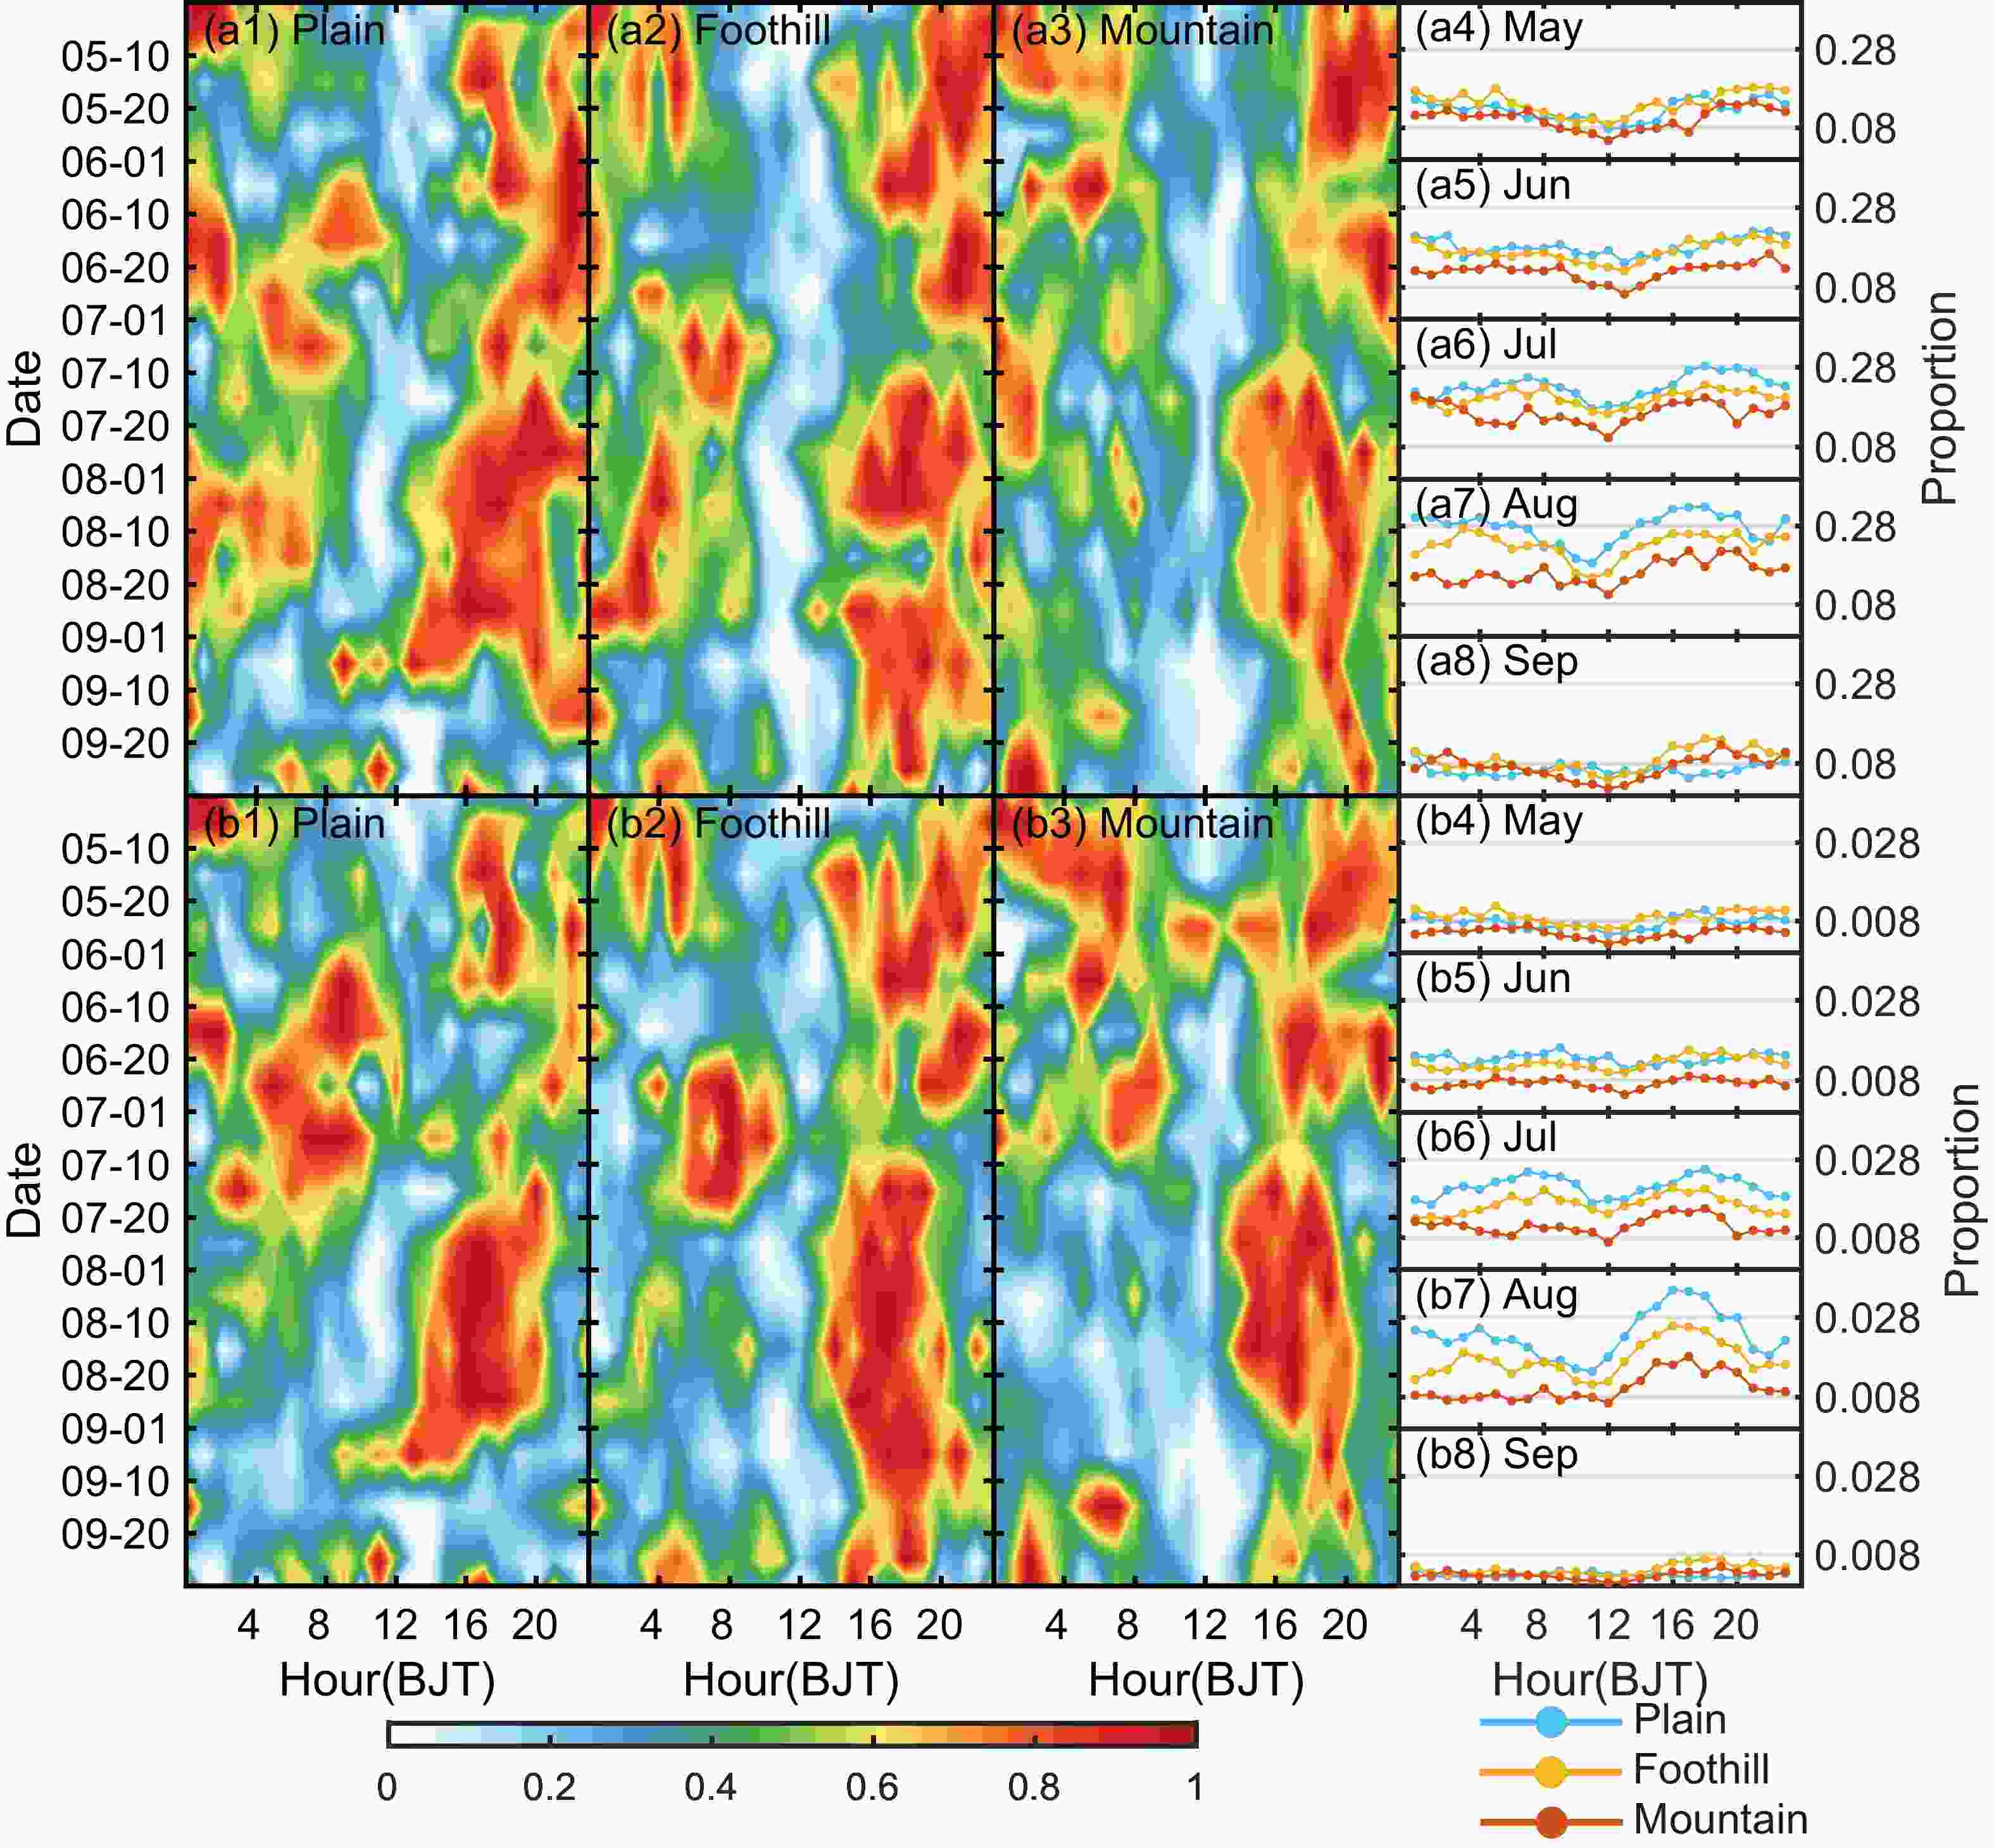
Figure 12. As in Fig. 10 but for the (a) contribution of SDHR amount to TR amount, and (b) contribution of SDHR frequency to TR frequency.
Furthermore, it should be noted that the SDHR amount (frequency) and its contribution to the TR amount (frequency) consistently show the following evolutionary characteristics: from May to August, the differences in the diurnal variations among the mountains, foothills, and plains keep increasing; the diurnal variations in the foothills are higher than those over the mountains throughout the whole day; and the diurnal variations over the plains (blue lines in Figs. 11a4–a7, b4–b7and Figs. 12a4–a7, b4–b7) keep increasing to be the highest among the three areas in August (Figs. 11a4–a7, b4–b7; Figs. 12a4–a7, b4–b7). As mentioned above, TR also shows changes from May to August in the differences among the mountains, foothills, and plains, with the difference in TR amount (frequency) continuing to decrease, while the difference in TR intensity continuing to increase (Figs. 10a4–a7, b4–b7, c4–c7). These results reveal that the rainfall differences among the mountains, foothills, and plains change gradually from May to August, probably indicating that the response of rainfall to orographic forcing also varies as the effects of different large-scale circulations change.
In summary, the evolution of the diurnal variations of TR and SDHR (amount, frequency and intensity) over the mountains, in the foothills, and over the plains is very complicated and diverse during the warm season. Nevertheless, there is a notable phase transition from EMP to LAP from May to August, which is closely related to the advance and retreat of the rainbands associated with the EASM circulation (Chen et al., 2009; Yuan et al., 2010). Chen et al. (2009) found that early-morning precipitation in southeastern China plays a dominant role in May and June, while afternoon precipitation is stronger in summer. Yuan et al. (2010) also revealed that precipitation in central-eastern China during the active monsoon period shows notable EMPs that exhibit banded spatial distributions and move with the main rainbands, while precipitation during the intermittent period is mainly concentrated in the period from late afternoon to midnight over this region. The EMP is closely related with the dynamical forcing from synoptic systems (i.e., mei-yu front, low-level jets, and their interaction with terrain) (Sun and Zhang, 2012; Chen et al., 2017), while the LAP is primarily caused by short-duration rainfall events controlled by the local thermal convection (Zhou and Wang, 2006; Li et al., 2008). Over the Dabie Mountains, one mechanism for the formation of an EMP is the interaction between the uplifting effect of the Dabie Mountains and a nocturnal boundary layer low-level jet (Fu et al., 2019). In general, the results of the present study show that, with the advance and retreat of the monsoon rainbands, the diurnal variation of rainfall during the warm season over the middle reaches of the YRB exhibits complicated evolutionary characteristics under the influence of complex topographic distributions.
-
Based on hourly rain gauge observational data during a period of five warm seasons (2016–20), the spatiotemporal distributions of rainfall over three types of terrain (mountain, foothill, and plain) in the middle reaches of the YRB are analyzed in terms of TR amount (frequency and intensity), SDHR amount (frequency and intensity), and the CST. The main findings can be summarized as follows:
(1) The TR amount (frequency) and SDHR amount (frequency) show similar annual variations but different monthly variations, with the peak month of the TR amount (frequency) appearing in June and the peak month of the SDHR amount (frequency) appearing in July. The CST in terms of amount varies slightly per year (16%–18%), with the maximum of 23% appearing in August, whereas the CST in terms of frequency per year is low (≤ 2%).
(2) The TR amount (frequency) and SDHR amount (frequency) show notable differences among mountain, foothill, and plain areas. The areas with a high TR are mainly located over the mountains and in the foothills over the middle reaches of the YRB, while those associated with a high SDHR are mainly concentrated at the foothill and plain stations close to the mountains. The mean rainfall of the warm season in the foothills is characterized by a high TR amount and high CST; rainfall over the mountains is characterized by a high TR frequency as well as low CST and intensity; and rainfall over the plains shows a low TR amount (frequency) as well as a high CST and intensity.
(3) The diurnal variations of TR and SDHR show diverse characteristics in mountain, foothill, and plain areas during the warm season. They exhibit a double-peak pattern, with one weak peak appearing in the early morning and the other strong peak appearing in the late afternoon. Overall, the rainfall in the foothills shows the strongest afternoon diurnal peak, with the following characteristics: TR is characterized by the highest rainfall amount, lower frequency, and a significant intensification of the afternoon rainfall intensity; SDHR is characterized by both the highest rainfall amount and frequency, but medium intensity. These results suggest that atmospheric thermal instability due to solar heating plays an important role in the late-afternoon rainfall intensification in the foothills, which is more likely to produce SDHR.
(4) The diurnal variations of TR and SDHR are accompanied by notable phase transitions from an EMP (mainly in May) to a LAP (mainly in August). The diurnal characteristics of rainfall over the mountains, in the foothills, and over the plains are also different from May to August. The difference between the diurnal characteristics of TR amount (frequency) over the mountains or in the foothills and that over the plains gradually becomes less noticeable from May to August. The SDHR amount (frequency) over the plains rises to be the highest among the three types of terrain. The phase transition of diurnal variation is possibly related to the migration of monsoon rainbands affected by monsoon circulations (Chen et al., 2009; Yuan et al., 2010), and the responses of precipitation to topographic forcing vary as the synoptic circulations change.
As SDHR is usually considered as convective precipitation (Davis, 2001; Fu and Liu, 2003; Zhang and Zhai, 2011; Chen et al., 2013a; Zheng et al., 2019), the results on SDHR in this study can to some extent reflect the distribution characteristics of convective precipitation over the middle reaches of the YRB during the warm season. Overall, the contribution of convective precipitation to total precipitation is above 16% during the warm season, with a maximum of 23% appearing in August. Moreover, it tends to form in the foothills in the afternoon and contributes more to the total precipitation in the foothills and over the plains than that over the mountains.
In addition, stations in this study were divided into three groups (mountain, foothill, and plain) according to their elevation, and the spatiotemporal variations of precipitation were then analyzed according to the averaged results of each type of station. It is found that SDHR is weak over the mountains. Although most of the mountain stations are concentrated in the western part of the study area (Fig. 1), SDHR was rarely observed at the mountain stations in the northwestern part during the study period (Fig. 5). This is the main reason why the averaged SDHR amount (frequency) within mountain areas is lower than that within plain areas and in the foothills (Figs. 7c and d). However, the SDHR amount (frequency) at some mountain stations in the southern part of the study area is not low (Fig. 5). Considering the interspersed spatial distribution of mountain, foothill, and plain stations over the middle reaches of the YRB, some plain stations with heavy rainfall are located close to the mountains (Figs. 5 and 6), which to some extent also increases the SDHR over the plains.
In conclusion, the spatiotemporal distribution characteristics of the rainfall over the middle reaches of the YRB are complicated and diverse. The main reasons for this include the effects of the migration of the EASM, varied synoptic circulations, complex underlying surfaces (e.g., various types of topography, dense urban clusters, etc.), and other fundamental factors governing rainfall distribution over hills and mountains (Yuan et al., 2010; Luo et al., 2020; Tang et al., 2022). The microphysics of particle growth, the response of a fluid flow to a terrain barrier, and the thermodynamics of moist air, also act as key factors for controlling the rainfall pattern over different types of terrain (Houze, 2012). Thus, further studies focused on rainfall events associated with different mountains (i.e., Dabie Mountains, second-step terrain) in the study area, are required to investigate how the topography (windward slopes, leeward slopes, the diversion of airflow) has an impact on the initiation, intensity, and diurnal variation of rainfall processes under different atmospheric circulations.
Acknowledgements. The routine surface observational data used in this study were provided by the National Meteorological Center, China Meteorological Administration. This research was supported by the National Natural Science Foundation of China (Grant Nos. U2142202, 41975056, 42230612, and 41975058), Youth Innovation Promotion Association, Chinese Academy of Sciences, and the National Key Scientific and Technological Infrastructure project “Earth System Numerical Simulation Facility” (EarthLab).
Spatiotemporal Characteristics of Rainfall over Different Terrain Features in the Middle Reaches of the Yangtze River Basin during the Warm Seasons of 2016–20
- Manuscript received: 2023-02-15
- Manuscript revised: 2023-08-30
- Manuscript accepted: 2023-09-25
Abstract: Based on hourly rain gauge data during May–September of 2016–20, we analyze the spatiotemporal distributions of total rainfall (TR) and short-duration heavy rainfall (SDHR; hourly rainfall ≥ 20 mm) and their diurnal variations over the middle reaches of the Yangtze River basin. For all three types of terrain (i.e., mountain, foothill, and plain), the amount of TR and SDHR both maximize in June/July, and the contribution of SDHR to TR (CST) peaks in August (amount: 23%; frequency: 1.74%). Foothill rainfall is characterized by a high TR amount and a high CST (in amount); mountain rainfall is characterized by a high TR frequency but a small CST (in amount); and plain rainfall shows a low TR amount and frequency, but a high CST (in amount). Overall, stations with high TR (amount and frequency) are mainly located over the mountains and in the foothills, while those with high SDHR (amount and frequency) are mainly concentrated in the foothills and plains close to mountainous areas. For all three types of terrain, the diurnal variations of both TR and SDHR exhibit a double peak (weak early morning and strong late afternoon) and a phase shift from the early-morning peak to the late-afternoon peak from May to August. Around the late-afternoon peak, the amount of TR and SDHR in the foothills is larger than over the mountains and plains. The TR intensity in the foothills increases significantly from midnight to afternoon, suggesting that thermal instability may play an important role in this process.
摘要: 利用地面自动站逐小时降水观测数据,针对不同的地形特征(山区( 400 m)、山麓(100 ~ 400 m)和平原(0 ~ 100 m)),分析了2016–20年暖季(5~9月)长江中游地区总降水和短时强降水(小时降水量20 mm)的整体特征、空间分布差异及日变化演变特征。对于山区、山麓和平原,总降水和短时强降水的雨量均在6月或7月达到峰值,短时强降水对总降水的贡献率在8月达到峰值(雨量为23%;频次为1.74%)。山麓降水中总降水量高、且短时强降水雨量贡献高,山区降水中总降水频次高、但短时强降水雨量贡献低,平原降水的总降水频次和雨量均较低、但短时强降水的雨量贡献高。整体来看,总降水(雨量和频次)的大值区多分布在山脉附近的山区和山麓站,短时强降水(雨量和频次)则集中分布在山脉附近的山麓或平原站。在日变化方面,山区、山麓和平原的总降水和短时强降水均表现为强度有明显差异的双峰特征(弱清晨峰值和强午后峰值),且从5到8月具有从清晨降水逐渐向午后降水转变的特征。在午后峰值时刻,总降水和短时强降水的雨量均具有山麓高于山区和平原的特征,且山麓地区从夜间到午后的总降水强度增幅显著,表明午后的热力不稳定对山麓地区的降水增强有重要作用。
 AAS Website
 AAS WeChat