


 DownLoad:


-
Evapotranspiration (ET) includes vegetation transpiration, soil evaporation, interception loss, open-water evaporation, and snow sublimation (Miralles et al., 2011). It is a passive process driven by energy and vapor pressure deficit (VPD) and limited by soil water availability. As a key component of terrestrial water, carbon, and energy cycles, ET affects global climate change and terrestrial ecosystems. Approximately 70% of global precipitation returns to the atmosphere through evapotranspiration each year, and in arid or semiarid regions this value may exceed 95% (Moiwo and Tao, 2015). Additionally, more than 60% of the global net solar radiation absorbed by the land surface is used to evaporate surface water (Trenberth et al., 2009). ET transports vapor and energy to the atmosphere, which can potentially cause or enhance deep convection and severe weather (Yang et al., 2016). ET also tightly conjoins carbon dioxide exchange via vegetation photosynthesis (Beer et al., 2010). Accurate ET estimates can promote a better understanding of the change mechanism of water and energy cycles.
As the “Asian Water Tower”, the Tibetan Plateau (TP) plays a vital role in the evolution of the Asian monsoon and the water-energy cycles in the Northern Hemisphere. The hydrologic cycle over the TP is affected by shrinking glaciers and changes in precipitation patterns caused by weakening Indian monsoons and strengthening westerlies (Yao et al., 2012). Global warming is supposed to accelerate the hydrological cycle (Pan et al., 2015b). The TP is the most significant, sensitive, and rapidly changing region for global climate and the environment (Qin et al., 2009). Under the background of global warming, the warming over the TP becomes even more significant. Therefore, focusing on the hydrologic cycle is crucial for improving water resource management and mitigating natural disasters over the TP and downstream countries.
Because of ET's high variability in time and space, direct measurement of ET is extremely difficult (Xu and Singh, 2005). ET data are traditionally acquired from in situ measurements, including weighing lysimeters, Bowen ratio energy balance systems, eddy covariance systems (ECs), and large aperture scintillometers (LASs) (Fisher et al., 2008). However, such measurements are costly and have limited spatial coverage, resulting in the inability to accurately estimate ET over large regions with challenging climates and complex topography such as the TP. To solve this problem, multiple ET products have been generated from reanalysis, remote sensing (RS), and land surface models (LSM) at regional or global scales (Reichle et al., 2017). Due to differences in meteorological forcing data, structural complexity, and parameterization, large uncertainties exist among various products (Sörensson and Ruscica, 2018). For example, some studies have noted that there is specifically a 15%~30% uncertainty between RS-derived ET products (Wang and Dickinson, 2012). There are regional differences in accuracy and applicability owing to climate, surface conditions, and spatial and temporal scales (Long et al., 2014). Therefore, different ET products should be comprehensively evaluated to identify the strengths and limitations in specific areas before they can be applied.
At present, there are two main types of uncertainty analysis methods for ET products. The first category is based on in situ measurements. Most previous studies have used EC ET data, which are generally considered to be the true value, as reference values to evaluate multisource ET products (Fisher et al., 2017). Inevitably, station representation and mismatch between point and pixel scales introduce uncertainty. Especially in the TP, sparse observations will significantly affect the accuracy of the assessment. To overcome this limitation, the second category is not based on in situ measurements. Recently, the triple collocation (TC) method has been used as an uncertainty estimation tool to evaluate hydrologic variables, such as soil moisture (Dong et al., 2020a), precipitation (Dong et al., 2020b), and leaf area index (Jiang et al., 2017). Based on TC, the multiple collocation (MC) method provides an extension to incorporate more than three estimation sources (Pan et al., 2015a). MC is used as a validation strategy, which is estimated by the statistical method. Without any prior knowledge and high-quality reference datasets, it can objectively evaluate the error of three or more independent products and give the covariance of each dataset. However, none of the studies have considered this approach to analyze multisource ET products over the TP. Considering the advantages and disadvantages of various ET products, merging reanalysis, satellite, and modeled ET products would reduce uncertainty and improve ET accuracy. Many studies have proven that the ET estimates from the multimodel averaged method are superior to those of individual models (Wu et al., 2012). However, MC-based statistical tools have not been considered for current multisource ET data merging. Therefore, the MC method is applied to evaluate and merge ET products over the TP.
The objectives of this study are as follows: 1) to investigate the reliability and application prospects of the MC method over the TP, where few ground stations have homogenous underlying surfaces; 2) to evaluate the uncertainties of multisource ET products (reanalysis-based, RS-based, and LSM-based ET products) over the TP using the MC method; 3) to generate higher precision merged ET products. Section 2 describes the study area and datasets. Section 3 explains the basic mathematical principle of MC and the least-squares merging scheme. Three categories of ET products are comprehensively evaluated from point (Pearson correlation analysis) and regional perspectives (MC method) in section 4. The main conclusions are then summarized in section 5.
-
The TP (26°00′~39°47′N, 73°19′~104°47′E) is located in central Asia, with an area of approximately 2.55 × 10⁶ km2 (the region ≥ 2500 m) and an average elevation over 4000 m (Wang et al., 2018). It has complex terrain, with more than 60% of its area being alpine grassland, alpine meadow, alpine grassland, and alpine desert (Wang et al., 2020). For this reason, the TP is acknowledged to exert a major influence on regional climate and atmospheric circulations via its thermal and dynamic mechanisms (Wu et al., 2012). The TP climate is characterized by an arid and semiarid climate, presenting a wet and warm summer and a cool and dry winter. Its land surface temperatures regionally vary, with an average temperature of 20°C in the southeast and mostly below 0°C in the northwest. Annual precipitation also demonstrates regional variability, gradually decreasing from the southeast (above 1000 mm) to the northwest (below 100 mm) (Wang et al., 2018). The TP, also known as the Asian Water Tower, is composed of glaciers with an area of approximately 100 000 km2, lakes with a total area of approximately 47 000 km2, and serves as the origin of more than ten major rivers with a total runoff of more than 466.1 billion m3, including the Brahmaputra, Mekong, Yellow and Yangtze Rivers, which support more than one billion people (Yao et al., 2022).
-
Reanalysis, remote sensing, and land surface model-based ET datasets are adopted as inputs for MC analysis. Upon considering temporal coverage and spatiotemporal resolution, twelve ET data products are selected in this study (Table 1).
ET products Category Spatial resolution Temporal resolution References CR Reanalysis 0.1° × 0.1° Monthly (Ma et al., 2019) SGC Reanalysis 0.1° × 0.1° Monthly (Wang et al., 2022a) ERA5 Reanalysis 0.25° × 0.25° Monthly (Hersbach, 2016) MERRA1 Reanalysis 0.5° × 0.667° 1 hour (Rienecker et al., 2011) NCEP_R2 Reanalysis Global T62 Gaussian grid (~210 km) 6 hours (Roads, 2003) SiTHv2 RS 0.1° × 0.1° Daily (Zhang et al., 2022) MODIS RS 0.05° × 0.05° 8 days (Yao et al., 2014) GLEAM3.6a RS 0.25° × 0.25° Monthly (Martens et al., 2017) GLEAM3.6b RS 0.25° × 0.25° Monthly (Martens et al., 2017) CLSM LSM 0.25° × 0.25° Monthly (Rodell et al., 2004) NOAH LSM 0.25° × 0.25° Daily (Rodell et al., 2004) VIC LSM 1° × 1° 3 hours (Rodell et al., 2004) Table 1. Overview of multisource evapotranspiration products.
-
The SGC product is derived from the sigmoid generalized complementary equation, using the ERA5 and China meteorological forcing datasets (CMFD) as input for the net radiation (Wang et al., 2022a, b). The dataset is calibrated and verified by the observation data of 12 eddy flux sites and water balance data of 7 river basins over the TP. The land surface parameter, b, in the sigmoid equation, provides the basis for the accurate prediction of evaporation over the TP under fast-changing conditions. The product includes monthly evaporation (soil evaporation, vegetation transpiration, and canopy interception) over the TP from 1979 to 2018. The CR dataset uses the nonlinear complementary-relationship method to generate the actual evapotranspiration of the land surface. The CMFD downward shortwave and longwave radiation, air temperature, air pressure, GLASS albedo and broadband longwave emissivity, ERA5-land near-surface temperature and humidity, and NCEP diffuse skylight ratio are selected as input data. The ERA5 dataset uses the 4D data assimilation technique of the ECMWF Integrated Forecasting System (IFS) and has 137 isobaric surface data spaced at 0.01 hPa intervals in the longitudinal direction. The monthly mean ET data of the surface layer are used. Compared to NCEP-DOE Reanalysis I (NCEP-R1), NCEP-R2 fixes data assimilation errors and updates physical parametric models. The MERRA1 products refer to the National Aeronautics and Space Administration (NASA) Modern Era Retrospective-analysis for Research and Applications (MERRA) reanalysis dataset.
-
There are four types of remote sensing-based ET products. The Global Land Evaporation Amsterdam Model (GLEAM) ET is the actual ET dataset. The Priestley-Taylor equation is used to indirectly calculate the actual ET on different underlying surfaces: transpiration, bare-soil evaporation, interception loss, open-water evaporation, and sublimation. The constraint of soil moisture on ET is also considered with the inclusion of a detailed parameterization process of forest interception. Meanwhile, microwave observations are widely used, which show advantages under cloudy conditions. Compared with GLEAM3.6a, GLEAM3.6b uses all remote sensing data to replace reanalysis data for driving data and spans a shorter period. The SiTHv2 dataset is obtained based on a remote sensing model driven by remote sensing and reanalysis meteorological data to estimate global daily terrestrial evapotranspiration (Zhang et al., 2022). The forcing data mainly includes net radiation, temperature, precipitation, air pressure, leaf area index, and land cover. The MODIS ET products are global remote sensing products with high spatiotemporal resolution. They use Bayesian methods to integrate five bit-heat flux algorithms, MOD16, RRS-PM, PT-JPL, MS-PT, and UMD-SEMI, combined with AVHRR, MODIS, and MERRA. The temporal resolution of the MODIS ET product is 8 days, and the spatial resolution was 0.05° × 0.05°.
-
The widely used Global Land Assimilation Data System (GLDAS) with two versions is adopted. The first version is a global dataset generated from 1979 to the present, driving various land surface models via observation and satellite data. The second version uses global meteorological data from Princeton University as the forcing field and drives different land surface models. Due to the serious problem of data discontinuity of GLDAS1.0, GLDAS2.0 (Noah, CLM, VIC) is selected.
-
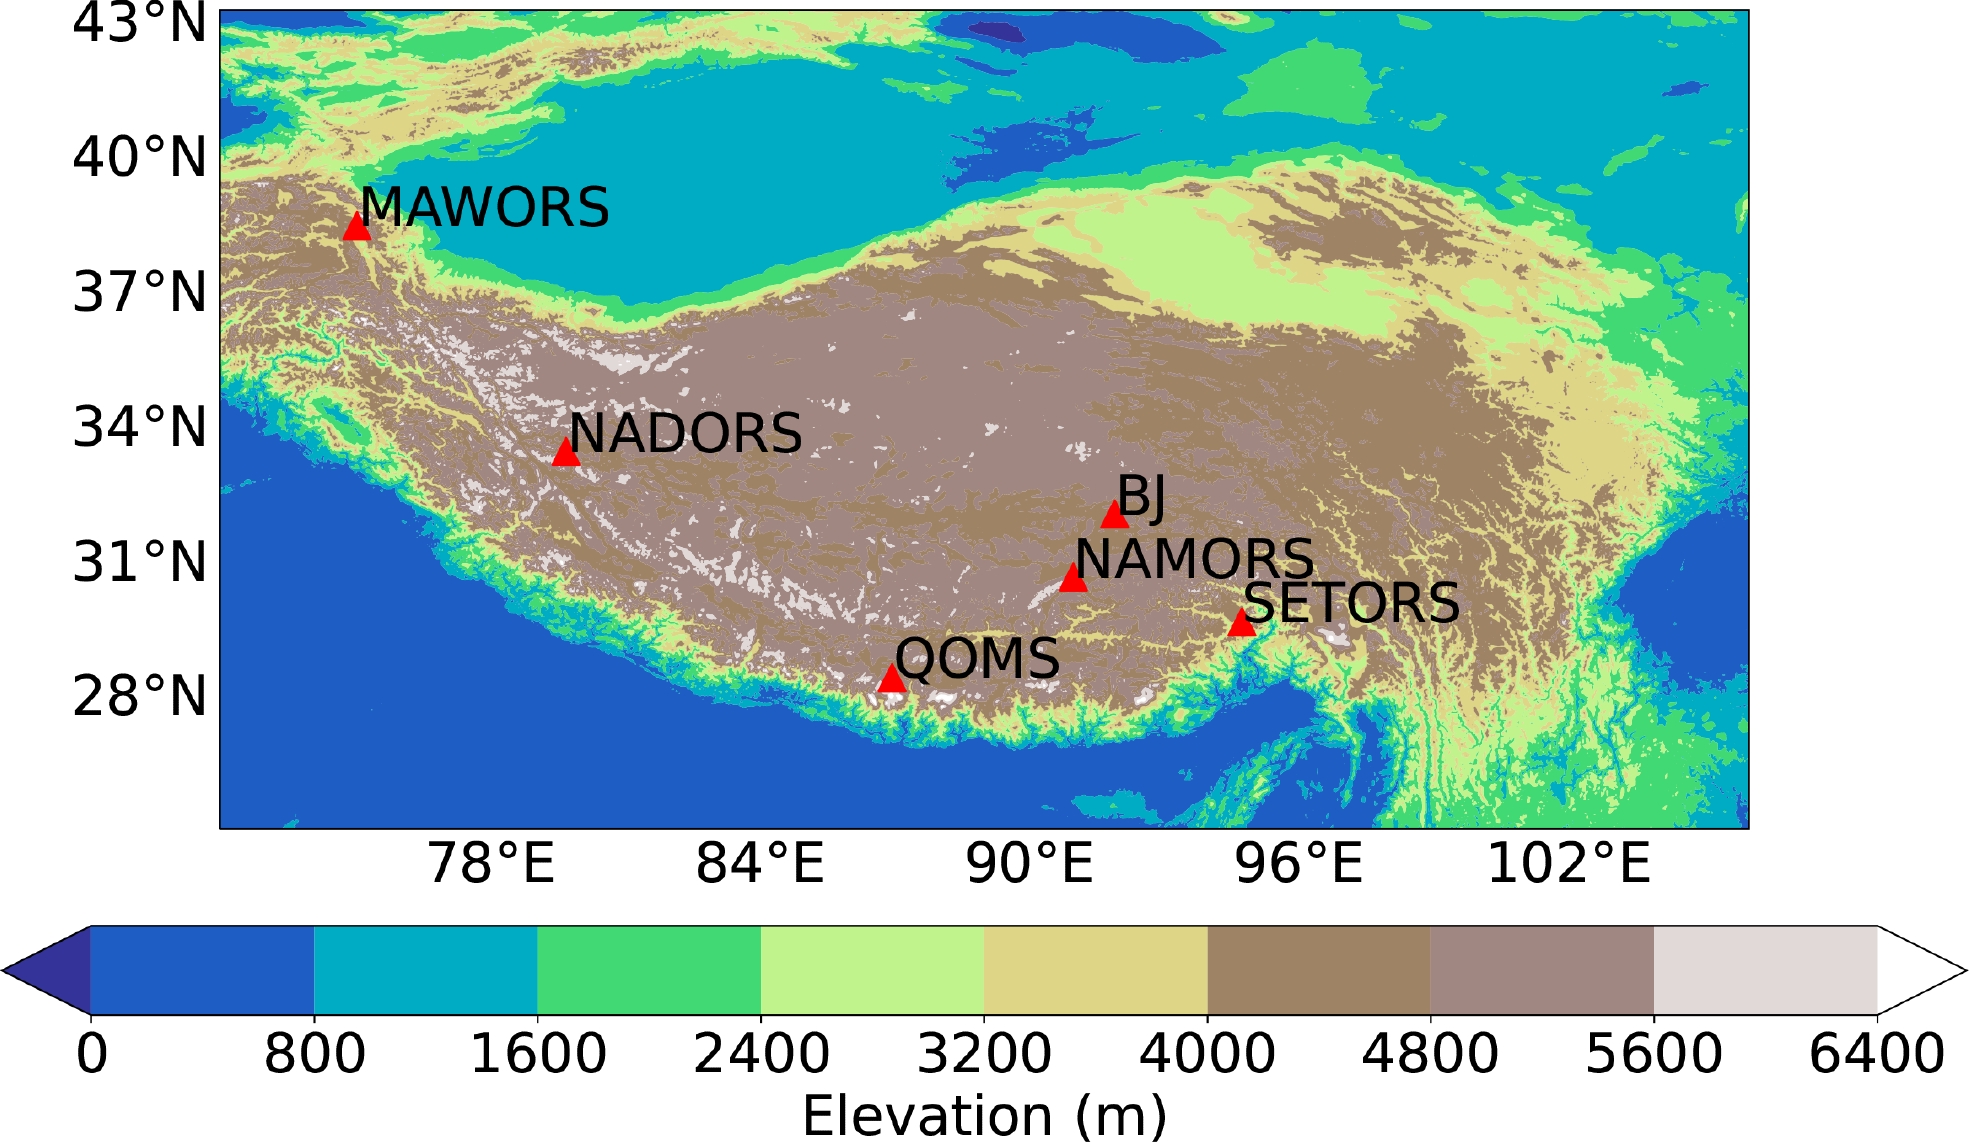
Eddy covariance (EC) ET has been utilized for reference data to validate different ET products. The Tibetan Observation and Research Platform (TORP) is an operational observing network that pays close attention to the TP’s atmosphere–land interaction. In situ ET data are collected from six flux tower observations over the TP (Fig. 1 and Table 2). These observations provide half-hourly values, and the time intervals are resampled into monthly average values to match different ET products.

Figure 1. Locations of the study area and observation networks. (Six flux tower sites are marked by triangles.)
Station Location Elevation (m) Land cover Climatic region BJ 31.37°N, 91.90°E 4509 Alpine meadow Semihumid area QOMS 28.21°N, 86.56°E 4276 Alpine desert Semiarid area NADORS 33.39°N, 79.70°E 4264 Alpine desert Arid area NAMORS 30.46°N, 90.59°E 4730 Alpine steppe Semiarid area SETORS 29.77°N, 94.73°E 3326 Alpine meadow Humid area MAWORS 38.41°N, 75.05°E 3668 Alpine desert Arid area Table 2. Overview of EC stations selected to validate ET products.
-
Since the ET products have different resolutions, a unified standard for data preprocessing is established as shown in Table 1. ET data are resampled with a spatial resolution of 0.25° × 0.25° and a temporal resolution of one month. A common period of record from January 2005 to December 2015 is chosen. Additionally, the area used for the ET products is a rectangular boundary (20°–45°N, 70°–110°E), which covers the entire TP. We fuse it and then crop it to the study area.
-
The errors of different products are obtained using MC. Assuming all the N sets of estimates of ET are unbiased, each set has n monthly values:
Provided the true value of the ET (we may never know) is:
The root-mean-square (RMS) distance represents the distance between any two estimates (
$ {x}_{j} $ and$ {x}_{k} $ ): (MC RMSE)The error evaluation using the MC method addresses the issue of the unknown squared error
$ {\left\{{{d}_{it}}^{2}\right\}}_{i=1,\cdots ,N} $ through a given$ {\left\{{{d}_{ij}}^{2}\right\}}_{\forall i\ne j} $ . Where$ \theta $ is a function expression and$ C $ is for the permutation. -
Merging various ET products through the minimum squared error is beneficial. The least-squares method is an estimation theory first proposed by Gauss and Legendre (Chawla, 1968), which can explain most modern data assimilation techniques. Consider that the optimal merge of estimates is
$ {\mathrm{E}\mathrm{T}}_{o} $ , it follows:where argmin represents the value of the variable when the objective function takes the minimum value.
The optimal weights and the squared error of the combined estimate,
$ {w}_{i} $ and$ {d}_{ot}^{2} $ , are calculated based on Eqs. (9) and (10). Previous studies have revealed an inverse relationship between estimate error and weight, in that the smaller the estimate error, the larger the weight (Yilmaz et al., 2012): -
The accuracy of independent ET data is assessed using in situ data as the reference. The correlation coefficient (R), unbiased root-mean-square error (ubRMSE) and mean absolute error (MAE). The calculation formulas are:
-
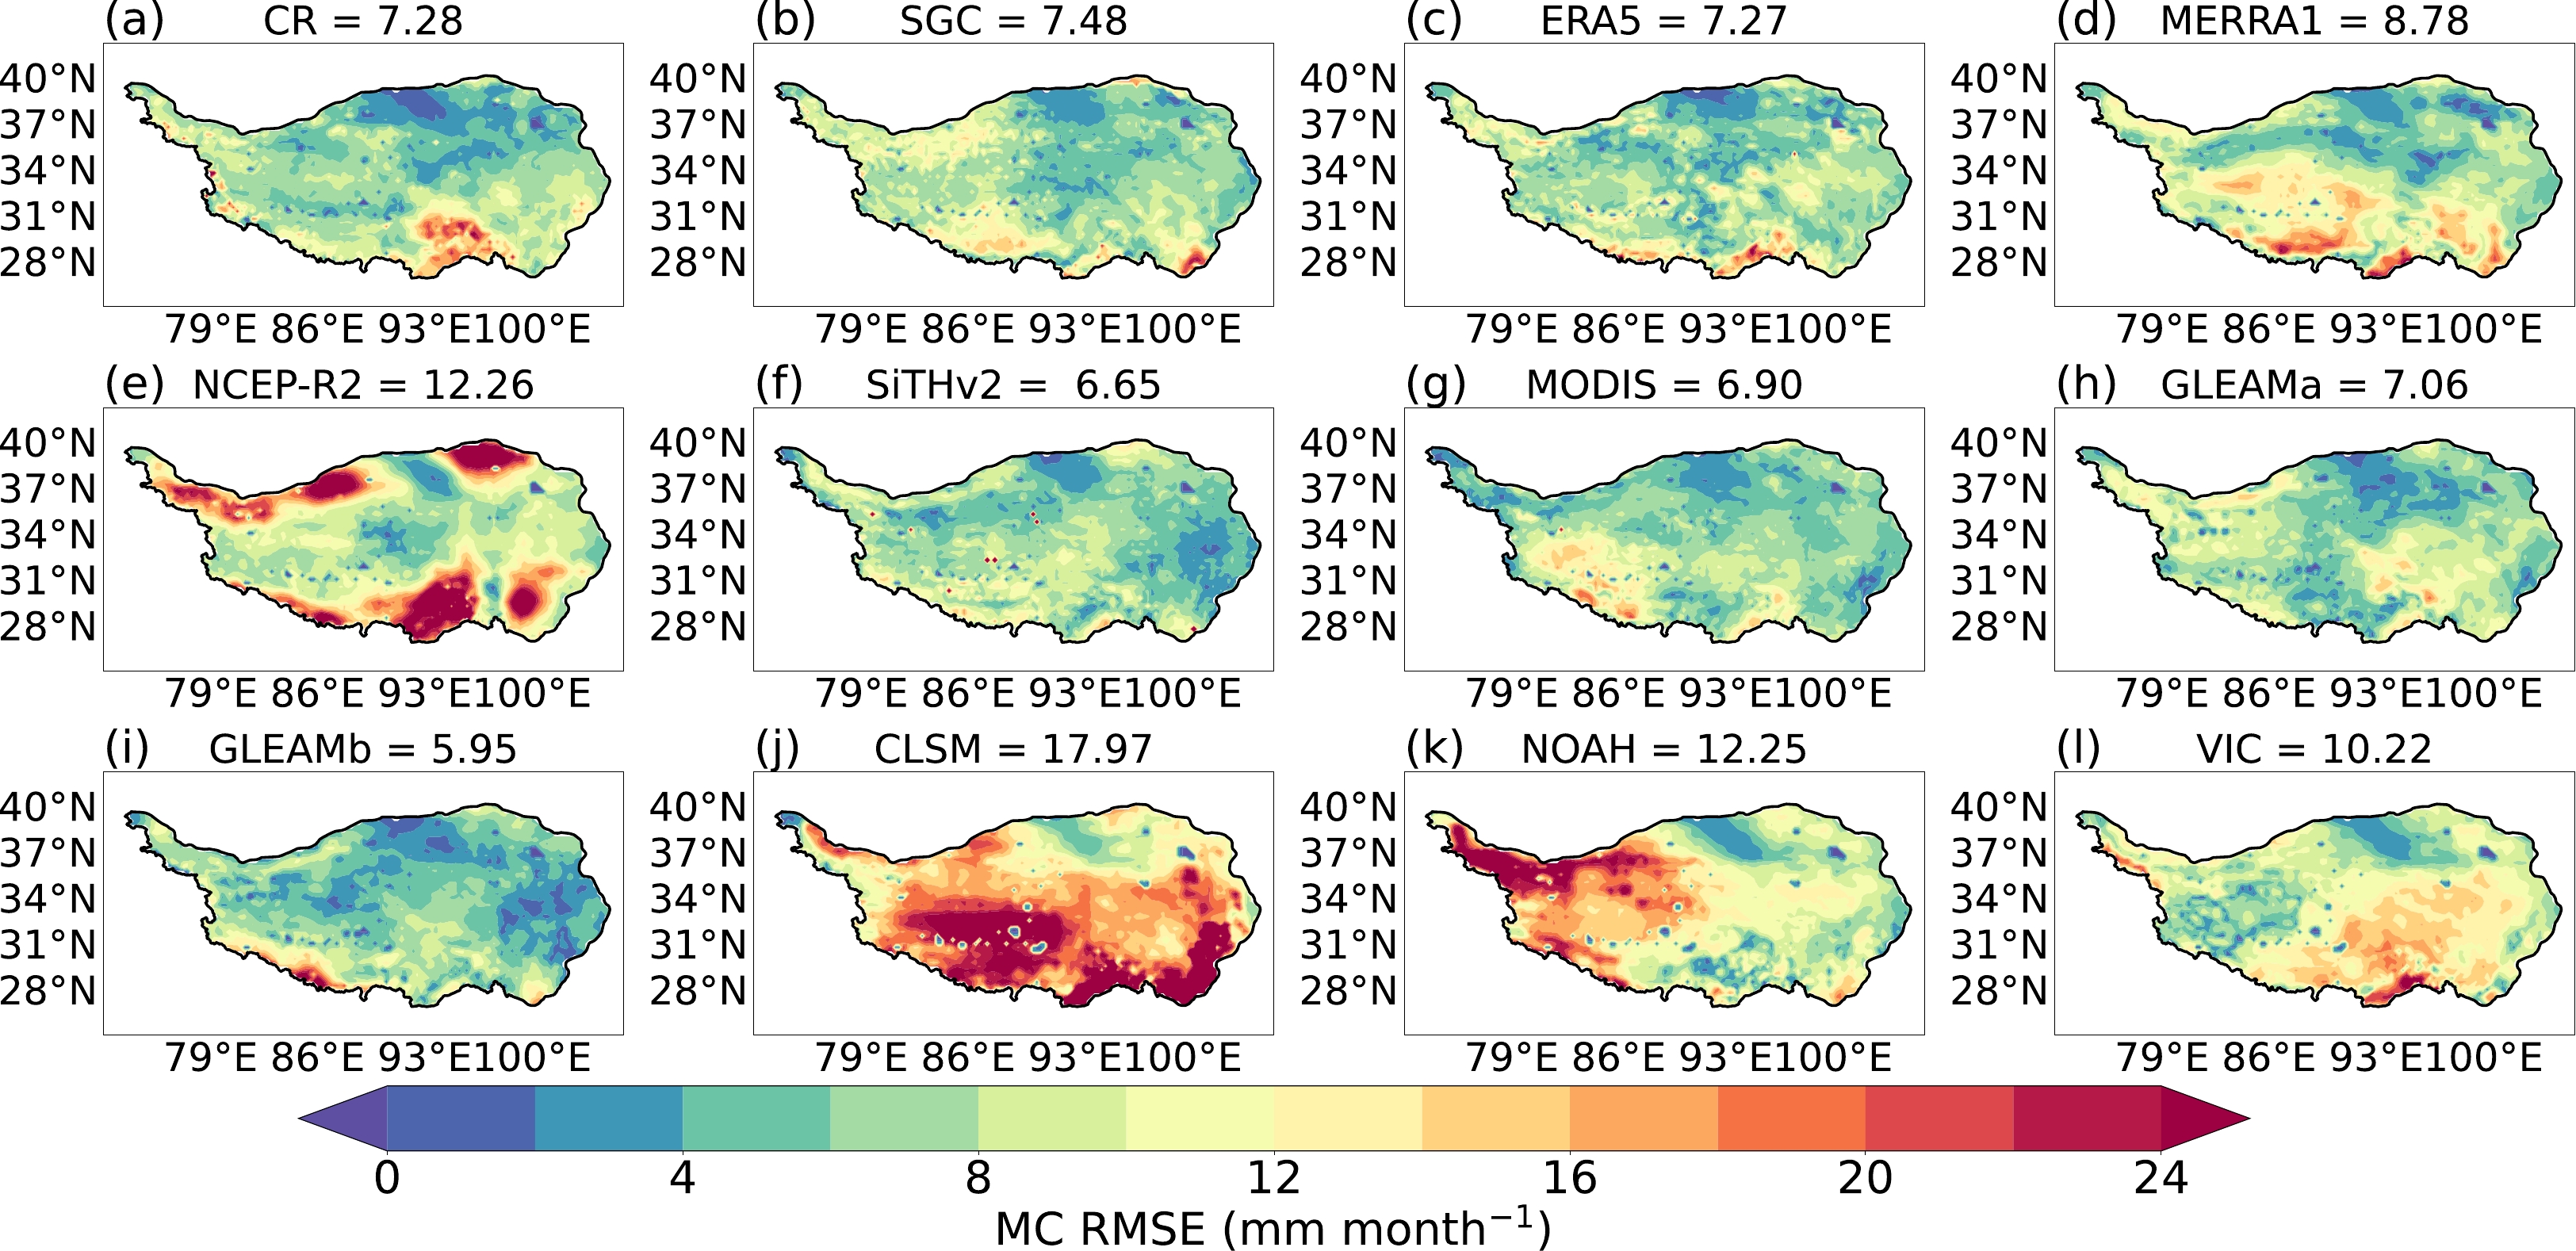
The spatial pattern of the random error variance varied among different ET products (Figs. 2a–l). ET uncertainties quantified via the MC method are lower in RS-based ET products (5.95 vs. 7.06 mm month–1) than those of LSM ET products (10.22 vs. 17.97 mm month–1) and reanalysis ET estimates (7.27 vs. 12.26 mm month–1). In the RS group, SiTHv2, MODIS, GLEAM3.6a and GLEAM3.6b have smaller RMSEs of 6.65, 6.90, 7.06, and 5.95 mm month–1, respectively. Remote sensing algorithms have been recognized as a feasible way to improve regional scale ET estimation through their ability to provide important information over vegetated surfaces and surface biophysical variables affecting ET. The MODIS product from polar-orbiting satellites provides temporally and spatially continuous unparalleled information of vegetation and surface energy, which can be used for regional ET estimates (Los et al., 2000). The MODIS product performs well in some arid and semiarid regions, such as the western and middle part of the TP, which is similar to the conclusions of Figs. 2g and 3g (Jia et al., 2022). The SiTHv2 adds the impact of groundwater in the root zone under soil moisture conditions and an irrigation water strategy in the croplands zone, which was fed with remote sensing data (Zhang et al., 2022). The GLEAM product is derived from the Priestley-Taylor equations and different underlying surfaces, using remote sensing data as input (Martens et al., 2017). The GLEAM product performs well in most of China in evaluating the impact of potential evapotranspiration and the constraint of soil moisture on ET (Jia et al., 2022). Due to the complex topography and arid and semiarid regions in the western and middle parts of the TP, the GLEAM product has suitable properties. Compared with GLEAM3.6a, GLEAM3.6b uses all remote sensing data to replace reanalysis data for driving its output. Overall, the GLEAM3.6b (5.95 mm month–1) product is superior to the other products.
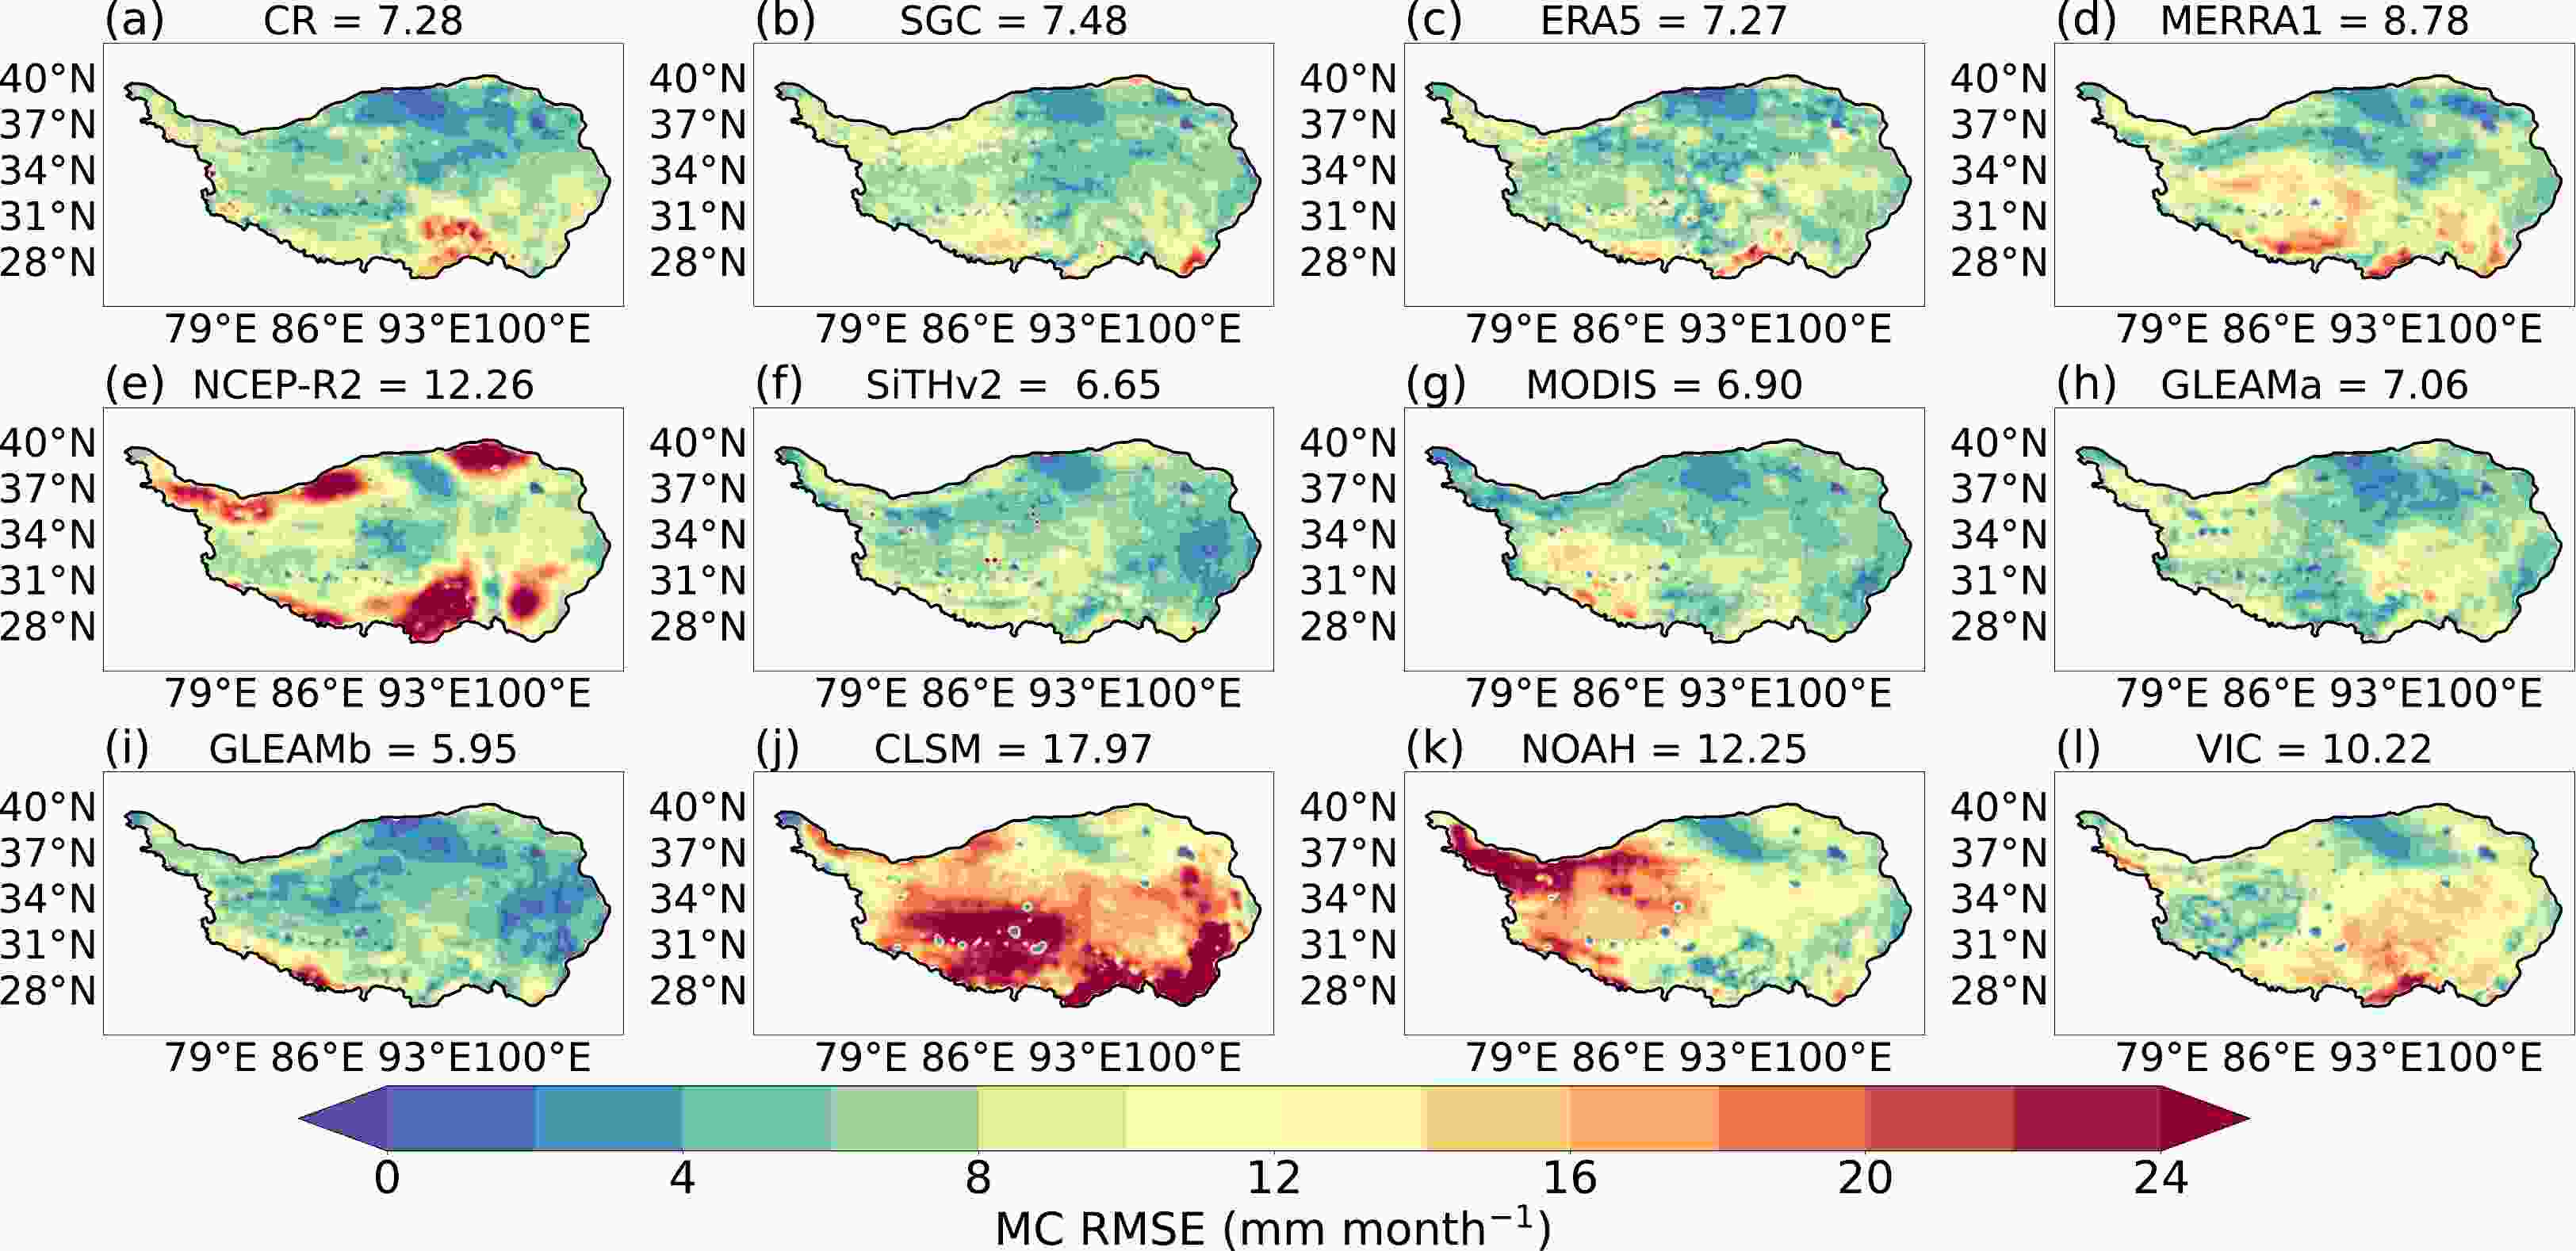
Figure 2. Spatial distribution of MC RMSE of multisource ET products over the TP. Panels (a)–(e) represent reanalysis products, which are CR, SGC, ERA5, MERRA1, and NCEP-R2, respectively. Panels (f)–(i) represent RS-based products, which are SiTHv2, MODIS, GLEAMa, and GLEAMb, respectively. Panels (j)–(l) represent LSM-based products, which are CLSM, NOAH, and VIC, respectively.
The spatial difference in the error variance is clearly identified over the TP. Based on Table 3 and the spatial distribution of the annual average ET in Figs. 7b–m, the error is smaller for areas with lower ET (arid and semiarid regions), while the error is larger for areas with higher ET (humid and semihumid regions). Note that the TP is mainly divided into four climate zones by rainfall amount, including the humid region, semihumid region, semiarid region, and arid region. The GLEAM error distribution is small in the north and large in the south. In general, the spatial distribution of the random error variance among different ET products indicates that these patterns are influenced by forcing datasets and climatological parameterization. The large error of the GLEAM product in the southern TP is due to the complex terrain, which makes it difficult to obtain an accurate vegetation optical depth. Some studies have shown that the surface elevation changes rapidly at the boundaries of the TP, especially along the southern boundary (Zhong et al., 2011). Therefore, the MC method can intuitively reflect the impact of topographic changes on ET products, while the traditional evaluation method (validation against flux tower observations) cannot verify the multisource ET products across the entirety of the area. In other words, the MC method can help to further reduce the ET uncertainty.
Humid Arid Semihumid Semiarid TP CR 12.51 6.14 9.36 6.37 7.28 SGC 9.84 7.34 7.71 7.02 7.48 ERA5 11.01 6.41 7.57 7.47 7.27 MERRA1 11.88 7.49 9.74 9.28 8.78 NCEP_R2 17.70 12.57 14.57 9.13 12.26 SiTHv2 7.52 6.49 5.30 7.59 6.65 MODIS 8.15 6.33 6.20 7.90 6.90 GLEAM3.6a 8.01 6.79 7.76 6.79 7.06 GLEAM3.6b 7.33 5.43 4.94 7.06 5.95 CLSM 33.09 13.69 20.32 19.13 17.97 NOAH 9.28 14.90 8.55 11.64 12.25 VIC 13.51 7.70 12.74 11.34 10.22 Table 3. The RMSEs of individual ET products using the MC in different climate zones. (units: mm month–1).

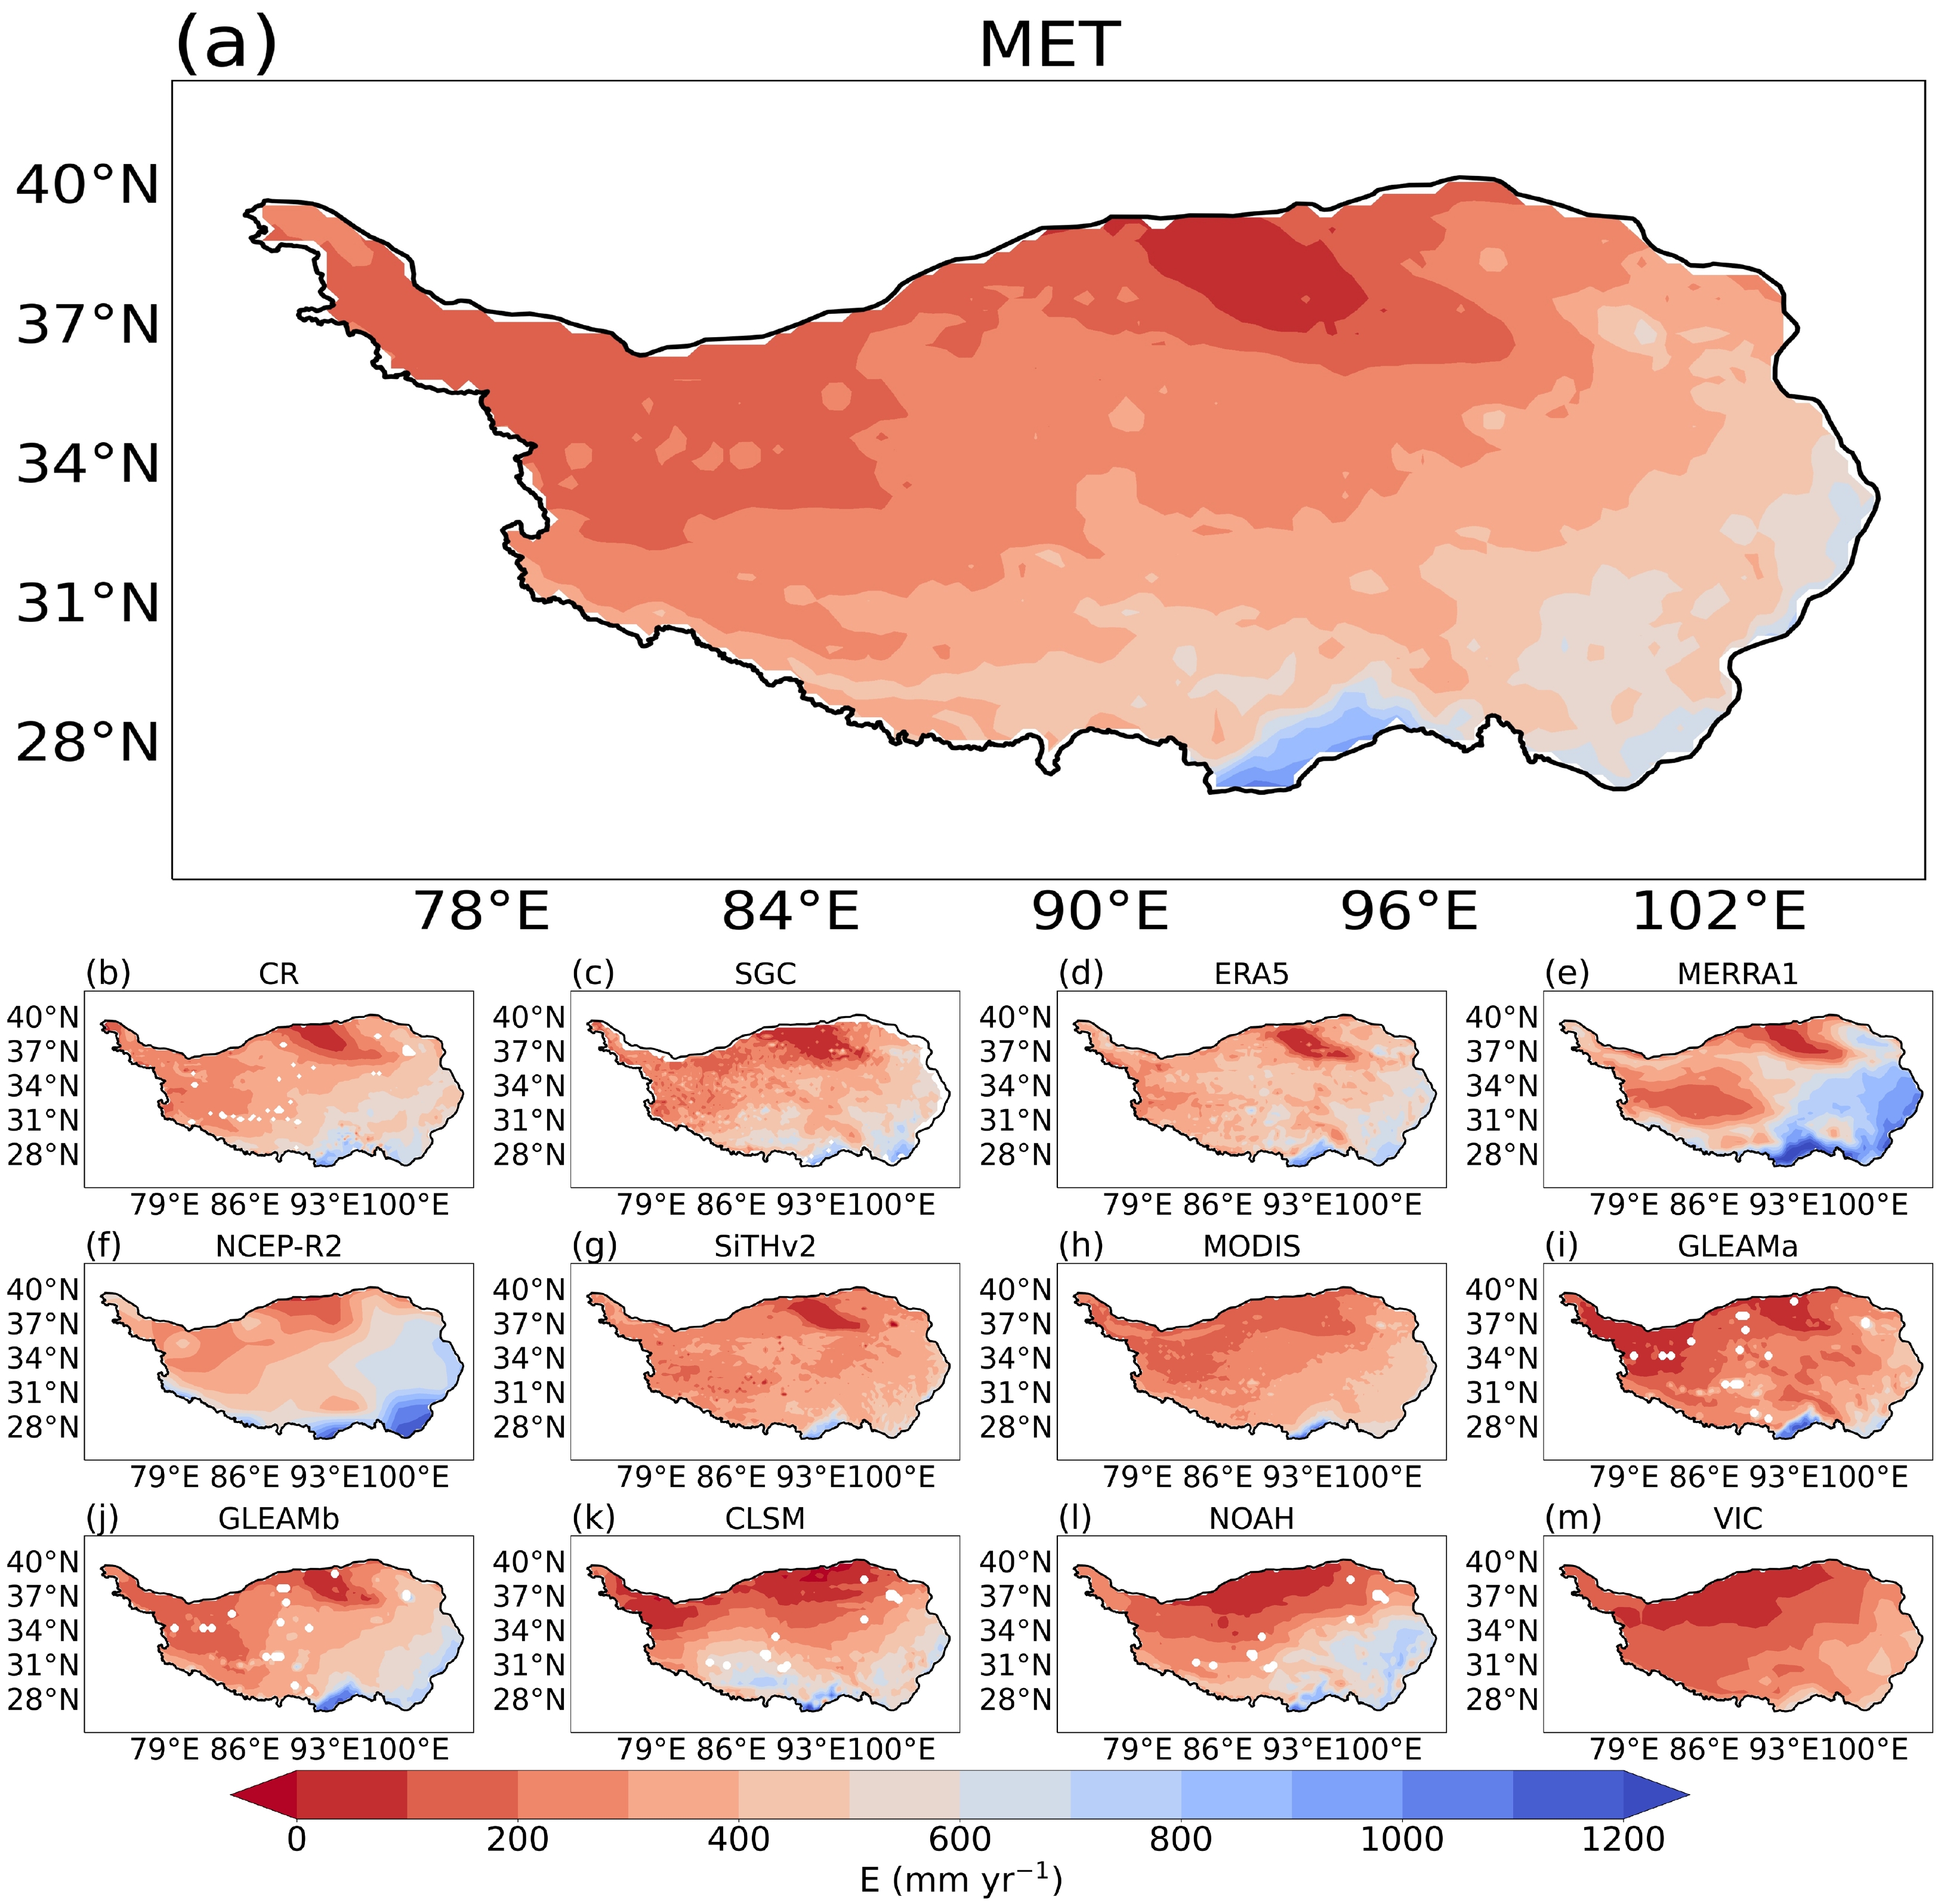
Figure 7. Spatial distribution of annual average evapotranspiration from multisource ET products and merged ET products (MET) from 2005 to 2015 (units: mm yr–1). Panel (a) represents the merged product. Panels (b)–(f) represent reanalysis products, which are CR, SGC, ERA5, MERRA1, and NCEP-R2, respectively. Panels (g)–(j) represent RS-based products, which are SiTHv2, MODIS, GLEAMa, and GLEAMb, respectively. Panels (k)–(m) represent LSM-based products, which are CLSM, NOAH, and VIC, respectively.
-
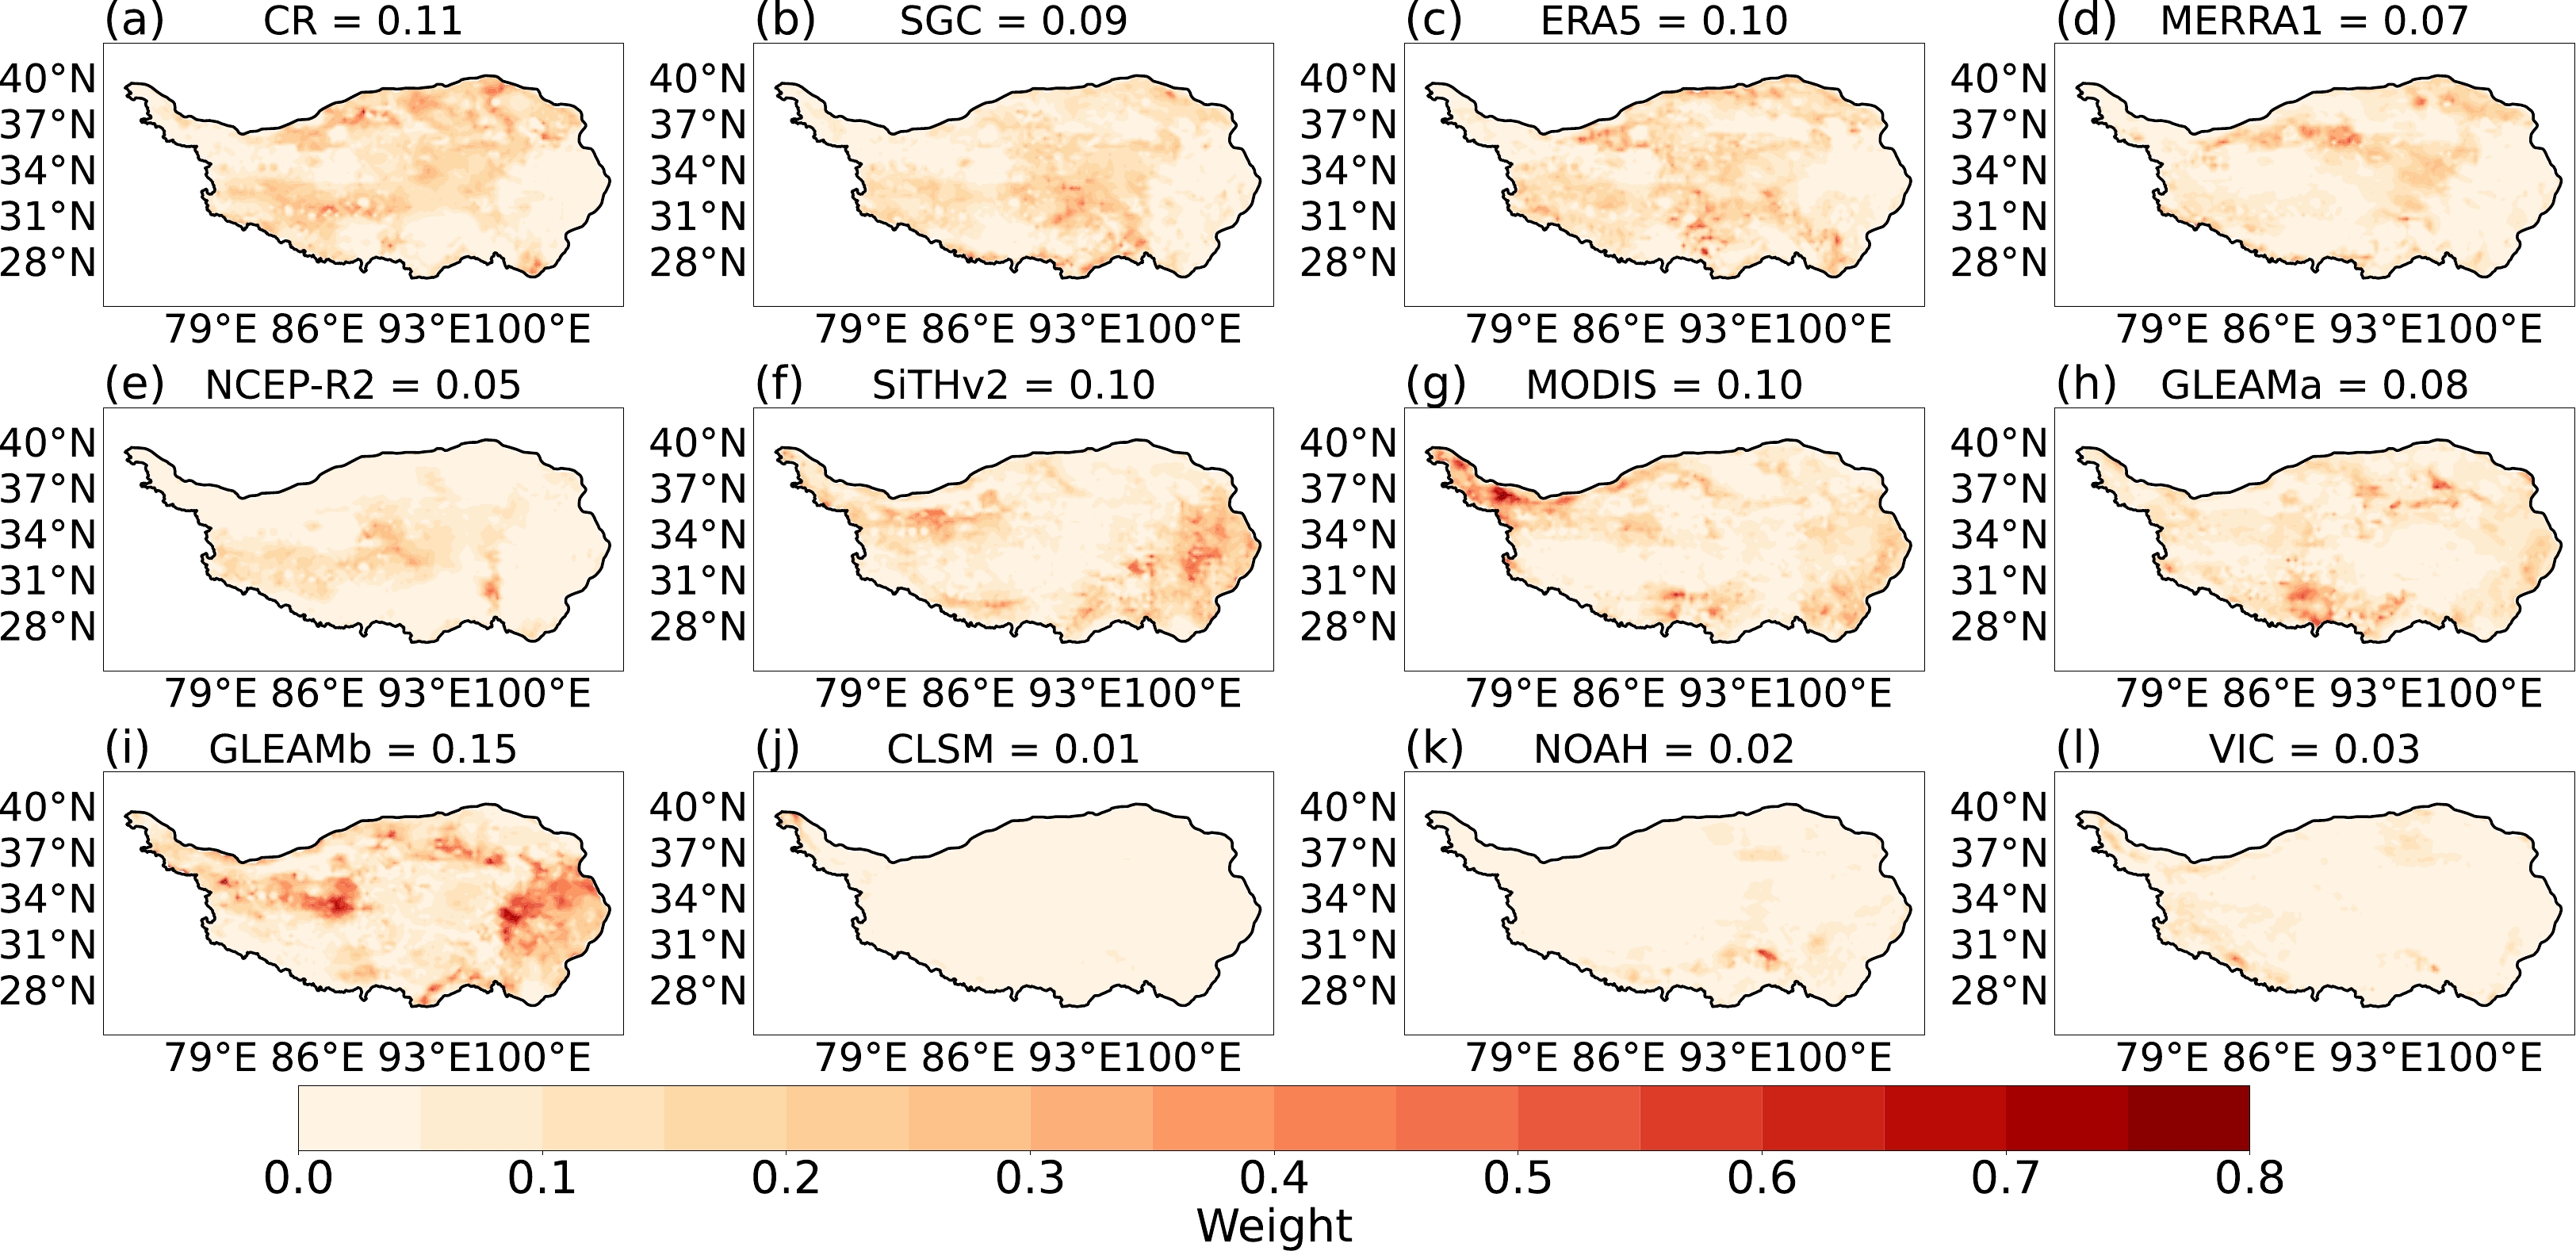
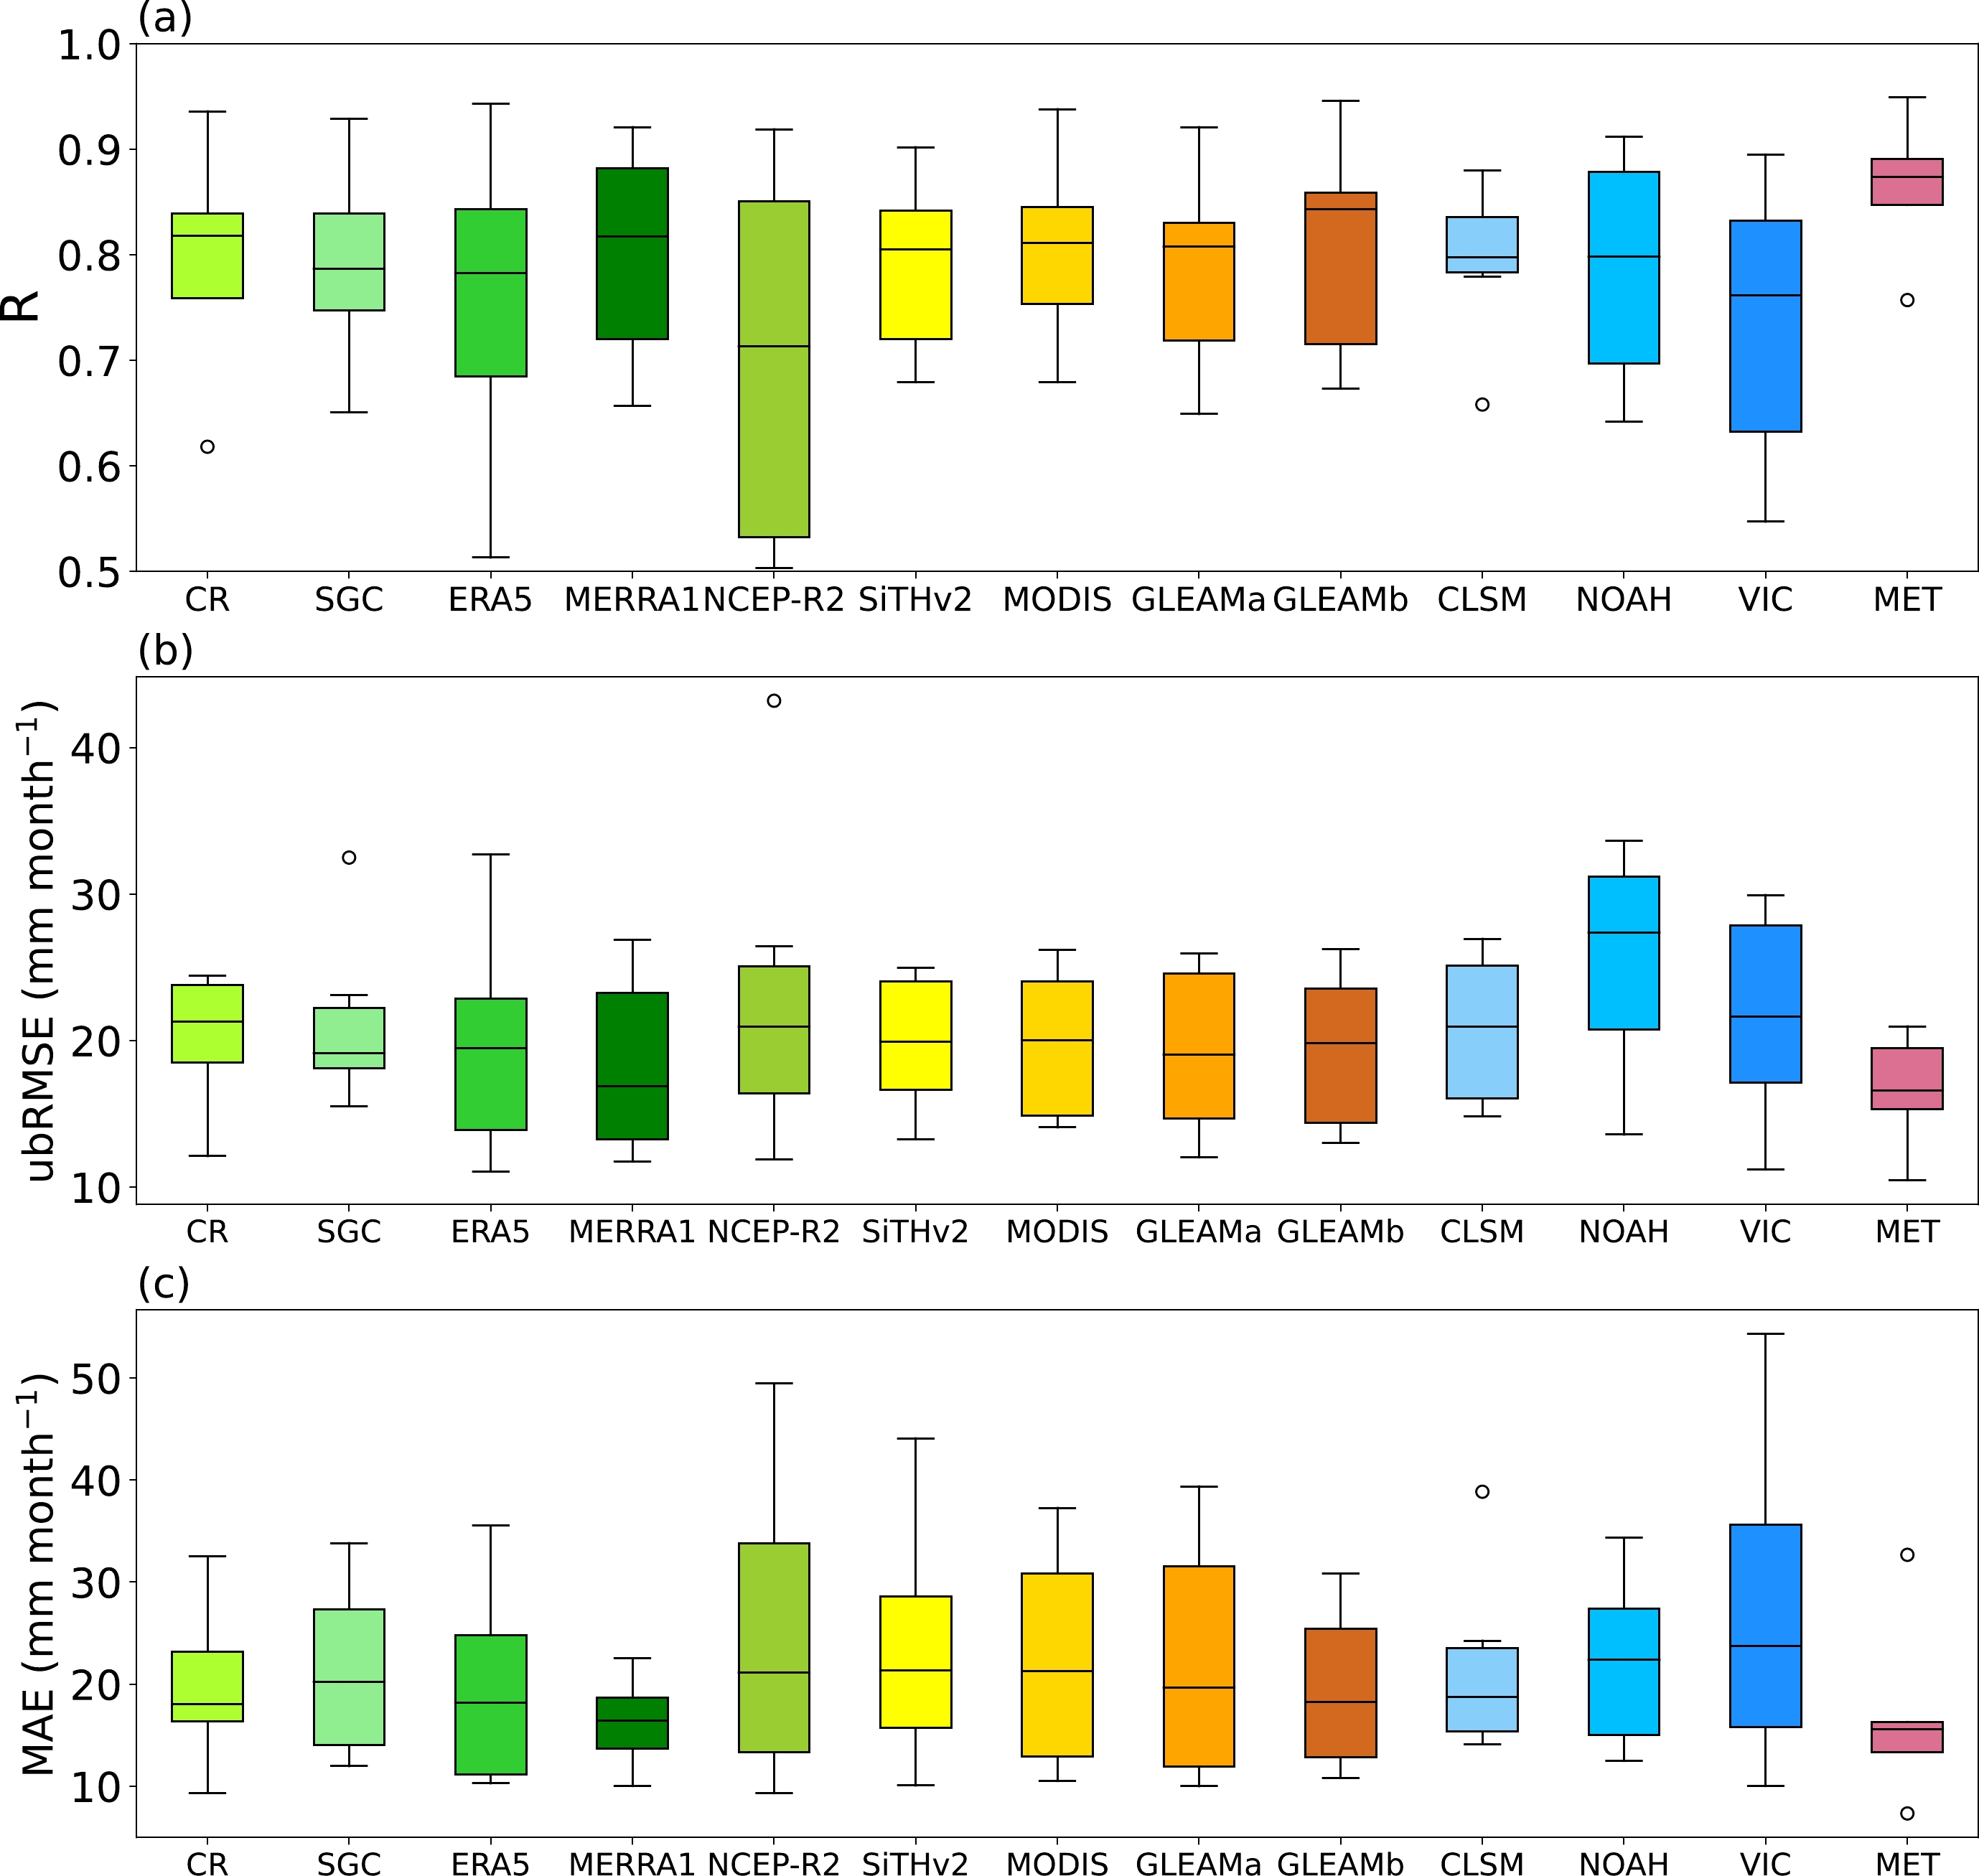
The spatial distributions of weight for individual ET products in Figs. 3a–l are a reaffirmation of the MC RMSE results. Data fusion can usually be expressed as a linear combination of various ET datasets, and the key is to determine the weight coefficient of each dataset. Based on Eqs. (4) and (9), the weight of a product is inversely proportional to its error (Pan et al., 2012; Yilmaz et al., 2012). Overall, the general idea of the MC method is that individual ET products with smaller errors are given more weight, and products with larger errors are given less weight. To assess the accuracy of both the individual products and the merged product, the ET estimates are compared with the in situ measurements. As Figs. 4a–c demonstrate, the MET product has the highest median R-value (0.87) and lowest median ubRMSE (16.60 mm month–1) and MAE (15.58 mm month–1), which outperforms any individual products. It is effective to improve accuracy to merge multisource ET products.
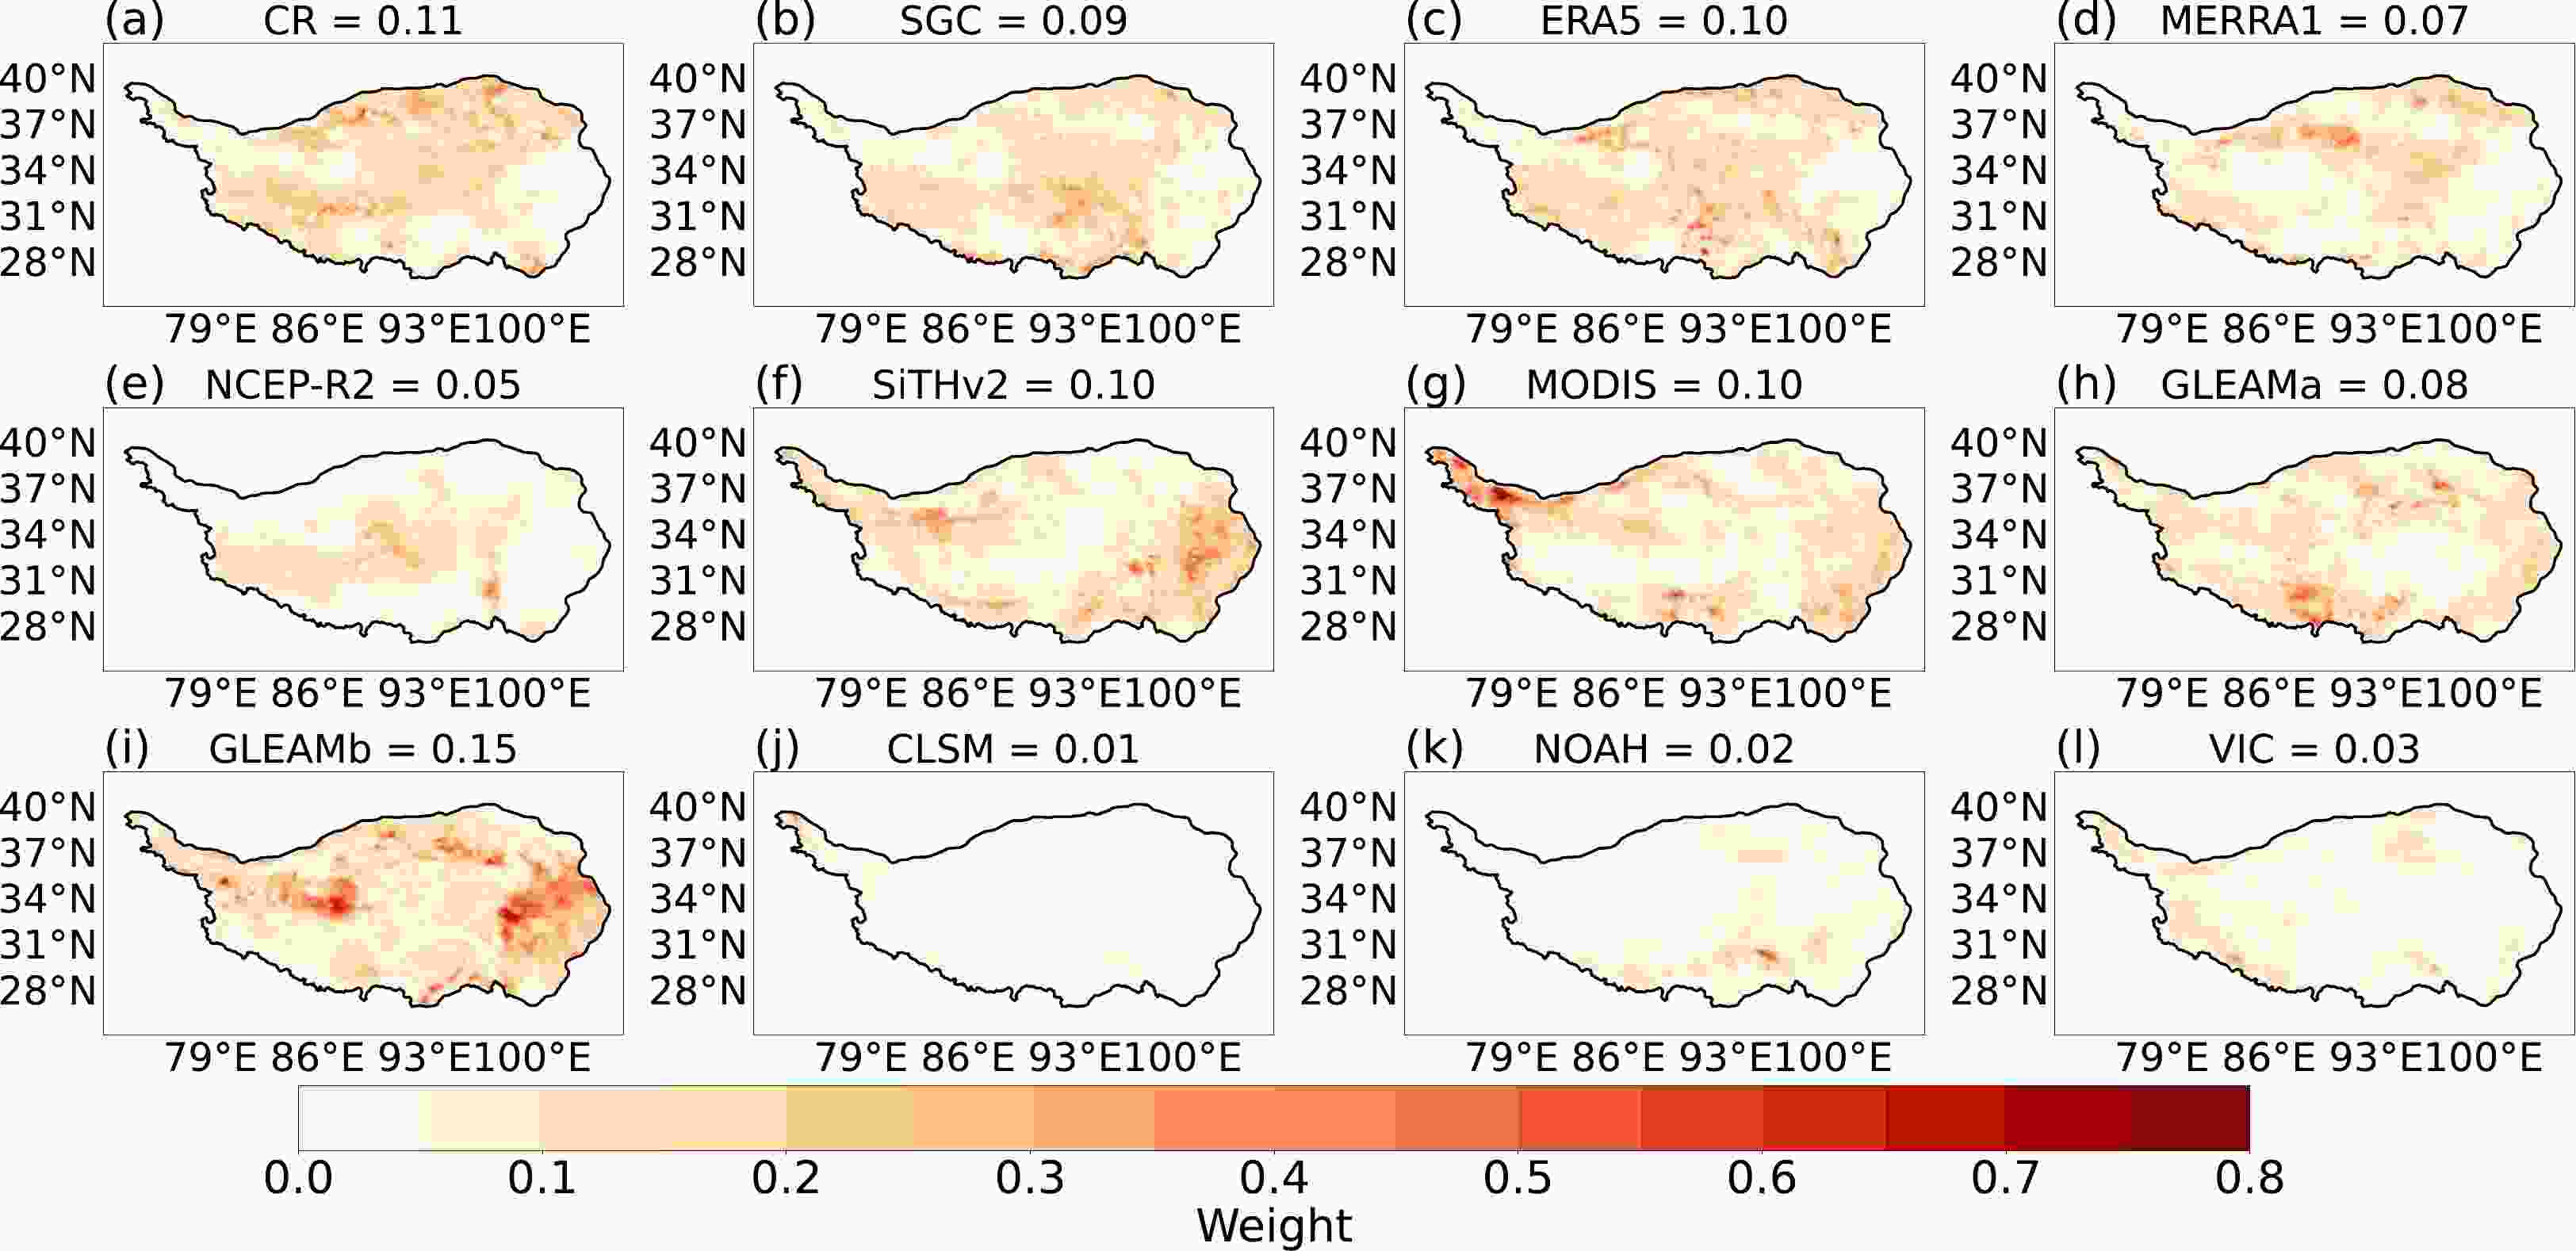
Figure 3. Spatial distribution of merging weight for the individual ET products over the TP. Panels (a)–(e) represent reanalysis products, which are CR, SGC, ERA5, MERRA1, and NCEP-R2, respectively. Panels (f)–(i) represent RS-based products, which are SiTHv2, MODIS, GLEAMa, and GLEAMb, respectively. Panels (j)–(l) represent LSM-based products, which are CLSM, NOAH, and VIC, respectively.

Figure 4. The evaluation of ET datasets based on in situ measurements: (a) R, (b) ubRMSE (mm month–1), and (c) MAE (mm month–1).
-
The multiyear monthly average and seasonal average of all ET products both show a single peak, which appears in July and summer, respectively (Figs. 5a, b). Seasonal ET cycles are highly related to periodic variations in radiative energy. In most cases, ET products within the same category (i.e., reanalysis, LSM, or RS) are similar in magnitude but vary significantly among different categories. The reanalysis ET products are significantly higher than those based on remote sensing and land surface models, which can also be identified in the spatial distribution of annual average ET (Figs. 7b–m).
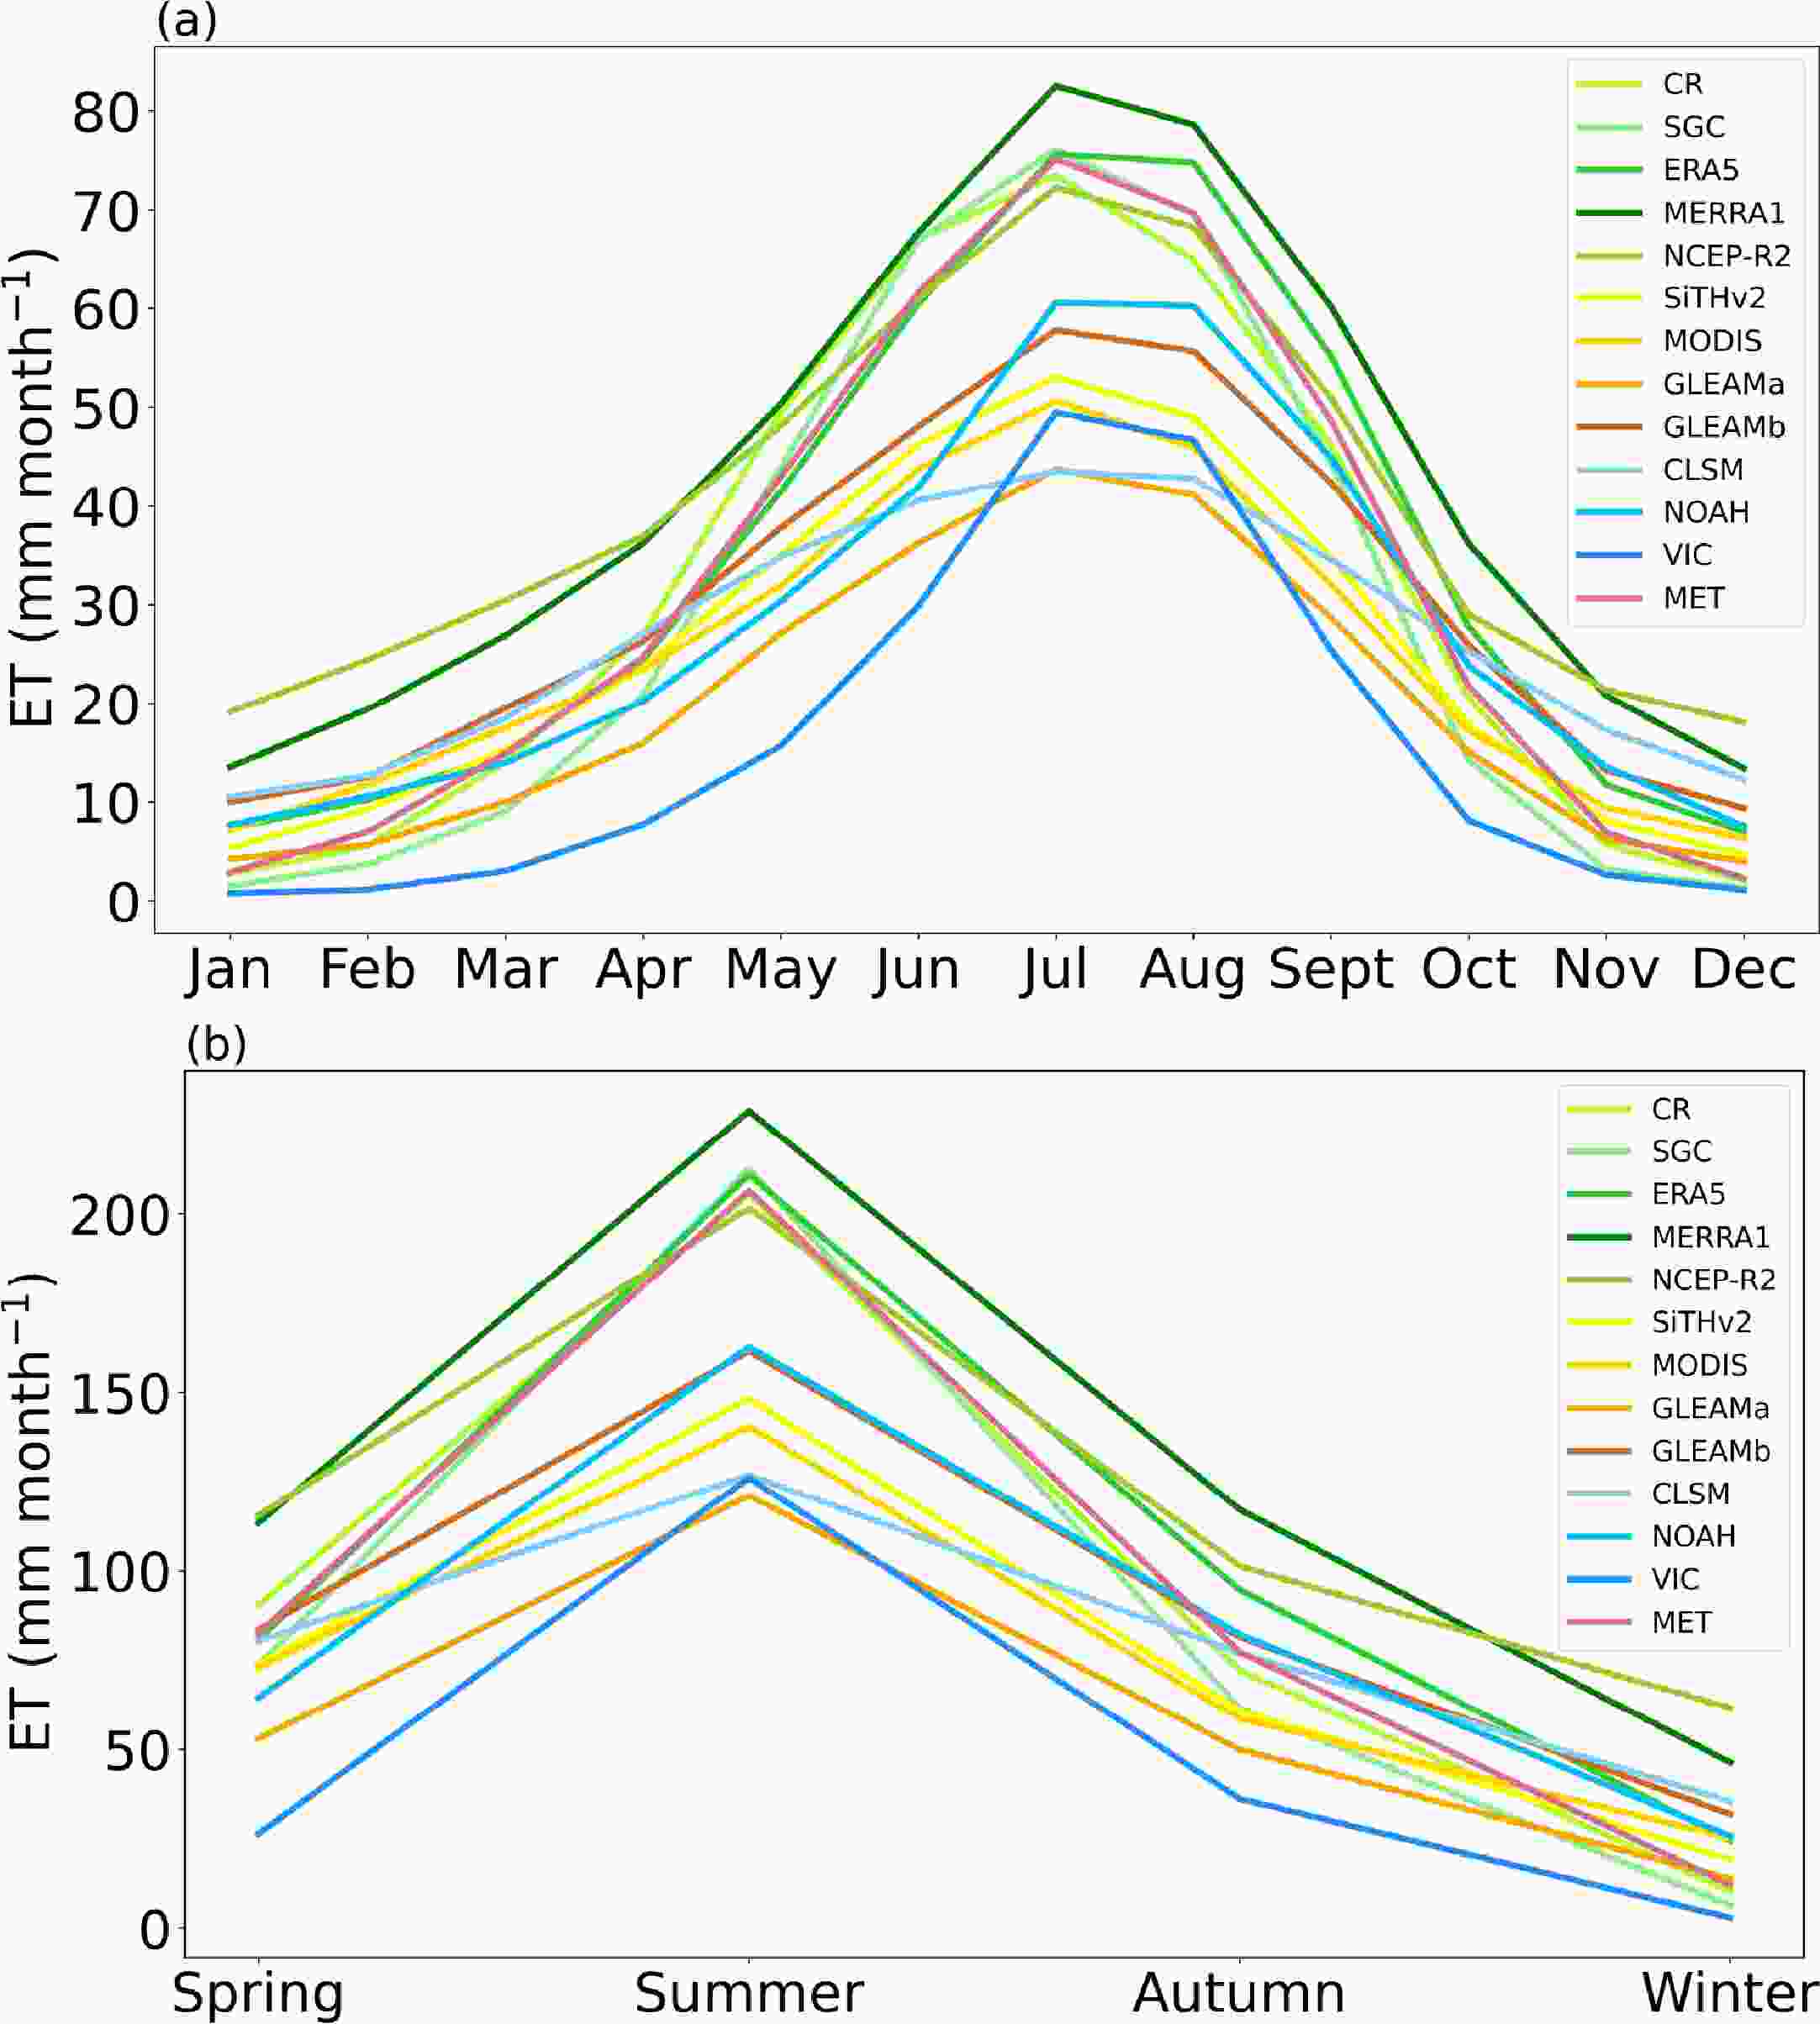
Figure 5. (a) Monthly and (b) mean seasonal time series of various evapotranspiration products for the period from January 2005−December 2015.
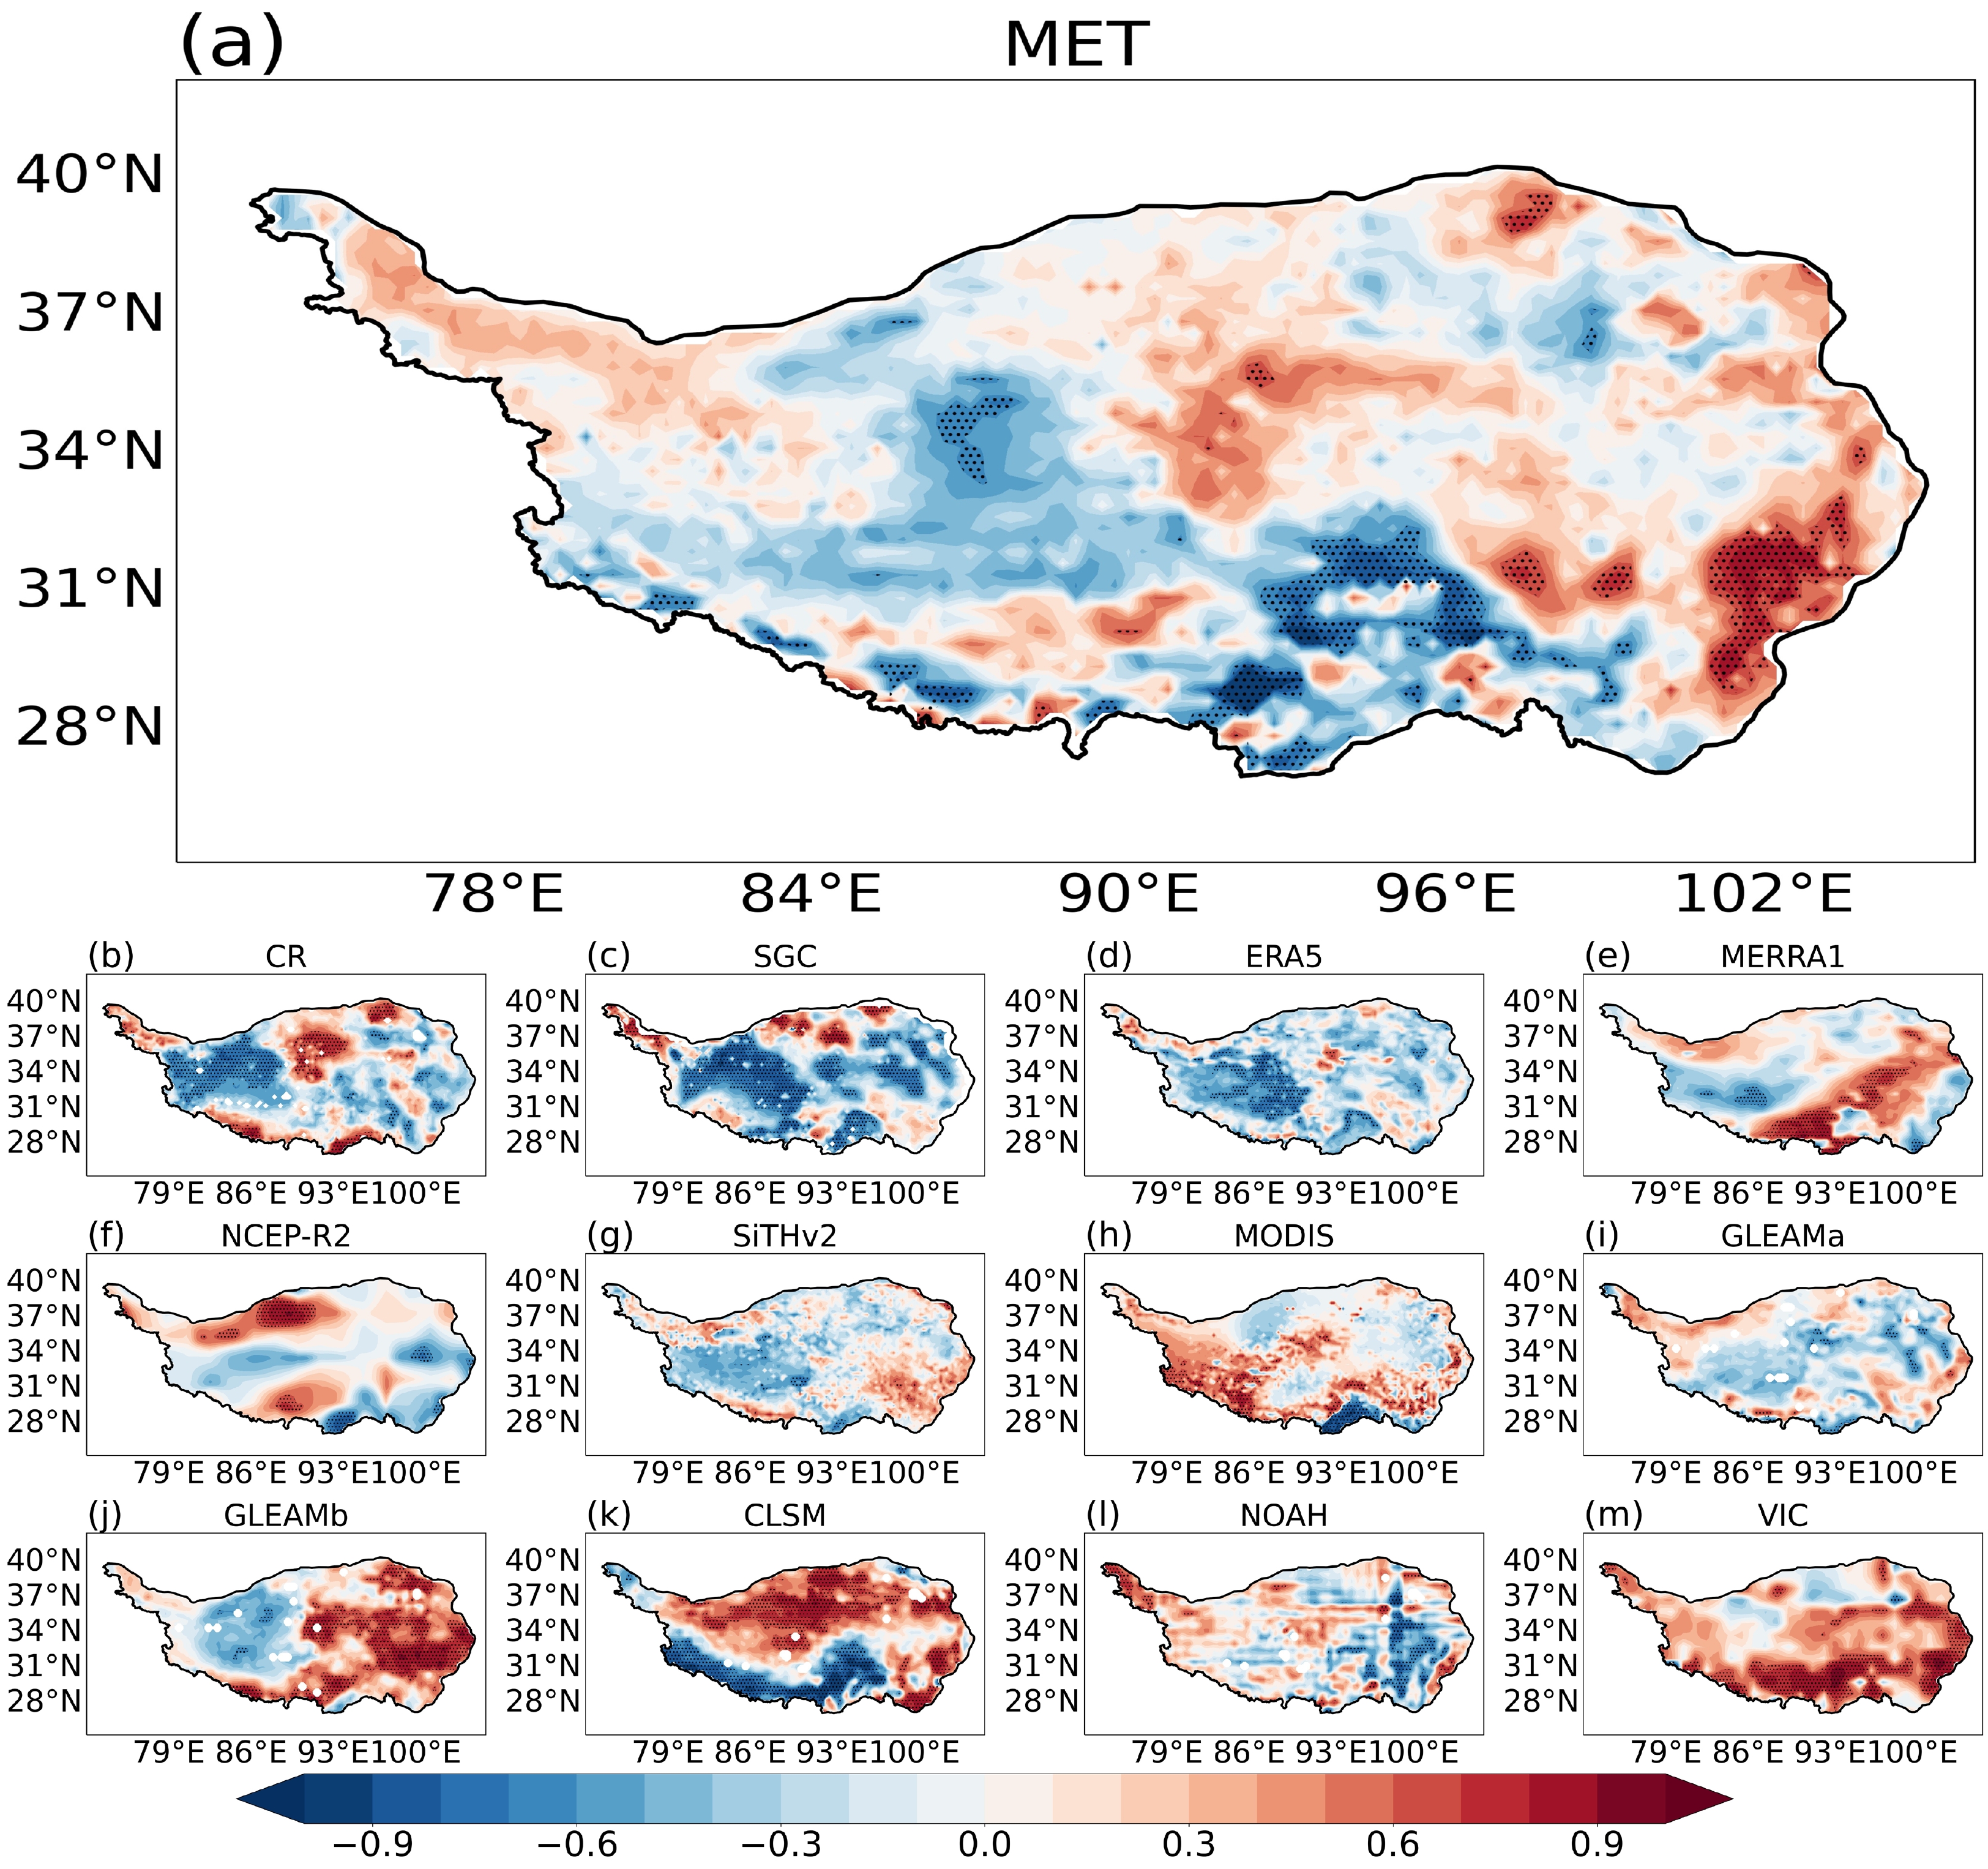
Almost all ET products display significant increasing trends during 2005–15, except for CR, SGC, MERRA1, ERA5, and CLSM (Figs. 6a–m). For MET (Fig. 6a), ET increases in the northern TP, southeastern TP, and northwestern TP, with the remaining areas experiencing ET decreases. Overall, it shows an increasing trend of 1.59 ± 0.85 mm yr–1 over the TP during 2005–15 (Table 4). The statistical results demonstrate that the annual MET product shows increases by over 66.28% of the TP territory while decreasing trends dominate 33.72% of the TP territory. The increasing trends pass the t-test (p<0.05) in most parts of the TP areas. Global warming may accelerate the hydrological cycle allowing water from melting glaciers and permafrost from the TP to increase ET (Jia et al., 2022). Since the 1980s, long-term satellite observations show an obvious greening of the TP, noting that greening enhances transpiration (Zhong et al., 2010, 2019; Piao et al., 2020). Although the ET of NCEP_R2, SiTHv2, MODIS, NOAH, and VIC also show general increases, their spatial distribution patterns are different from that of MET. This is due to the differences in meteorological forcing data, structural complexity, and parameterization among the various ET products.
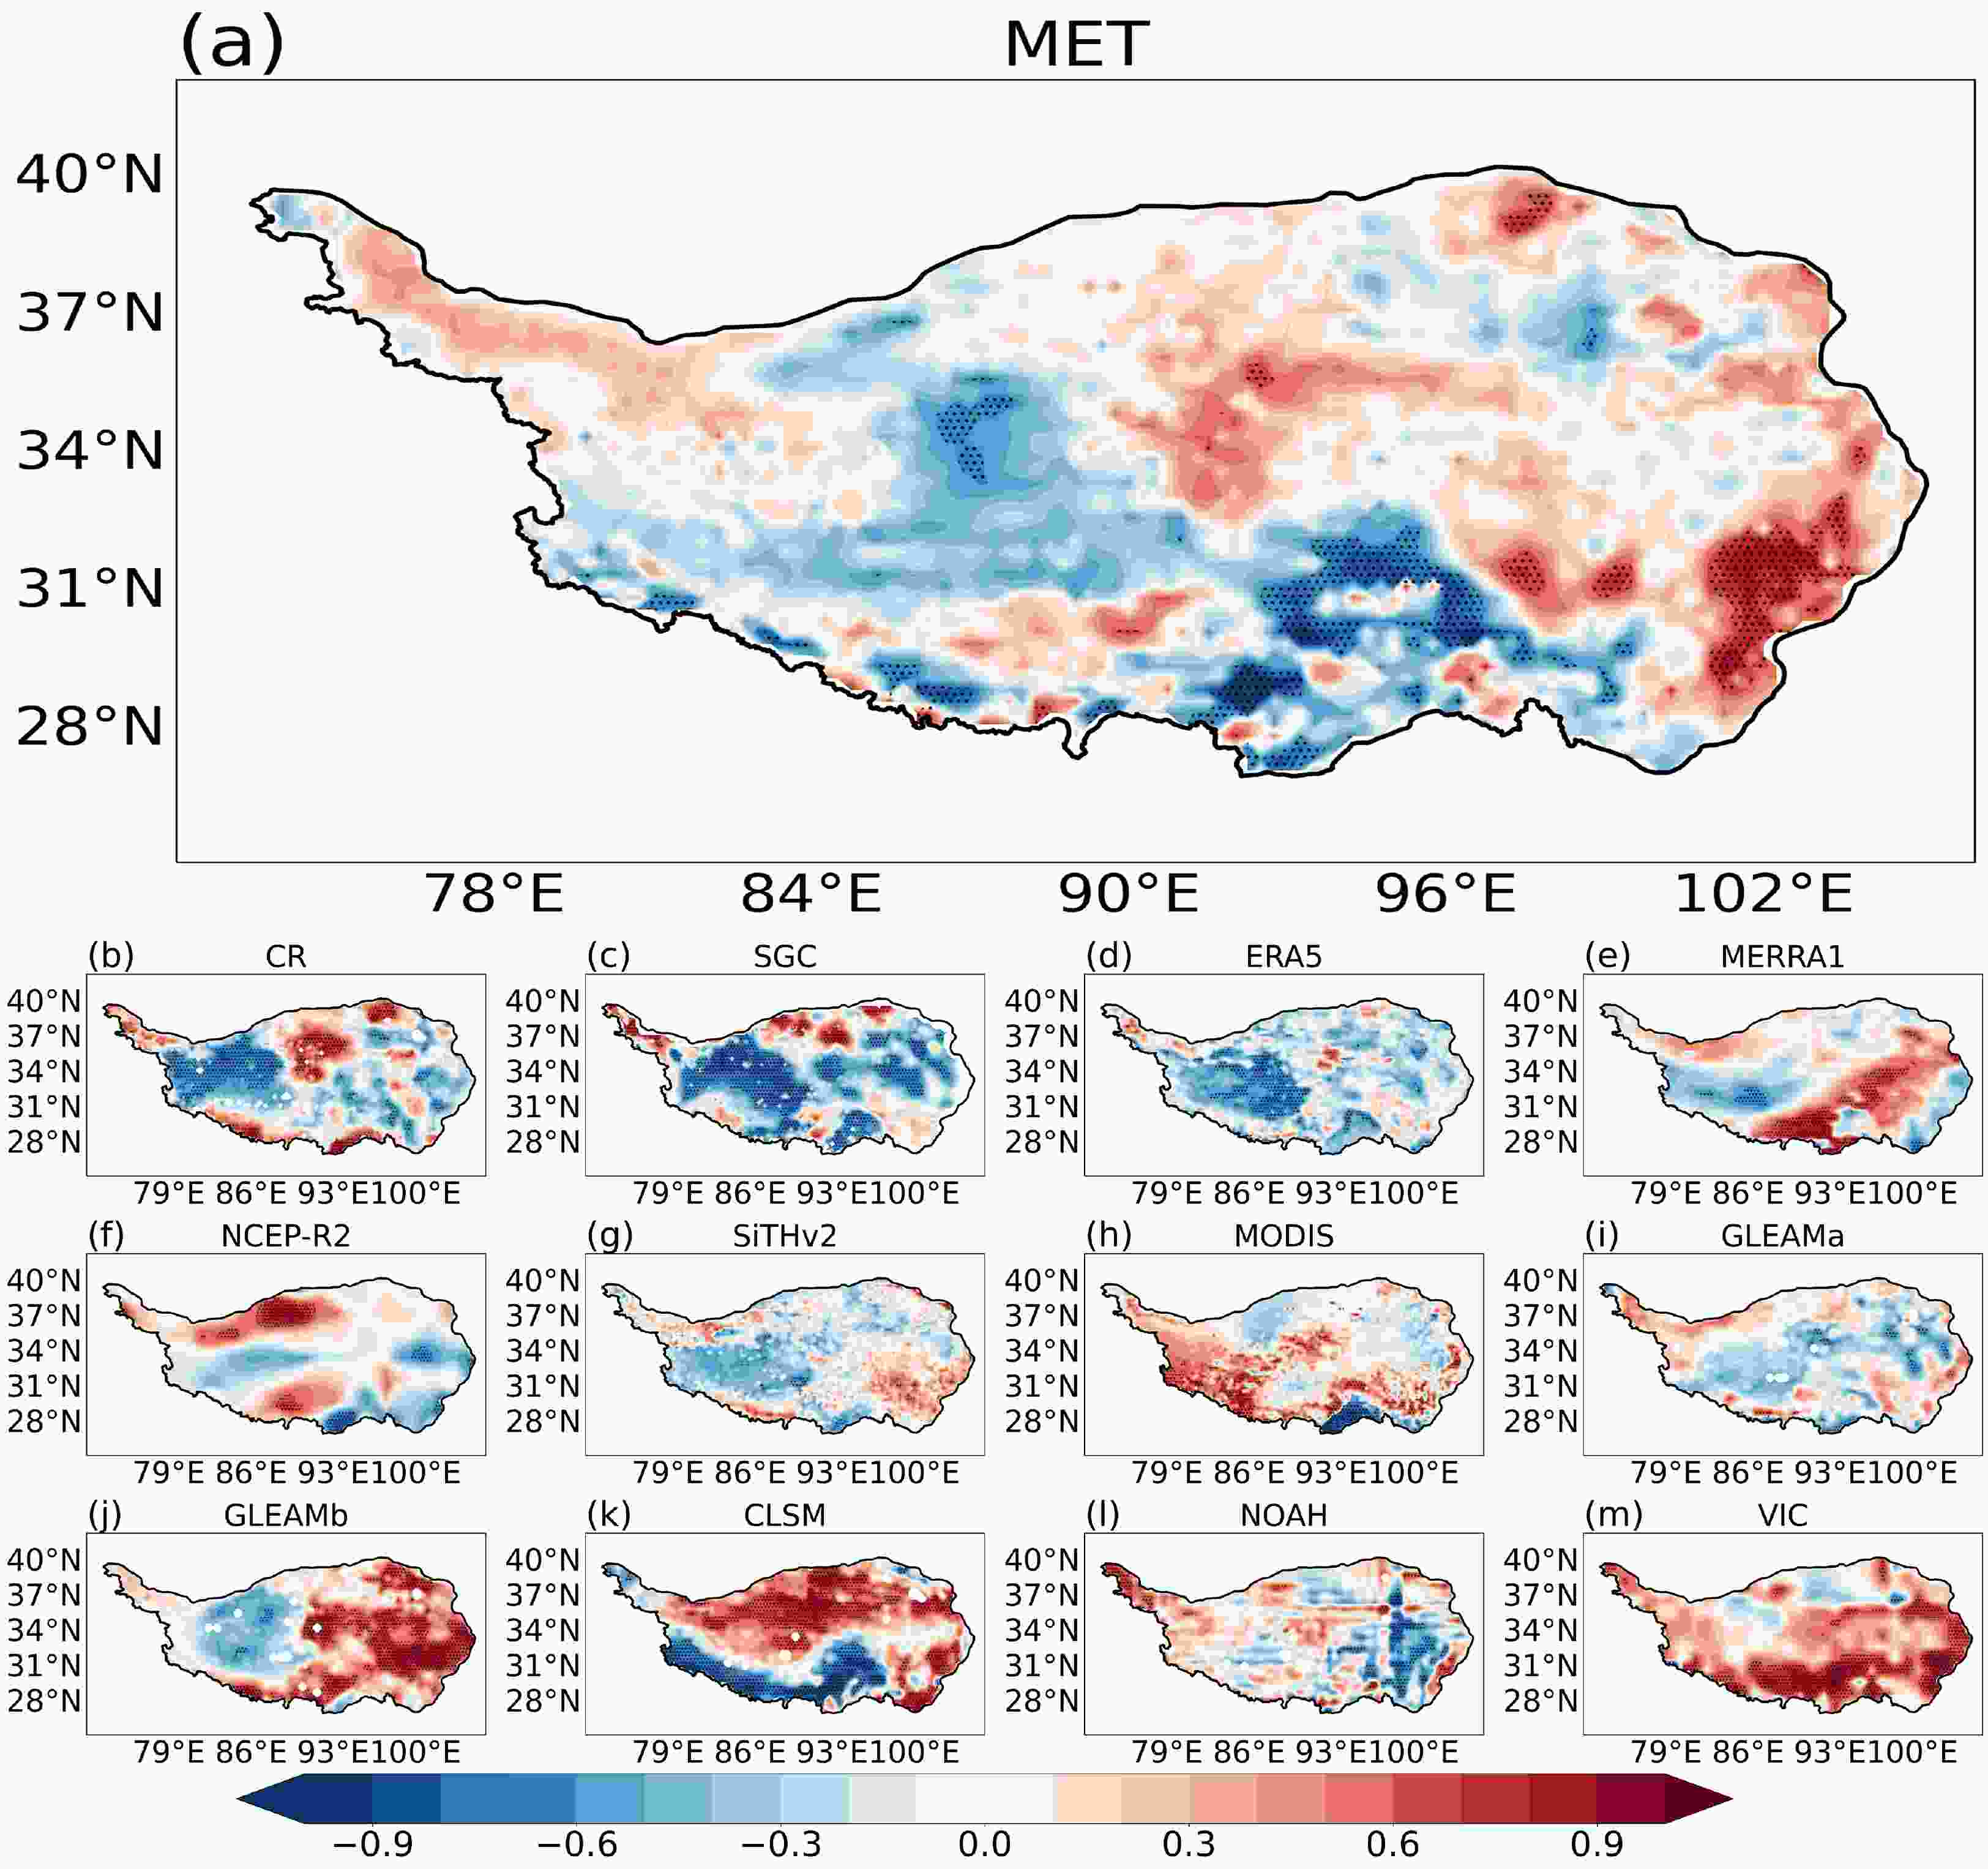
Figure 6. Spatial distribution of trend correlation coefficients of multisource evapotranspiration products and merged evapotranspiration product (MET) over the TP from 2005 to 2015. The stippling denotes statistically significant trends (p<0.05) according to a Student's t-test. Panel (a) represents the merged product. Panels (b)–(f) represent reanalysis products, which are CR, SGC, ERA5, MERRA1, and NCEP-R2, respectively. Panels (g)–(j) represent RS-based products, which are SiTHv2, MODIS, GLEAMa, and GLEAMb, respectively, while (k)–(m) represent LSM-based products, which are CLSM, NOAH, and VIC, respectively.
ET Products Seasonal means (mm) Annual means
(mm)Multi-year trends
(mm yr–1)Spring Summer Autumn Winter CR 90.46 205.50 72.30 10.45 378.71 –0.37 SGC 75.90 213.12 63.95 7.00 359.96 –2.55 ERA5 81.39 209.73 94.78 25.07 410.96 –1.59 MERRA1 113.44 228.87 117.16 46.60 506.07 –1.44 NCEP_R2 116.50 205.02 103.09 61.27 485.87 2.26 SiTHv2 74.13 149.12 61.92 19.17 304.34 1.39 MODIS 72.37 138.53 58.38 25.18 294.45 1.59 GLEAM3.6a 54.37 122.53 51.57 14.56 243.02 1.22 GLEAM3.6b 82.24 160.72 82.05 31.29 356.30 2.81 CLSM 80.72 126.90 76.54 34.97 335.96 –1.99 NOAH 62.81 164.45 83.07 25.63 319.12 4.55 VIC 26.12 127.34 36.62 2.93 193.01 3.40 MET 83.02 207.50 77.79 12.30 380.60 1.59 Table 4. Seasonal/annual means and multi-year trends of different ET products over the TP.
-
There is no significant difference in the spatial pattern of multiyear mean annual ET among individual and merged products, with the annual average ET decreasing from southeast to northwest (Figs. 7a–m). Moreover, higher ET values exist over the humid regions and semihumid regions of the southeast TP, and lower values are over the arid regions and semiarid regions of the northwest TP. In the reanalysis group, the spatial distributions are all complete, except for CR, as its calculation excludes ET from water. In the RS and LSM groups, the blank values are caused by the lack of remotely sensed data. It is obvious that VIC has the lowest estimation over the whole TP, which was also proven by Ma and Szilagyi (2019). In addition, the annual total ET across the whole TP is quantified (Fig. 8 and Table 4). According to MET, the annual averaged ET of the entire TP is 380.60 mm, resulting in the evapotranspiration of about 970.53 × 10¹² kg of water from the surface upon considering the TP to be 2.55 × 10⁶ km2 (the region ≥ 2500 m). The annual ET values of all products in the reanalysis group are generally high, among which MERRA1 is the highest, up to 506.07 mm. In the RS and LSM groups, their values are relatively close, except that VIC has the lowest value of 193.01 mm. In terms of seasonal variation (Table 4), the ET values of the MET product over the TP are 83.02, 207.50, 77.79, and 12.30 mm in spring, summer, autumn, and winter, respectively. The amount of ET is higher in spring and summer and lower in autumn and winter, which is consistent with the seasonal variation in precipitation.
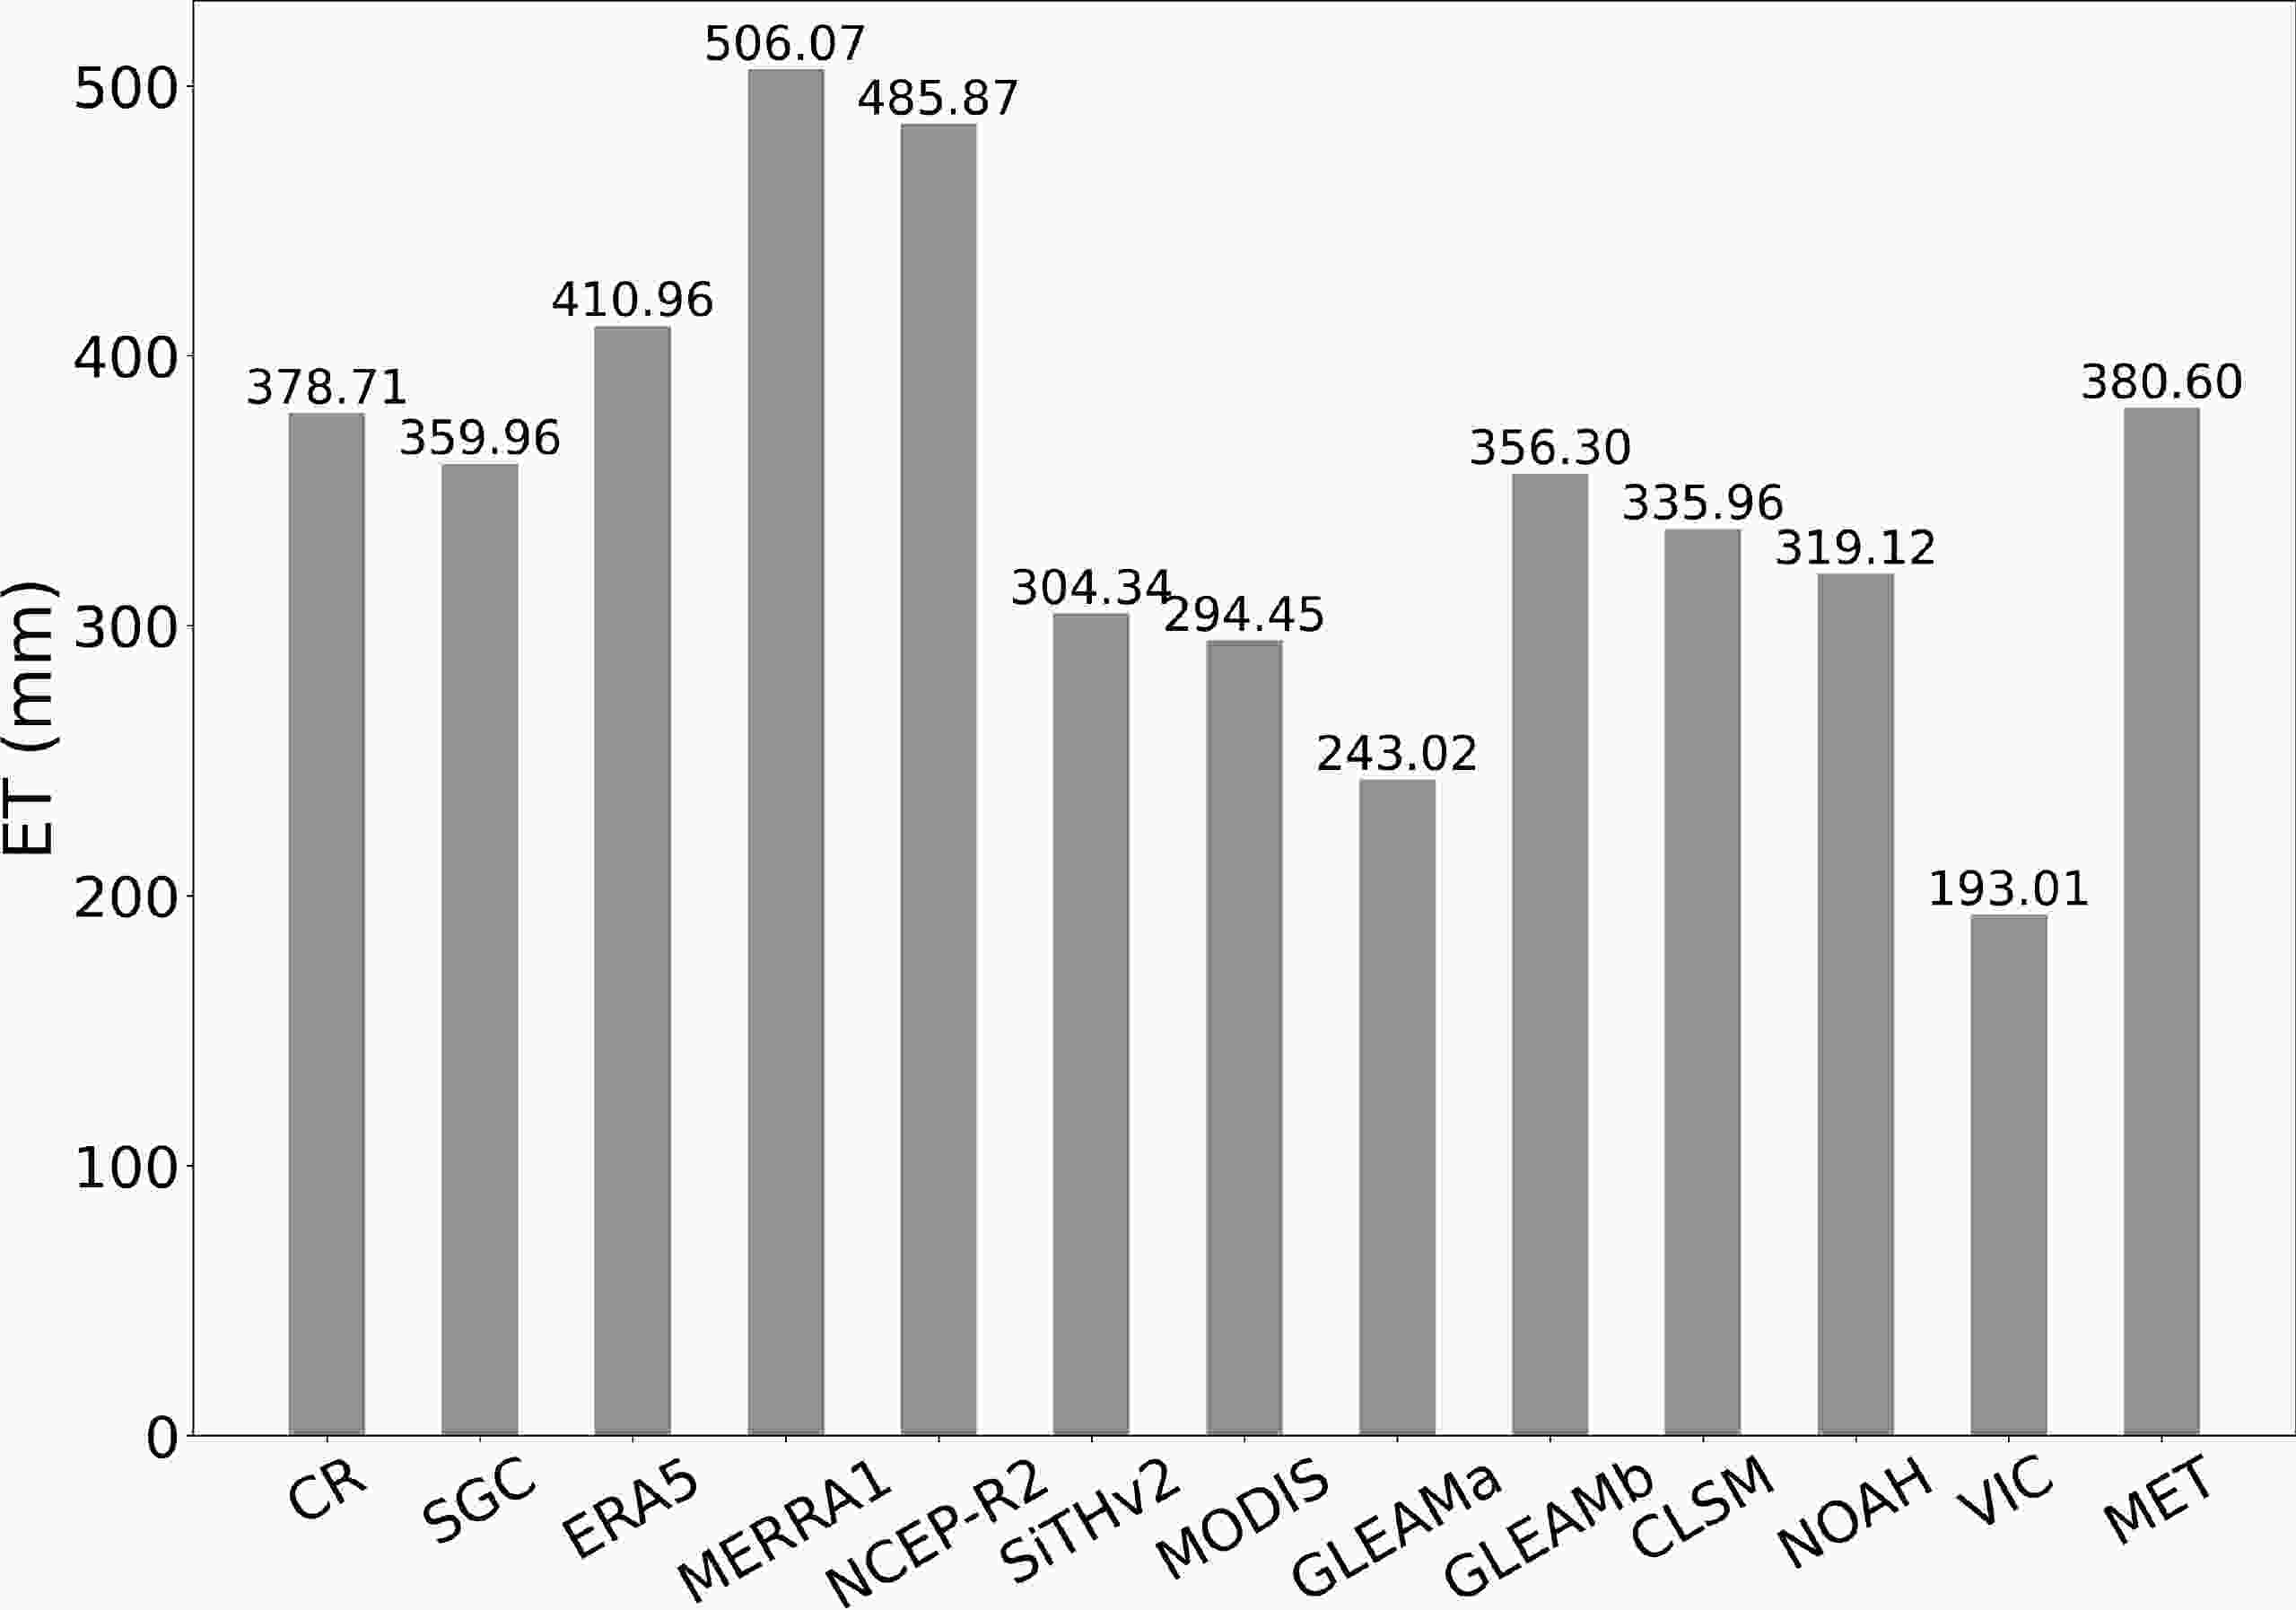
Figure 8. Total annual ET over the TP (units: mm).
The MC method is used to evaluate each product by calculating random errors over the TP. The previous section concludes that GLEAM3.6b has the best performance among individual ET products. Compared with GLEAM3.6b, the merged ET product has fewer blank values. That is, the spatial distribution is more complete. Its annually averaged ET for the entire TP is 380.60 mm, while that of GLEAM3.6b is 356.30 mm. This is because reanalysis products account for a part of the weight in MET and their annual total ET of the entire TP is generally higher. Additionally, GLEAM3.6b itself has a lot of blank values due to missing remotely sensed data.
-
This study focuses on merging evapotranspiration from different ET products based on the least-squares merging approach with explicit consideration of the error characteristics quantified by MC. The accuracy of MET is superior to any individual ET product, which proves the feasibility of the MC method to integrate different ET products. However, some limitations in the application of MC still exist. First, if input datasets can only be divided into fewer than three groups, the method cannot be applied. Second, the method only calculates variances, not correlation coefficients, which is different from TC.
Regarding ET uncertainties quantified via the MC method, the considerable uncertainty in LSM-based ET mainly arises from the differences in the model structures and parameters. The parameterizations of root water uptake, canopy conductance variations, water movements in the soil, and soil moisture control on transpiration increase the uncertainty of ET through interactions (Clark et al., 2015; Purdy et al., 2018). In contrast, the GLEAM3.6b (5.95 mm month–1) product is superior to the other products. Similar conclusions have been addressed in previous studies (Miralles et al., 2014; Yang et al., 2017; Liu et al., 2018). Six ET products over the TP were evaluated against the water balance method, and the GLEAM dataset had the best performance in the East-Asian-monsoon-dominated and Indian-monsoon-dominated basins (Liu et al., 2018). Validation against ChinaFLUX EC observations under various ecosystems showed that the GLEAM performed better, particularly at grassland sites (Yang et al., 2017). This is because GLEAM is the only global ET product that considers soil moisture, which is a vital constraint in ET retrieval (Miralles et al., 2014). In terms of the seasonal average of different ET products, the discrepancies in ET estimates for various products are generally larger in spring and summer and smaller in winter and spring. This is due to the uncertainty arising from the precipitation in spring and summer (Zhong et al., 2020; Wang et al., 2023). Additionally, since different ET products are resampled with the same spatial resolution, the influence of the uncertainty in the resampling process on the accuracy assessment of ET products remains to be explored. Although the MET product well reproduces the spatiotemporal ET pattern over the TP, more high-resolution ET products can be considered in the fusion process to reduce uncertainty.
-
As a statistical validation strategy, the MC method quantifies the uncertainty of individual ET products without using a reference dataset. This study obtains the error variance of different ET products using MC, and then the weights of different products in the MET are allocated based on the error variance of each dataset. Compared to the conventional method (EC ET), the MC method does not need to provide ground truth values, which is suitable for the TP due to the difficulty in the maintenance of ground observation stations, the sparseness of observations, and limited spatial representation. Compared to the triple collocation (TC) method, the MC method extends itself to more than three estimation sources. Without any prior knowledge and high-quality reference datasets, it can objectively evaluate the error of three or more independent products and give the covariance of each dataset. Furthermore, it can avoid introducing the inherent uncertainty of reference datasets.
In this study, based on the in situ ET data from TORP (BJ, QOMS, NADORS, NAMORS, SETORS, and MAWORS) and MC analysis, the accuracy and reliability of four satellite-based ET products (SiTHv2, MODIS, GLEAM3.6a, GLEAM3.6b), three LSM-based ET products (VIC, CLSM, NOAH), and five reanalysis ET products (CR, SGC, ERA5, MERRA1, NCEP_R2) are evaluated and merged. The spatiotemporal variation patterns of ET of the merged product and individual products are displayed. The multiyear mean annual ET of the merged product and individual products are quantified. Several conclusions can be summarized as follows.
(1) Uncertainties in various ET products over the TP are quantified via the MC method. Compared with LSM-based and reanalysis ET products, the uncertainty of RS-based ET products is the lowest. The advantage of the MC method is that it allows regional assessment of multisource ET products without the need for ground truthing. For example, complex topography may affect multisource ET products, and this method can reflect the impacts of terrain on product accuracy. It can be clearly identified that the uncertainty of all products is larger at the boundary of the TP, where the terrain is complex.
(2) The MC-based merging ET dataset with a spatial resolution of 0.25° at a monthly temporal scale during 2005–15 is generated. Compared with individual ET products, the multi-year average annual ET of the MET product has a similar spatial pattern, which decreased from the southeast to the northwest of the TP. This is consistent with the spatial distribution of precipitation over the TP. Furthermore, GLEAM3.6b has minimal uncertainty quantified by the MC method. Compared with GLEAM3.6b, the spatial distribution of the MET is more complete. Through validation with in situ observations, it has the highest median R-value (0.87), the lowest median of ubRMSE (16.60 mm month–1), and the lowest MAE (15.58 mm month–1). The accuracy of MET is superior to any individual ET product. This proves the feasibility of fusing multisource ET products by the MC method in data-poor areas such as the TP.
(3) For the merged and individual ET products, the total ET amount over the TP and their spatiotemporal variation patterns are clearly identified. The multiyear monthly and seasonal averages of most reanalysis-based ET products are higher than those of RS-based and LSM-based ET products. Almost all ET products show higher ET values in the humid regions and semihumid regions of the southeast TP and lower values in the arid regions and semiarid regions of the northwest TP. The total annual ET over the entire TP as calculated by MET is approximately 380.60 mm, resulting in the evapotranspiration of approximately 970.53 × 10⁹ t of water from the TP. In addition, it shows an increasing trend of ET of 1.59±0.85 mm yr–1 over the TP during 2005–15.
Acknowledgements. This work was funded by the Second Tibetan Plateau Scientific Expedition and Research (STEP) Program (Grant No. 2019QZKK0103); National Natural Science Foundation of China (Grant Nos. 41875031, 42230610, 41522501, 41275028) and CLIMATE-Pan-TPE in the framework of the ESA-MOST Dragon 5 Programme (Grant ID 58516).
| ET products | Category | Spatial resolution | Temporal resolution | References |
| CR | Reanalysis | 0.1° × 0.1° | Monthly | (Ma et al., 2019) |
| SGC | Reanalysis | 0.1° × 0.1° | Monthly | (Wang et al., 2022a) |
| ERA5 | Reanalysis | 0.25° × 0.25° | Monthly | (Hersbach, 2016) |
| MERRA1 | Reanalysis | 0.5° × 0.667° | 1 hour | (Rienecker et al., 2011) |
| NCEP_R2 | Reanalysis | Global T62 Gaussian grid (~210 km) | 6 hours | (Roads, 2003) |
| SiTHv2 | RS | 0.1° × 0.1° | Daily | (Zhang et al., 2022) |
| MODIS | RS | 0.05° × 0.05° | 8 days | (Yao et al., 2014) |
| GLEAM3.6a | RS | 0.25° × 0.25° | Monthly | (Martens et al., 2017) |
| GLEAM3.6b | RS | 0.25° × 0.25° | Monthly | (Martens et al., 2017) |
| CLSM | LSM | 0.25° × 0.25° | Monthly | (Rodell et al., 2004) |
| NOAH | LSM | 0.25° × 0.25° | Daily | (Rodell et al., 2004) |
| VIC | LSM | 1° × 1° | 3 hours | (Rodell et al., 2004) |


 AAS Website
 AAS WeChat