


 DownLoad:


-
As one of China’s most densely populated and urbanized megalopolis clusters, the Beijing-Tianjin-Hebei (BTH) region has suffered from serious air pollution in recent years, especially heavy PM2.5 pollution. Ambient PM2.5 is a great threat to human health (e.g., Ho et al., 2018; Yang et al., 2019; Chen and Hoek, 2020; Yue et al., 2021). In addition, these atmospheric particles can also interact with radiation, and alter cloud microphysics and precipitation, thereby affecting the radiative energy balance of the Earth’s system (e.g., Zhang et al., 2015; Sarangi et al., 2018; Tang et al., 2020; Jia et al., 2021). Since 2013, there have been many heavy air pollution events covering most areas of China where the 24-h average concentrations of PM2.5 exceed the threshold of ‘severe pollution’ identified by China’s ambient air quality standards (GB3095-2012). To control air pollution, the Chinese government has issued many policies and measures, including the promotion of energy conservation and emission reduction (e.g., Zheng et al., 2018; Chen et al., 2019, 2020; Fang et al., 2019; Ji et al., 2019; Kanaya et al., 2020; Qu et al., 2020). However, the mechanisms of the generation and evolution of PM2.5 pollution remain unclear. Moreover, global climate change and the frequent occurrence of extreme weather also influence PM2.5 evolution and the interactions of aerosol and meteorological processes, making it more challenging to effectively control PM2.5 pollution in China.
Air quality forecasting is critical for administrators to develop efficient and effective strategies for air pollution control. The forecast of air pollution episodes a few days in advance can help the government take short-term actions and issue timely alerts to reduce the exposure of the population and prevent potential pollution (e.g., Honoré et al., 2008; Menut et al., 2015; Liu et al., 2018; Petersen et al., 2019). Generally, there are two kinds of methods to forecast air quality, i.e., statistical models and numerical models. Although statistical methods can predict air pollution episodes well, they have limited capability to reveal the kinetic and chemical mechanisms of air pollution (Liu et al., 2005; Gupta and Christopher, 2009; Lee et al., 2011; Agarwal et al., 2020; Xiao et al., 2020; Chae et al., 2021; Seng et al., 2021). In contrast, numerical models take meteorology and chemistry processes into account, enabling the analysis and understanding of chemical and physical processes that affect the formation and evolution of air pollution. This method has been widely used for air quality forecasting and studying the temporal and spatial variations in air pollutants (e.g., Liu et al., 2018; Ni et al., 2018; Bao et al., 2019; Khan and Kumar, 2019; Petersen et al., 2019; Spiridonov et al., 2019, 2021; Kumar et al., 2020). However, as of now, accurate forecasting of air pollution episodes remains a challenge.
The accurate forecasting of air quality with numerical models is greatly hindered by the uncertainties in model input fields (e.g., emissions and initial conditions) and the incomplete or insufficient parameterization of the relevant atmospheric chemical processes. In addition, meteorological forecast uncertainties also largely affect air quality forecast accuracy since they can directly affect processes such as transport, turbulent mixing, and dry deposition (e.g., Willmott et al., 1985; Dennis et al., 2010; Gilliam et al., 2015; Chatani and Sharma, 2018; Hu et al., 2019a; Podrascanin, 2019; McNider and Pour-Biazar, 2020; Rao et al., 2020). The impacts of meteorological forecast uncertainties on air quality forecasts have been widely studied (e.g., Delle Monache et al., 2006; Zhang et al., 2007; Garcia-Menendez et al., 2013; Bei et al., 2014; Thomas et al., 2019; Zhao et al., 2019; Liu and Wang, 2020). Zhao et al. (2019) investigated the influence of planetary boundary layer (PBL) and surface layer parameterizations on surface ozone concentrations in the BTH region. They found that the choices of PBL and surface layer schemes could change the simulated surface ozone concentrations by a difference of over 20% in terms of ozone dry deposition fluxes. Liu and Wang (2020) examined the contribution of the variations in meteorological conditions and anthropogenic emissions to the summer ozone concentration from 2013 to 2017 in China. They found that in some areas of China, changes in meteorological conditions may have a more significant effect on ozone than anthropogenic emissions, with changes in wind fields making an important contribution to the increase in surface ozone. Garcia-Menendez et al. (2013) investigated the sensitivity of forecasted PM2.5 concentrations to uncertain wind fields and found that the uncertainties of forecasted PM2.5 concentrations might be determined by the uncertainties of wind fields rather than emissions. In addition, they found that the NME (normalized mean error) of the forecasted PM2.5 concentrations caused by uncertainties in wind fields could reach 100%.
Many studies have proven that the numerical forecast uncertainties of meteorological fields generally increase with increasing forecast lead times (e.g., Judt, 2018; Baumgart et al., 2019; Parsons et al., 2019; Selz, 2019; Zhang et al., 2019), which largely limits the forecast accuracy of air quality. Therefore, it is also important to examine the impacts of lead time on air quality forecasts to explore the factors affecting the forecast accuracy of air quality, which has been investigated in some previous studies (e.g., Zhang et al., 2007, 2017; Honoré et al., 2008; de Wildt et al., 2011; Neal et al., 2014; Menut et al., 2015; Emili et al., 2016; Liu et al., 2018; Spiridonov et al., 2019; Thomas et al., 2019; Gvoždíková and Müller, 2021). Honoré et al. (2008) conducted forecast experiments over Europe from 2004 to 2006 with forecast lead times from 24 to 72 hours. By evaluating the surface ozone concentrations with observations, they found that 6%, 15%, and 25% of the ozone daily maxima forecast uncertainties of the 24-, 48-, and 72-hour forecasts are due to meteorological forecast uncertainties at some rural stations. examined. The ability of the Lotos-Euros model to forecast PM10 concentrations in 2009 with a lead time of six days in the Netherlands was examined by de Wildt et al. (2011). The correlation between the forecast and observations is approximately 0.66–0.77 with a lead time of less than three days and then gradually deteriorates to 0.54 for the six-day forecast. Zhang et al. (2017) evaluated the predictability of hourly and daily PM2.5 of WRF-Chem in downtown Beijing for November-December 2015 with a lead time range of 10 days. They found that the root-mean-square-error (RMSE) of the forecasted hourly (daily) mean PM2.5 significantly increased with increasing lead time, rising from 103.1 (85.8) for the one-day forecast to 150.7 (130.0) for the ten-day forecast.
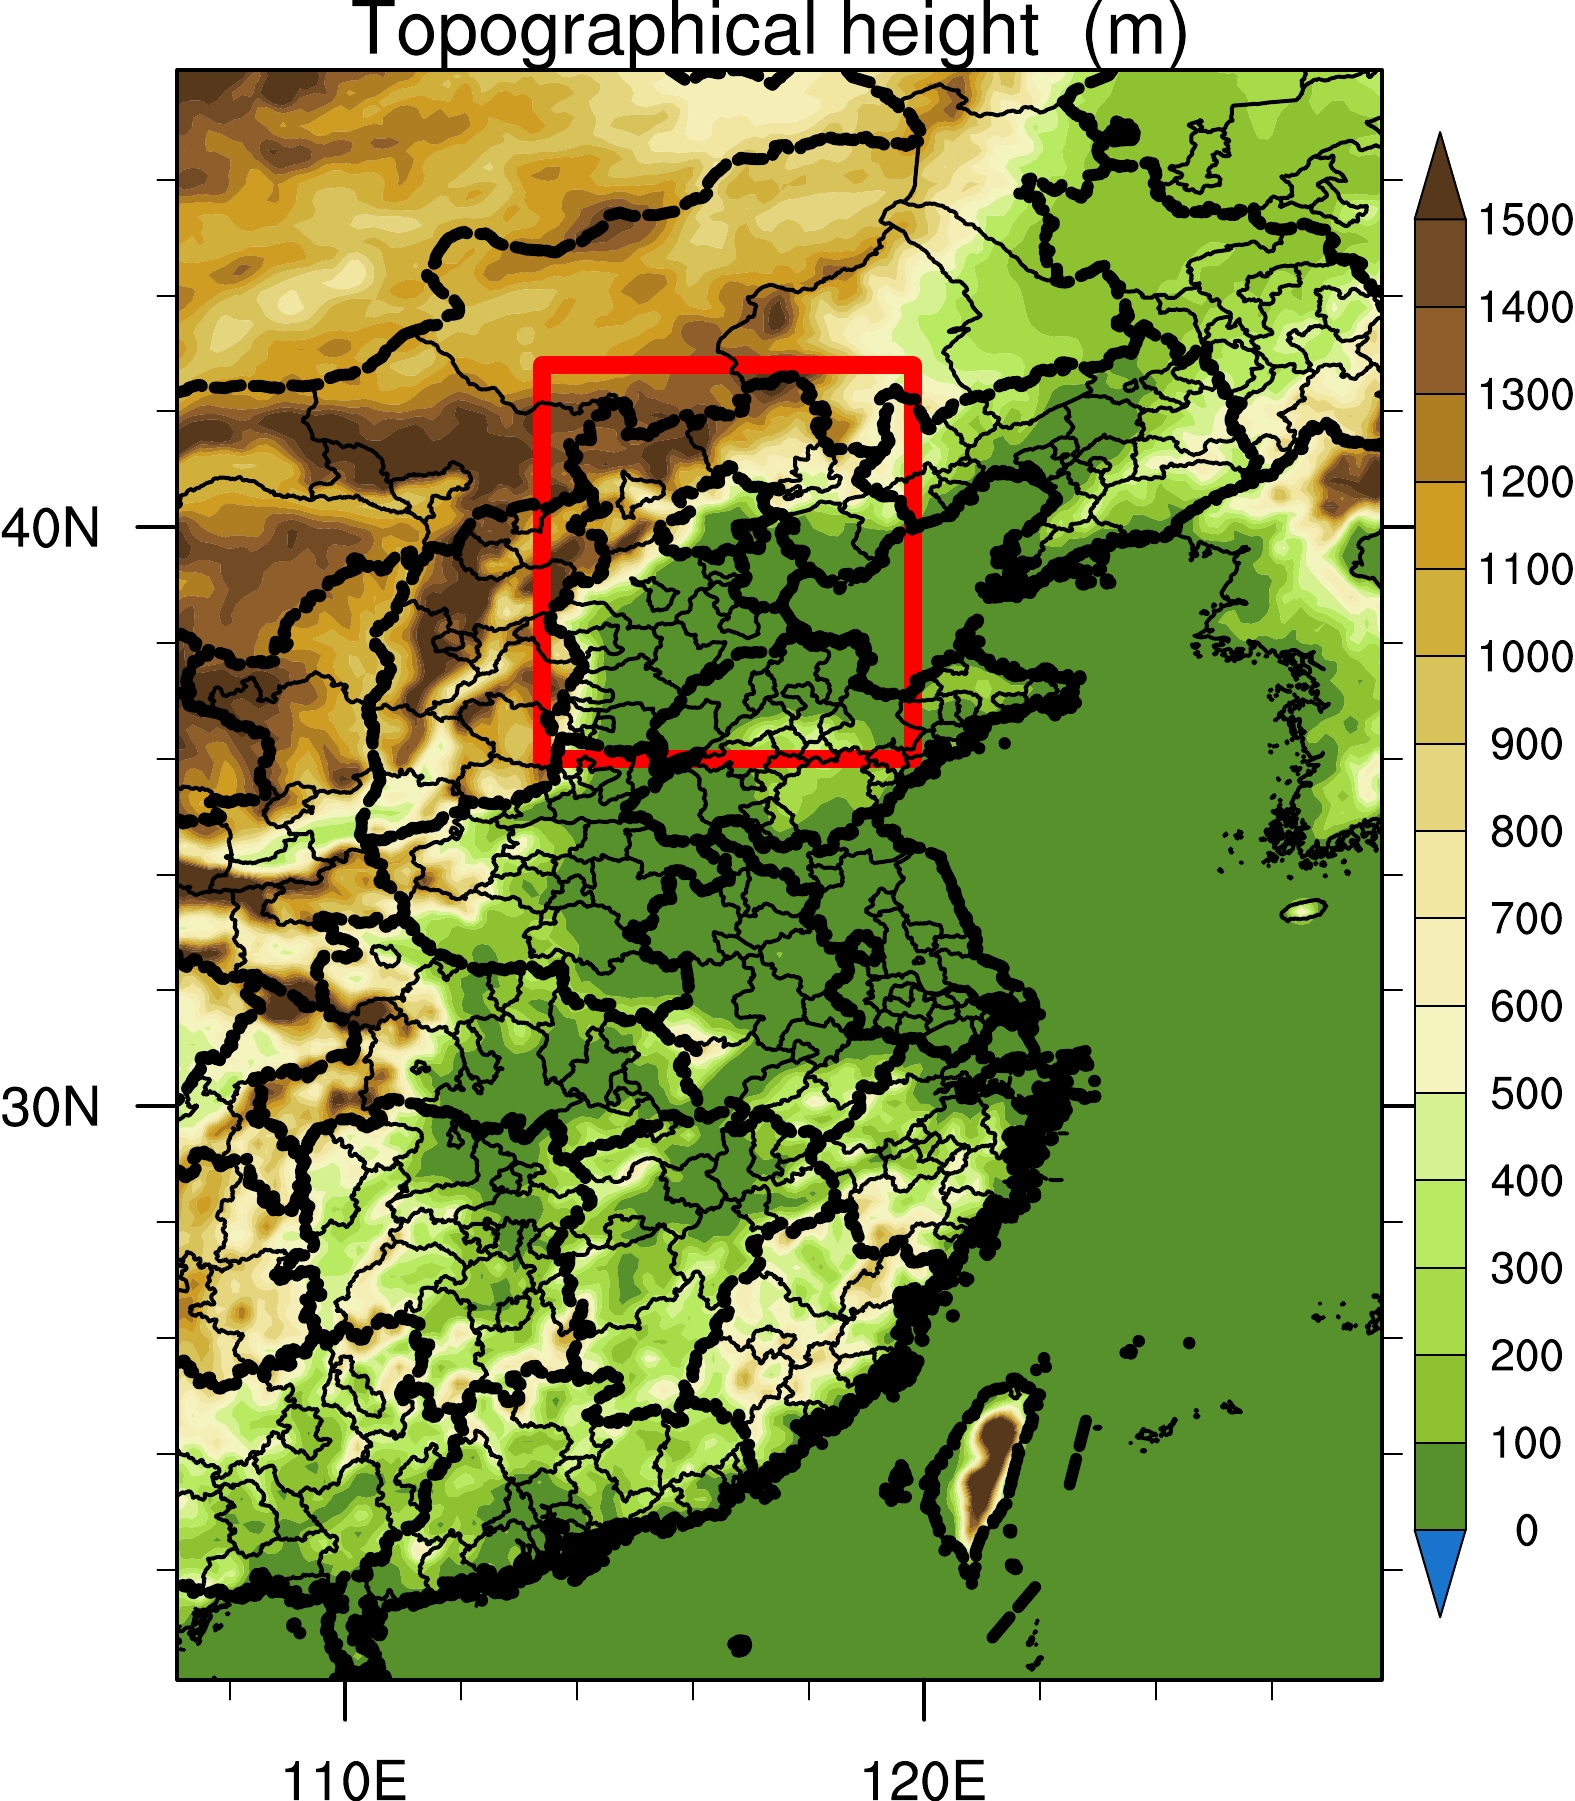
Some previous studies have reported the impacts of forecast lead time on air quality forecast results. Few studies focused on the impact of lead time on air quality forecast in China on a seasonal scale and investigated the mechanisms driving the air quality forecast uncertainties caused by increasing lead time for different seasons. It is not well known which processes are key to the forecasting uncertainties with increasing forecast lead times. Therefore, in this study, a few air quality forecast experiments are conducted with different forecast lead times for four seasons over China. The analysis aims to explore the impacts of meteorological forecast uncertainties with increasing lead time on the forecasting uncertainties of surface PM2.5 concentrations in different seasons, and the underlying mechanisms are also investigated. This study focuses on the BTH region, including Beijing, Tianjin, and Hebei Province, as shown in Fig. 1. The BTH region is located on the coast of the Bohai Sea, with the Taihang Mountains to the west, the Yanshan Mountains to the north, and the Yimeng Mountains to the southeast. With a large amount of heavy industry and seasonal heating demand, the BTH region has become the most polluted region by anthropogenic emissions in China and typically represents the characteristics of air pollution over northern China. In addition, the BTH region has a typical temperate and continental monsoon climate with distinct seasons, featuring hot and humid in summer and cold and dry in winter.
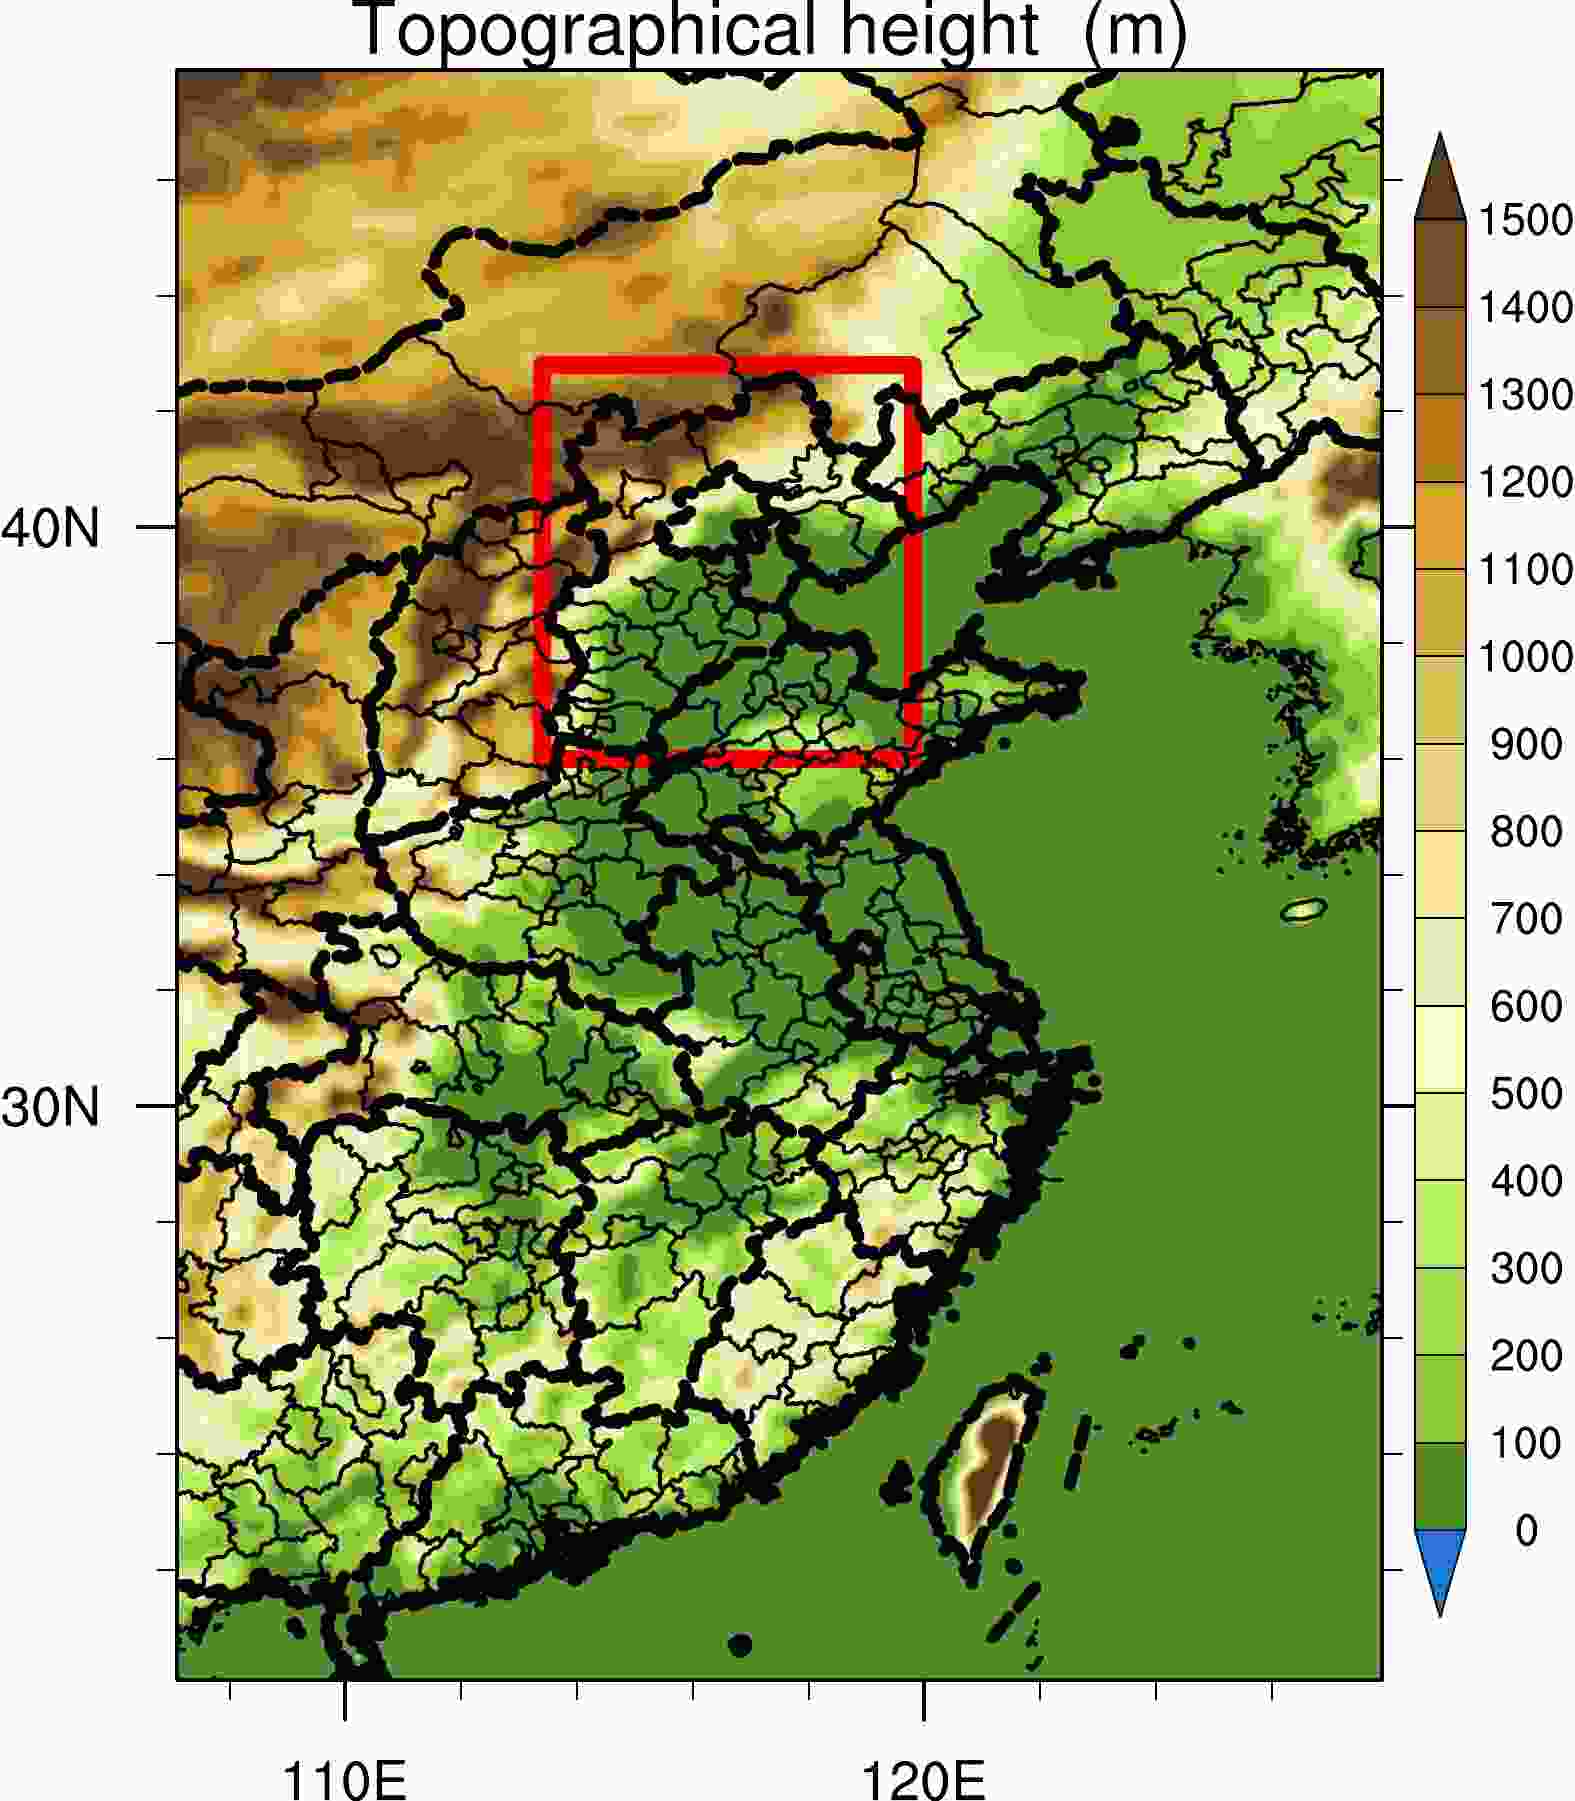
Figure 1. Spatial distribution of topographical height within the inner domain. The red box denotes the BTH region in this study.
The remainder of the paper is organized as follows. The details of the model used, the experimental design, and the analysis method of the impacts of meteorological forecast uncertainties are presented in section 2. The quantitative analysis of the impacts of meteorology forecast uncertainties and the investigation of the underlying mechanisms are discussed in section 3. The summary and discussion are found in sections 4 and 5, respectively.
-
In this study, the USTC version of WRF-Chem with new functions including radiation forcing diagnosis of aerosol species and improved PBL mixing of aerosols is used (Zhao et al., 2013a, b, 2014, 2016; Hu et al., 2019b; Du et al., 2020; Zhang et al., 2021). In particular, to understand the mechanisms by which uncertainties in meteorological forecasts affect the surface PM2.5 concentrations forecasts, this version is updated with a detailed diagnosis of the contributions of each crucial process to surface PM2.5 concentrations (Du et al., 2020). The WRF-Chem configurations of this study are similar to that of Du et al. (2020). Briefly, the CBM-Z (Zaveri and Peters, 1999) and the MOSAIC (Zaveri et al., 2008) are used for aerosol chemistry. The size distributions of aerosol particles are characterized by eight bins following the method of Fast et al. (2006). The description of dry depositions of aerosol mass and number follows the method of Binkowski and Shankar (1995). The wet deposition of aerosols follows the method of Easter et al. (2004) and Chapman et al. (2009). The YSU PBL scheme (Hong et al., 2006) is used, and the PBL mixing coefficient within the boundary layer is modified following Du et al. (2020) by setting the lower limit of the PBL mixing coefficient from the default value in WRF-Chem to 5 m2 s–1 and is applied in the mixing of gas and aerosol pollutions. The Morrison two-moment scheme is used for cloud physics (Morrison et al., 2009), while the RRTMG (Mlawer et al., 1997; Iacono et al., 2000; Zhao et al., 2011) is used for radiation. The description of aerosol optical properties follows the method of Fast et al. (2006) and Barnard et al. (2010). The description of the activation and resuspension of aerosols in aerosol-cloud interactions follows the methods of Gustafson et al. (2007).
-
In this study, the WRF-Chem is conducted with two nested domains (one-way nesting) during four months of 2018 (i.e., January, April, July, and October), representing the four seasons. The outer domain covers a quasi-global region with 360 × 145 grid cells (180°W–180°E, 67.5°S–77.5°N) at a 1° × 1° horizontal resolution (not shown), while the inner domain covers East China with 147 × 196 grid cells (107.1°–127.9°E, 20.1°–47.9°N) at a horizontal resolution of 0.14° × 0.14°, as shown in Fig. 1. Although the analysis in this study focuses on the BTH region, this inner domain covers the entire region of East China, including almost all of the densely populated regions of China, to consider the impacts of transport. The preliminary analysis of other regions, such as the Yangtze River Delta (YRD) region and the Pearl River Delta (PRD) region, shows quite different results and mechanisms compared to those over the BTH region and will therefore be presented in future studies. In addition, since the surface PM2.5 concentrations are relatively low in the mountainous northwestern areas of the BTH region (to be discussed in section 3) and the populated urban areas are mainly distributed in the central and southern areas of the BTH region, the analysis of this study will focus on the central and southern plain areas of the BTH region [Fig. S1 in the electronic supplementary material (ESM)].
The forecast experiments are conducted with the two nested domains for four months of 2018. Each forecast experiment starts at 0000 UTC each day of the month and runs for 144 hours. In this way, the composite forecasting results can be obtained for each month with lead times (the time span of the forecast) from 24 hours to 144 hours. In this way, the impacts of the lead time induced by meteorological forecasting uncertainties can be investigated. Specifically, the composite of the average forecasting results between 24 hours and 48 hours is referred to hereafter as the 2-Day forecast, and analogously, the 3-Day, 4-Day, 5-Day, 6-Day, and 7-Day forecasts are designated for analysis. For each forecast run, the chemical initial fields and lateral conditions of the inner domain are obtained from the outer quasi-global domain, and the meteorological initial conditions of both domains are obtained from the ERA-interim reanalysis data. Meanwhile, the chemical initial fields and lateral conditions of the forecast in the outer quasi-global domain are obtained by a quasi-global simulation with the same settings, except that four-dimensional data assimilation (FDDA) is applied (Stauffer and Seaman, 1990; Seaman et al., 1995). Although the experiments are driven by the reanalysis at the meridional lateral boundaries, the simulation results can be treated as forecast results, considering that the outer domain covers nearly the entire globe. Notably, a few test experiments are also conducted with the ERA5 reanalysis serving as the initial and boundary conditions. A negligible difference is found between the results driven by different reanalyses (not shown), which indicates that the results in this study do not depend on the reanalysis used.
The configuration of emissions in this study is similar to that used by Du et al. (2020). For both domains, the monthly emission inventory of Hemispheric Transport of Air Pollution version 2 (HTAPv2) of 2010 at 0.1° × 0.1° horizontal resolution (Janssens-Maenhout et al., 2015) is used with the emissions over China replaced by the 0.1° × 0.1° Multi-resolution Emission Inventory for China (MEIC) of 2015 (Li et al., 2017a, b). The biomass burning emissions are derived from the hourly Fire Inventory from NCAR (FINN) at a 1-km resolution (Wiedinmyer et al., 2011), which follows the injection heights proposed by Dentener et al. (2006) in the Aerosol Comparison between Observations and Models (AeroCom) and the diurnal variation provided by WRAP (2005). The biogenic emissions are simulated by MEGAN v2.0 following (Zhang et al. (2021). In addition, the GOCART dust emission scheme (Ginoux et al., 2001) is used to calculate the vertical dust flux, and the size distributions of dust particles emitted into the atmosphere are characterized in the MOSAIC aerosol size bins (Kok, 2011). The sea-salt emission follows Zhao et al. (2013b).
-
Normally, forecasting uncertainties can be assessed by comparing the forecasting results and the reanalysis or observations. However, in addition to the impacts of forecast uncertainties of meteorological fields, air quality forecasting uncertainties may result from many other factors, such as uncertainties of emissions and deficiencies in physical and chemical parameterizations, and the uncertainties due to these factors may cancel each other out. Therefore, the impacts of meteorological forecast uncertainties caused by variable lead times cannot be isolated simply through comparison with reanalysis or observations. In this study, the 2-Day forecast is treated as the benchmark, and the impacts of meteorological forecast uncertainties caused by lead time on the forecast uncertainties of surface PM2.5 concentration are analyzed by the difference in forecasted PM2.5 concentrations between the 3-Day and 7-Day forecasts and the 2-Day forecast. Some key meteorological fields from the 2-Day forecast are evaluated with the ERA5 reanalysis data. The forecast generally captures the spatial features of the 850-hPa geopotential heights and winds for different seasons (Fig. S2 in the ESM). The forecast bias of geopotential heights is less than 50 m in east China in winter and within 10 m in other seasons, while the bias of winds is less than 5 m s–1 in east China in all seasons. In addition, the forecast slightly overestimates (underestimates) the 2-m temperature in central and eastern China (along the northern and southern coasts) with biases less than 3 K (Fig. S3 in the ESM). In general, the meteorological fields from the 2-Day forecast are reliable. Therefore, by comparing the differences in PM2.5 concentrations between the 3-Day and 7-Day forecasts and the 2-Day forecast, the impacts of meteorological forecast uncertainties due to variable lead times can be quantified.
-
Figure 2 shows the spatial distributions of surface PM2.5 concentrations from the 2-Day to 7-Day forecasts. The surface PM2.5 concentrations from the 2-Day forecast are higher in the central and southern areas in the BTH region throughout the seasons, especially in the plain areas. The PM2.5 concentrations over the mountainous northwestern areas from the 2-Day forecast are less than 30 μg m–3 throughout the year, therefore, this area will not be the focus of the study. The highest PM2.5 concentrations throughout the year occur in winter, with concentrations up to 70 μg m–3. In spring, surface PM2.5 concentrations are also relatively high over the Northwest, which is due to the long-range transport of dust that is prevalent in this season (discussed more below). In summer, the surface PM2.5 shows a similar spatial distribution to that in winter, with a lower concentration of approximately 20 to 50 μg m–3. However, the PM2.5 concentrations remain below 40 μg m–3 for the entire area in autumn. With increasing lead times, the spatial distributions of forecasted PM2.5 concentrations significantly change and exhibit obvious seasonal differences. The forecasted PM2.5 concentrations continue to increase with increasing lead times over the BTH region throughout the four seasons, except that the concentrations may decrease in winter and autumn.
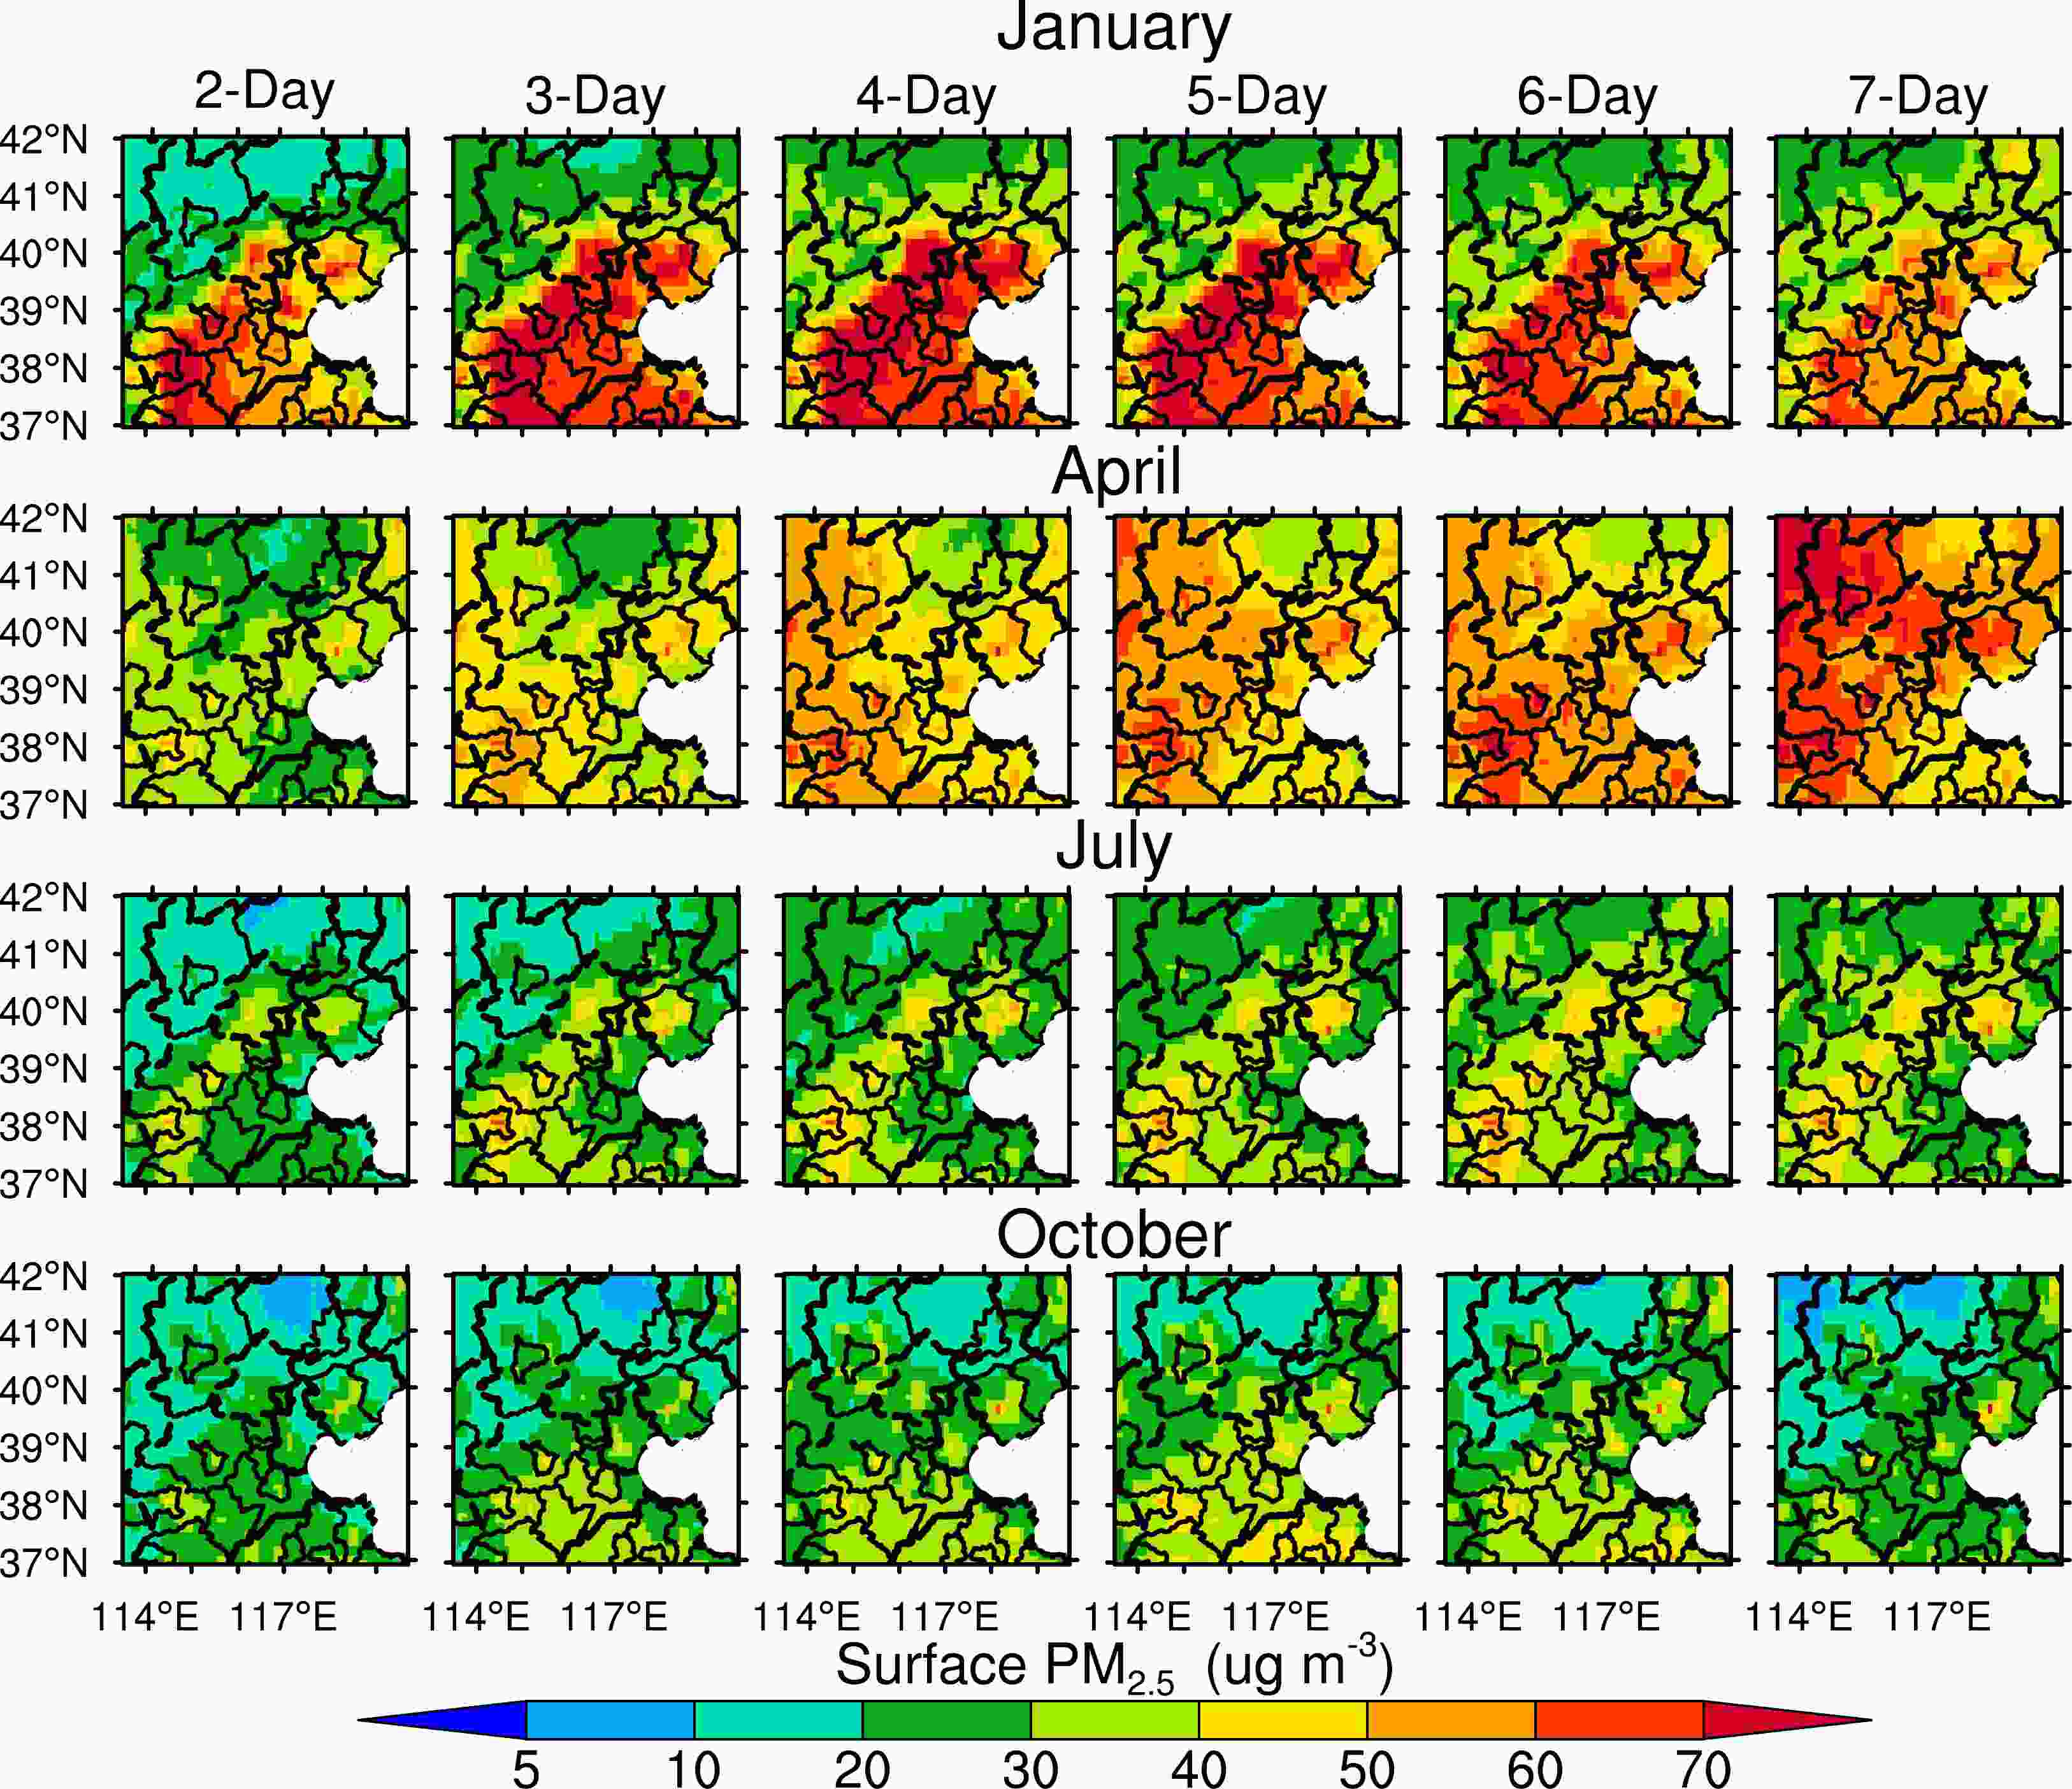
Figure 2. Spatial distribution of surface PM2.5 concentrations from the 2-Day to 7-Day forecasts in January, April, July, and October of 2018.
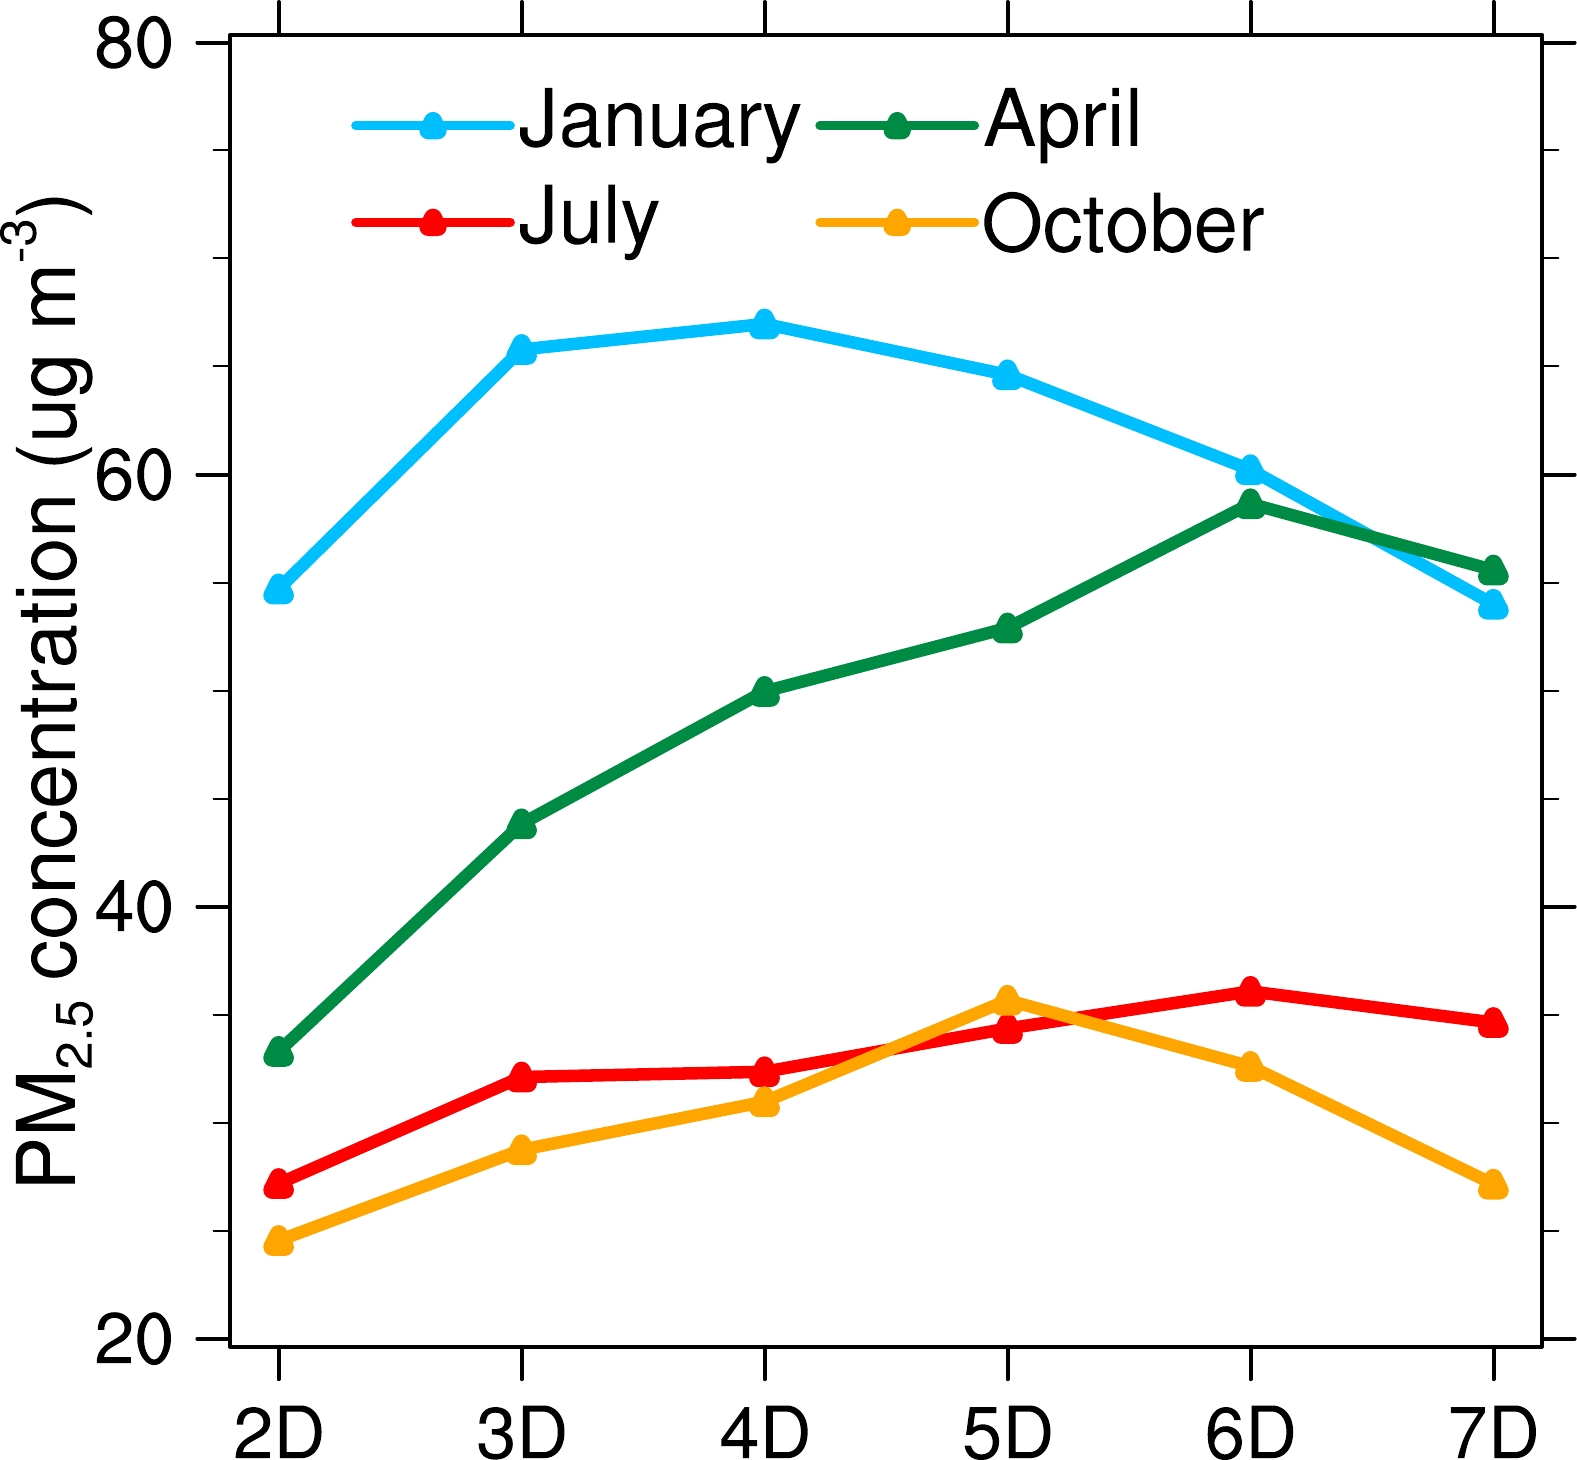
Figure 3 shows the regional surface PM2.5 concentrations averaged over the plain areas of BTH (as shown in Fig. S1) for four seasons from the forecasts with different lead times. In winter, the surface PM2.5 concentration from the 2-Day forecast is approximately 55 μg m–3, and it increases with the increasing lead time, peaking at 65 μg m–3 in the 4-Day forecast. It then decreases to approximately 53 μg m–3 in the 7-Day forecast. This indicates that the forecasting uncertainties of monthly mean surface PM2.5 concentrations in the BTH region in winter can reach 20% solely due to the forecasting meteorological uncertainties with a 4-Day or longer lead time. In spring, with the increasing lead times, the forecasted PM2.5 concentrations increase from 32 μg m–3 in the 2-Day forecast to 58 μg m–3 in the 6-Day forecast. The impacts of lead time on the forecasting uncertainties of surface PM2.5 concentrations over the BTH region are much larger (~80%) in spring than in winter (~20%). In summer, the forecasted surface PM2.5 concentrations generally increase with lead time from 27 μg m–3 in the 2-Day forecast to 36 μg m–3 in the 7-Day forecast, reflecting a forecasting uncertainty of ~40%. In autumn, the impact of lead time on forecasted surface PM2.5 concentrations is similar to that in summer in the 2-Day to 5-Day forecasts (~50%) but differs in the 6-Day and 7-Day forecasts. Overall, the forecasting uncertainties in surface PM2.5 concentrations are the smallest in winter among the four seasons and can reach more than 80% solely due to the forecasting meteorological uncertainties with a lead time of seven days or even shorter.
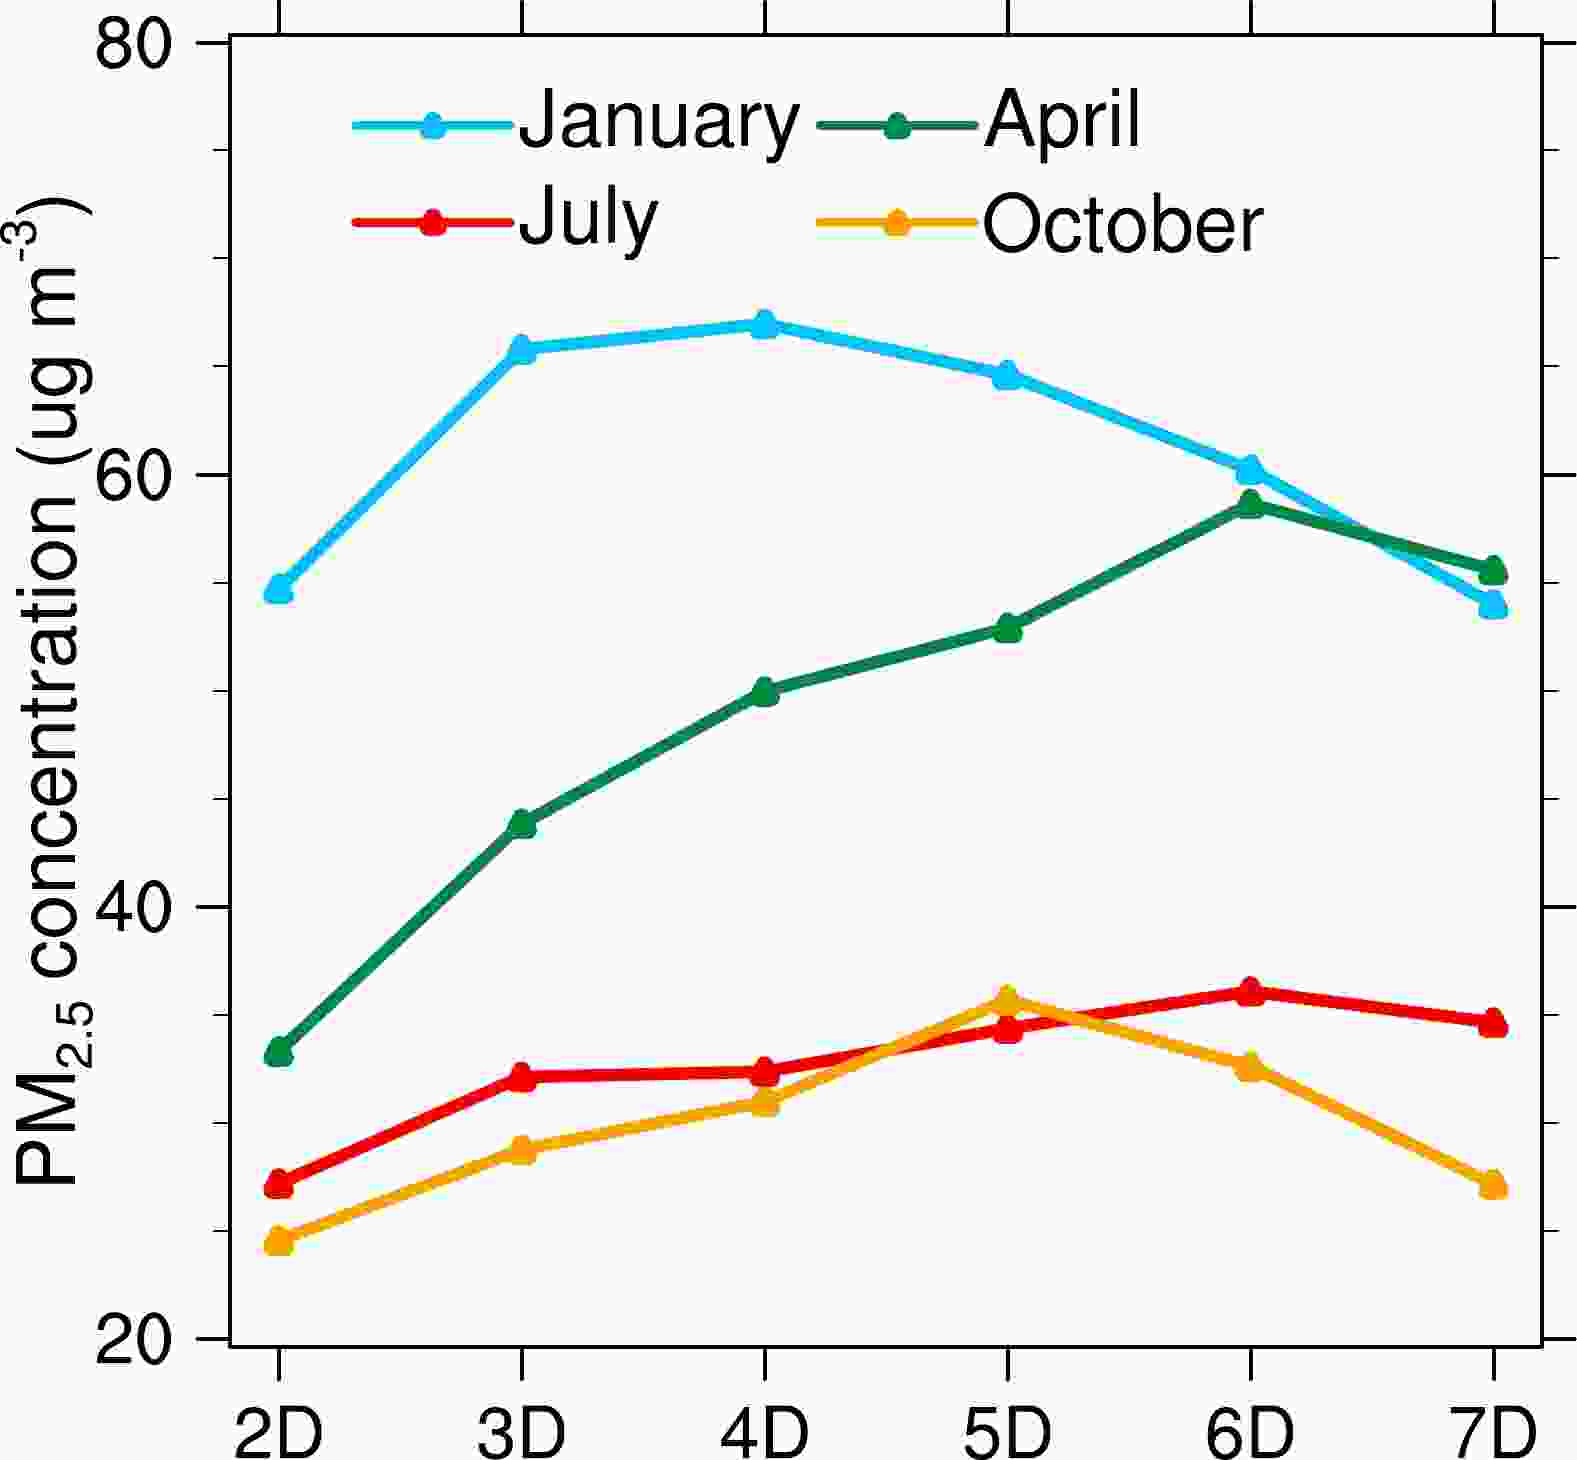
Figure 3. Monthly mean surface PM2.5 concentrations over the BTH region in January, April, July, and October of 2018 from the 2-Day to 7-Day forecasts.
-
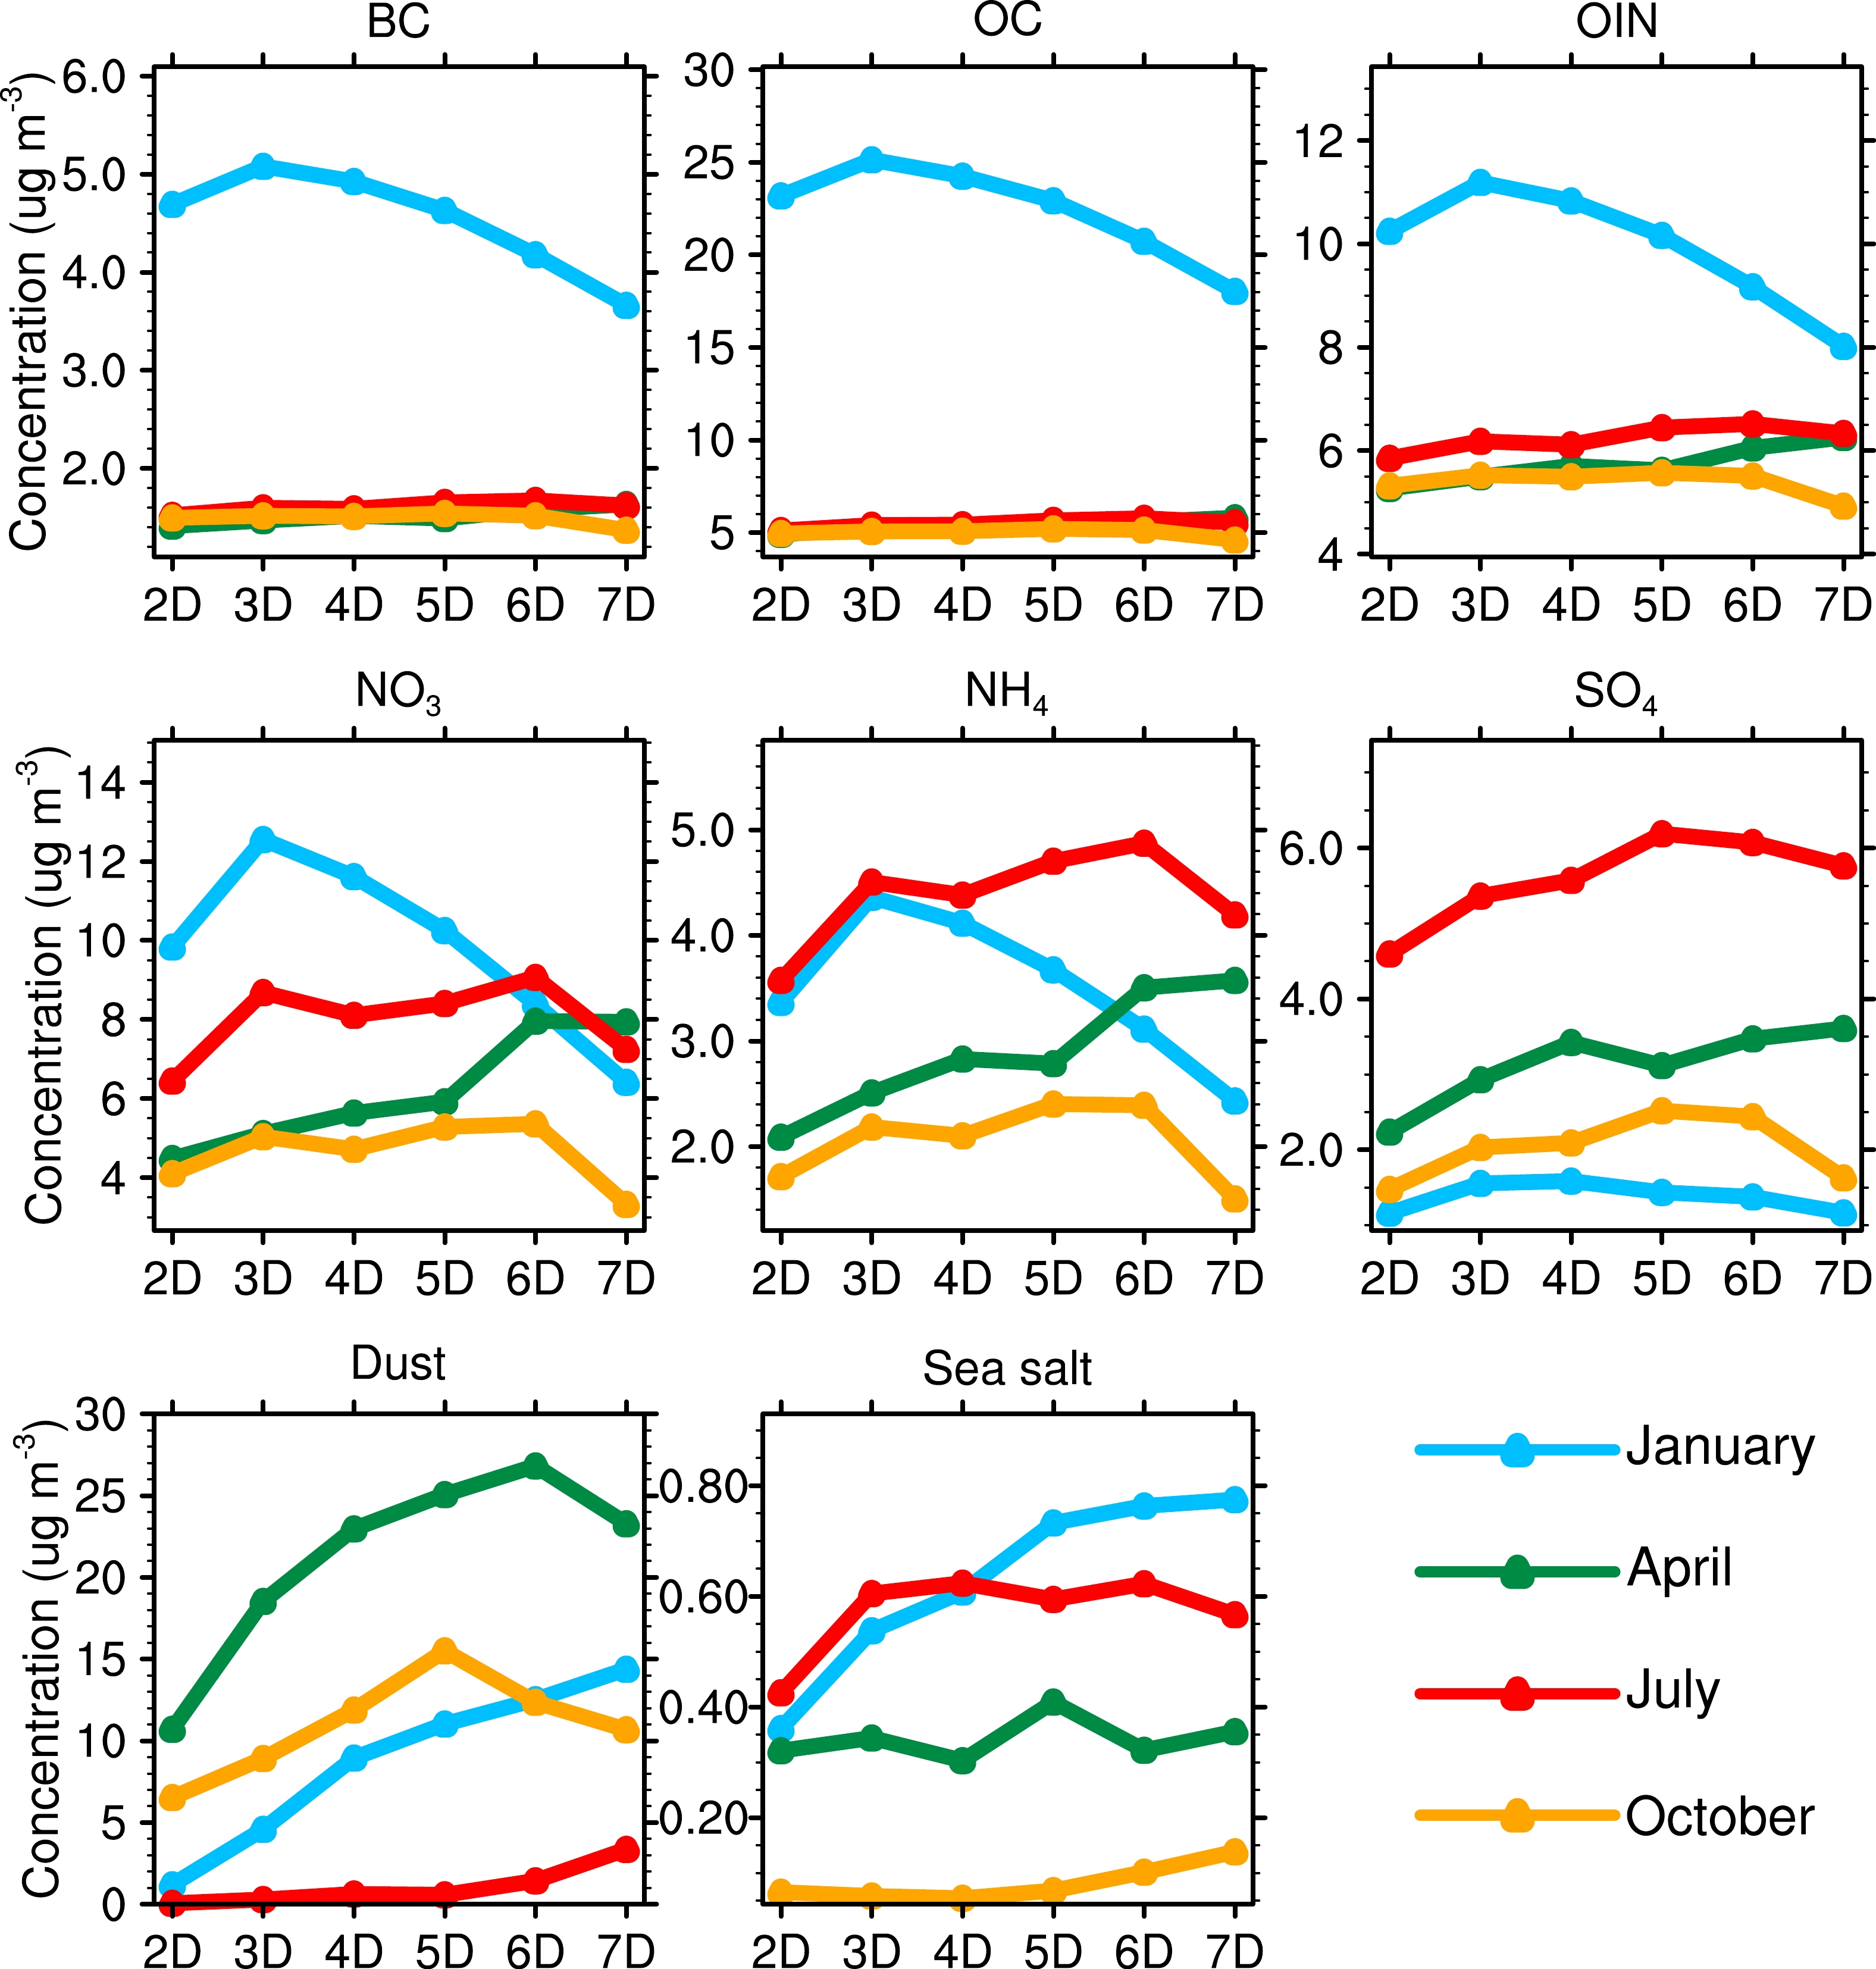
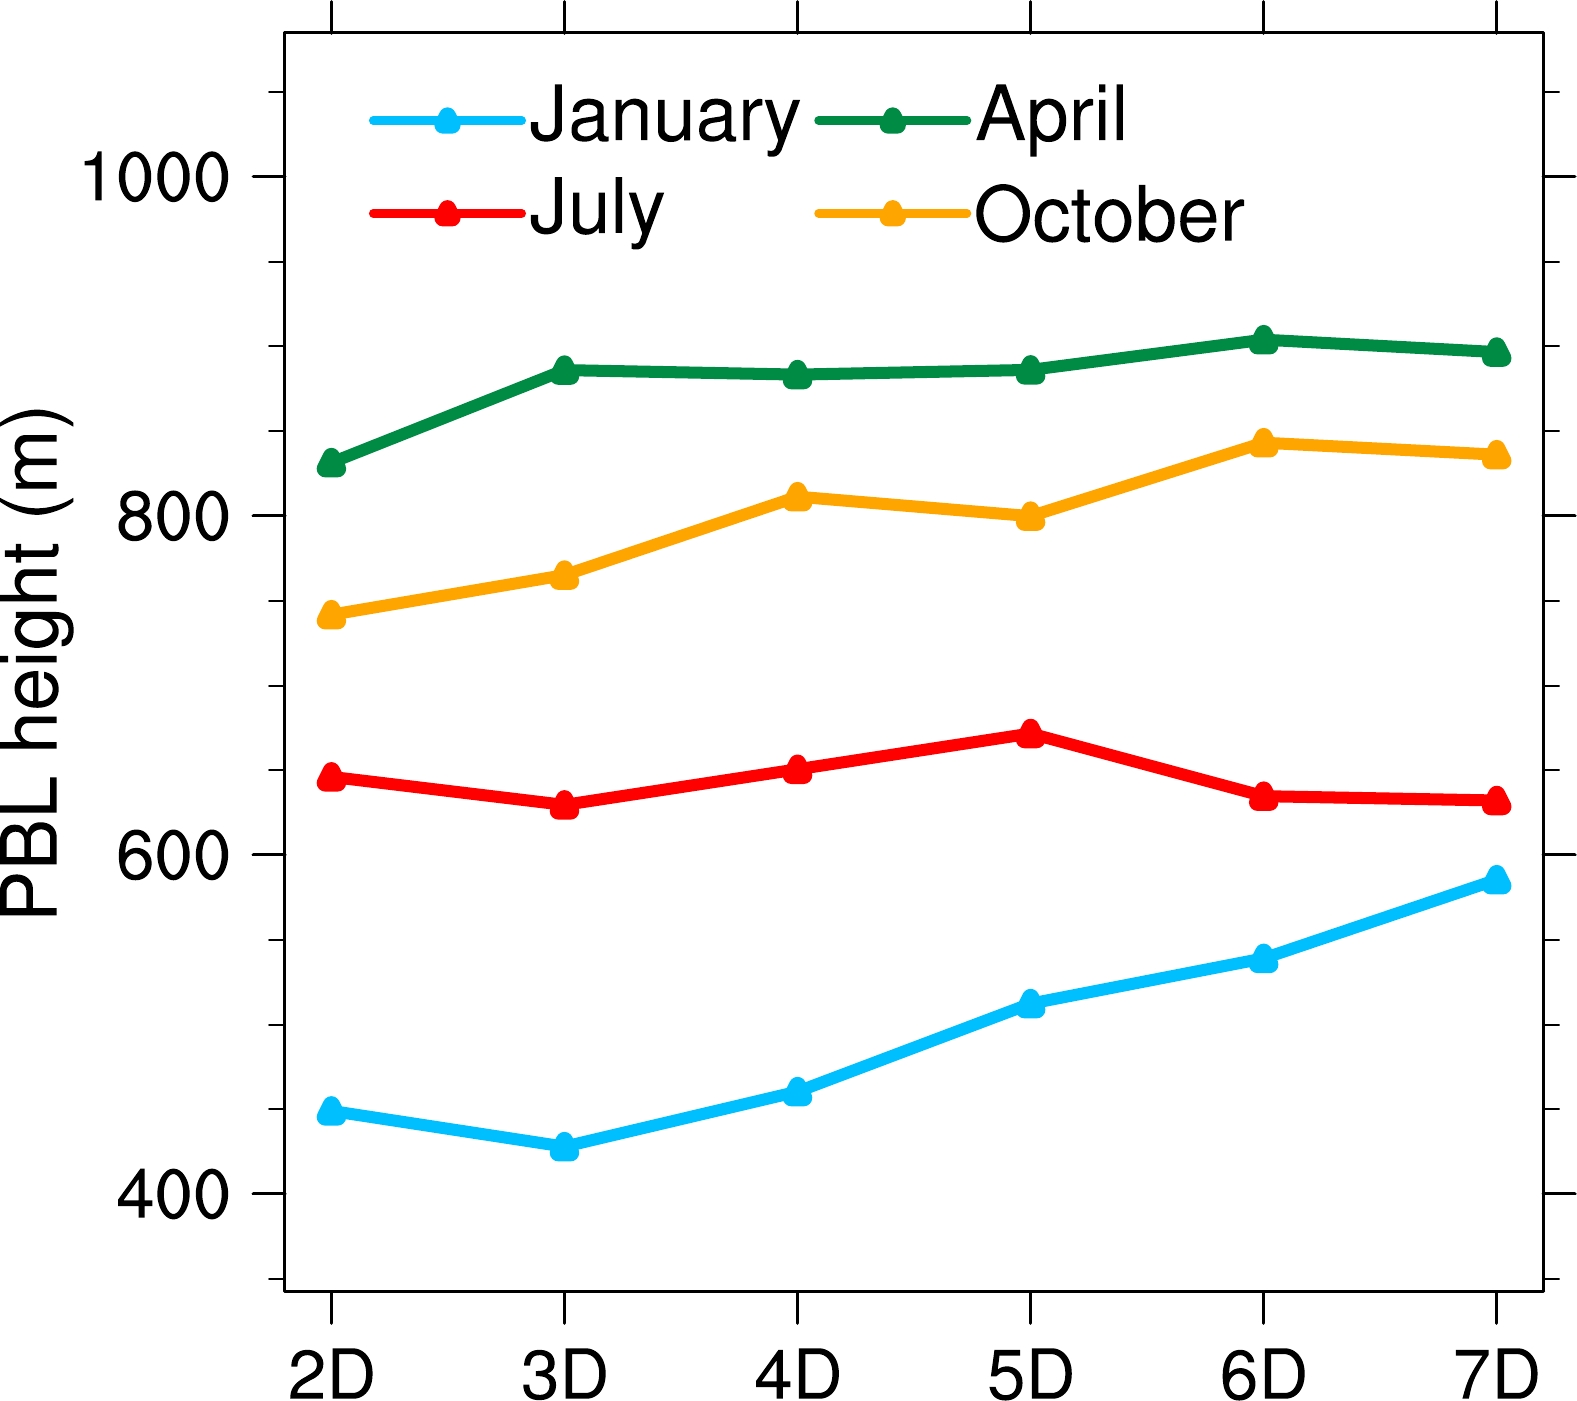
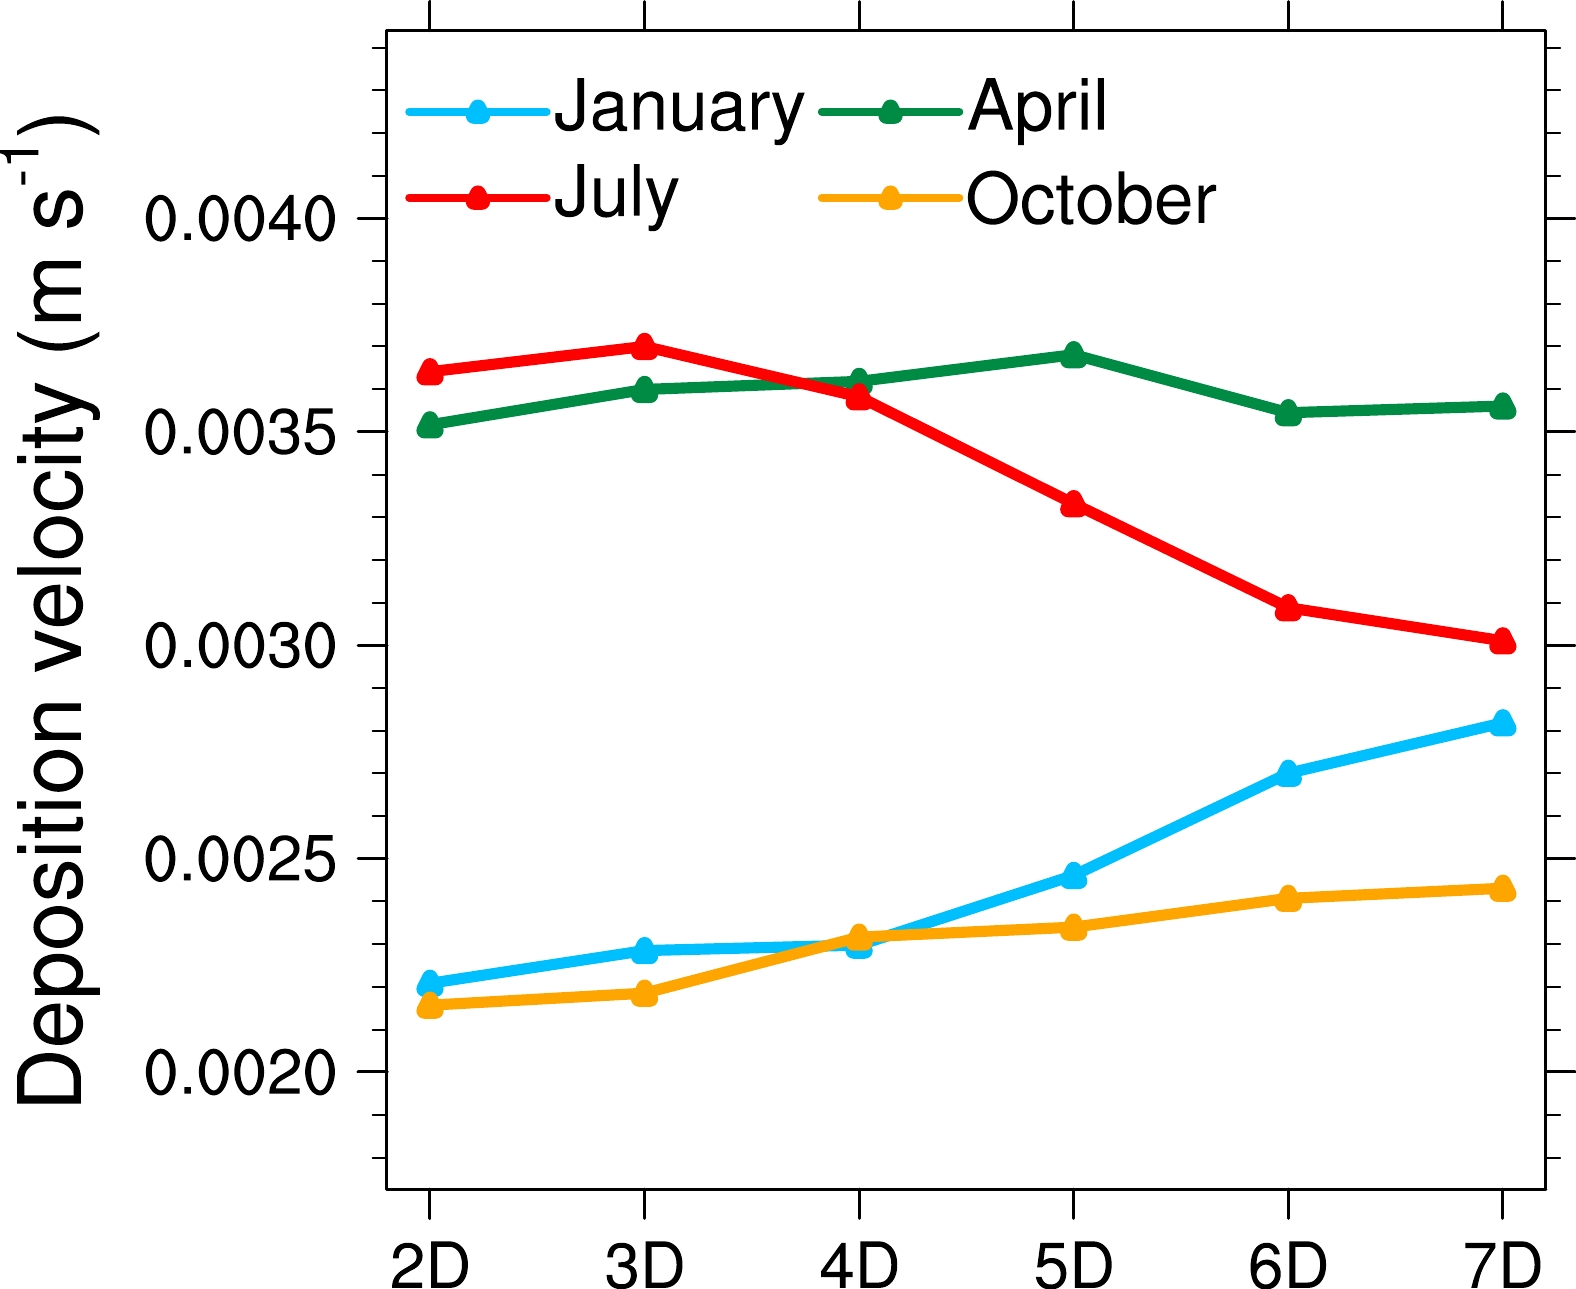
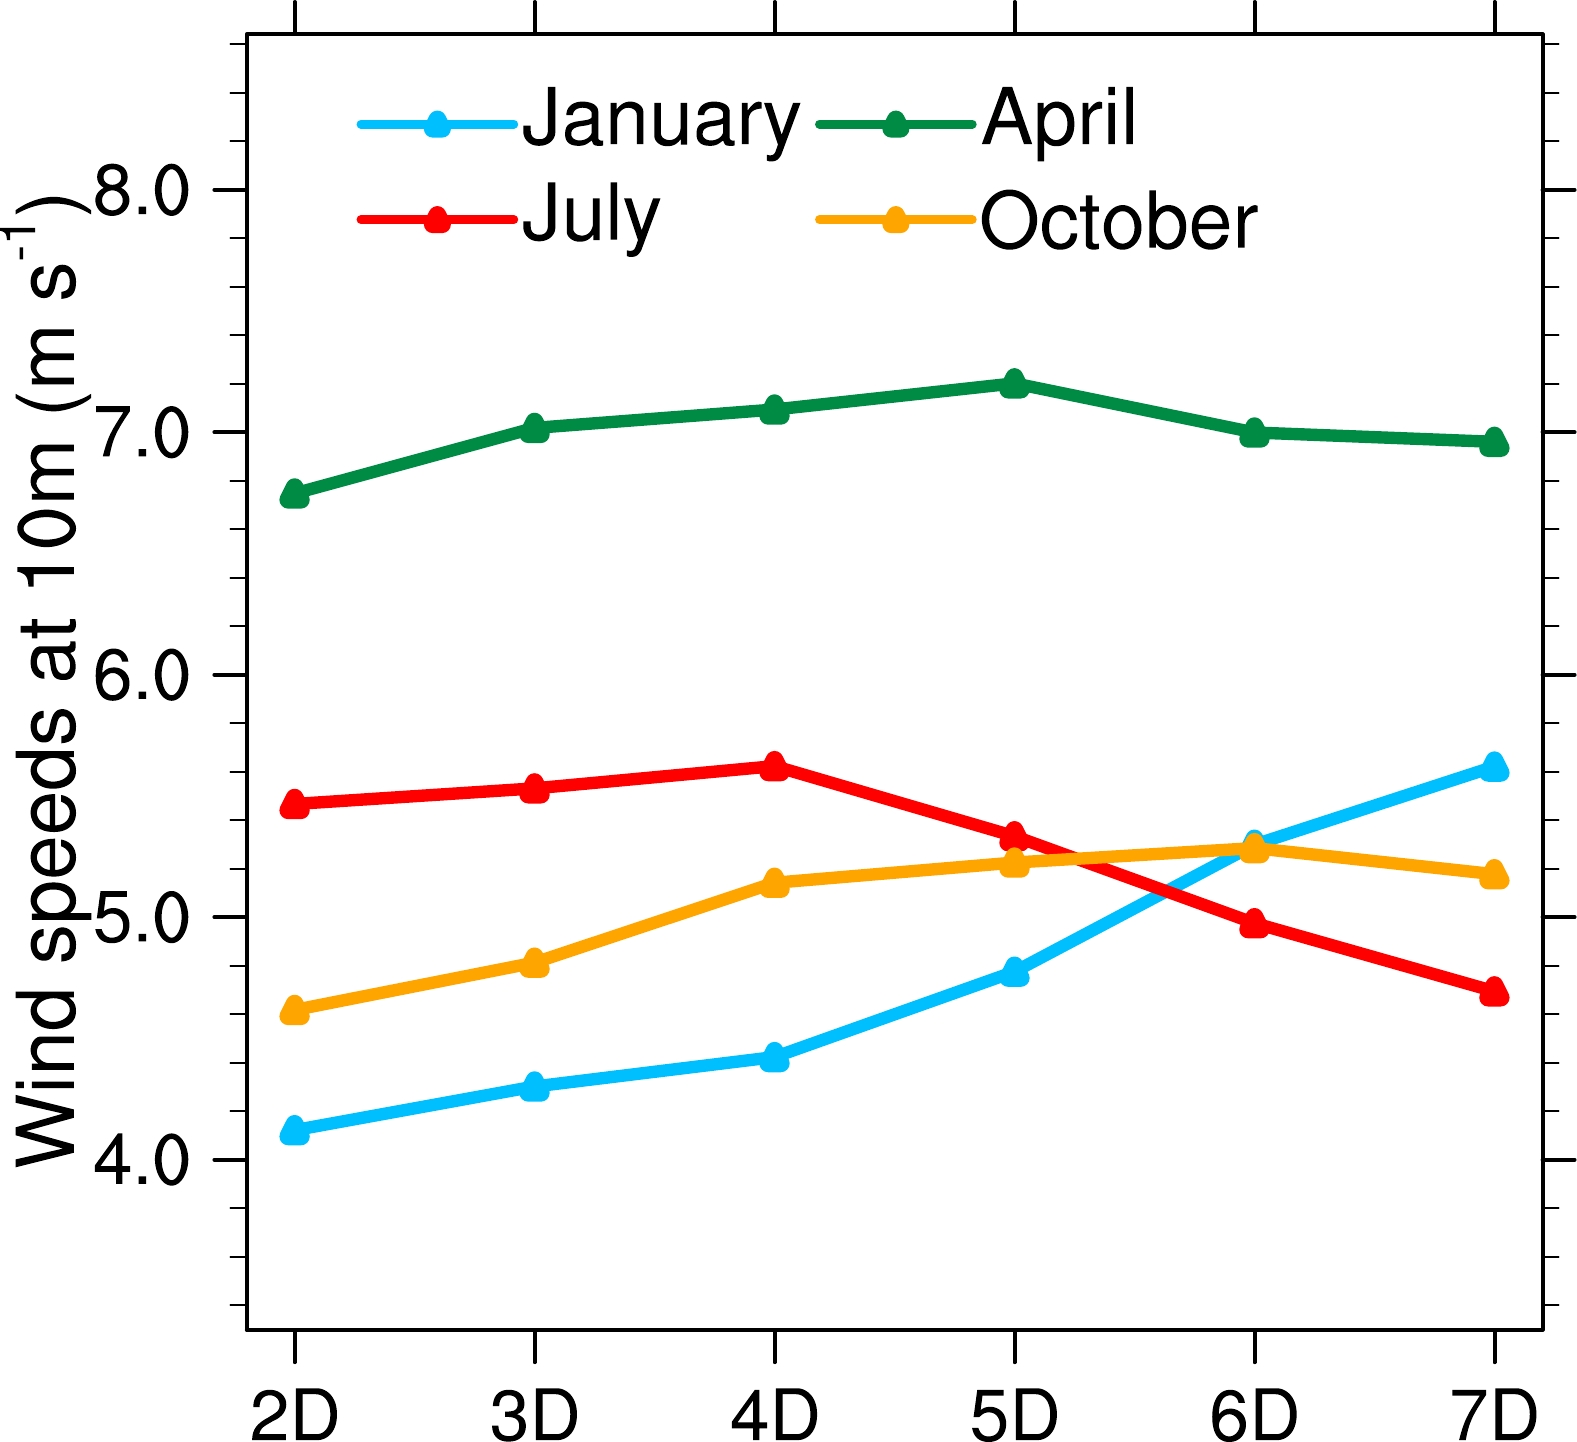
To further understand the seasonal characteristics of the forecasting uncertainties of surface PM2.5 concentrations due to increasing lead times, Fig. 4 shows the regional surface concentrations of PM2.5 compositions averaged over the plain areas of BTH for four seasons from the forecasts with different lead times. From the 2-Day forecast, in winter, anthropogenic primary particles dominate the total surface PM2.5, i.e., the masses of OC, BC, and OIN occupy ~70% of the total PM2.5 mass. The masses of anthropogenic secondary particles (i.e., nitrate, sulfate, ammonia) occupy ~24%. These six species show similar trends with increasing lead time, which is also consistent with the pattern of total PM2.5 mass (Fig. 3). The change in surface PM2.5 with lead time corresponds well to the change in PBL height. Figure 5 shows the regionally averaged PBL heights over the plain areas of BTH for four seasons from the forecasts with different lead times. It is obvious that the PBL height increases after the 4-Day lead time in winter, which leads to a decrease in the forecasted surface anthropogenic primary and secondary particles and thus the total PM2.5 mass. In addition, the dry deposition rate also increases with lead time (Fig. 6), particularly after the lead time of 4 days, which also leads to a decrease in the surface concentrations of anthropogenic particles with lead time. In WRF-Chem, the dry deposition velocity of particles is proportional to the near-surface wind with a positive relationship (e.g., Wesely and Hicks, 1977; Peters and Eiden, 1992). Therefore, this change in the dry deposition rate results from the increase of the near-surface wind speed due to increased lead time (Fig. 7).
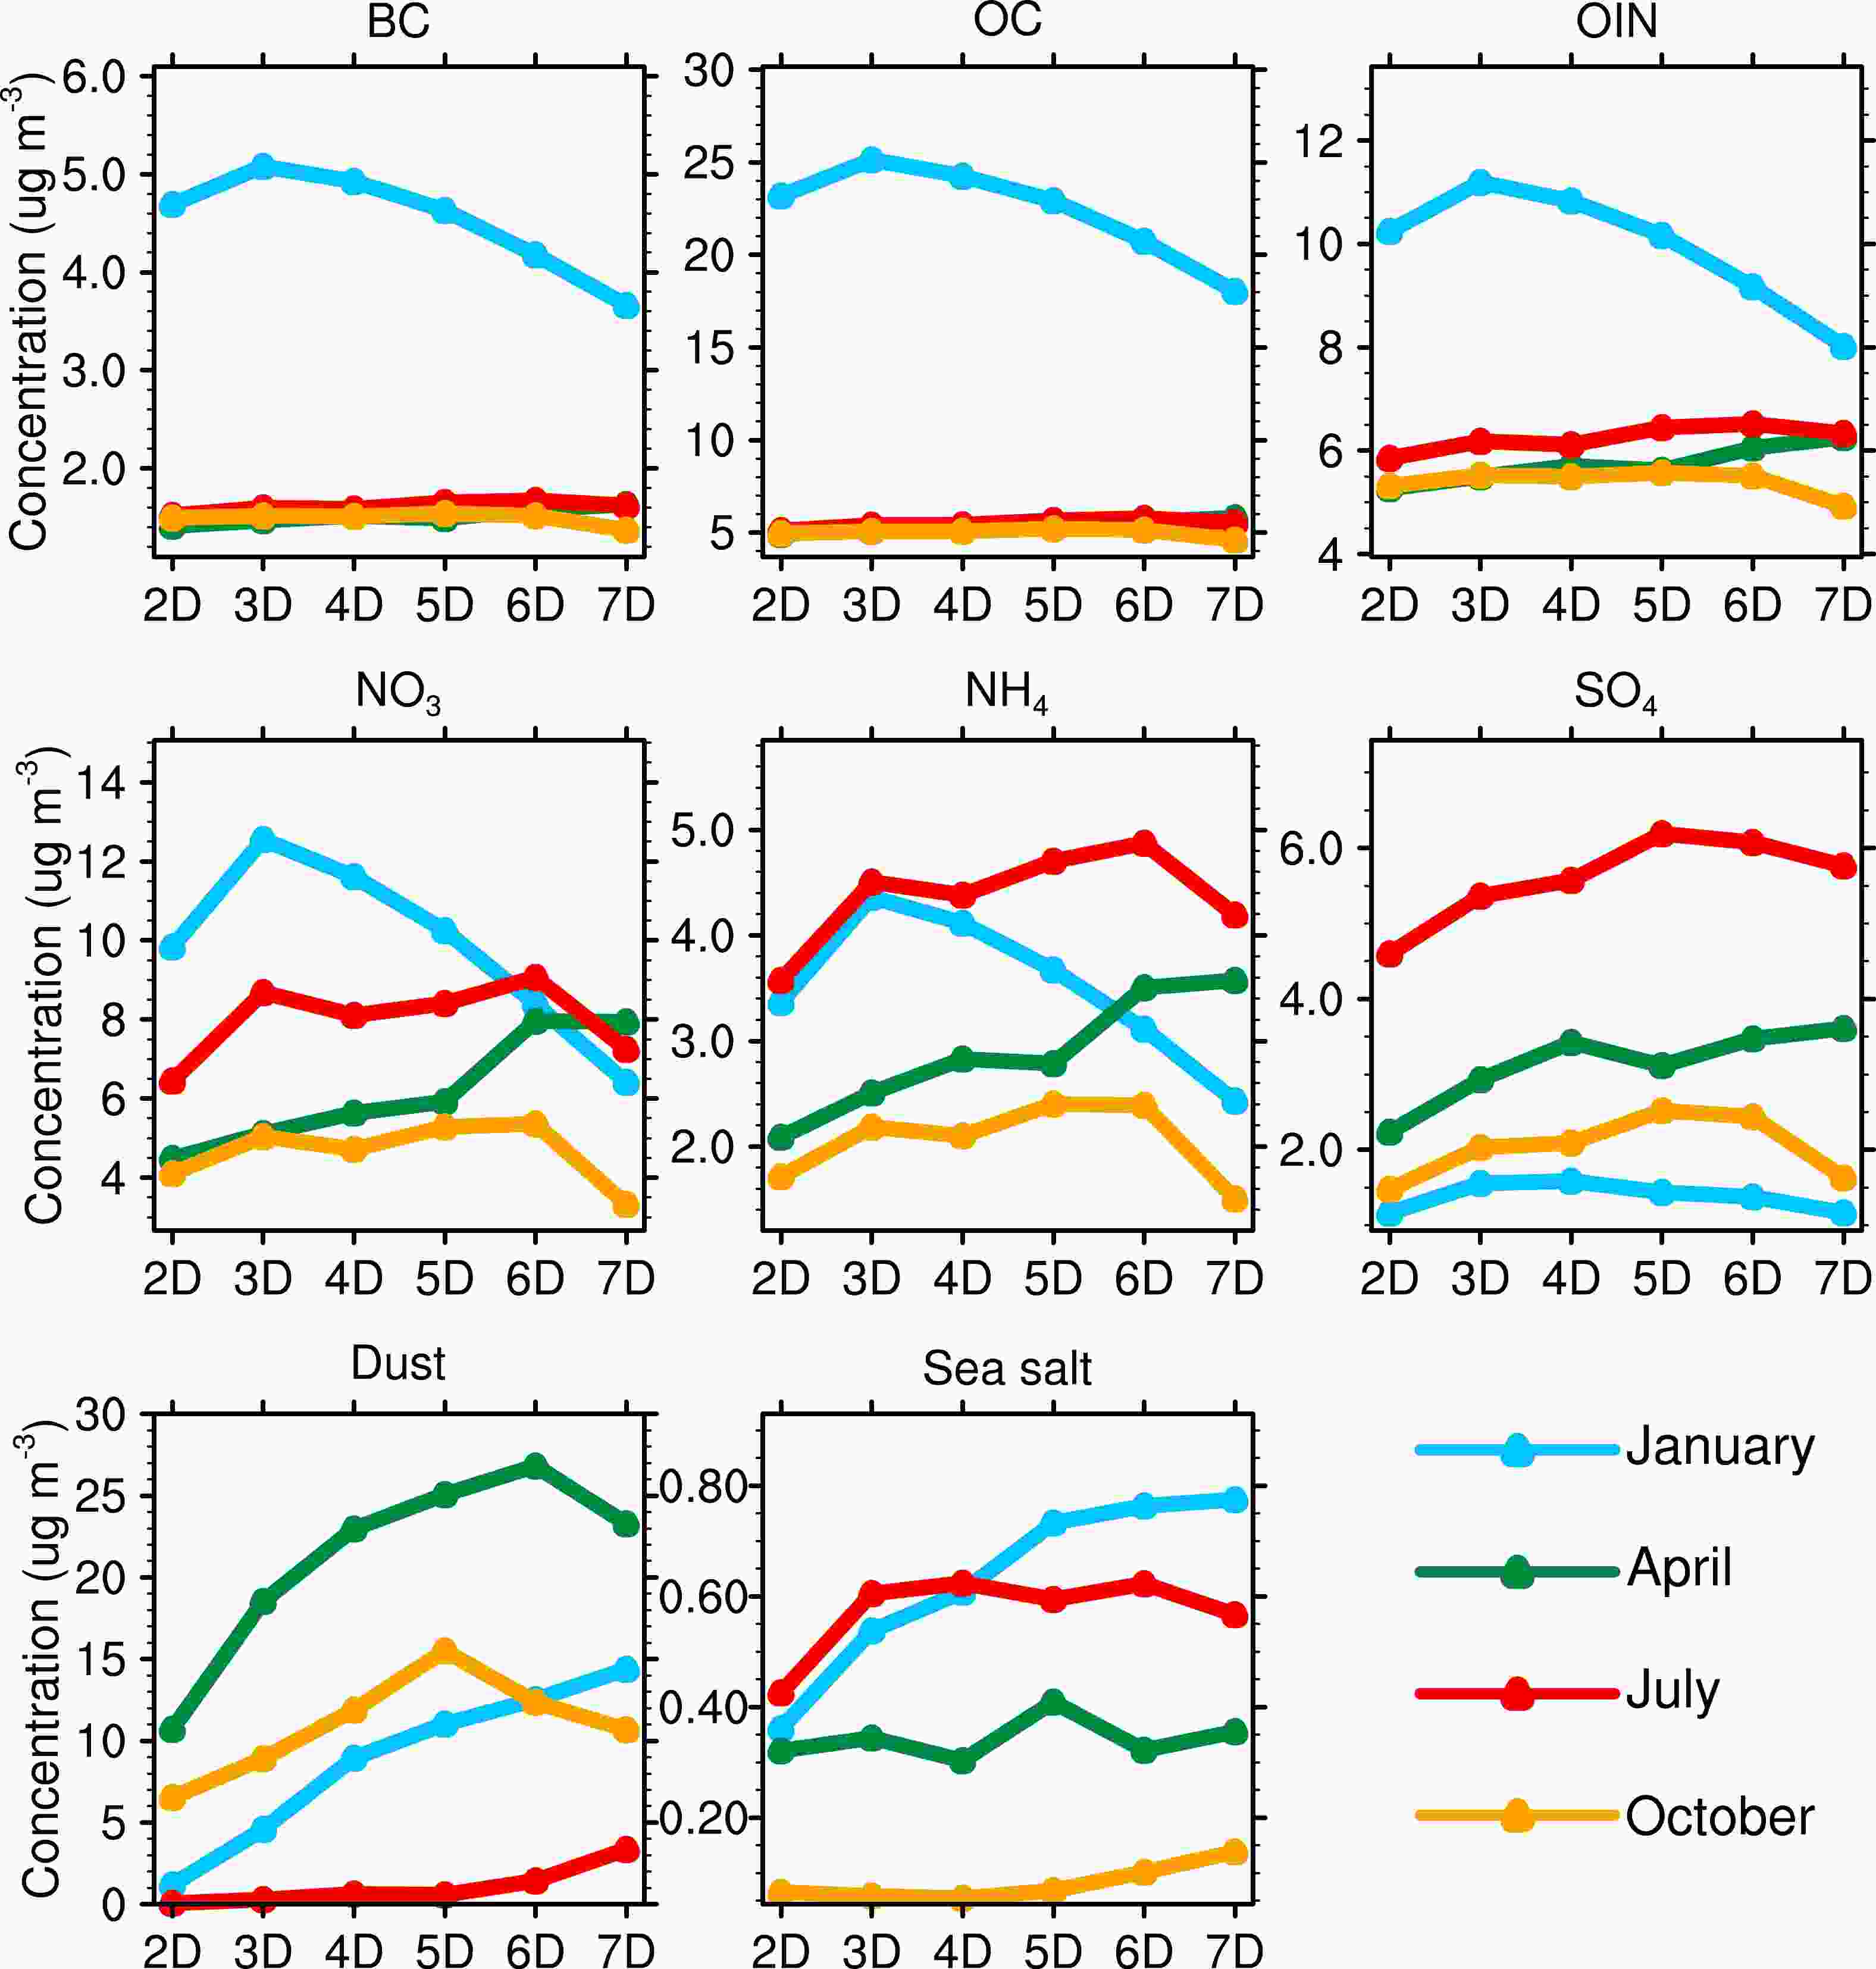
Figure 4. Monthly mean surface concentrations of PM2.5 compositions over the BTH region in January, April, July, and October of 2018 from the 2-Day to 7-Day forecasts.
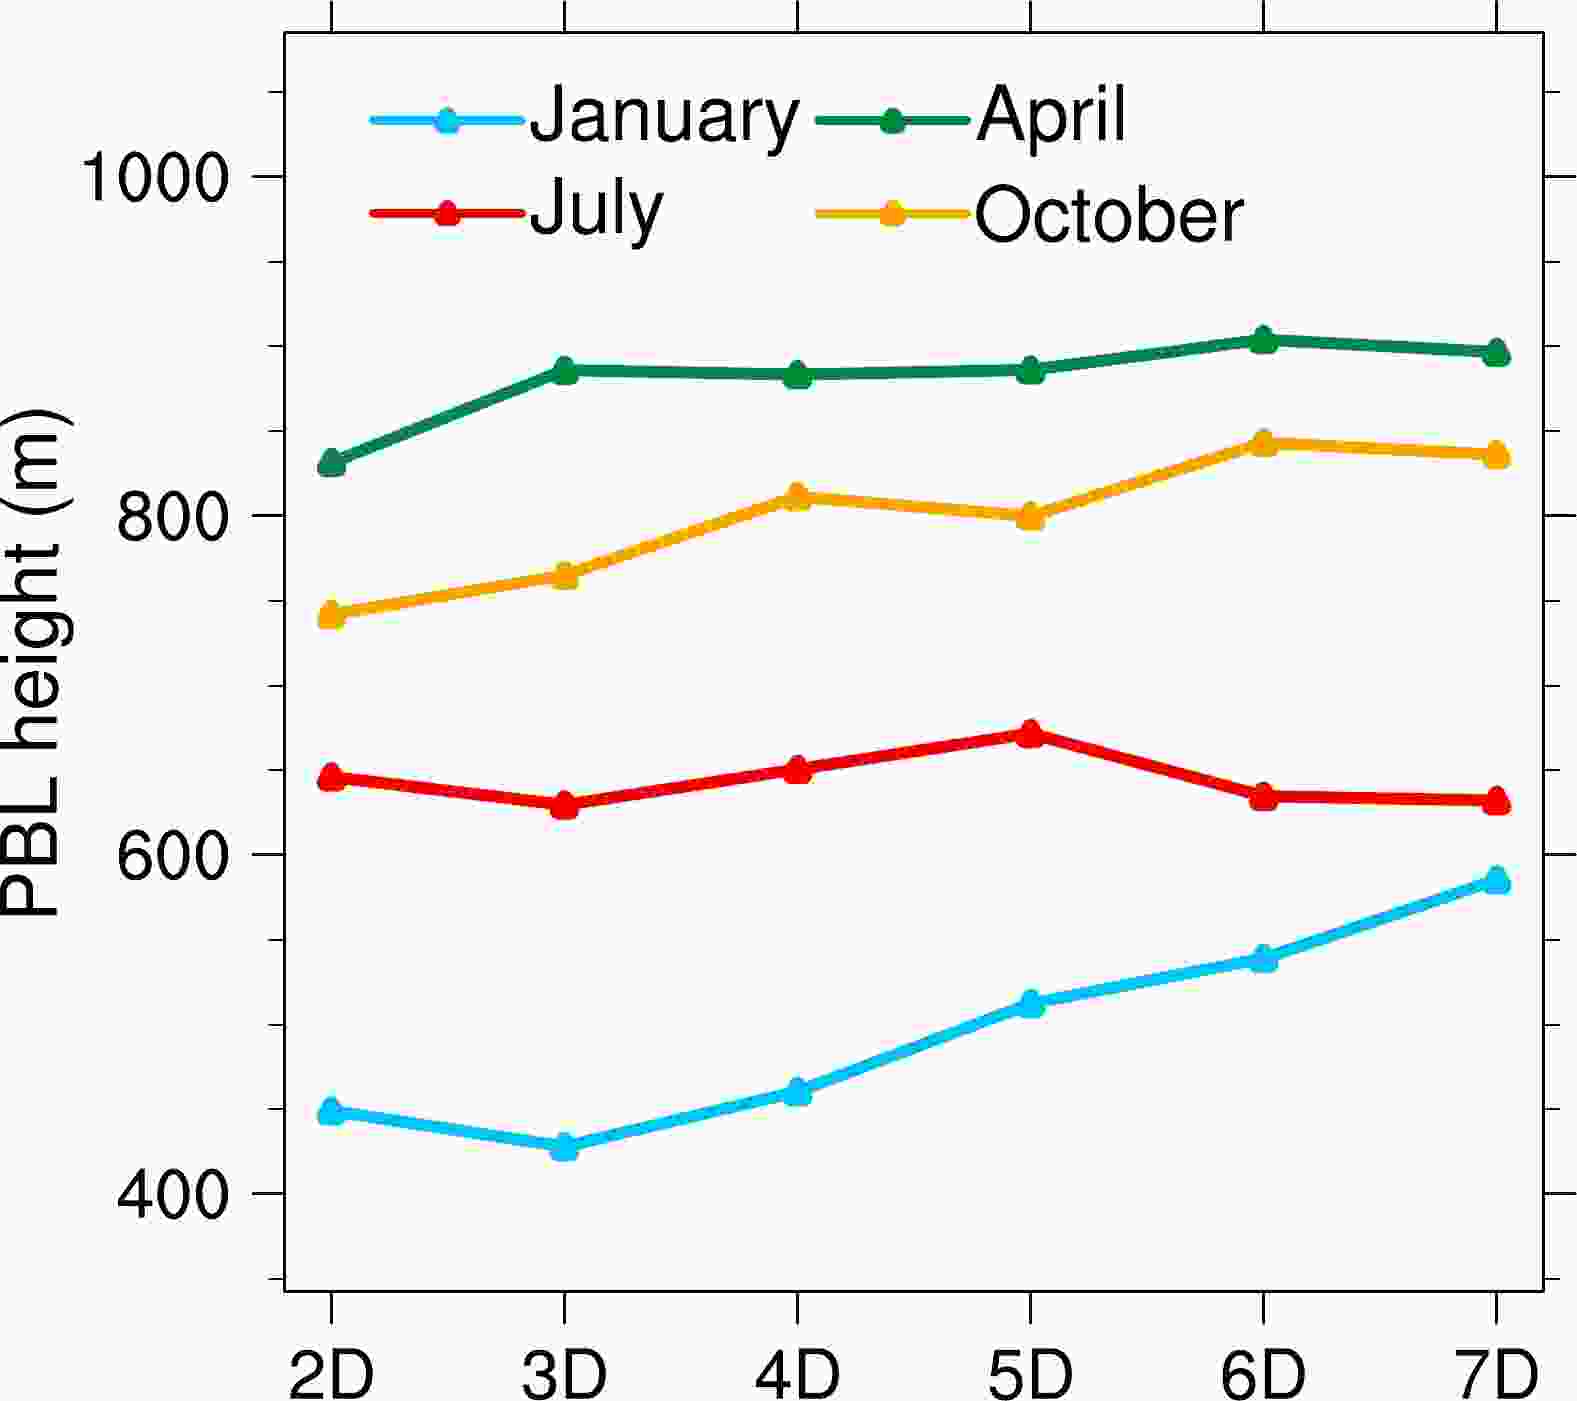
Figure 5. Monthly mean PBL heights over the BTH region in January, April, July, and October of 2018 from the 2-Day to 7-Day forecasts.
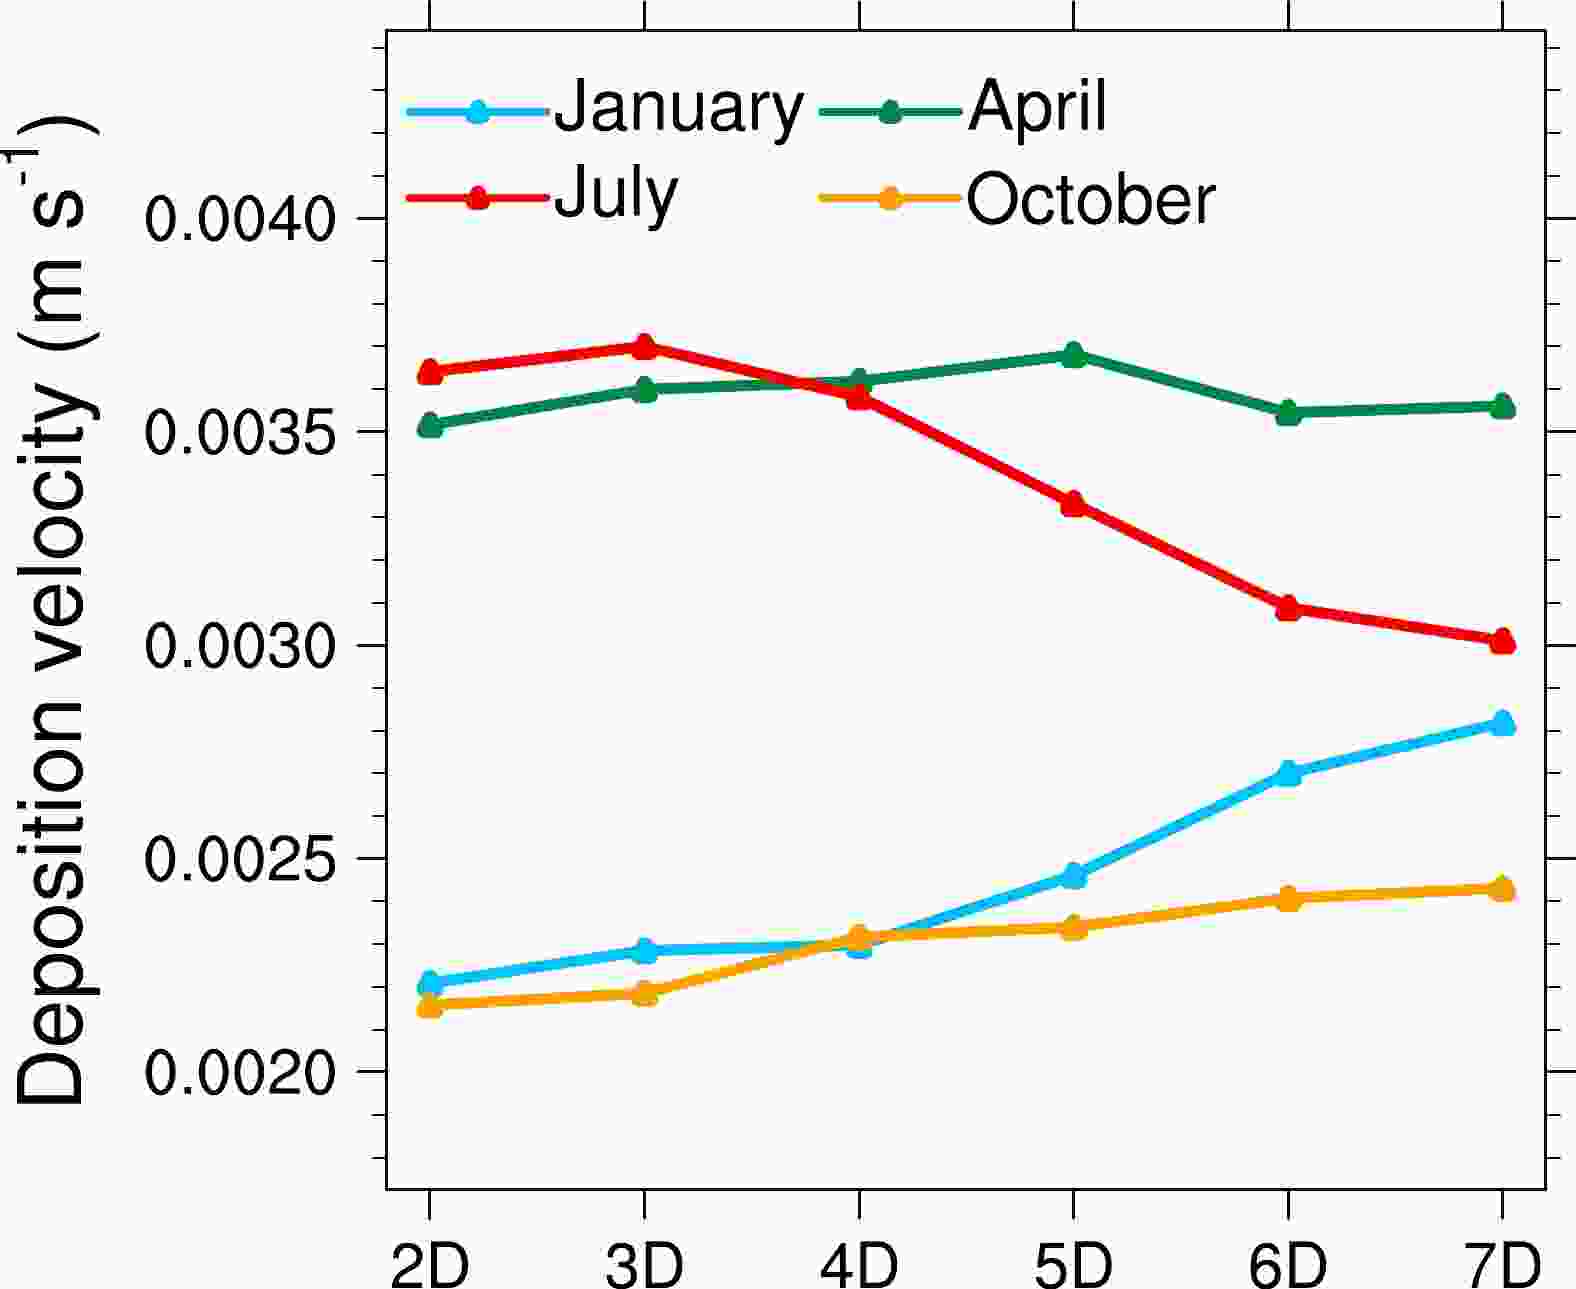
Figure 6. Same as Fig. 5, but for dry deposition velocity.
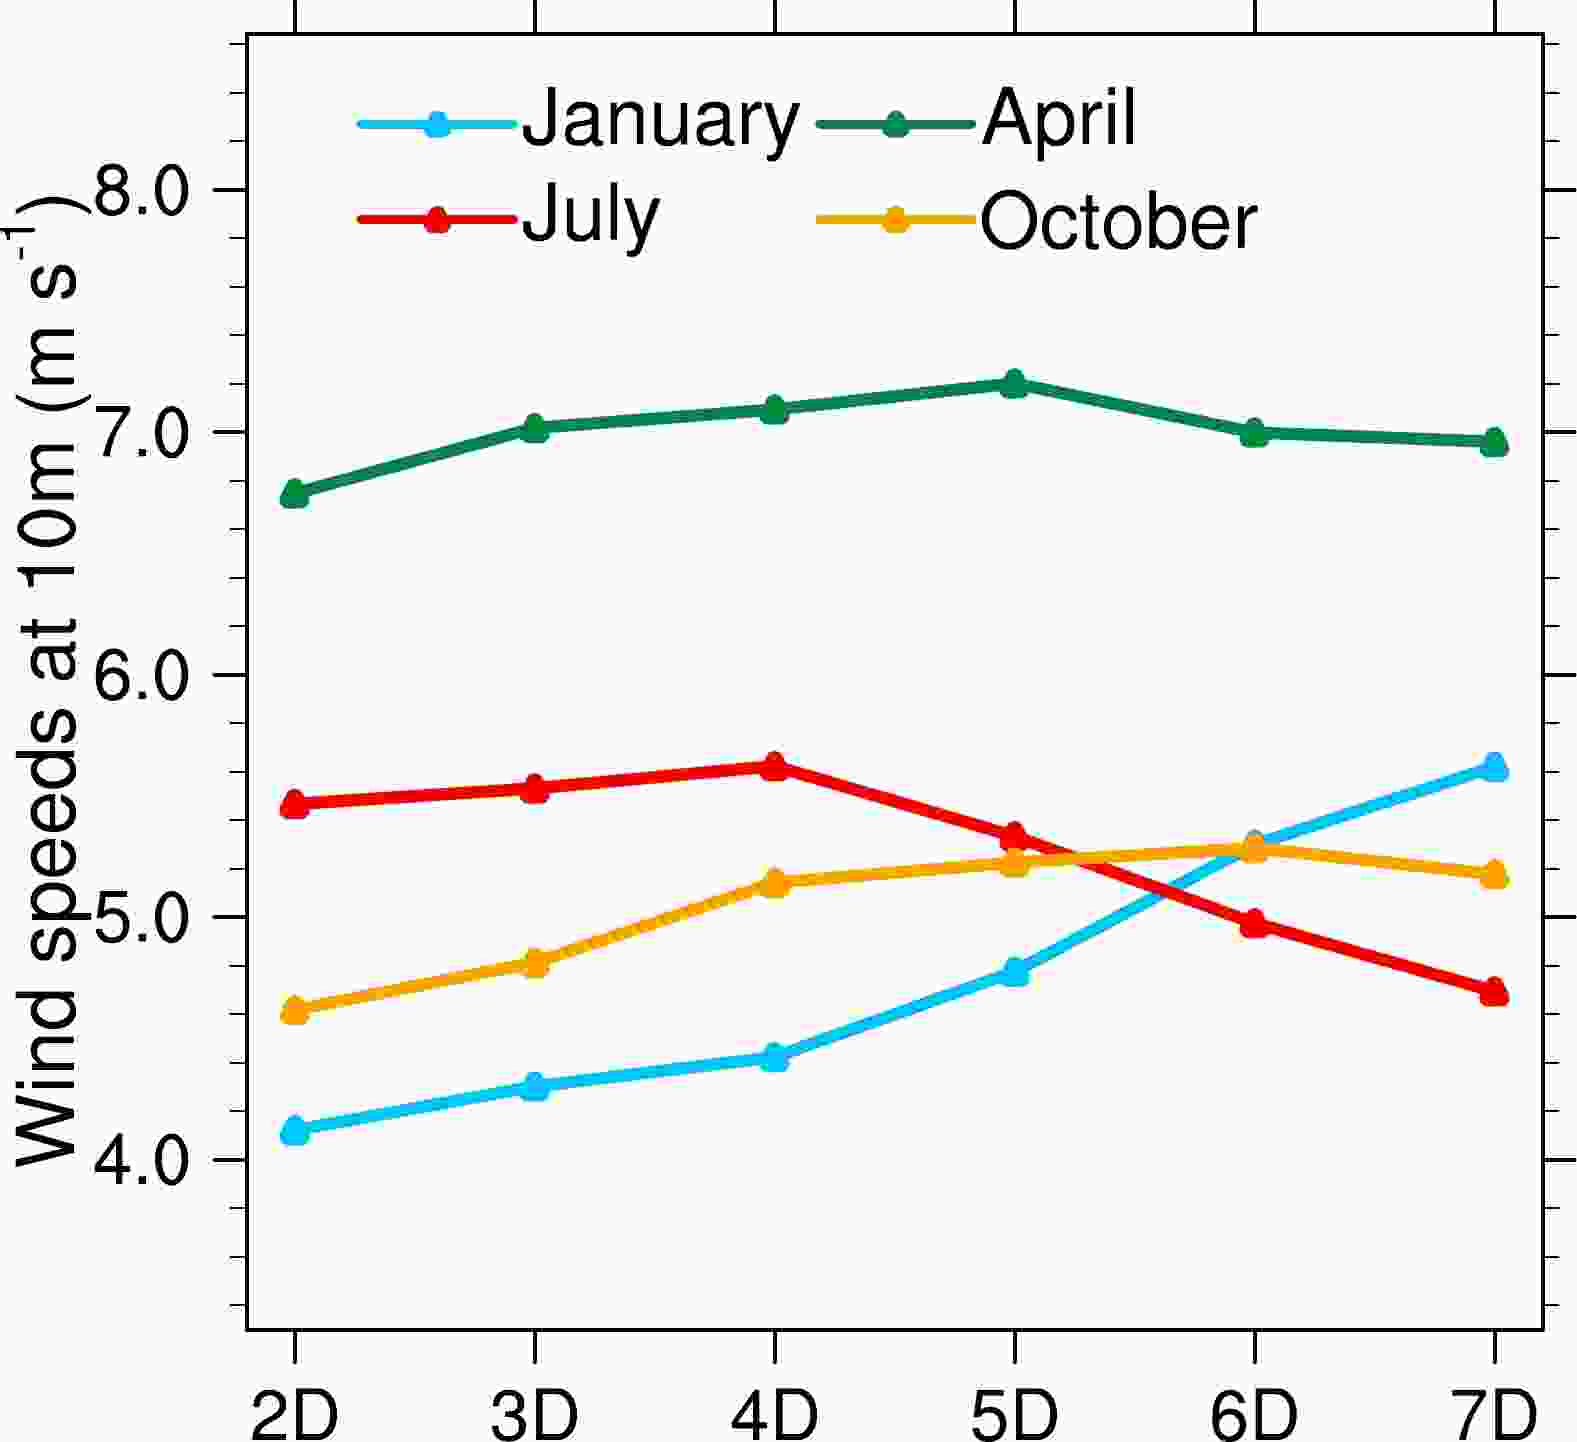
Figure 7. Same as Fig. 5, but for surface wind speeds.
It is also noteworthy that the mass of natural dust particles significantly increases with lead time from 1 μg m–3 in the 2-Day forecast to 15 μg m–3 in the 7-Day forecast, leading to a contribution from a negligible amount to almost 30%. Figure 8 shows the spatial distributions of the 700-hPa wind fields for the four seasons from the forecasts with different lead times. Over the plains area of BTH region, natural dust is mainly transported from the northwest. It is obvious that northwesterly winds become stronger with increasing lead time in winter, which leads to an increase in the long-range transport of dust.
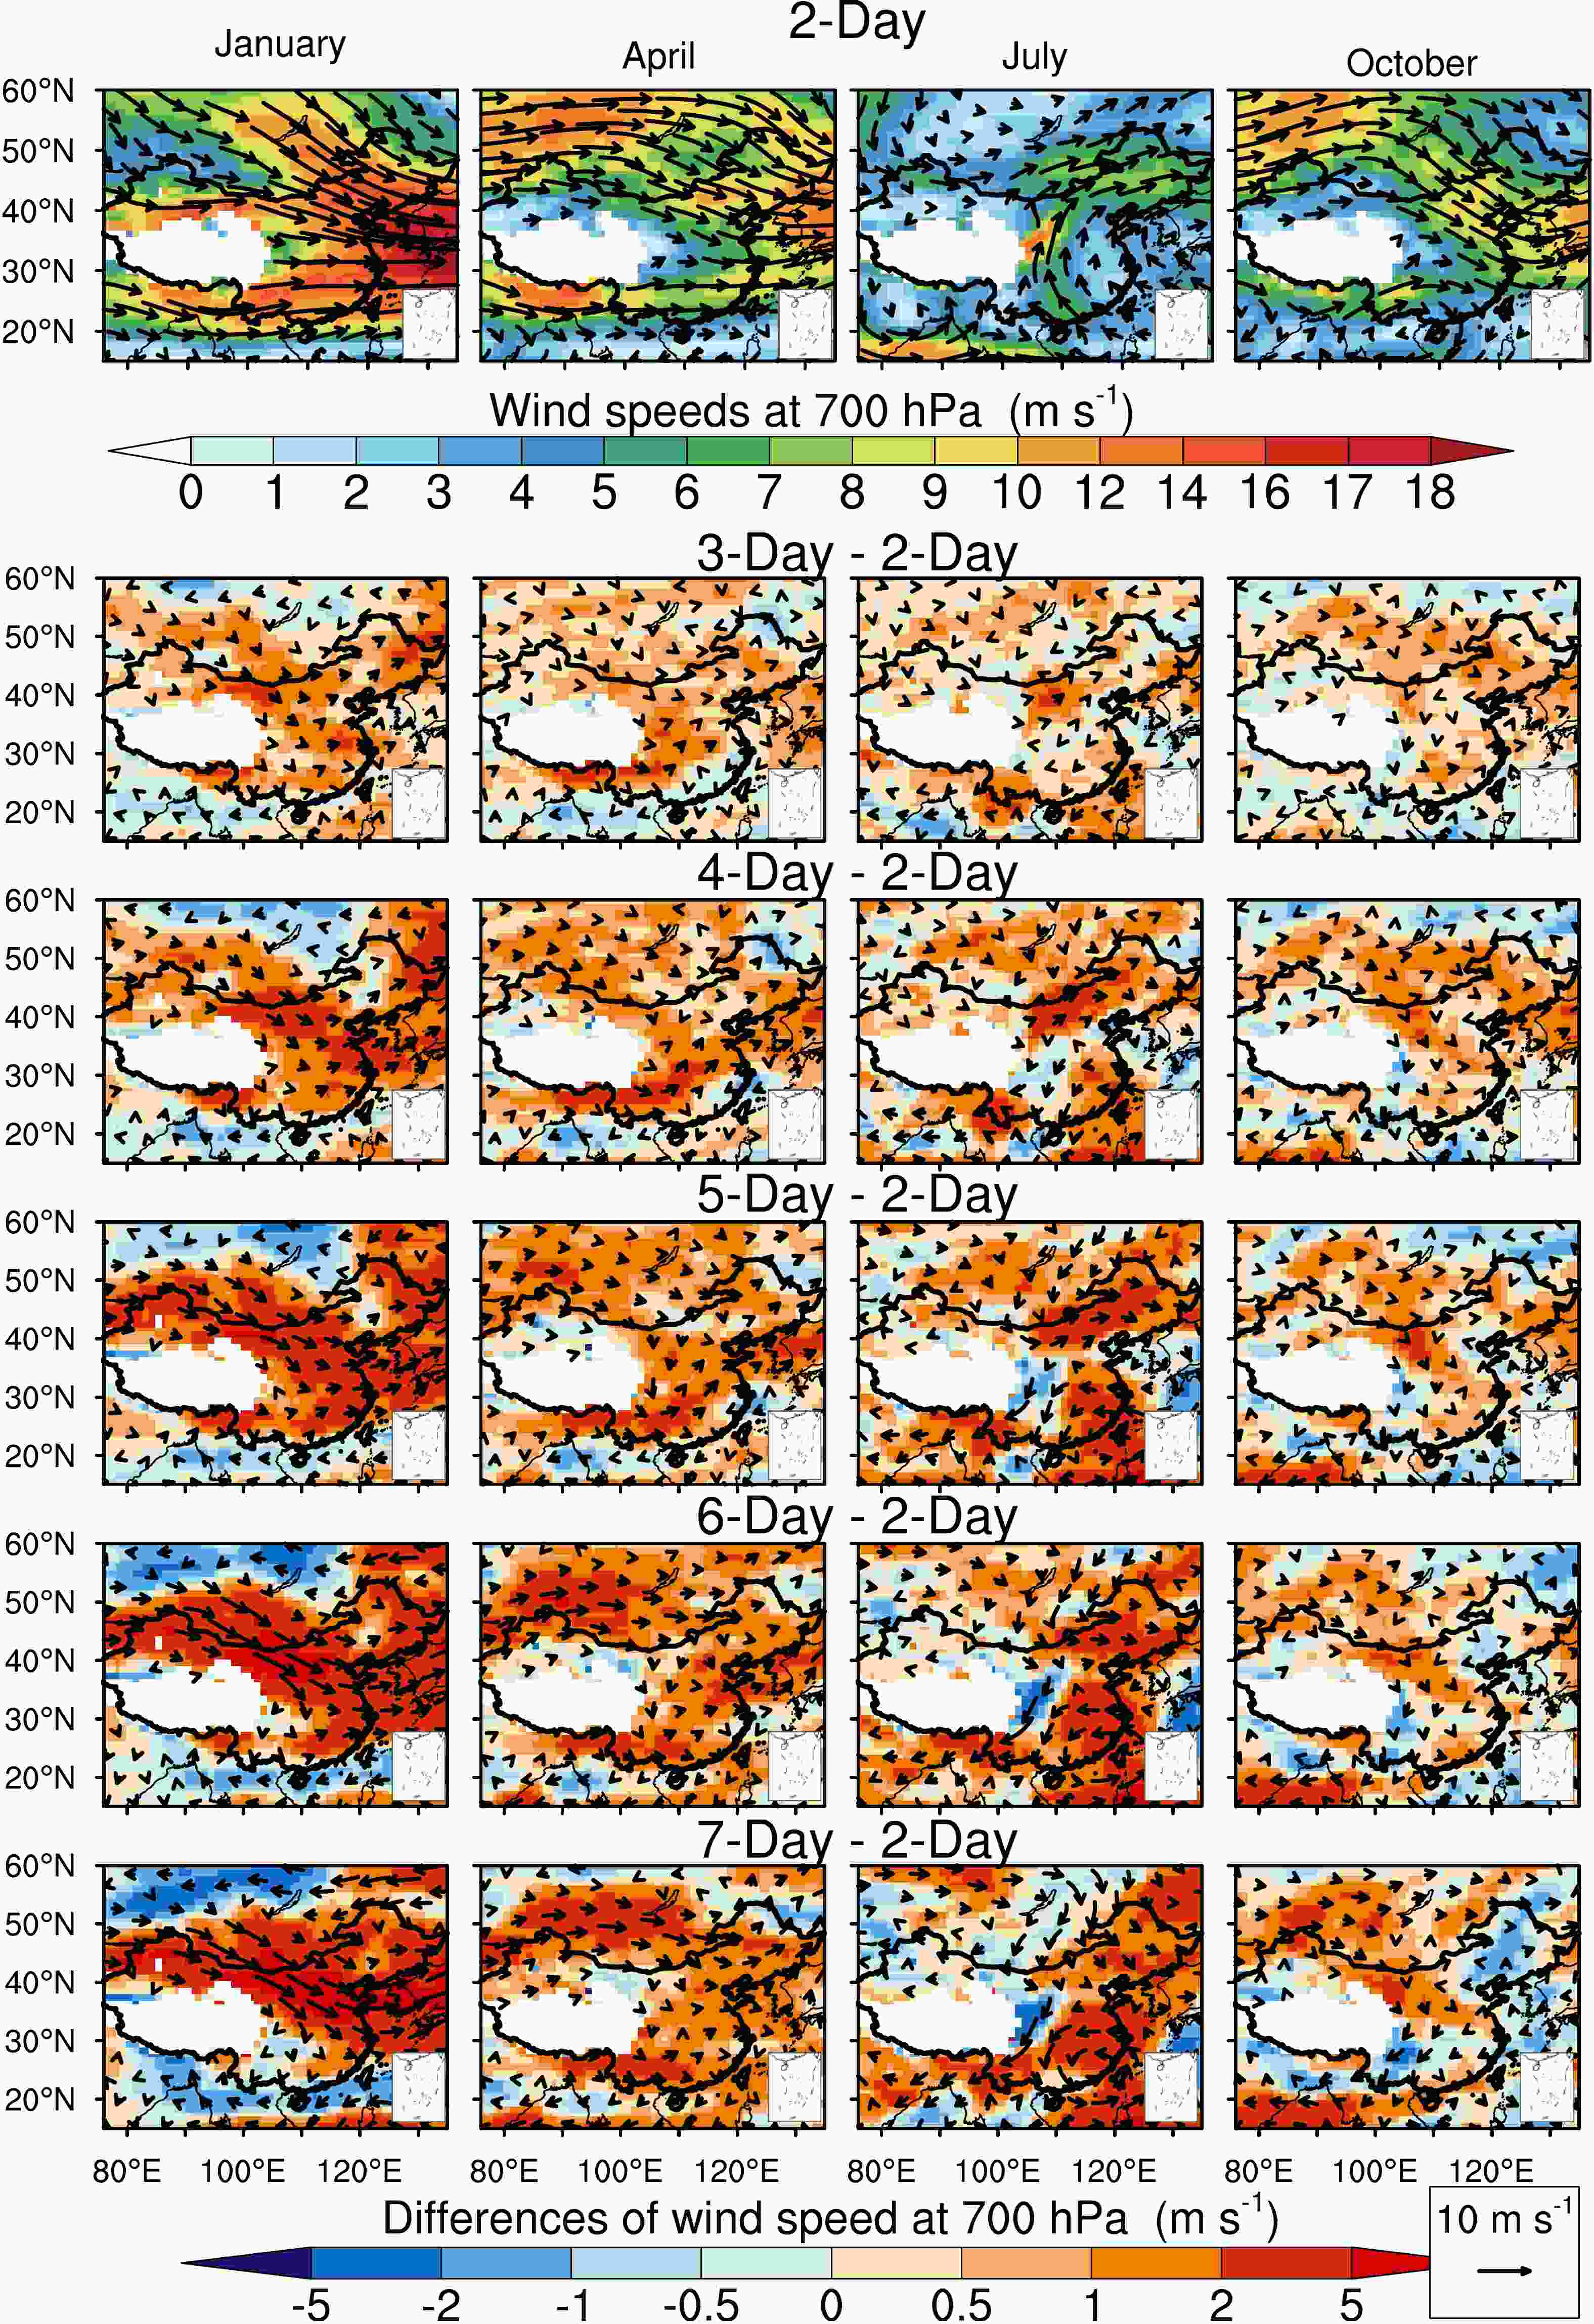
Figure 8. Spatial distribution of 700-hPa wind circulations in the 2-Day to 7-Day forecasts in January, April, July, and October of 2018.
In spring, like summer and autumn, the surface concentrations of anthropogenic primary particles are much lower than those in winter. This is due to much lower emissions in seasons other than winter, particularly for OC and BC (Fig. S8 in the ESM). The masses of these three anthropogenic primary species occupy approximately 30% of the total surface PM2.5 mass from the 2-D forecast. Natural dust and anthropogenic secondary particles each contribute one-third to the total surface PM2.5 mass in the 2-D forecast. With increased lead time, the masses of anthropogenic primary species slightly increase, corresponding to the small variation in PBL height, while the masses of natural dust and anthropogenic secondary particles increase more significantly. The total mass of anthropogenic secondary particles increases from 9 μg m–3 in the 2-Day forecast to 15 μg m–3 in the 7-Day forecast. The change in near-surface temperature is relatively small, corresponding to increased lead time (Fig. 9), which should have a small impact on the production of secondary particles. This increase in anthropogenic secondary particles is likely due to condensation formation over the increase in the existing particle surface area from natural dust. The mass of natural dust significantly increases from 10 μg m–3 in the 2-Day forecast to more than 20 μg m–3 in the 7-Day forecast, which is the result of stronger northwesterly winds with increased lead time in spring (Fig. 8). The change in the dry deposition rate due to the increased lead time is also small. Therefore, the impacts of increased lead time on the forecasted surface PM2.5 concentrations in spring are mainly a consequence of its impact on the large-scale circulation and thus on the long-range transport of dust, which can further induce changes in the production of anthropogenic secondary particles.
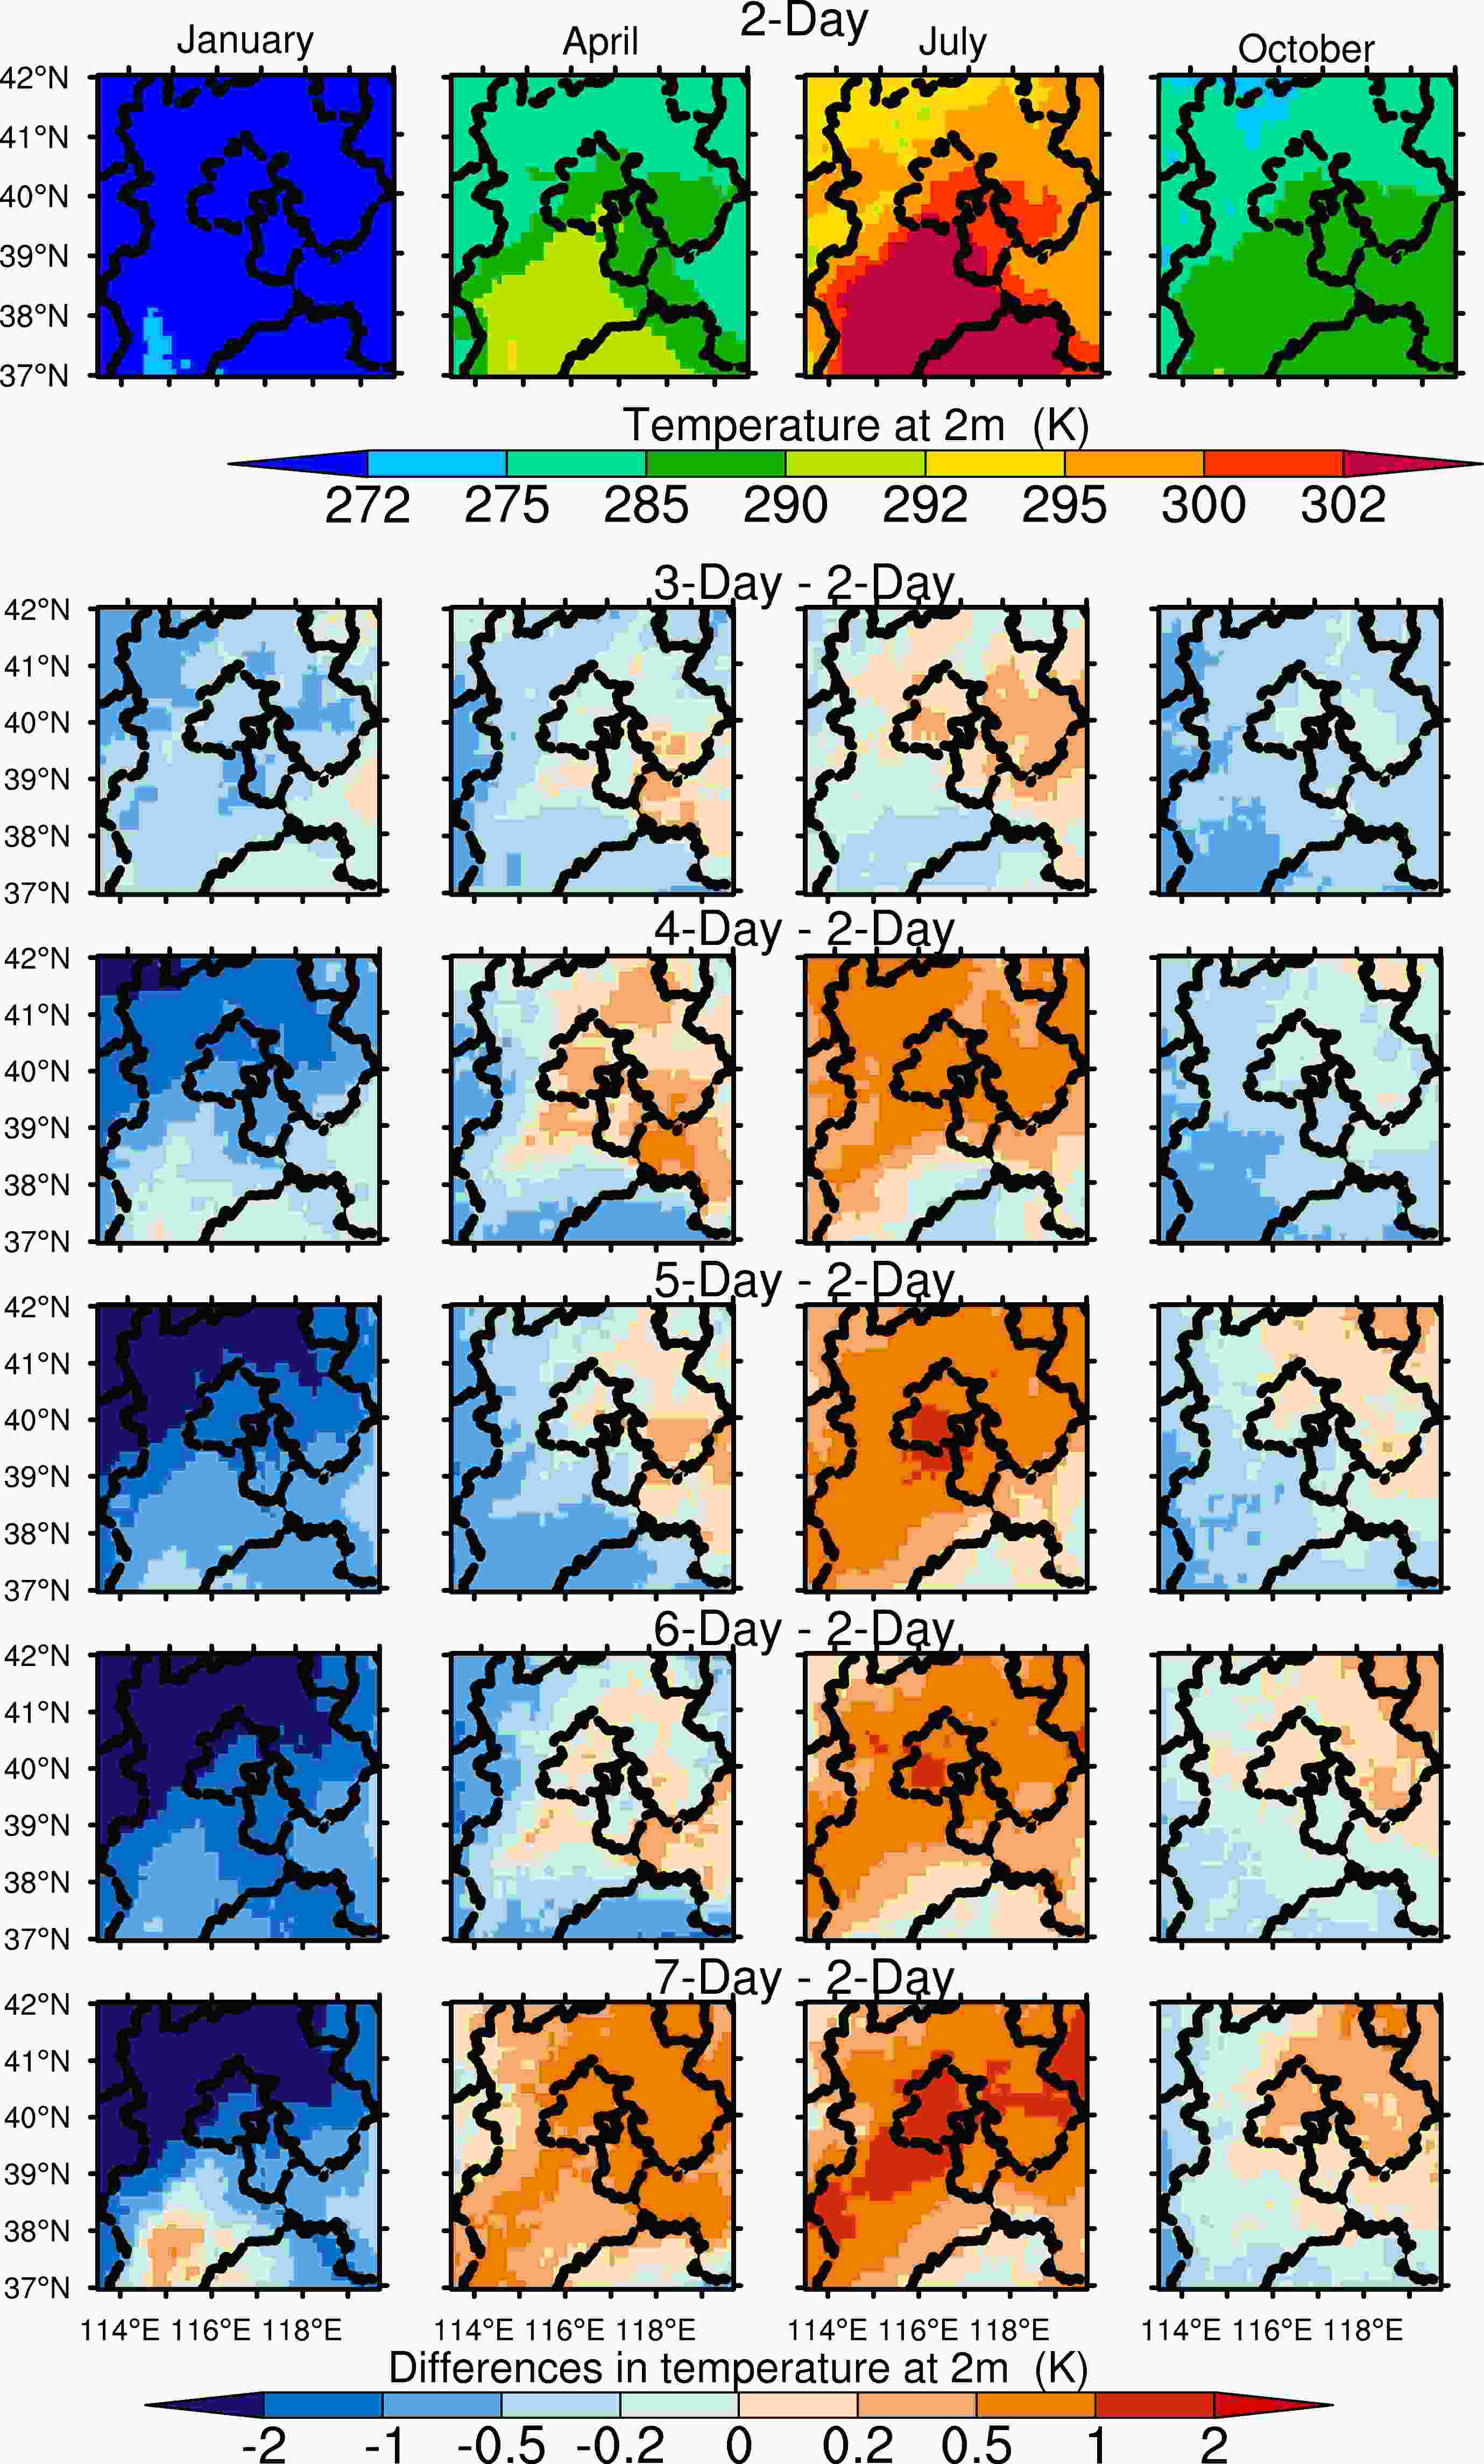
Figure 9. Spatial distribution of 2-m temperature from the 2-Day to 7-Day forecasts in January, April, July, and October of 2018.
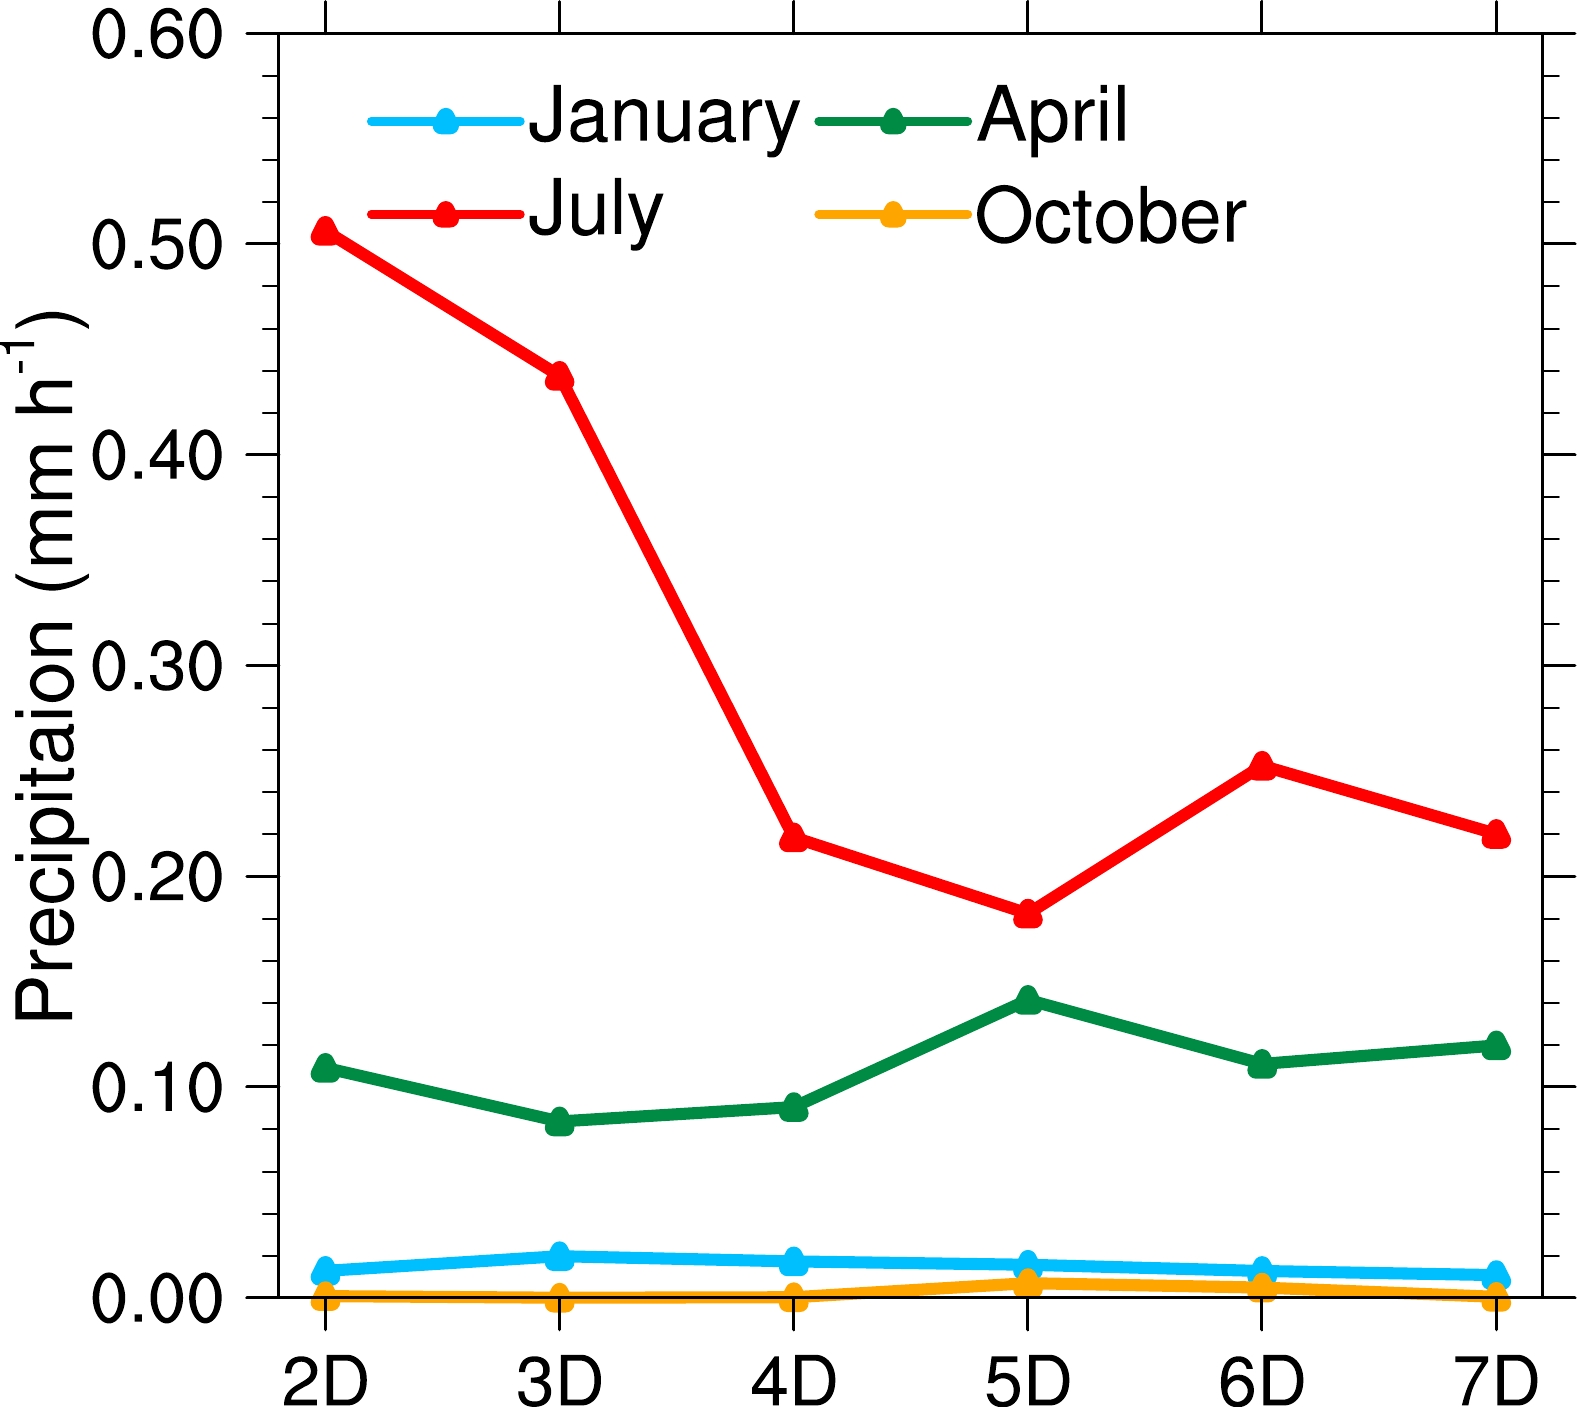
In summer, the total mass of surface PM2.5 is the lowest among the four seasons (Fig. 3). Anthropogenic primary and secondary particles occupy approximately 40% and 60% of the total surface PM2.5 mass in the 2-Day forecast respectively (Fig. 4). With the increased lead time, the slight increase in the total surface PM2.5 mass mainly results from the increase in anthropogenic secondary particles. The increase in total mass in the 6-Day and 7-Day forecasts also partially comes from the slight increase in natural dust. In general, the PBL height varies only slightly and should have a relatively small impact in summer (Fig. 5). This increase in the surface mass of particles may correspond to the decrease in the dry and wet deposition rates (Fig. 6), which results from the decrease in the near-surface wind speed and precipitation rate with increased lead times (Figs. 7, 10). Therefore, the impacts of increasing lead time on the forecasted surface PM2.5 concentrations in summer are mainly through its impacts on near-surface wind and precipitation and thus the dry and wet deposition rates.

Figure 10. Same as in Fig. 5, but for precipitation.
In autumn, along with increasing lead time, the total surface PM2.5 mass increases in the 2-Day to 5-Day forecasts and then decreases in the 6-Day to 7-Day forecasts (Fig. 3). The overall change in total surface PM2.5 mass with lead time is mainly due to the change in natural dust (Fig. 4). Part of the increase in surface PM2.5 mass in the 2-Day to 5-Day forecasts is also from anthropogenic secondary particles, which is also partly related to condensation formation over the increased surface area of the existing particles from natural dust. In the 2-Day to 5-Day forecasts, the change in anthropogenic primary particles is very small, although the PBL height and dry deposition rate change slightly with the lead time. In the 5-Day to 7-Day forecasts, the change in the circulation pattern, particularly over the northern part, leads to a decrease in the surface concentrations of all components. The contribution analysis of the transport process by Du et al. (2020) shows that the contributions of the transport process to the surface concentrations of all the compositions decrease from 5-Day to 7-Day lead times (Fig. 11). Therefore, the impacts of increased lead time on the forecasted surface PM2.5 concentrations in autumn are mainly through its impact on the large-scale circulations, which, on the one hand, can play a role in transporting natural dust into the region and, on the other hand, ventilating the particles out of the region.
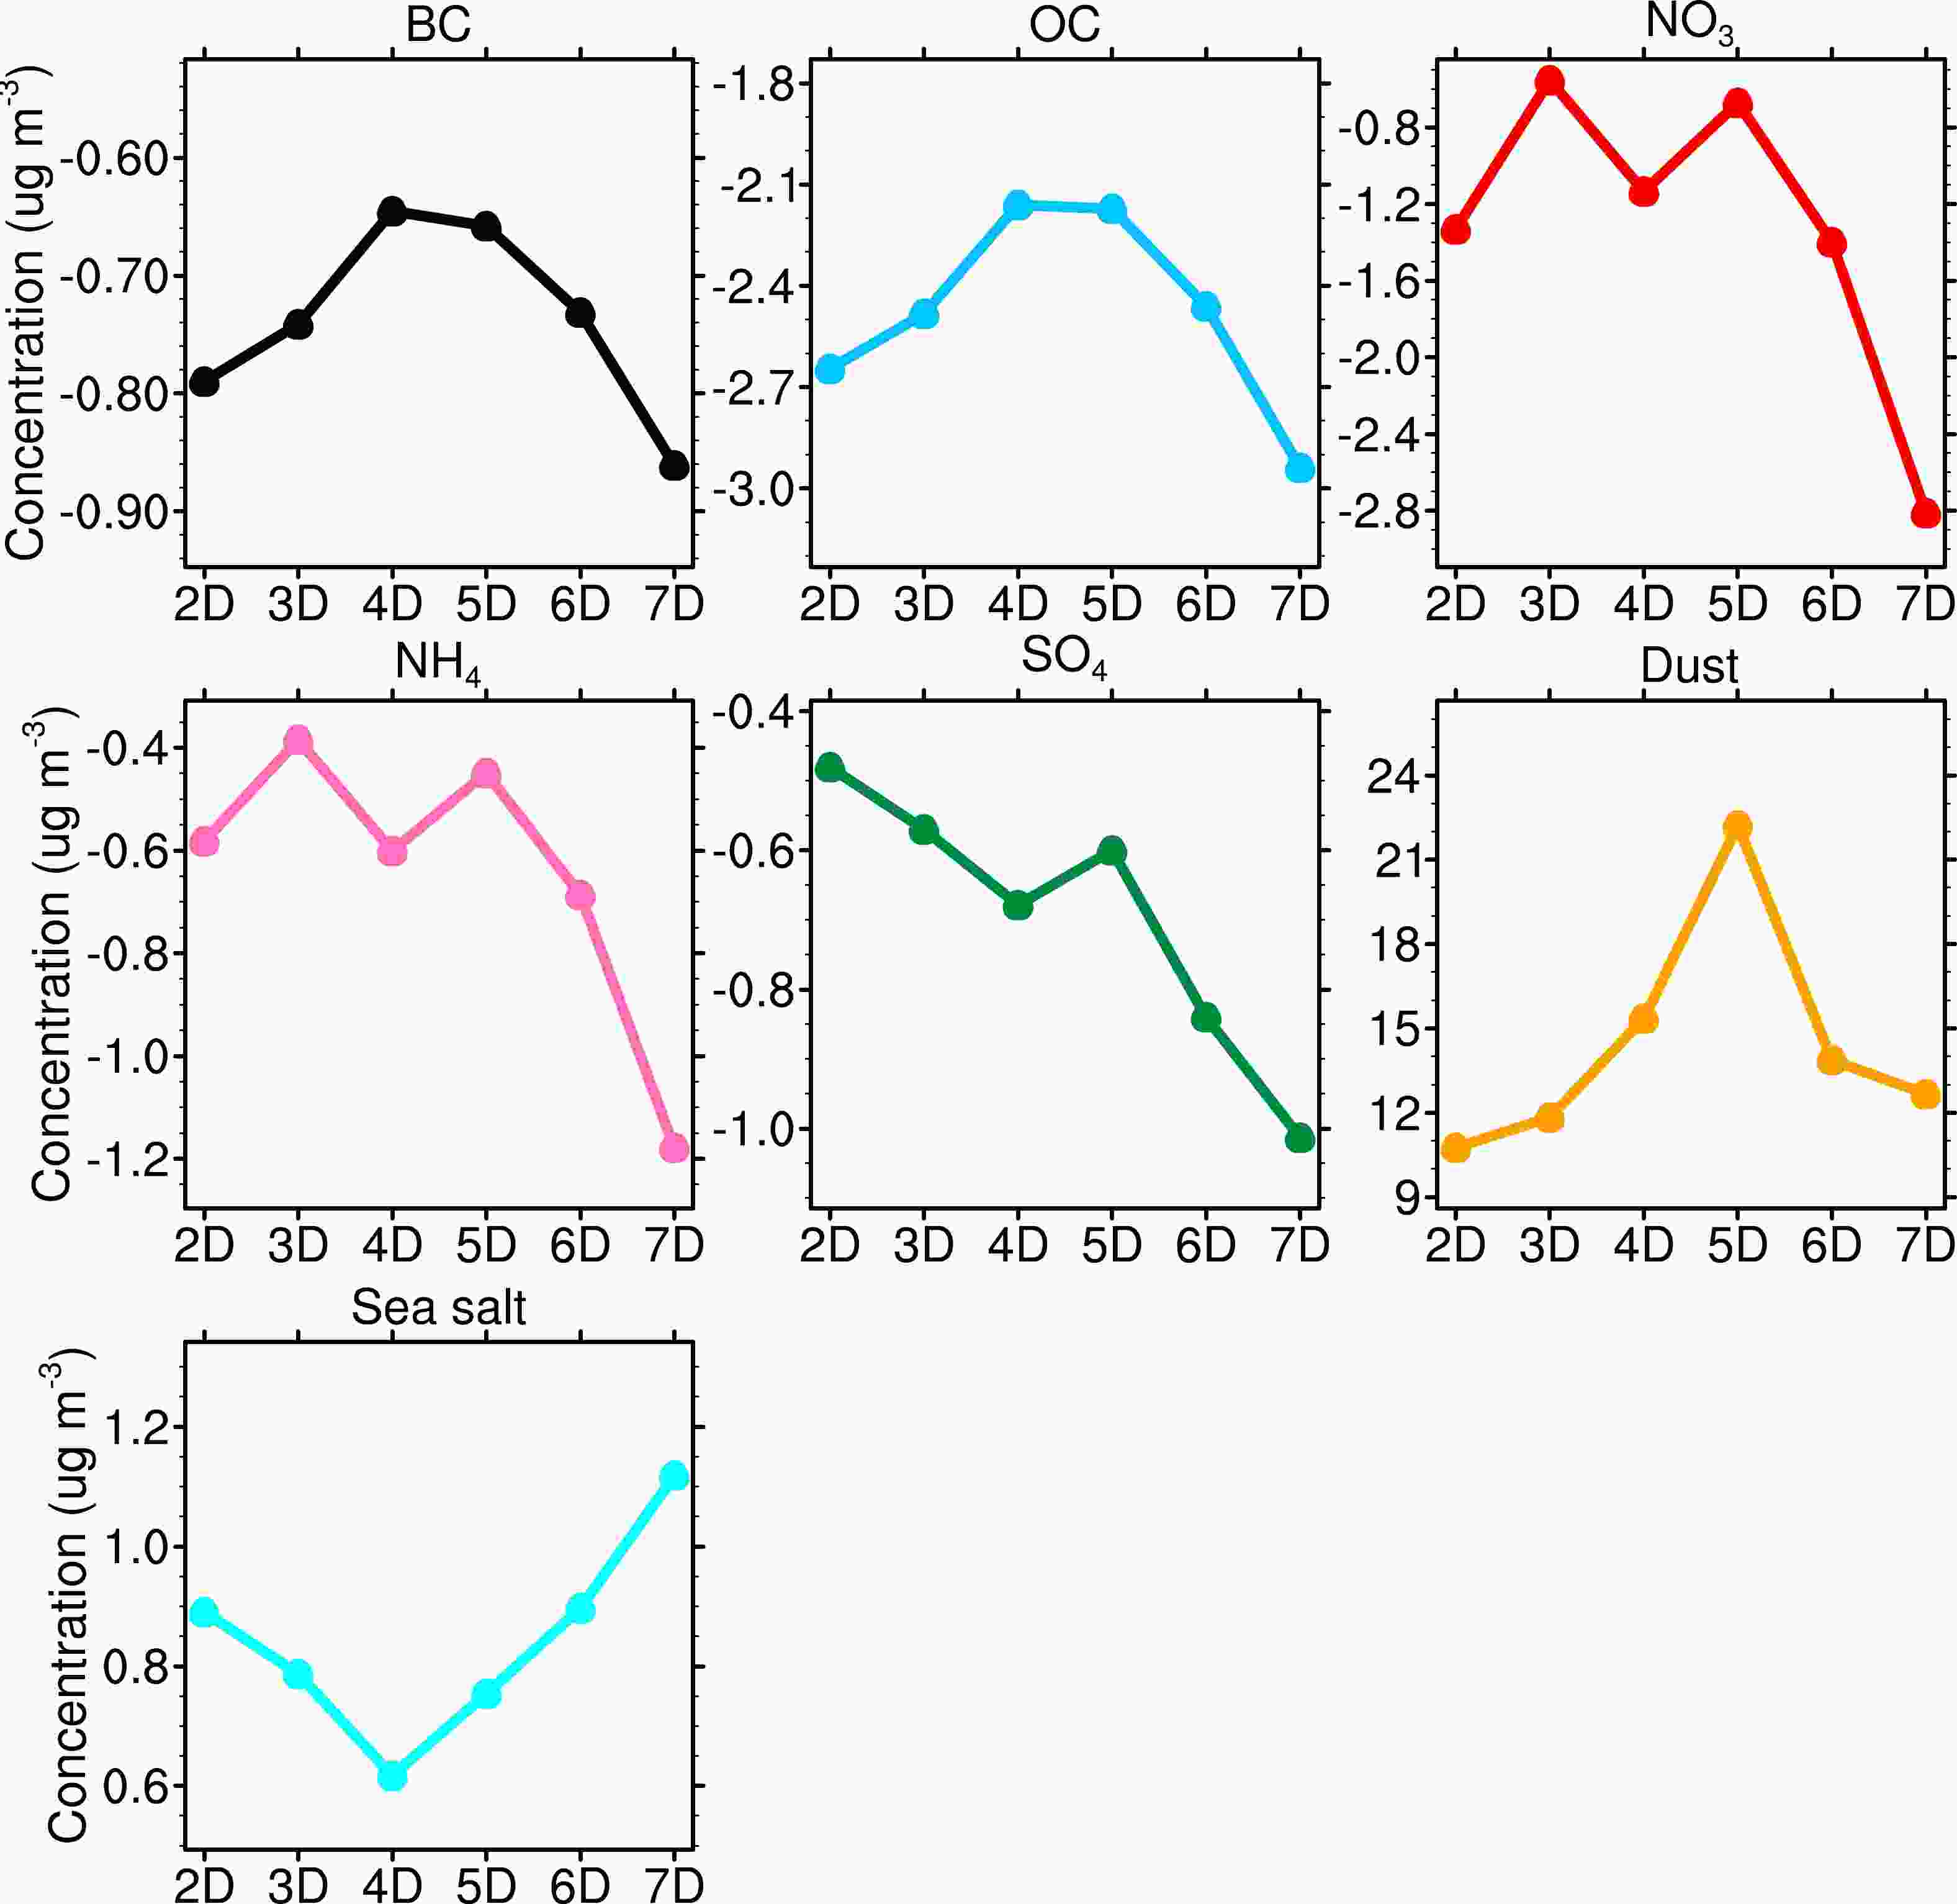
Figure 11. Monthly mean contributions of transport processes to surface concentrations of PM2.5 compositions over the BTH region in October 2018 from the 2-Day to 7-Day forecasts.
-
As analyzed above, this study focuses on investigating the impacts of forecast lead time at a seasonal scale. However, the important role of lead time in forecasting typical synoptic weather and haze events has also been reported by many studies (Zhang et al., 2007; Keil et al., 2020; Gvoždíková and Müller, 2021; Ulpiani et al., 2022; Hochman et al., 2023). Here, a precipitation event (15 October to 17 October) and a haze event (8 April to 10 April) are selected to show the effect of forecast lead time on typical events. As shown in Fig. S4 in the ESM, the forecasted precipitation of the 2-Day forecast increases from 1500 UTC on 15 October, peaks at 0.45 mm h–1 at 0200 UTC on 16 October, and lasts until 1800 UTC on 16 October. As the lead time increases, the intensity of precipitation noticeably decreases, and the time of peak precipitation shifts gradually. Ultimately, this precipitation event is entirely absent in the 7-Day forecast. The spatial distribution of precipitation at 850 hPa at 0200 UTC on 16 October, the time of peak precipitation, undergoes significant changes (Fig. S5 in the ESM). These changes in intensity and spatial distribution of the predicted precipitation are caused by the movement and strength of the convergence of the 850-hPa wind field with increased lead time. The changes in precipitation weaken the contributions of wet deposition with increasing lead time (Fig. S4b). This ultimately leads to a considerable increase in PM2.5 concentrations, which rises almost threefold from the 2-Day (around 40 μg m–3) to the 7-Day (roughly 120 μg m–3, Fig. S4c).
As shown in Fig. S6 in the ESM, during the pollution event from 8 April to 10 April, the regional mean PM2.5 concentrations peaked at 200 μg m–3 at 0000 UTC on 9 April in the 2-Day forecast. The PM2.5 concentrations gradually increase with increased lead time, reaching over 400 μg m–3 in the 7-Day forecasts. It is obvious that natural dust is the dominant composition mode, accounting for more than 90% of the total PM2.5 mass. As the natural dust of the BTH region is mainly transported from northwestern China, this event is mainly caused by the long-range transported dust. In addition, the northwesterly winds become stronger with increased lead time (Fig. S7 in the ESM), leading to enhanced long-range dust transport, which in turn contributes to the increasing trend in surface PM2.5 concentrations in the BTH area.
Although the impacts of lead time on a single event can also be analyzed as above, the numerical experiments designed in this study may not be appropriate for such analysis, because the analysis of a single event requires ensemble forecasts for each lead time to eliminate the influence of initial condition and chaotic effect. Since the ensemble experiments for each lead time for the entire four months are too computationally expensive, they are not conducted in this study. Instead, this study focuses on the lead time effect at a seasonal scale because the forecast experiment for each day can be taken as one ensemble member at a seasonal scale so that the impacts of forecast lead time can be well assessed.
-
In this study, a series of forecasts with lead times ranging from 2–7 days are conducted for January, April, July, and October of 2018 over the BTH region using the WRF-Chem model. The seasonal characteristics of forecasting uncertainties in surface PM2.5 concentrations associated with forecast lead time and its driving factors are investigated with these forecasts. For the regional average of the plains area of BTH, the forecasted highest surface PM2.5 concentrations throughout the year occur in winter, with concentrations up to 55 μg m–3, followed by those of approximately 35 μg m–3 in spring and autumn. The forecasted surface PM2.5 concentrations in summer reach the minimum of the year with a value of approximately 25 μg m–3.
With the increased lead time, the forecasted PM2.5 concentrations significantly change and demonstrate obvious seasonal differences. Please note that these forecasting uncertainties in surface PM2.5 concentrations are solely sourced from the forecasting uncertainties in meteorological fields due to increased lead time. In general, the forecasting uncertainties of monthly mean surface PM2.5 concentrations in the BTH region are the smallest (20%) in winter among the four seasons. In spring, the forecasted PM2.5 concentrations increase from 32 μg m–3 to 58 μg m–3 with increased lead time, reflecting an uncertainty of ~80%. In summer, the forecasted surface PM2.5 concentrations generally increased with lead time from 25 μg m–3 in the 2-Day forecast to 35 μg m–3, reflecting an uncertainty of ~40%. In autumn, the trend of forecasted surface PM2.5 concentrations is similar to that in summer, and the uncertainty can reach 50%. Overall, the forecasting uncertainties in surface PM2.5 concentrations can reach more than 80% solely due to the forecasting meteorological uncertainties with 7-Day lead times or even shorter.
The forecasting uncertainties in PM2.5 composition and associated meteorological fields due to increased lead time are further analyzed to explore the factors driving the seasonal characteristics of forecasting uncertainties in total surface PM2.5 concentrations. In winter, anthropogenic primary particles dominate the total surface PM2.5 mass, and thus its forecasting uncertainty with lead time. Therefore, the impact of lead time in winter mainly results from its influence on PBL heights and hence the PBL mixing of anthropogenic primary particles. The uncertainties in near-surface wind and hence dry deposition rate also play a small role. In spring, the forecasting uncertainty regarding the total surface PM2.5 mass mainly results from the impacts of lead time on the large-scale northwesterly flow, and thus the long-range transport of natural dust. The increase in transported natural dust can further provide more existing particle surface area for the condensation production of anthropogenic secondary particles. In summer, the total mass of surface PM2.5 mainly consists of anthropogenic primary and secondary particles. With increasing lead time, the slight increase in the total surface PM2.5 mass mainly results from the decrease in the dry and wet deposition rates, which is due to the reduction in the near-surface wind speed and precipitation rate. In autumn, the total surface PM2.5 mass increases in the 2-Day to 5-Day forecasts and then decreases in the 6-Day to 7-Day forecasts. This is mainly due to the change in large-scale circulations with increasing lead time, which eventually affects the long-range transport of natural dust and the ventilation of anthropogenic particles.
This study highlights the impacts of uncertainties in forecasted meteorological fields due to lead time on the forecasting uncertainties in surface PM2.5 concentrations. The impacts have evident seasonal variation. Since the forecasting uncertainties in surface PM2.5 concentrations can be significantly large due to lead time, it is necessary to improve the forecast accuracy of key meteorological fields with increasing lead time before the accuracy of air quality forecasts can be truly made with a lead time of a few days or even longer. According to previous studies, the intrinsic growth of errors in the underlying dynamical system and instabilities will contribute to the growth of forecasting uncertainties in meteorological fields by affecting some important processes, e.g., tropical cyclones, subtropical jet streams, blocking cases, and areas of moist convection (Dalcher and Kalnay, 1987; Emanuel and Zhang, 2016; Magnusson, 2017; Zhang et al., 2019). This may imply that the forecast accuracy of all these processes can affect the accuracy of forecasting surface PM2.5 concentrations. In addition, in this study, the analysis of the impact of lead time on the PM2.5 concentration forecast mainly focuses on the seasonal scale, and the impact of meteorological uncertainties is isolated while the impact of initial conditions and chaotic error are eliminated (more details are shown in section 2.3). The forecasting uncertainties of surface PM2.5 concentrations in typical synoptic weather and haze events due to the increase in lead time can be even larger, which warrants further investigation.
Data availability. The release version of WRF-Chem can be downloaded from http://www2.mmm.ucar.edu/wrf/users/download/get_source.html. The updated USTC version of WRF-Chem can be downloaded from http://aemol.ustc.edu.cn/product/list/ or contact chunzhao@ustc.edu.cn. Additionally, code modifications will be incorporated into the release version of WRF-Chem in the future.
Author contributions. Qiuyan DU and Chun ZHAO designed the experiments and conducted and analyzed the simulations. All authors contributed to the discussion and final version of the paper.
Acknowledgements. This research was supported by the National Key Research and Development Program of China (No. 2022YFC3700701), National Natural Science Foundation of China (Grant Nos. 41775146, 42061134009), USTC Research Funds of the Double First-Class Initiative (YD2080002007), and Strategic Priority Research Program of Chinese Academy of Sciences (XDB41000000). The study used computing resources from the High-Performance Computing Center of the University of Science and Technology of China (USTC).
Electronic supplementary material: Supplementary material is available in the online version of this article at https://doi.org/10.1007/s00376-023-3060-3.
Seasonal Characteristics of Forecasting Uncertainties in Surface PM2.5 Concentration Associated with Forecast Lead Time over the Beijing-Tianjin-Hebei Region
- Manuscript received: 2023-03-29
- Manuscript revised: 2023-09-17
- Manuscript accepted: 2023-10-19
Abstract: Forecasting uncertainties among meteorological fields have long been recognized as the main limitation on the accuracy and predictability of air quality forecasts. However, the particular impact of meteorological forecasting uncertainties on air quality forecasts specific to different seasons is still not well known. In this study, a series of forecasts with different forecast lead times for January, April, July, and October of 2018 are conducted over the Beijing-Tianjin-Hebei (BTH) region and the impacts of meteorological forecasting uncertainties on surface PM2.5 concentration forecasts with each lead time are investigated. With increased lead time, the forecasted PM2.5 concentrations significantly change and demonstrate obvious seasonal variations. In general, the forecasting uncertainties in monthly mean surface PM2.5 concentrations in the BTH region due to lead time are the largest (80%) in spring, followed by autumn (~50%), summer (~40%), and winter (20%). In winter, the forecasting uncertainties in total surface PM2.5 mass due to lead time are mainly due to the uncertainties in PBL heights and hence the PBL mixing of anthropogenic primary particles. In spring, the forecasting uncertainties are mainly from the impacts of lead time on lower-tropospheric northwesterly winds, thereby further enhancing the condensation production of anthropogenic secondary particles by the long-range transport of natural dust. In summer, the forecasting uncertainties result mainly from the decrease in dry and wet deposition rates, which are associated with the reduction of near-surface wind speed and precipitation rate. In autumn, the forecasting uncertainties arise mainly from the change in the transport of remote natural dust and anthropogenic particles, which is associated with changes in the large-scale circulation.
-
Keywords:
- PM2.5,
- forecasting uncertainties,
- forecast lead time,
- meteorological fields,
- Beijing-Tianjin-Hebei region
摘要: 气象要素预报的不确定性是长期以来学界公认的制约空气质量预报准确性和可预测性的主要因素。但目前气象预报的不确定性对不同季节空气质量预报影响的研究较为缺乏,且空气质量预报不确定性随预报时长延长增加的关键过程和机制也尚不明确。本研究通过对京津冀地区2018年1月、4月、7月和10月的2天至7天预报时长的数值预报实验,分析了气象预报不确定性对各预报时长近地面PM2.5浓度预报的影响。结果显示,随预报时长延长,PM2.5 的预报浓度有明显变化,并表现出显著的季节性变化特征:预报时长导致的京津冀地区PM2.5 月平均近地面浓度的预报不确定性在春季最大(80%),其次是秋季(约 50%)、夏季(约 40%)和冬季(20%)。通过分析PM2.5各化学组份近地面浓度和气象要素随预报时长的变化特征,本研究发现冬季预报时长导致的PM2.5近地面浓度预报不确定性主要是由于边界层高度预报随预报时长的升高增强了人为一次颗粒物的边界层混合。在春季,预报时长导致的不确定性则主要受对流层底西北风的影响。随预报时长不断增强的西北风加强了自然源沙尘气溶胶的远距离传输和人为二次气溶胶的凝结生成。在夏季,预报时长导致的不确定性主要是由于近地面风速和降水率随预报时长的减弱导致的干、湿沉积率的减弱。在秋季,预报时长导致的不确定性主要来自自然源沙尘的远距离传输和人为大气颗粒物传输随预报时长的增强,这与大尺度环流随预报时长的变化有关。
 AAS Website
 AAS WeChat