


 DownLoad:


-
The El Niño-Southern Oscillation (ENSO) phenomenon arises from ocean–atmosphere coupled processes in the tropical Pacific and can significantly affect global climate variability. Generally, ENSO is characterized by large sea surface temperature (SST) anomalies in the tropical central and eastern Pacific, accompanied by a zonal seesaw of sea level pressure and precipitation anomalies (Philander et al., 1984; McPhaden et al., 2006). However, individual ENSO events display large differences in their amplitude, spatial pattern, and temporal evolution. In particular, many studies have focused on the differences in the spatial pattern of SST anomalies, mainly because the detailed structure of SST patterns can play an important role in determining global teleconnections and societal impacts. Such differences in the ENSO-related SSTA patterns are often referred to as “different flavors of ENSO” or “ENSO diversity” (Capotondi et al., 2015a; Timmermann et al., 2018; Jin, 2022).
It is now widely accepted that there are at least two distinct categorizations of El Niño. One category of El Niño events exhibits a maximum SST anomaly centered in the eastern equatorial Pacific (historically named the canonical El Niño), which has been referred to as Eastern-Pacific (EP) or Cold-Tongue (CT) El Niño (Kao and Yu, 2009; Kug et al., 2009). In the other category, the large SST anomaly region is confined to the central equatorial Pacific, with its peak near the dateline. Many studies have reported that this type of event has been occurring with increased frequency since the late 1990s (e.g., Lee and McPhaden, 2010; Li et al., 2017; Freund et al., 2019; Gao et al., 2022; Zhang et al., 2022). For this non-canonical SST anomaly pattern, several names have been used, such as “Dateline El Niño” (Larkin and Harrison, 2005), “El Niño Modoki” (Ashok et al., 2007), “Warm-Pool El Niño” (Kug et al., 2009), and “Central-Pacific (CP) El Niño” (Kao and Yu, 2009); these different names are often defined by SST-based indices averaged in different regions. In this study, we use EP and CP El Niño events to refer to the two different types of El Niño events signifying that their largest SST anomalies are located in the eastern and central tropical Pacific, respectively.
The EP and CP El Niño types also differ in terms of atmospheric teleconnections and climatic impacts, corresponding to their separate SSTA signatures. For example, Weng et al. (2007) analyzed the association of a CP El Niño with the Pacific-Japan pattern and Pacific North American (PNA) pattern, whose climatic impacts along the Pacific rim are very different from an EP El Niño. Yu et al. (2012) also demonstrated that a CP El Niño preferably excites a wave train resembling the PNA pattern, while the EP El Niño primarily excites a poleward wave train emanating out of the tropics into higher latitudes; correspondingly, these different wave train responses lead to different impacts in North America. Hu et al. (2012) showed that there are robust climate differences in the eastern Pacific, North America, and North Atlantic regions during EP and CP El Niño events. Many other studies have also pointed out the significant differences associated with EP and CP El Niño events, including atmospheric circulation structure (Trenberth and Smith, 2009; Gushchina et al., 2022), regional rainfall variability (Kim et al., 2012), and tropical cyclone activity (Chen and Tam, 2010).
The generation and development of EP and CP El Niño events have been proposed to be related to different oceanic and atmospheric processes in the equatorial Pacific. Focusing on dynamical oceanic processes, Kug et al. (2009) suggested that the vertical advection of anomalous temperature gradients by the mean upwelling (i.e., the thermocline feedback) plays a leading role for the EP El Niño, whereas the SST warming of a CP El Niño is primarily driven by zonal advective feedback (i.e., zonal advection due to anomalous currents acting on the mean temperature gradient). The relative importance of the thermocline feedback and zonal advective feedback in generating EP and CP El Niño events is actually a reflection of different background mean states in the eastern and central equatorial Pacific. That is, the thermocline is shallow and upwelling is strong in the eastern Pacific, while in the west-central Pacific, there is a large zonal SST gradient at the warm pool edge. In this sense, interdecadal changes in the mean state of the tropical Pacific, resulting from anthropogenic global warming and/or natural low-frequency variability, could play a significant role in modulating the occurrence ratio of CP/EP El Niño events (Ashok et al., 2007; Yeh et al., 2009, 2011; Yu et al., 2015; Sullivan et al., 2016; Hu et al., 2023). On the atmospheric side, the intensity and location of surface wind in the central-western equatorial Pacific provide an important triggering mechanism for different El Niño types. For example, westerly wind bursts (WWBs), a kind of state-dependent stochastic wind forcing, can work together with the basic recharge-discharge cycles to induce diversity in both the spatial pattern and amplitude of SST anomalies (Chen et al., 2015; Fedorov et al., 2015; Levine et al., 2016). Specifically, the WWBs acting on a recharged oceanic thermal state often result in a strong EP El Niño, while the WWBs with a discharged state tend to trigger a CP El Niño. Lian et al. (2018) further showed that the genesis of WWBs is associated with tropical cyclones in the western North Pacific, which also can shift the El Niño warming center by directly modulating the Walker circulation and thermocline gradient in the tropical Pacific (Wang and Li, 2022a, b).
In recent years, variations in the extratropical Pacific have been recognized to be major contributors to ENSO diversity. In the subtropical Pacific, for example, the North Pacific Meridional Mode (NPMM), characterized by covarying SST and wind anomalies in the northeastern Pacific, can extend southwestward to the central equatorial Pacific and this interaction is particularly important in triggering CP El Niño events (Chang et al., 2007; Yu et al., 2010). In addition, the South Pacific Meridional Mode (SPMM), a mode analogous to the NPMM but in the southeastern tropical Pacific, tends to act as a precursor of an EP El Niño (Zhang et al., 2014a, b; Min et al., 2017; Lu et al., 2022). In the mid-high latitude Pacific, the North Pacific Oscillation (NPO), the second mode of atmospheric variability over the North Pacific, is closely related to the occurrence of a CP El Niño one year later through the seasonal footprint mechanism and NPMM (Vimont et al., 2003; Yu and Kim, 2011). On longer timescales, the Pacific Decadal Oscillation (PDO) in the North Pacific could also play a role in changing the El Niño flavor by modulating the tropical Pacific mean state (Zhang et al., 1998; Nonaka et al., 2002; Choi et al., 2011; Chung and Li, 2013; Power et al., 2021).
In addition, many studies have suggested that SST variability in other oceanic basins may also provide additional sources for ENSO diversity. For instance, the SST cooling of North Tropical Atlantic (NTA) in boreal spring often induces a subsequent CP El Niño condition, while the equatorial Atlantic Niña is more conducive to the occurrence of an EP El Niño (Ham et al., 2013a, b; Dommenget and Yu, 2017; Wang et al., 2017). In particular, due to the limited observational record, coupled general circulation models (CGCMs) are used to examine the role and associated mechanisms of these remote precursors in triggering different types of El Niño events. On the one hand, by conducting partially coupled or pacemaker experiments within one particular model framework, Ham et al. (2013b) and Jiang and Li (2021) showed that NTA cooling favors CP El Niño occurrence by altering the air-sea interactions in the intertropical convergence zone, while the Atlantic Niña favors EP events via the zonal shifts in the Walker Circulation. On the other hand, multimodel simulations from the Climate Model Intercomparison Project (CMIP) archives are also used to examine and estimate the contributions of these remote precursors to ENSO diversity (Ham and Kug, 2015; Kajtar et al., 2017; Cai et al., 2019; Zhao et al., 2023).
However, current CGCMs still show large uncertainties in the realistic representation of ENSO diversity and remote forcing effects. Hou and Tang (2022) showed that using the recently released CMIP6 simulations, many CGCMs still have difficulty reproducing the observed range of El Niño flavors. This limitation of simulating ENSO diversity is closely related to model biases in the background mean state (e.g., the cold tongue bias). Such a misrepresentation of the mean state could lead to biases in reproducing the zonal SST gradient and the relevant zonal advective feedback, which is essential for a CP El Niño (Bellenger et al., 2014; Taschetto et al., 2014; Capotondi et al., 2015b; Feng et al., 2020; Planton et al., 2021). Due to the systematic biases of the mean state, most CGCMs also cannot satisfactorily simulate the Atlantic SST variability, thus leading to an unrealistic estimate of the remote impacts on ENSO (Ham and Kug, 2015; Kucharski et al., 2015). Furthermore, although many CGCM-based studies have emphasized the role of remote influences in ENSO diversity as mentioned above, not every observed ENSO event is preceded by these remote precursors (e.g., NTA and Atlantic Niño/Niña), which emphasizes the critical role of coupled dynamics internal to the tropical Pacific on ENSO evolution. Therefore, the answer to whether ENSO diversity arises solely from internal processes within the tropical Pacific or includes remote influences remains elusive.
In this study, we examine ENSO diversity in a hybrid coupled model (HCM), denoted as HCMAGCM, which consists of an atmospheric general circulation model (AGCM) and a simplified intermediate oceanic model in the tropical Pacific (Keenlyside and Kleeman, 2002; Zhang et al., 2003, 2020; Gao and Zhang, 2017; Hu et al., 2019). The ocean component is an anomaly model, with a prescribed climatological SST obtained from the observations, thus avoiding the plague of mean state biases inherent to complex CGCMs (Planton et al., 2021). In the HCMAGCM, the ocean and atmosphere are actively coupled only within the tropical Pacific; beyond the tropical Pacific, the underlying SST forcing the atmosphere is specified as its climatological monthly mean fields. That is, this model only contains coupled processes internal to the tropical Pacific, without considering influences from remote ocean variations in other basins. In the context of this HCMAGCM framework, we aim to address the following questions: (1) Can the EP and CP El Niño events be adequately depicted in this tropical Pacific ocean–atmosphere coupled model? (2) If so, what respective dominant dynamical processes can be distinguished for the EP and CP El Niño conditions? (3) What are the possible causes for the generation of the different El Niño types? (4) Can the extratropical atmospheric teleconnections be distinctly produced by the two types of El Niño events? To this end, we will utilize a 1000-year-long simulation of HCMAGCM to address these questions.
The remainder of this paper is organized as follows. In section 2, a description of the model and data used in this study is provided. Different characteristics during the peak phase of EP and CP El Niño events are shown in section 3. Section 4 presents the evolution and related dynamical processes for both EP and CP El Niño events, and shows the possible roles of the mean state decadal changes in generating ENSO diversity in the model. In section 5, differences in the extratropical atmospheric responses to the two types of El Niño are analyzed. A summary and discussion is provided in section 6.
-
Hybrid coupled models (HCMs) refer to a type of simplified ocean–atmosphere coupled model within which one component is usually taken as a simple anomaly model, whereas the other component is taken as a primitive equation-based general circulation model (Zhang et al., 2020). The HCM used in this study consists of an atmospheric general circulation model (AGCM) and a simplified intermediated ocean model, denoted as HCMAGCM. The atmospheric component is ECHAM5, the fifth version of the European Centre for Medium-Range Weather Forecasts (ECMWF) model developed by the Max Planck Institute for Meteorology (Roeckner et al., 2003). ECHAM5 is a global spectral model based on primitive equations. The horizontal spectral resolution is T63 (1.875° × 1.875°) with 19 vertical hybrid levels up to a pressure level of 10 hPa.
The ocean component of HCMAGCM consists of a dynamical intermediate ocean model (IOM) and an SST anomaly model (Keenlyside and Kleeman, 2002). The IOM includes linear and nonlinear dynamical components. The linear component is derived from the McCreary (1981) baroclinic mode model, with an extension to include effects of a horizontally varying background stratification. The first 10 baroclinic modes are resolved in vertical layers and the combined effects of high-order 11–30 modes are simulated by Ekman dynamics in two surface layers. The nonlinear component is simplified as residual terms in the momentum equations, which provide corrections to the linear component where the linear assumption is not valid. Compared to other intermediate-type models (e.g., the Zebiak-Cane model; Zebiak and Cane, 1987), this IOM accounts for spatially varying stratification, multiple vertical modes to describe the vertical structure of the upper ocean, and nonlinearity. As a result, the IOM can realistically simulate ocean currents in the tropical Pacific, in particular the zonal current variability in the central Pacific.
An SST anomaly model is embedded into the dynamical IOM to describe the thermodynamics of surface mixed layer. In the SST anomaly model, a novel approach has been developed to parametrize the temperature of subsurface water entrained into the mixed layer (
$ {T_{\text{e}}} $ ), based on the close relationship between$ {T_{\text{e}}} $ and sea level anomalies (Sirven and Vintzileos, 2000; Dewitte et al., 2002; Zhang et al., 2003). First, the$ {T_{\text{e}}} $ anomaly fields are obtained using an inverse modeling method of the SST anomaly equation whose tendency is specified from observations, while the currents are modeled from the dynamical ocean model. Then, a relationship between the$ {T_{\text{e}}} $ anomalies and sea level anomalies are determined by using a singular value decomposition (SVD) method. With the SVD technique, the sea level anomaly (a prognostic field) simulated from the dynamical ocean model can be used to estimate Te anomalies. In estimating$ {T_{\text{e}}} $ , the first five SVD modes are included, with squared covariance fractions of about 92.7%, 4.4%, 1.1%, 0.7%, and 0.37%, respectively. In the first leading SVD mode, the sea level variability is characterized by a seesaw across the basin, while the$ {T_{\text{e}}} $ variability is concentrated predominantly in the eastern and central Pacific, corresponding to the mature phase of ENSO (Zhang et al., 2005). The higher modes are typically smaller in amplitude and have a higher frequency variability in time. This improved$ {T_{\text{e}}} $ calculation adequately represents the subsurface effect on SST due to the vertical mixing and entrainment processes, so that the model can realistically reproduce the SST variability in the tropical Pacific (Zhang et al., 2005; Zhang and Gao, 2016).The ocean model domain covers the tropical Pacific and Atlantic basins from 124°E to 30°E and from 33.5°S to 33.5°N, with a realistic representation of continents (but only the tropical Pacific basin is considered in this study). As a result, in the coupled framework of the HCMAGCM, active ocean–atmosphere coupling can only exist within the tropical Pacific; outside of the tropical Pacific, the SST is prescribed to be climatology as the boundary for the ECHAM5 global atmosphere model. The horizontal resolution of the ocean model is 2° zonally and a varying grid meridionally, stretching from 0.5° within 10° of the equator to 3° at its northern and southern boundaries. Vertically, the ocean is assumed to be flat-bottomed with a depth of 5500 m. The linear component has 33 levels in the vertical, with 8 levels in the upper 125 m. The nonlinear component and high-order 11–30 baroclinic modes are calculated only for two surface layers, which span the upper 125 m. The SST fields from Reynolds and Smith (1994) are used to define the climatological SST in the anomaly ocean model.
The HCMAGCM employs an anomaly coupling strategy because the ocean component is formulated as an anomaly, thus freeing itself from the SST mean state biases that are challenges in many CGCMs. The atmosphere and ocean components allow active coupling only in the tropical Pacific; beyond the tropical Pacific, the SST field is set to its climatological monthly mean, so there is no coupling between the ocean and atmosphere. Therefore, such a modeling framework only represents the effect of coupled processes within the tropical Pacific on ENSO evolution. The coupling frequency between ocean and atmosphere is once per day with the exchanged variables being SST, surface heat flux, and wind stress anomalies. More detailed descriptions of the HCMAGCM are given in Hu et al. (2019). In this study, a 1000-yr long-term control simulation of the HCMAGCM is analyzed.
-
The observational and reanalysis datasets used in this study include (1) monthly SST data from the Extended Reconstruction SSTs version 5 (ERSSTv5) with a 2° × 2° horizontal resolution for the period 1951–2020 (Huang et al., 2017); (2) monthly sea surface height (SSH) and surface wind stress from the Ocean Reanalysis System 5 (ORAS5) with an approximate 0.25° × 0.25° resolution for the period 1958–2020 (Zuo et al., 2019); (3) monthly precipitation from the Global Precipitation Climatology Project (GPCP) dataset with a 2.5° × 2.5° grid resolution for the period 1979–2020 (Adler et al., 2018). Monthly anomalies are calculated by removing the climatological means for each month. All data used in this study are linearly detrended prior to calculations and analyses.
-
Following Kug et al. (2009), we compare the Niño-3 (averaged SST anomalies in 5°S–5°N, 90°–150°W) and Niño-4 (averaged SST anomalies in 5°S–5°N, 160°E–150°W) indices to identify the two types of El Niño events. An El Niño event is referred to as an EP El Niño if the Niño-3 index during the boreal winter (November–January) is larger than 0.5°C and larger than Niño-4, while CP El Niño events are characterized by the boreal winter Niño-4 index exceeding 0.5°C and also the Niño-3 index. During the 1951–2020 period of observations, there were 12 EP El Niño events (i.e., 1951/52, 1957/58, 1963/64, 1965/66, 1972/73, 1976/77, 1982/83, 1986/87, 1997/98, 2002/03, 2006/07, 2015/16) and 7 CP El Niño events (i.e., 1953/54, 1968/69, 1977/78, 1991/92, 1994/95, 2004/05, 2009/10). Over the 1000-yr simulation of HCMAGCM, we identified 151 EP and 43 CP El Niño events. Note that the proportion of CP El Niño events in the model, with a CP to EP ratio of 0.28, is significantly lower than that in observations with a ratio of 0.58. This discrepancy may be due to the model’s lack of tropical-extratropical coupling processes and inter-basin interactions. Figure 1 shows the time series of Niño-3 SSTAs during an EP El Niño and Niño-4 SSTAs during a CP El Niño in both observations and the HCMAGCM simulation, respectively. Both types of El Niño events tend to peak in November-December, exhibiting a typical phase-locking feature (Figs. 1a, d). The maximum Niño-3 SST amplitude of an EP El Niño is generally larger than the Niño-4 counterpart of a CP El Niño in both observations and the model simulation. The observed Niño-3 has a spectral peak of about three years and Niño4 shows similar interannual periods but has a larger spectral power in the decadal range (Fig. 1c; Capotondi et al., 2020). In the model, both Niño-3 and Niño-4 have significant spectral power at 2–4 years; however, they show no obvious differences on decadal timescales (Fig. 1f), which may be related to the lack of tropical–extratropical coupling processes in the HCMAGCM. In addition, the equatorial zonal profiles of SST anomalies during EP and CP El Niño events during the boreal winter are also shown in Fig. 1. As seen from the thick solid lines, the composite zonal profiles for the two types of El Niño events exhibit good agreement between the model and observations. The EP El Niño events have large SST anomalies spanning from 170°W to 90°W with the maximum value around 120°W, while during the CP events, the SST anomalies maximize around 170°W and are substantially weaker in the eastern equatorial Pacific (Figs. 1b, e). It is also evident that the EP El Niño events exhibit a broad range of amplitudes from weak to extreme warming, while the CP events usually are weak and moderate. The HCMAGCM can simulate the distinct zonal locations of maximum SST anomalies and the different amplitude spreads for EP and CP El Niño events, similar to the observations. In addition, it needs to be mentioned that we also applied the combined regression-empirical orthogonal function (EOF) analysis (Kao and Yu, 2009) to identify the spatial pattern of EP and CP ENSO in the HCMAGCM. The calculated pattern correlation shows that the identified EP and CP El Niño events based on the comparison of Niño-3 and Niño-4 have high spatial similarity to the EP and CP structure obtained by the regression-EOF method.
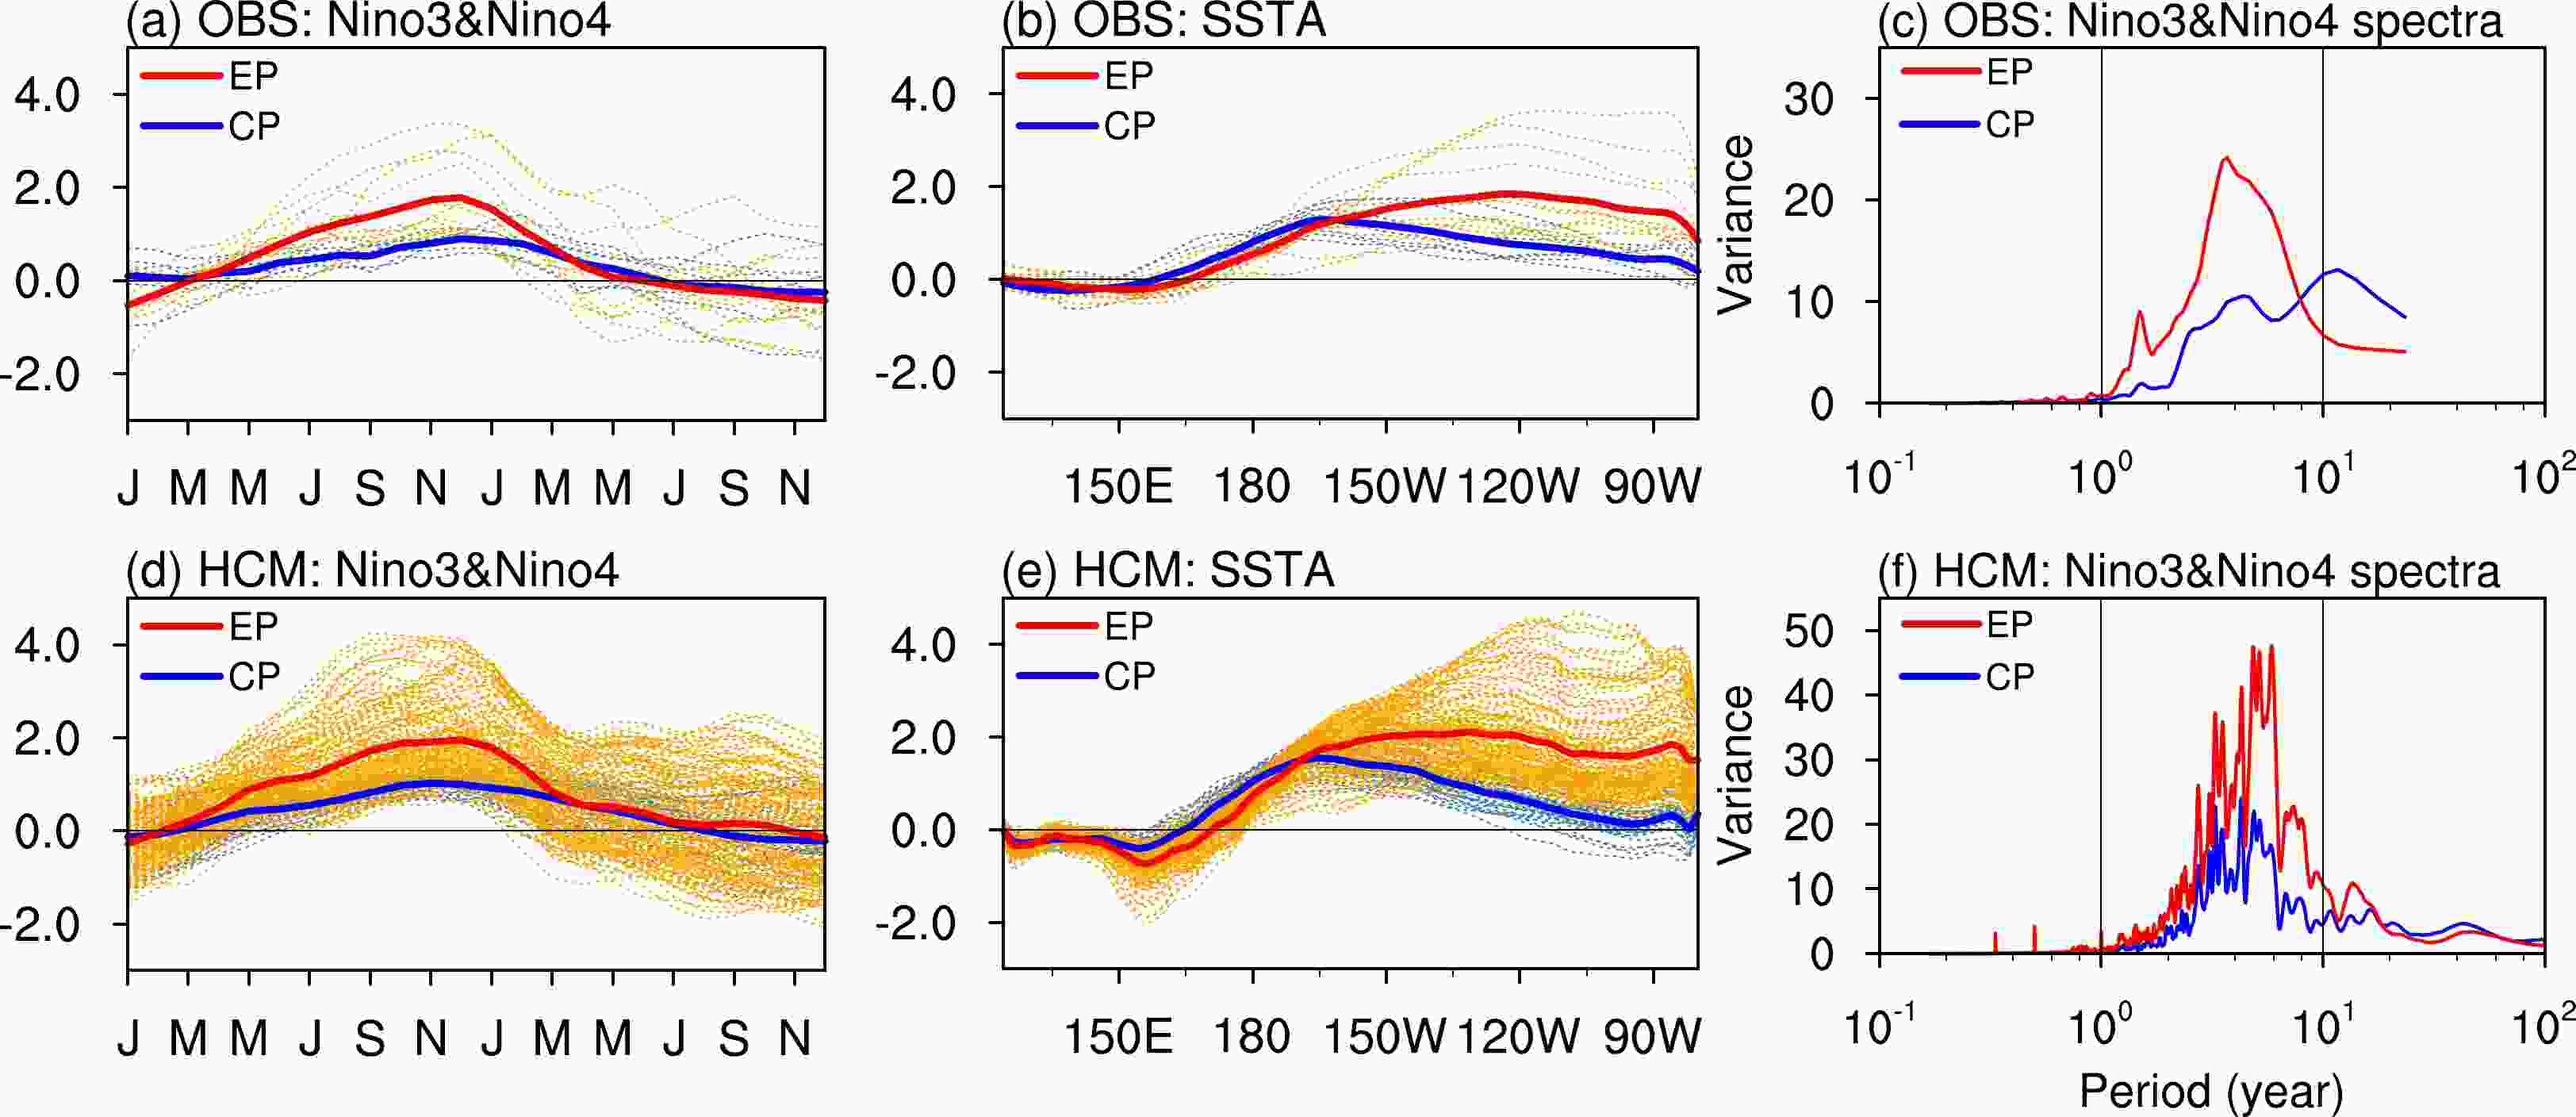
Figure 1. (a, d) Time series of Niño-3 and Niño-4 indices for EP and CP El Niño events, (b, e) equatorial SSTA profiles averaged from 5°S–5°N during November-January for EP and CP El Niño events, and (c, f) power spectra of the Niño-3 and Niño-4 indices from (top) observations and (bottom) the HCMAGCM simulation. In (a, b) and (d, e), orange and blue dashed lines show the profiles of individual EP and CP El Niño events, while the red and blue solid lines indicate the composite profiles of EP and CP El Niño events, respectively. In (c, f), the red and blue lines indicate the power spectra of Niño-3 and Niño-4 indices, respectively.
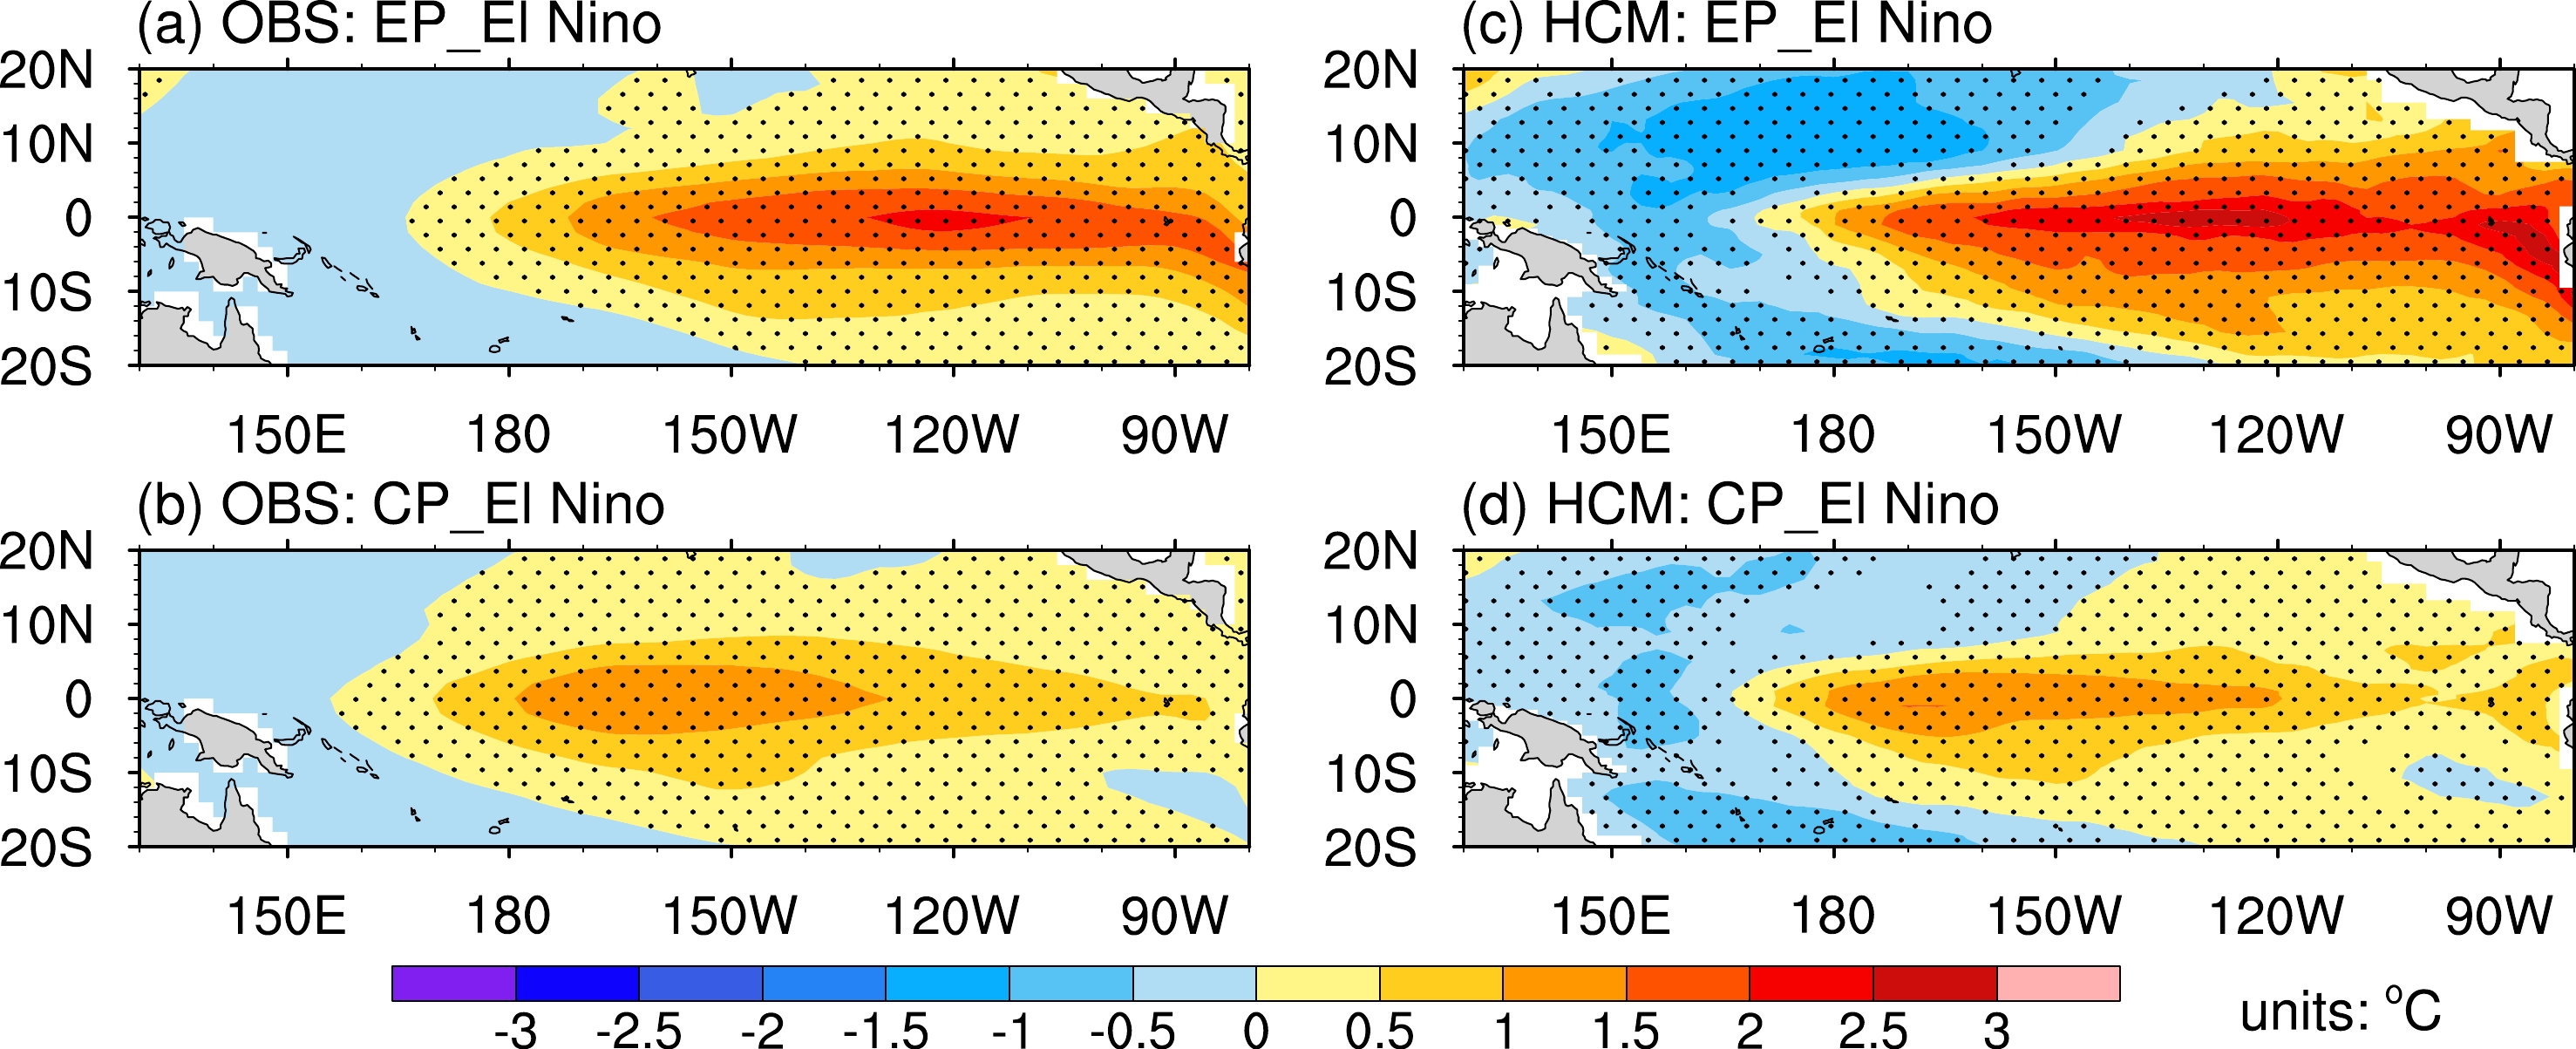
Figure 2 shows the composite SST anomalies for EP and CP El Niño events from observations and model simulation. Consistent with the zonal profiles on the equator in Fig. 1, large SST anomalies during the observed EP El Niño appear in the 170°–90°W longitude range with the maximum value being located around 120°W, while those during the CP El Niño peak further west and are also weaker than EP events. The simulated EP El Niño events in the HCMAGCM are slightly stronger than those in observations. The EP El Niño in the model shows significant warming in the central-eastern tropical Pacific, with a maximum warming center located in the 135°–120°W band that is similar to the observations. Note that there is another warming center with comparable amplitude in the far eastern boundary regions, which is more obvious in the model than in the observations. The simulated spatial patterns of a CP El Niño show a good correspondence to those obtained from observations; however, the model shows significant negative SST anomalies in the western off-equatorial Pacific, which is not seen in the observed composites. This difference in the model may be attributed to model deficiencies, including the lack of other oceanic basins. Despite some differences, it seems that the HCMAGCM does depict the major distinctions associated with the central peak of SSTAs at different longitudes between the two types of El Niño events.

Figure 2. Composite SST anomalies of (a, c) an EP El Niño event and (b, d) a CP El Niño event during November−January from (left) observations and (right) model simulation. Dotted areas indicate that the composite SST anomalies are statistically significant at a 95% confidence level for (a, b) the observations and at a 99% confidence level for (c, d) the HCM, as determined by a Student’s t-test.
The pattern and intensity of SST anomalies evident during different El Niño types are closely tied to the changes in the surface wind stress. Figure 3 shows the composites of zonal wind stress anomalies for the EP and CP El Niño events in observations and the model. The EP El Niño displays anomalously strong westerly winds in the western-central equatorial Pacific, centered to the east of the dateline. The anomalous westerlies for a CP El Niño are distributed further west, with the intensity and zonal extent being smaller compared to those of the EP El Niño. The model can realistically reproduce the different zonal locations and scales of wind stress in the two types of El Niño events. However, the wind stress anomalies of both types in the model are stronger than in the observations (Figs. 3c, d), which well corresponds to the simulated stronger SST anomalies shown in Fig. 2.
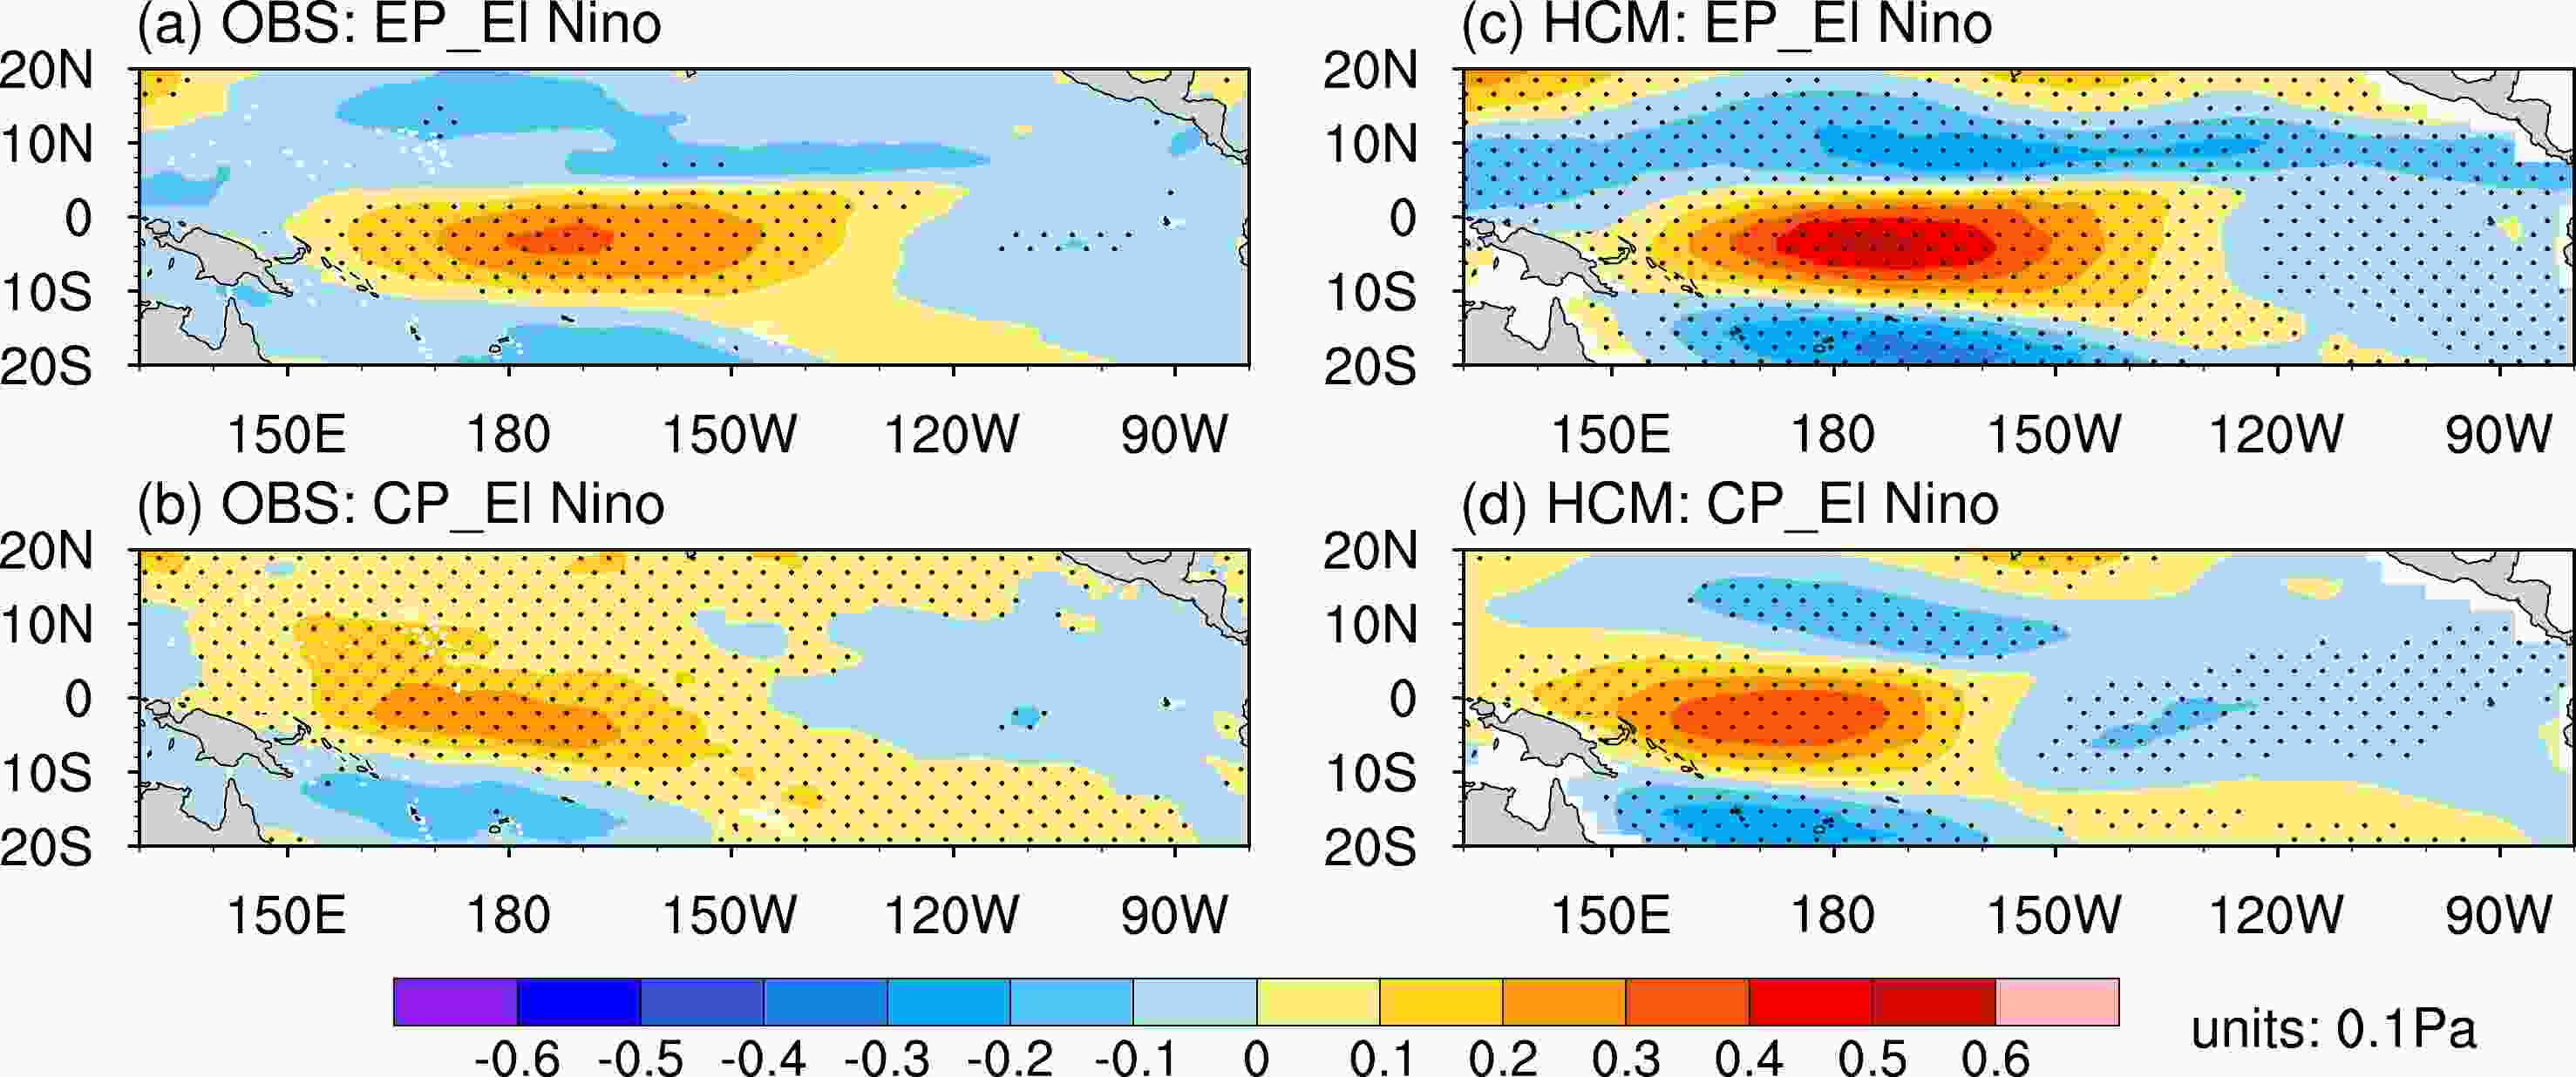
Figure 3. Same as in Fig. 2, but for zonal wind stress anomalies. The composites are conducted for El Niño years beginning in 1958.
The simulated SSH anomalies for the EP and CP El Niño events are examined in Fig. 4. In the simplified ocean component of the HCMAGCM, SSH anomalies can be used to indicate the variations in the thermocline depth due to their dynamical relationship. The model composites of SSH anomalies for the two types of El Niño events are similar to the observation. In the case of an EP El Niño, SSH anomalies show a strong zonal dipole pattern with positive anomalies in the eastern Pacific and negative anomalies in the western Pacific, indicating a deeper (shallower) thermocline in the eastern (western) Pacific. In contrast, SSH anomalies with CP events are substantially weaker and the positive anomalies extend further westward than those with EP events, indicative of a weaker thermocline variation as demonstrated in previous studies (Kug et al., 2009, 2010; Capotondi, 2013).

Figure 4. Same as in Fig. 3, but for SSH anomalies.
The tropical precipitation anomalies associated with El Niño events are major drivers for global atmospheric teleconnections. Since the SST anomalies associated with EP and CP El Niño events exhibit different amplitudes and spatial patterns, the resultant precipitation anomalies are also different (Fig. 5). For example, in the observed EP El Niño composite, the center of positive precipitation anomalies is located around 160°W, with a tail extending to the eastern Pacific. The positive anomalies of the CP El Niño composite, on the other hand, are confined to the central Pacific near the dateline with a weaker magnitude. Note that the simulated precipitation anomalies show different spatial patterns in the EP and CP composites but with a comparable magnitude. In addition, the precipitation anomalies in the model are significantly stronger than those in the observations, which possibly results from deficiencies in the model.
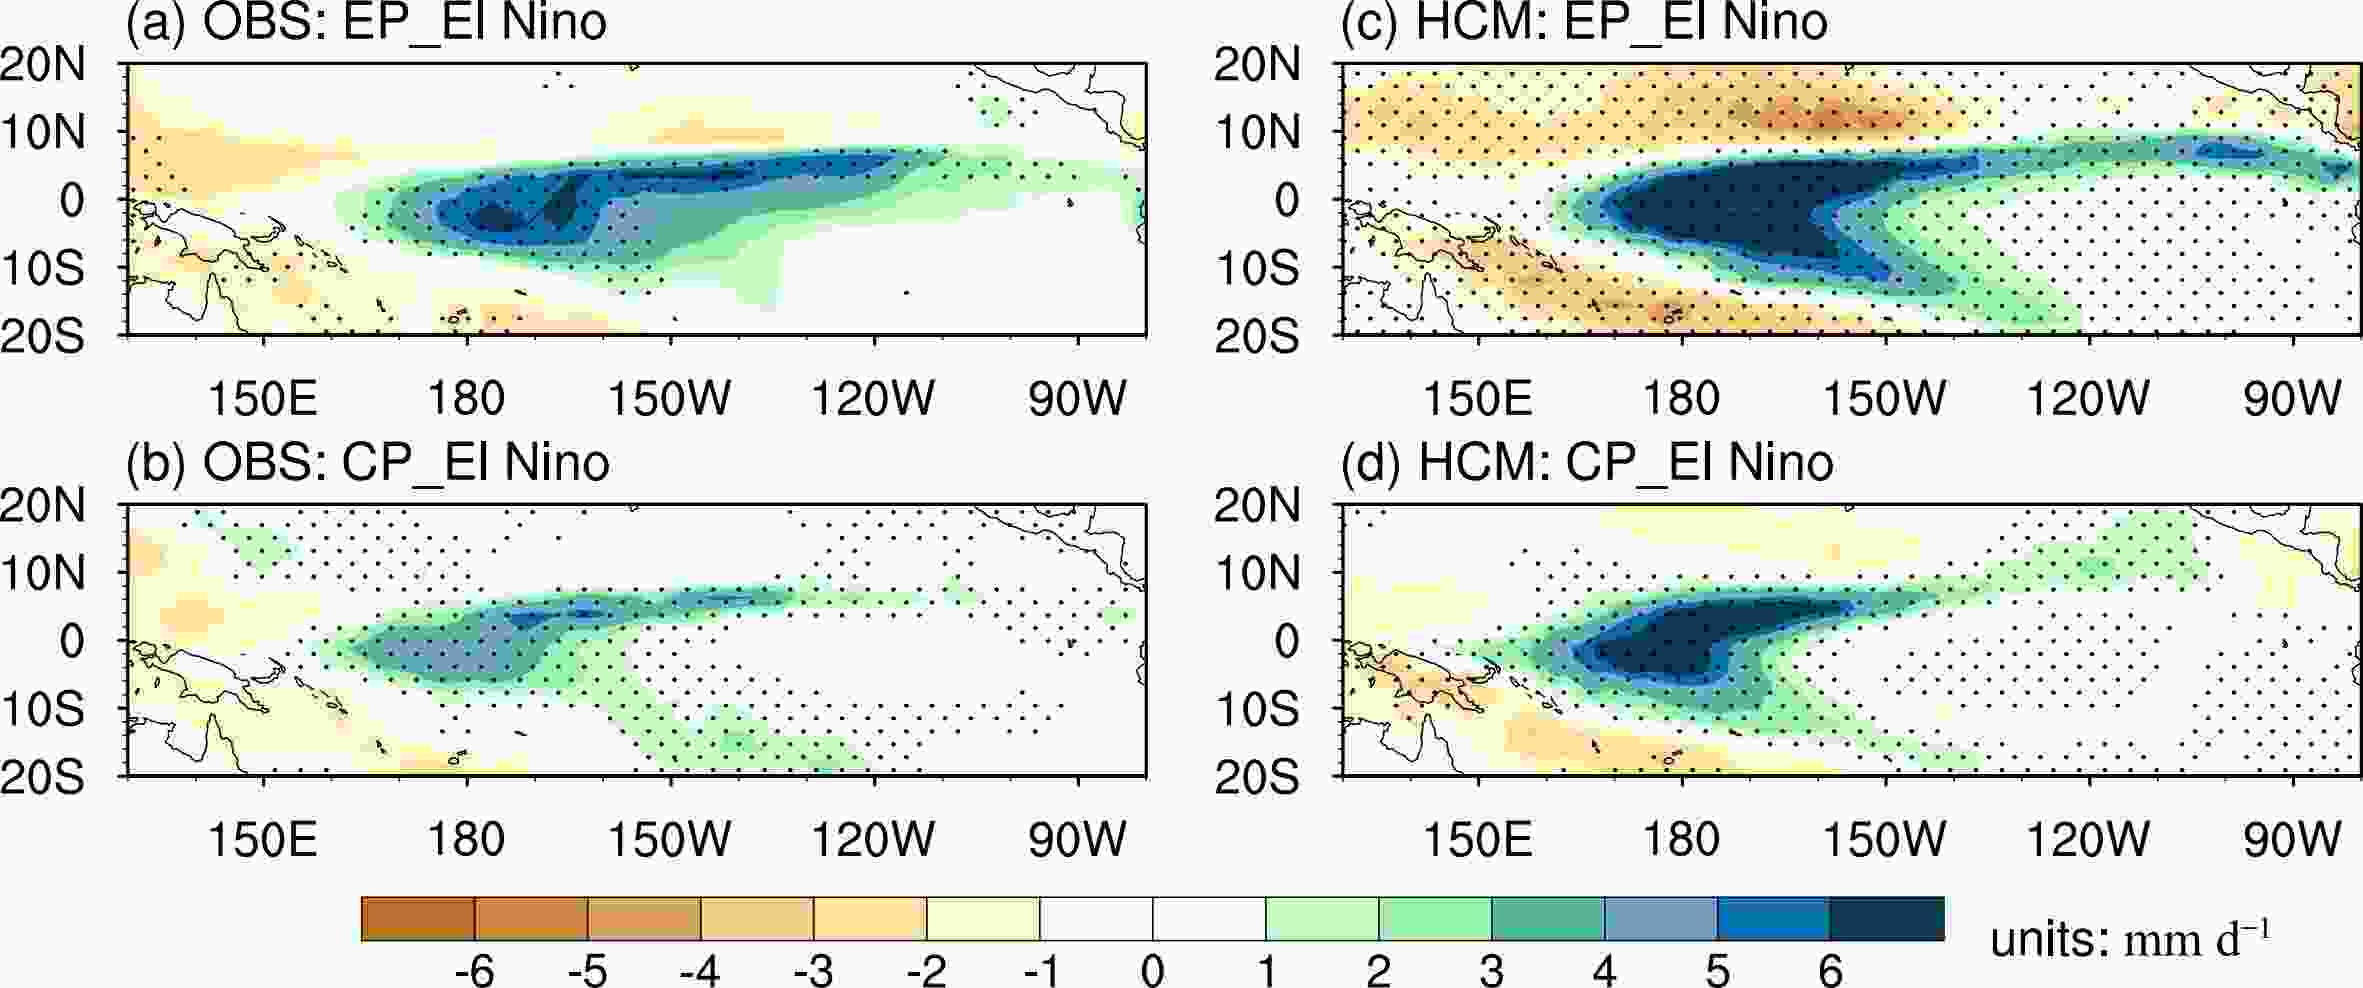
Figure 5. Same as in Fig. 2, but for precipitation anomalies. The composites are conducted during El Niño years after 1979 because the GPCP dataset is available for 1979–2020.
According to the above discussion, we can see that there exist two types of El Niño events in the HCMACGM simulation, even though the ocean and atmosphere are actively coupled only within the tropical Pacific. The two types of simulated events are characterized by distinctive zonal peaks and anomaly amplitudes in both oceanic and atmospheric variables, which are overall similar to the observation. In the next section, the temporal evolutions associated with EP and CP El Niño events and the dynamical processes responsible for their different anomaly patterns will be further discussed.
-
Figure 6 shows the space-time evolution for the composite SST and surface wind stress anomalies during EP and CP El Niño events in the model simulation. In the case of an EP El Niño, the SST anomalies in the eastern equatorial Pacific become positive in February and then propagate westward and yield significant warming in the central and eastern tropical Pacific duing December (Fig. 6a). Meanwhile, westerly anomalies first appear to the west of the dateline and gradually strengthen and extend eastward, favoring the growth of the SSTAs through advecting warm water and equatorial downwelling. The evolution of a CP El Niño differs in that it starts relatively late; in February, cold anomalies still exist in the central-eastern equatorial Pacific. The surface warming of CP El Niño occurs around April and peaks in the central Pacific during December, accompanied by anomalously weaker westerlies (Fig. 6b). Such evolutionary differences between EP and CP El Niño events are more clearly illustrated in Fig. 7. Obviously, the SST and wind stress anomalies during an EP El Niño are stronger than those during a CP El Niño. During an EP El Niño, significant warming is seen to the east of the dateline and anomalous westerlies can extend to 135°W, while a CP El Niño peaks in the 180°–135°W longitude range with weak westerly anomalies being confined only west of 165°W. Figure 7 also shows the evolutions of SSH anomalies for the EP and CP El Niño events. For the SSH anomalies, the EP and CP El Niño composites show a similar eastward propagation from the western to eastern equatorial Pacific (Figs. 7c, d). However, the positive SSH anomalies of an EP El Niño are in the eastern Pacific near the coast, while those of CP El Niño are clearly shifted westward and weakened. This may suggest that the dominant importance of the thermocline feedback during the development of EP and CP El Niño events differ, which is examined in the following SST budget analysis.
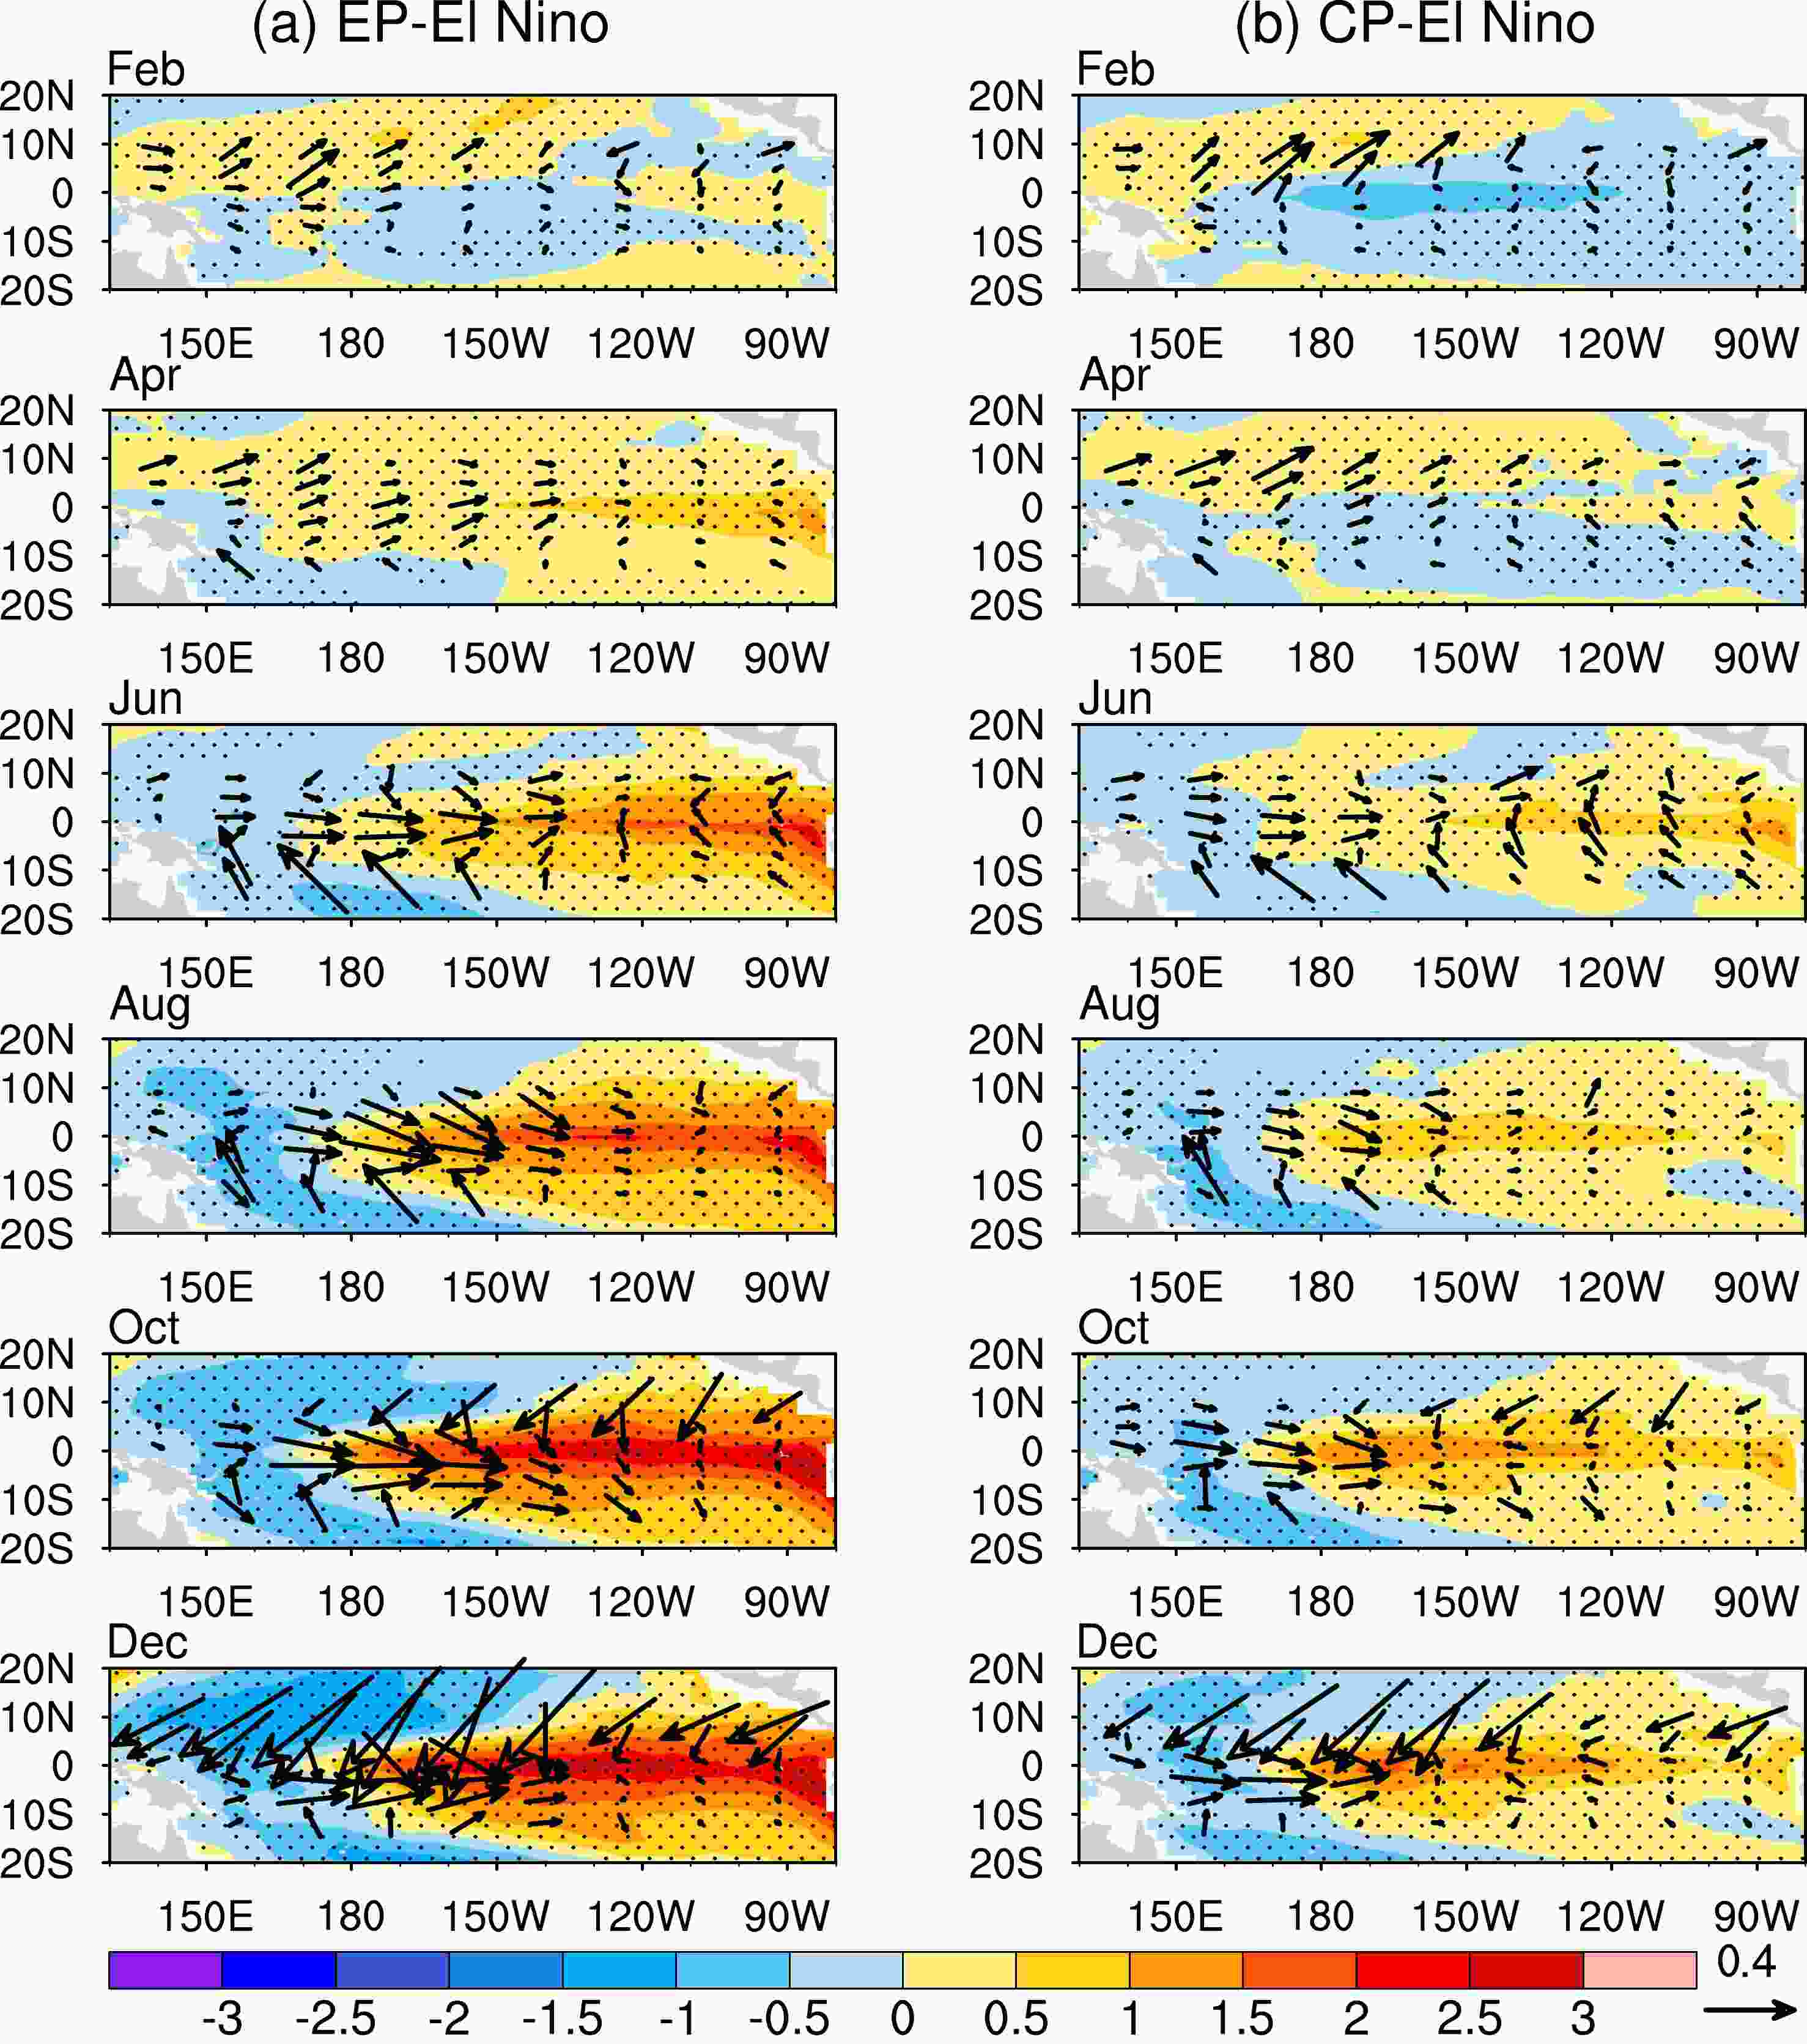
Figure 6. Composite evolutions of SST (°C, shading) and wind stress (0.1 Pa, vectors) anomalies for (a) EP El Niño and (b) CP El Niño events in the model simulation. Dotted areas indicate the 99% confidence level of composite SST anomalies according to a Student’s t-test.
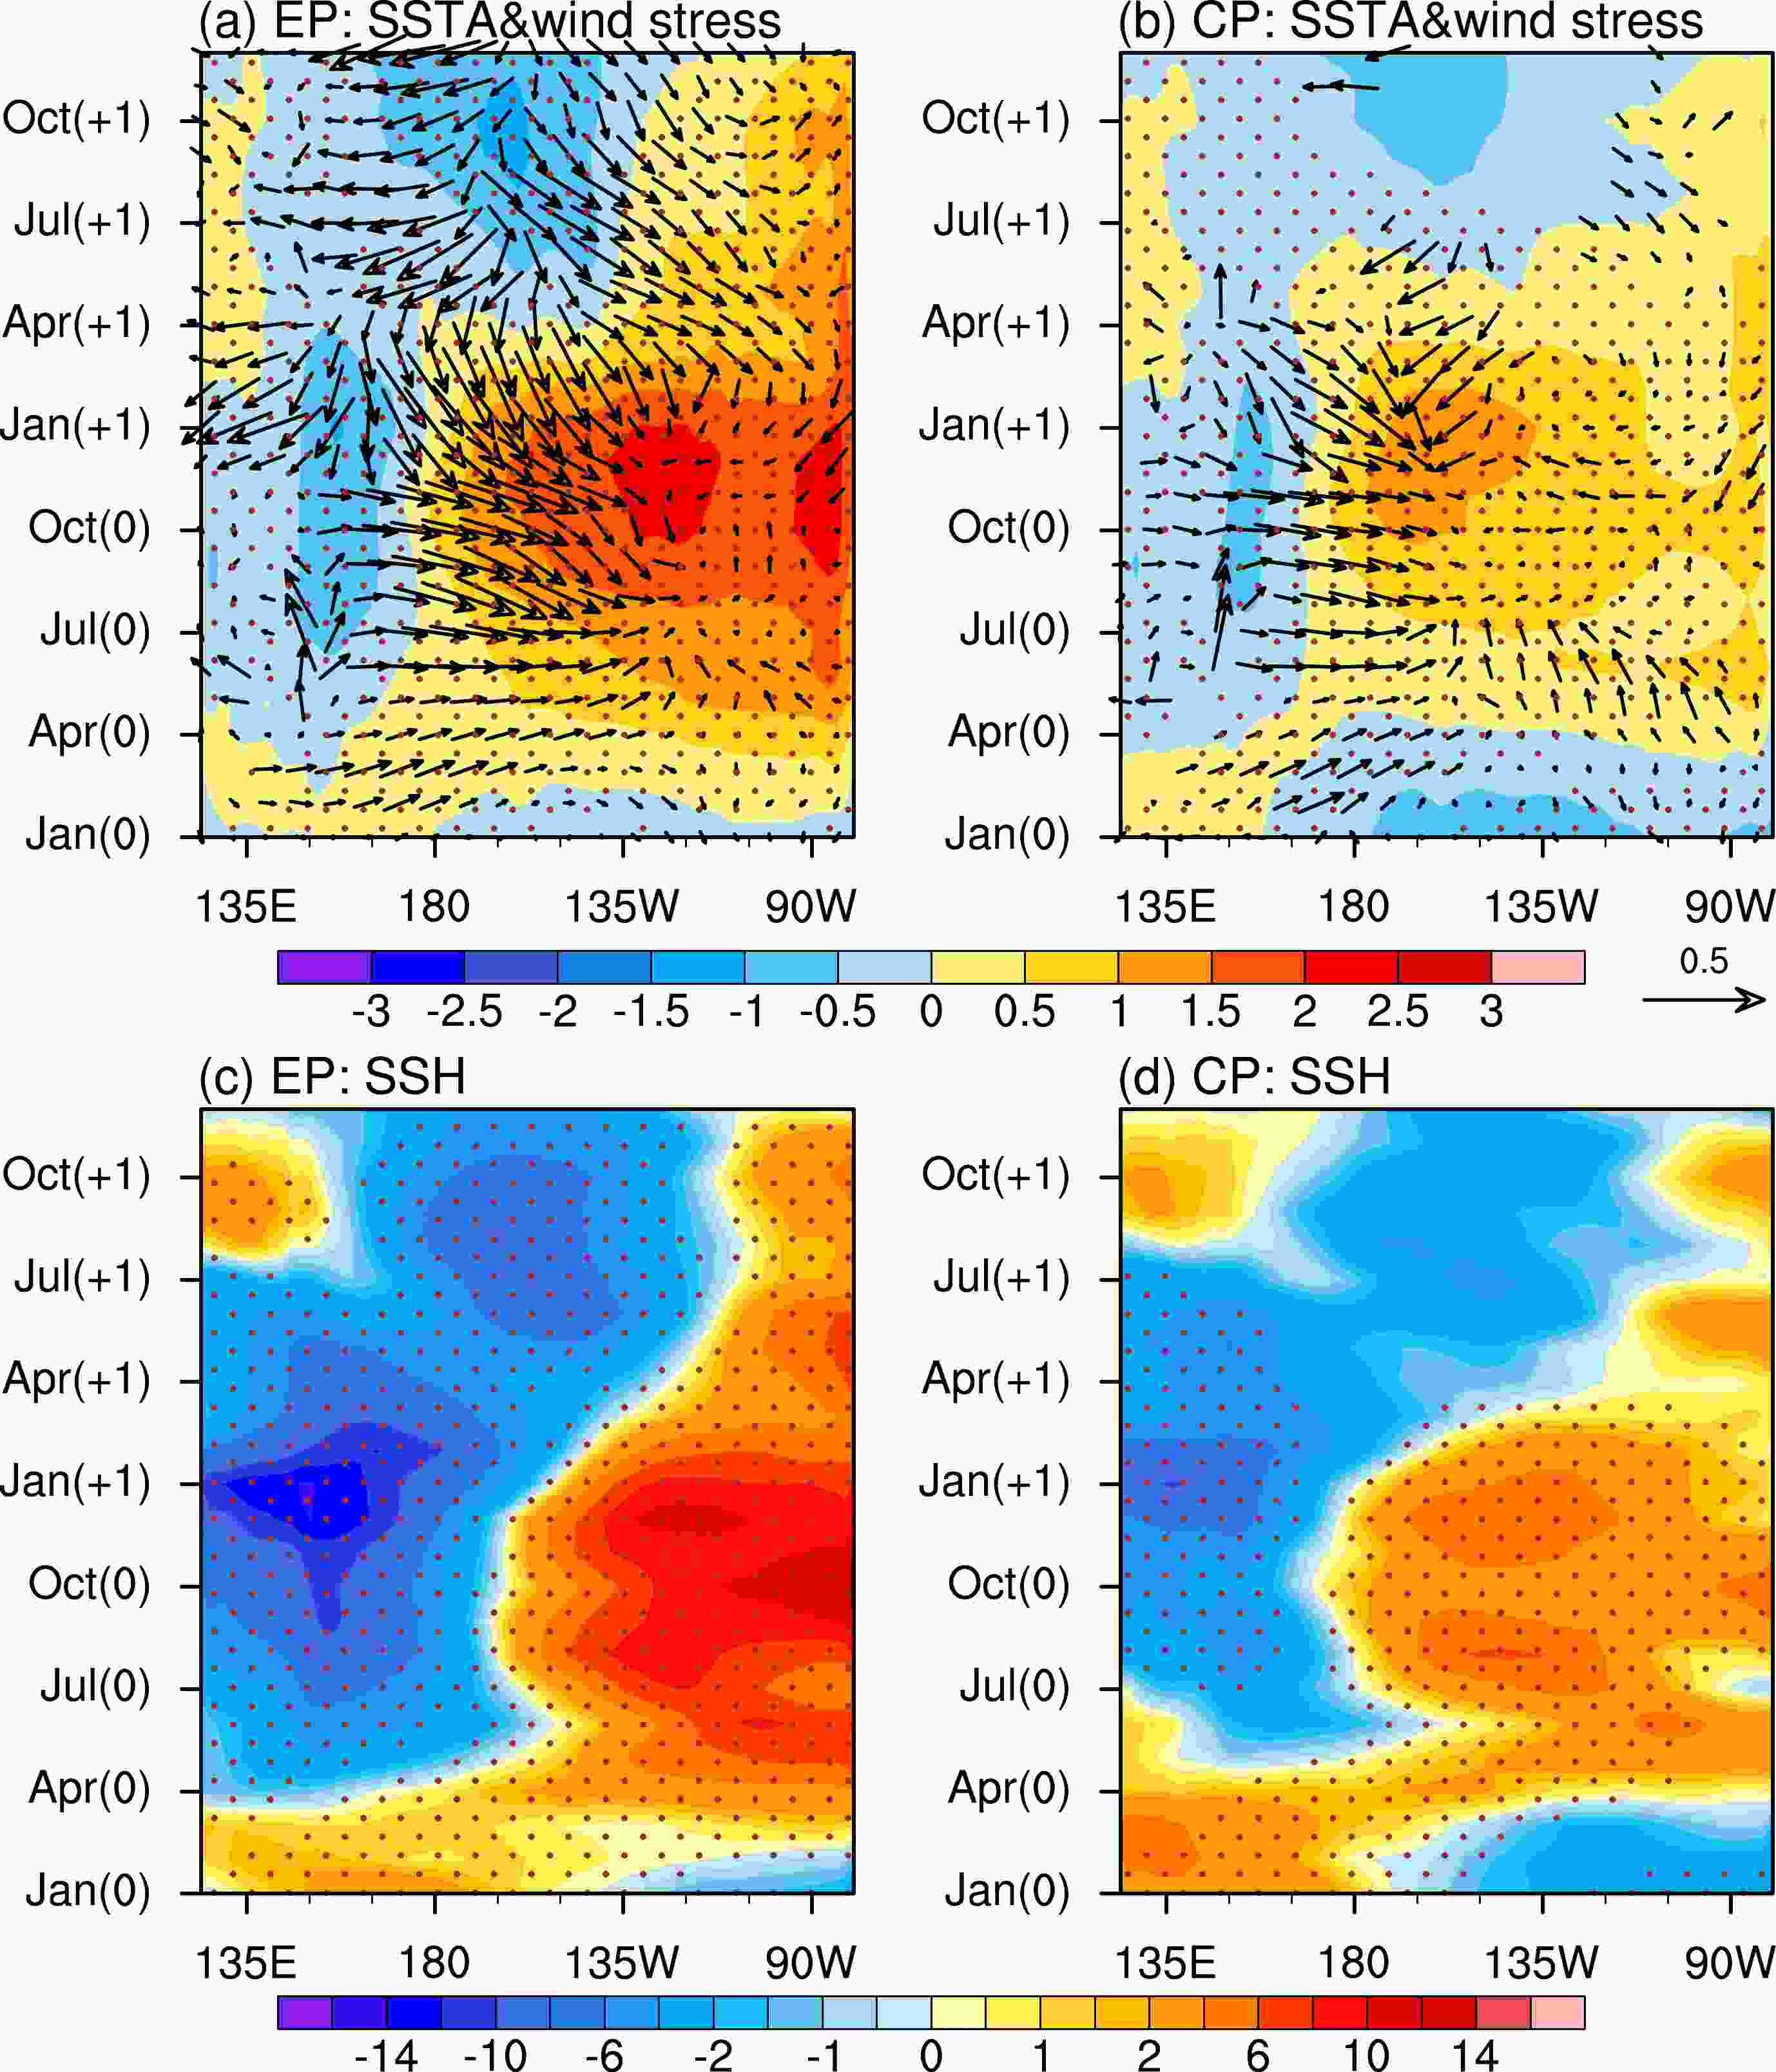
Figure 7. Composite evolutions of SST (°C, shading) and wind stress (0.1 Pa, vectors) anomalies averaged between 5°S and 5°N for (a) an EP El Niño and (b) a CP El Niño event in the model simulation. Panels (c, d) are the same as (a, b) but for SSH anomalies. Month (0) and Month (+1) represent months during the El Niño peak year and those after the peak year, respectively. Dotted areas indicate the 99% confidence level of composite SST anomalies according to a Student’s t-test.
In the ocean component of the HCMAGCM, the mixed layer SST anomaly equation is written as:
where terms with primes indicate anomalies, and terms with overbars indicate monthly climatological values;
$ T $ and$ {T_{\text{e}}} $ represent the SST and the subsurface temperature entrained into the mixed layer; u and v are the zonal and meridional velocity components, respectively; w is the vertical velocity at the base of the mixed layer;$ M(x) = \left\{ {{array}{*{20}{c}} {0,{\kern 1pt} {\kern 1pt} {\kern 1pt} {\kern 1pt} {\kern 1pt} {\kern 1pt} x \leqslant 0} \\ {1,{\kern 1pt} {\kern 1pt} {\kern 1pt} {\kern 1pt} {\kern 1pt} {\kern 1pt} {\kern 1pt} x > 0} {array}} \right. $ is the Heaviside step function; H is the depth of the mixed layer;$ {Q_{\text{a}}} $ is the anomalous net surface heat flux; Res is the residual term. We label the three terms in the zonal advection as U1, U2 and U3, those in the meridional advection as V1, V2, and V3, and those in the vertical advection as W1, W2, and W3. Therefore, the U1 term represents the zonal advective feedback, and the W2 represents the thermocline feedback.Figure 8 compares the composite heat budget averaged over the Niño-3 region for an EP El Niño and over the Niño-4 region for a CP El Niño during their developmental periods. Along with a larger role of the thermocline feedback, both the thermocline feedback (W2 in Fig. 8) and zonal advective feedback (U1 in Fig. 8) significantly contribute to the growth of an EP El Niño in the Niño-3 region. Although the V2 term with its anomalous temperature advection by the mean meridional current is also large during EP El Niño, it tends to advect warm water poleward and broaden the meridional extent of the SST anomaly only after the occurrence of warm SST anomalies along the equator (Kang et al., 2001). Different from an EP El Niño, the development of a CP El Niño event is dominantly determined by the zonal advective feedback, while the thermocline feedback is much weaker (Fig. 8b). During both EP and CP El Niño events, the net surface heat flux (
$ {Q_{\text{a}}} $ ) acts as a damping term with stronger thermal damping present in EP events compared to CP events. In addition, to compare the wind stress response to EP and CP SST anomalies, Figure 8c shows the scatter plots of the equatorial zonal wind stress anomalies and Niño-3 (Niño-4) SST anomalies with a regression fitting line. It shows that stronger westerly wind stress anomalies in the equatorial Pacific are associated with EP SST anomalies. The regression coefficients during EP and CP events are 0.008 and 0.006 Pa °C–1, respectively, indicating a stronger wind response to SST changes during EP El Niño events.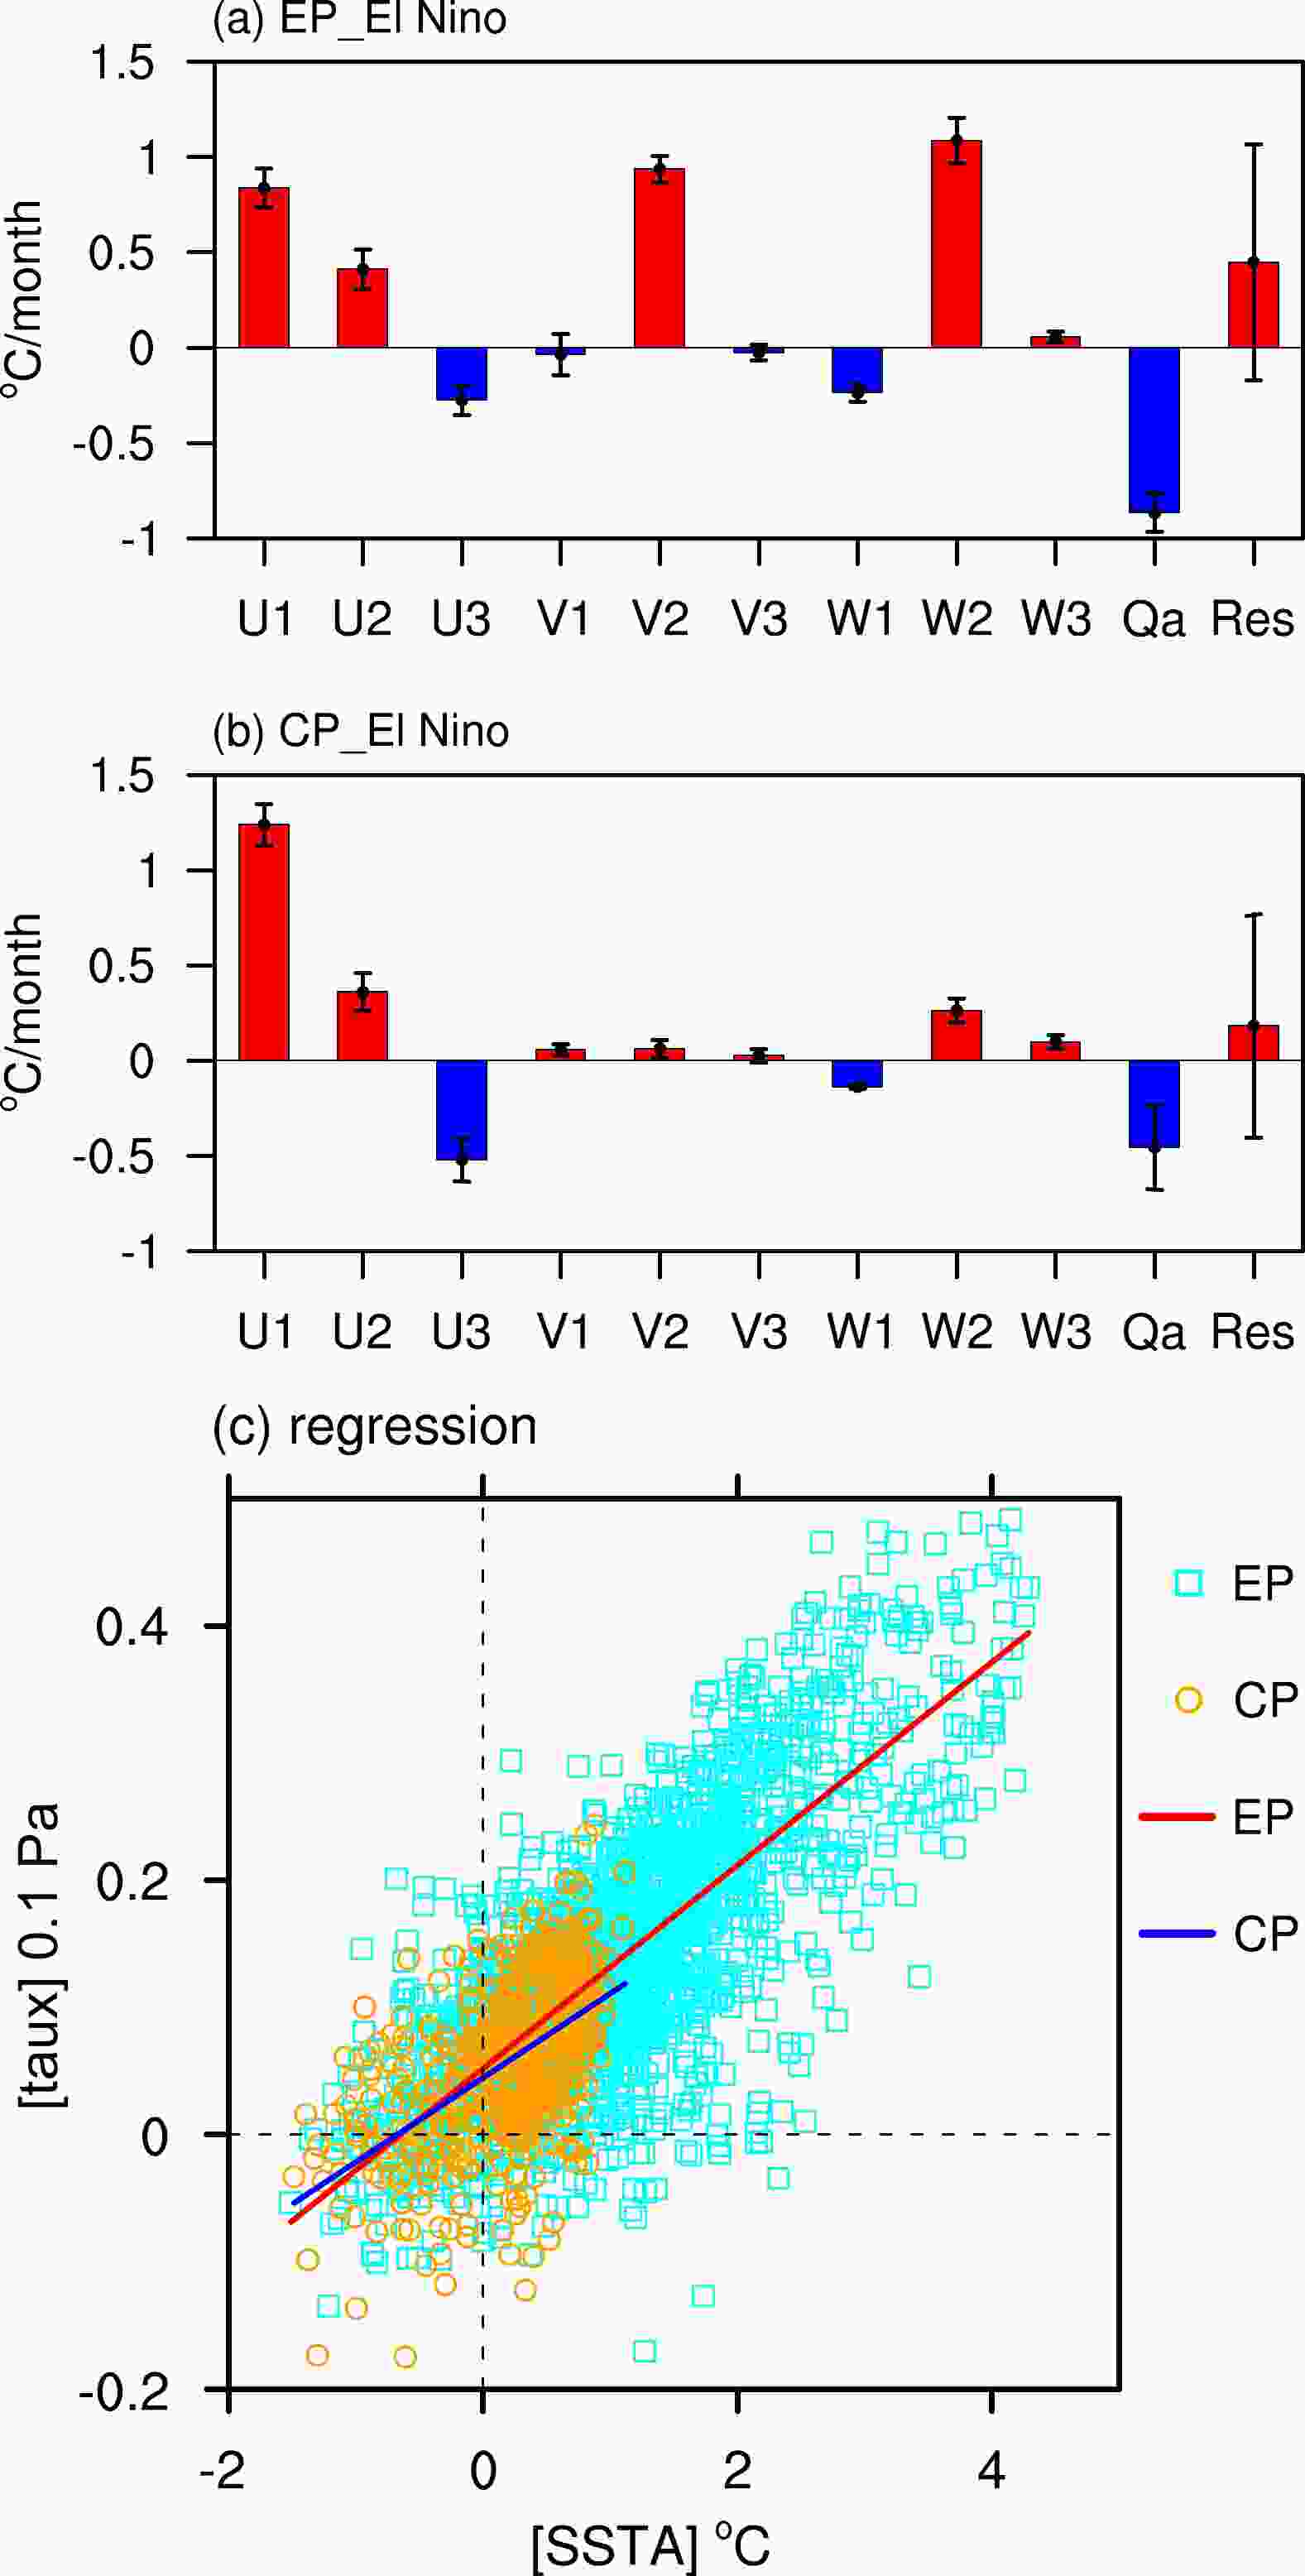
Figure 8. Heat budget in the (a) Niño-3 region during EP El Niño and (b) Niño-4 region during CP El Niño. The budget is calculated from January (0) to November (0) during the peak El Niño year. U1, U2 and U3 represent the zonal advection term
$ - {\kern 1pt} u'\partial \bar T/\partial x $ (i.e., the zonal advective feedback),$ - {\kern 1pt} \bar u\partial T'/\partial x $ , and$ - {\kern 1pt} u'\partial T'/\partial x $ , respectively. V1, V2 and V3 represent the meridional advection term$ - {\kern 1pt} v'\partial \bar T/\partial y $ ,$ - {\kern 1pt} \bar v\partial T'/\partial y $ , and$ - {\kern 1pt} v'\partial T'/\partial y $ , respectively. W1, W2 and W3 represent the vertical advection term$ - {\kern 1pt} {\kern 1pt} (w')M( - w')({\bar T_{\text{e}}} - \bar T)/H $ ,$ - {\kern 1pt} {\kern 1pt} (\bar w)M( - \bar w)({T_{\text{e}}}' - T')/H $ , (i.e., the thermocline feedback), and$ - {\kern 1pt} (w')M( - w')({T_{\text{e}}}' - T')/H $ , respectively.$ {Q_{\text{a}}} $ represents anomalous net surface heat flux. Error bars denote the 95% confidence interval as determined by a Student’s t-test. (c) Scatterplots of zonal wind stress anomalies averaged in a domain bounded by 5°S–5°N, 150°E–120°W versus Niño-3 (Niño-4) SST anomalies for EP (CP) El Niño events. Light blue squares represent EP events and orange circles represent the CP events. The solid red and blue lines indicate the regression lines for EP and CP El Niño events, respectively. -
As illustrated in previous sections, the HCMAGCM can realistically depict both EP and CP El Niño events, with distinctive spatial characteristics and dominant dynamical processes. According to the formulation of the HCMAGCM, active ocean–atmosphere coupling is allowed only in the tropical Pacific; therefore, the results highlight the dominant importance of internal processes within the tropical Pacific for producing ENSO diversity. Then, a question arises: what are the causes responsible for generating ENSO diversity in the tropical Pacific? To address this question, we analyze the possible relationship between the tropical Pacific decadal mean states and the occurrence of different El Niño types.
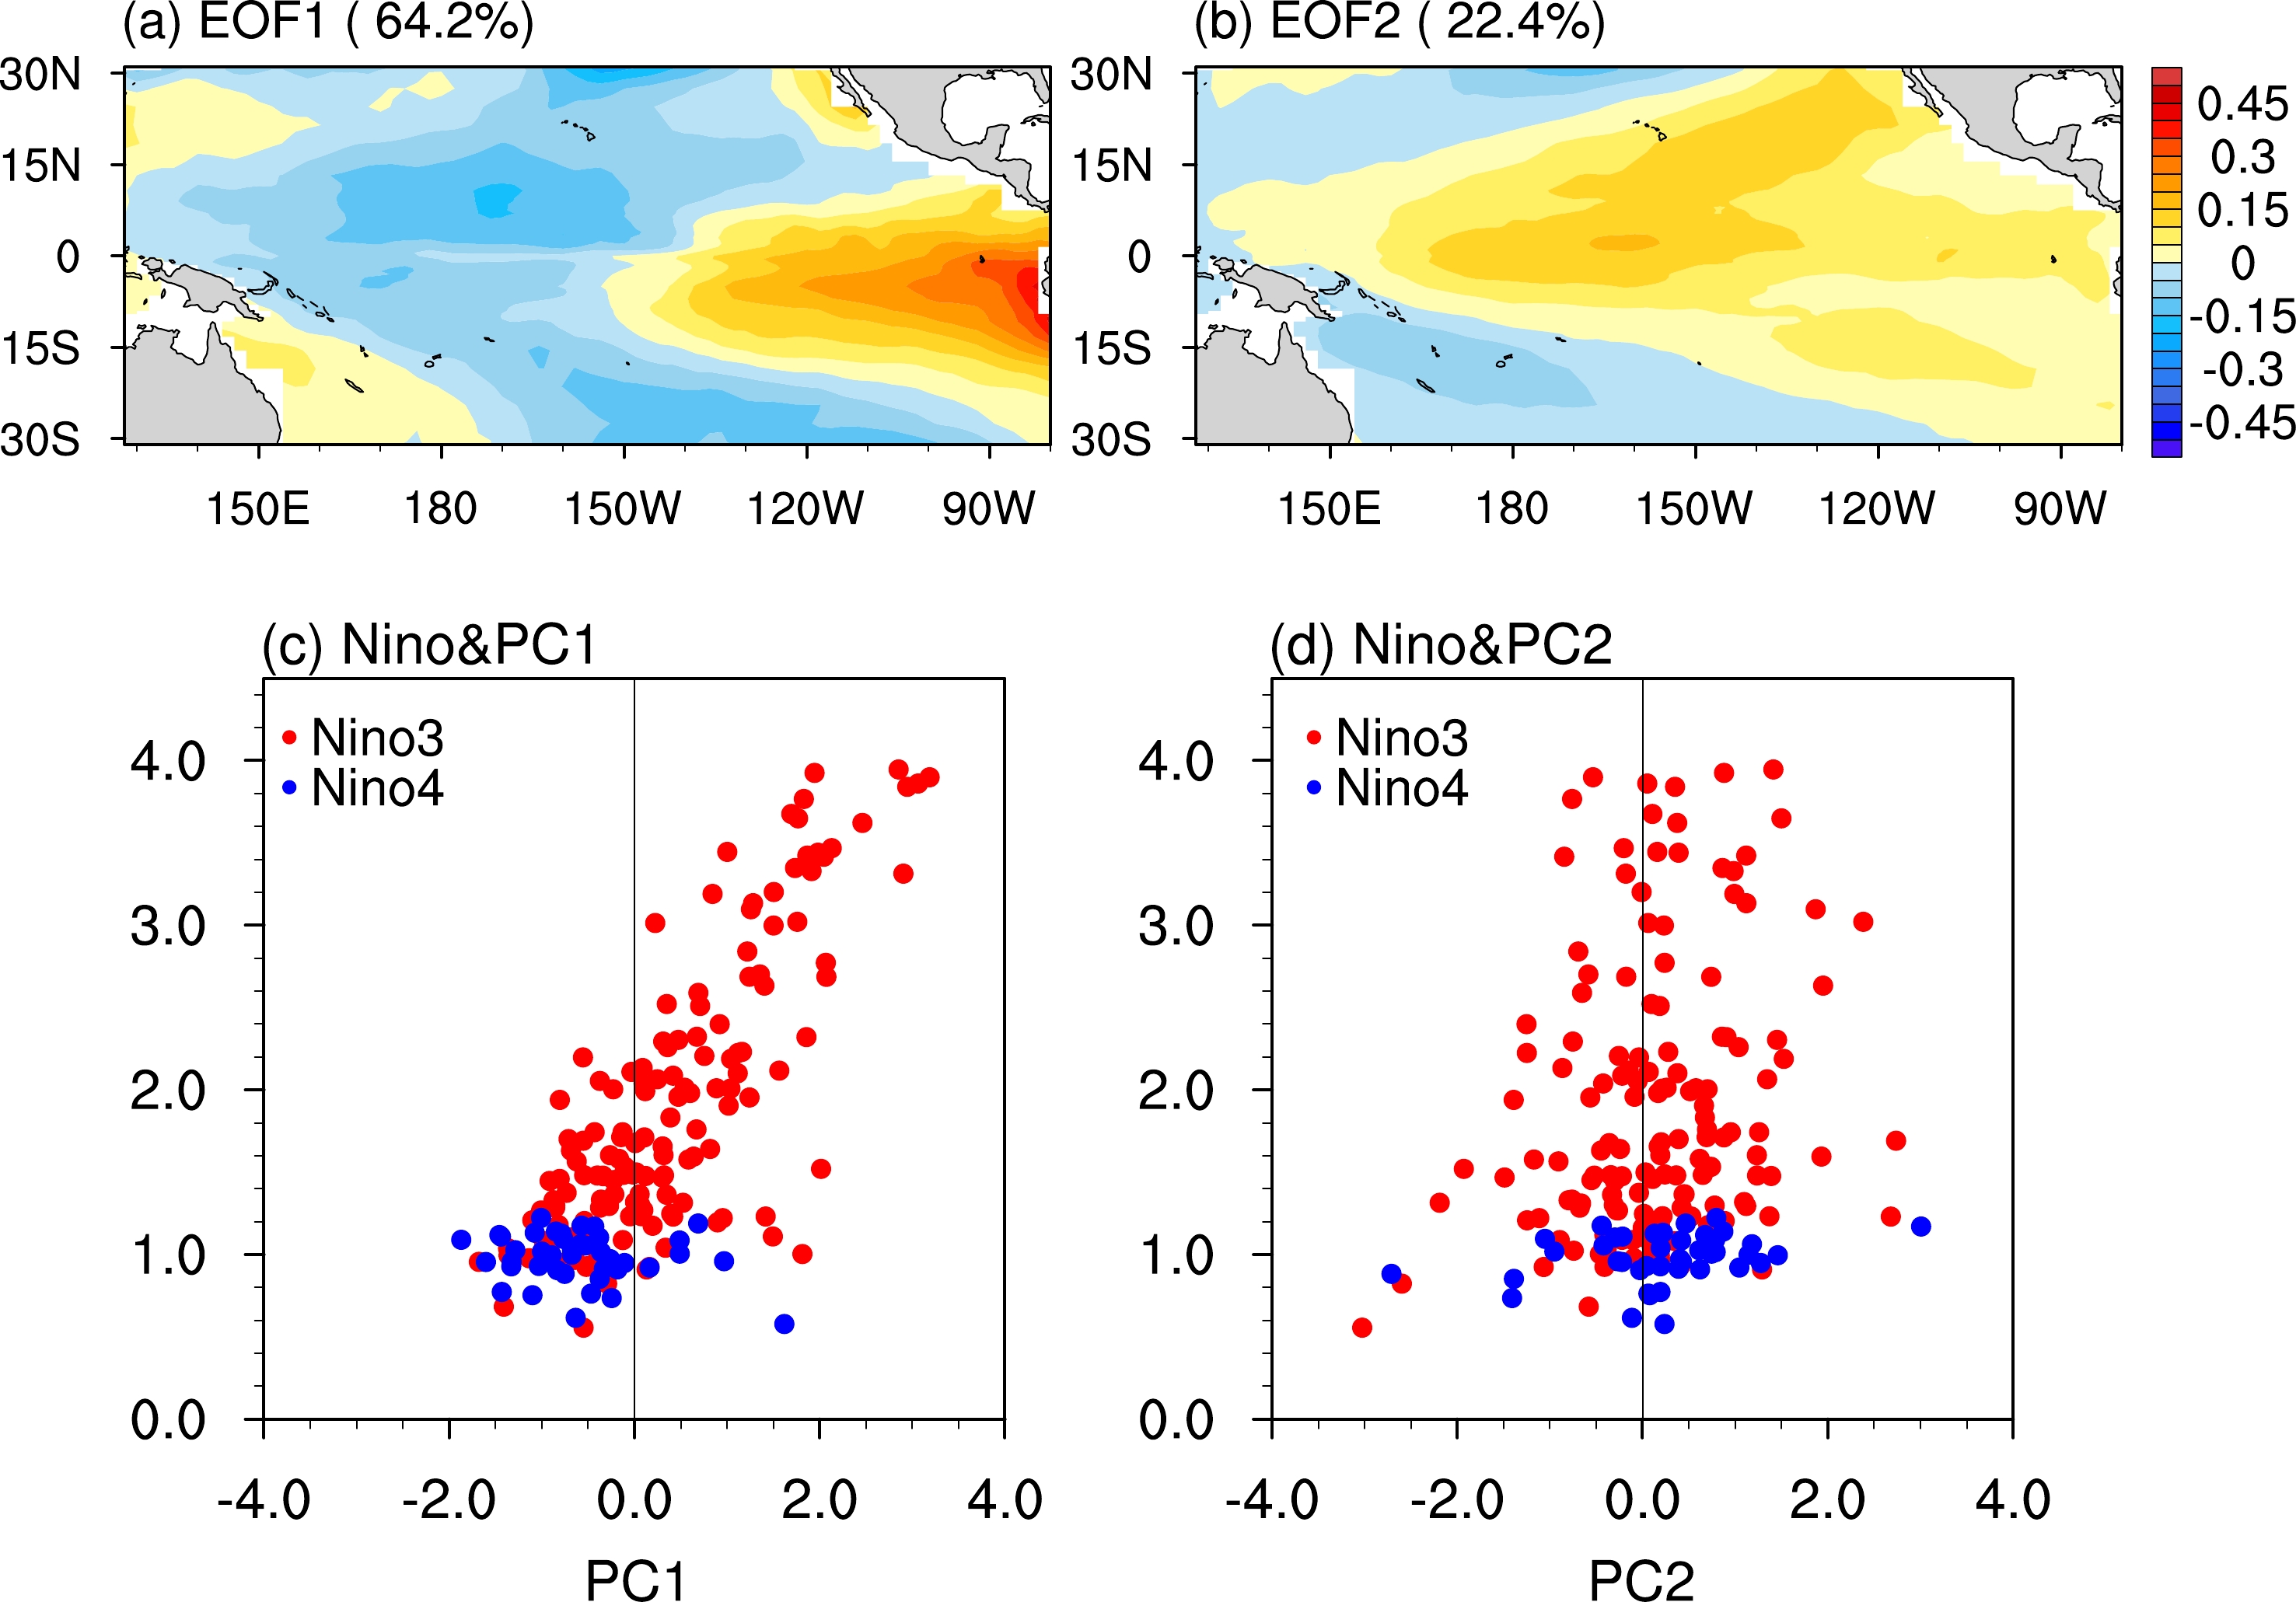
To obtain the tropical Pacific decadal variability in the HCMAGCM, an empirical orthogonal function (EOF) analysis is applied to the 10-yr low-pass filtered SST anomalies. Figures 9a and 9b show the spatial patterns of the EOF1 and EOF2 modes, respectively. The EOF1 features an east-west dipole structure, while the EOF2 displays an ENSO-like pattern but with a broad structure. To explore the relationship between the two EOF decadal modes and the occurrences of different El Niño types, the corresponding principal component (PC) time series, using Niño-3 for an EP El Niño and Niño-4 for a CP El Niño, are shown in Figs. 9c and 9d. It shows that when the amplitude of Niño-3 increases, the PC1 becomes larger, indicating a relationship between changes in the EP El Niño amplitude and PC1. Quantitatively, the decadal changes of the amplitude of EP events are represented by the 10-yr low-pass filtered standard deviation of Niño-3 indices, which are strongly correlated with PC1 (the correlation coefficient r = 0.75). This suggests that the decadal dipole mode in the HCMAGCM may be related to the decadal changes in ENSO amplitude, consistent with previous studies (Choi et al., 2012; Ogata et al., 2013). As for the CP El Niño, it is evident that the CP events occur more frequently during the positive periods of PC2, indicating that an ENSO-like warming decadal condition is often related to frequent occurrences of CP El Niño events. These results indicate a possible modulating role played by the ENSO-like decadal modes regarding CP El Niño preference in the HCMAGCM.
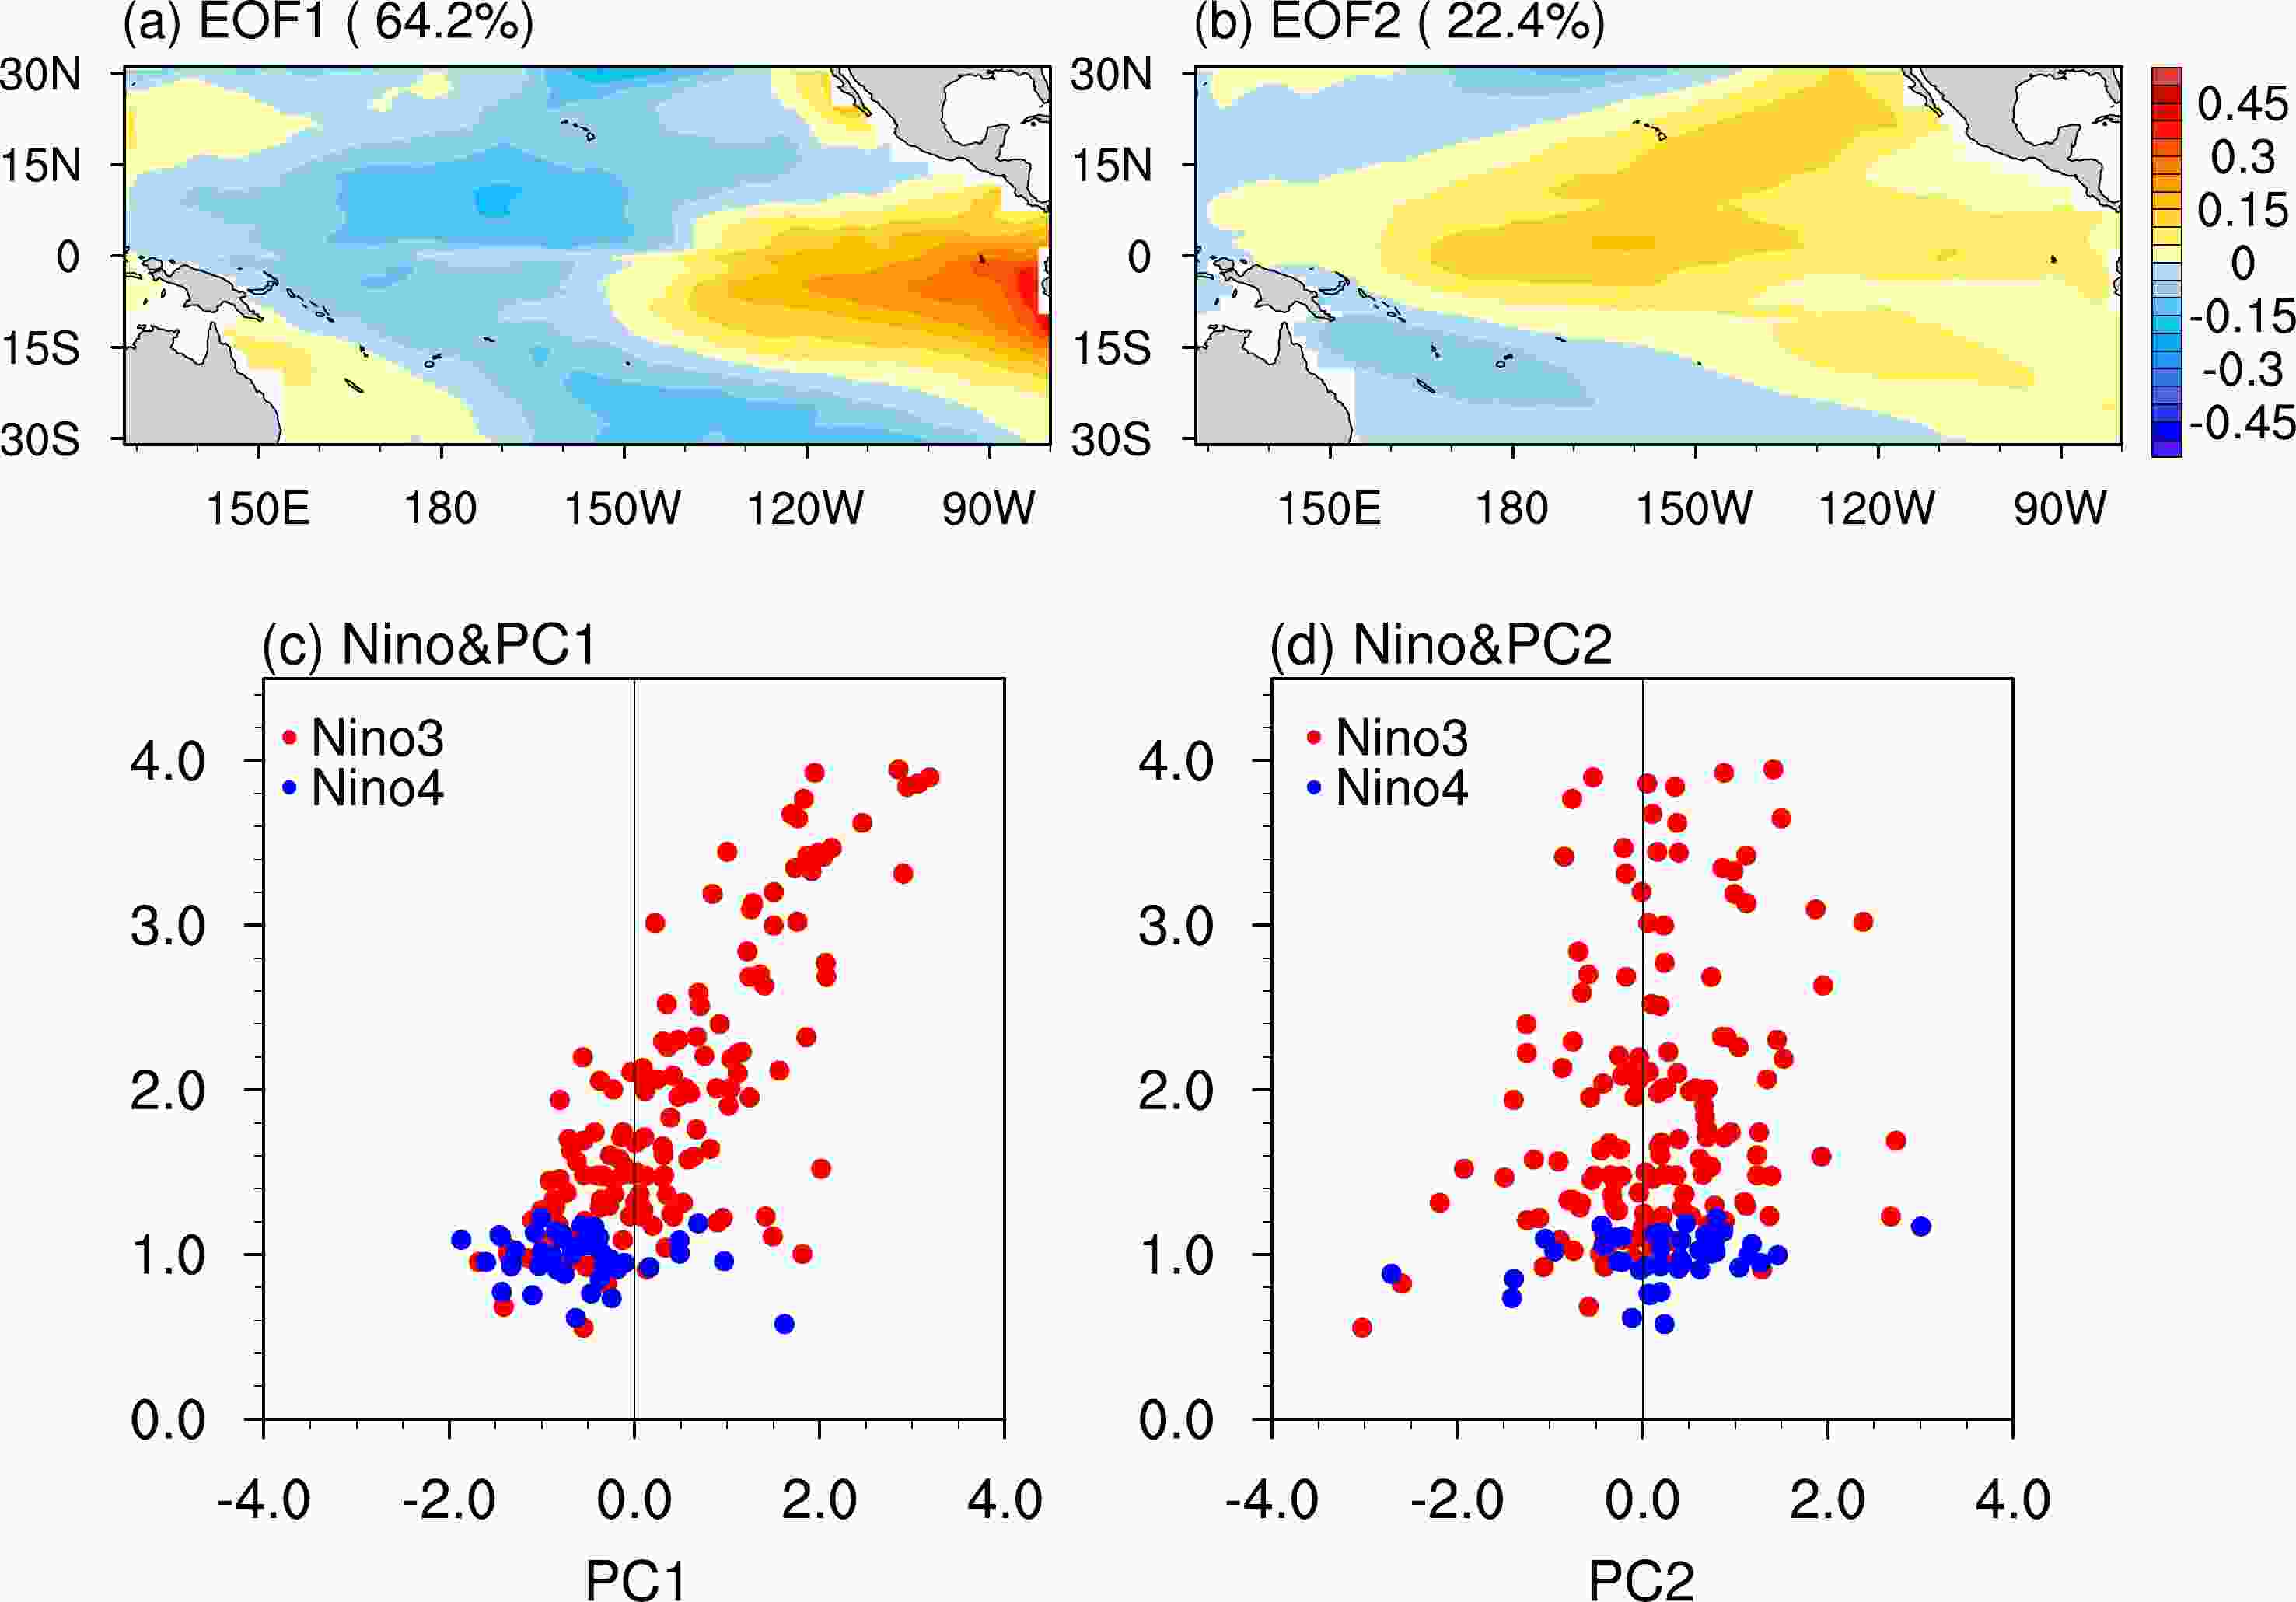
Figure 9. (a, b) The EOF1 and EOF2 modes of the 10-yr low-pass filtered SSTA, and (c, d) the corresponding PCs and Niño indices during the November-January of El Niño years in the model.
Indeed, some previous studies have suggested that different decadal conditions in the tropical Pacific favor different dynamic processes, thereby affecting the occurrence of the two El Niño types (Choi et al., 2011; Chung and Li, 2013; Zhong et al., 2017). However, it is still a matter of debate as to whether the tropical Pacific decadal variability is generated purely through internal processes of the tropical Pacific or caused by extratropical influences (e.g., the PDO). Recalling again the model formulation, the results in our study may indicate that these decadal variations can be internally generated within the tropical Pacific coupled system. Nevertheless, further detailed analysis regarding the origins of the two decadal modes is needed in the future and is beyond the scope of this study. In addition, it is worth noting that the close relationship between the two types of El Niño events and the tropical Pacific decadal modes in the HCMAGCM does not imply a simple causality because the atmospheric and oceanic variability on different timescales are always coherently and consistently occurring due to the coupling. Furthermore, note that in observations the decadal ENSO-like mode emerges as the first EOF mode, while the dipole mode is the second mode. These differences between the model and observations are primarily attributed to the lack of tropical–extratropical coupling processes in the HCMAGCM, where the ocean model is restricted solely to the tropical Pacific. Consequently, the signal of tropical Pacific decadal variability is underestimated and the rectification effects of ENSO are overestimated. Therefore, the decadal dipole mode, which is closely related to ENSO rectification effects, becomes the leading mode in the HCMAGCM.
-
The detailed structure of El Niño SST anomalies determines the shifts of tropical deep convection, atmospheric heating, and consequently far-field teleconnections to mid-high latitudes. Previous studies have indicated the existing differences in the global teleconnections induced by EP and CP El Niño events (Ashok et al., 2007; Weng et al., 2007, 2009; Trenberth and Smith, 2009; Hu et al., 2012; Gushchina et al., 2022). In section 3, we have demonstrated that the amplitude and spatial pattern of SST anomalies are well distinguished between EP and CP El Niño events in the simulation of HCMAGCM. In this section, the respective atmospheric responses to EP and CP El Niño events are compared to explore whether the extratropical atmospheric teleconnections associated with EP and CP types are also different in the model simulation. The analysis focuses on the wintertime of November–January in the El Niño peak year, considering the strong atmospheric circulation response to El Niño SST forcing in this season.
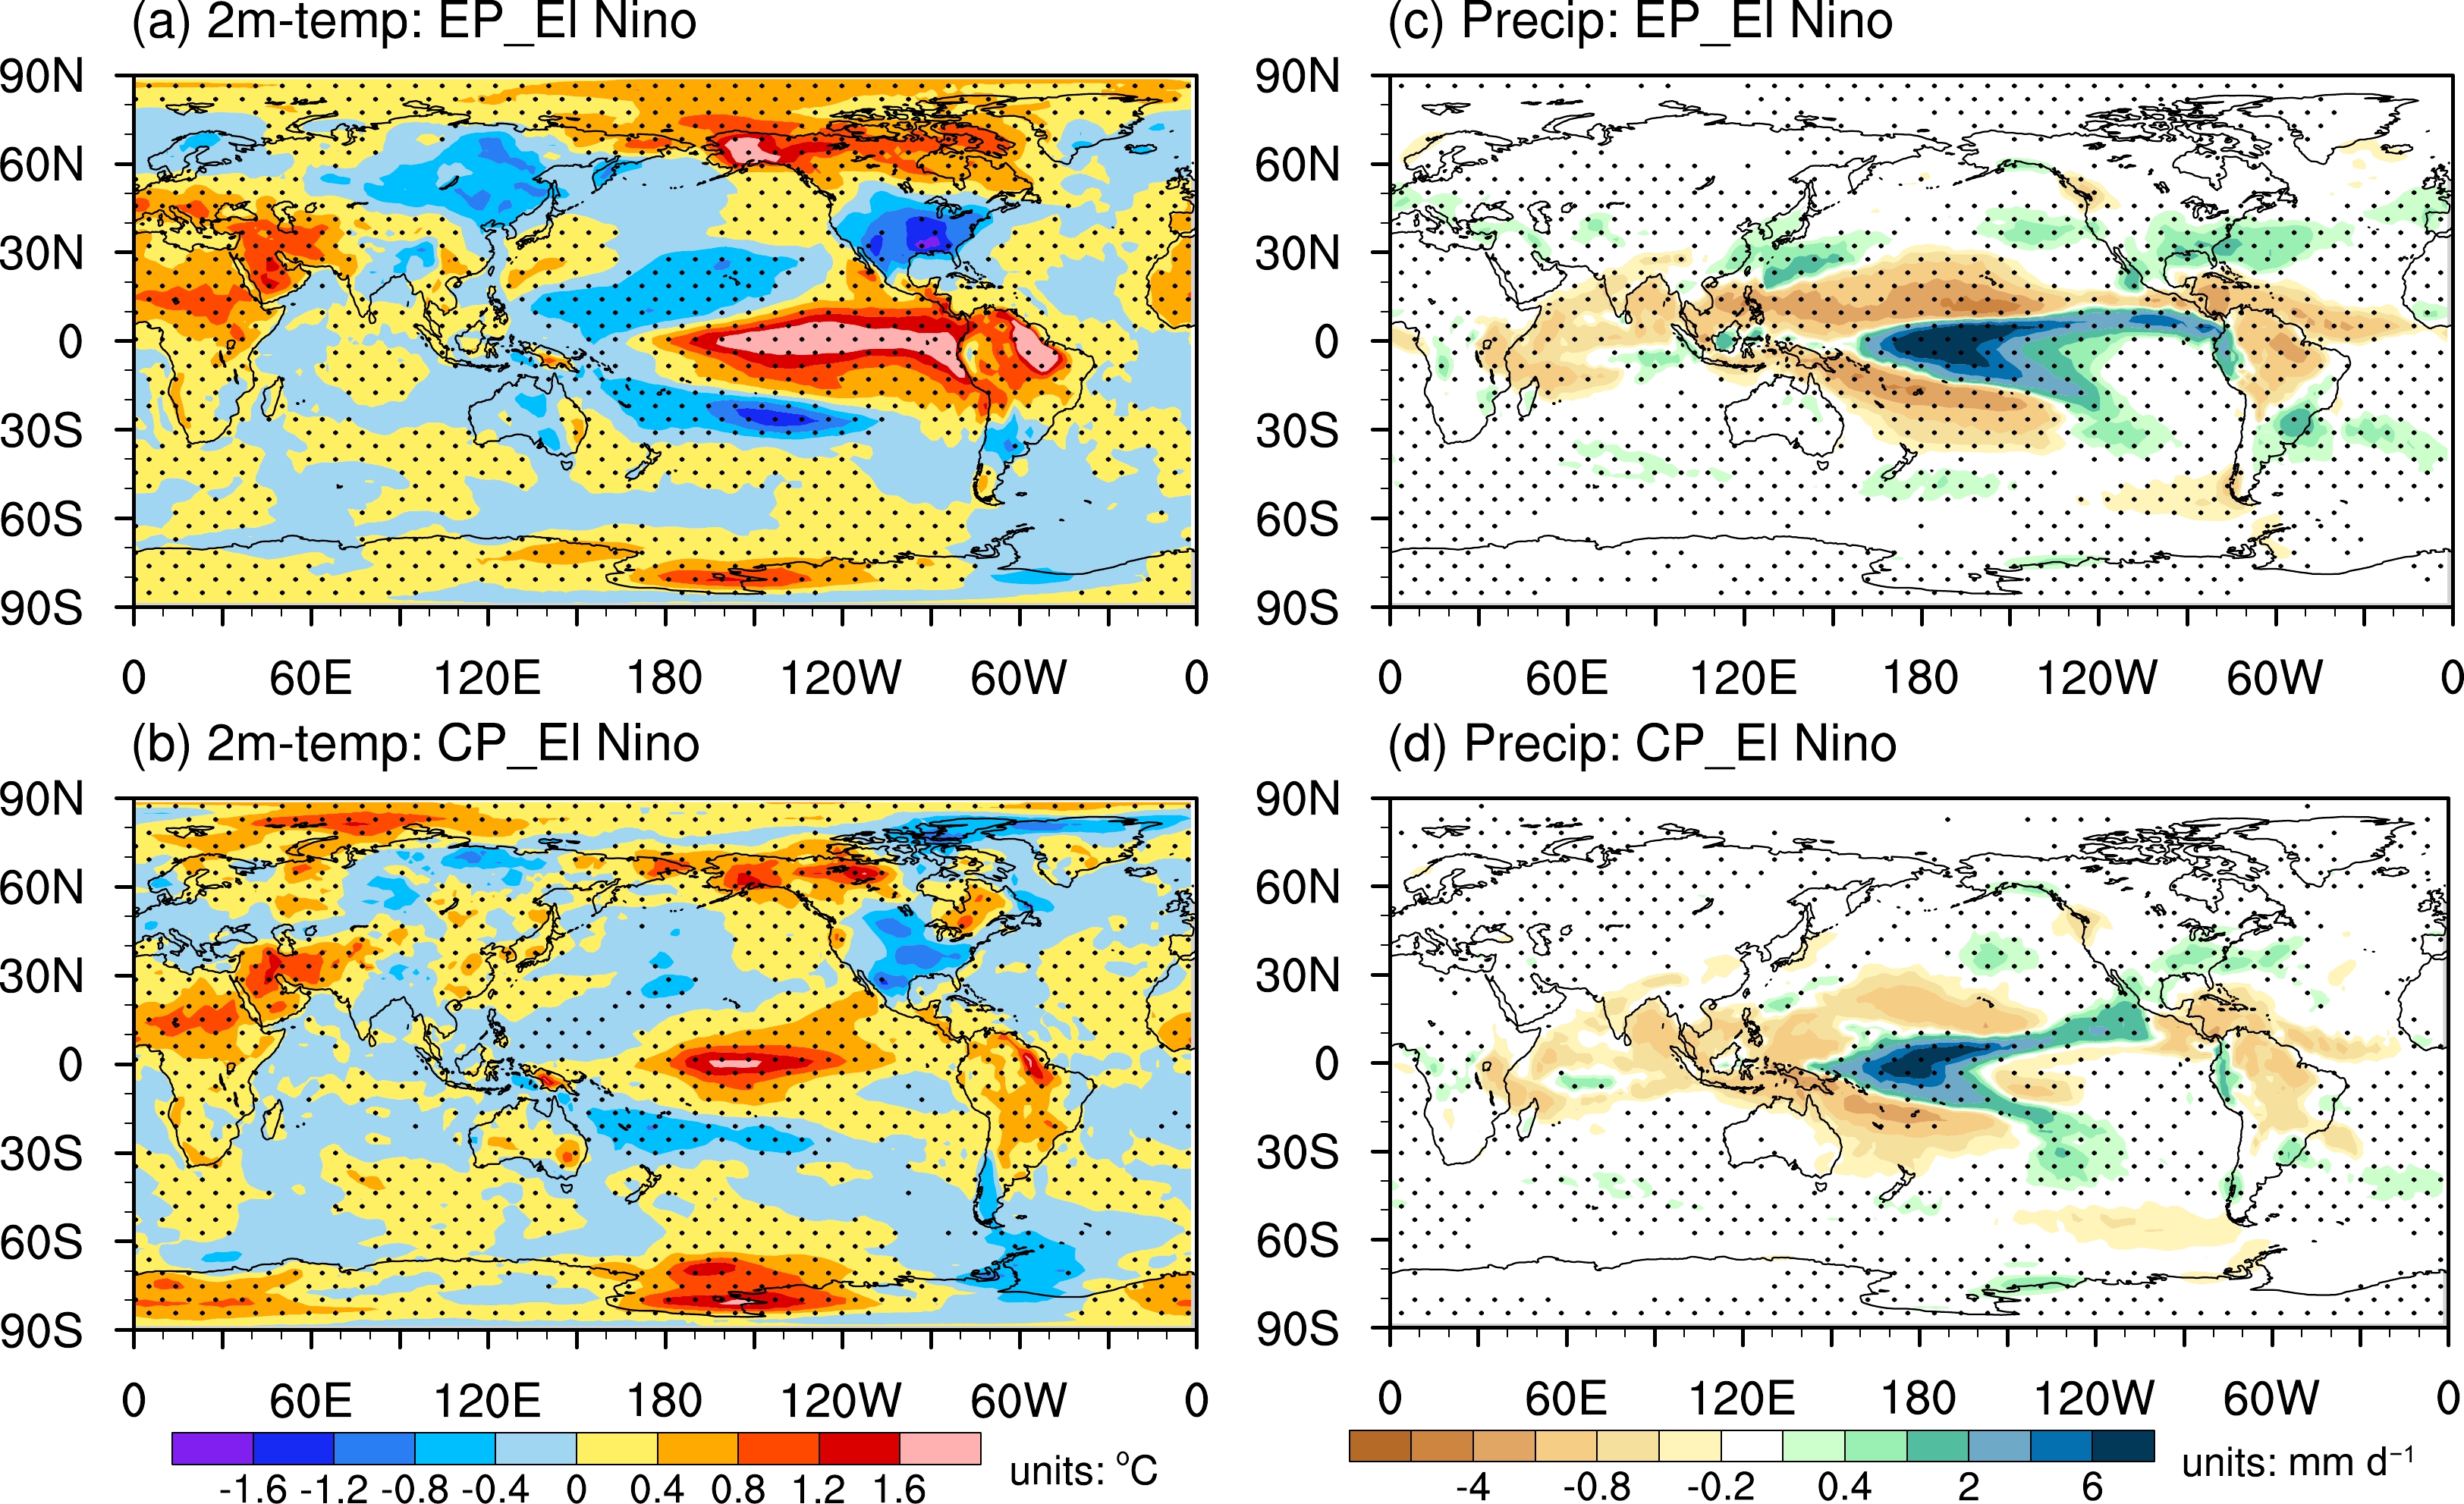
The composite anomalies of global wintertime 2-m temperature and precipitation during EP and CP El Niño events are presented in Fig. 10. For the two types of events, the changes in 2-m temperature over the tropical Pacific follow the imposed SST anomalies, with two cold bands in the South and North Pacific Oceans linked in the western tropical Pacific (Figs. 10a, b). However, the 2-m temperature responses in the Eurasian continent and North America are substantially different between EP and CP El Niño events. The temperature anomalies during an EP El Niño show a uniform cold pattern in the Eurasian continent, while those in a CP El Niño exhibit regional-scale characteristics. This is likely related to the fact that the composite anomalies during a CP El Niño have smaller amplitudes and are more easily affected by noise. In the North America, the EP El Niño produces a well-defined warm-north and cold-south anomaly pattern, whereas the southern cold anomalies extend northward and warm anomalies are located in the eastern and western coasts during a CP El Niño. However, the southern cold anomalies fail to demonstrate statistical significance in either event type. For the precipitation responses, large anomalies are mainly confined to 50°S–50°N (Figs. 10c, d). In the tropical Pacific, the main differences in precipitation changes between EP and CP El Niño events are over the eastern equatorial Pacific, where a CP El Niño causes a reduction in precipitation. Outside the tropical Pacific, there are strong similarities in the precipitation patterns between EP and CP El Niño events in some regions, but with different magnitudes. For example, compared with a CP El Niño, the precipitation induced by an EP El Niño exhibits much larger increases in the southeastern United States, southeastern China, southern Japan, and southeastern South America, respectively.
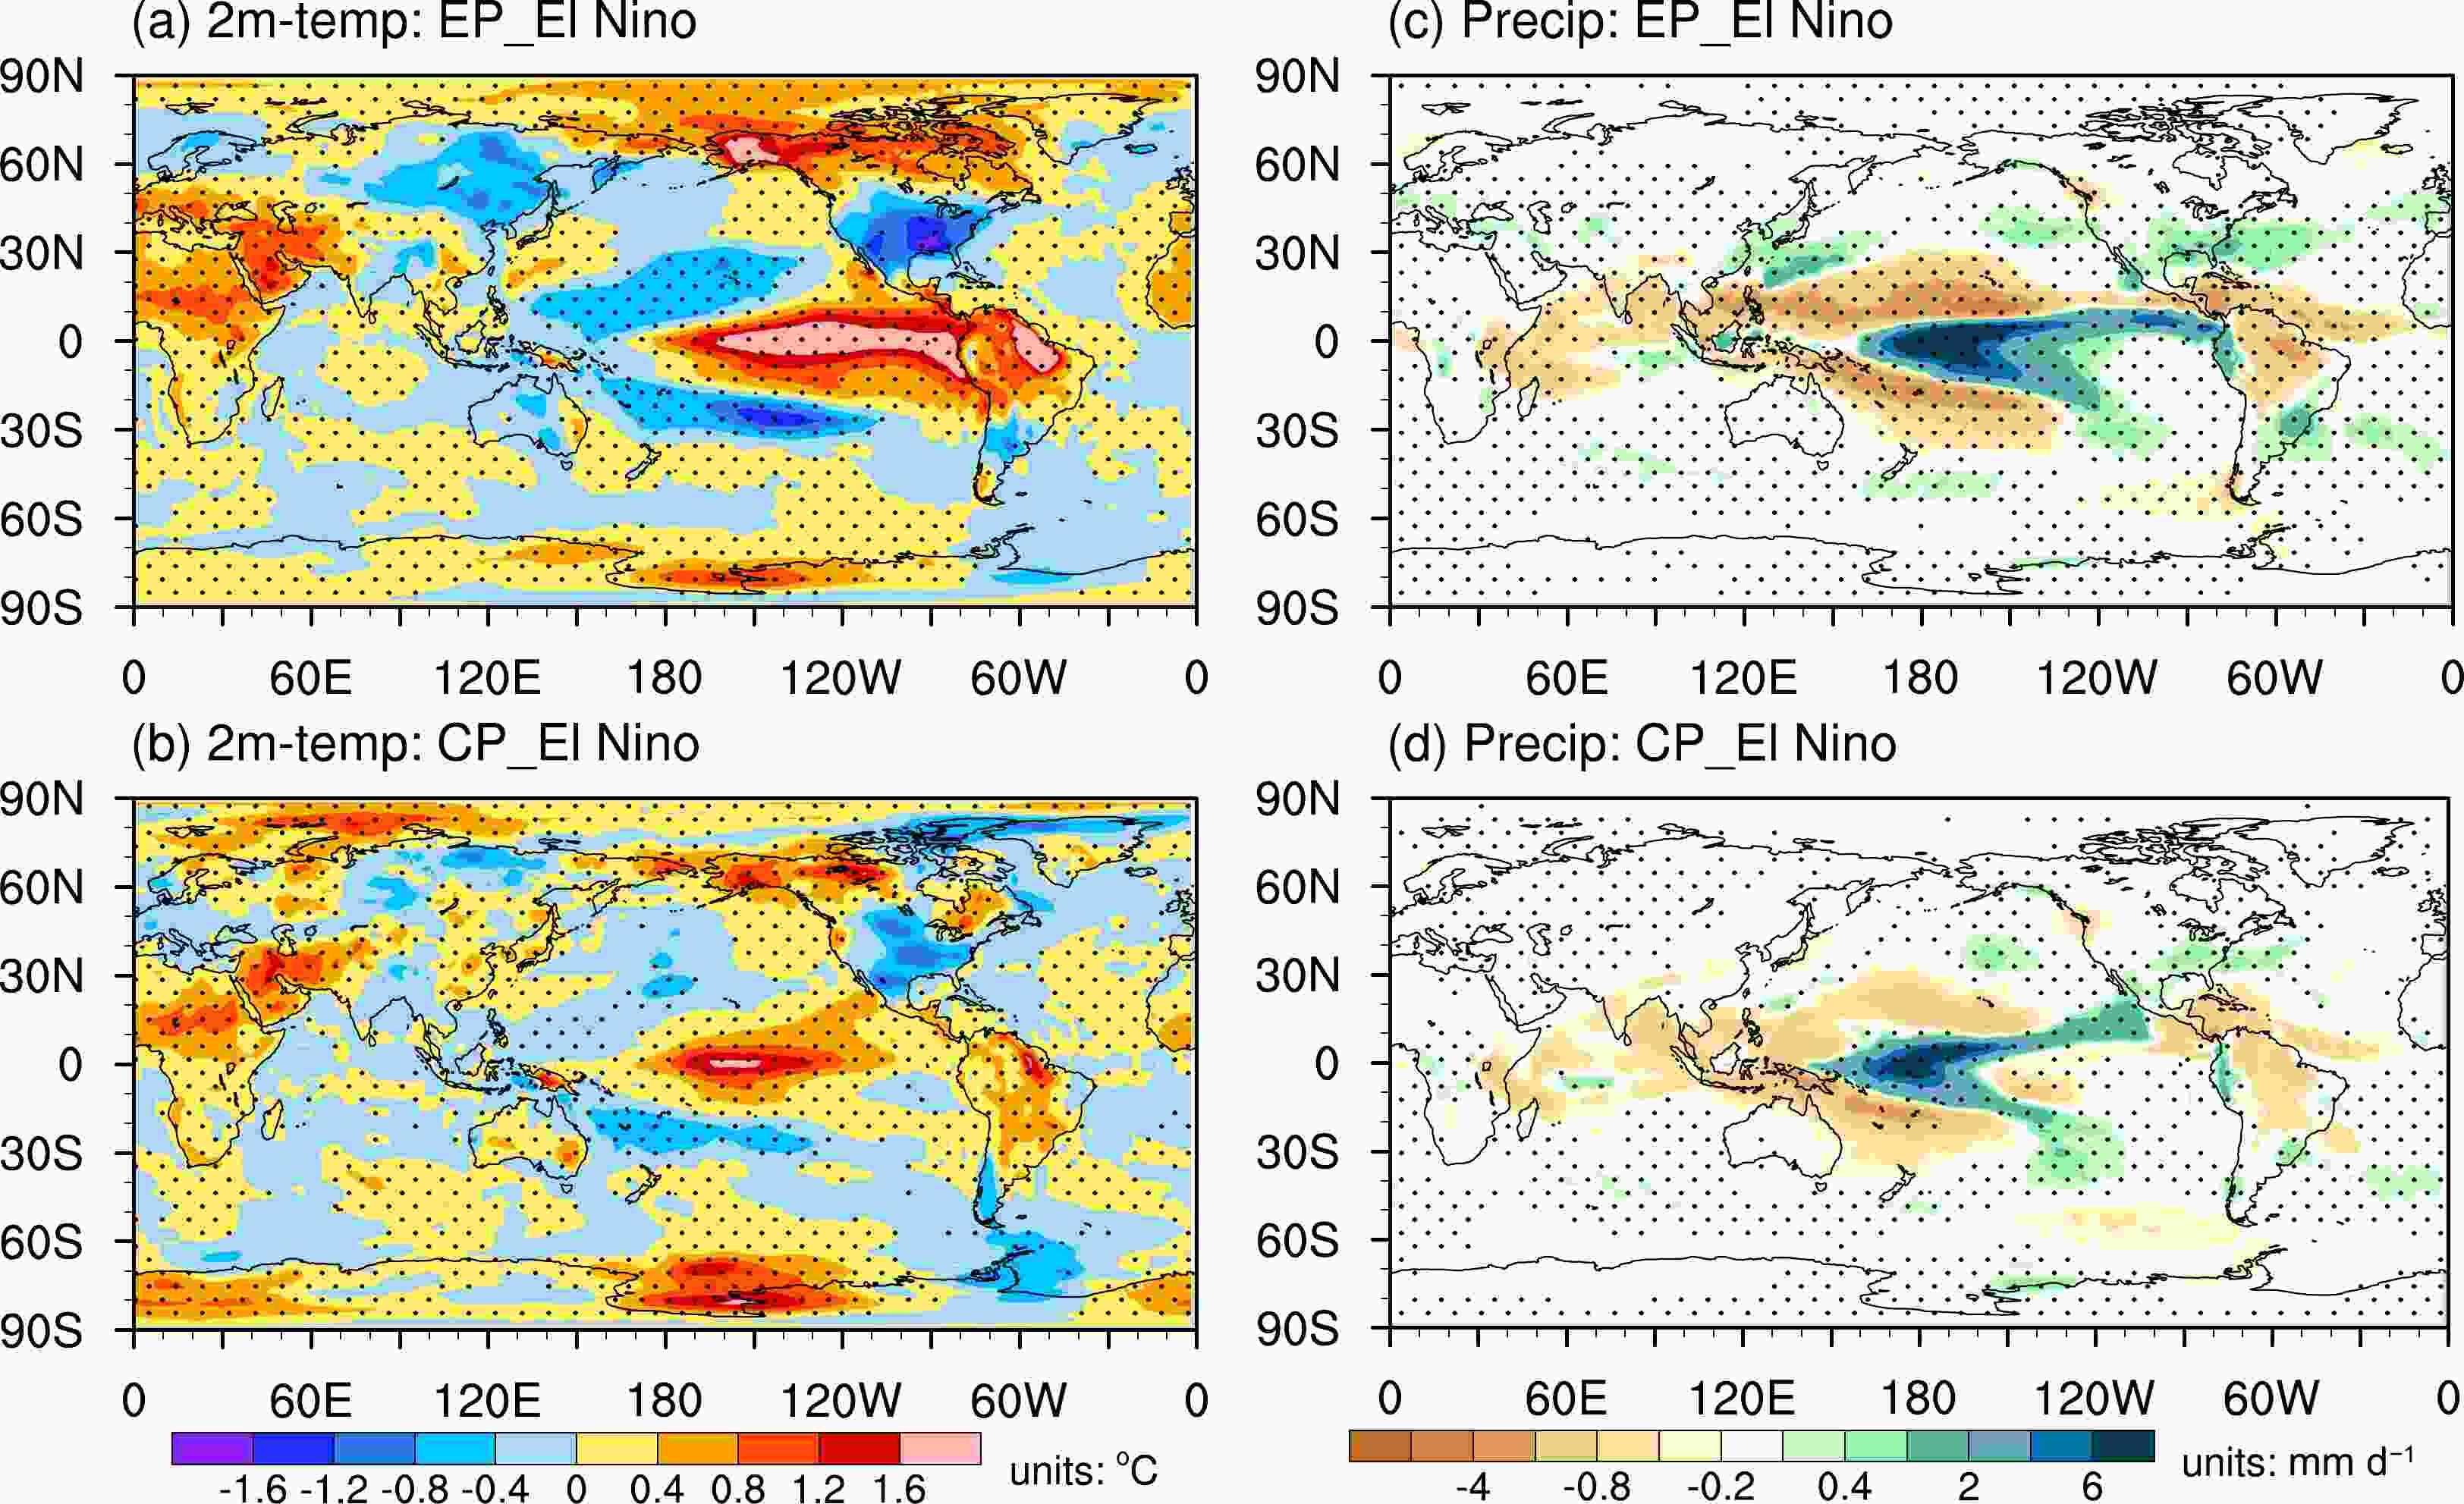
Figure 10. Composite anomalies of global (a, b) 2-m temperature and (b, d) precipitation in November–January for EP El Niño and CP El Niño events from the HCMAGCM simulation. Dotted areas indicate the 95% confidence level according to a Student’s t-test.
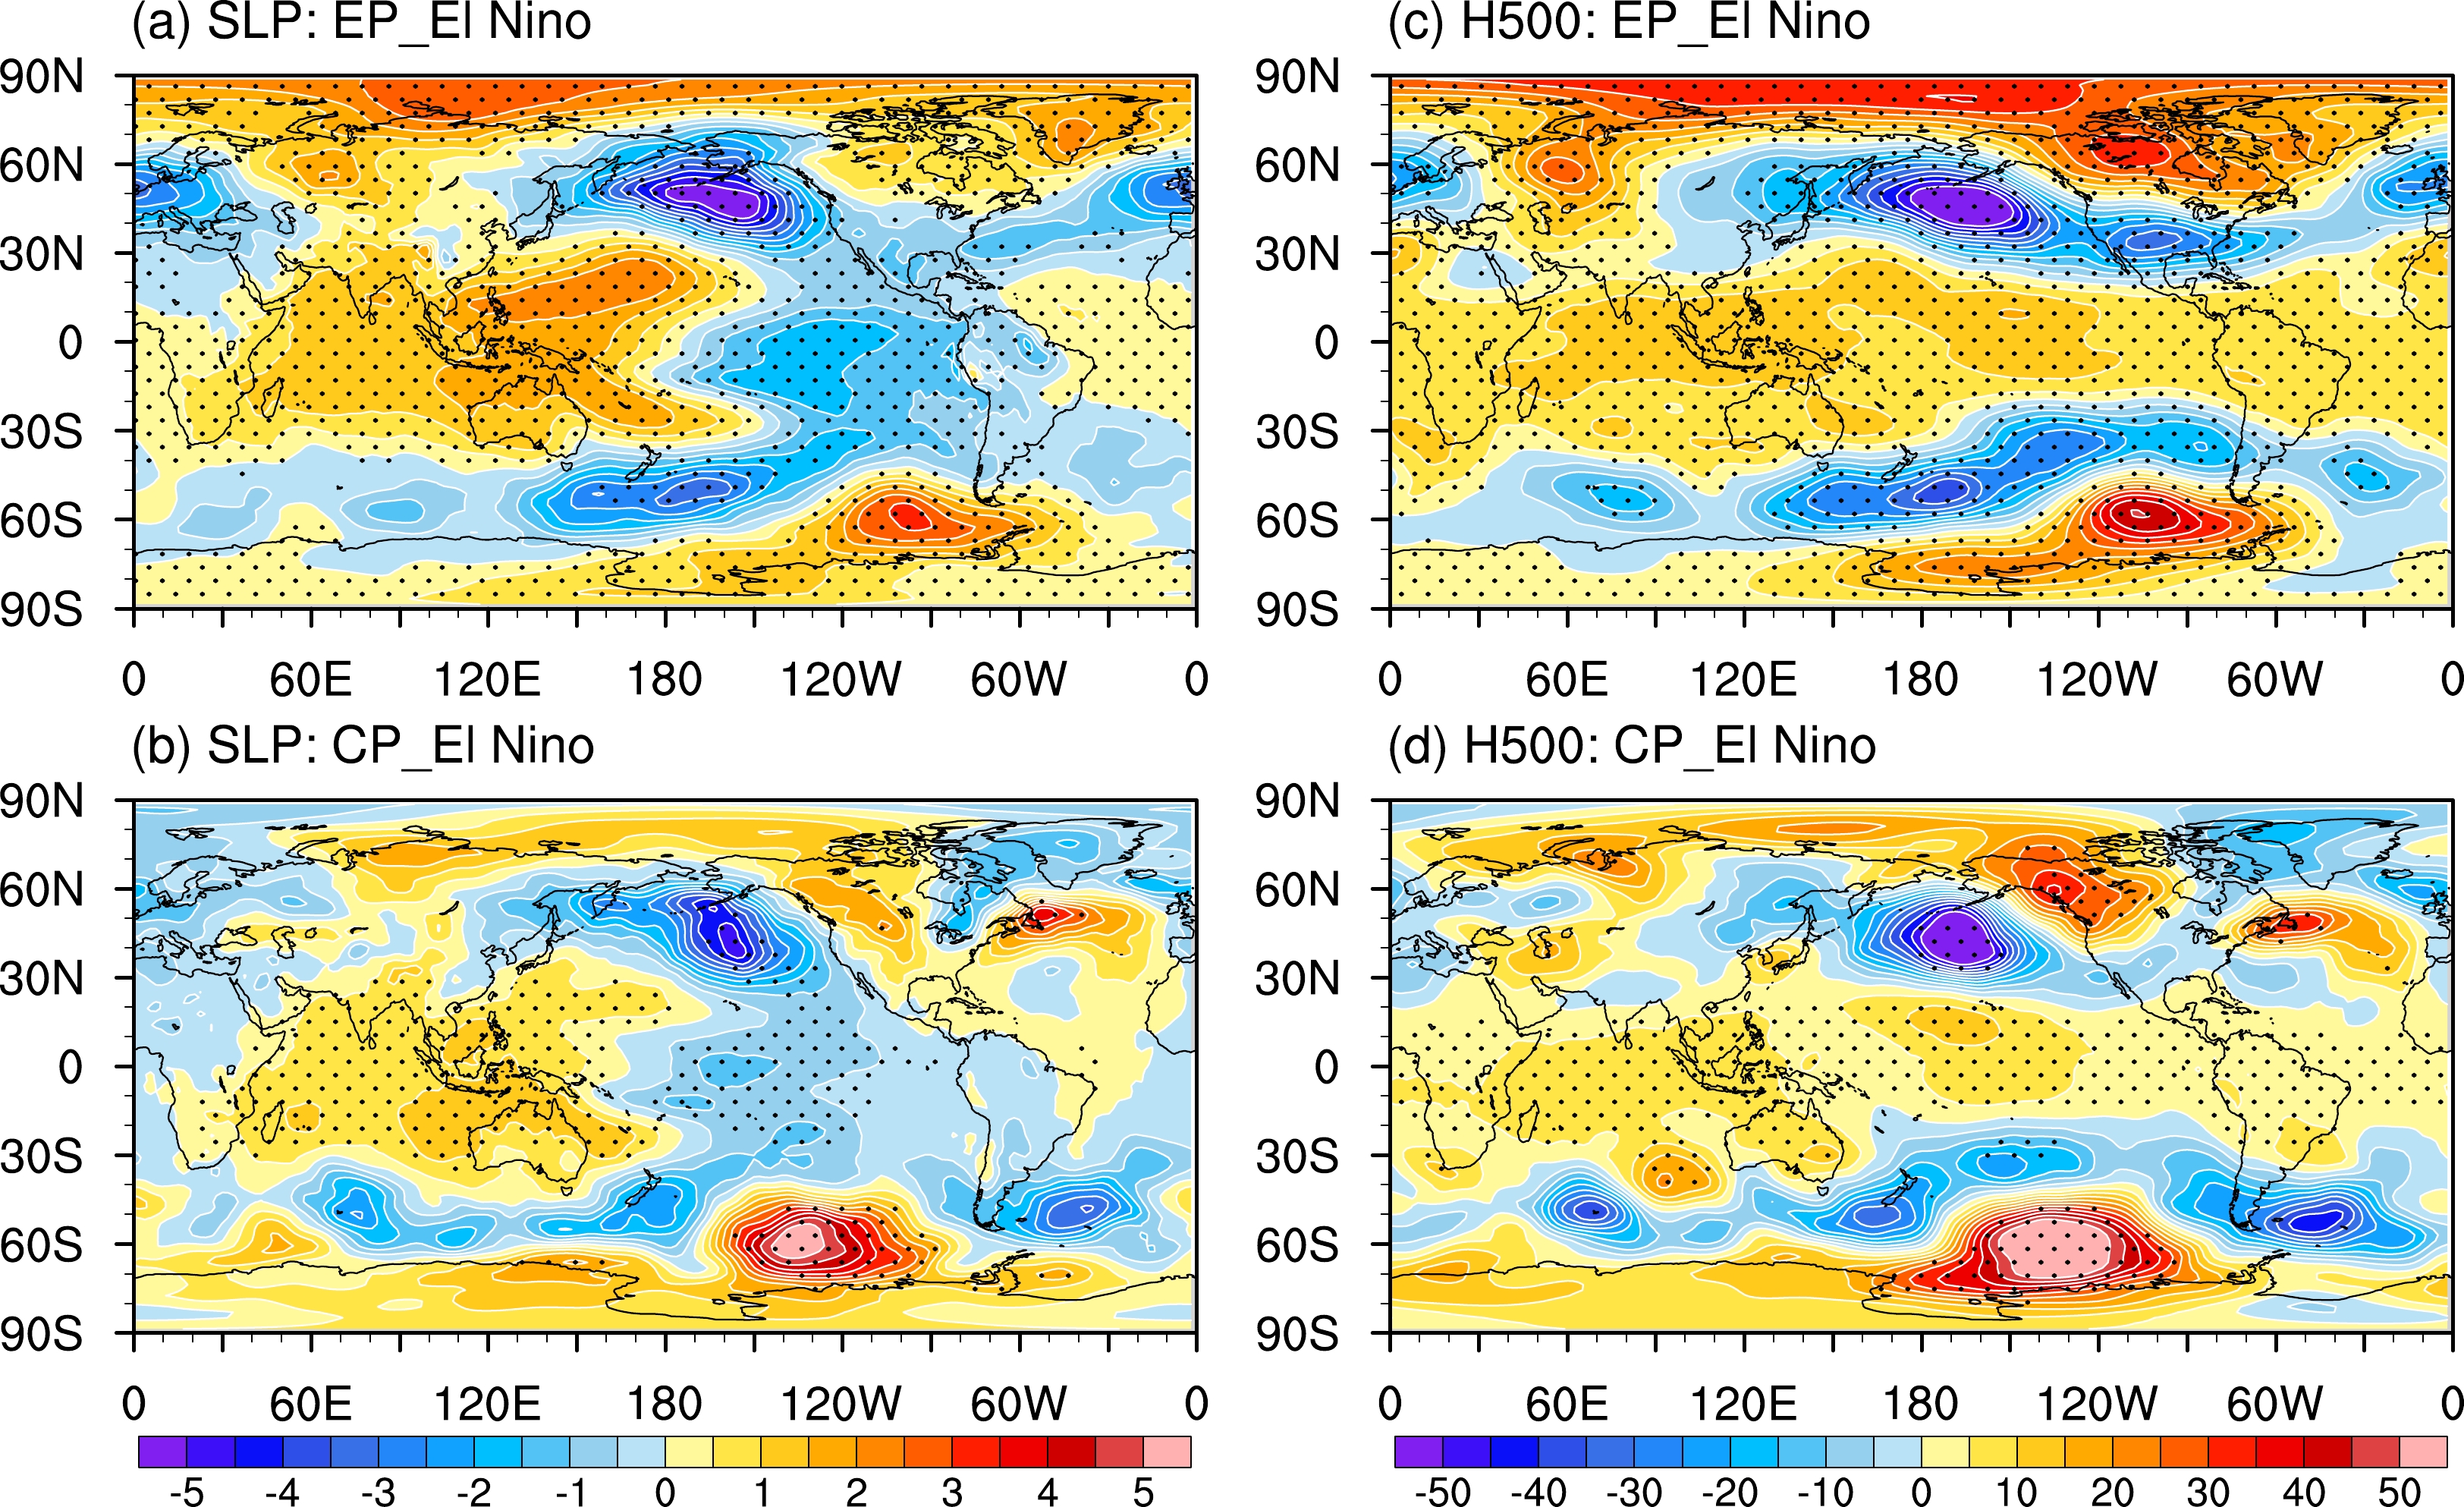
Regarding the SLP response, there is a negative SLP anomaly in the eastern tropical Pacific and a positive anomaly in the western tropical Pacific and Maritime Continent, a pattern typical of the Southern Oscillation (Figs. 11a, b). The negative anomalies in the North and South Pacific Oceans are also clearly seen in both the EP and CP El Niño composites. Overall, the SLP response patterns display a westward shift for the CP El Niño relative to the EP El Niño, except for a different structure in North America. Note that the SLP responses in the extratropical regions during a CP El Niño are statistically less significant compared to EP events, which is likely due to the smaller amplitude and sample size of CP events. Figure 11 also shows the 500-hPa geopotential height anomalies, which represent the large-scale, mid-tropospheric changes in the circulation and are closely related to the tropical SST forcing. Due to the tropospheric warming forced by El Niño SST anomalies, a positive anomaly band covers the tropical and subtropical latitudes, which has a weaker amplitude in a CP El Niño than EP El Niño. Major differences between EP and CP El Niño events are seen in the North Pacific and North American regions (Figs. 11c, d). During an EP El Niño, there are positive centers to the south of Hawaii and northeastern Canada, respectively, with a negative band stretching from the North Pacific across the United States to the North Atlantic. This 500-hPa geopotential height anomaly pattern during an EP El Niño events is similar to the poleward wave train addressed by Yu et al. (2012). However, the 500-hPa geopotential height anomaly with a CP El Niño is more like the Pacific North American (PNA) pattern, characterized by high centers over Hawaii and western Canada, and low centers over the Aleutian Islands and western United States. In addition, there are three anomaly centers circularly distributed in the North Atlantic during a CP El Niño, which obviously differs from the negative band structure during an EP El Niño.
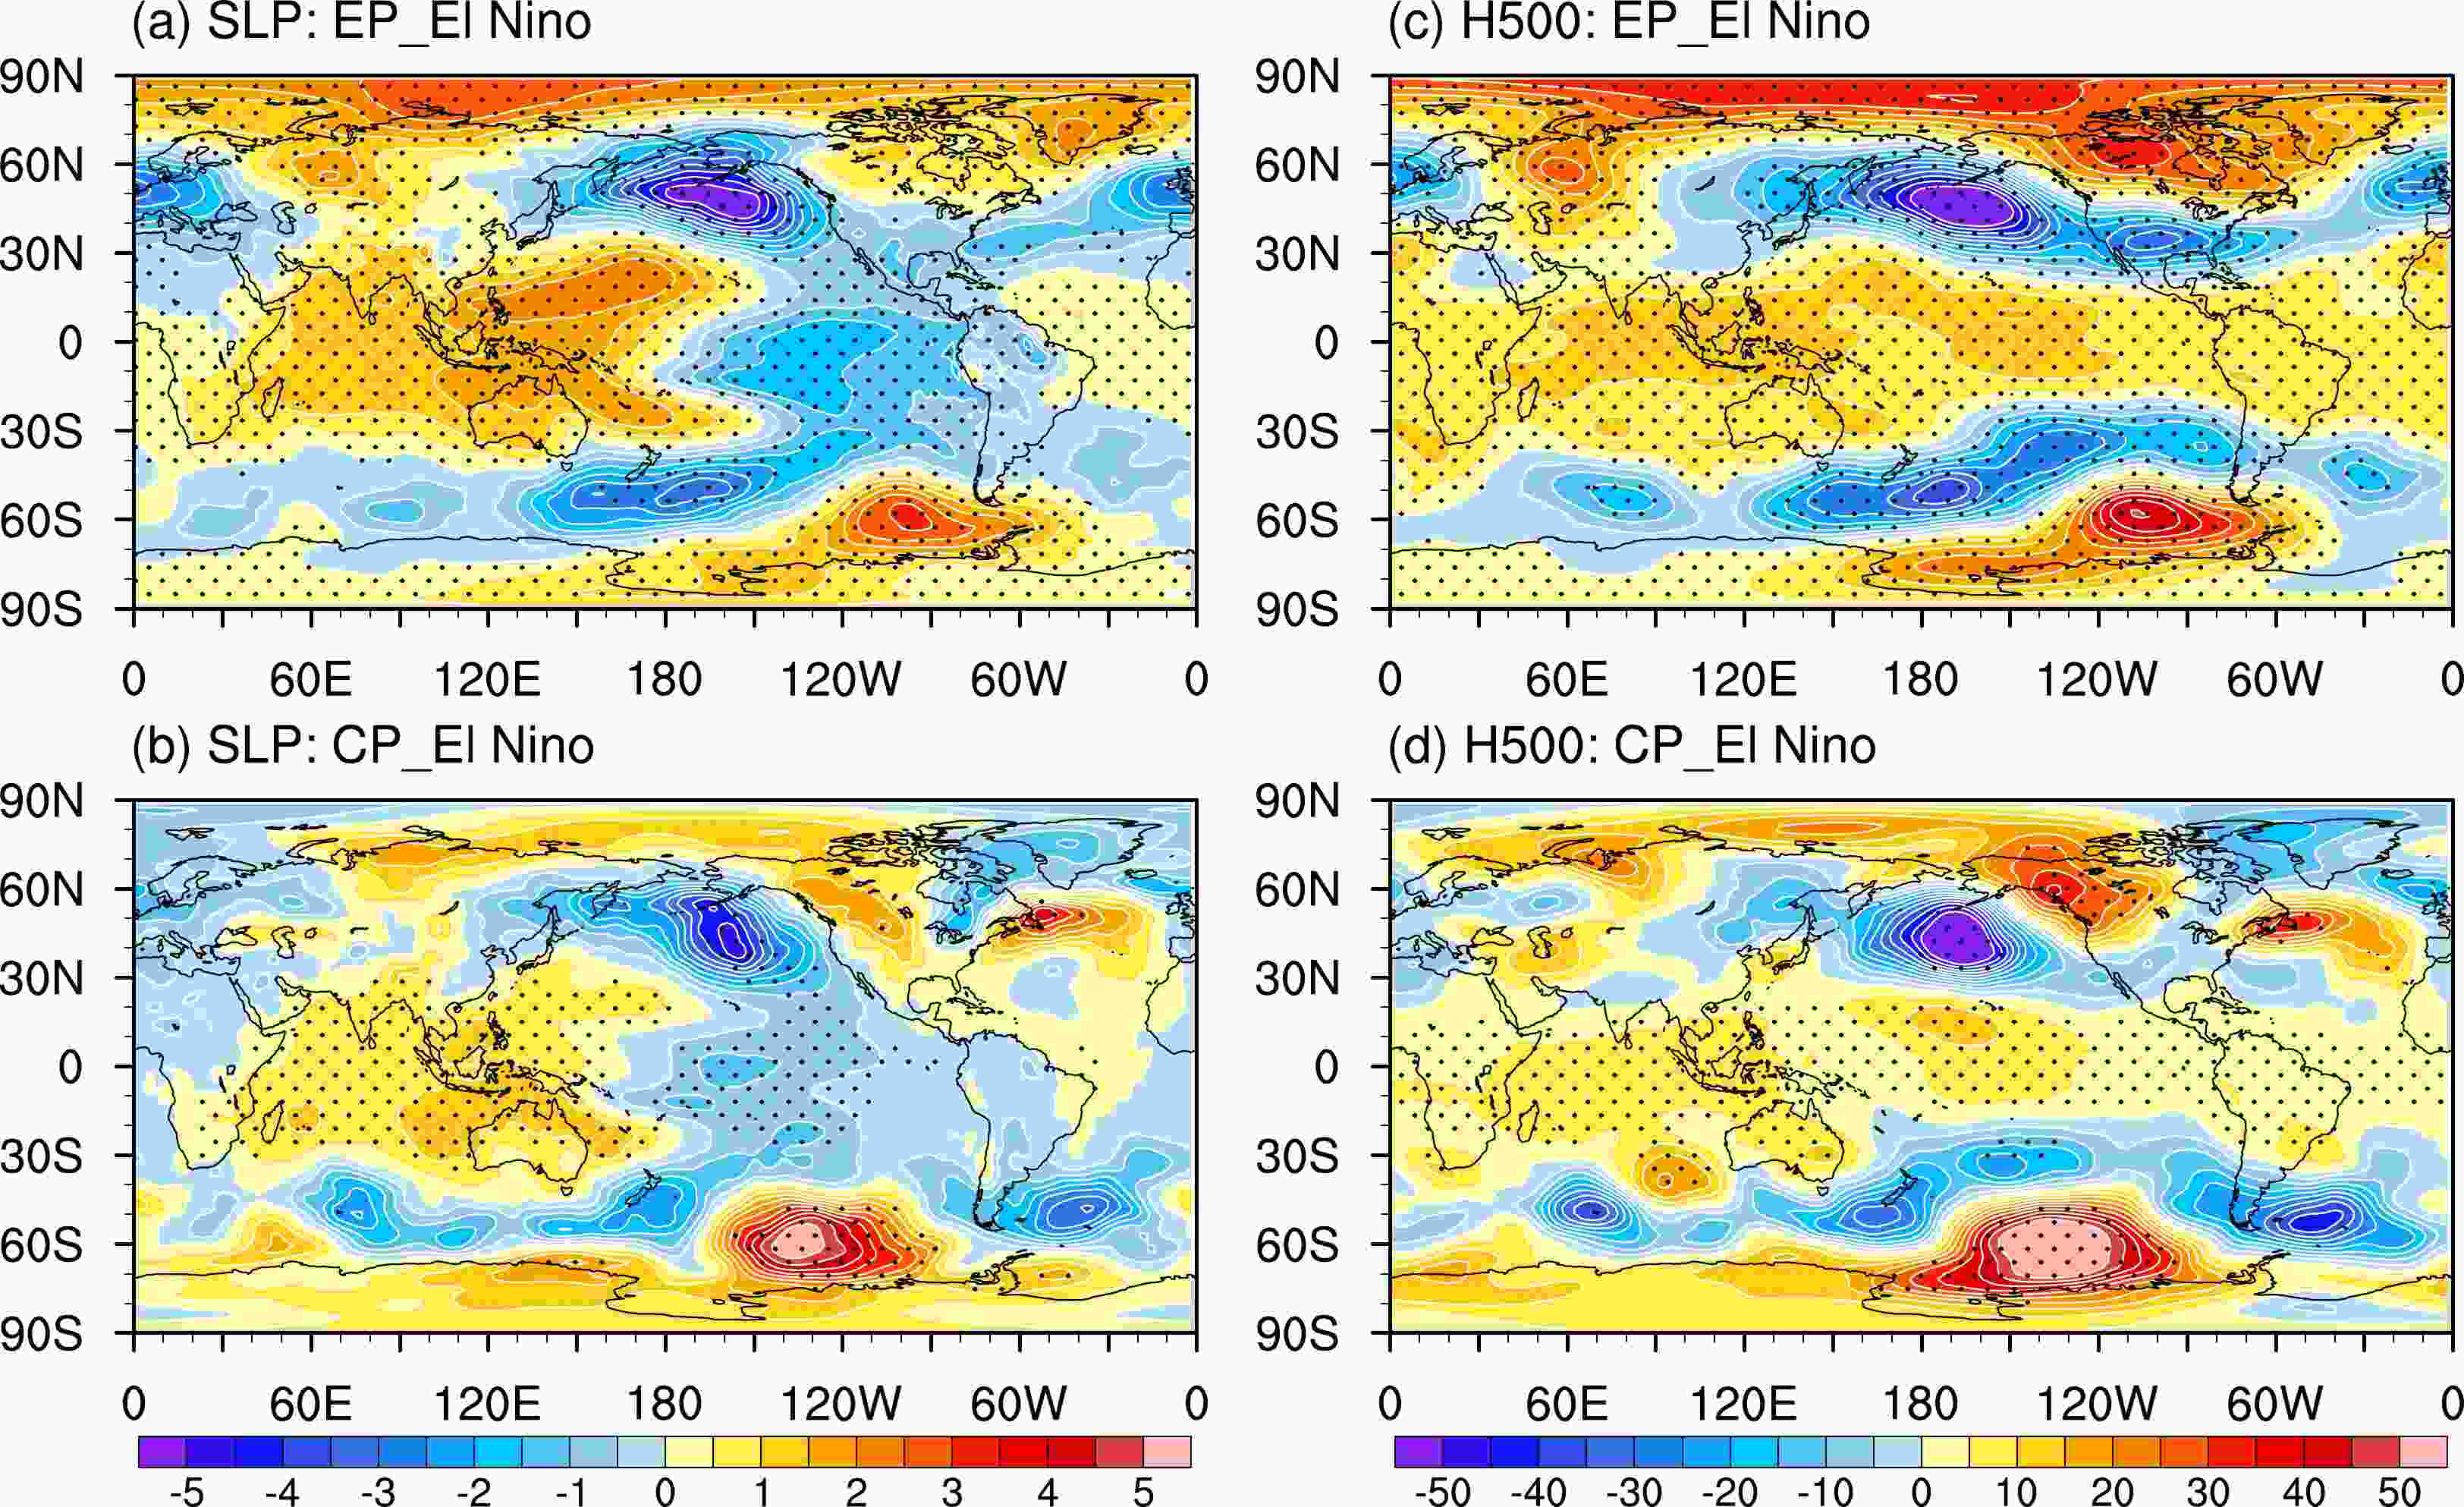
Figure 11. Same as in Fig. 10, but for (a, b) SLP and (c, d) 500-hPa geopotential height.
These results indicate that different climate impacts can arise during EP and CP El Niño events in the HCMAGCM. In addition to the tropical Pacific, North America is a major region where significant differences can be seen in the 2-m temperature, SLP, and 500-hPa geopotential height fields. These different responses can be purely forced by altering the location and intensity of SSTAs associated with the two types of El Niño events because the HCMAGCM only allows the ocean and atmosphere to be actively coupled in the tropical Pacific. Therefore, we can conclude that the climatic contrasts over North America between EP and CP El Niño events are robust. However, it should be noted that the results need to be interpreted within the context of HCMAGCM. Some previous studies have conducted observational analyses to compare the climate impacts related to the two types of El Niño. For example, Yu et al. (2012) reported that the EP and CP El Niño events excite different planetary wave patterns in the extratropical atmosphere, with the CP El Niño being related to a PNA-like pattern and the EP El Niño being related to a poleward propagating wave train, respectively. As a result, the winter temperature anomalies in the United States show a warm-northeast and cold-southwest pattern during an EP El Niño but a warm-northwest and cold-southeast pattern during a CP El Niño, respectively (Zou et al., 2014). We obtain results from model simulations, which are similar to Yu et al. (2012) regarding the different wave patterns corresponding to EP and CP El Niño events. However, the resultant temperature responses in the United States show some differences. Compared with the observations in Yu et al. (2012) and Zou et al. (2014), the cold anomalies in the model cover the entire area of the southern United States for an EP El Niño, while the northwestern warm anomalies are substantially weaker for a CP El Niño. This discrepancy may be due to specific problems with the HCMAGCM (e.g., the limited ocean model domain) or may suggest that statistical methods cannot entirely eliminate impacts from other climate variability during the observation-based analyses.
-
In this study, the simulation of different El Niño flavors and corresponding atmospheric responses is examined in a 1000-yr long-term control integration of the HCMAGCM. Our analysis shows that two types of El Niño events, EP and CP, can be identified in the model by comparing the SST anomalies in the Niño-3 and Niño-4 regions, respectively. As analyzed, EP and CP El Niño events from the model exhibit major distinct and observable characteristics in both atmospheric and oceanic variables within the tropical Pacific. Consistent with previous studies (Kao and Yu, 2009; Kug et al., 2009), EP El Niño events generally have larger SST anomalies spanning from the dateline to the eastern boundary of the equatorial Pacific, while the SST anomalies accompanying a CP El Niño are much weaker and mainly confined to the west of 120°W. The zonal wind stress fields during EP and CP El Niño events show similar changes in the longitudinal position of anomaly centers and their amplitude. The SSH anomalies are also examined to represent the variations in the thermocline depth. In the case of an EP El Niño, the SSH anomalies show a strong zonal dipole with positive anomalies in the eastern equatorial Pacific and negative anomalies in the western Pacific. On the other hand, the positive SSH anomalies during a CP El Niño extend further westward, while the negative anomalies are confined west of the dateline and have a weaker amplitude than those of EP events. In addition, the model depicts different patterns of tropical precipitation anomalies between the two types of El Niño events, which are critical for the extratropical atmospheric teleconnections.
The temporal evolutions of the two types of El Niño in the HCMAGCM are also consistent with the observations and previous studies. The warm SST anomalies during an EP El Niño appear in the early spring and are accompanied by strong westerlies eastward extending to 135°W, eventually resulting in large SST warming in the central-eastern Pacific. In contrast, a CP El Niño occurs later in spring and the westerlies along the equator are much weaker and confined west of 150°W. Furthermore, the SST heat budget analysis shows that both the thermocline feedback and zonal advective feedback, with the former playing a leading role, significantly contribute to the growth of warm SSTs during an EP El Niño. However, during the development of a CP El Niño, the zonal advective feedback plays a dominant role and the thermocline feedback is much weaker. Further analysis shows that the tropical Pacific decadal variability could modulate a CP El Niño preference and give rise to ENSO diversity in the HCMAGCM.
According to the model setting of the HCMAGCM, the extratropical atmospheric variability can only be influenced by El Niño-related SST anomalies in the tropical Pacific. Therefore, the wintertime atmospheric responses are illustrated by composite analysis for the EP and CP El Niño events, respectively, including the 2-m temperature, SLP, and 500-hPa geopotential height. The EP and CP El Niño events mainly show robust climate differences in North America, implying that other regions may not be significantly affected by the type of El Niño. There is a well-defined warm-north and cold-south anomaly pattern of temperature responses during an EP El Niño, while the southern cold anomalies extend northward and warm anomalies appear on the eastern and western coasts during a CP El Niño. The different responses are associated with different wave trains preferably excited by EP and CP El Niño events, as seen from the 500-hPa geopotential height. The CP El Niño generates a PNA-like pattern, while the EP El Niño generates a poleward propagating wave train pattern.
Although the HCMAGCM can reproduce the observed characteristics in many aspects of the atmospheric and oceanic anomalies associated with both EP and CP El Niño events, there are still some discrepancies that need to be noted. First, the simulated El Niño events are stronger than those in the observations, which is also a common symptom in most global climate models (Bellenger et al., 2014; Capotondi et al., 2015b). In addition, the bias of cold SST anomalies to the north and south of the western off-equatorial Pacific is obvious in the HCMAGCM. This bias may introduce a commensurate and significant negative precipitation anomaly bias in this region, especially during an EP El Niño, which is not evident in the observations. Furthermore, the extratropical response patterns differ from previous observational analyses in some details of spatial structure. On the one hand, these discrepancies may exist because the observation-based results still contain influences from other climate modes and local processes, while the extratropical responses in the atmosphere are only directly forced by the EP/CP El Niño in the HCMAGCM. On the other hand, such discrepancies may be due to specific problems with the HCMAGCM, including the simplicity of the ocean component and the lack of other oceanic basins. Therefore, the results obtained in this study should be interpreted within the context of this particular model setting. Additionally, this study only focuses on the two types of El Niño events in the HCMAGCM, and discussions on the La Niña diversity and whether the asymmetries between El Niño and La Niña can be captured by the model still needs to be completed.
Results from complex CGCMs have demonstrated the role played by SST variations in the North Tropical Atlantic (NTA) and equatorial Atlantic in generating different types of El Niño events, as mentioned in the introduction. However, the results presented in this modeling study indicate that the genesis of ENSO diversity can reside in the internal processes within the tropical Pacific, according to the formulation of the HCMAGCM. In terms of the causes of ENSO diversity in the model, we discuss a possible link between tropical Pacific decadal variability and different El Niño types. However, further analyses are clearly needed to understand the related modulation mechanisms. Furthermore, ENSO diversity can be affected by a variety of factors in the tropical Pacific, including internal nonlinearity of the coupled system, stochastic processes, WWBs, the Madden Julian Oscillation, and NPMM/SPMM (Capotondi et al., 2015a; Timmermann et al., 2018; Jin, 2022). Their respective relationships with different El Niño types should be investigated in future studies through additional sensitivity experiments in the context of HCMAGCM. For example, the parameterization for the temperature of subsurface water entrained into the mixed layer (
$ {T_{\text{e}}} $ ) in the ocean model depends on the SVD modes between sea level and the$ {T_{\text{e}}} $ anomalies making use of the observed and model-produced data. In the observations, the SVD modes between them may be different during different decades, and thus their decadal changes possibly affect ENSO diversity; this needs to be investigated with modeling experiments. Note that the HCMAGCM could be easily used to explore the effects of other climate modes (e.g., the Indian Ocean Dipole, PDO) on ENSO evolution, by introducing the varying information from other basins separately. These relevant studies are currently underway and will desirably be reported in the future.Acknowledgements. This work is supported by the National Natural Science Foundation of China (NSFC; Grant No. 42275061), the Strategic Priority Research Program of the Chinese Academy of Sciences (Grant No. XDB40000000), the Laoshan Laboratory (Grant No. LSKJ202202404), the NSFC (Grant No. 42030410), and the Startup Foundation for Introducing Talent of Nanjing University of Information Science and Technology.
Different El Niño Flavors and Associated Atmospheric Teleconnections as Simulated in a Hybrid Coupled Model
- Manuscript received: 2023-06-07
- Manuscript revised: 2023-09-08
- Manuscript accepted: 2023-10-08
Abstract: A previously developed hybrid coupled model (HCM) is composed of an intermediate tropical Pacific Ocean model and a global atmospheric general circulation model (AGCM), denoted as HCMAGCM. In this study, different El Niño flavors, namely the Eastern-Pacific (EP) and Central-Pacific (CP) types, and the associated global atmospheric teleconnections are examined in a 1000-yr control simulation of the HCMAGCM. The HCMAGCM indicates profoundly different characteristics among EP and CP El Niño events in terms of related oceanic and atmospheric variables in the tropical Pacific, including the amplitude and spatial patterns of sea surface temperature (SST), zonal wind stress, and precipitation anomalies. An SST budget analysis indicates that the thermocline feedback and zonal advective feedback dominantly contribute to the growth of EP and CP El Niño events, respectively. Corresponding to the shifts in the tropical rainfall and deep convection during EP and CP El Niño events, the model also reproduces the differences in the extratropical atmospheric responses during the boreal winter. In particular, the EP El Niño tends to be dominant in exciting a poleward wave train pattern to the Northern Hemisphere, while the CP El Niño tends to preferably produce a wave train similar to the Pacific North American (PNA) pattern. As a result, different climatic impacts exist in North American regions, with a warm-north and cold-south pattern during an EP El Niño and a warm-northeast and cold-southwest pattern during a CP El Niño, respectively. This modeling result highlights the importance of internal natural processes within the tropical Pacific as they relate to the genesis of ENSO diversity because the active ocean–atmosphere coupling is allowed only in the tropical Pacific within the framework of the HCMAGCM.
-
Keywords:
- hybrid coupled model,
- tropical Pacific Ocean,
- global atmosphere,
- Eastern/Central-Pacific El Niño,
- atmospheric teleconnections
摘要: 在前期工作中,我们已将中等复杂程度的热带太平洋海洋模式和全球大气环流模式(AGCM)相互耦合,成功发展了一个混合型耦合模式(HCM),称为HCMAGCM,并可用于海气系统的长期积分试验。本研究基于其1000年的控制试验结果,考察了该模式对东部型(EP)和中部型(CP)El Niño及其全球大气遥相关的模拟情况。分析表明,HCMAGCM能够真实地模拟两类El Niño事件相应的海表温度、风场和降水等变量在强度和纬向位置上的不同特征。进一步,海表温度热收支分析表明,温跃层反馈和纬向平流反馈分别主导了EP和CP El Niño事件的发展。另外,该模式也能够模拟出北半球冬季热带外大气对两类El Niño事件不同的响应特征:EP El Niño倾向于在北半球激发向极地的波列结构,而CP El Niño倾向于产生类似太平洋北美型(PNA)遥相关的波列结构。这种不同的波列响应给北美地区产生了不同的气候影响,EP El Niño期间北美地区为北暖-南冷的响应,而CP El Niño期间表现为东北暖-西南冷的分布特征。由于在HCMAGCM框架下,只允许在热带太平洋区域有海洋和大气的相互耦合,所以,该模式结果强调了热带太平洋内部自然变率过程对产生ENSO多样性及其影响的重要作用。
-
关键词:
- 混合型耦合模式,
- 热带太平洋,
- 全球大气,
- 中部/东部型厄尔尼诺,
- 大气遥相关


 AAS Website
 AAS WeChat