


 DownLoad:


-
The Bay of Bengal (BOB) is an important source of water vapor for the Tibetan Plateau (TP). In summer, the southwesterly monsoon and westerlies are the dominant weather systems for water vapor transport over the TP. The water vapor that originates in the Indian Ocean enters the TP mainly from its southern boundary, but it can also enter the TP from its western boundary if it is aided by westerly flow. Water vapor transport from the Indian Ocean to the TP follows two routes: an eastern route originating from the BOB and a western route originating from the Arabian Sea (Lü, 2017; Zhang et al., 2019). Regarding the mechanism by which water vapor enters the TP in summer, Xie et al. (2009) mentioned that when the sea surface temperature (SST) of the northern Indian Ocean is warm, the southwesterly monsoon from the Indian Ocean to the northwestern Pacific weakens, while the southwesterly and southeasterly monsoon in the western portion of the northwest Pacific subtropical high strengthens, resulting in significantly more precipitation in the southern TP. When the tropical Indian Ocean is warmer (cooler), the South Asian high strengthens (weakens) and moves southward (northward) (Huang et al., 2011). Warmer (cooler) SSTs in the tropical Indian Ocean correspond to a more southwardly (northwardly) displaced position of the East Asian jet stream axis in summer (Qu and Huang, 2012). Dong et al. (2016, 2018) proposed two routes for water vapor transport from the Indian subcontinent to the TP: upslope and up-and-over.
Previous studies related to water vapor transport over the TP have focused mainly on the monsoon system and the westerlies in summer. In the monsoon transition seasons, the role of the monsoon is greatly weakened, while the role of the westerlies is more prominent (Feng and Zhou, 2012; Zhang et al., 2017). Water vapor transport over the TP during the monsoon transition seasons is rarely studied. Therefore, this study focuses mainly on water vapor transport into the TP during this time.
During the monsoon transition seasons, the BOB TC system cannot be ignored. The annual variation of BOB TCs is characterized by double-peak seasons, with May and October–November being the peak periods (Gray, 1968; Singh et al., 2000; Islam and Peterson, 2009; Li et al., 2013). April–May and October–November correspond to the monsoon transition seasons, indicating that the “bimodal” characteristic may be related to the seasonal transition of atmospheric circulation (Lü, 2017). During the monsoon transition seasons, which are also the double-peak TC seasons, BOB TCs may cause a significant precipitation anomaly over the TP (Dai, 1974). Xiao and Duan (2015) found that most of the northern Indian Ocean TCs that have a large impact on the TP originate from the BOB, and most occur in May and October, with an impact radius of about 1000 km. The contribution to water vapor transport over the southern boundary of the TP (SBTP) caused by BOB TCs from April to June is about twice that from September to December. However, TC frequency from April to June is apparently lower than that from September to December, which begs the following question. What is the cause of this contrast?
The impact of TCs on the precipitation in China occurs mainly through the direct arrival of TCs themselves (Tu et al., 2022; Yu et al., 2022), and the effective influence radius of precipitation is less than 1000 km (Li and Zhou, 2015; Li et al., 2015). BOB TCs can cause more extensive water vapor transport anomalies by coordinating with specific weather systems such as troughs in the westerlies, and these water vapor transport anomalies caused by different circulation conditions also have significant differences (Zhou et al., 2022). Research on the influence of troughs on TC activity has been concentrated in the western Pacific Ocean, mainly involving the influence of troughs on cyclogenesis (Chen and Huang 2008; Li et al., 2012a; Wang and Wu, 2016, 2018) and TC intensity (Li and Zhou, 2013). For the BOB, the effects of trough or ridge systems on TC activity during the monsoon transition seasons are relatively scarce and are mentioned only in the context of case studies (Li et al., 2012b; Suo and Ding, 2014).
In previous studies, it has been found that during the double-peak TC seasons, TC frequency is lower, but TC contribution to water vapor transport over the SBTP is higher in the first peak TC season. The mechanism of this phenomenon has not been further studied and is the main concern of this paper.
The remainder of this paper is organized as follows. The data and methods are described in section 2. Section 3 discusses the seasonal variation of BOB TC frequency and the meridional moisture budget anomaly (MMBA) associated with BOB TCs. The key factor responsible for the contribution to the MMBA is analyzed in section 4. The physical mechanism of the influence of westerlies on the MMBA is detailed in section 5. Finally, a conclusion and discussion are given in section 6.
-
Reanalysis datasets including wind fields, specific humidity, and geopotential height are obtained from the European Centre for Medium-range Weather Forecasts (ECMWF) Re-Analysis Interim (ERA-Interim; Dee et al., 2011), with a horizontal resolution of 0.5° × 0.5° and a temporal resolution of 6 hours. The datasets are collected from 1979 to 2018, and the vertical level is 37. BOB TC datasets are downloaded from the International Best Track Archive for Climate Stewardship (IBTrACS). In this study, SBTP refers specifically to a line from 78° to 102°E at 28°N, which is close to the southernmost latitude of the TP.
-
The meridional moisture budget (MMB, in g s–1 hPa–1 cm–1) is calculated by (Zhou et al., 2022):
where v and q represent the meridional wind (v) and specific humidity (q), respectively, and n is the grid number in the selected area.
On certain timescales, each variable can be divided into three components: low-frequency oscillations, with periods of over 90 days, intraseasonal oscillations, with periods of 20–90 days, and synoptic-scale perturbations, with a cycle of 2–20 days. The relevant equations are as follows:
The meridional and zonal components of the momentum equation in large-scale motion in the upper troposphere at mid-latitudes are (Zhou et al., 2022):
where u and v are the zonal and meridional components of velocity, respectively. The subscript z (m) indicates the zonal (meridional) components. G represents the pressure gradient force, A represents the Coriolis force, and du/dt (dv/dt) represents the zonal (meridional) acceleration.
-
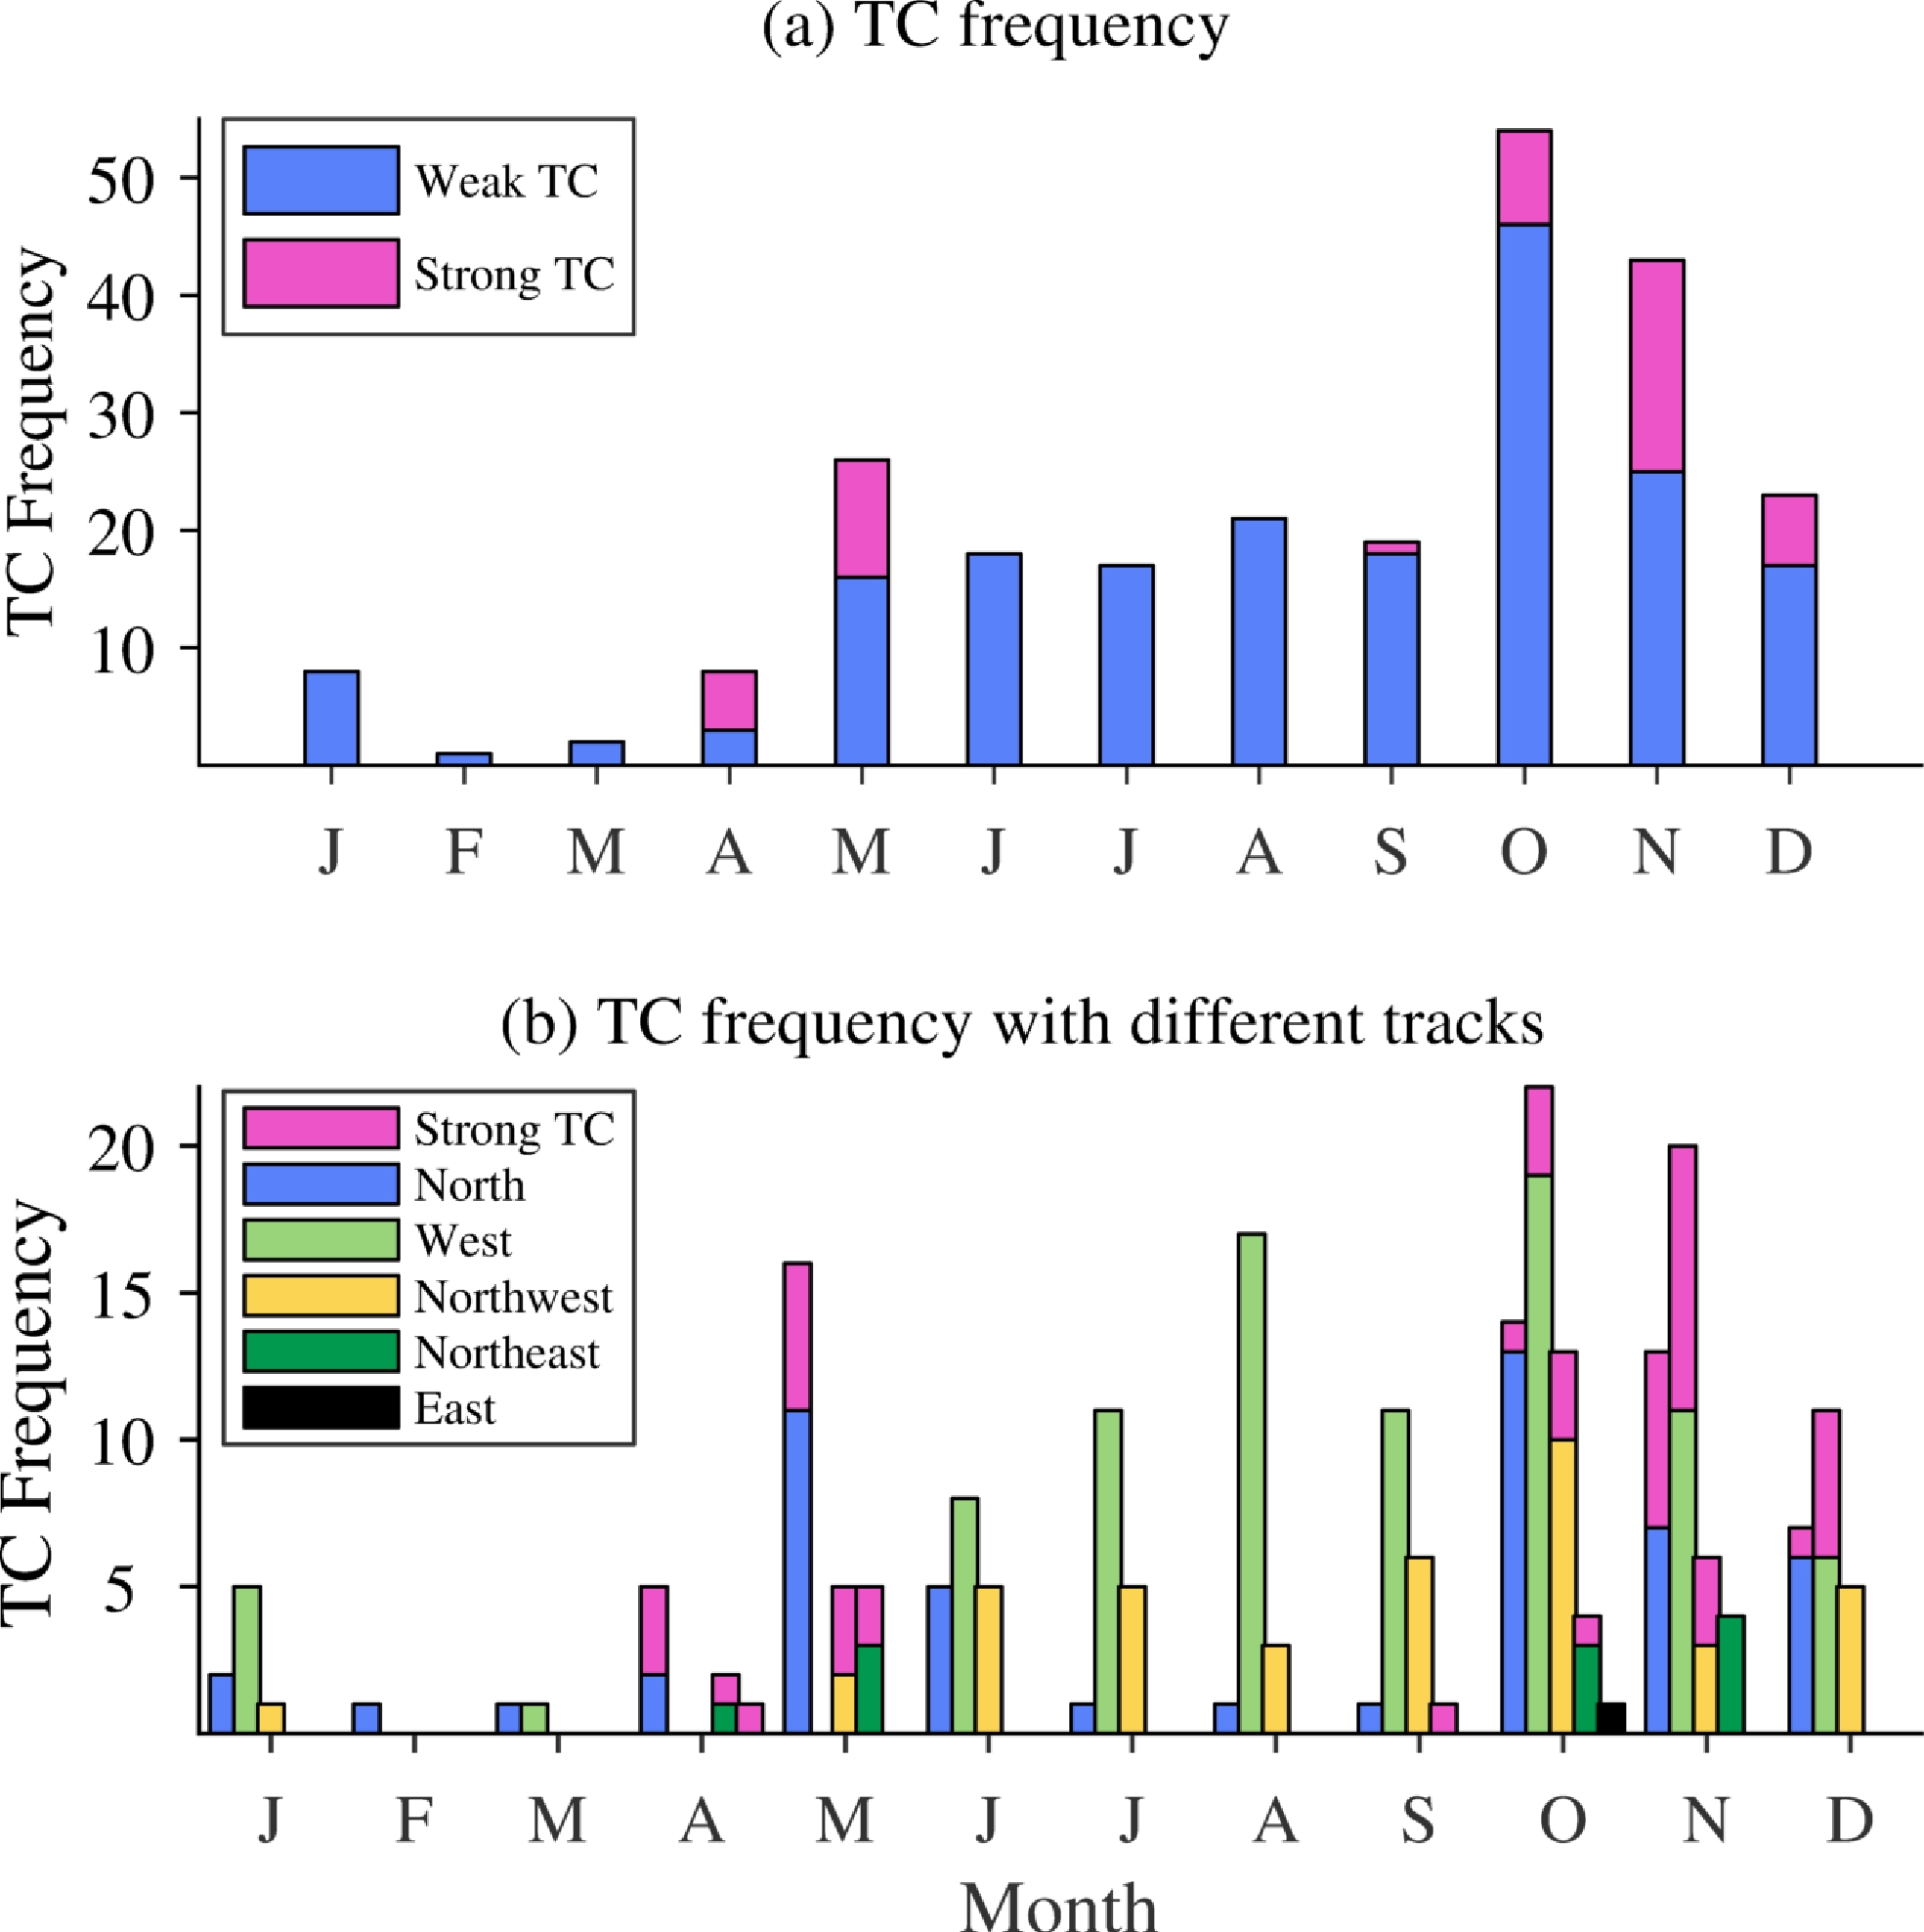
During 1979–2018, a total of 240 TCs formed in the BOB (5°–25°N, 75°–100°E). Figure 1a shows that the TC frequency over the BOB during 1979–2018 has significant seasonal variation. BOB TCs are characterized by double peaks, with the two peak TC seasons occurring in May and October–December. The number of TCs forming in the BOB during May, October, November, and December is 26, 52, 43, and 23, respectively. Among the double-peak TC seasons (May and October–December), the TC frequency is the highest in October, followed by November. It is relatively low in May and the lowest in December. Strong TCs are the most frequent in November (18 strong TCs).
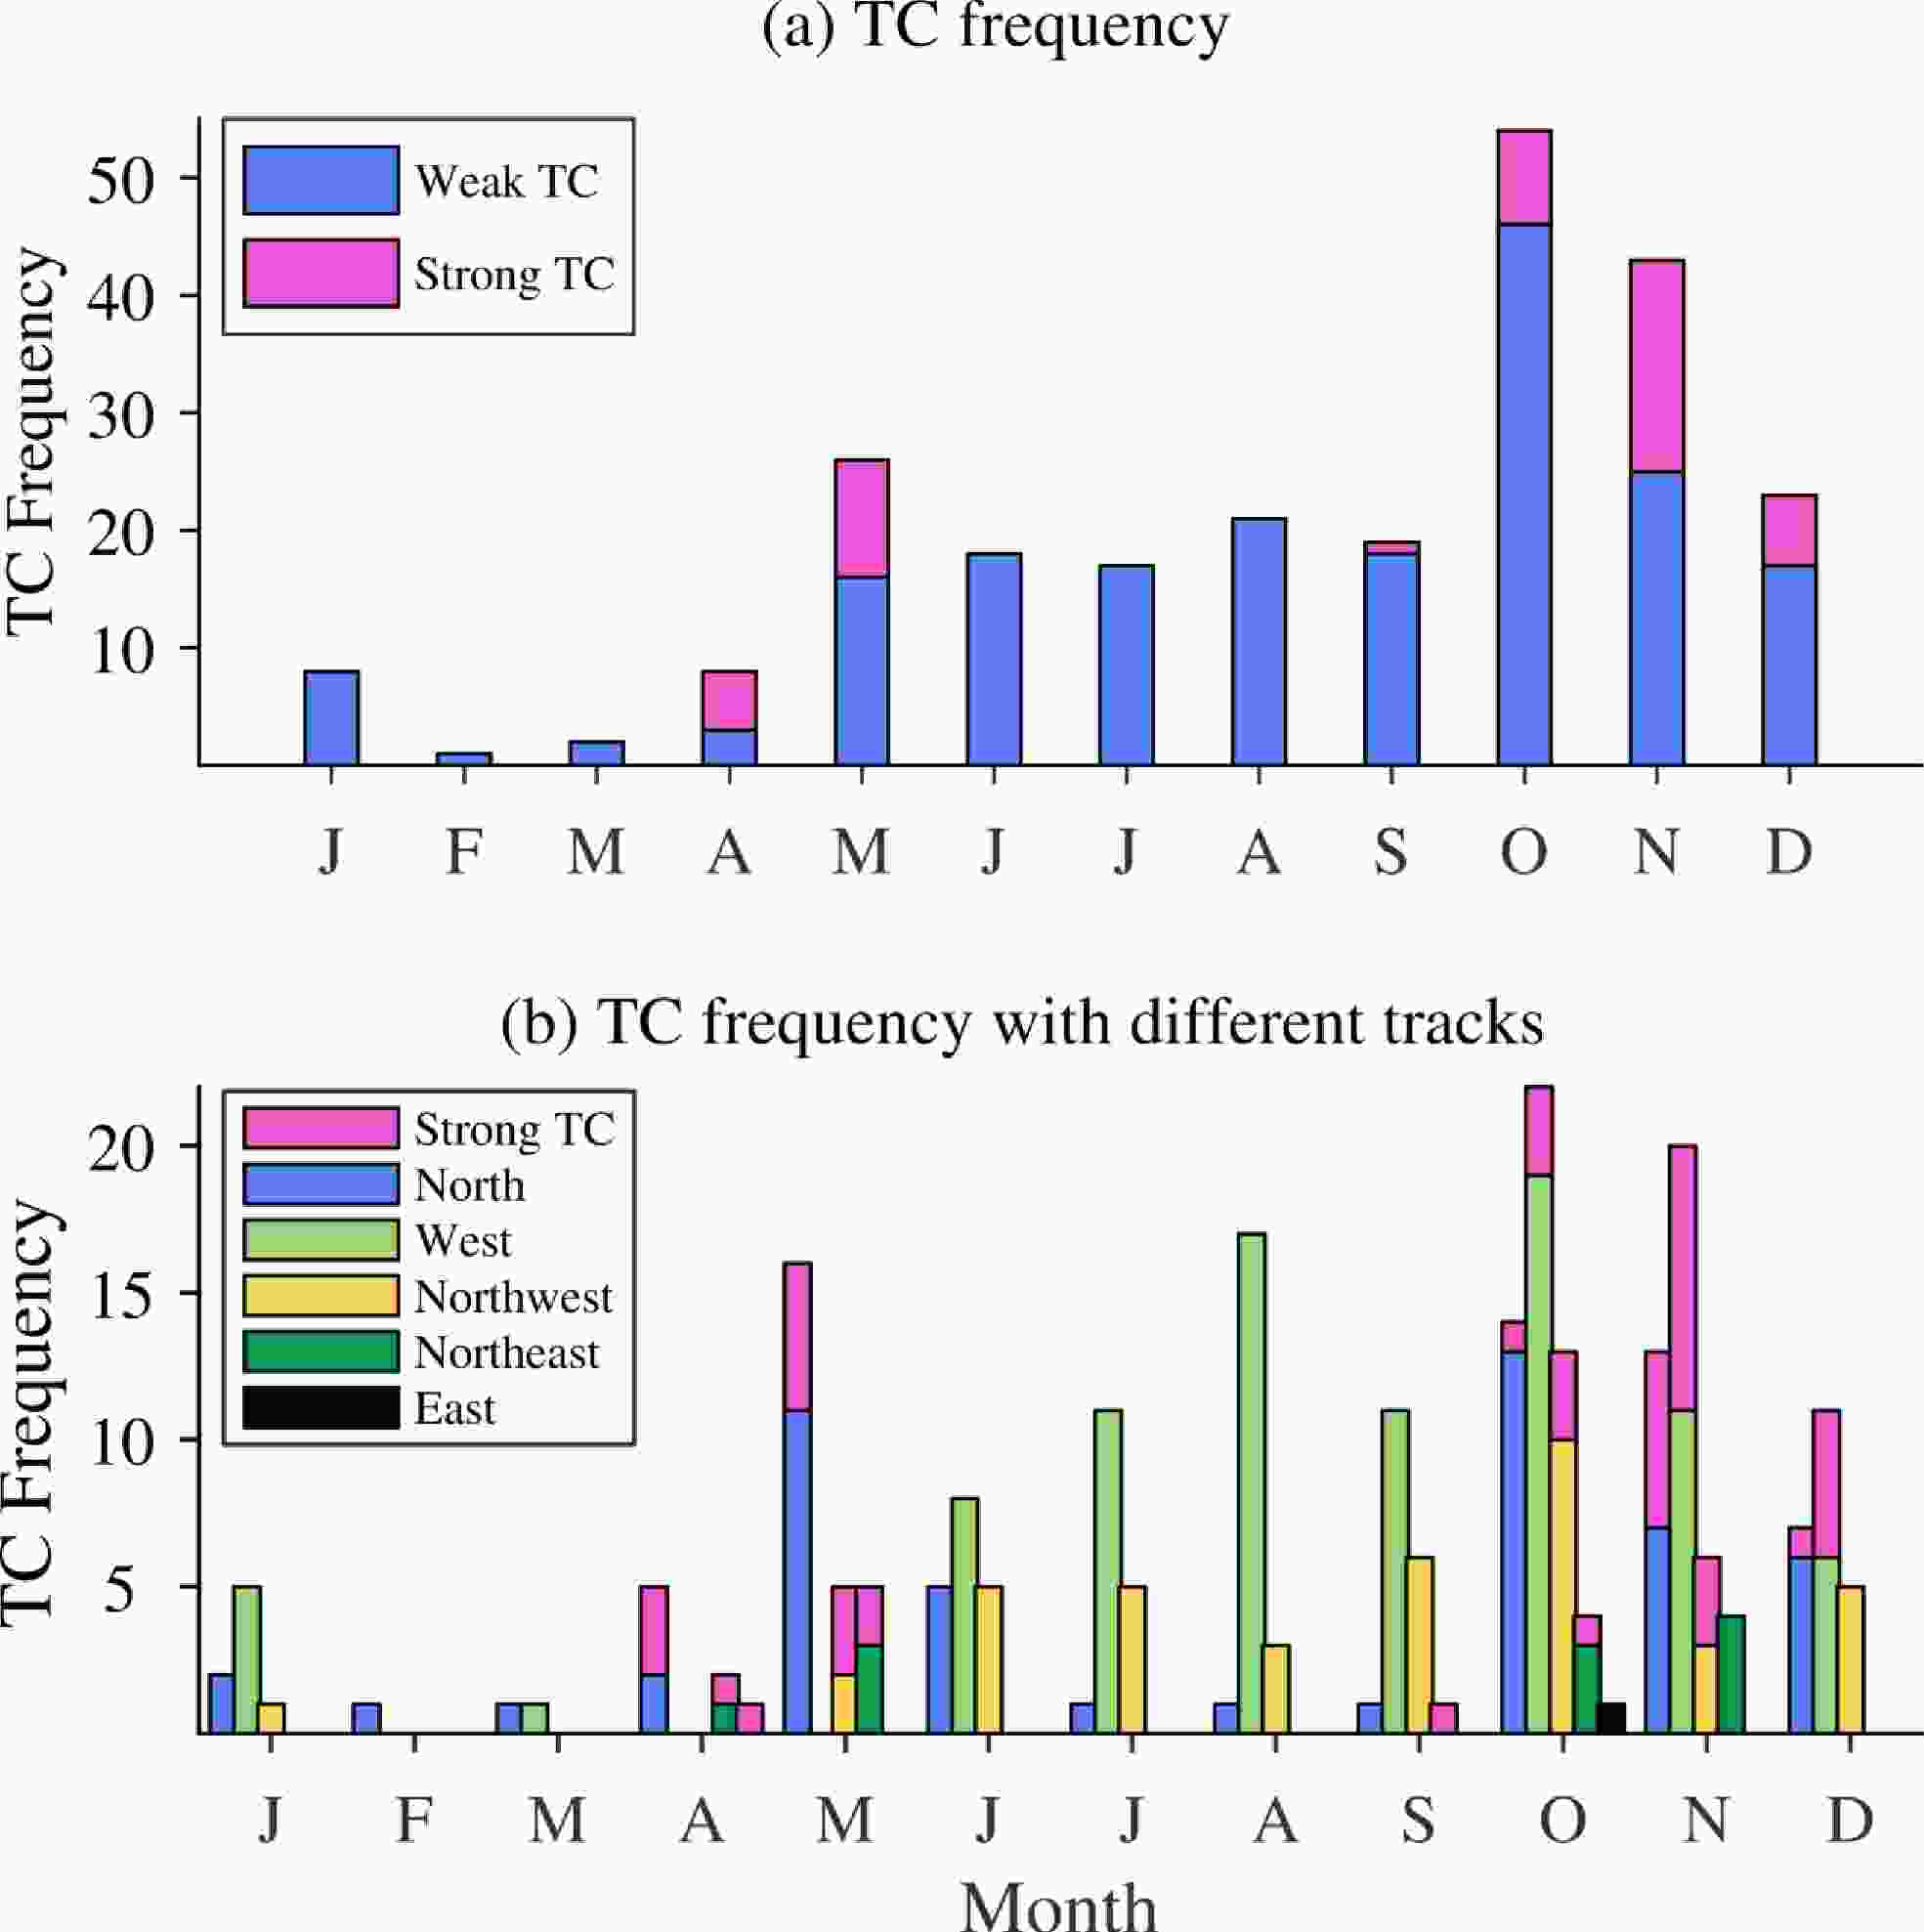
Figure 1. Annual variation of (a) frequency for weak and strong TCs and (b) for TCs with different tracks during 1979–2018.
The different influences of BOB TCs on precipitation and water vapor transport can also be found in different tracks. If a TC moves northward, it may greatly impact Bangladesh and the TP; if it moves eastward, it may affect Myanmar, the Indochina Peninsula, and southwestern China; if it moves westward, it may have a major impact on India and Sri Lanka (Lü, 2017). Therefore, when considering water vapor transport to the TP, it is essential to take into account different TC tracks. In this study, TCs are classified into five categories according to their tracks: north, west, east, northwest, and northeast. The frequency of each category is shown in Fig. 1b and the spatial distribution is shown in Fig. S1 [in the electronic supplementary material (ESM)]. From June to December, most TCs tend to move westward, while from February to May, they tend to move northward. There are no TCs with a west track in May. In contrast, the proportion of both northeast- and east-track TCs is relatively small. Northeast-track TCs occur only in April–May and October–November, and only two east-track TCs occur in April and October. Northwest-track TCs occur from May to December, and in October, the proportion of northwest-track TCs is comparable to that of north-track TCs. Comparing TCs in the double-peak TC seasons, the frequency of north-track TCs in May and October-November is similar, with 16, 14, and 13 cases, respectively, with only 7 cases occurring in December. Almost half of the west-track TCs occur in October–December, but none in May. In addition, the proportion of northwest-track TCs is relatively higher in October than in May and November.
-
It is widely acknowledged that May and October–December represent the double-peak TC seasons, which also coincide with the monsoon transition seasons. During these periods, water vapor transport associated with westerlies and BOB TCs is an important source of water vapor for the TP. The water vapor coming from BOB TCs enters the TP mainly from the SBTP. In this paper, we choose a straight line close the southern slope of the Himalayas to represent the SBTP.
To understand the difference in water vapor transport over the SBTP, an MMBA over the SBTP during the double-peak TC seasons is first confirmed. The MMBA over the SBTP is 29.76 and 29.94 g s–1 cm–1 in May and October (Table 1). The difference in MMBA between October and May is small, but since there are fewer TCs in May, the contribution rate is the highest in May (1.14). The MMBA in November is 18.91 g s–1 cm–1, which is less than that in May and October; the MMBA is the lowest in December (4.86 g s–1 cm–1). The contribution rate to the MMBA (MMBA divided by TC frequency) is the highest in May and decreases month by month from October to December. That is, the difference in the contribution rate is characterized by significant seasonal variation. For TCs with different tracks, the contribution rate is the highest for north-track TCs, followed by northeast-track TCs, except for October (when northeast-track TCs are the highest, followed by northwest-track TCs), and it is lowest for west-track TCs. It can be seen that the difference in the TC track has an important impact on the contribution rate.
MMBA/TC frequency May Oct. Nov. Dec. All 29.76/26
(1.14)29.94/52
(0.58)18.91/43
(0.44)4.86/23
(0.21)North track 24.01/16
(1.50)9.65/14
(0.69)13.60/13
(1.05)2.54/7
(0.36)West track − 3.75/20
(0.19)1.51/20
(0.08)0.00/11
(0)Northwest track 2.27/5
(0.45)10.35/14
(0.74)1.66/6
(0.28)2.32/5
(0.46)Northeast track 3.48/5
(0.70)6.19/4
(1.55)2.14/4
(0.53)− Table 1. The MMBA (g s–1 cm–1) over the SBTP integrated from 500 to 100 hPa during the double-peak TC seasons (values in parentheses represent the values of the MMBA divided by TC frequency).
Figure S2 (in the ESM) shows the MMBA for TCs with an MMBA greater than zero during the double-peak TC seasons. There are 22 TCs with MMBAs greater than zero in May, and 24, 19, and 5 TCs in October, November, and December, respectively. The proportion of TCs with an MMBA greater than zero is the highest in May, and there is a decreasing trend from October to December, which is consistent with the variation in the contribution rate to the MMBA. This again confirms the seasonal variation of the MMBA shown in Table 1.
It is of interest to determine whether TC track and intensity are the main factors that cause seasonal differences in the MMBA. West-track TCs have little impact on the TP, but they account for almost half of the TC frequency from October to December. This is one reason for the high contribution rate to the MMBA in May. When west-track TCs are not considered, the contribution (contribution rate) to the MMBA in May and October–December is 29.76 (1.14), 26.19 (0.82), 17.4 (0.76), and 4.86 (0.41) g s–1 cm–1, respectively. Except for west-track TCs, the contribution rate is still the highest in May and decreases month by month from October to December. This means that TC track is not the key factor behind the seasonal differences in the MMBA. For TC intensity, the frequency of strong TCs is the highest in November, followed by May. There are more strong TCs in May than in October, which is one reason for the higher contribution in May than in October. The number of strong TCs is the highest in November (18 strong TCs), but the contribution rate in November is lower than that in May and October. When west-track TCs are not counted, the frequency of strong TCs in May and October–December is 10, 5, 9, and 1, respectively. The frequency of strong TCs in November is similar to that in May, and more than that in October, but the contribution rate is much lower than that in May and October. These results suggest that TC intensity is not the main reason for seasonal differences in the MMBA.
In summary, the contribution rate to the MMBA has seasonal variation and is the highest in May, even though TC frequency is relatively low. From October to December, the contribution rate decreases month by month. Neither TC track nor intensity is the key factor, which then begs the question: what is the key factor that contributes to the seasonal variation of the contribution rate to the MMBA over the SBTP during the double-peak TC seasons?
-
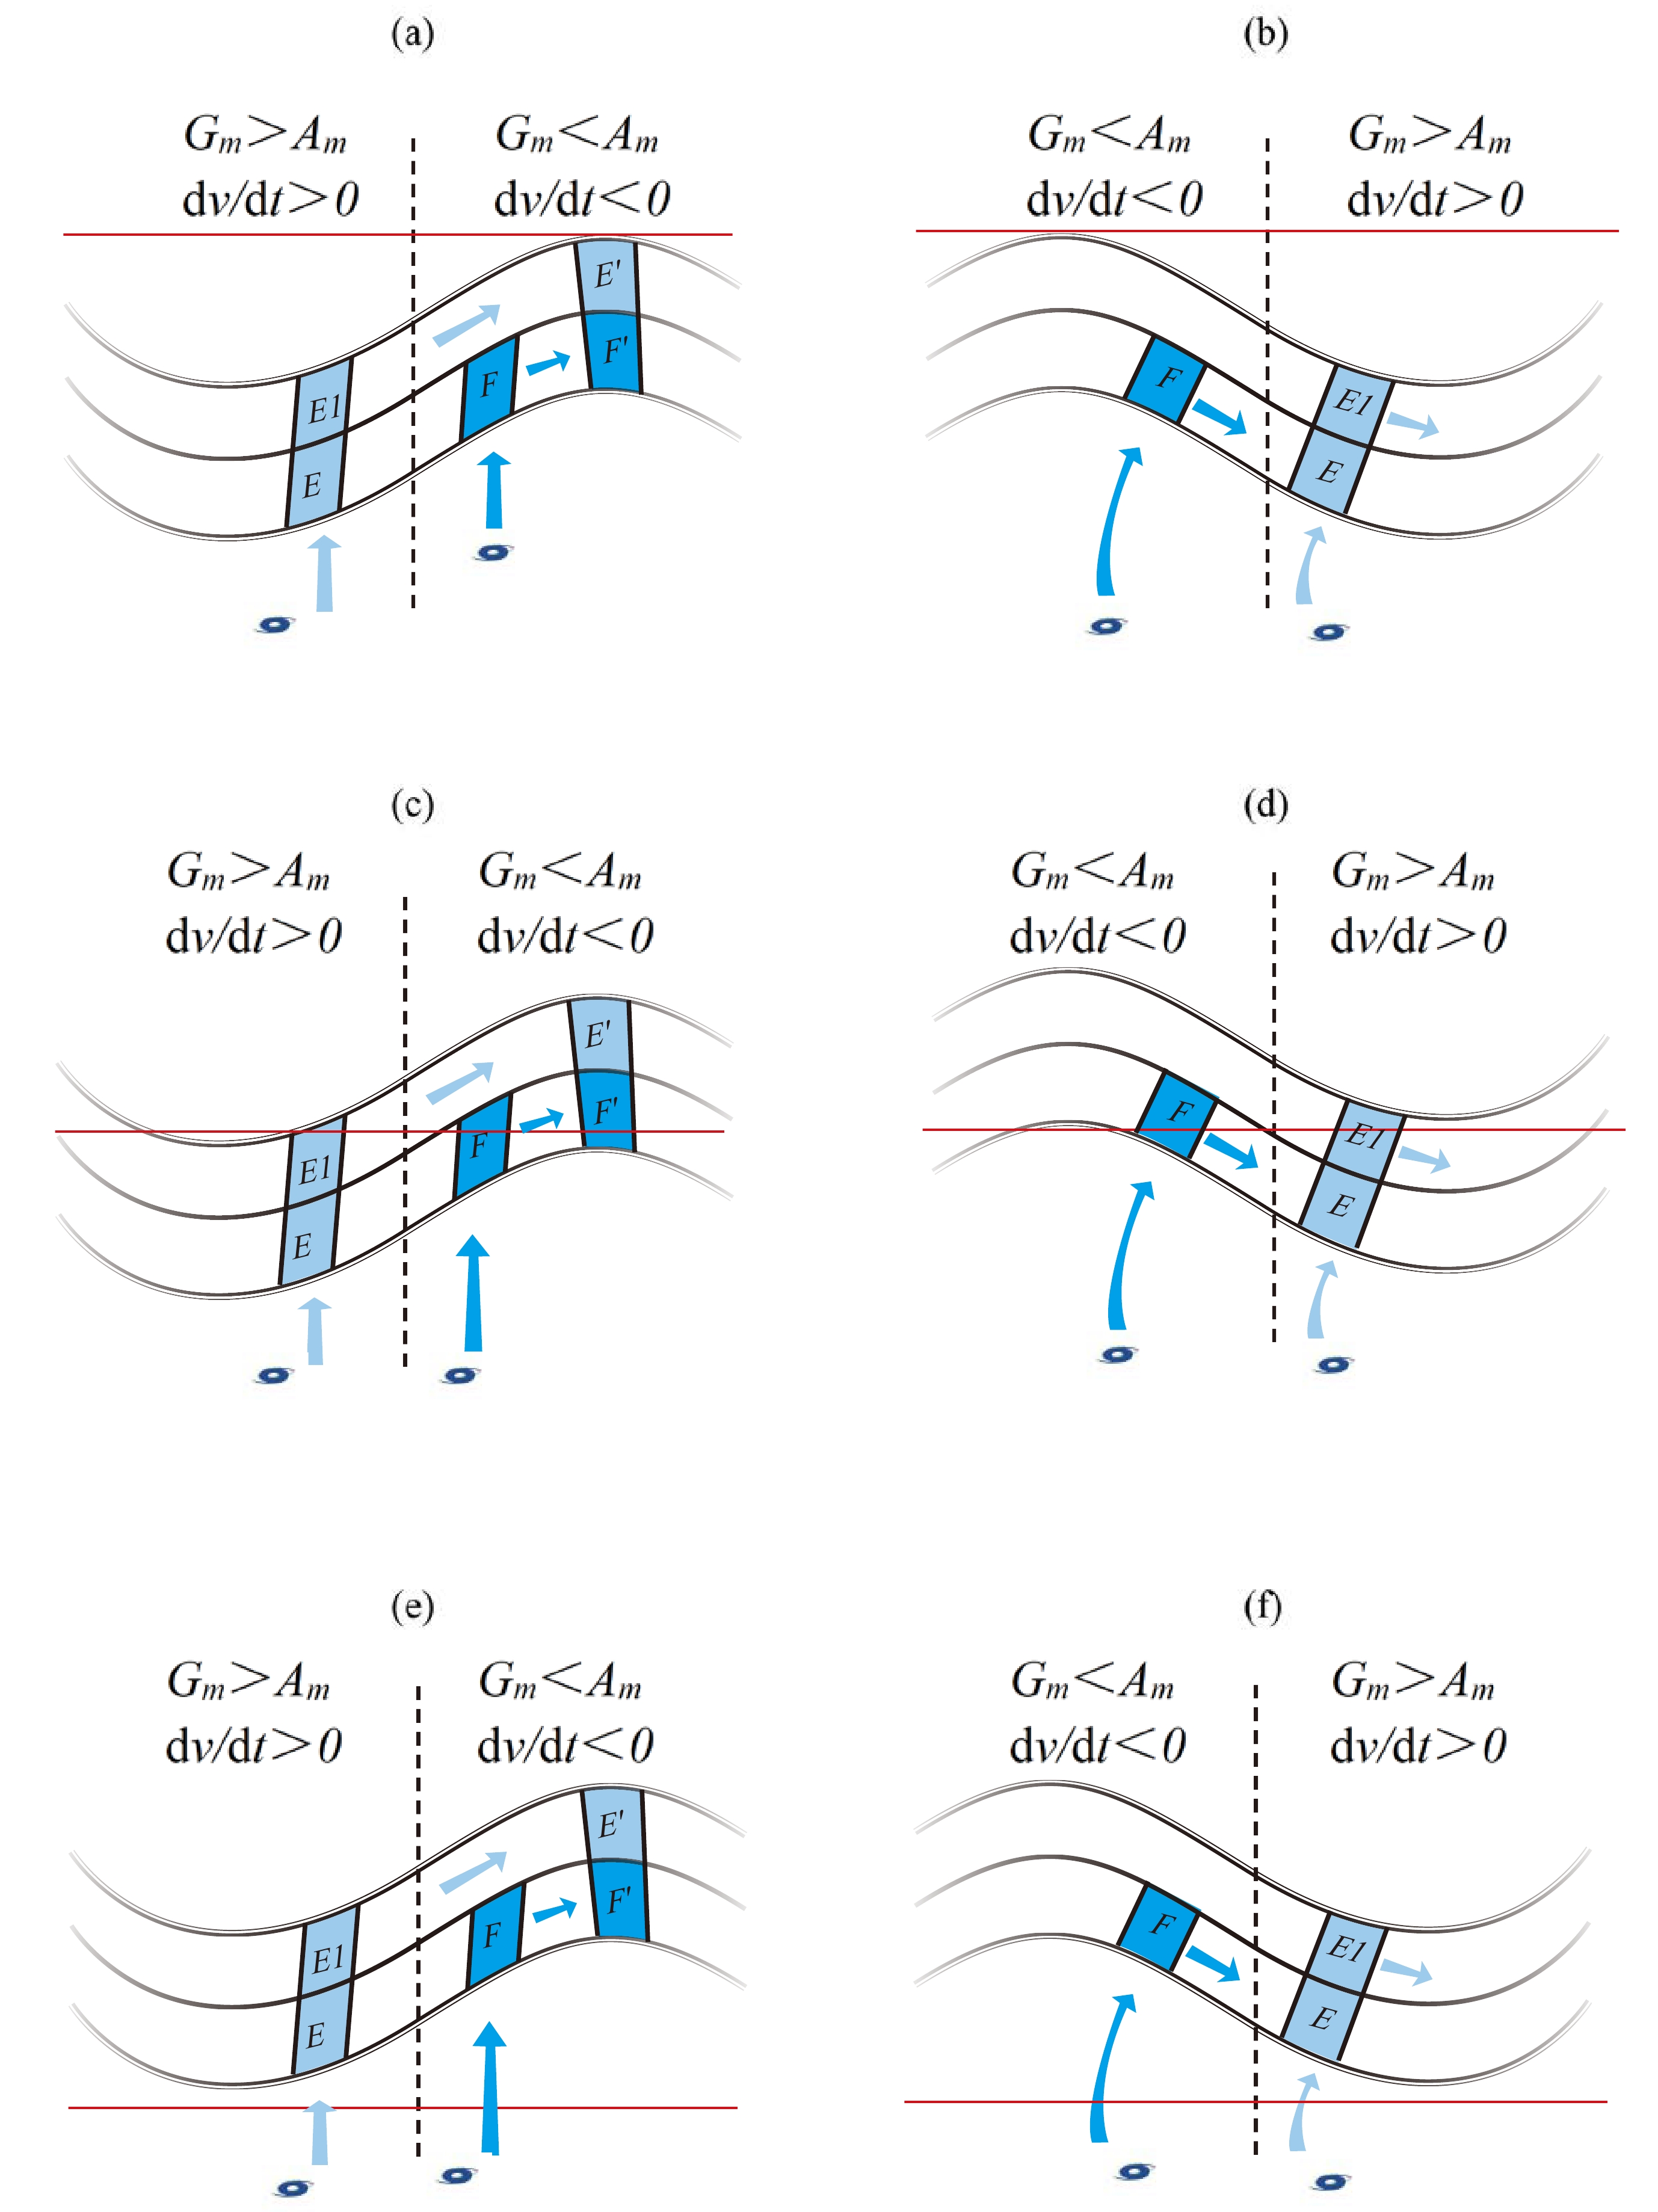
It is known from previous studies (Zhou et al., 2022) that the westerlies are the key factor in determining whether water vapor can cross the SBTP. If a TC wind field in the upper troposphere encounters southwesterly downstream of the trough, which is called a Type-T TC (“T” means “trough”), the water vapor may cross the SBTP, but when it encounters a northwesterly downstream of the ridge, which is called a Type-R TC (“R” means “ridge”), it is difficult for the water vapor to enter the TP. Therefore, it is speculated that the difference in the contribution rate to the MMBA is related to the seasonal variation of the westerlies.
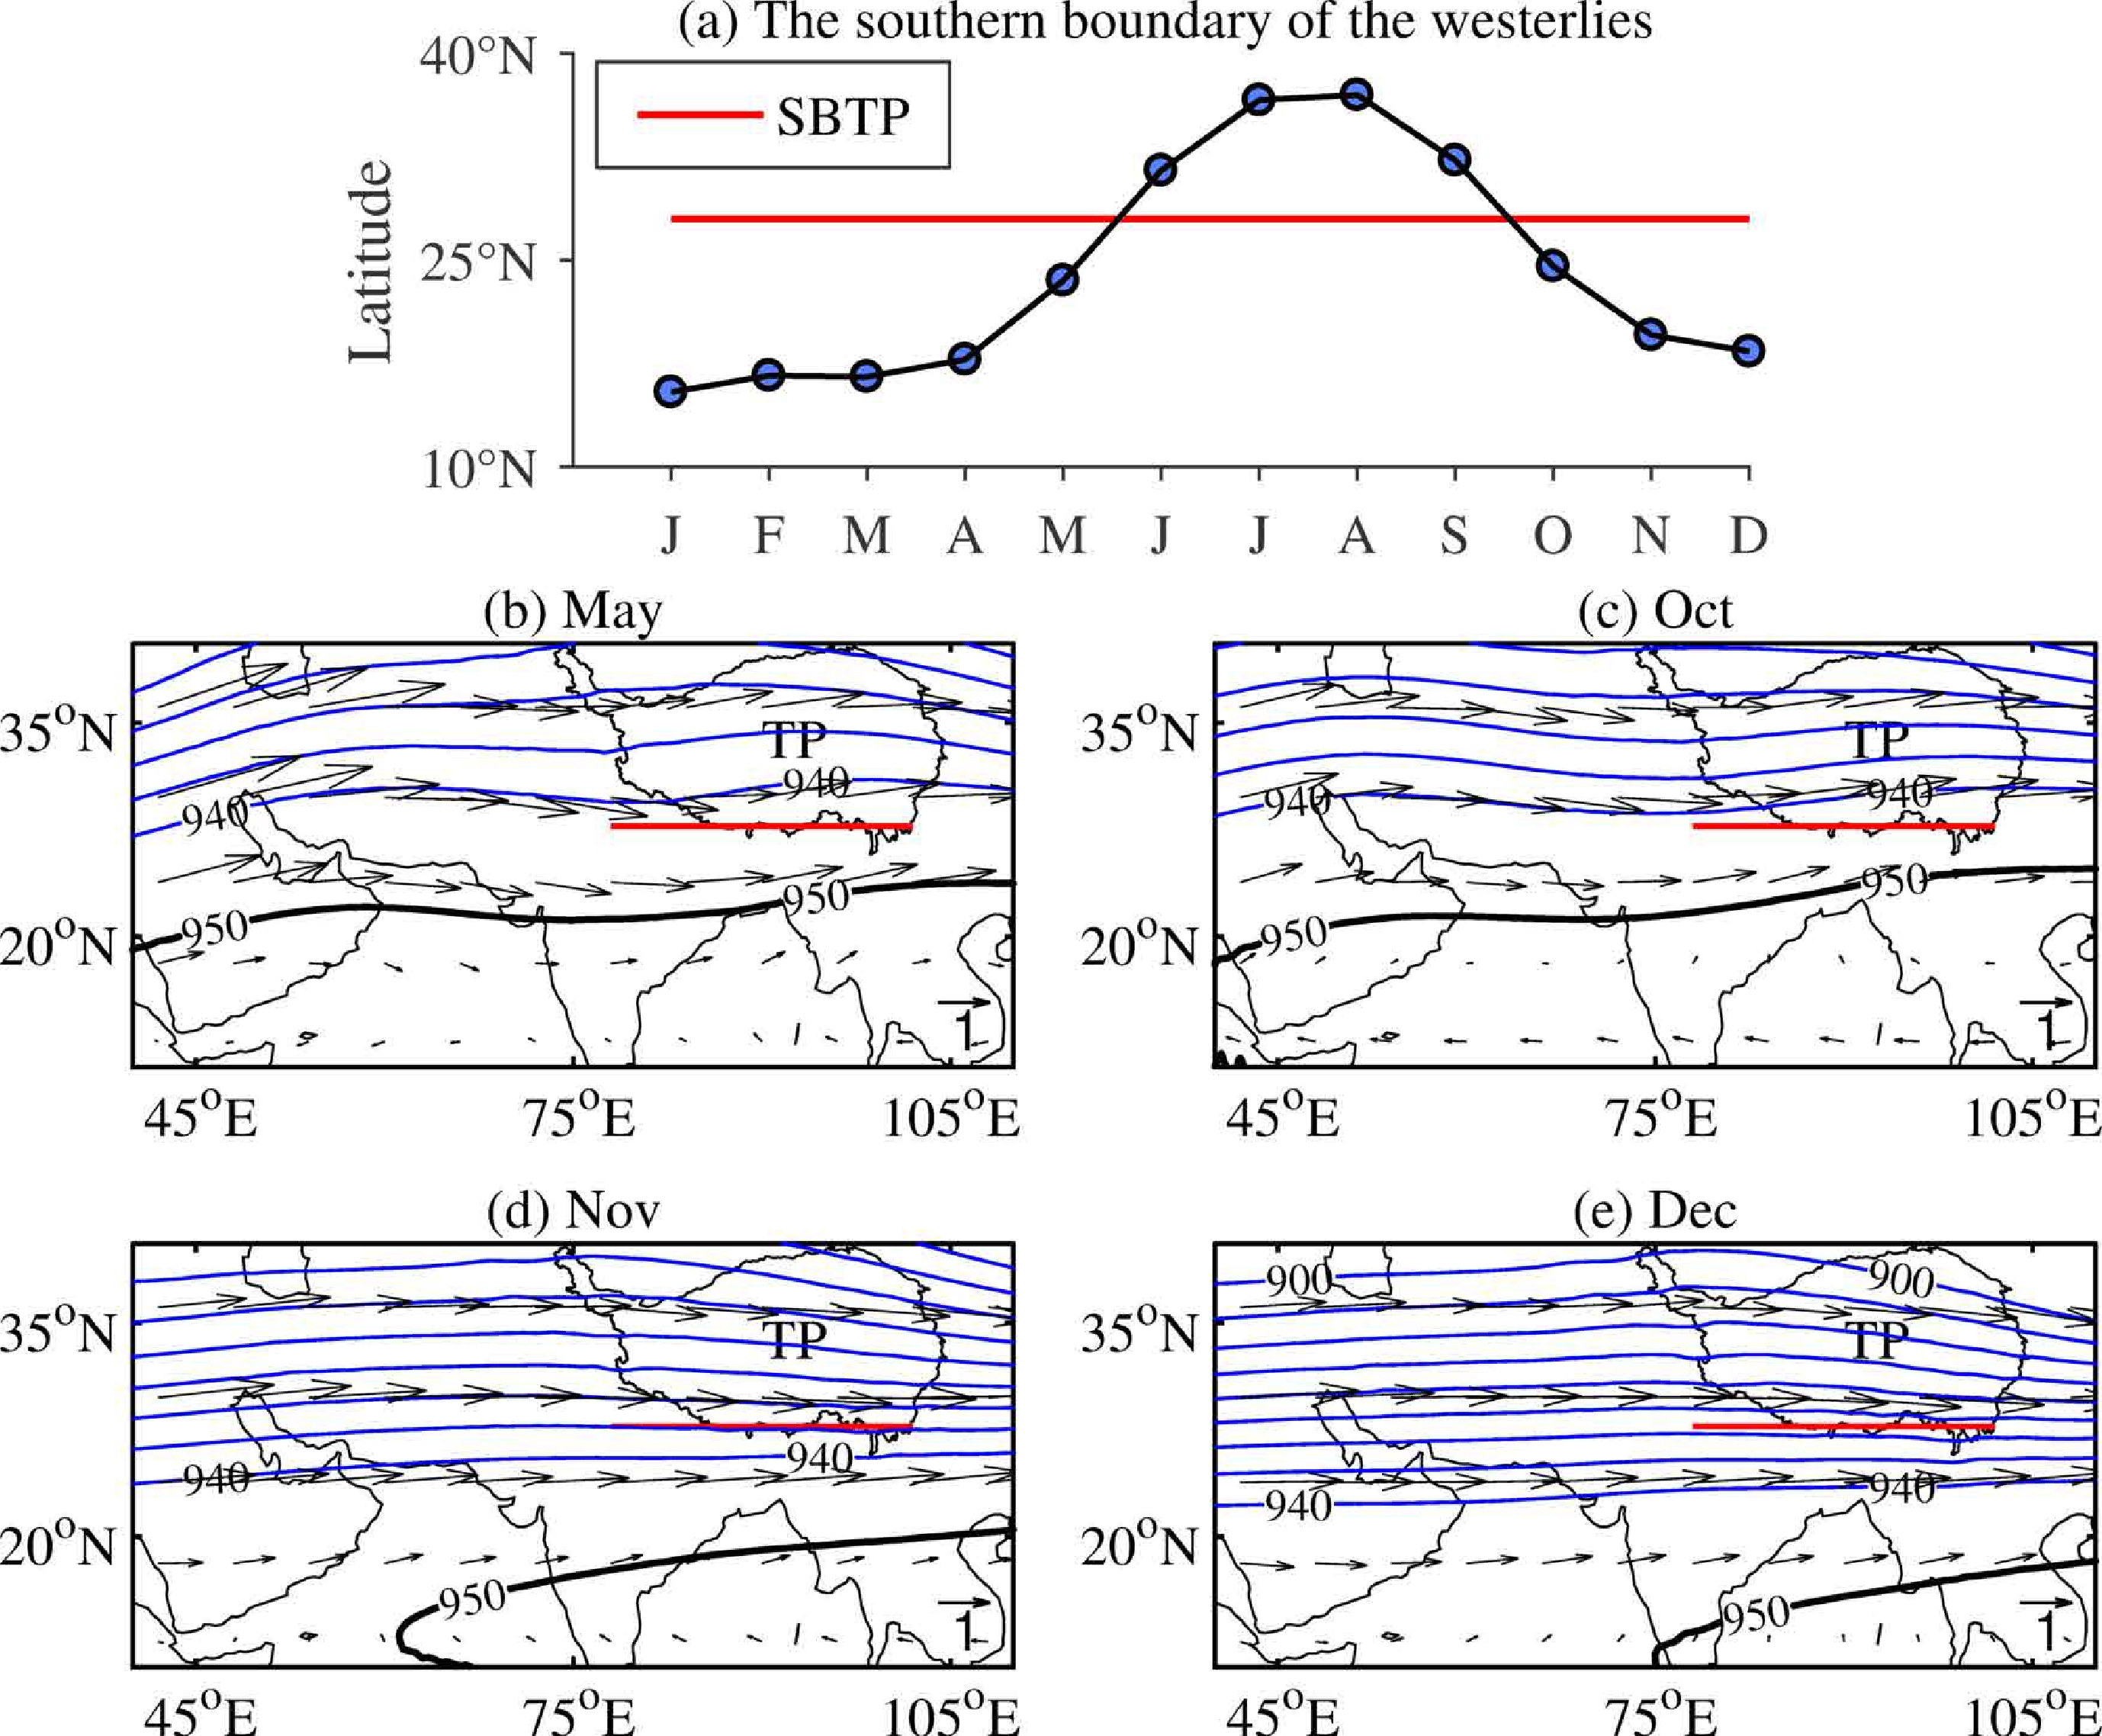
To understand the relationship between the westerlies and BOB TCs, annual variation characteristics of the average latitude of the southern boundary of the westerlies (SBW) within the longitude of the SBTP during 1979–2018 are shown in Fig. 2a. The geopotential height and wind field at 300 hPa (Figs. 2b–e) indicate that the 950 dagpm contour line is very close to the SBW within the longitude of the TP (78°–102°E), so the latitude of this contour line is used to approximately place the position of the SBW in this study. The meridional position of the SBW is relatively north in summer and south in winter. In May and October (Figs. 2b, c), the latitude of the SBW is very close, and it is near the SBTP; from October to December (Figs. 2c–e), the latitude of the SBW gradually turns southward, corresponding to the gradual reduction of the contribution rate to the MMBA.
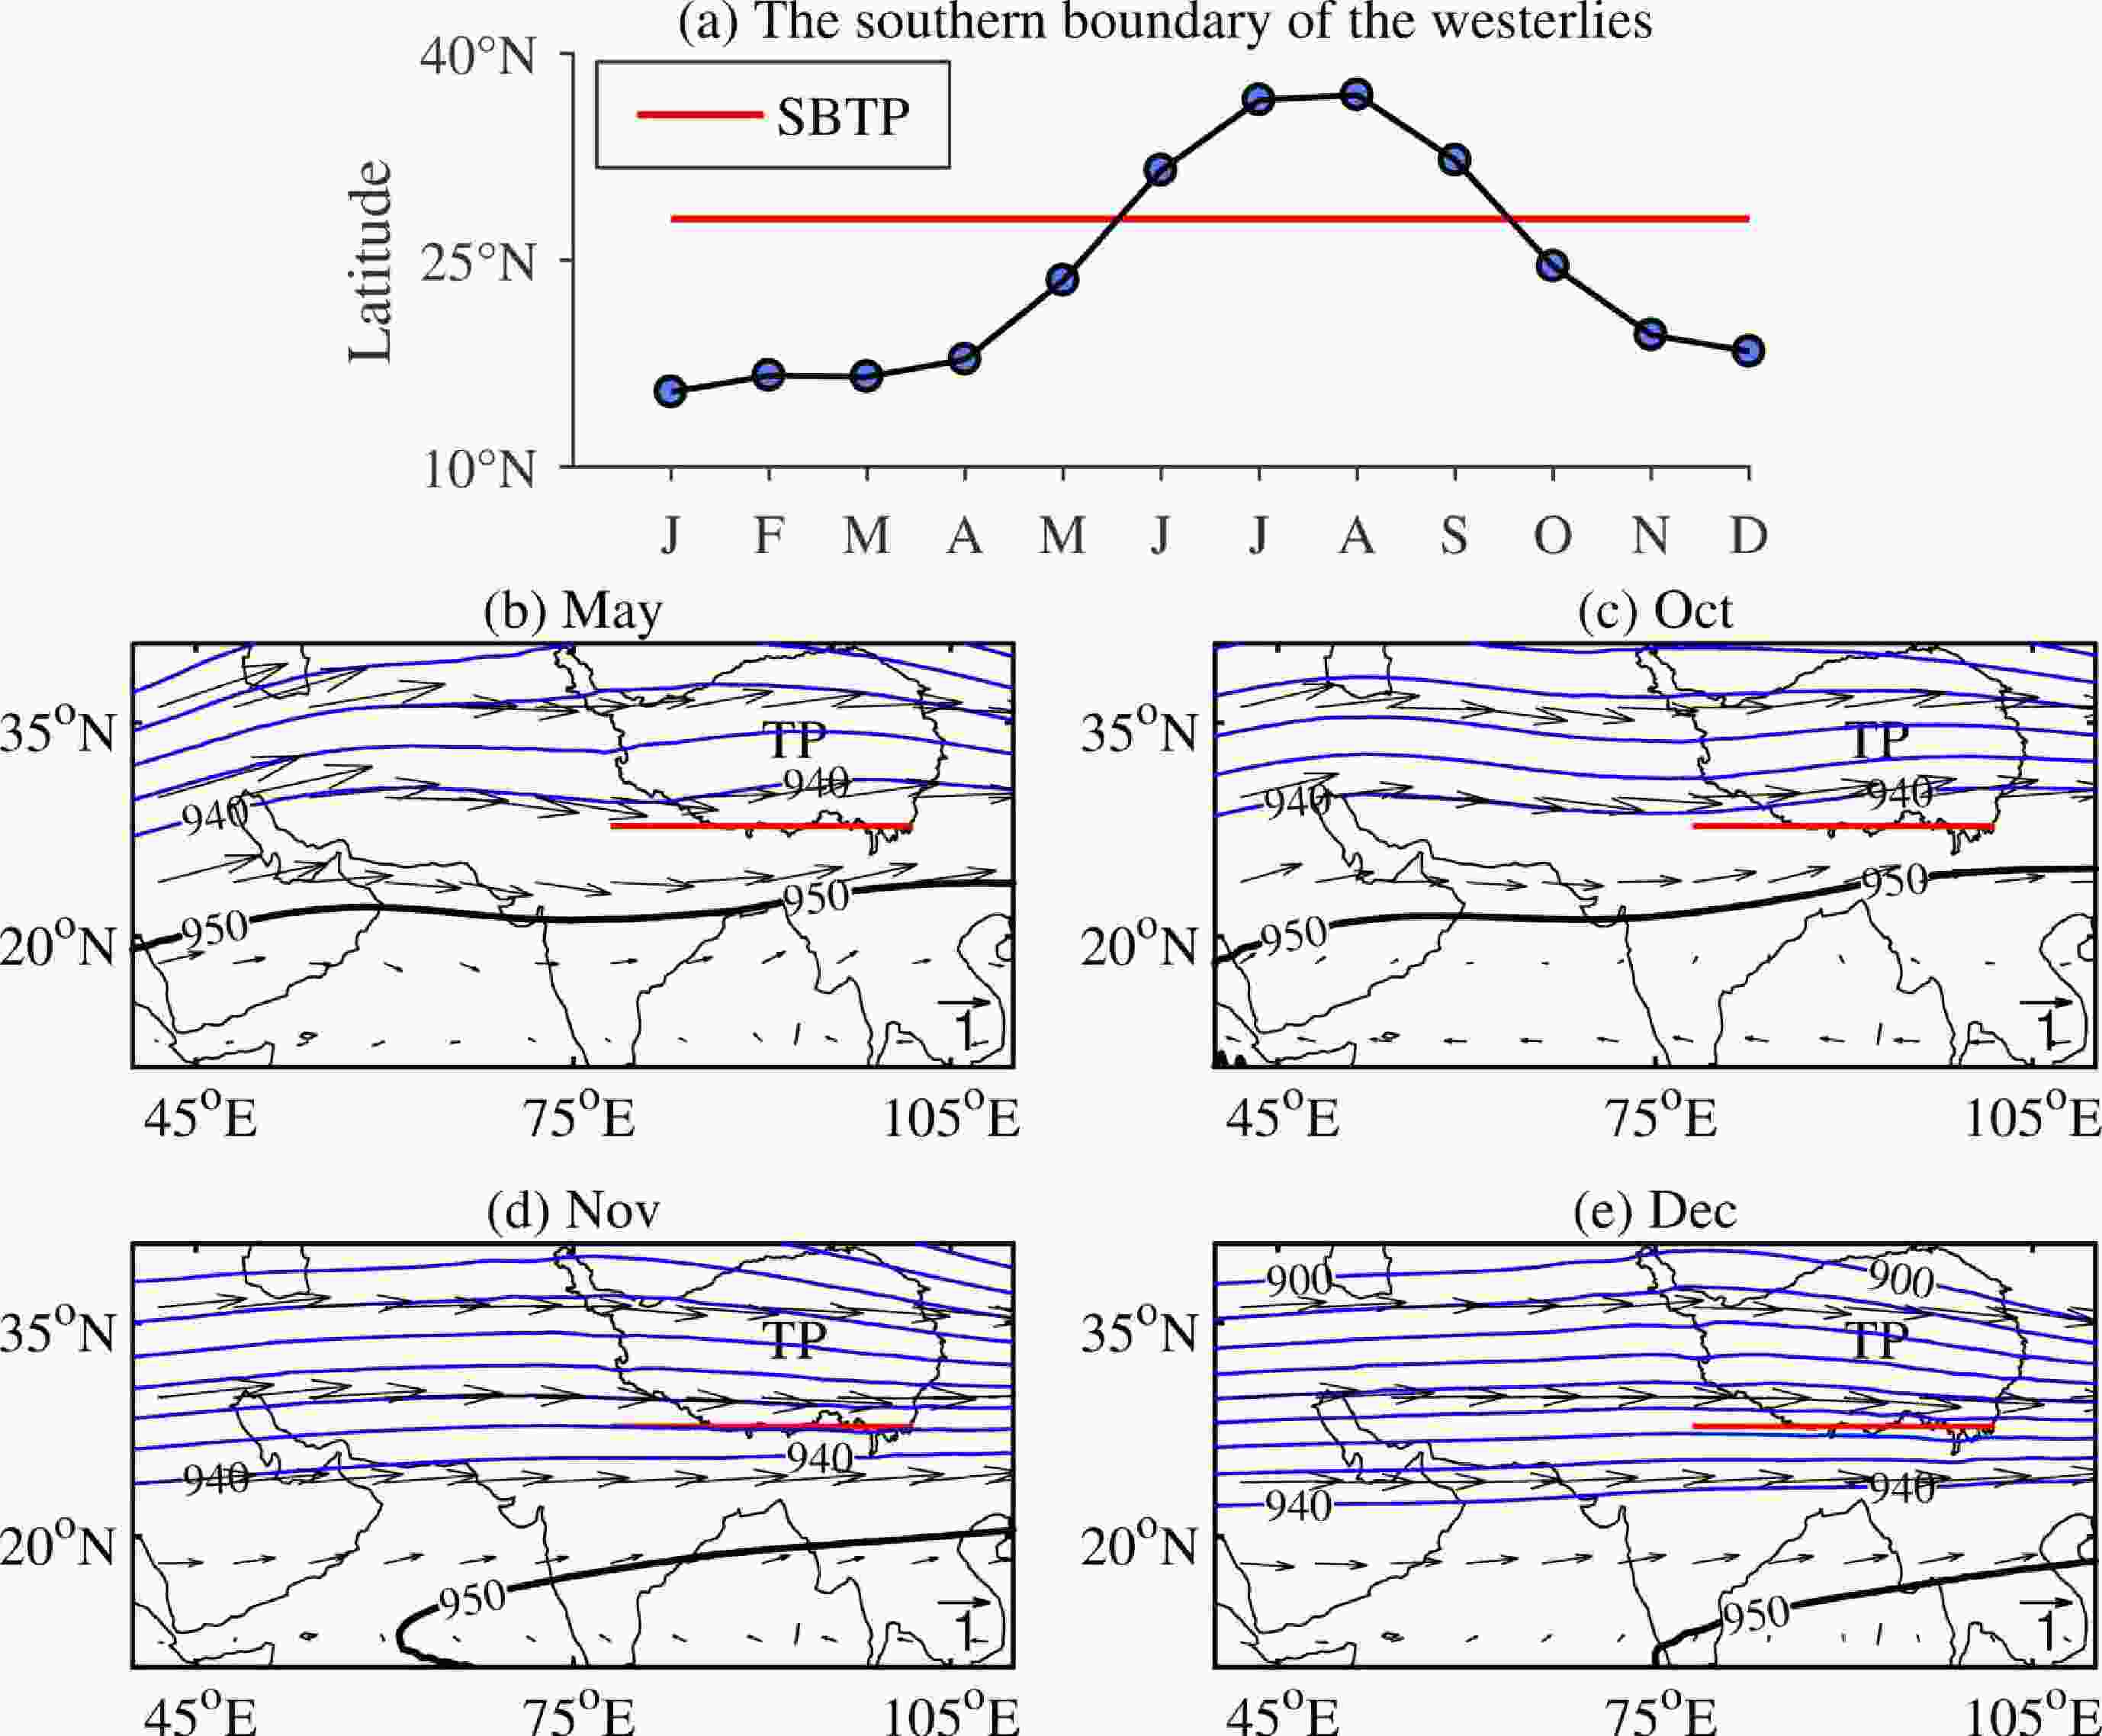
Figure 2. (a) Annual variation of the average latitude of the southern boundary of the westerlies within the longitude of the SBTP and (b–e) the geopotential height (contours, dagpm) and wind field (vectors) at 300 hPa for the double-peak TC seasons during 1979–2018. The solid bold black line approximates the location of the southern boundary of the westerlies.
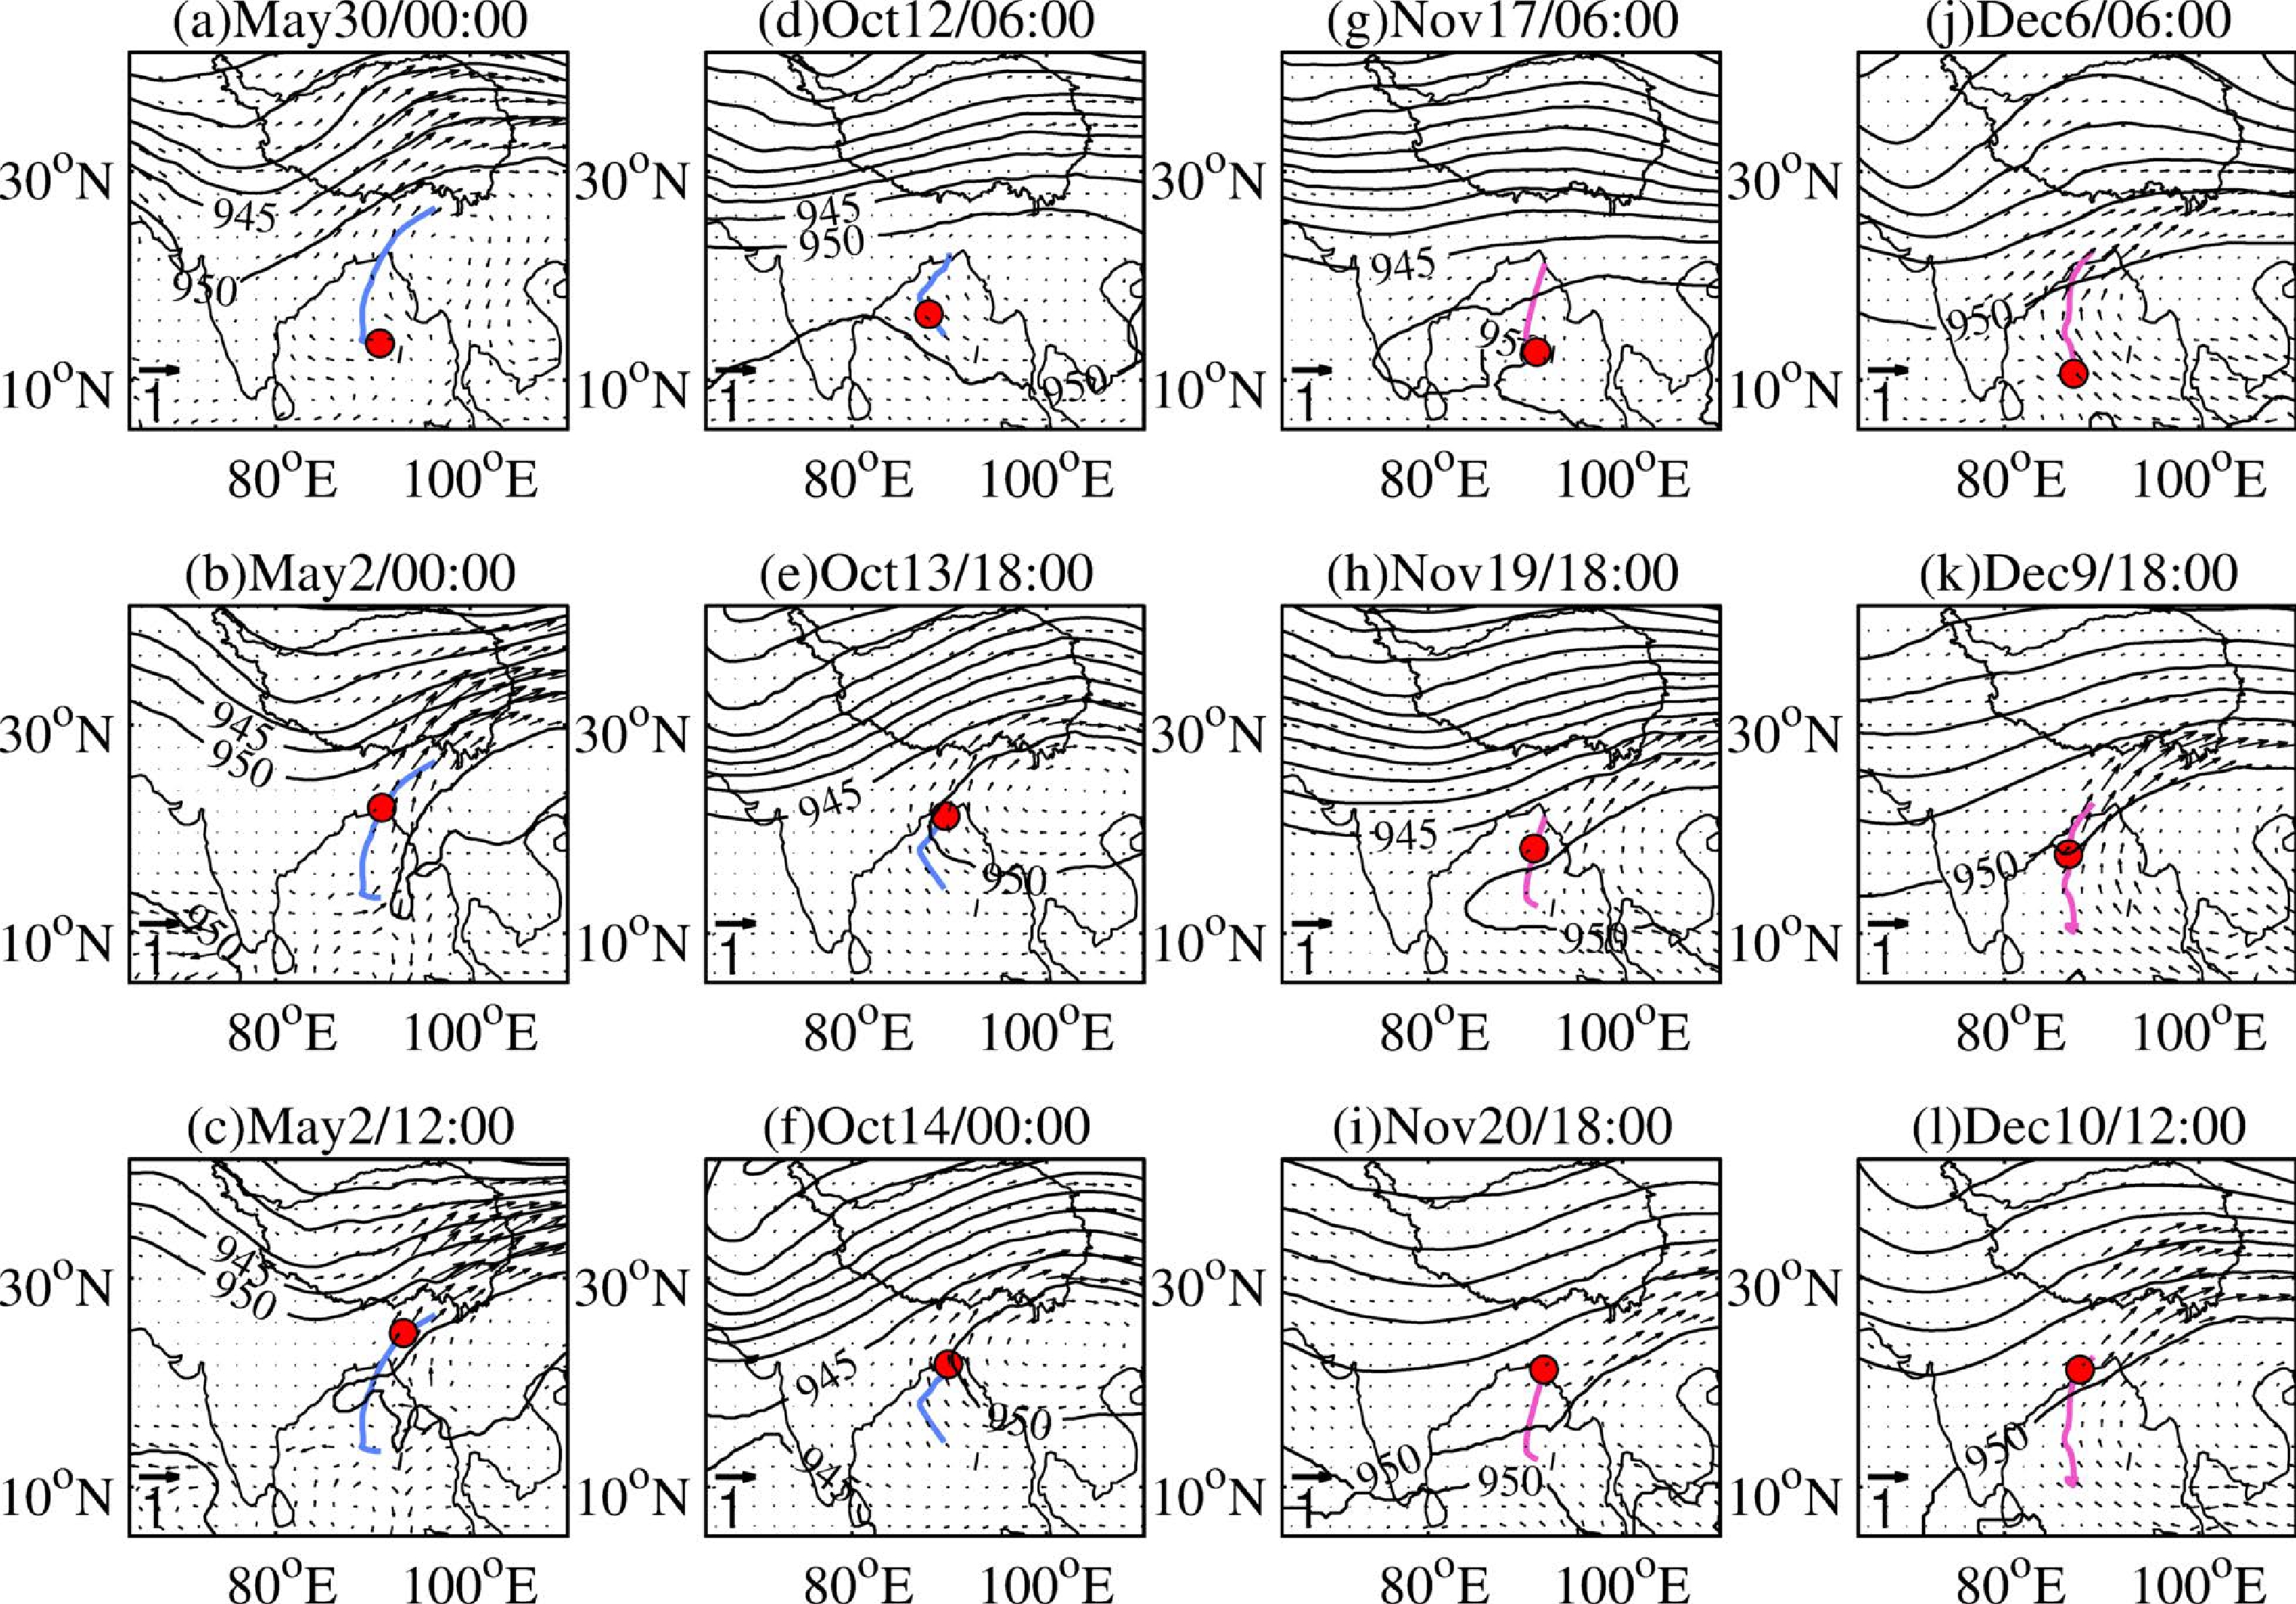
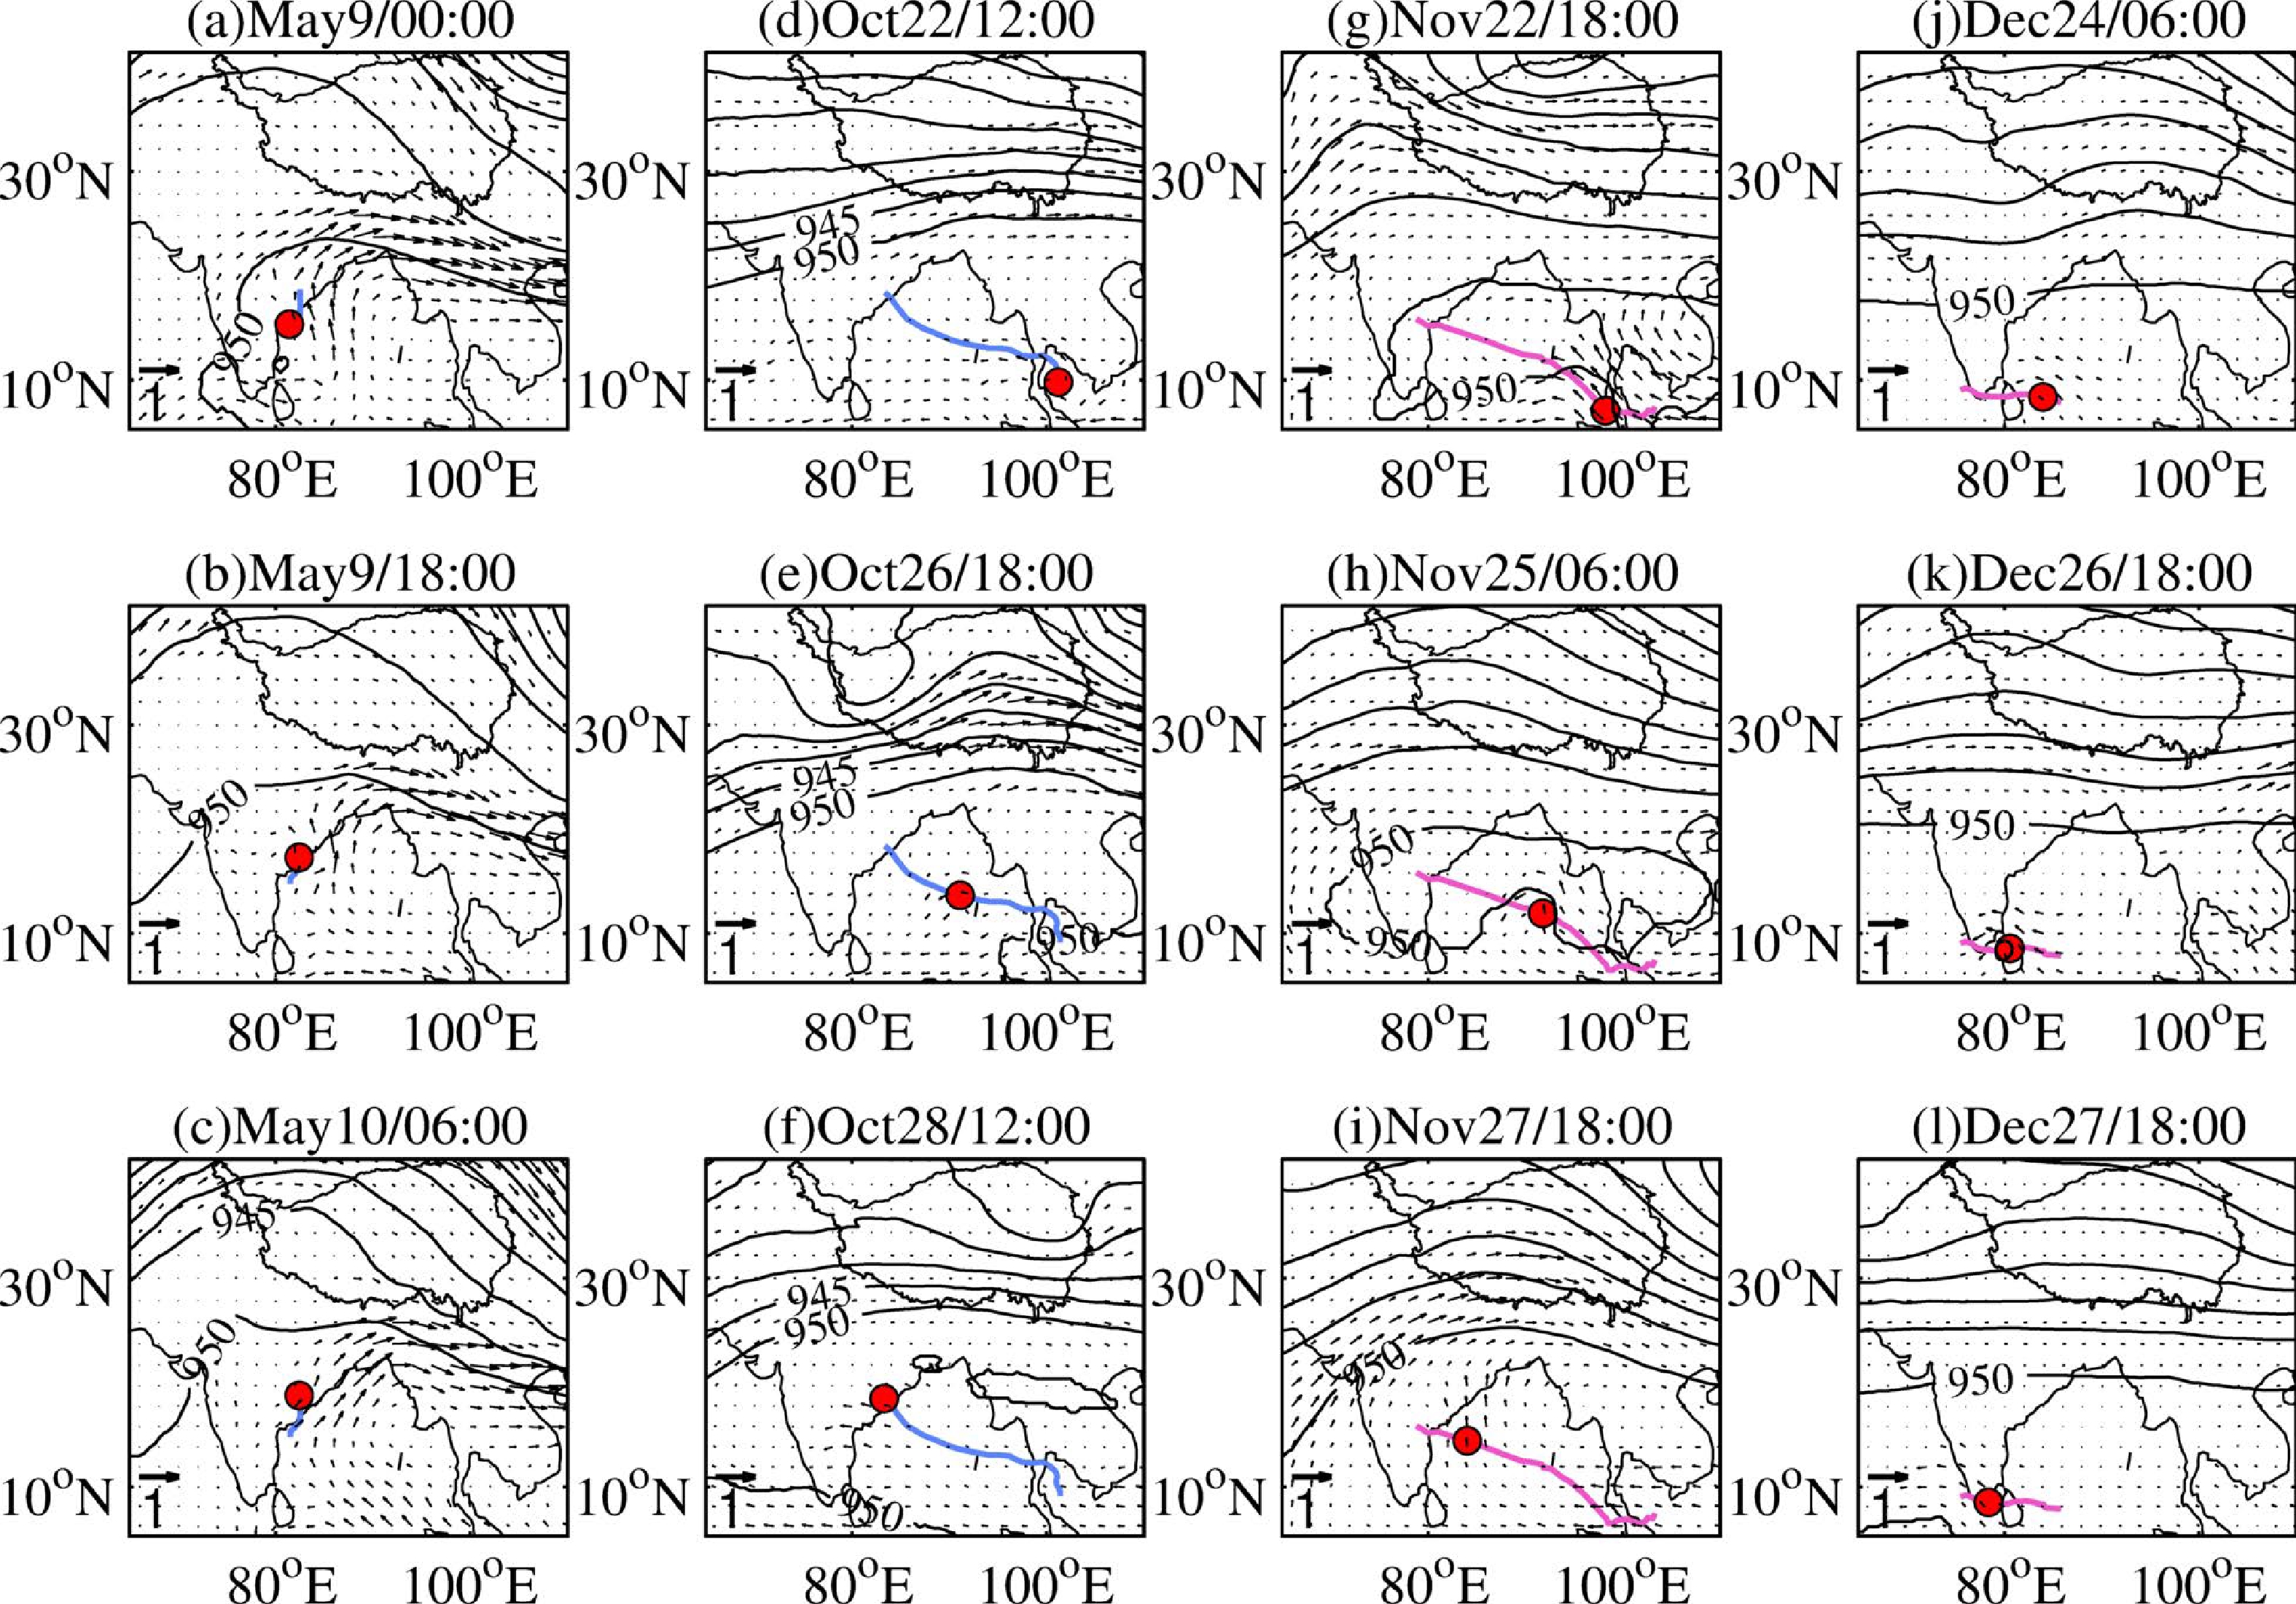
To further verify the influence of the seasonal variation of the westerlies on the seasonal change in the MMBA induced by BOB TCs during the double-peak TC seasons, TC cases in May and October–December are selected and water vapor flux is plotted. In previous work (Zhou et al., 2022), it was clarified that in May, for Type-T TCs (Type-R TCs) with westerlies around the SBTP, the water vapor may (may not) enter the TP. That is to say, the configuration of the trough and ridge during the TC activity period affects water vapor transport in different ways. Therefore, 4 Type-T TC cases (Fig. 3) and 4 Type-R TC cases (Fig. 4) in May and October–December are selected to compare the difference in water vapor transport between the two configurations. For Type-T TCs, the geopotential height and water vapor flux at three different moments are selected and shown in Fig. 3. The trough is relatively north in May and October (Figs 3a–f), and relatively south in November and December (Figs. 3g–l). When the trough is relatively north (Figs. 3a–f), water vapor can be transported farther north. When the trough is relatively south, water vapor does not necessarily cross the SBTP (Fig. 3i). For Type-R TCs, the geopotential height and water vapor flux are shown in Fig. 4. The ridge is relatively north in May and October (Figs. 4a–f), and relatively south in November and December (Figs. 4g–l). When the ridge is abnormally north (Figs. 4a–c), water vapor may cross the SBTP, but it can affect only the southern region of the TP. When the ridge is relatively south, the water vapor cannot cross the SBTP (Figs. 4g–l).
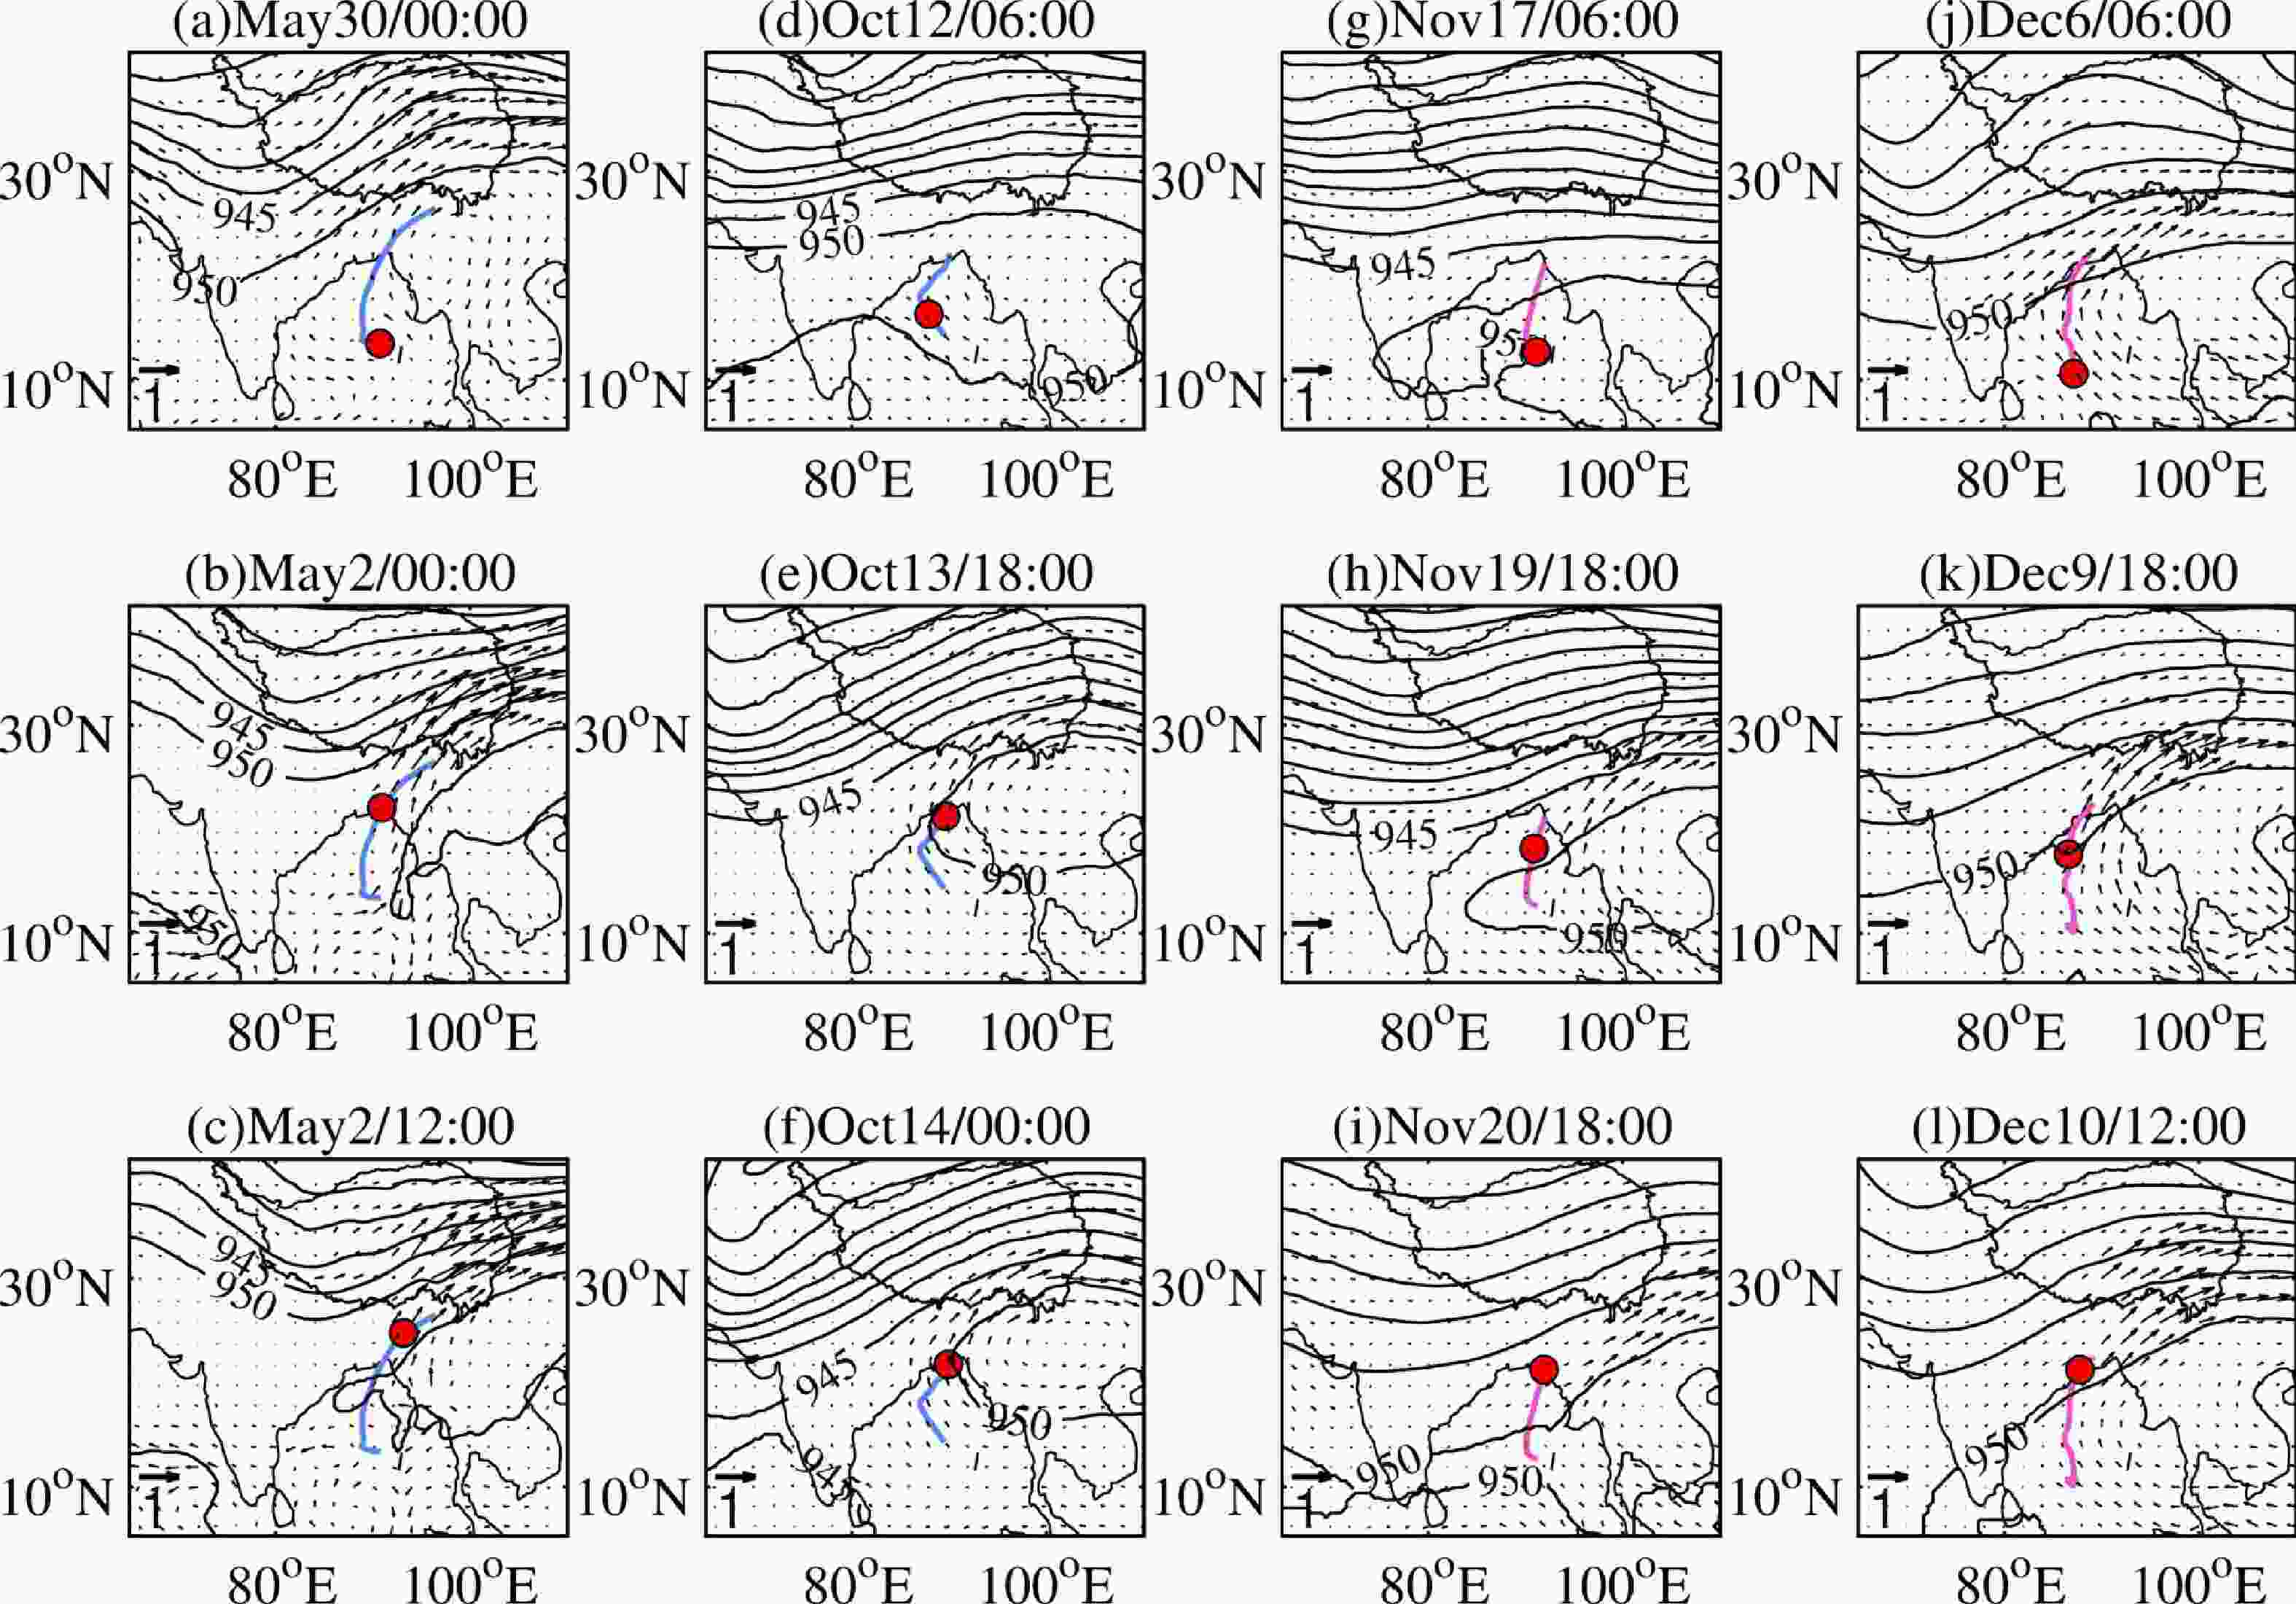
Figure 3. The geopotential height (contours, dagpm) and water vapor flux (vectors) at 300 hPa, and TC path (solid blue and red lines indicate weak and strong TC paths, respectively) for Type-T TC cases in (a–c) May, (d–f) October, (g–i) November and (j–l) December. The red circles represent the position of the TC center at the time shown in each plot.
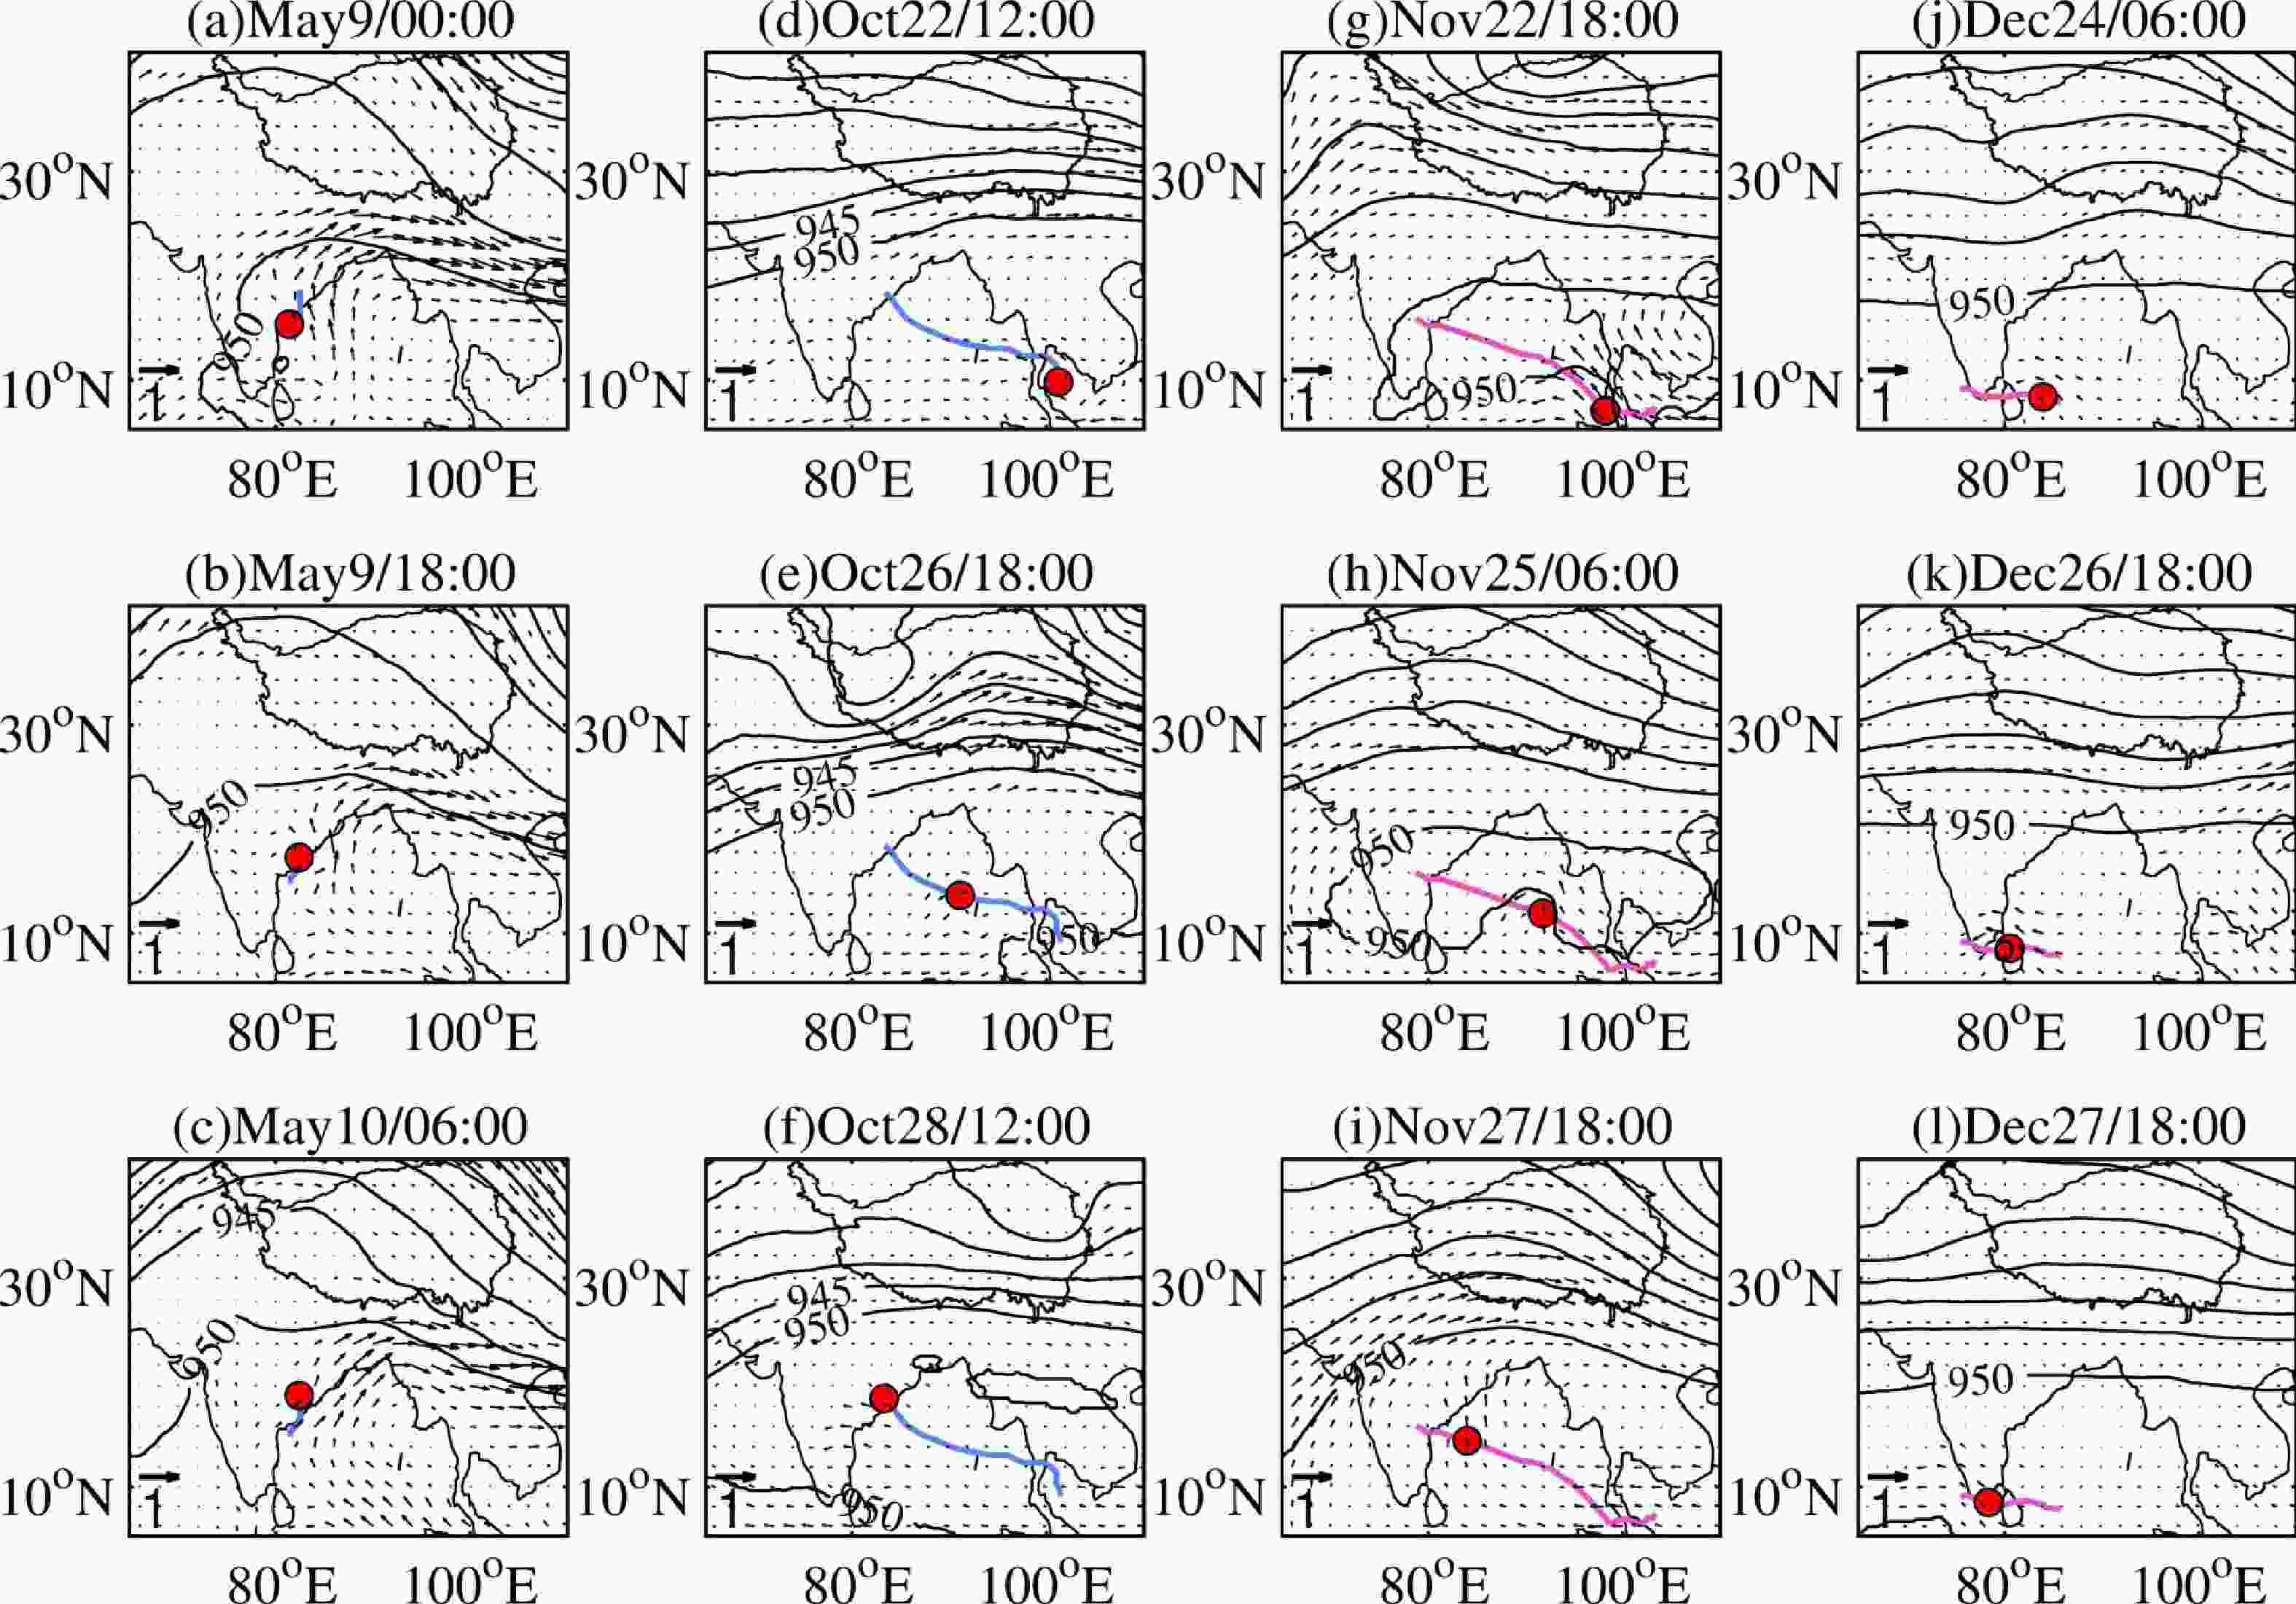
Figure 4. The same as in Fig. 3, but for Type-R TC cases.
In addition, for Type-T TCs (Fig. 3), TC intensities in May (Figs. 3a–c) and October (Figs. 3d–f) are weak, the trough is relatively north, and water vapor around the TCs can enter the TP. TCs in November (Figs. 3g–i) are strong, the trough is relatively south, and the contribution to water vapor transport is small. For Type-R TCs (Fig. 4), even if the selected TC cases in November and December are strong, due to the configuration of a ridge around the SBTP, it is difficult for water vapor to enter the TP. These conclusions again show that TC intensity is not the key factor affecting the contribution rate to the MMBA.
-
To explain the influential mechanism of the westerlies, we further analyze the momentum equation. In the mid-latitudes, air masses in the upper troposphere in large-scale motion are controlled by the Coriolis force and pressure gradient force, in opposing directions.
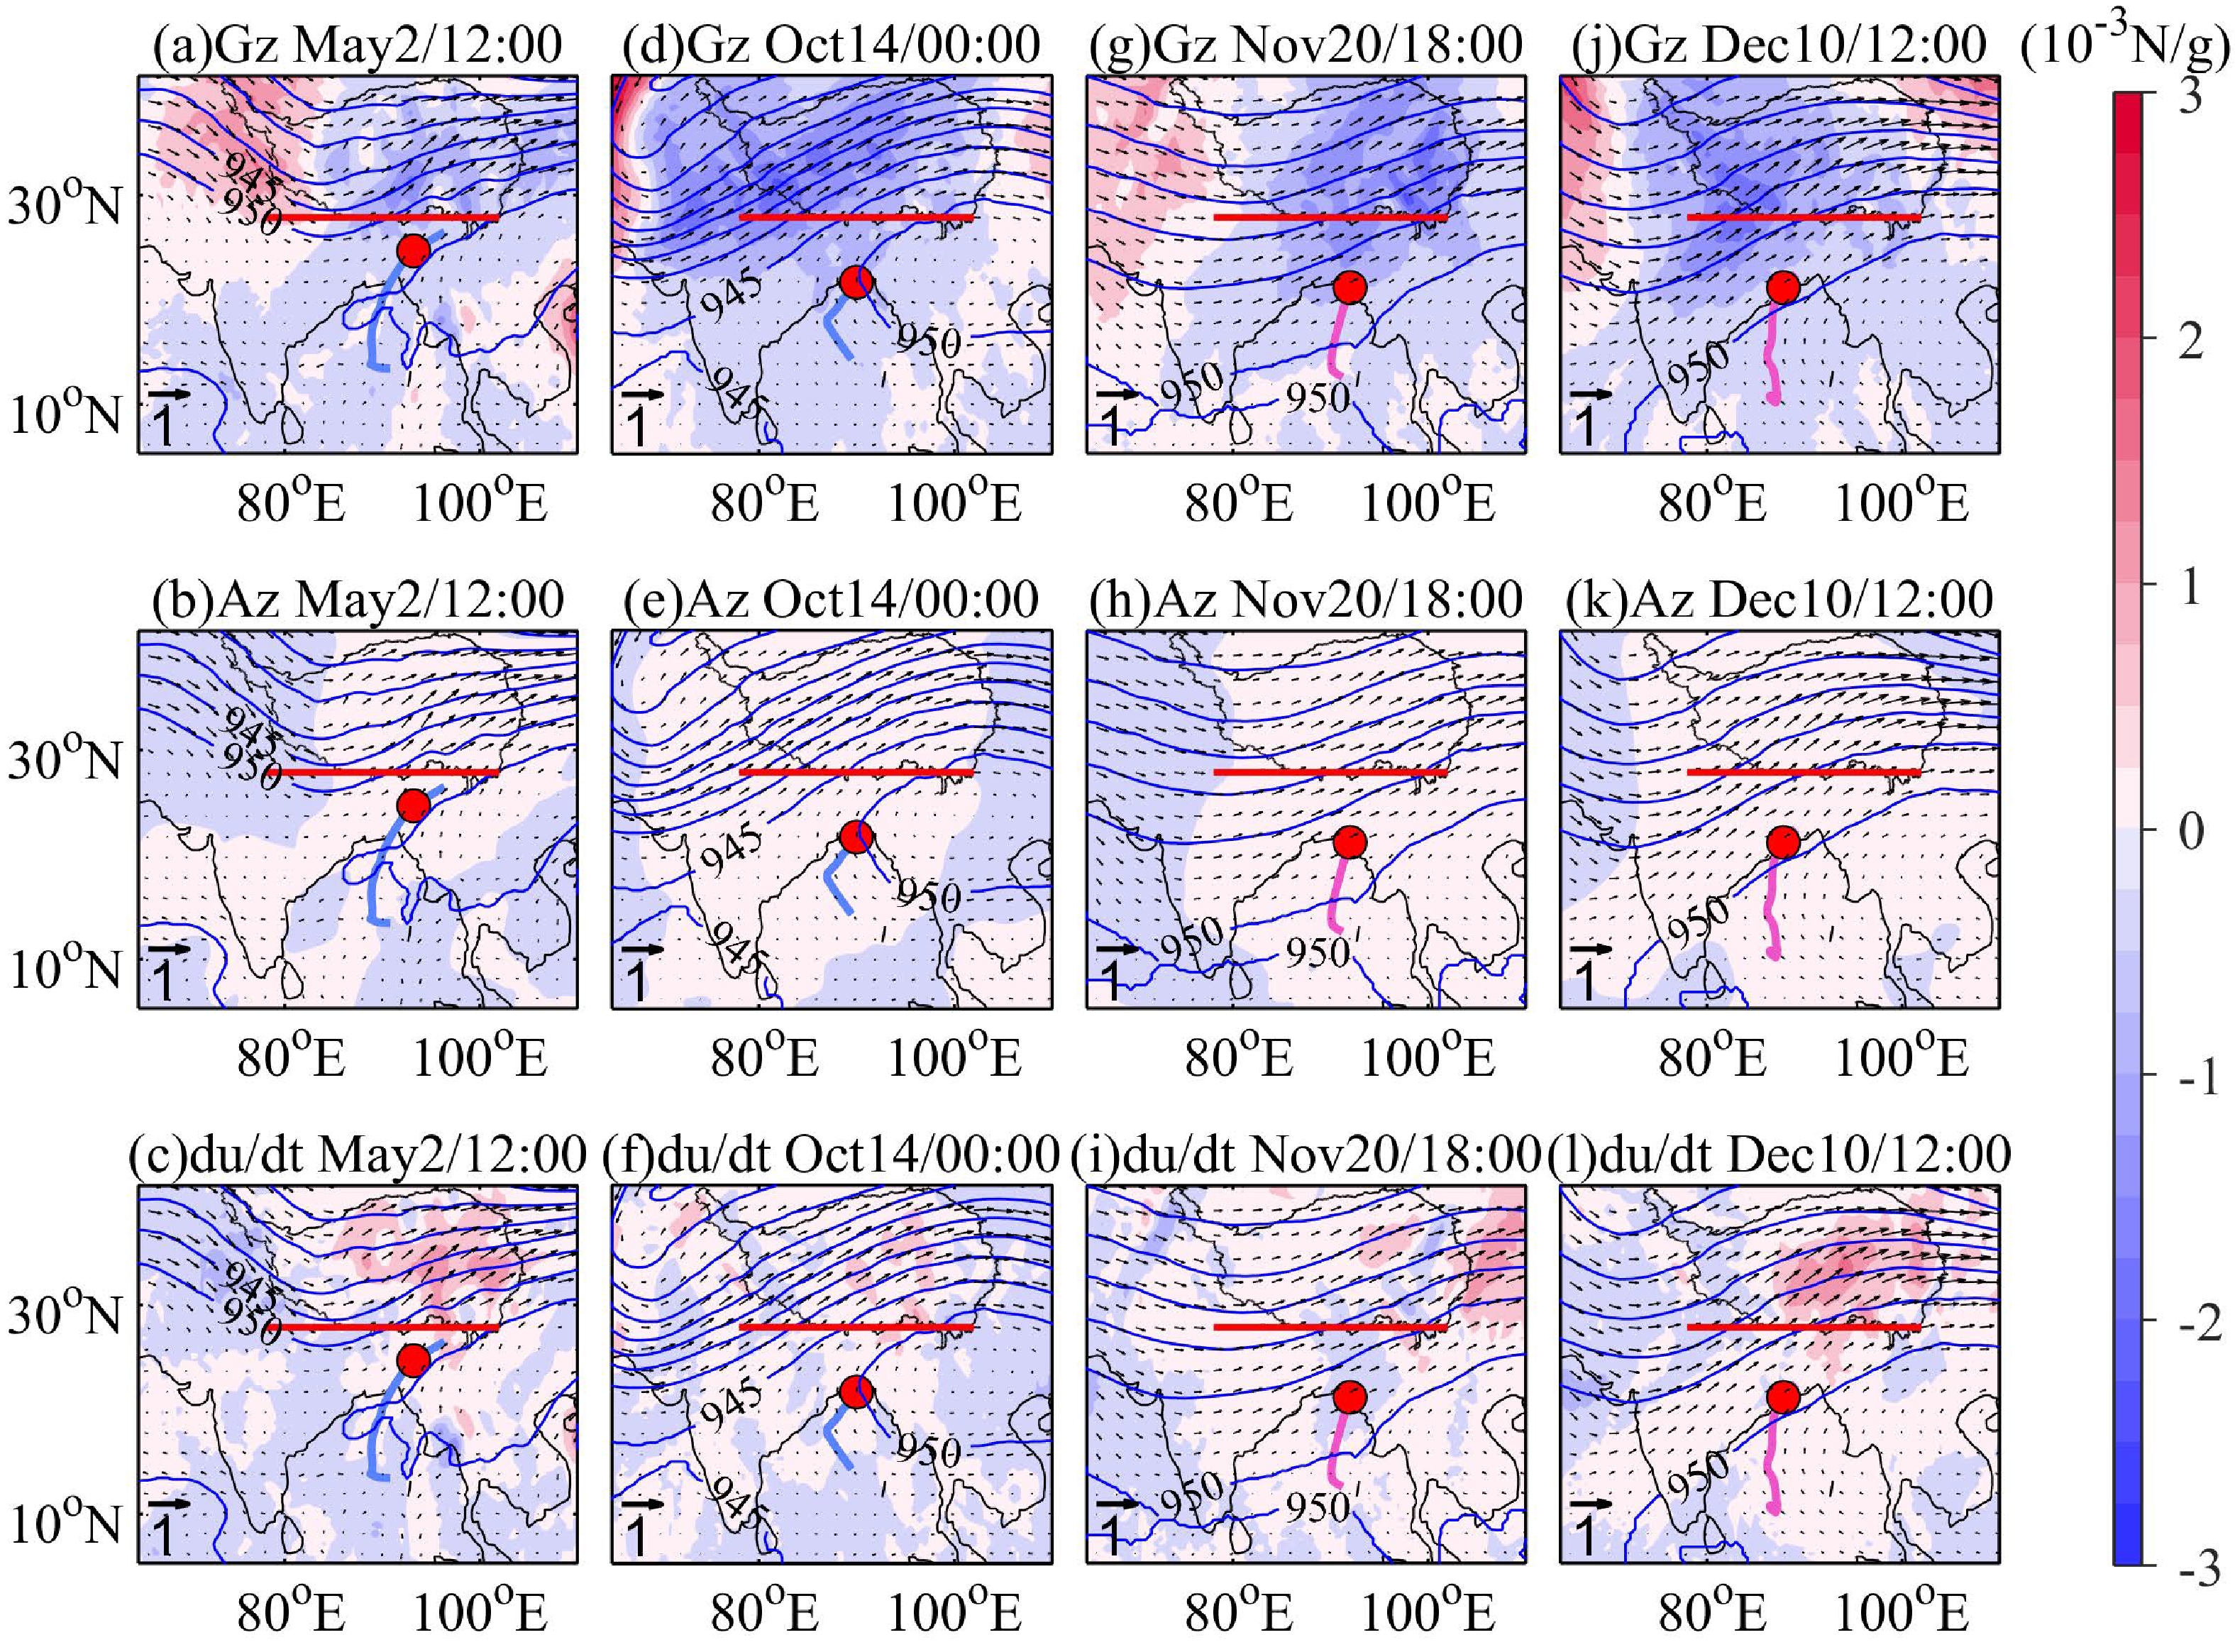
Figure 5 shows the meridional component of the pressure gradient force (Gm), Coriolis force (Am), and resultant acceleration (dv/dt) at 300 hPa for the four Type-T TC cases. With different meridional positions of the westerlies, the distribution of Gm and Am is also different in the meridional direction. In the westerlies, Gm is positive and the direction is north, while Am is negative and the direction is south. For Type-T TCs in May and October (Figs. 5a–f), the trough is relatively north, and the distribution of Gm and Am is significantly north. When the trough is relatively south in November and December (Figs. 5g–l), the distribution of Gm and Am is relatively south. For the resultant acceleration (Figs. 5c, f, i, and l), in the area near the trough line, it is positive and the direction is north, and in the area near the ridge line, it is negative and the direction is south. Therefore, it is easy for water vapor to cross the SBTP when it enters the westerlies from the area near the trough line. When the water vapor enters the westerlies from the area near the ridge line, for Type-T TCs with the trough relatively south, the water vapor may not cross the SBTP, or it affects only the southern region of the TP. Such is the case in November (Fig. 5i).
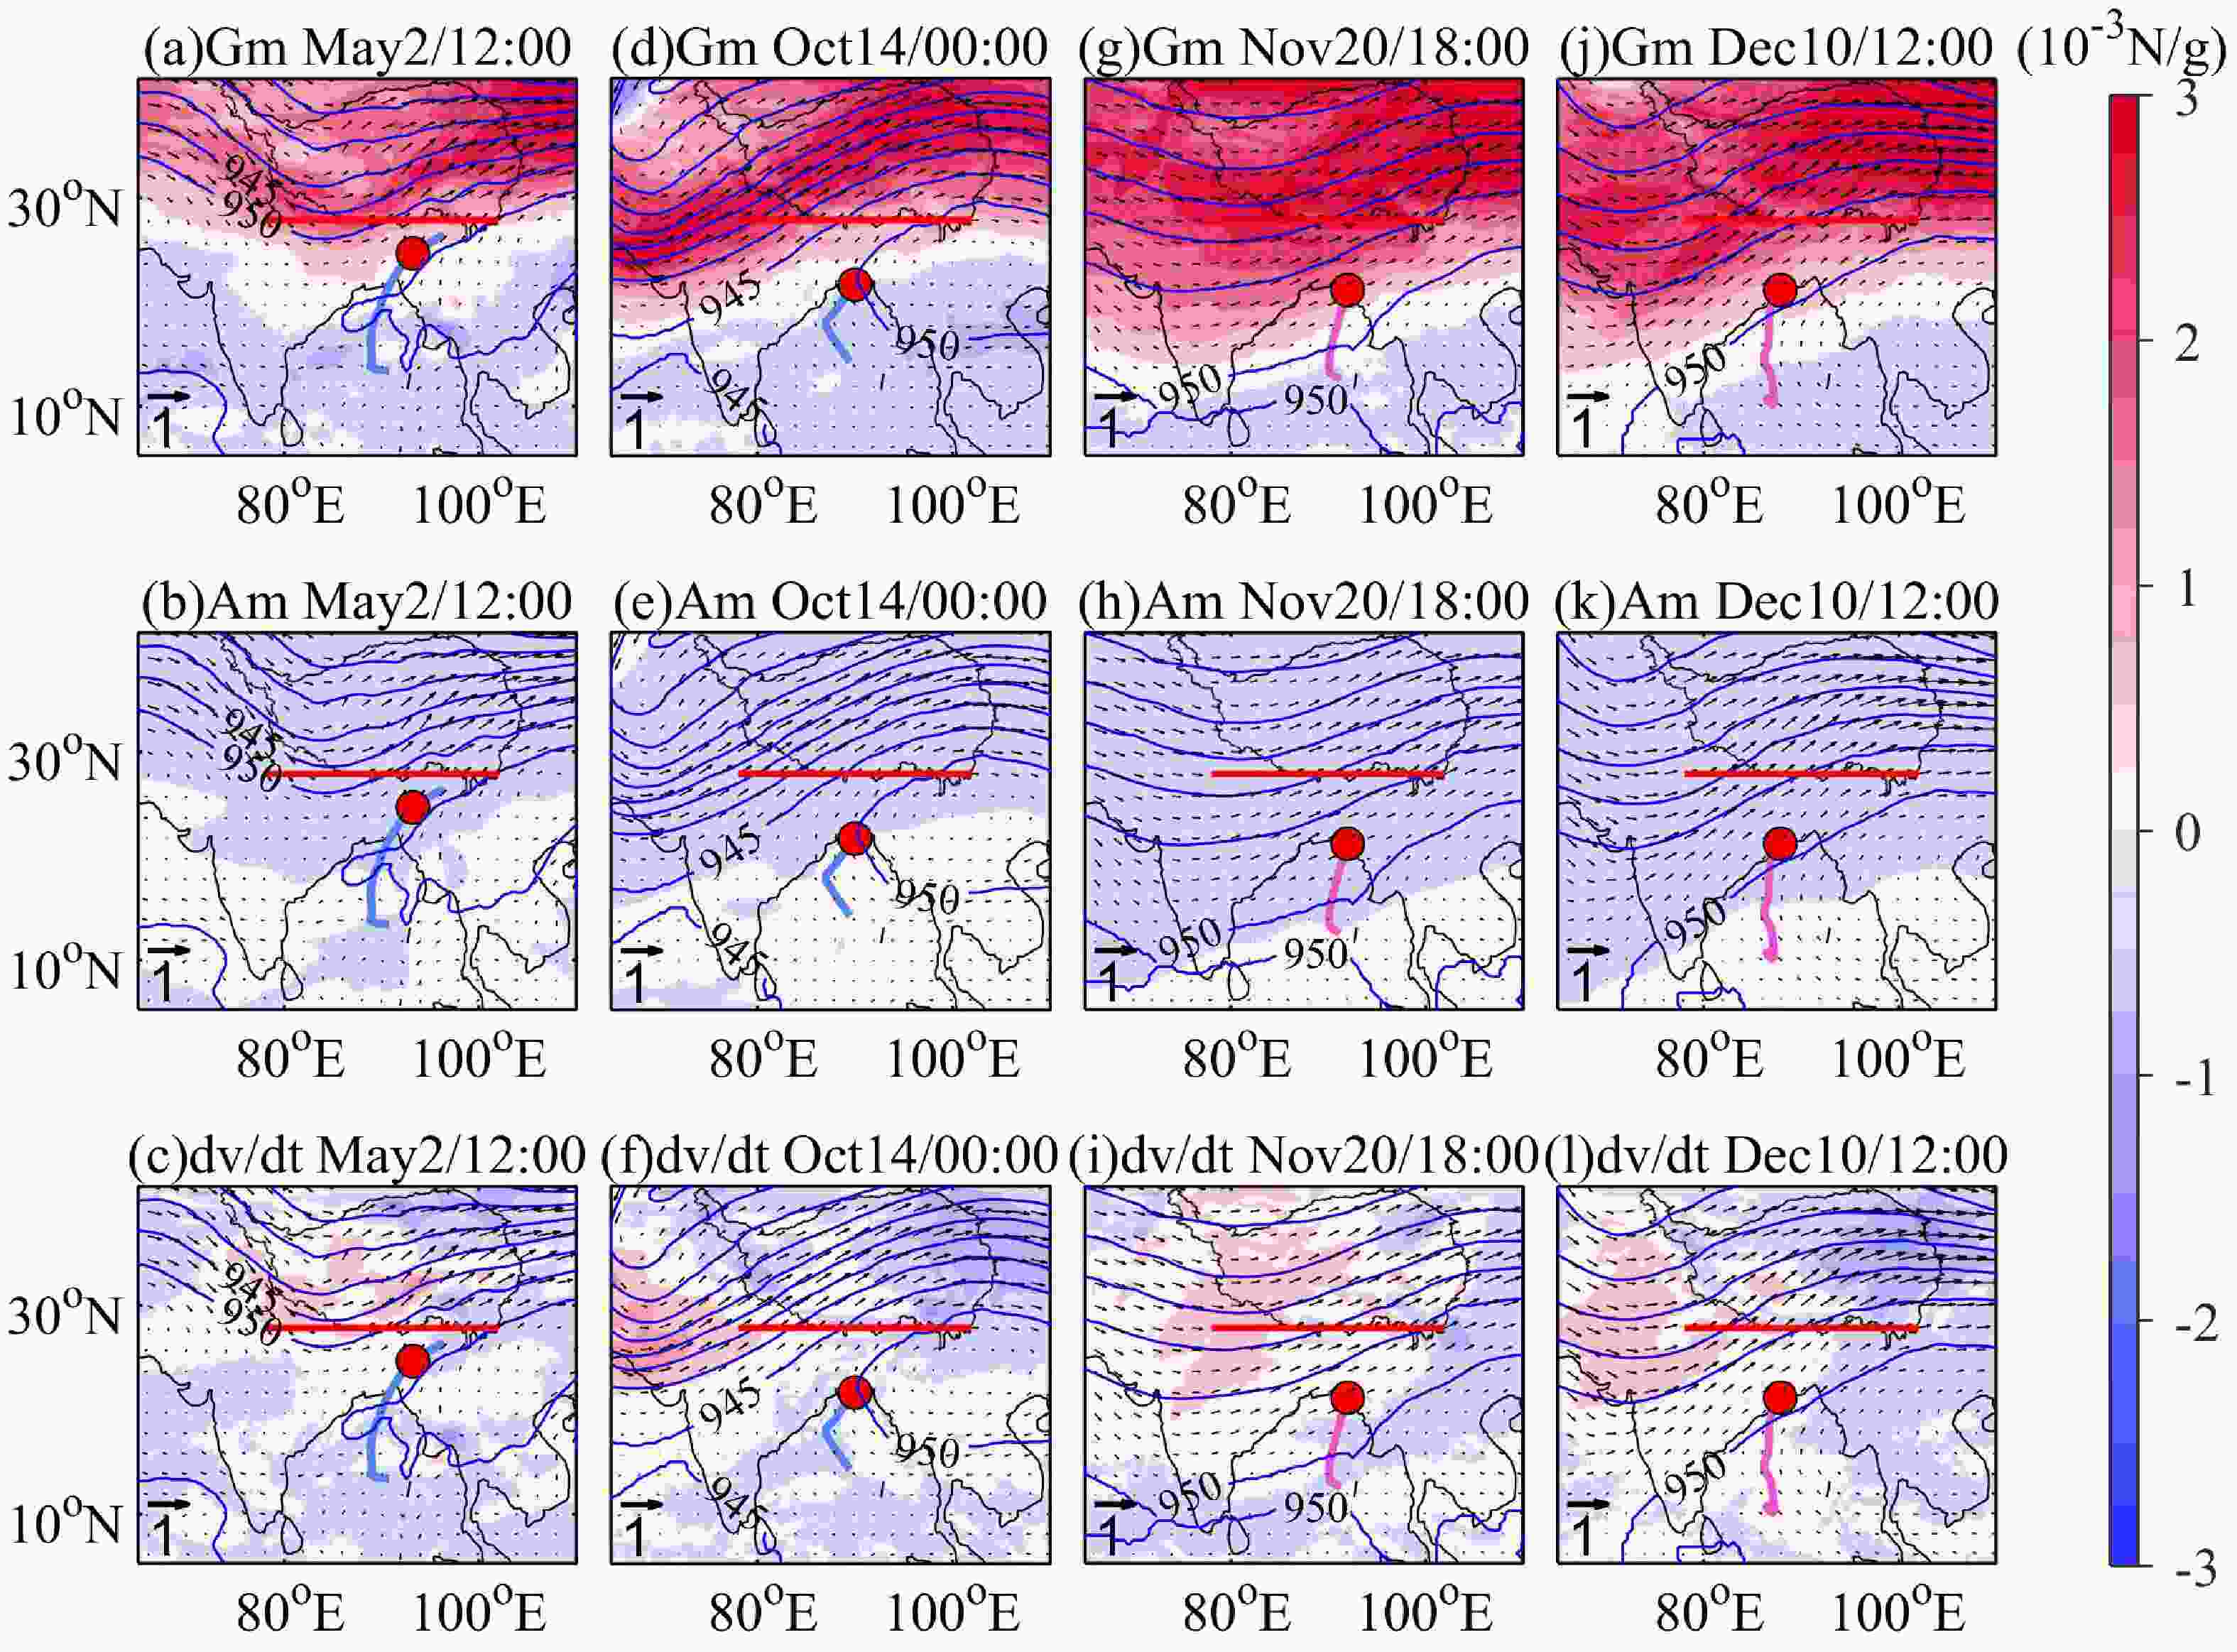
Figure 5. (Gm: a, d, g, j) Geopotential height (dagpm, blue lines), wind field (m s–1, vectors), TC path (bold blue and purple lines represent weak and strong TCs, respectively), and the meridional component of the pressure gradient force, (Am: b, e, h, k) Coriolis force, and (dv/dt: c, f, i, l) resultant acceleration for Type-T TC cases at 300 hPa. Red dots represent the position of the TC center at the time shown in each plot.
The zonal component of the pressure gradient force (Gz), Coriolis force (Az), and resultant acceleration (du/dt) for Type-T TCs is shown in Fig. 6. Downstream of the trough, Gz is westwardly directed, and Az is eastwardly directed, and the opposite is true downstream of the ridge. Therefore, when water vapor enters the westerlies from the area near the ridge line downstream of the trough, it will quickly be deflected to the east, which is not conducive to the northward transport of water vapor.
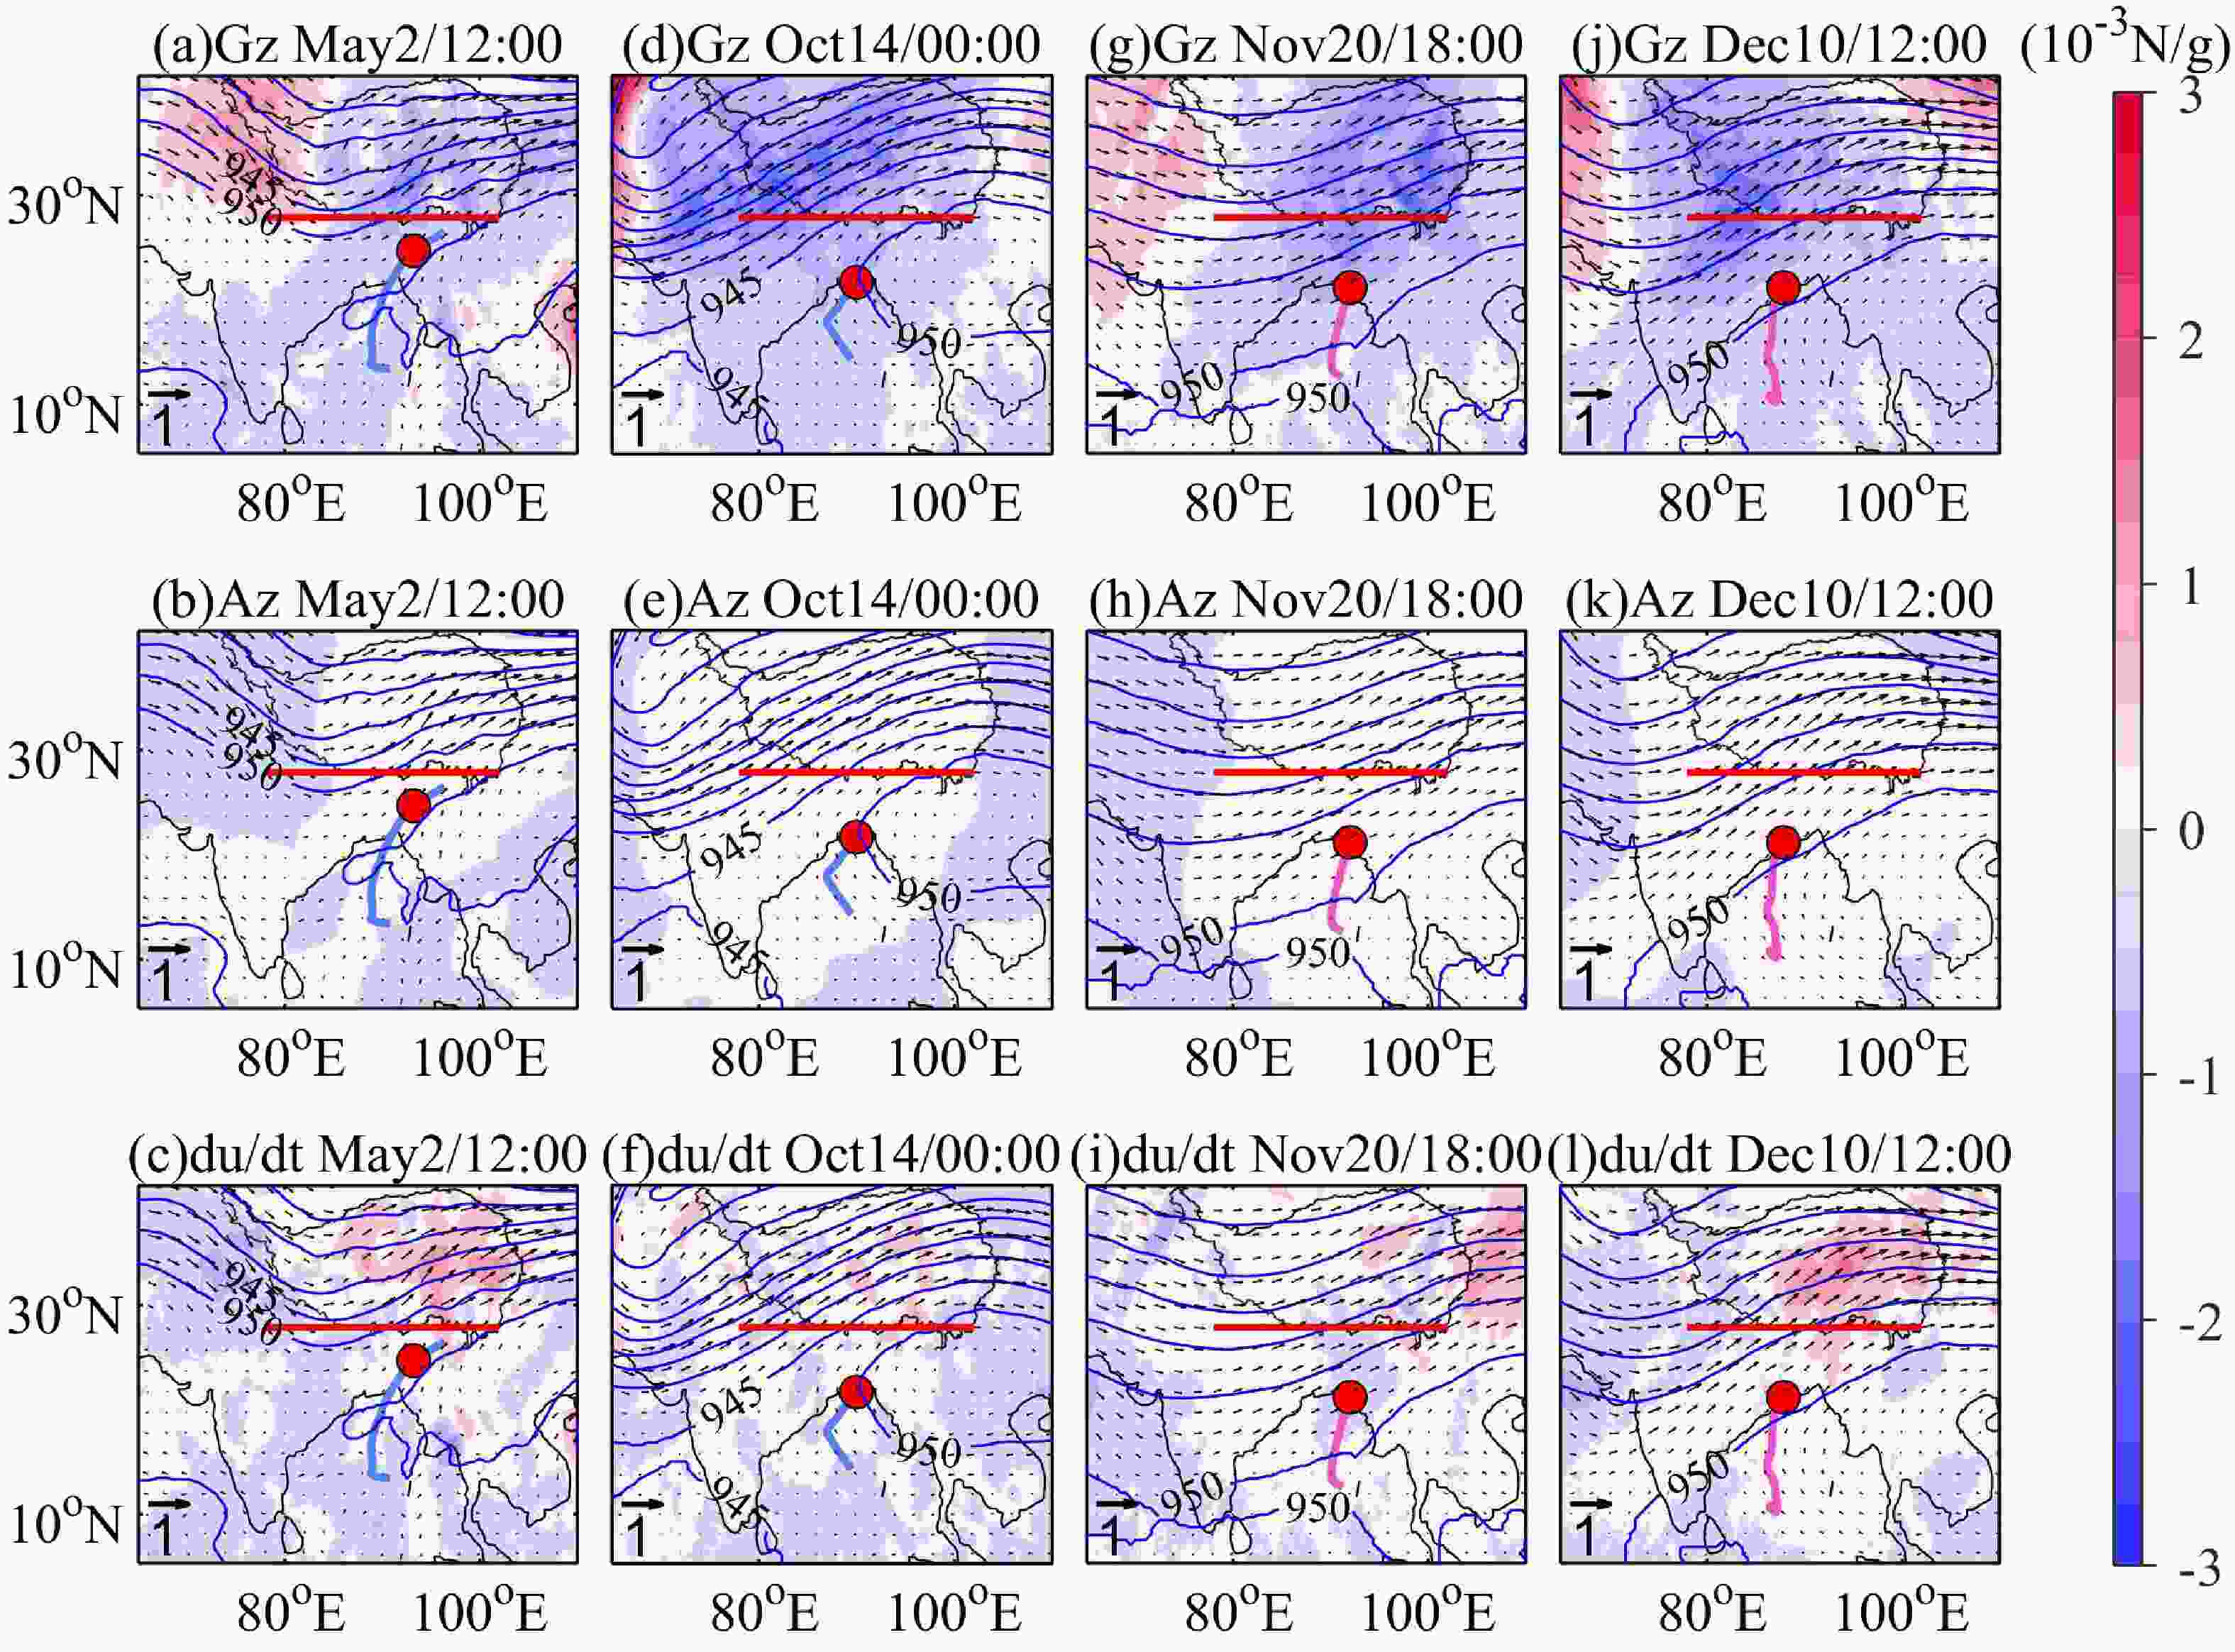
Figure 6. The same as in Fig. 5, but for the zonal component of the (Gz; a, d, g, j) pressure gradient force, (Az: b, e, h, k) Coriolis force, and (du/dt: c, f, i, l) resultant acceleration for Type-T TC cases.
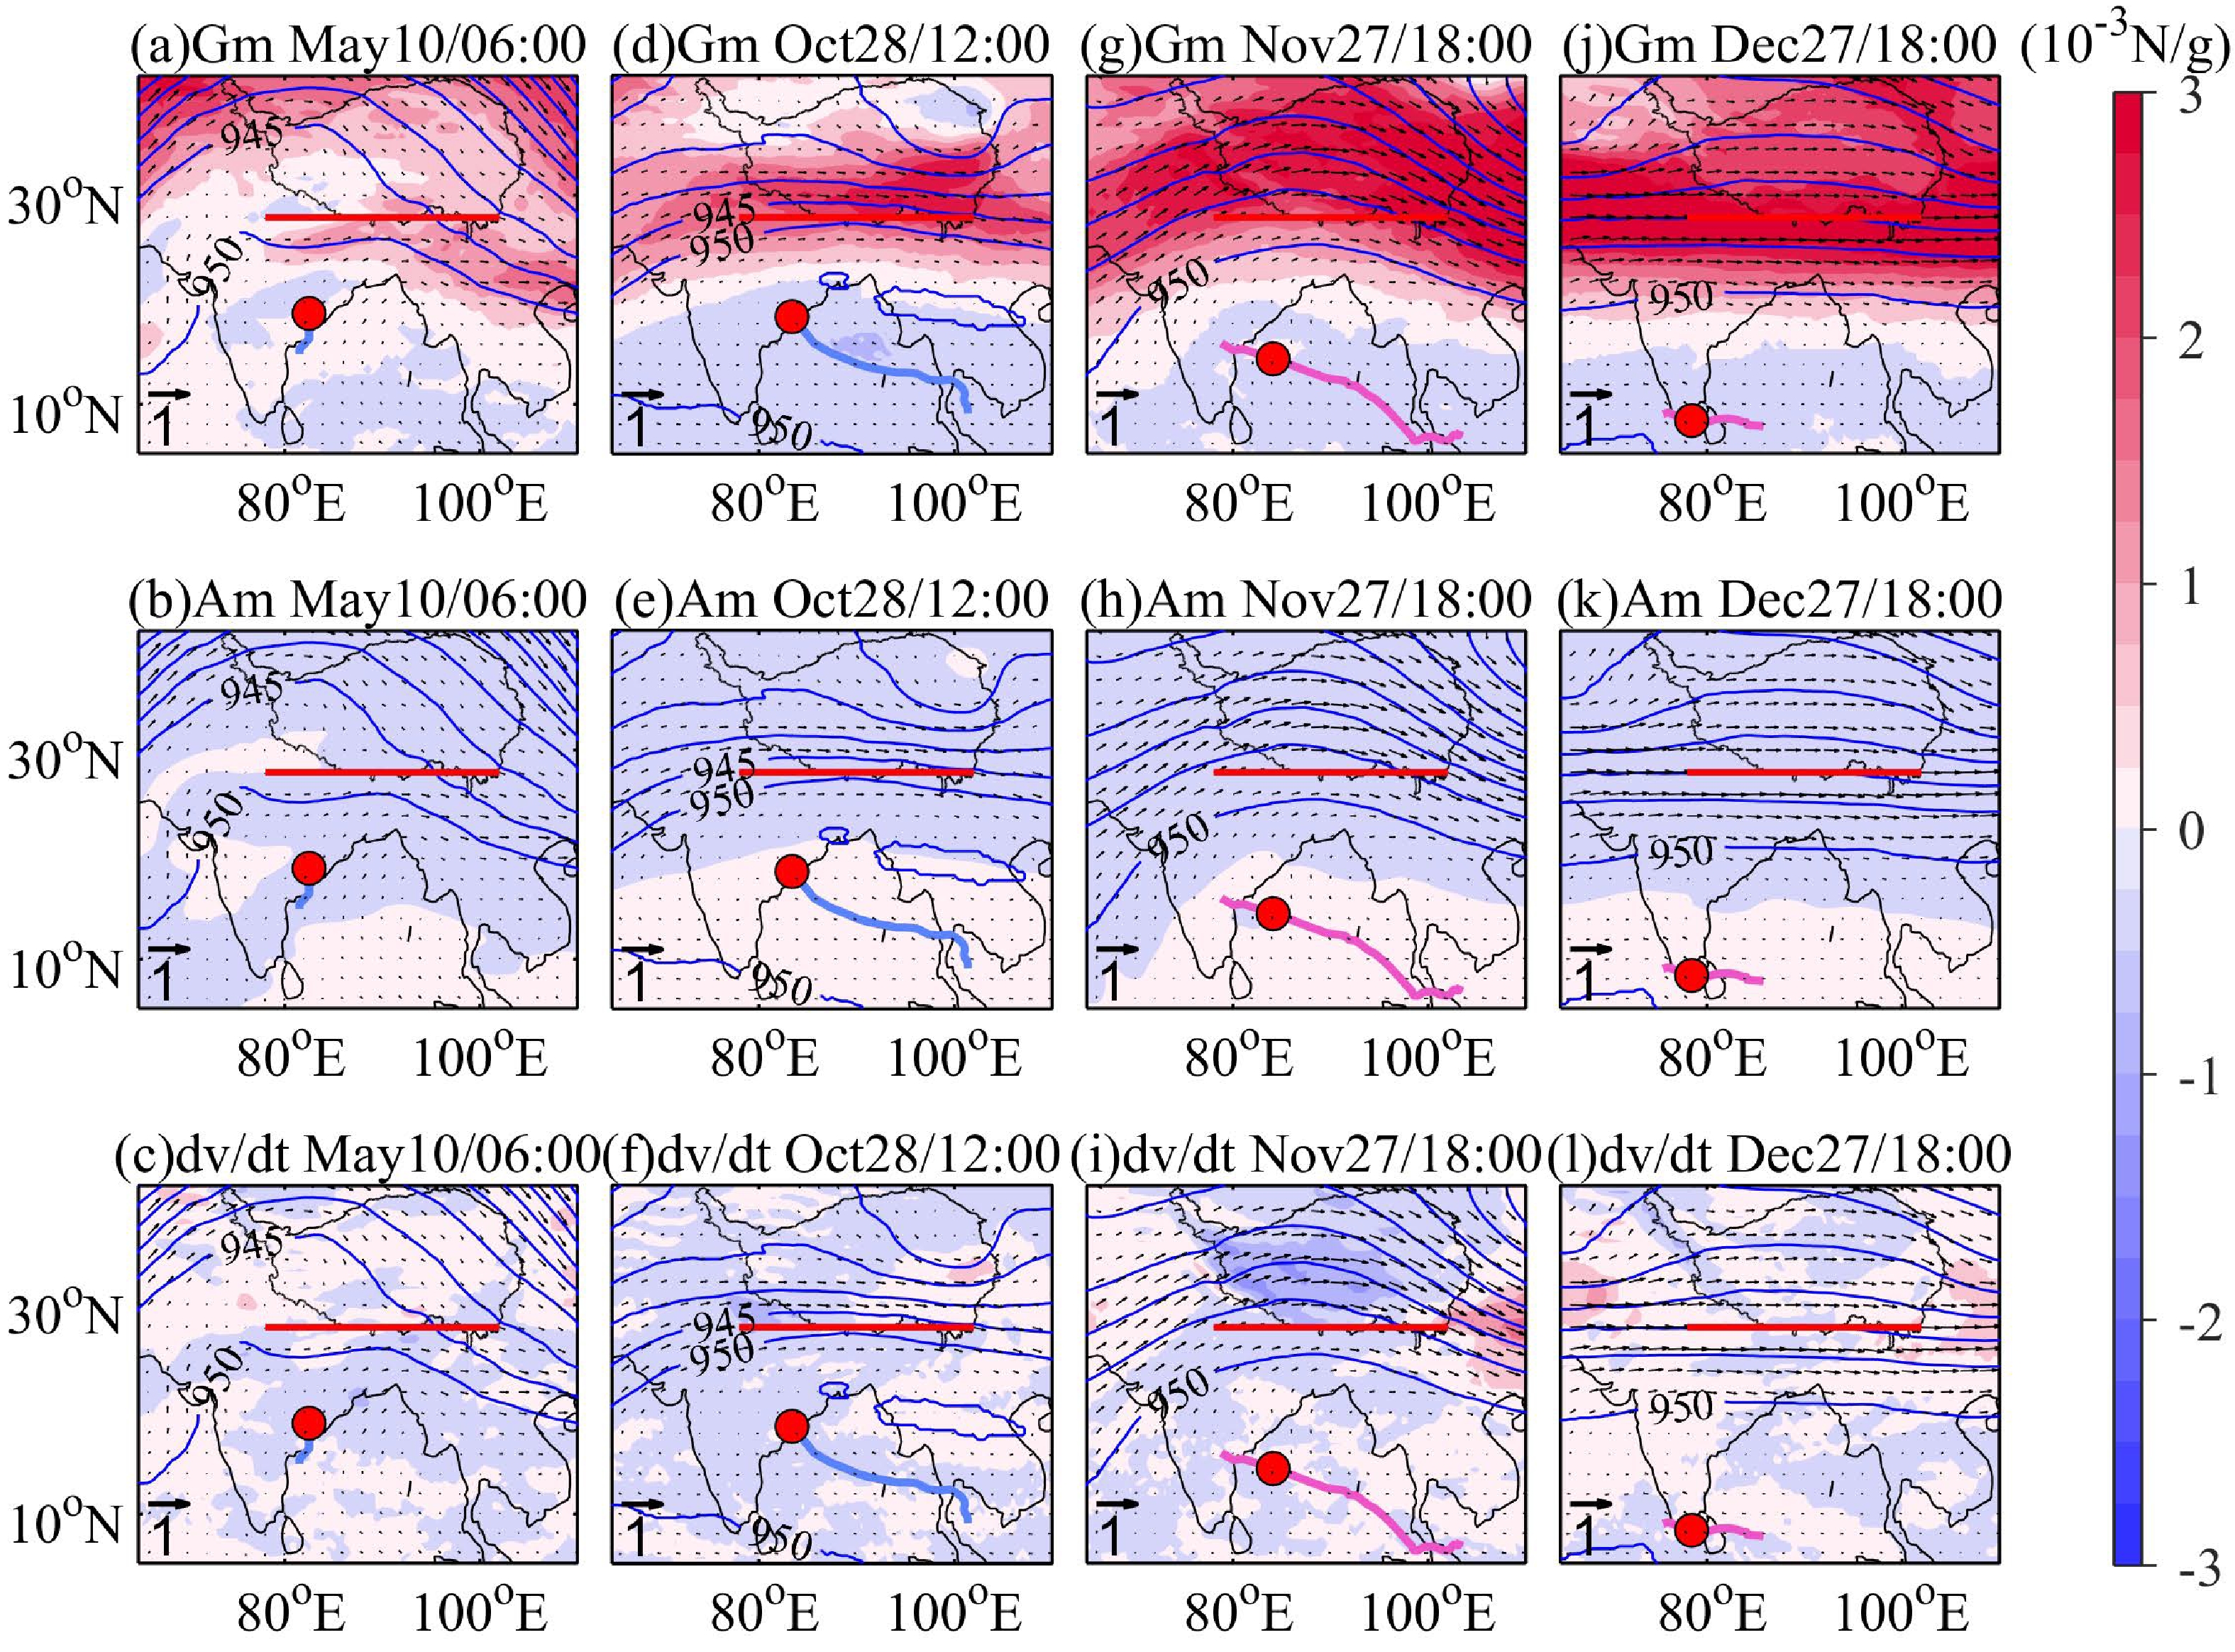
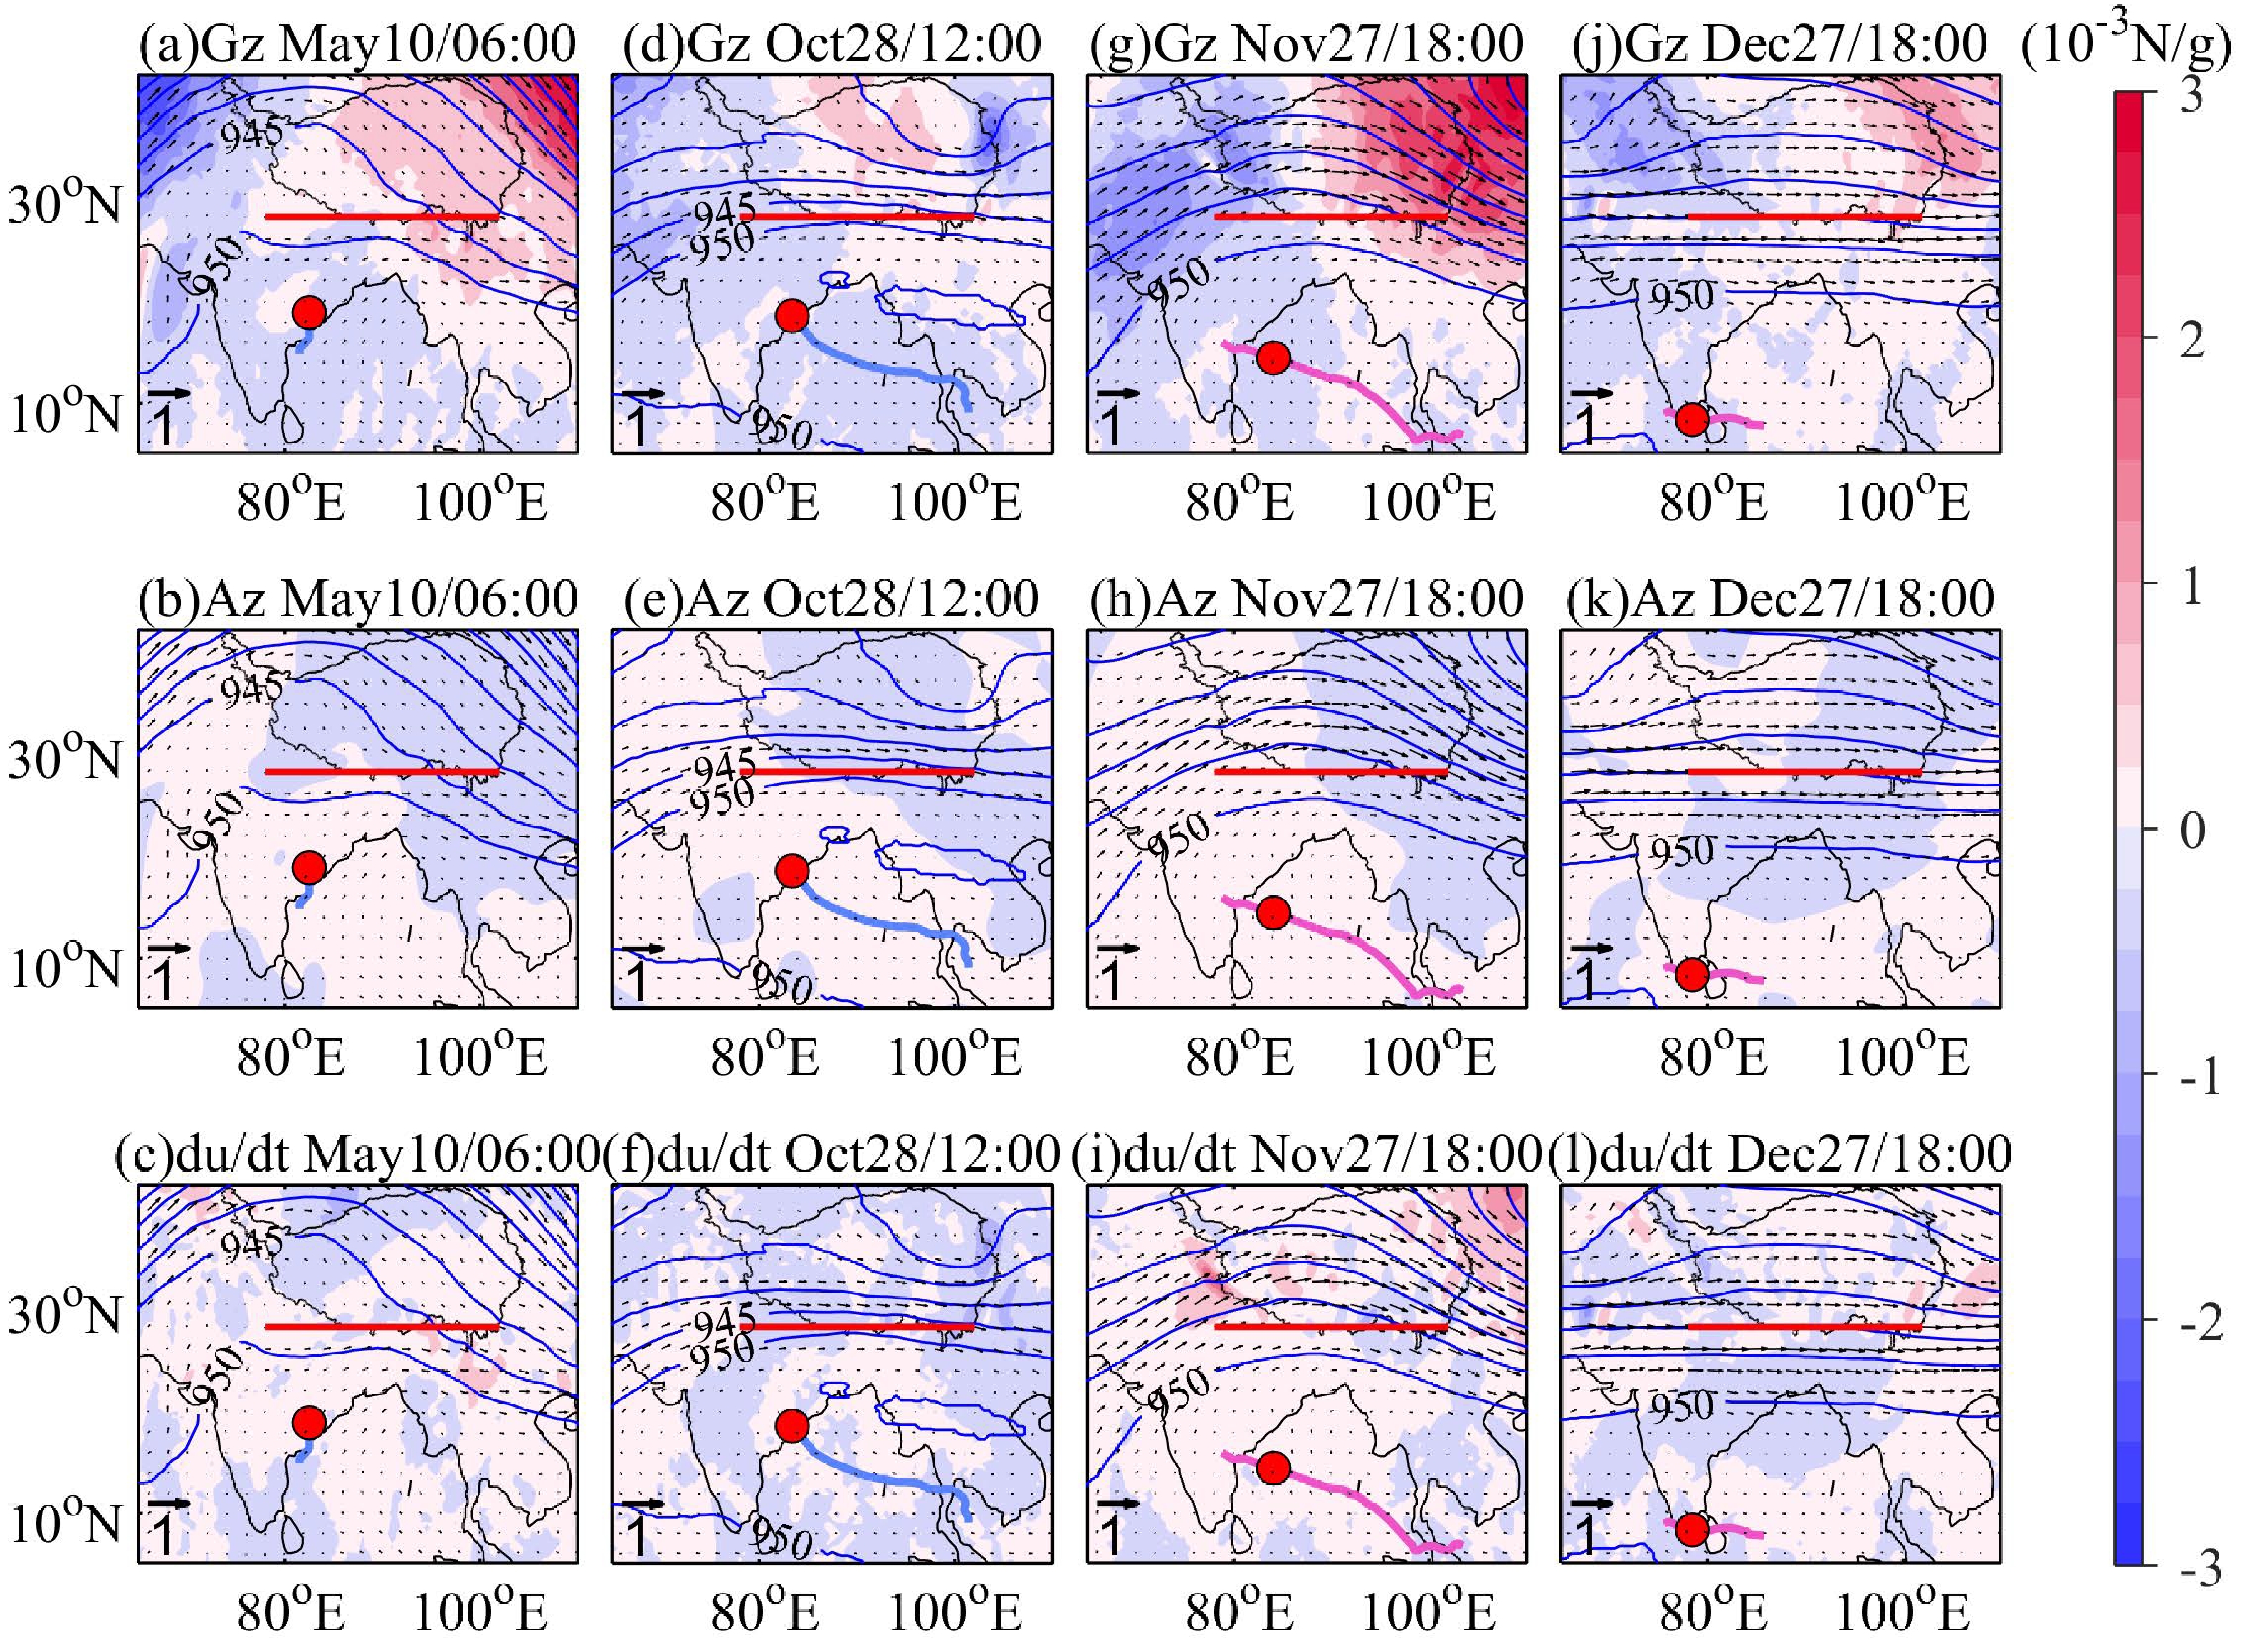
For Type-R TCs (Fig. 7), the distribution of Gm, Am, Gz, and Az is the same as for Type-T TCs (Fig. 5). As the meridional resultant acceleration is negative (Fig. 7) and the zonal resultant acceleration (Fig. 8) is positive near the ridge line; therefore, when the ridge is relatively south, it is difficult for water vapor to be transported northward, and when the ridge is relatively north, the southward resultant acceleration does not necessarily affect the northward transport of water vapor.
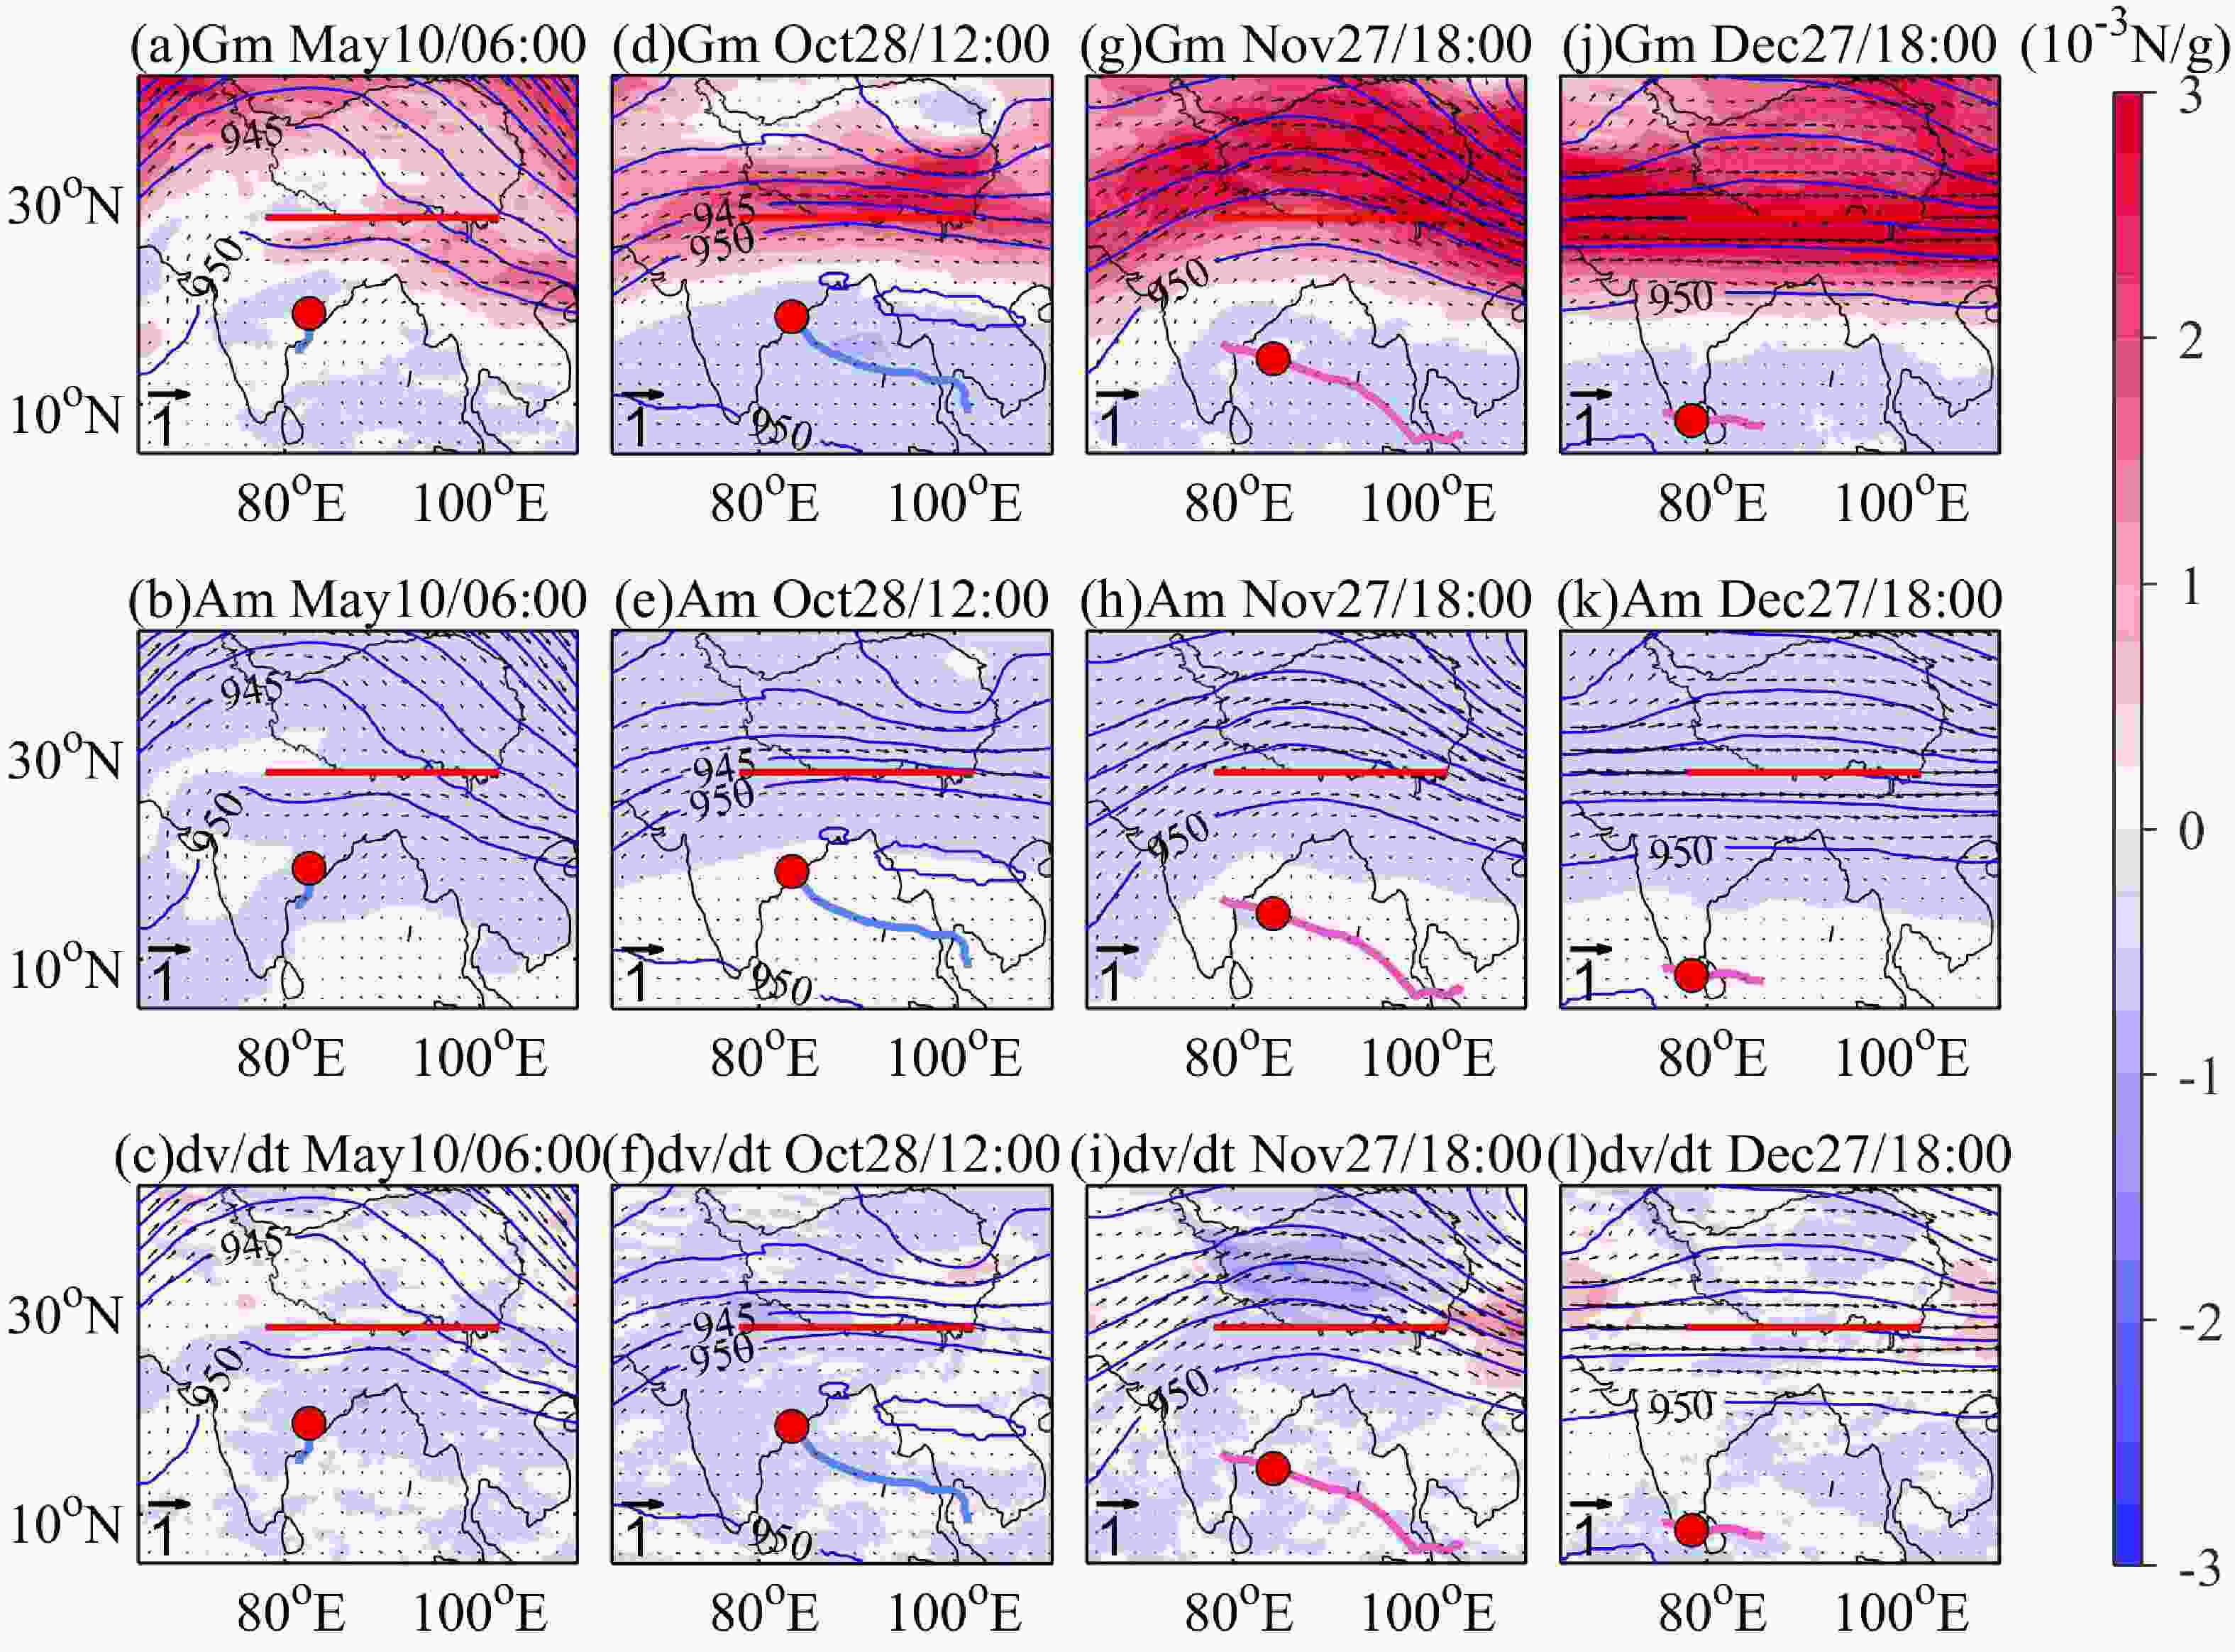
Figure 7. The same as in Fig. 5, but for Type-R TC cases.
Figure 8. The same as in Fig. 6, but for Type-R TC cases.
A schematic diagram illustrates the previous conclusions (Fig. 9). Figures 9a, c, and e show Type-T TCs, and Figs. 9b, d, and f show Type-R TCs. When the westerlies are relatively south (Figs. 9a, b), it is difficult for water vapor to be transported into the TP. The westerlies along the SBTP from November to April belong mostly to this configuration. When the westerlies are relatively north (Figs. 9e, f), especially when they are north of the SBTP, they have little effect on water vapor transport. From June to September, the westerlies, on average, are north of the SBTP and the contribution to the MMBA over the SBTP is independent of the westerlies. When the westerlies are near the SBTP, whether water vapor can be transported into the TP depends on the configuration of the trough and ridge, as detailed in a previous paper (Zhou et al., 2022). The westerlies in May and October are near the SBTP, so when a TC encounters the trough, it is easy for water vapor to be transported into the TP, but the opposite is true when it encounters the ridge. Due to the relatively southern position of the westerlies in November and December, their contribution rate is lower than that in May and October.
Figure 9. Schematic diagram of the effect of the meridional position of the westerlies on the MMBA.
-
This study focuses mainly on the following question: Why is the contribution rate to the MMBA over the SBTP induced by BOB TCs the highest when the TC frequency is relatively low in May?
BOB TCs are characterized by double peaks, with May and October–December constituting the two peak seasons. TC frequency decreases from October to December and is lower in May than in October and November. In May, north-track TCs are the most frequent, and from October to December almost half of the TCs move westward. The MMBA is the largest in May, and from October to December, it decreases month by month. TC intensity and track are not the main factors.
Through previous studies, we know that the westerlies play a decisive role in water vapor transport, so we speculate that the westerlies may be the key factor affecting the seasonal variation of the MMBA over the SBTP. First, it is confirmed that the seasonal change of the westerlies is consistent with that of the MMBA. Then, to confirm the influence of westerlies on the MMBA, we choose 8 TC cases and compare the water vapor flux. For Type-T TCs, when the trough is farther north (south), water vapor can be transported farther north over the TP (water vapor may not necessarily cross the SBTP). For Type-R TCs, when the ridge is south (north), no water vapor can be transported into the TP (water vapor may affect the southern TP). The westerlies in November and December are relatively south, leading to a low contribution rate to the MMBA over the TP in November and December.
To further understand the mechanism, the momentum equation is used. The meridional resultant acceleration is positive (negative) in the area near the trough line (ridge line), and the resultant zonal acceleration is negative (positive) downstream of the trough (ridge). For Type-T TCs, when the trough is relatively south and the water vapor enters the trough from the area near the ridge line, the direction of the resultant meridional (zonal) acceleration is south (east), water vapor will be transported eastward but may not necessarily cross the SBTP. For Type-R TCs, when the ridge is farther south and the water vapor enters the ridge from the area near the ridge line, the direction of the resultant meridional (zonal) acceleration is south (west), which is not conducive to the northward transport of water vapor.
Although BOB TCs can transport water vapor to the TP, whether water vapor transported by BOB TCs is worthy of attention remains questionable? To learn more about this issue, the MMB over the SBTP is classified according to timescale.
The nine components of the MMB over the SBTP during the double-peak TC seasons are shown in Fig. 10a. During the TC activity period, for the MMB over the SBTP, the term
$ (1/g){v'}{q'} $ , which is the result of the synoptic-scale perturbation of v and q. The life cycle of TCs is several days to more than ten days, which qualifies such phenomena a synoptic-scale perturbation. This result shows that the contribution to the MMB over the SBTP caused by BOB TCs is the highest during the TC activity period. It is sufficient to show that in the monsoon transition seasons, the MMB over the SBTP caused by BOB TCs is an important source of water vapor for the TP. With global warming, the frequency of BOB TCs tends to increase (Lakshani and Zhou, 2023), and the influence of water vapor transport by BOB TCs is more noteworthy.
Figure 10. Components of the MMB (g s–1 cm–1) over the SBTP integrated from 500 to 100 hPa for different types of TC tracks during the double-peak TC seasons.
The synoptic-scale disturbance term
$ (1/g){v'}{q'} $ is the highest in May and decreases from October to December (Fig. 10a). North-track TCs in May contribute the most, northwest-track TCs contribute the most in October, and west-track TCs contribute the least (Fig. 10e). Of these three terms [$ (1/g)\overline {vq} $ ,$ (1/g)\overline v {q^ * } $ ,$ (1/g)\overline v {q'} $ ],$ (1/g)\overline v {q'} $ has the largest value; of these three terms [$ (1/g)\overline {vq} $ ,$ (1/g){v^ * }\overline q $ ,$ (1/g){v'}\overline q $ ],$ (1/g){v'}\overline q $ has the largest value in May and December and the values of$ (1/g)\overline {vq} $ and$ (1/g){v'}\overline q $ are equivalent in October and November (Fig. 10a). That means$ \overline v $ and$ {q'} $ contribute the most during the TC activity period. The values of the four terms consisting of$ \overline v $ and$ {q'} $ are further shown in Figs. 10b–e. The north-track TC contribute the most in May, November and December, and the northwest-track TC contribute the most in October.On the whole, the components of the MMB show that the contribution to the synoptic-scale disturbance term is the highest, which means that the MMB over the SBTP associated with BOB TCs is crucial.
| MMBA/TC frequency | ||||
| May | Oct. | Nov. | Dec. | |
| All | 29.76/26 (1.14) |
29.94/52 (0.58) |
18.91/43 (0.44) |
4.86/23 (0.21) |
| North track | 24.01/16 (1.50) |
9.65/14 (0.69) |
13.60/13 (1.05) |
2.54/7 (0.36) |
| West track | − | 3.75/20 (0.19) |
1.51/20 (0.08) |
0.00/11 (0) |
| Northwest track | 2.27/5 (0.45) |
10.35/14 (0.74) |
1.66/6 (0.28) |
2.32/5 (0.46) |
| Northeast track | 3.48/5 (0.70) |
6.19/4 (1.55) |
2.14/4 (0.53) |
− |


 AAS Website
 AAS WeChat