


 DownLoad:


-
The Tibetan Plateau (TP) is located in central Asia, with an area of about 2.5 × 10⁶ km2 and an average elevation of more than 4000 m, which is the highest plateau in the world. Located in the north of the South Asian summer monsoon region and the west of the East Asian summer monsoon region (Webster et al., 1998), the TP is influenced by the large-scale circulation of the summer monsoon and the mid-latitude westerly (Schiemann et al., 2009; Maussion et al., 2014; Yang et al., 2014; You et al., 2015; Kuang and Jiao, 2016). The complex interaction between the westerly and summer monsoon is one of the important reasons for the spatial and temporal differences of precipitation and moisture transport over the TP (Guo and Zhu, 2022; Li et al., 2022).
Known as the “World Water Tower”, the TP contains a large amount of water resources (Xu et al., 2014) and is the source of many major Asian rivers, such as the Yellow River, Yangtze River, and Yarlung Zangbo River (YZR). The TP and low-latitude marine monsoon regions constitute the “large triangular sector” of moisture transport, indicating that the TP plays an important role in the global water cycle (Xu et al., 2019). There have been many studies on the summer atmospheric water cycle over the TP. For instance, Wang et al. (2009) found that atmospheric water vapor enters the TP in summer mainly through three moisture channels: the westerly, the Indian Ocean (IO)–Bay of Bengal (BOB), and the South China Sea (SCS)–BOB. Chen et al. (2012) found that a narrow moisture band along the southern IO to the Arabian Sea to the TP is the most important moisture transport channel. Chen et al. (2019b) quantified that the proportion of moisture contribution of the tropical IO to the southern TP (STP) in summer is 28.5% ± 3.6%. The source and transport of moisture over the TP in summer are also closely related to the large-scale circulation. Xu et al. (2014) believed that the summer monsoon plays a key role in transporting moisture from the tropical oceans to the TP. Liu et al. (2016) thought that the cyclonic circulation over the BOB and the subtropical high pressure are conducive to the transport of moisture from low latitudes to the TP. Chen et al. (2019a) pointed out that the sub-seasonal movement of the Indian summer monsoon moderates the importance of different moisture sources affecting the STP.
The TP has an abundant moisture content, and its spatial distribution is highly heterogenous. The moisture increases from northwest to southeast at 500–700 hPa, and from north to south at 500–300 hPa, in summer (Zhang et al., 2013). Abundant moisture also provides active convective clouds and precipitation, and the frequency of convective clouds over the TP is more than 60% (Fu et al., 2006). Precipitation mainly occurs in summer (June–August) (Wang et al., 2018), and its intensity and frequency gradually decrease from southeast to northwest (Fu et al., 2020), with convective precipitation accounting for 76% (Li et al., 2008). In addition, the cloud-precipitation process also significantly affects the summer heat source structure over the TP by releasing latent heat (Fu et al., 2006; Chen et al., 2015, 2017; Wang et al., 2015), and is significantly affected by the summer monsoon rains (Chen et al., 1985) and cloud types (Chen et al., 2015) in different regions of the TP (Ueda et al., 2003).
The TP covers a vast area, and there are huge differences between the northern and southern TP (NTP and STP). Unlike the NTP, which is controlled by the westerly, the STP is an area where the westerly and summer monsoon interact. Different circulation structures cause different moisture sources in the NTP and STP (Zhang et al., 2019). In addition, there are many meridional canyons in the STP, including the YZR Grand Canyon, serving as moisture channels, thus becoming an important area for moisture to enter the TP from South Asia (Wang et al., 2017), which has a significant impact on the TP and even its downstream areas. It is difficult for the moisture entering into the STP to advance northward, making the TP become an asymmetric wet island (Xu et al., 2019). The STP has more convective activity (Li et al., 2008), stronger precipitation intensity, and more summer monsoon precipitation than the NTP (Shi, 2002). The latent heat from condensation related to the cloud-precipitation process also plays a more important role in the formation of the heat source in the STP (Chen et al., 2015; Wu et al., 2017). It can be seen that the STP is a key region providing moisture for the TP water tower, and has more active energy and moisture budgets. Therefore, the study of the atmospheric water cycle in the STP plays a very important role in understanding the TP’s weather and climate.
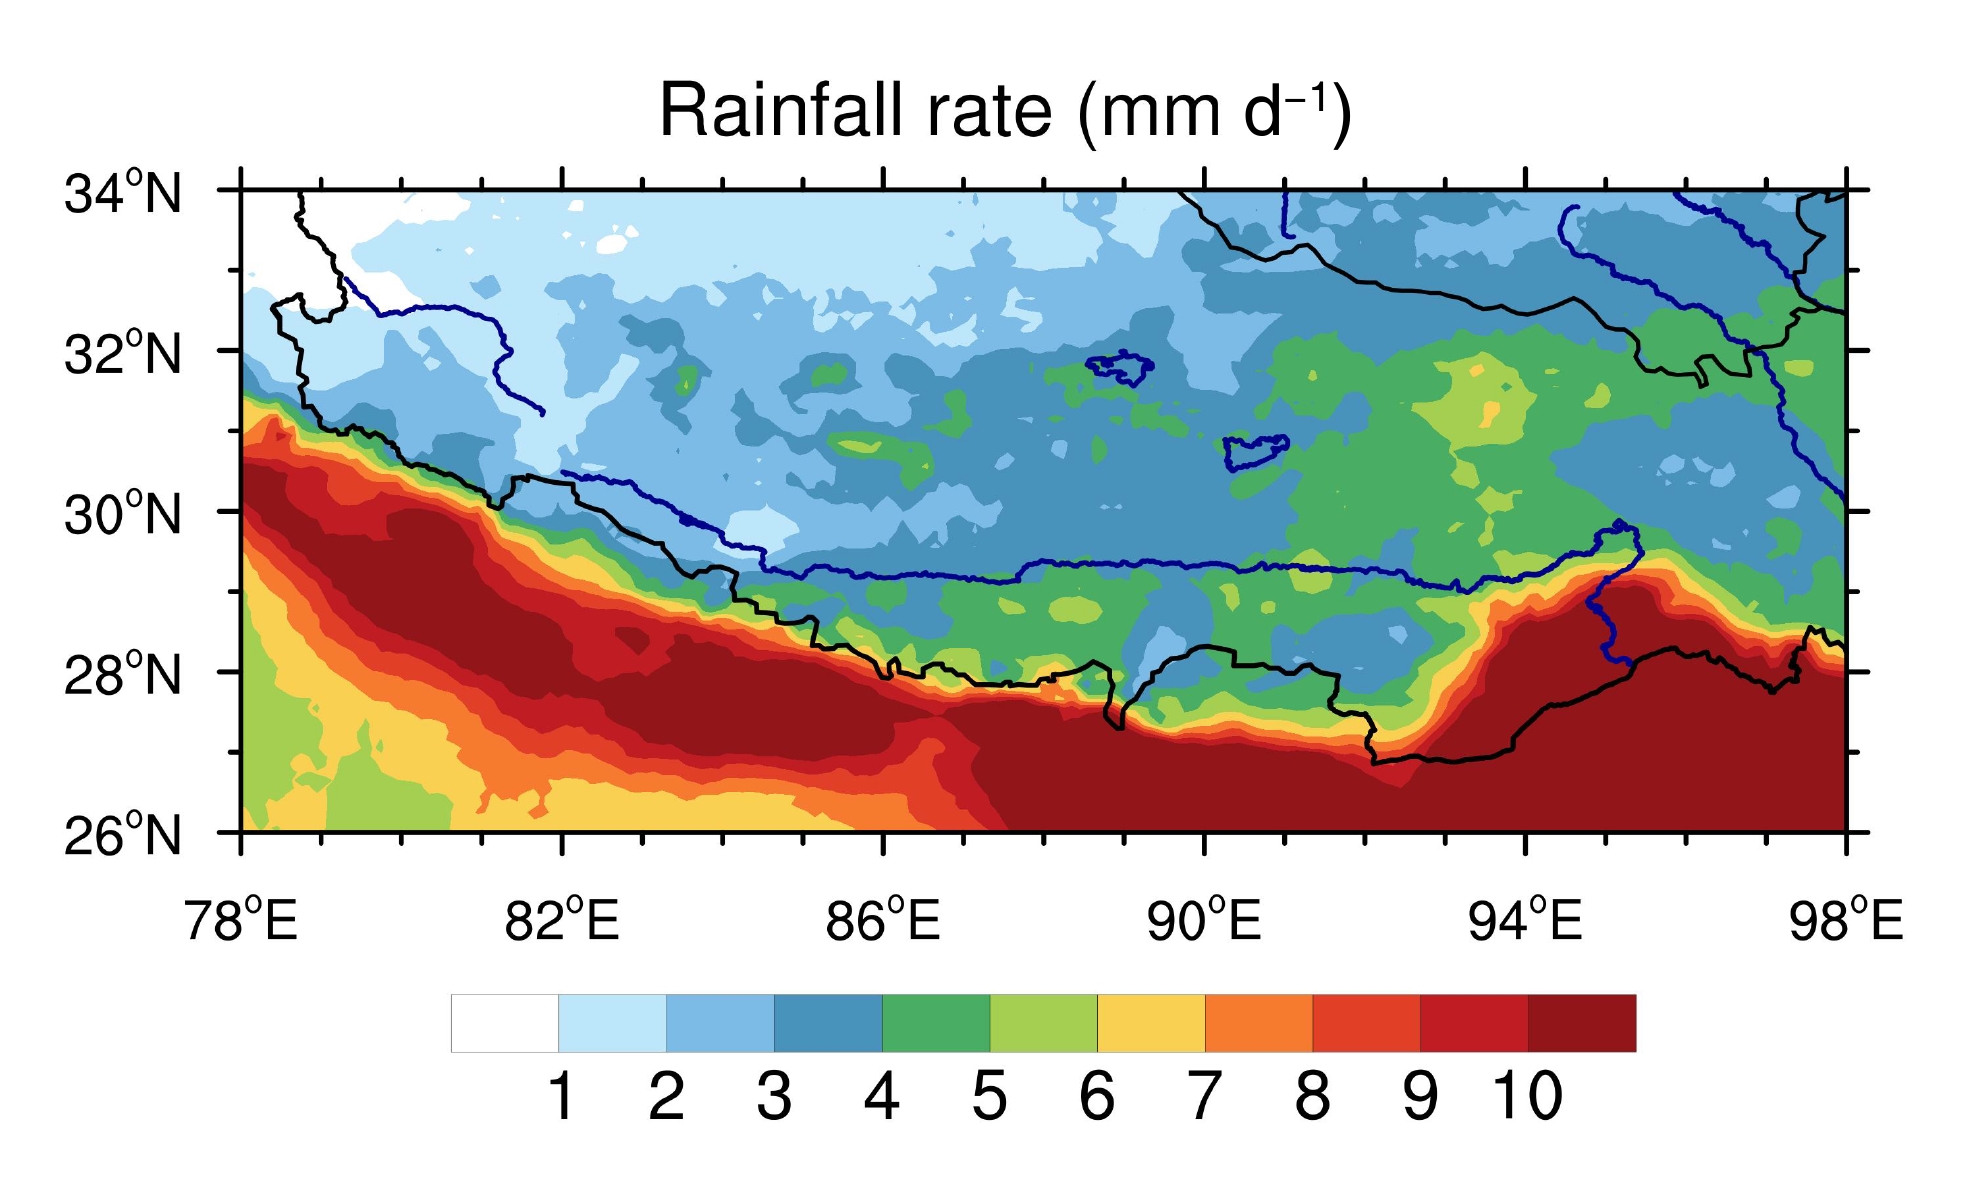
The YZR traverses the STP from west to east, providing about 47% of the water resources on the TP with less than 10% of the area (Xu et al., 2020). As part of the IO water system (Liu et al., 2014; Wu et al., 2020), the YZR carries warm and humid air from the IO into the TP, providing moisture conditions for more than 50% of the TP’s precipitation (Xu et al., 2020). The YZR basin (YZRB) is one of the regions of the TP with the most vigorous convective activities (Li et al., 2008), and the frequency of convective clouds can reach more than 90% (Fu et al., 2006). The average annual precipitation of the YZRB is 300–500 mm, and the precipitation is concentrated in summer and often occurs at night. There is an obvious spatial variation (Fig. 1), with the annual precipitation increasing from the upstream to downstream region (Wu et al., 2020; Zhang et al., 2022b). At the same time, the YZRB is also the economic and cultural center of Tibet, with the highest population density on the TP (Liu et al., 2014).
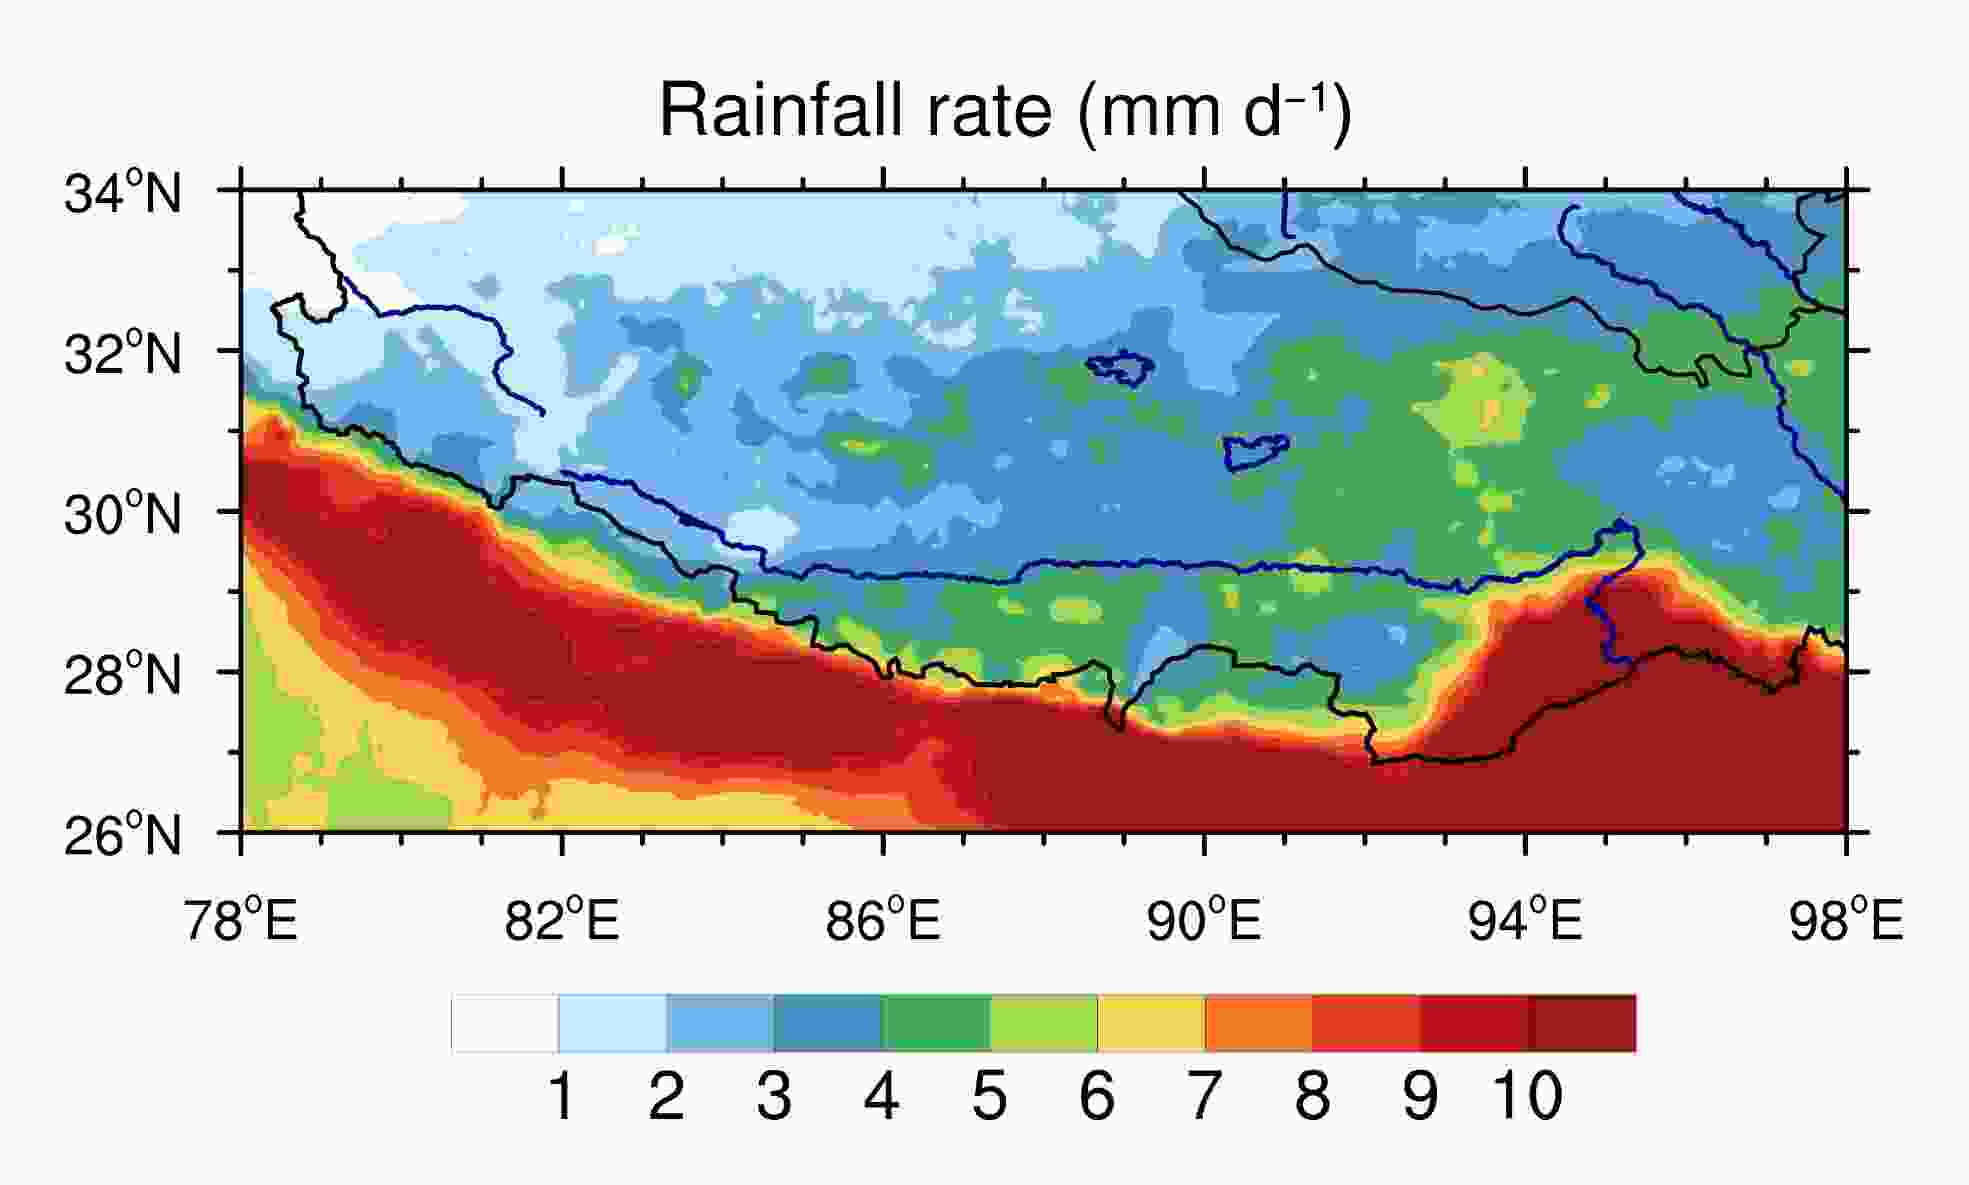
Figure 1. Spatial distribution of average summer precipitation (units: mm d−1) over the YZRB (blue line) and its surrounding areas during 2014–18 based on GPM satellite data.
However, the vertical structure of the atmospheric water cycle in the YZRB has been less well studied. In addition, reanalysis data and model simulations are commonly used in relevant studies. In this study, we establish a dynamically and thermodynamically consistent atmospheric forcing dataset that is completely dependent on observation, with high vertical resolution. Focusing on the upstream, midstream, and downstream regions of the YZRB, we carefully explore the atmospheric water cycle under the transition influence of the westerly and summer monsoon from an observational perspective. Furthermore, the moisture transport structures in the meridional, zonal, and vertical directions are discussed. The vertical structures of moisture consumption in each analysis region are compared.
The paper is organized as follows: section 2 introduces the methods and data, including the analysis domains; section 3 describes the atmospheric water cycle in the YZRB under the transition influence of the westerly and monsoon; section 4 analyzes the moisture sources; section 5 gives the diabatic heating and moisture consumption; and finally, section 6 provides a summary and outlook.
-
This study uses the constrained variational analysis (CVA) method proposed by Zhang and Lin (1997) to process the multi-source measurements in the YZRB. The method is used to process atmospheric soundings of wind, temperature, and humidity obtained from a small number of stations. Constrained by surface precipitation, surface latent and sensible heat fluxes, as well as radiative fluxes at the surface and the top of the atmosphere (TOA), the atmospheric state variables are adjusted with the minimum possible amount to conserve column-integrated mass, static energy, momentum, and moisture. Finally, the dynamically and thermodynamically consistent atmospheric analysis dataset is obtained (Zhang and Lin, 1997).
Different from the traditional objective analysis method that only considers mass conservation, the CVA method satisfies the conservation requirements of mass, moisture, heat, and momentum, and obtains a series of diagnostic variables such as vertical velocity, advective tendencies, apparent heat source, and apparent moisture sink. Unlike the accuracy of reanalysis data, which is greatly affected by the deficiencies of the numerical model and assimilation method, the results of the CVA method depend on observation and can make up for the discontinuity and errors of actual measurements. Sensitivity tests show that the accuracy of analysis data products is mostly affected by the domain-averaged precipitation (Zhang et al., 2001). Its uncertainty mainly affects the magnitude of the analyzed field rather than its vertical structure (Xie et al., 2014). The CVA method has been widely used in many atmospheric field campaigns, such as Atmospheric Radiation Measurement (ARM), Tropical Rainfall Measuring Mission (TRMM), the Tropical Warm Pool-International Cloud Experiment (TWP-ICE), Midlatitude Continental Convective Clouds Experiment (MC3E), and the Third Tibetan Plateau Atmospheric Scientific Experiment (TIPEX-III), and has shown obvious advantages in the analysis of the cloud-precipitation and convection process, as well as moisture and heat budgets (Schumacher et al., 2007; Xie et al., 2010, 2014; Tang et al., 2016; Pang et al., 2019; Zhang et al., 2021a, b, 2022a). Zhang et al. (2021a) applied the CVA method to the TP (Nagqu), and sensitivity testing showed that the CVA model established on the TP has high stability (Wang et al., 2022).
-
The YZRB is the most important river basin in the STP, is long but narrow (Liu et al., 2014), and its elevation can drop from 7258 m to 132 m (Xu et al., 2020), showing significant differences in the upstream, midstream, and downstream regions. The upstream region is cold, windy, and arid, with annual average precipitation of less than 300 mm, and is mainly covered by alpine meadows. The midstream region is the most important farming area on the TP, with an average annual precipitation of 300–600 mm. The downstream region is the YZR Grand Canyon, which is the main moisture channel of the TP, guiding a large amount of marine moisture into the southeastern TP and producing annual average precipitation of more than 2000 mm (Liu et al., 2019; Wu et al., 2020).
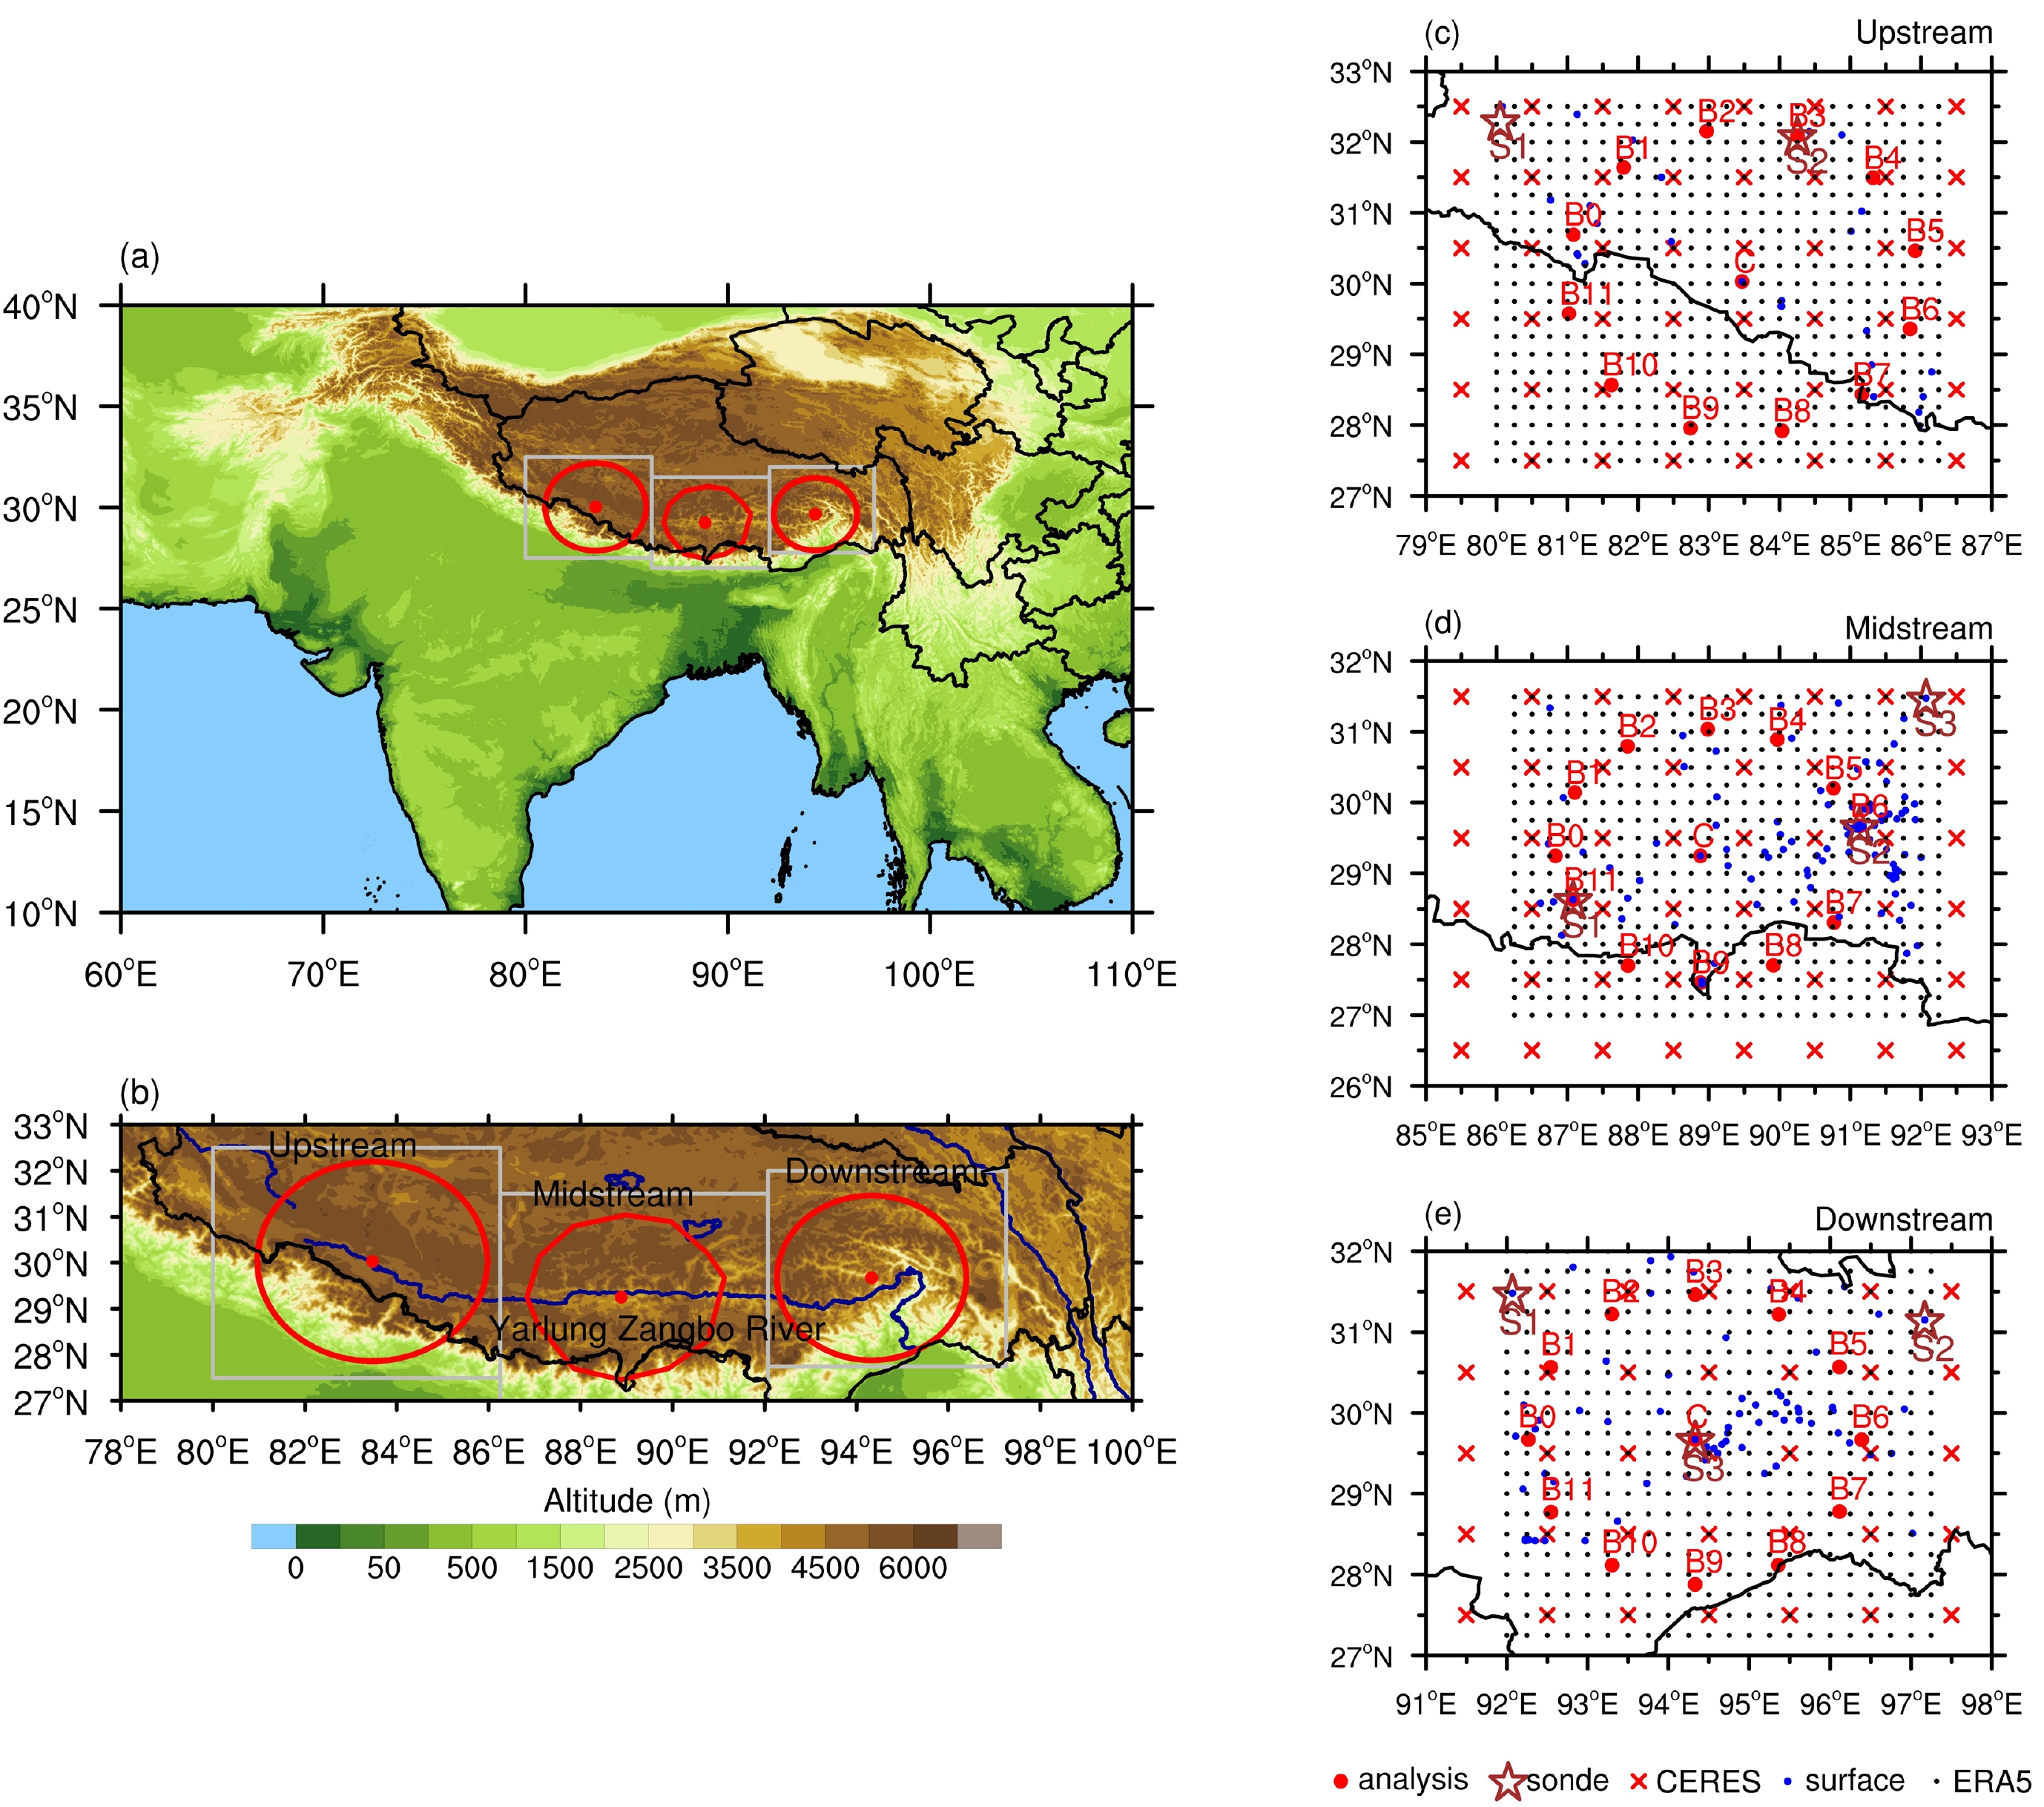
To compare and analyze the regional differences of the YZRB, physically consistent atmospheric analysis models are constructed in the upstream, midstream, and downstream regions of the YZRB. The central points of the analysis domains are sounding stations or surface stations near the YZR. To make full use of sounding measurements, the analysis points that form the boundary of the air columns should be made to coincide with the sounding stations as much as possible, so the variables on the analysis points are closer to the actual observation (Wang et al., 2022). Due to the limited number of actual sounding stations in the analysis domain, some artificial analysis points are added to form an approximately circular boundary of the air column, which is conducive to maintaining the uniformity of the flux calculation. For the radius of the analysis domains in the YZRB, it is necessary to make full use of the station observations, and to refer to the distance between the central points and the sounding stations forming the analysis points, while ensuring that the areas of these three analysis domains are similar. After comprehensive consideration, the radius of the air columns is determined to be approximately 200 km. Eventually, the analysis domains in the YZRB are determined (Fig. 2). The upstream, midstream, and downstream regions are respectively centered at surface station 55447 (30.03°N, 83.47°E), surface station 55578 (29.25°N, 88.88°E), and Nyingchi sounding station (29.67°N, 94.33°E). There are two sounding stations (Gerze and Shiquan River) and 26 surface stations in the upstream region, three sounding stations (Tingri, Lhasa, and Nagqu) and 104 surface stations in the midstream region, and three sounding stations (Nyingchi, Nagqu, and Qamdo) and 68 surface stations in the downstream region (Figs. 2c–e).
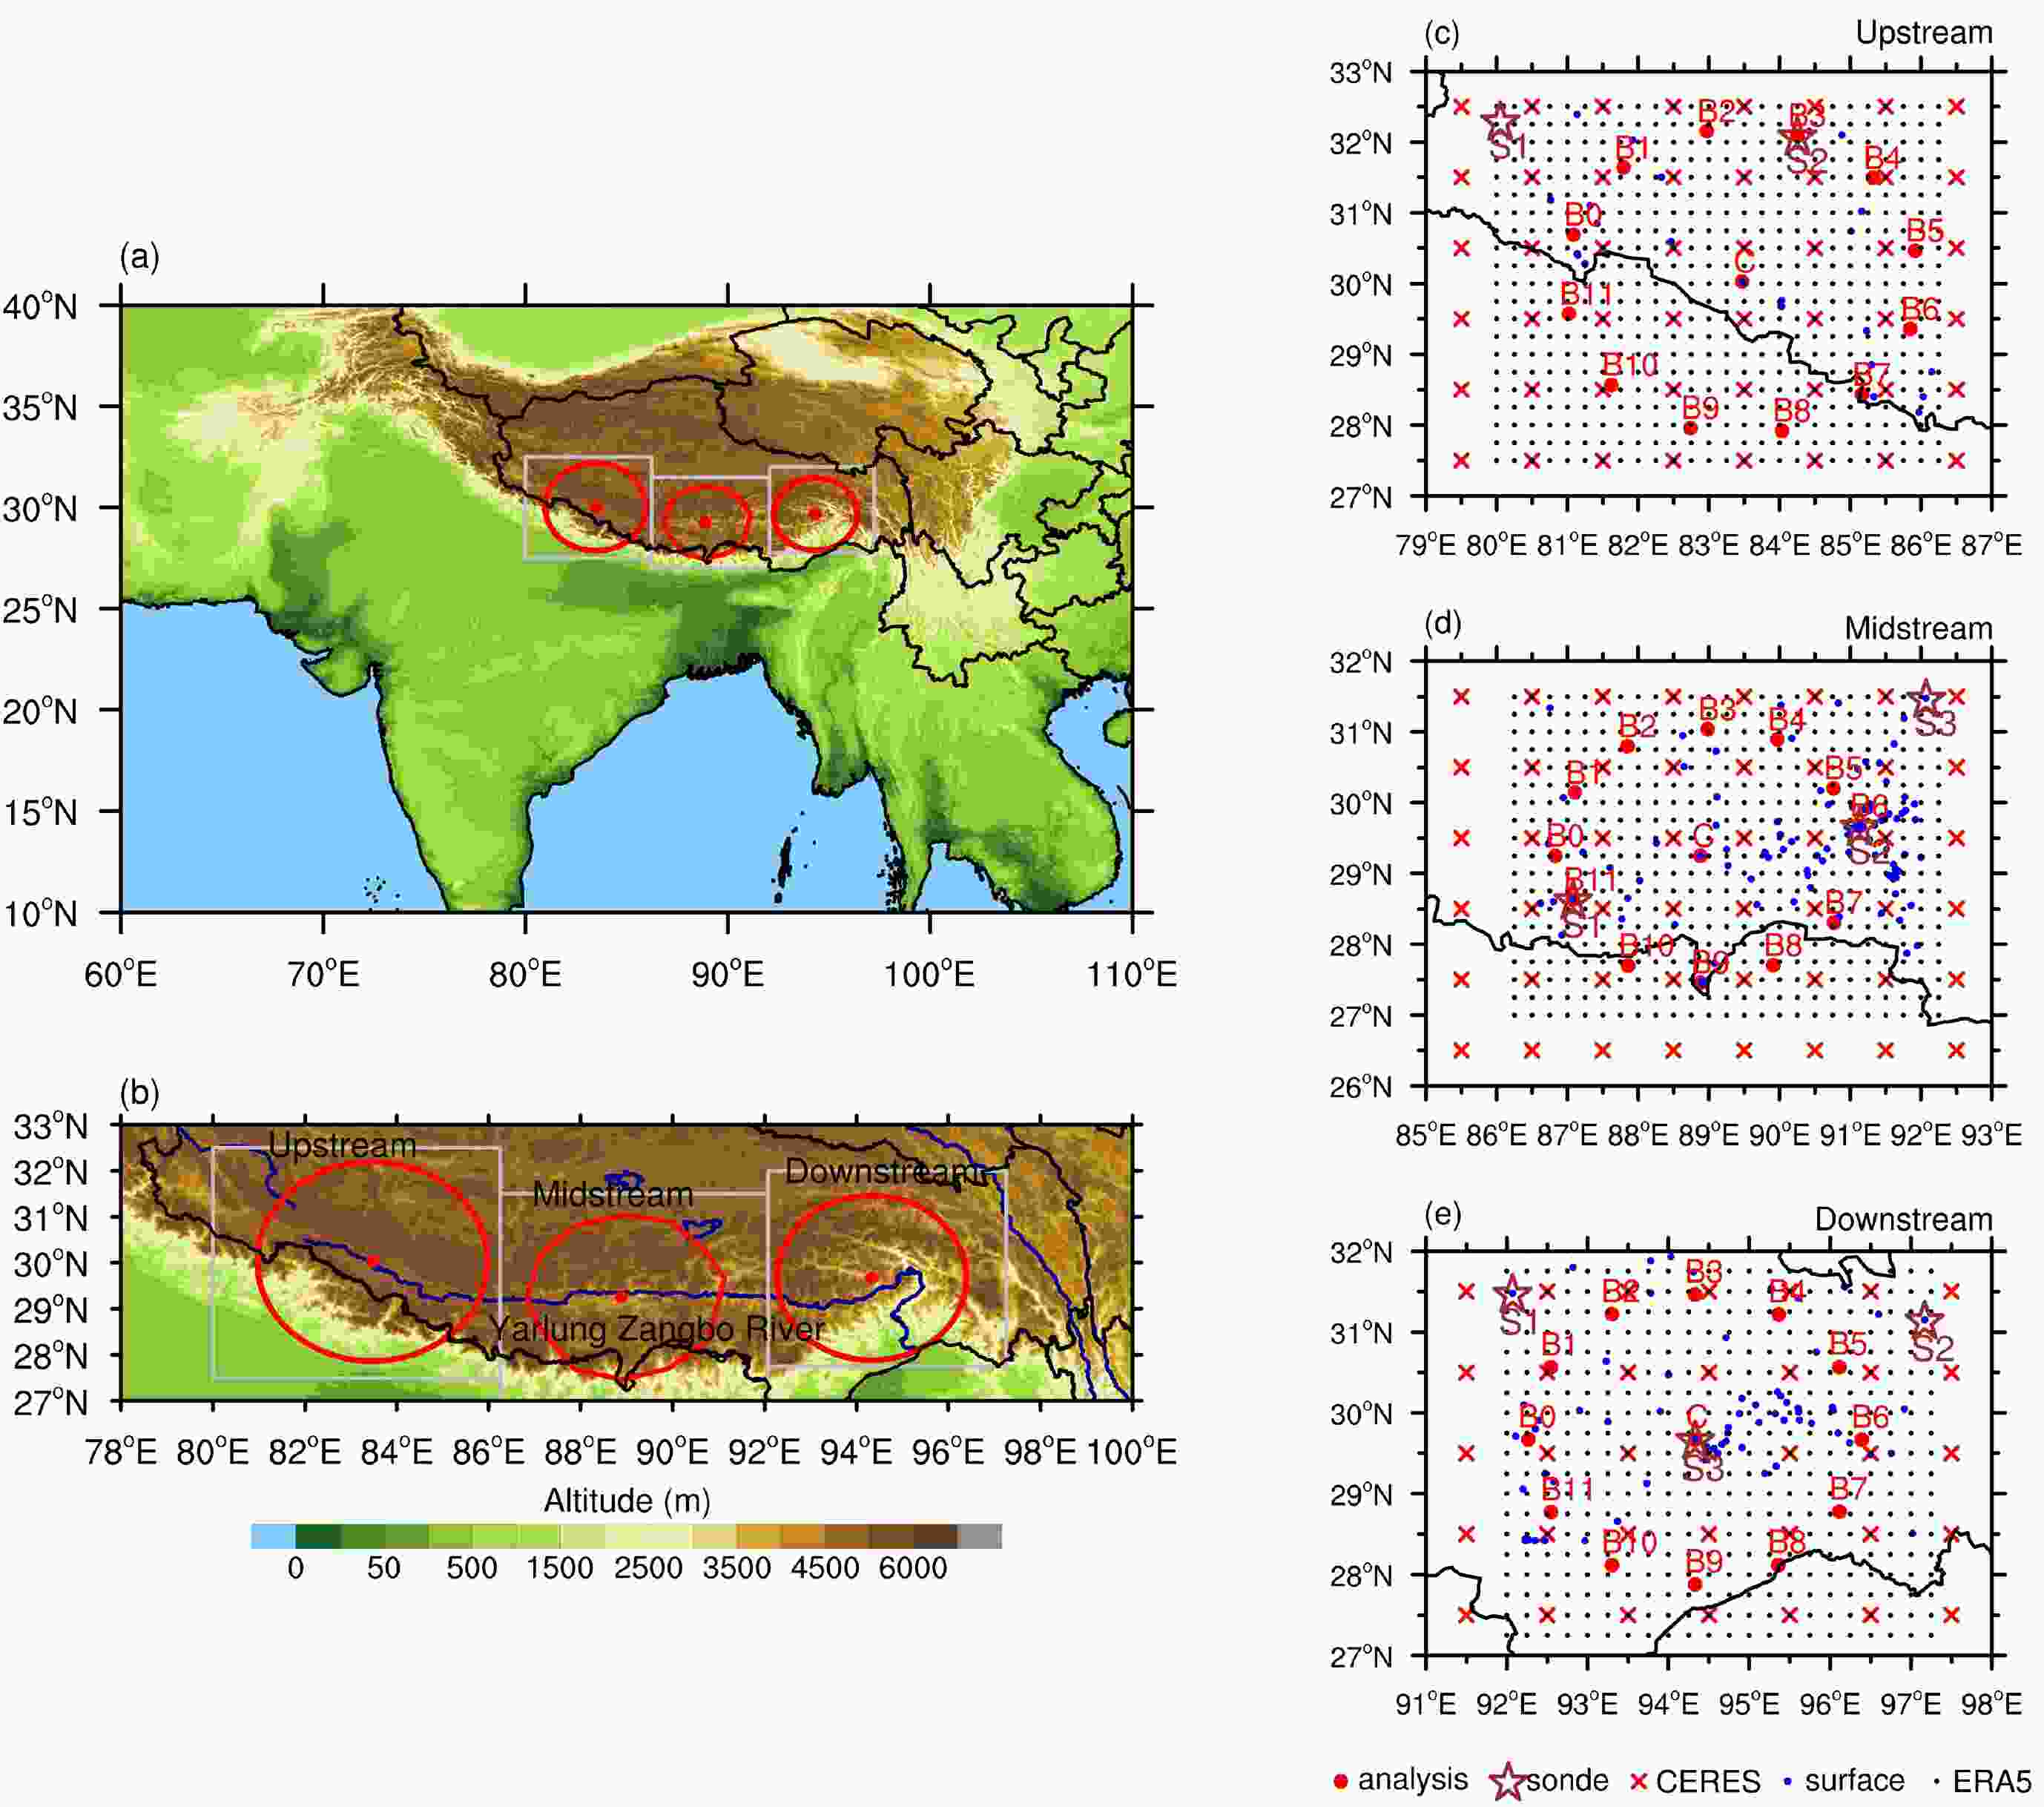
Figure 2. (a, b) Locations of the upstream, midstream, and downstream regions in the YZRB. The red circles represent the analysis domains, the gray rectangles are the practical input data domains for CVA, the blue line represents the YZR, and black stars represent the sounding stations. (c–e) Data distributions in the (c) upstream, (d) midstream, and (e) downstream regions of the YZRB. The red dots represent the analysis domain (B0–B11); the brown stars represent the sounding stations (S1–S4); the blue dots represent the surface stations; the red crosses represent the CERES grid points of the Terra-Aqua satellite; and the black dots represent the background field formed by ERA5.
The analysis model can input multi-source measurements, such as routine measurements from surface and balloon sounding stations, remote sensing from satellite retrievals, and intensive-observation-period measurements in TP field campaigns. The state variables are the upper-level pressure, wind, temperature, and relative humidity provided by the sounding stations, with a temporal resolution of 12 h. The constrained variables include hourly precipitation, pressure, wind, temperature, and relative humidity provided by surface automatic meteorological stations, as well as radiation fluxes at the surface and the TOA and liquid water content provided by the Terra-Aqua satellite CERES, with a temporal resolution of 1 h and a spatial resolution of 1° × 1°. Due to the lack of long-term surface heat flux measurements, surface latent heat and sensible heat fluxes are replaced by ERA5 reanalysis data. Wang et al. (2022) showed that the replacement of surface heat fluxes has little impact on the analysis model. The upper-level wind, temperature, and relative humidity provided by ERA5 are used as the background field with a temporal resolution of 1 h and a spatial resolution of 0.25° × 0.25°. Data distributions are shown in Figs. 2c–e.
This paper focuses on the atmospheric water cycle as well as the moisture source and consumption over the YZRB in summer. Therefore, June to August, when moisture is the most abundant and precipitation is the most concentrated, is chosen as the research period. To make the data representative, the summer atmospheric analysis data from 2014 to 2018 are constructed. The general characteristics of summer precipitation and atmospheric structure over the YZRB are shown through the five-year average. The CVA-produced analysis data are domain-averaged and one-dimensional, with a temporal resolution of 1 h and a vertical resolution of 25 hPa, including single and multi-layer variables, such as the boundary data obtained according to actual observation (surface precipitation, pressure, temperature, wind, radiation flux from the surface and TOA), as well as the upper-level variables adjusted based on the sounding measurements (such as temperature, humidity, and wind). The analysis model can also generate a series of important variables that cannot be directly observed, such as vertical velocity, divergence, temperature/moisture advection, apparent heat source, and apparent moisture sink. The analysis data can provide reliable data (Zhang et al., 2001; Xie et al., 2014; Wang et al., 2022) that are based on observations and are physically consistent for understanding the atmospheric dynamic and thermal structure, as well as exploring the atmospheric water cycle process in the YZRB. The data without explaining the source below are from the analysis dataset.
-
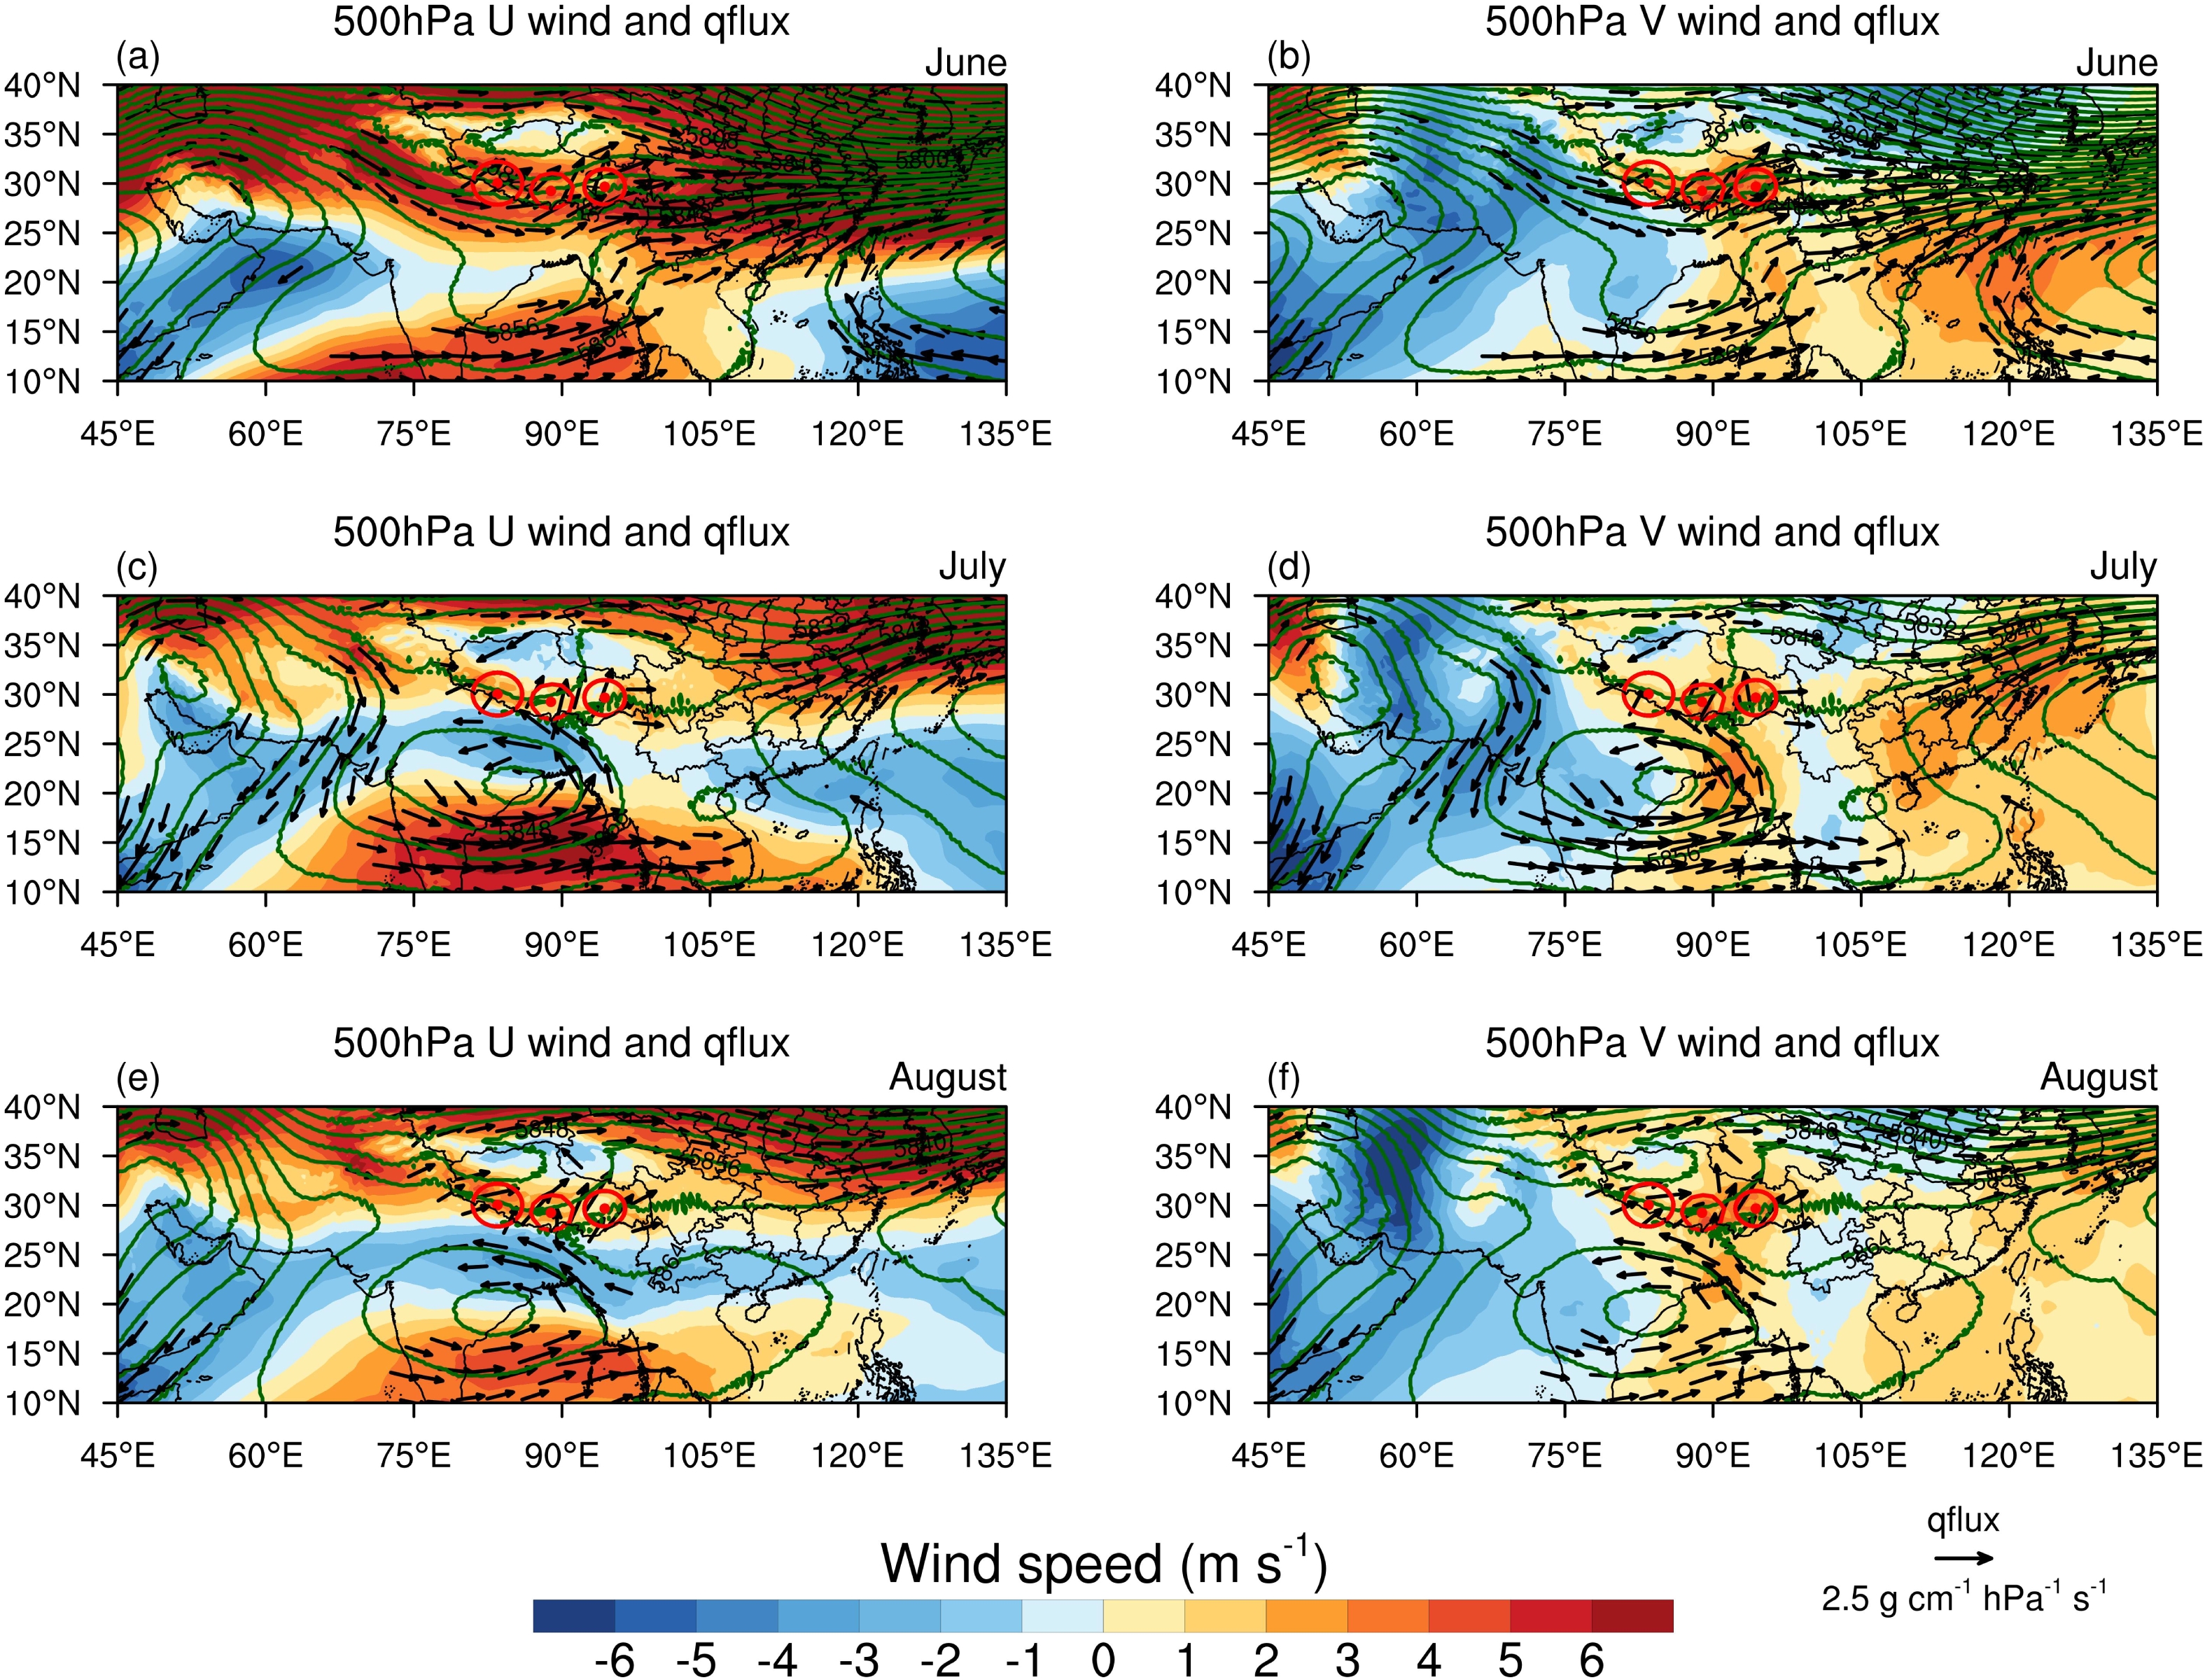
The YZRB is under the influence of the westerly and summer monsoon from June to August. Figure 3 shows the large-scale westerly–monsoon circulation background covering the TP and its surrounding areas. In June, the YZRB is mainly affected by the westerly, which enters the YZRB from the southwestern TP, and its influence on the upstream, midstream, and downstream regions of the YZRB is weakened in turn (Fig. 3a). On the contrary, a trough over the Indian Peninsula–BOB has a weak effect on the YZRB. The southwest summer monsoon airflow coming from the BOB has a stronger influence on the downstream region of the YZRB (Fig. 3b). In July, the westerly weakens significantly, and its affected area withdraws westward to the upstream region of the YZRB (Fig. 3c). The Indian trough further develops into a low-pressure center and the summer monsoon intensifies dramatically. The maximum southerly wind speed area advances westward to the north of the BOB, guiding the summer monsoon northward from the BOB, significantly affecting the midstream and downstream regions of the YZRB, while the upstream region can still receive the westerly in addition to the relatively weak summer monsoon (Fig. 3d). In August, the westerly is relatively stronger than in July (Fig. 3e), while the low-pressure center is weaker (Fig. 3f). In addition, the transverse trough over the SCS deepens and moves northward, guiding the southeasterly from the SCS to affect the YZRB (Fig. 3f).
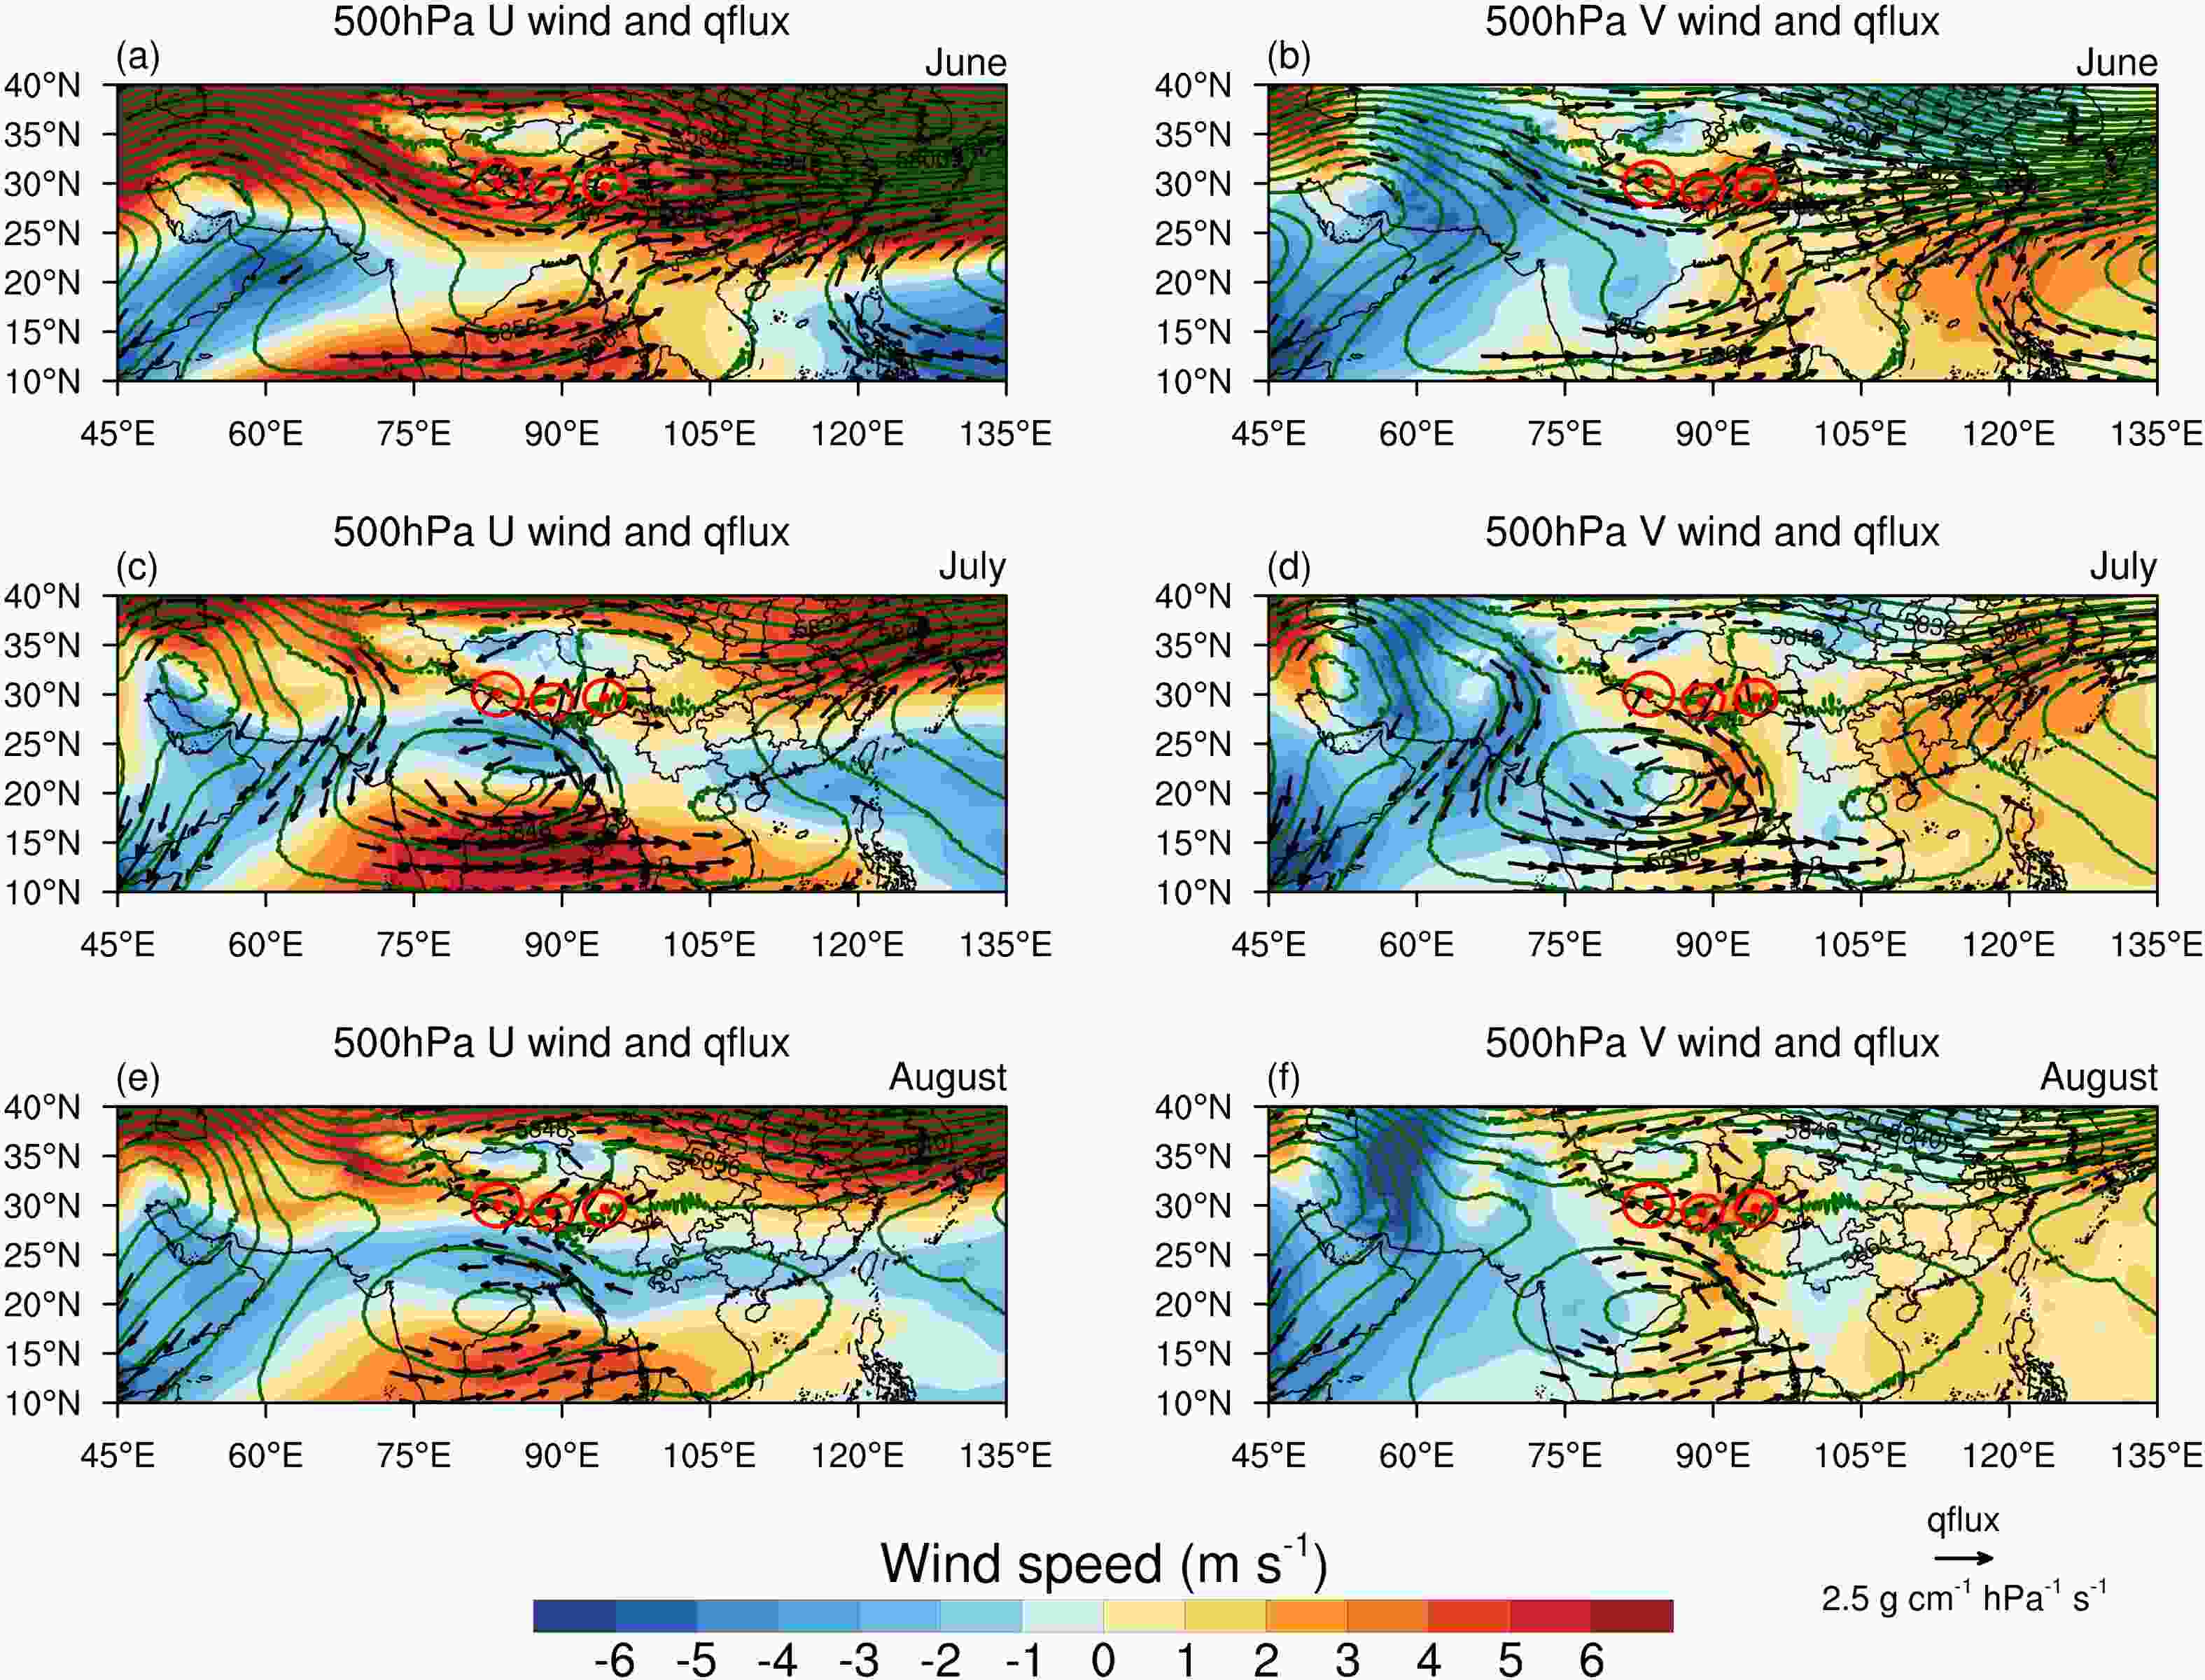
Figure 3. The winds (shaded; units: m s−1), moisture flux (vectors; > 1.2 g cm−1 hPa−1 s−1), and geopotential (dark green contours; units: gpm) distribution at 500 hPa in (a, b) June, (c, d) July, and (e, f) August, provided by ERA5 reanalysis data. Panels (a, c, e) are for U wind, while (b, d, f) are for V wind.
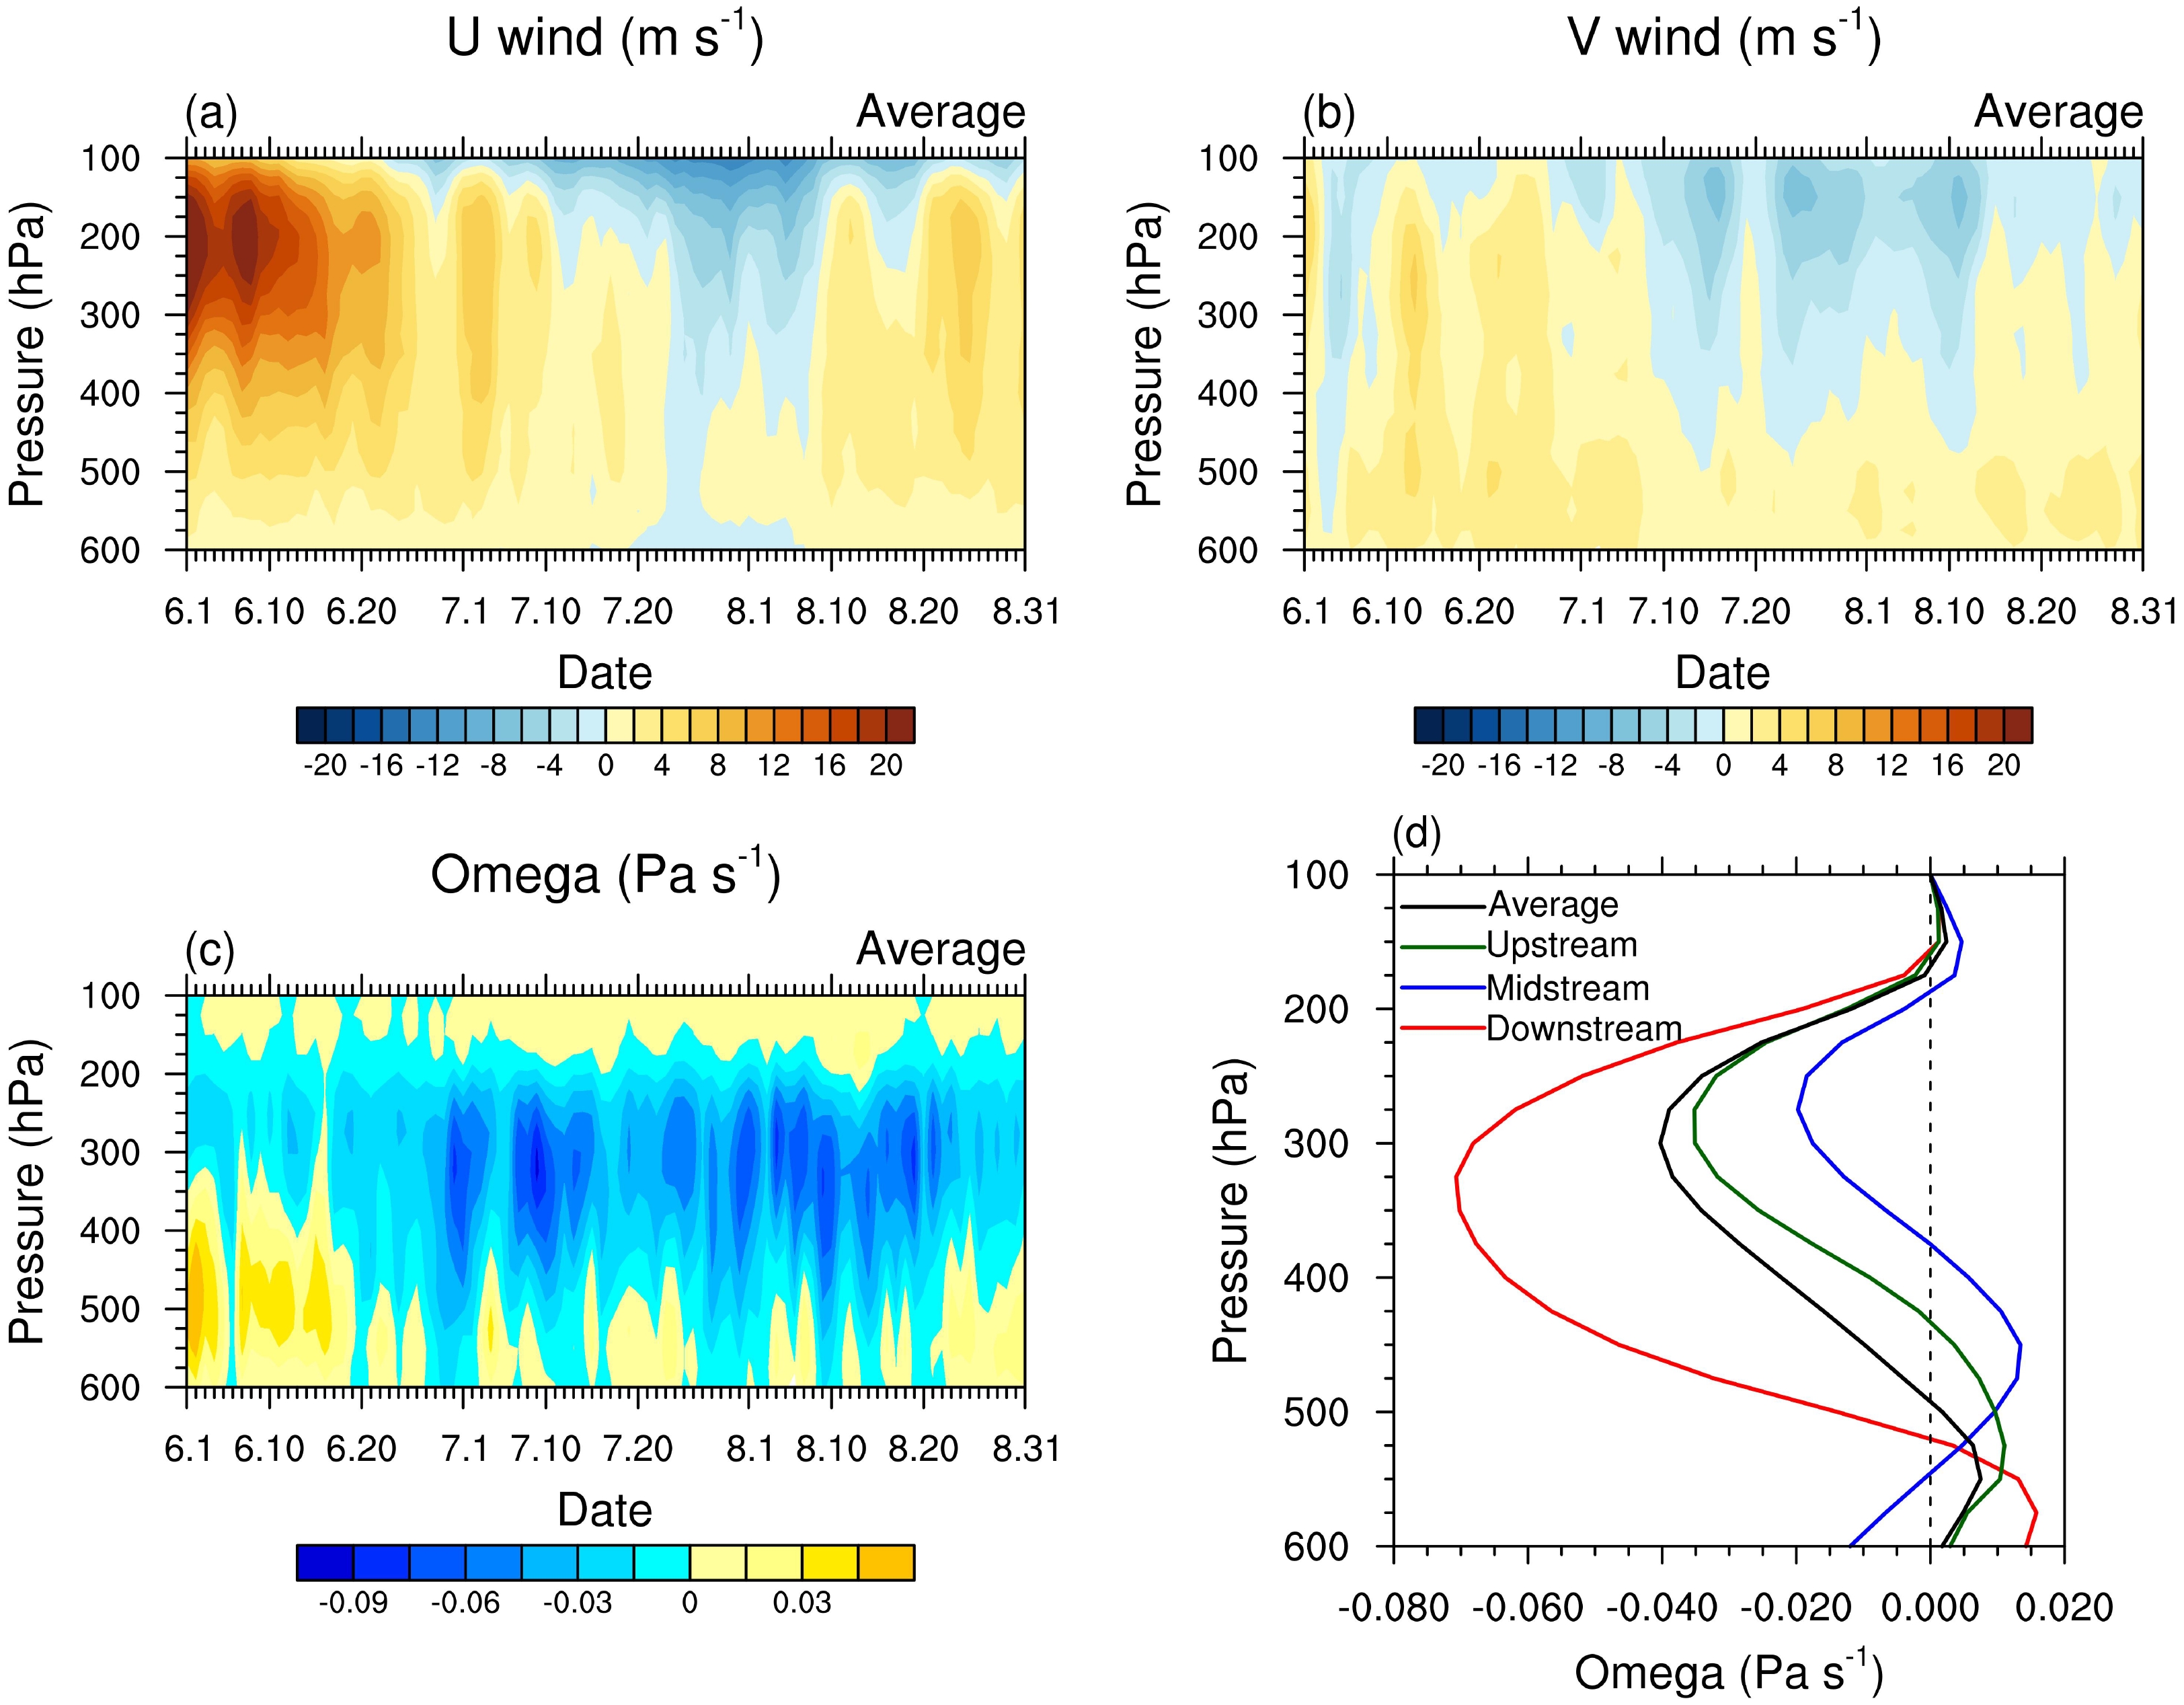
Figure 4 shows the time–pressure cross-sections of the horizontal wind field and vertical velocity in the YZRB against the background of the large-scale westerly and summer monsoon circulations. The upper troposphere is dominated by a westerly jet in June, whose maximum is located at 200 hPa in early June (Fig. 4a). The vertical motion is weak in June, with 400 hPa as the boundary, upward above and downward below (Fig. 4c). Under the influence of the summer monsoon from July to August, the lower troposphere maintains southwest winds (Figs. 4a and b). V wind changes to a continuous structure with a southerly in the lower troposphere and northerly in the mid-to-upper troposphere (Fig. 4b). U wind is still dominated by the westerly, except for a broad vertical range of easterly wind from late July to early August (Fig. 4a). At this time, the vertical motion intensifies, and the upward motion appears almost throughout the troposphere, with a peak at 300 hPa (Figs. 4c and d). Among these three regions of the YZRB, the upward motion maximum is strongest and lowest in the downstream region, while it is weakest and highest in the midstream region (Fig. 4d).
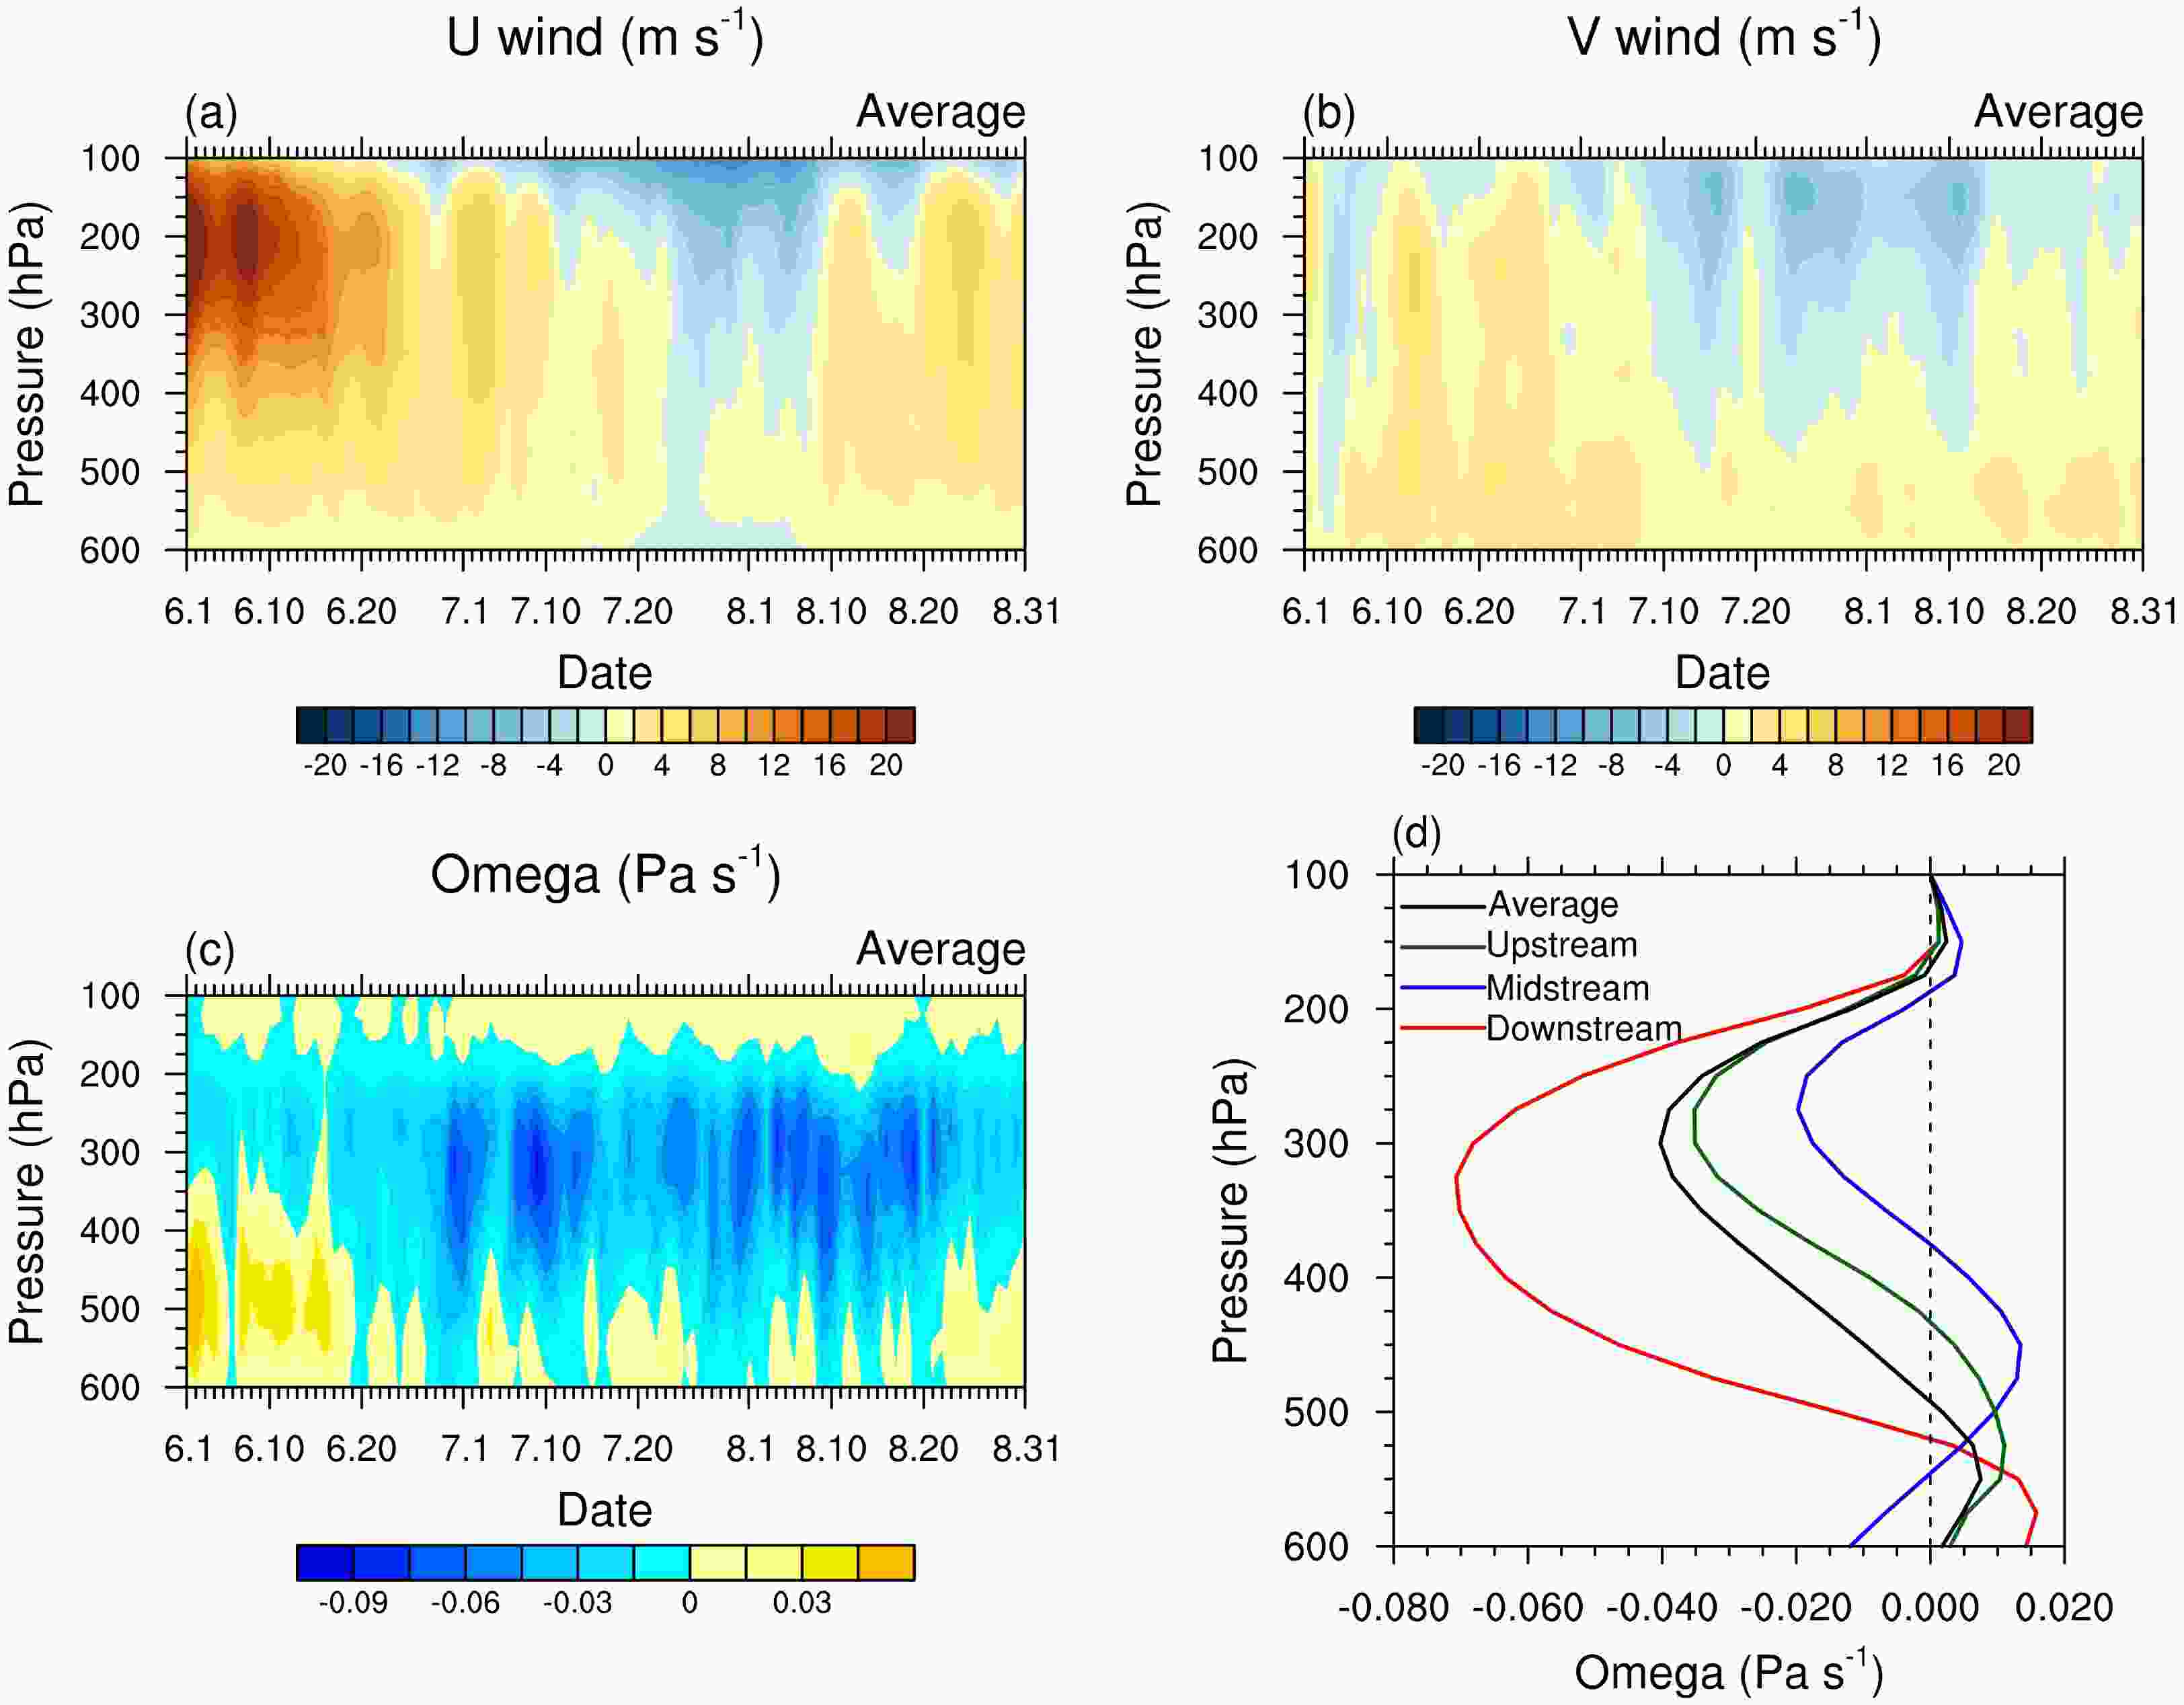
Figure 4. Time–pressure cross-sections of regional average (a) U wind (units: m s−1), (b) V wind (units: m s−1), and (c) vertical velocity (units: Pa s−1) in the YZRB, as well as (d) period-averaged profiles of vertical velocity (units: Pa s−1) in the upstream (green line), midstream (blue line), and downstream (red line) regions, and the regional average (black line).
The moisture source and its transport are significantly affected by the westerly and summer monsoon circulation. Some moisture in the YZRB is transported by the westerly from the west side of the TP. Another part is conveyed by the summer monsoon coming from the BOB, where they converge in the midstream and downstream regions of the YZRB (Fig. 3). In general, the YZRB has a relatively stronger moisture flux over the TP in summer, and the moisture flux in the midstream and downstream regions is stronger than that in the upstream region. In June, the location of the moisture flux maximum affecting the YZRB basically coincides with the location of the U wind speed maximum, so the moisture in June is mainly transported by the westerly (Fig. 3a). In July, with the weakening of the westerly and the strengthening of the summer monsoon, the location of the moisture flux maximum affecting the YZRB basically coincides with the location of the V wind speed maximum, forming a summer monsoon moisture transport belt from the BOB to the southeastern TP (Fig. 3d). In August, an east-to-west moisture transport belt appears from the south side of the TP to the northern BOB, which is driven by southeast wind, carrying moisture from the SCS (Fig. 3e). It converges with the southwest airflow at the northern BOB, jointly providing moisture for the YZRB (Figs. 3e and f).
-
Under the combined influence of the westerly and summer monsoon moisture transport, the YZRB has formed a unique atmospheric water cycle for moisture, cloud, and precipitation. Figure 5 shows the temporal evolution of the atmospheric water cycle, where the cloud variables are based on Terra-Aqua satellite CERES data. CERES classifies clouds into four types: low cloud (cloud top height below 700 hPa), mid-low cloud (between 500 hPa and 700 hPa), mid-high cloud (between 300 hPa and 500 hPa), and high cloud (above 300 hPa). Due to the high altitude of the TP, its surface pressure is generally less than 700 hPa, and the low cloud of CERES is not suitable for this region. Therefore, mid-low cloud, mid-high cloud, and high cloud in CERES are used for research. The upstream region of the YZRB has the weakest moisture, cloud fraction, and precipitation among the three regions, with an average precipitation of 2.5 mm d−1 in summer. In June, the troposphere in the upstream region is very dry, especially from 350 hPa to 150 hPa, where the relative humidity is even below 20% (Fig. 5a). The extremely weak relative humidity in the upper troposphere inhibits the formation of high clouds, making high clouds become the least common cloud type in June, and the only moisture in the mid-to-lower troposphere forms some mid-high clouds (Fig. 5b). Precipitation is also extremely scarce because of insufficient moisture supply (Fig. 5c). Since the end of June, atmospheric moisture continues to increase and reaches its peak in early August, when the relative humidity maximum is located at 500–350 hPa (Fig. 5a). During this period, the mid-high cloud fraction remains stable at around 35%, and influenced by the increase of moisture, the high-cloud fraction gradually increases, exceeding the mid-high cloud and reaching a peak (more than 50%) around early August (Fig. 5b). The evolution of precipitation is very similar to that of high clouds, and the precipitation peak also appears in early August (6 August), which is much stronger than that in other periods (Fig. 5c), indicating that precipitation is mainly generated by high clouds. In mid-August, moisture, cloud, and precipitation all weaken rapidly (Figs. 5a–c).
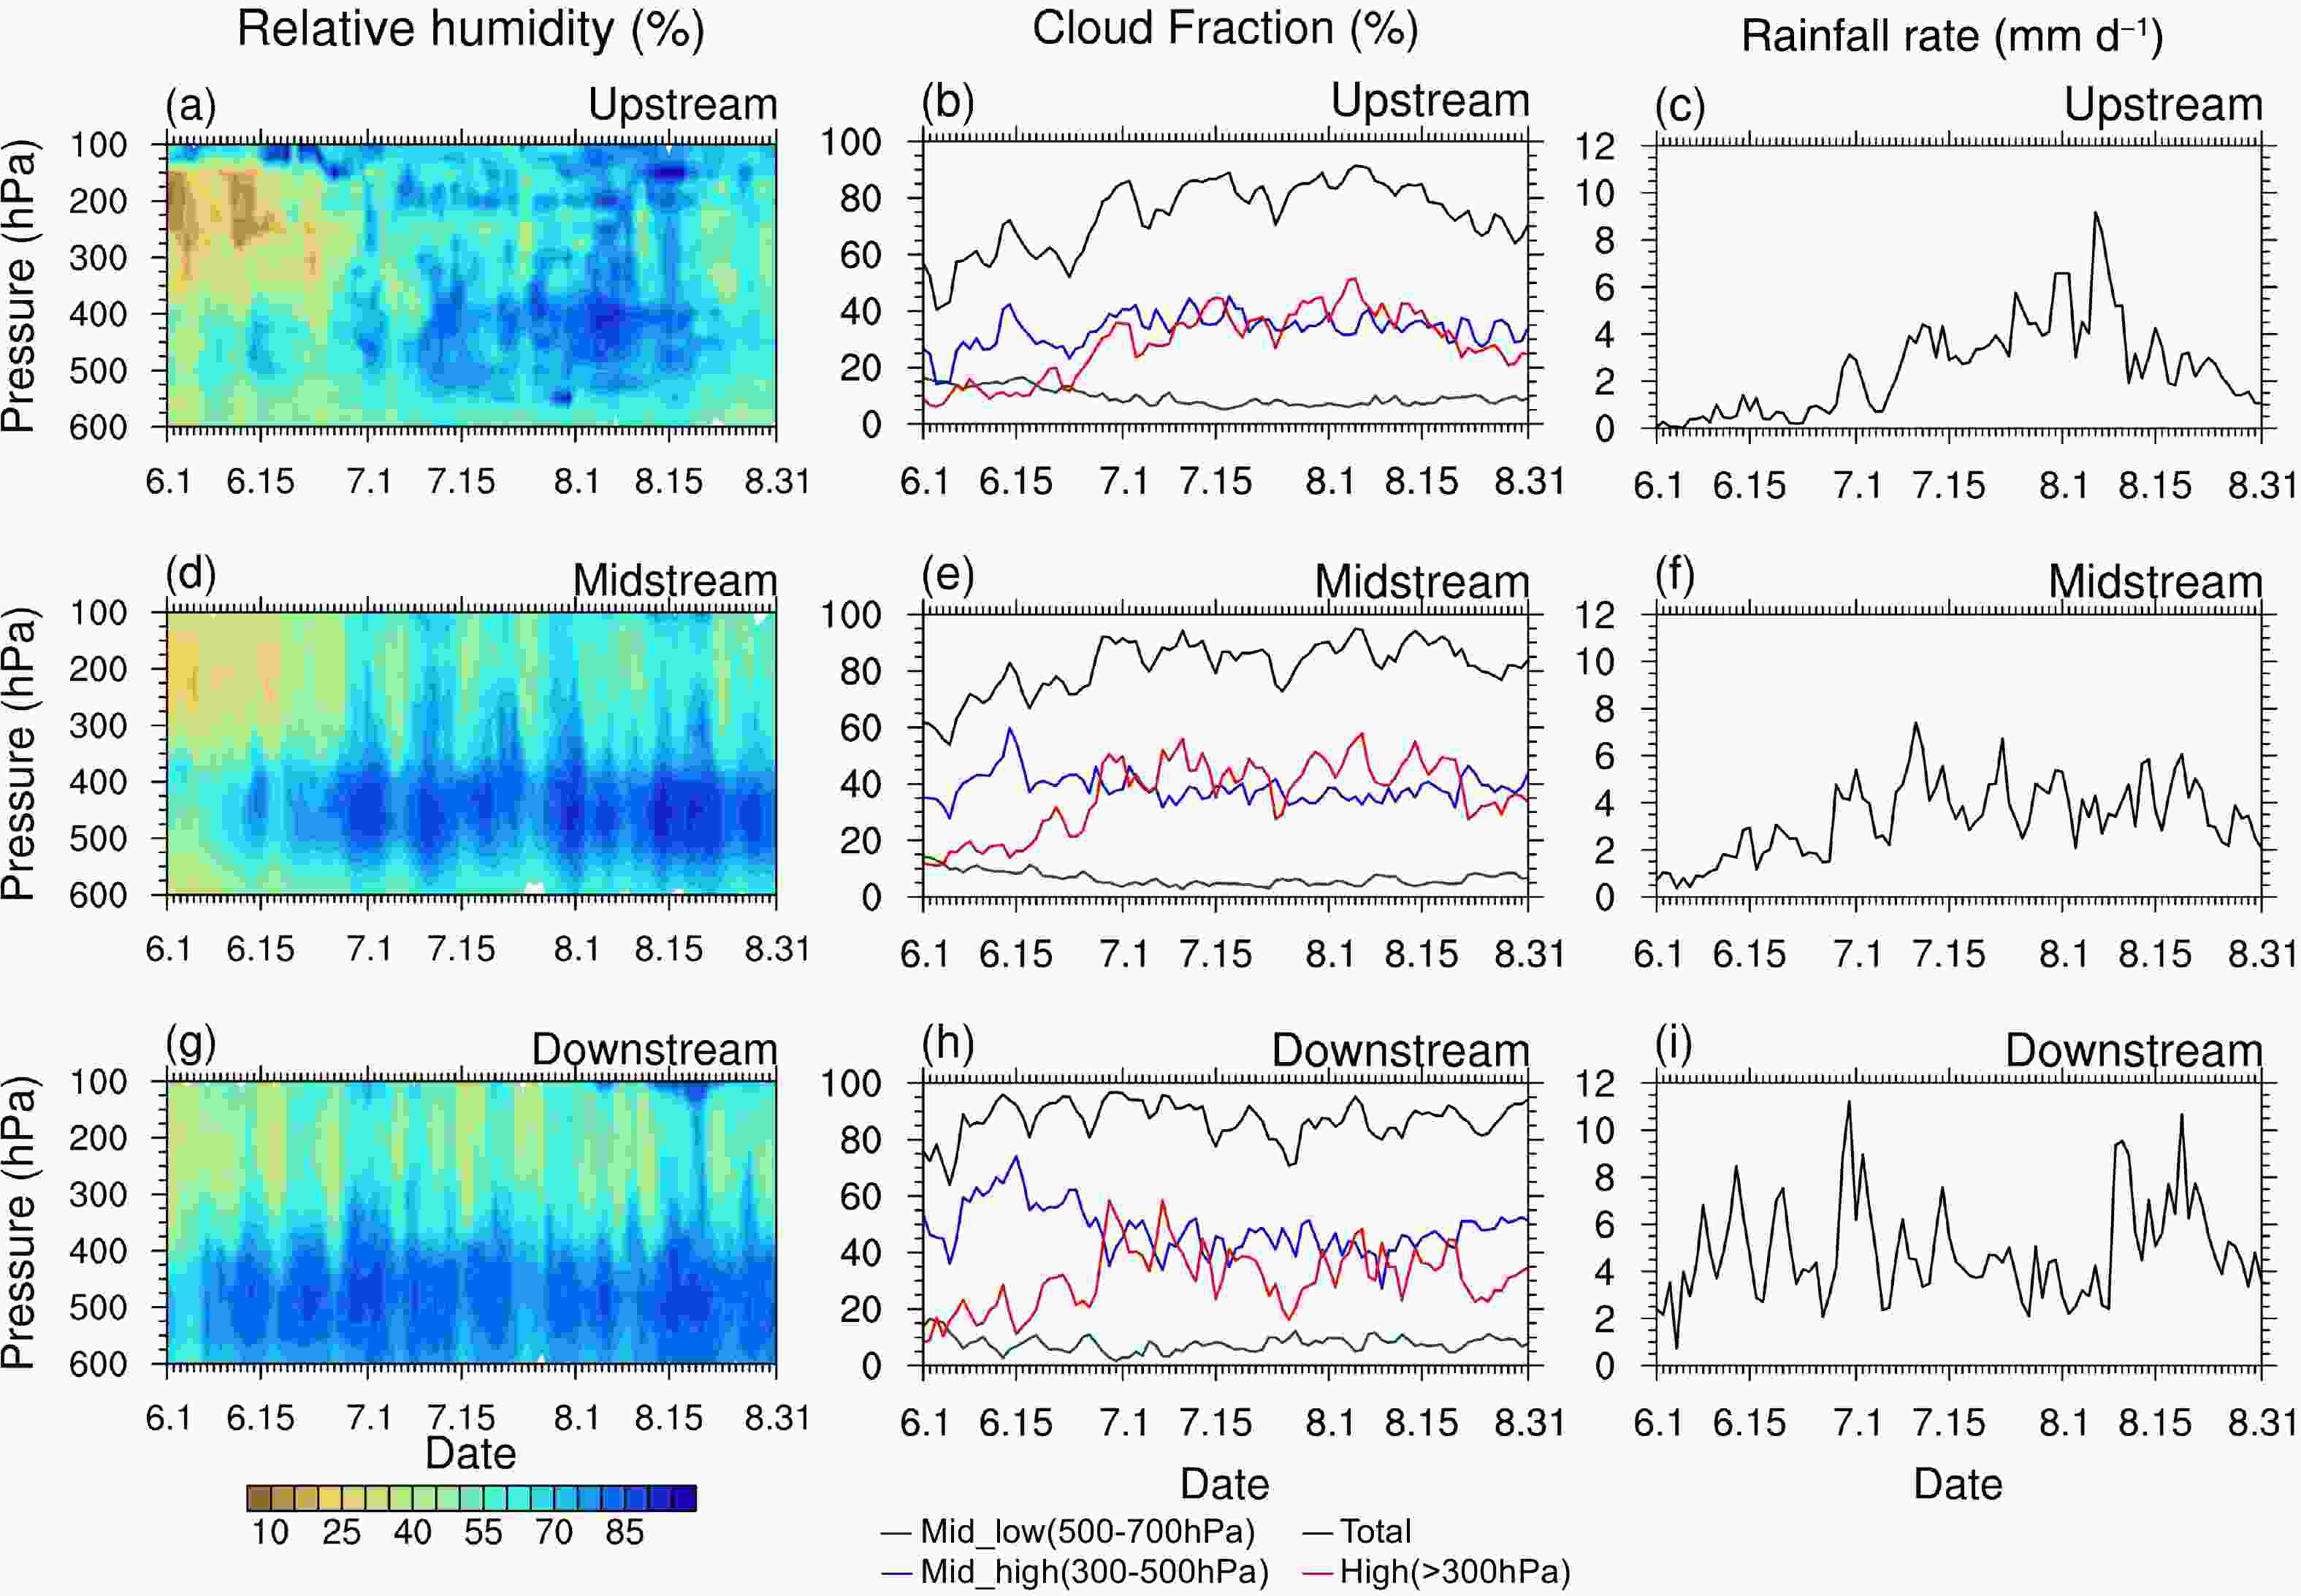
Figure 5. (a, d, g) Time–pressure cross-sections of relative humidity (%), (b, e, h) time series of cloud fraction (%), and (c, f, i) time series of precipitation (units: mm d−1) in the (a–c) upstream, (d–f) midstream, and (g–i) downstream regions.
The moisture, cloud fraction, and precipitation in the midstream region are stronger than those in the upstream region, and the average precipitation in summer is 3.3 mm d−1. In June, the moisture content in the upper troposphere is weak (Fig. 5d), resulting in fewer high clouds, and the mid-high clouds dominate the midstream region in June (Fig. 5e). The precipitation is weak, and two minor precipitation events in mid-June are produced by mid-high clouds and high clouds respectively (Figs. 5e and f). At the end of June, the moisture, cloud, and precipitation all increase rapidly and maintain large magnitudes until the end of August, showing an oscillation with a period between 10 and 15 days (Figs. 5d–f). The relative humidity maximum is vertically expanded and distributed within 550–350 hPa (Fig. 5d). Especially in the upper troposphere, the moisture is greatly supplemented, allowing high clouds to dominate the midstream region, whose maximum can be close to 60% (Fig. 5e). Precipitation is still mainly generated by high clouds, but unlike the high clouds whose maximum appears in early August, precipitation can reach an obvious peak on 10 July (Figs. 5e and f).
The downstream region has the most abundant moisture, cloud, and precipitation, which last almost throughout the summer, with an average precipitation of 4.9 mm d−1. The moisture maximum is located from 600 to 350 hPa, and there is the strongest relative humidity in the lower troposphere (Fig. 5g). Stronger relative humidity makes it easier for clouds to form, so the total cloud fraction can stay around 90%. The sufficient moisture in the mid-to-lower troposphere provides favorable conditions for the formation of mid-high clouds, making the mid-high cloud fraction become the largest in the downstream region, with an average of about 50% and a maximum of 75%. The high clouds are relatively weaker, but their temporal evolution is more drastic (Fig. 5h). The downstream region already has obvious precipitation in June, and there are two periods of heavy precipitation: the peak of the strongest precipitation on 30 June, and the second period on 19 August (Fig. 5i), both of which correspond to the period with relatively more high clouds (Fig. 5h). From late July to early August, there is a break period of high cloud and precipitation (Figs. 5h and i).
-
The atmospheric analysis data satisfy the moisture budget balance and depend on observation. Therefore, in this section, we discuss the source and transport of moisture in the YZRB from the observational perspective and try to understand the mechanism of the atmospheric water cycle process in the YZRB under the moisture transport of the westerly and summer monsoon.
The governing equation of large-scale moisture is
where
$ {\mathbf{V}} $ is the horizontal wind vector,$\omega $ is the vertical velocity,$q$ is the water vapor mixing ratio,$E$ is evaporation,$C$ is condensation,$q_l$ is the cloud liquid water content, the overbar represents the horizontal average over the domain, and a prime represents the deviation from the average.The vertical integration of Eq. (1), where
$\left\langle X \right\rangle = \dfrac{1}{g}\displaystyle\int_{pT}^{ps} {\left( X \right)} {\text{d}}p$ , isin which
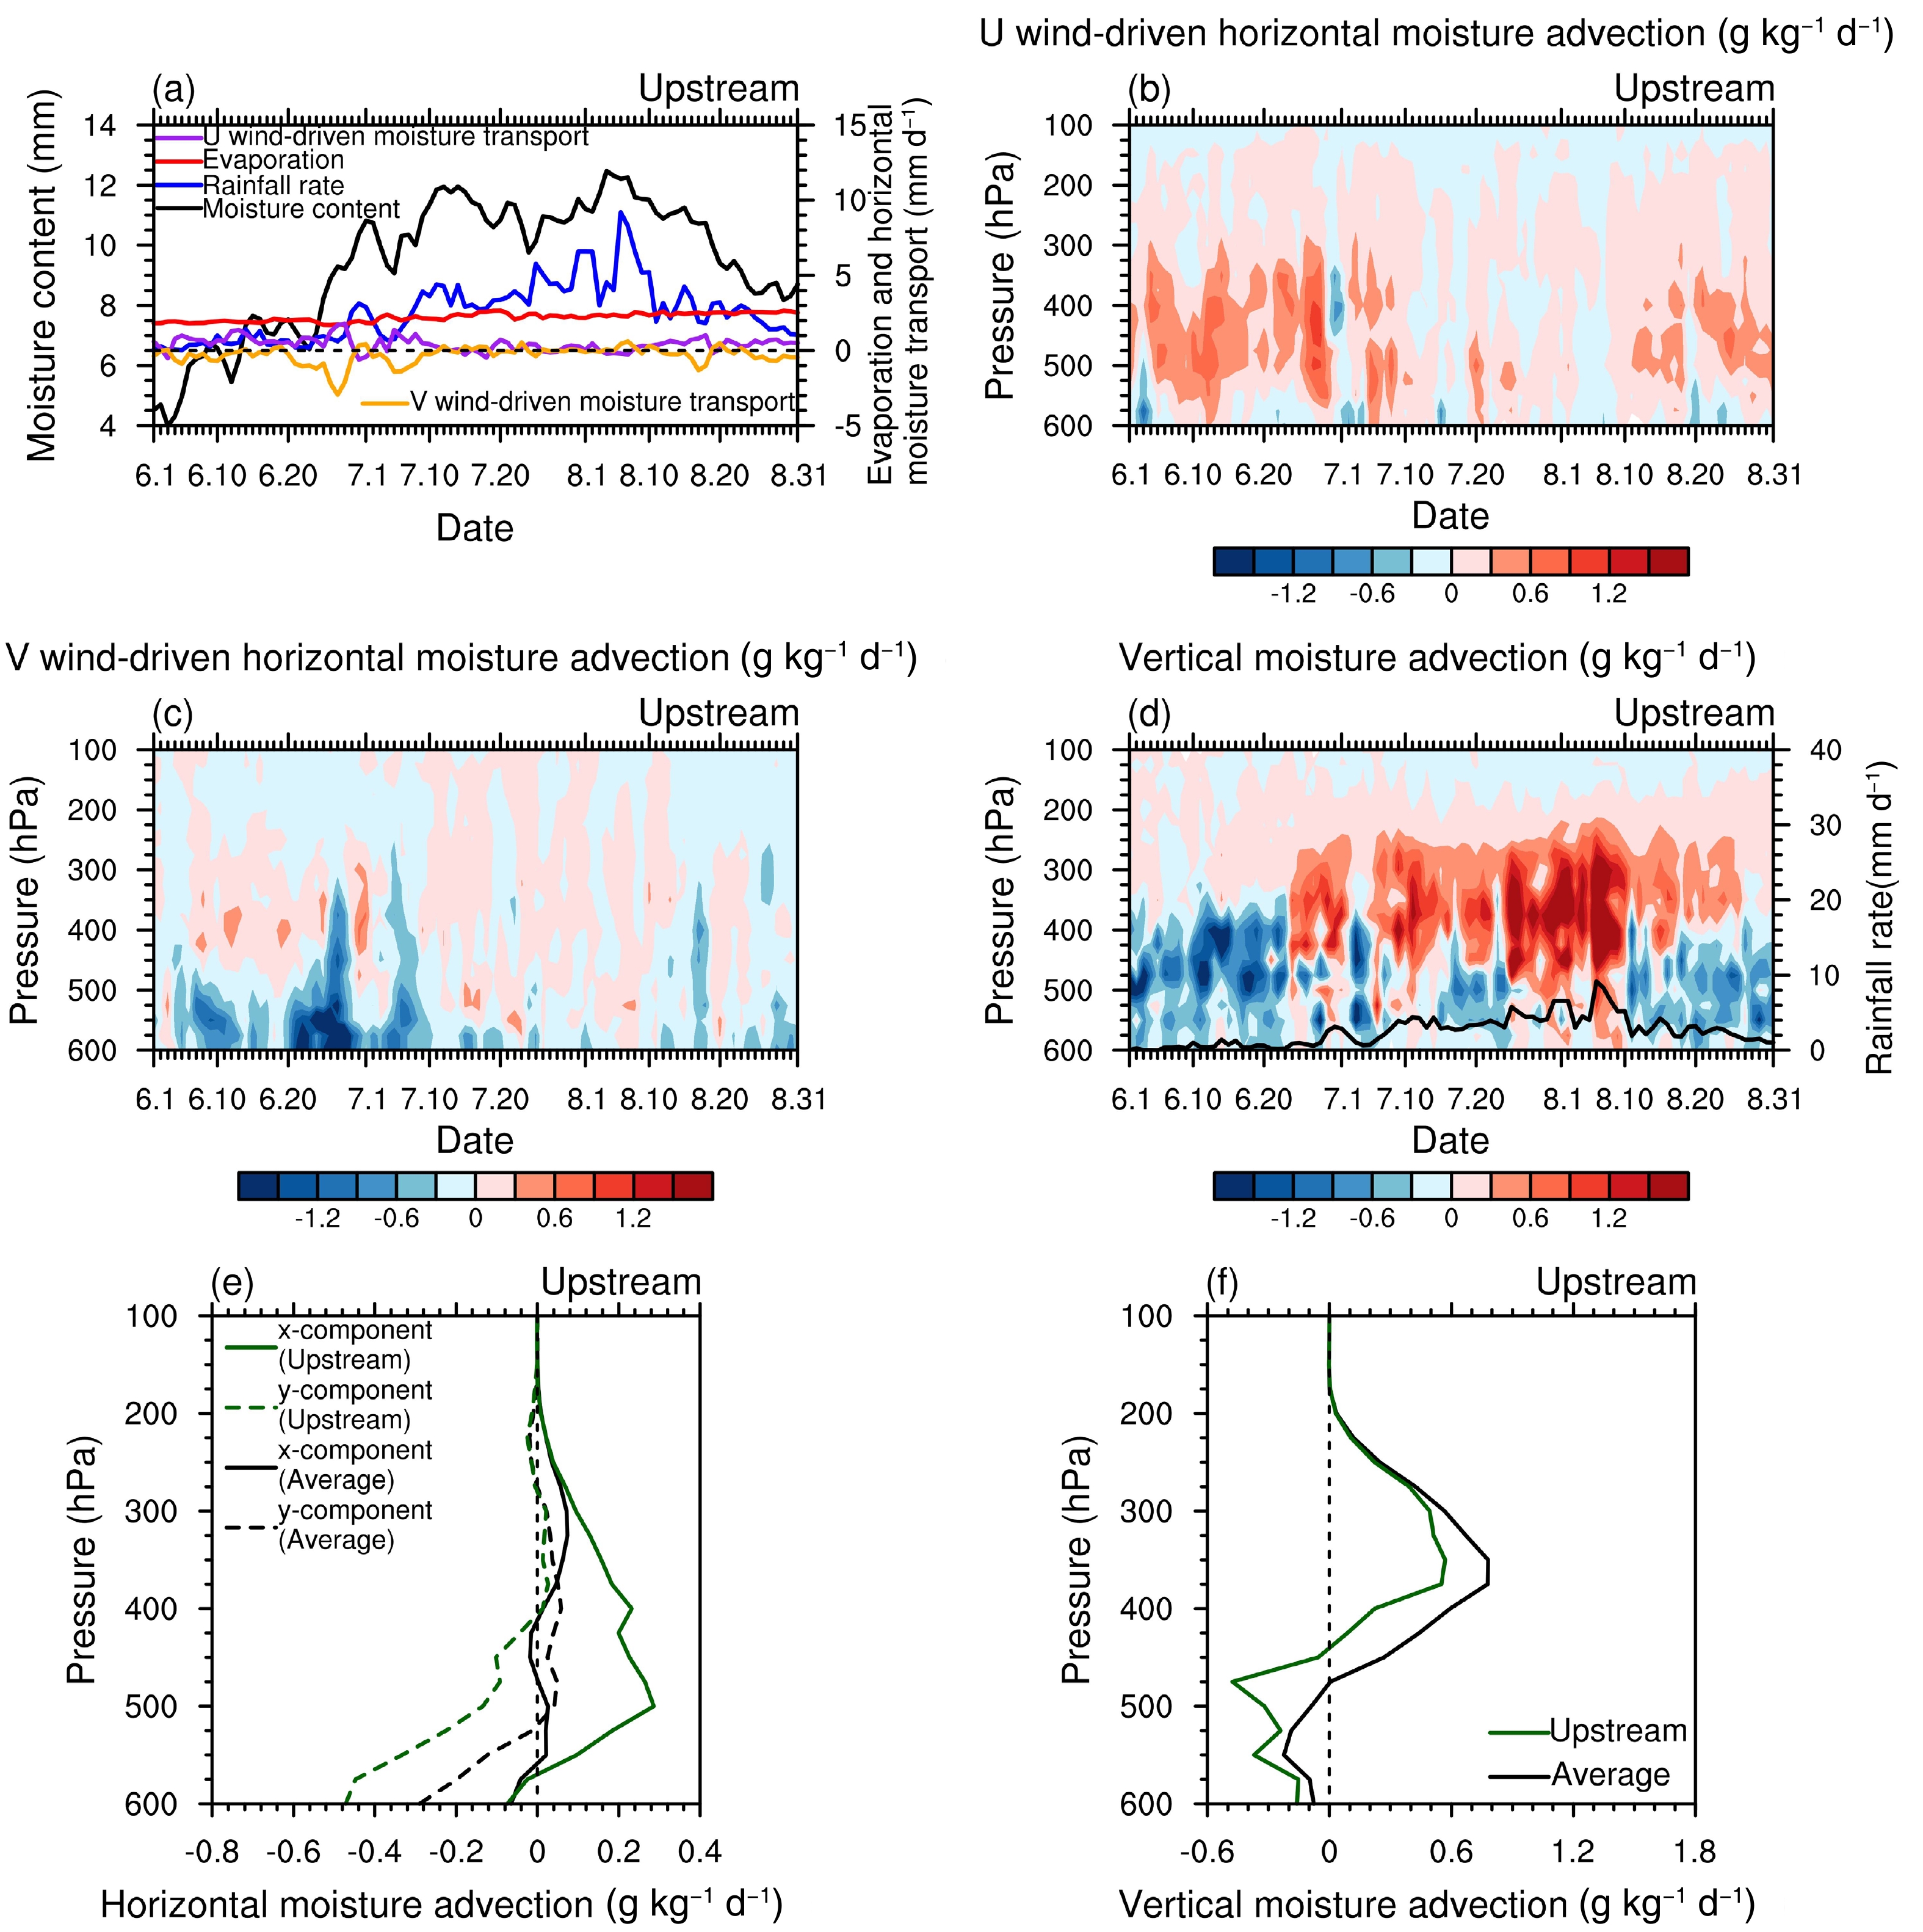
$E_{\mathrm{s}}$ is surface evaporation and$P_{{\mathrm{rec}}}$ is precipitation. It can be seen that the moisture sources are the column-integrated moisture transport and surface evaporation, while precipitation and cloud water storage (too small to be considered in the moisture budget) play key roles in moisture consumption. Furthermore, the moisture transport includes the horizontal moisture advection that represents the moisture exchange between the outside and the air column, as well as the vertical moisture advection on behalf of the upward airflow in the air column that brings moisture from lower to upper levels. Considering the distribution of summer wind fields over the YZRB, the x-component and y-component of the horizontal moisture advection can be regarded as the westerly- and southerly-driven horizontal moisture advection.In the upstream region of the YZRB, the westerly-driven moisture advection shows a net moisture input in the whole troposphere, whose maximum is located at 500 hPa. On the contrary, the southerly-driven moisture advection has a strong drying effect below 400 hPa (Fig. 6e). The vertical wet advection maximum is located at 350 hPa, and its intensity is more than twice as strong as the westerly-driven wet advection maximum (Fig. 6f). Moisture advection has an obvious temporal variation (Fig. 6a), which significantly affects the temporal evolution of moisture, cloud, and precipitation. In June, the westerly-driven wet advection shows significant moisture transport (Fig. 6b), corresponding to the fact that the upstream region is significantly affected by the westerly. However, the southerly-driven dry advection and vertical dry advection consume a large amount of moisture (Figs. 6c and d), which is the main reason for the scarce moisture, cloud, and precipitation at this time (Figs. 6a–c). Although the southerly wind speed maximum is always located to the southeast side of the upstream region (Figs. 3b, d and f), from July to early August, with the increasing influence of the summer monsoon on the upstream region during its westward advance (Figs. 3d and f), the vertical wet advection continues to strengthen (Fig. 6d), and its upward transport of moisture is conducive to the formation of high clouds and convective precipitation. Therefore, in early August, when the vertical wet advection is strongest (Fig. 6d), moisture, high cloud, and precipitation all reach their summer peak (Figs. 5a–c). From mid-August, the reappearance of vertical dry advection (Fig. 6d) results in a rapid weakening of precipitation (Fig. 5c). This phenomenon indicates that the influence of the summer monsoon on the upstream region has basically ended.
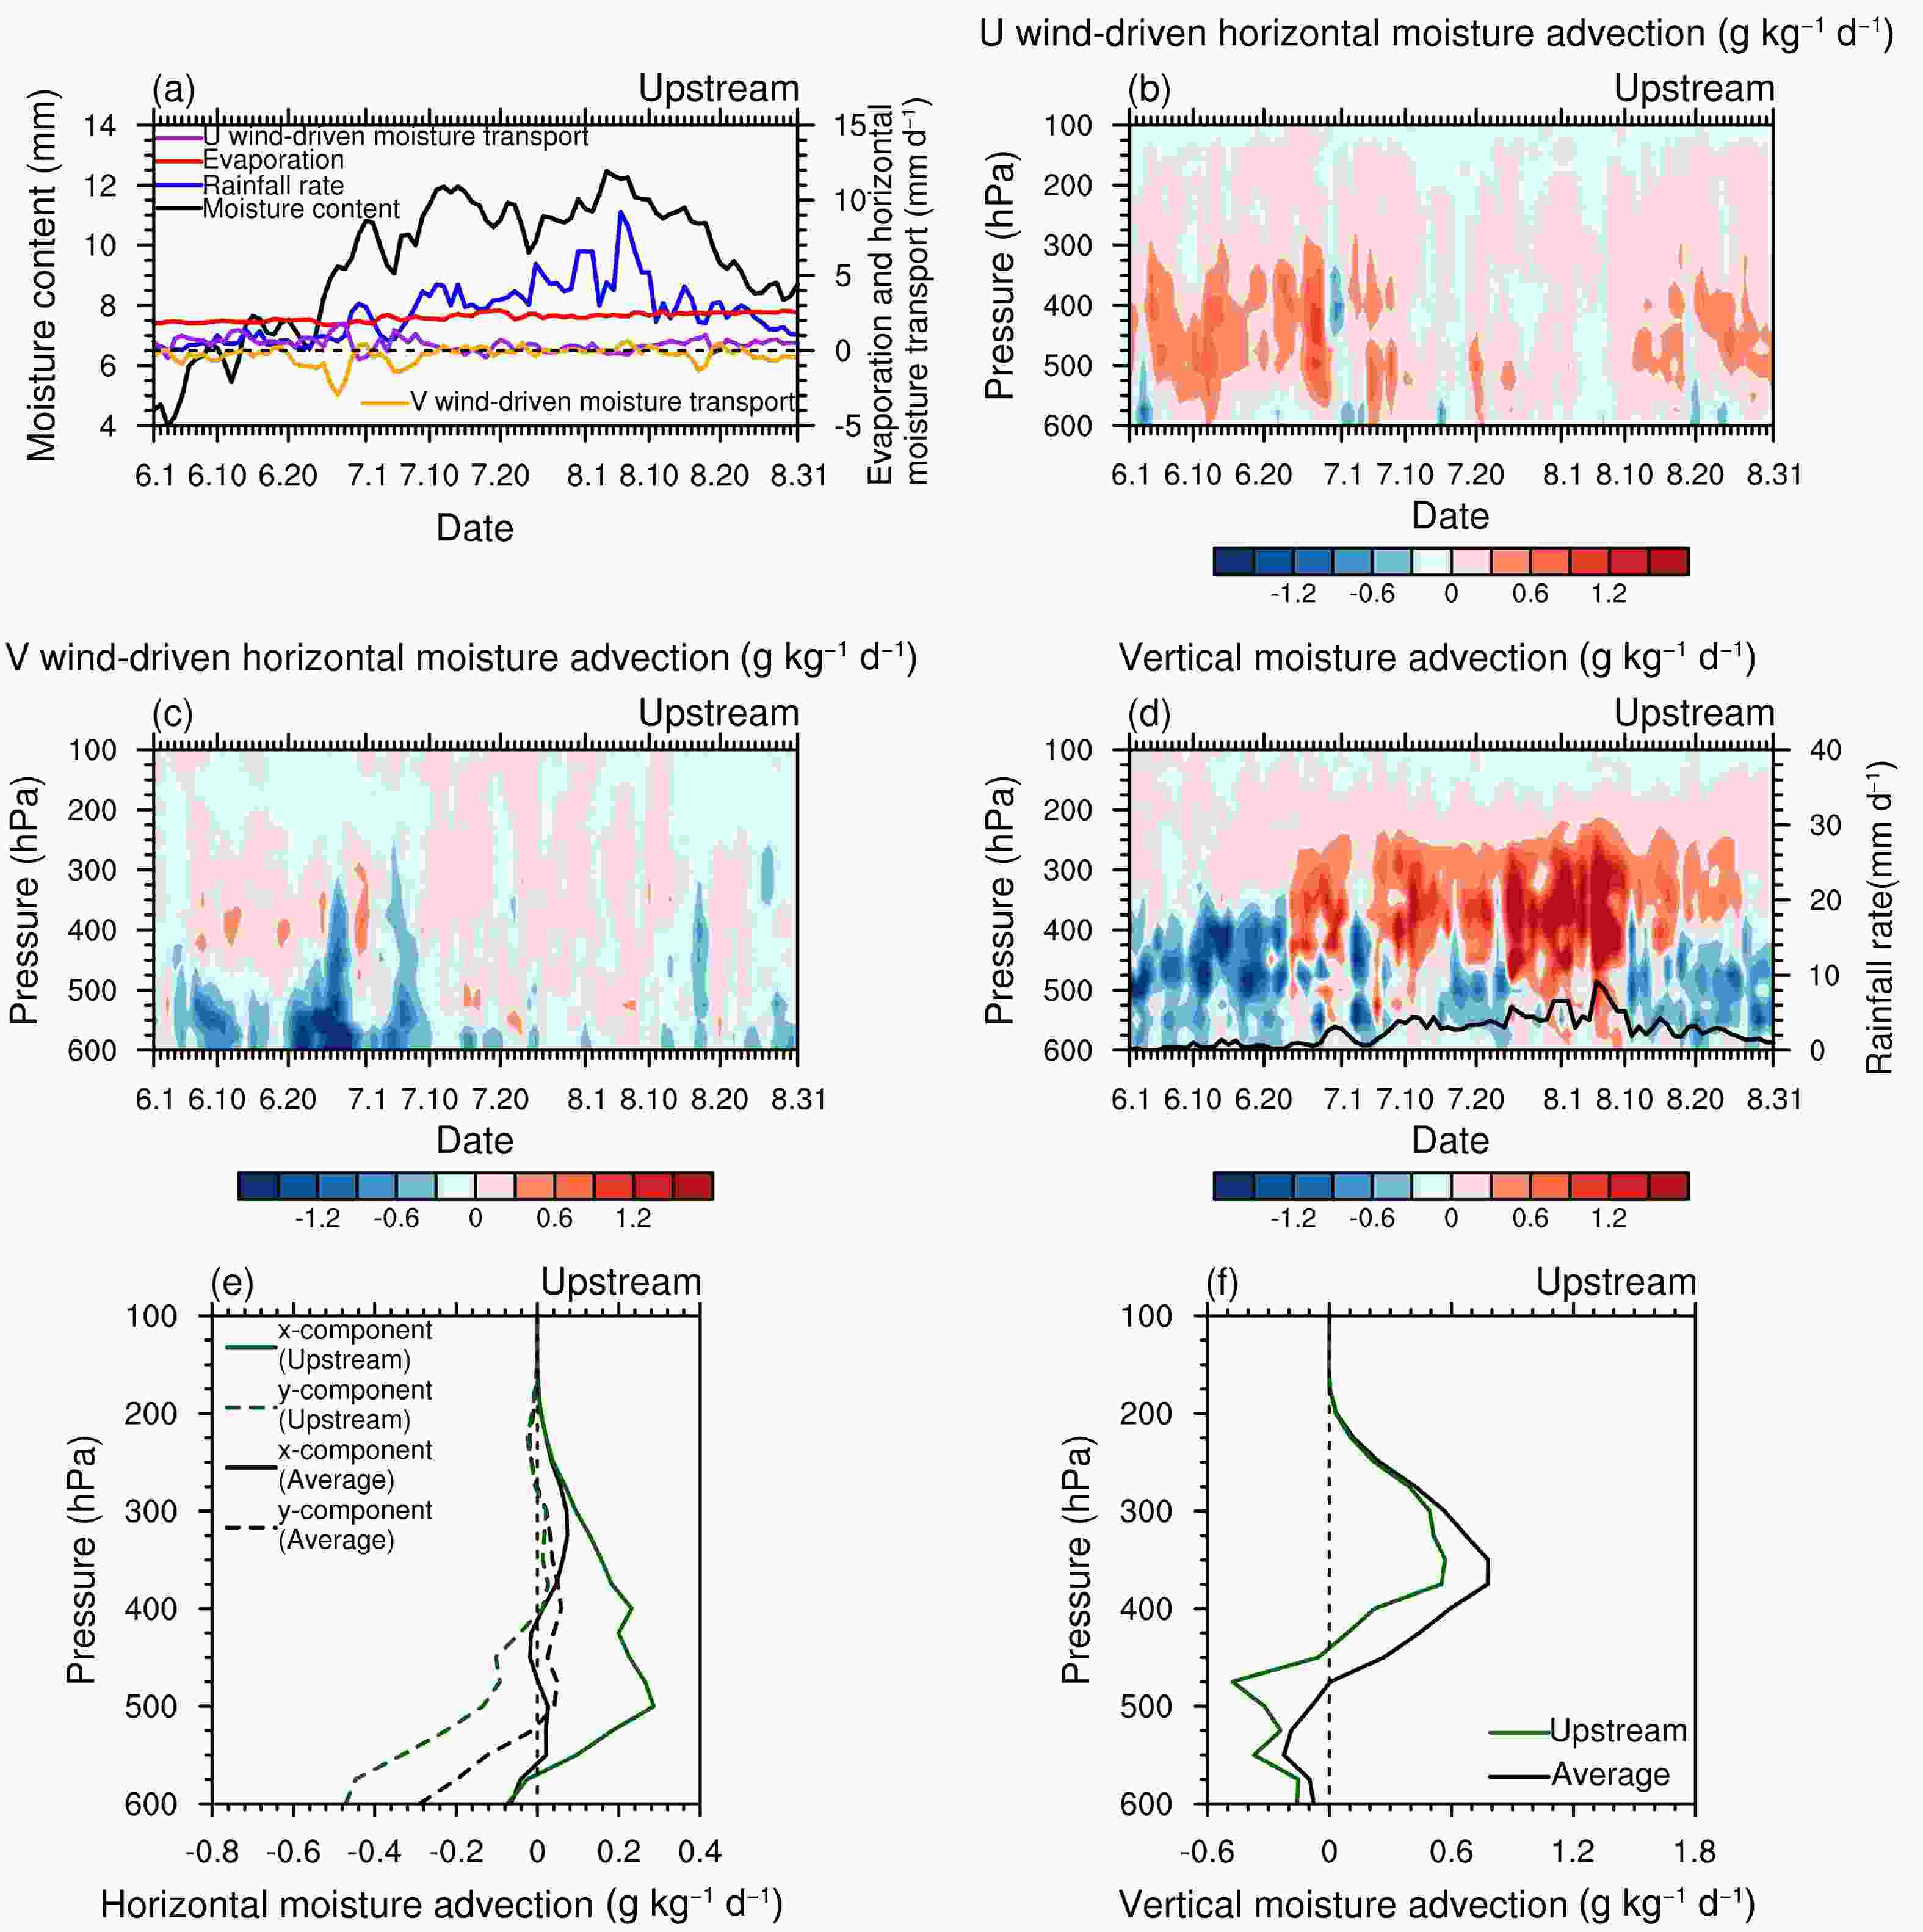
Figure 6. (a) Time series of column-integrated moisture content (black line; units: mm), U wind (purple line) and V wind (yellow line) moisture transport (units: mm d−1), surface evaporation (red line; units: mm d−1), and rainfall rate (blue line; units: mm d−1). Time-pressure cross-sections of (b) U wind-driven horizontal moisture advection (units: g kg−1 d−1), (c) V wind horizontal moisture advection (units: g kg−1 d−1), and (d) vertical moisture advection (units: g kg−1 d−1) in the upstream region of the YZRB, where the black line represents rainfall rate (units: mm d−1). Period-averaged profiles of (e) horizontal moisture advection and (f) vertical moisture advection in the upstream region (green lines) and the regional average (black lines).
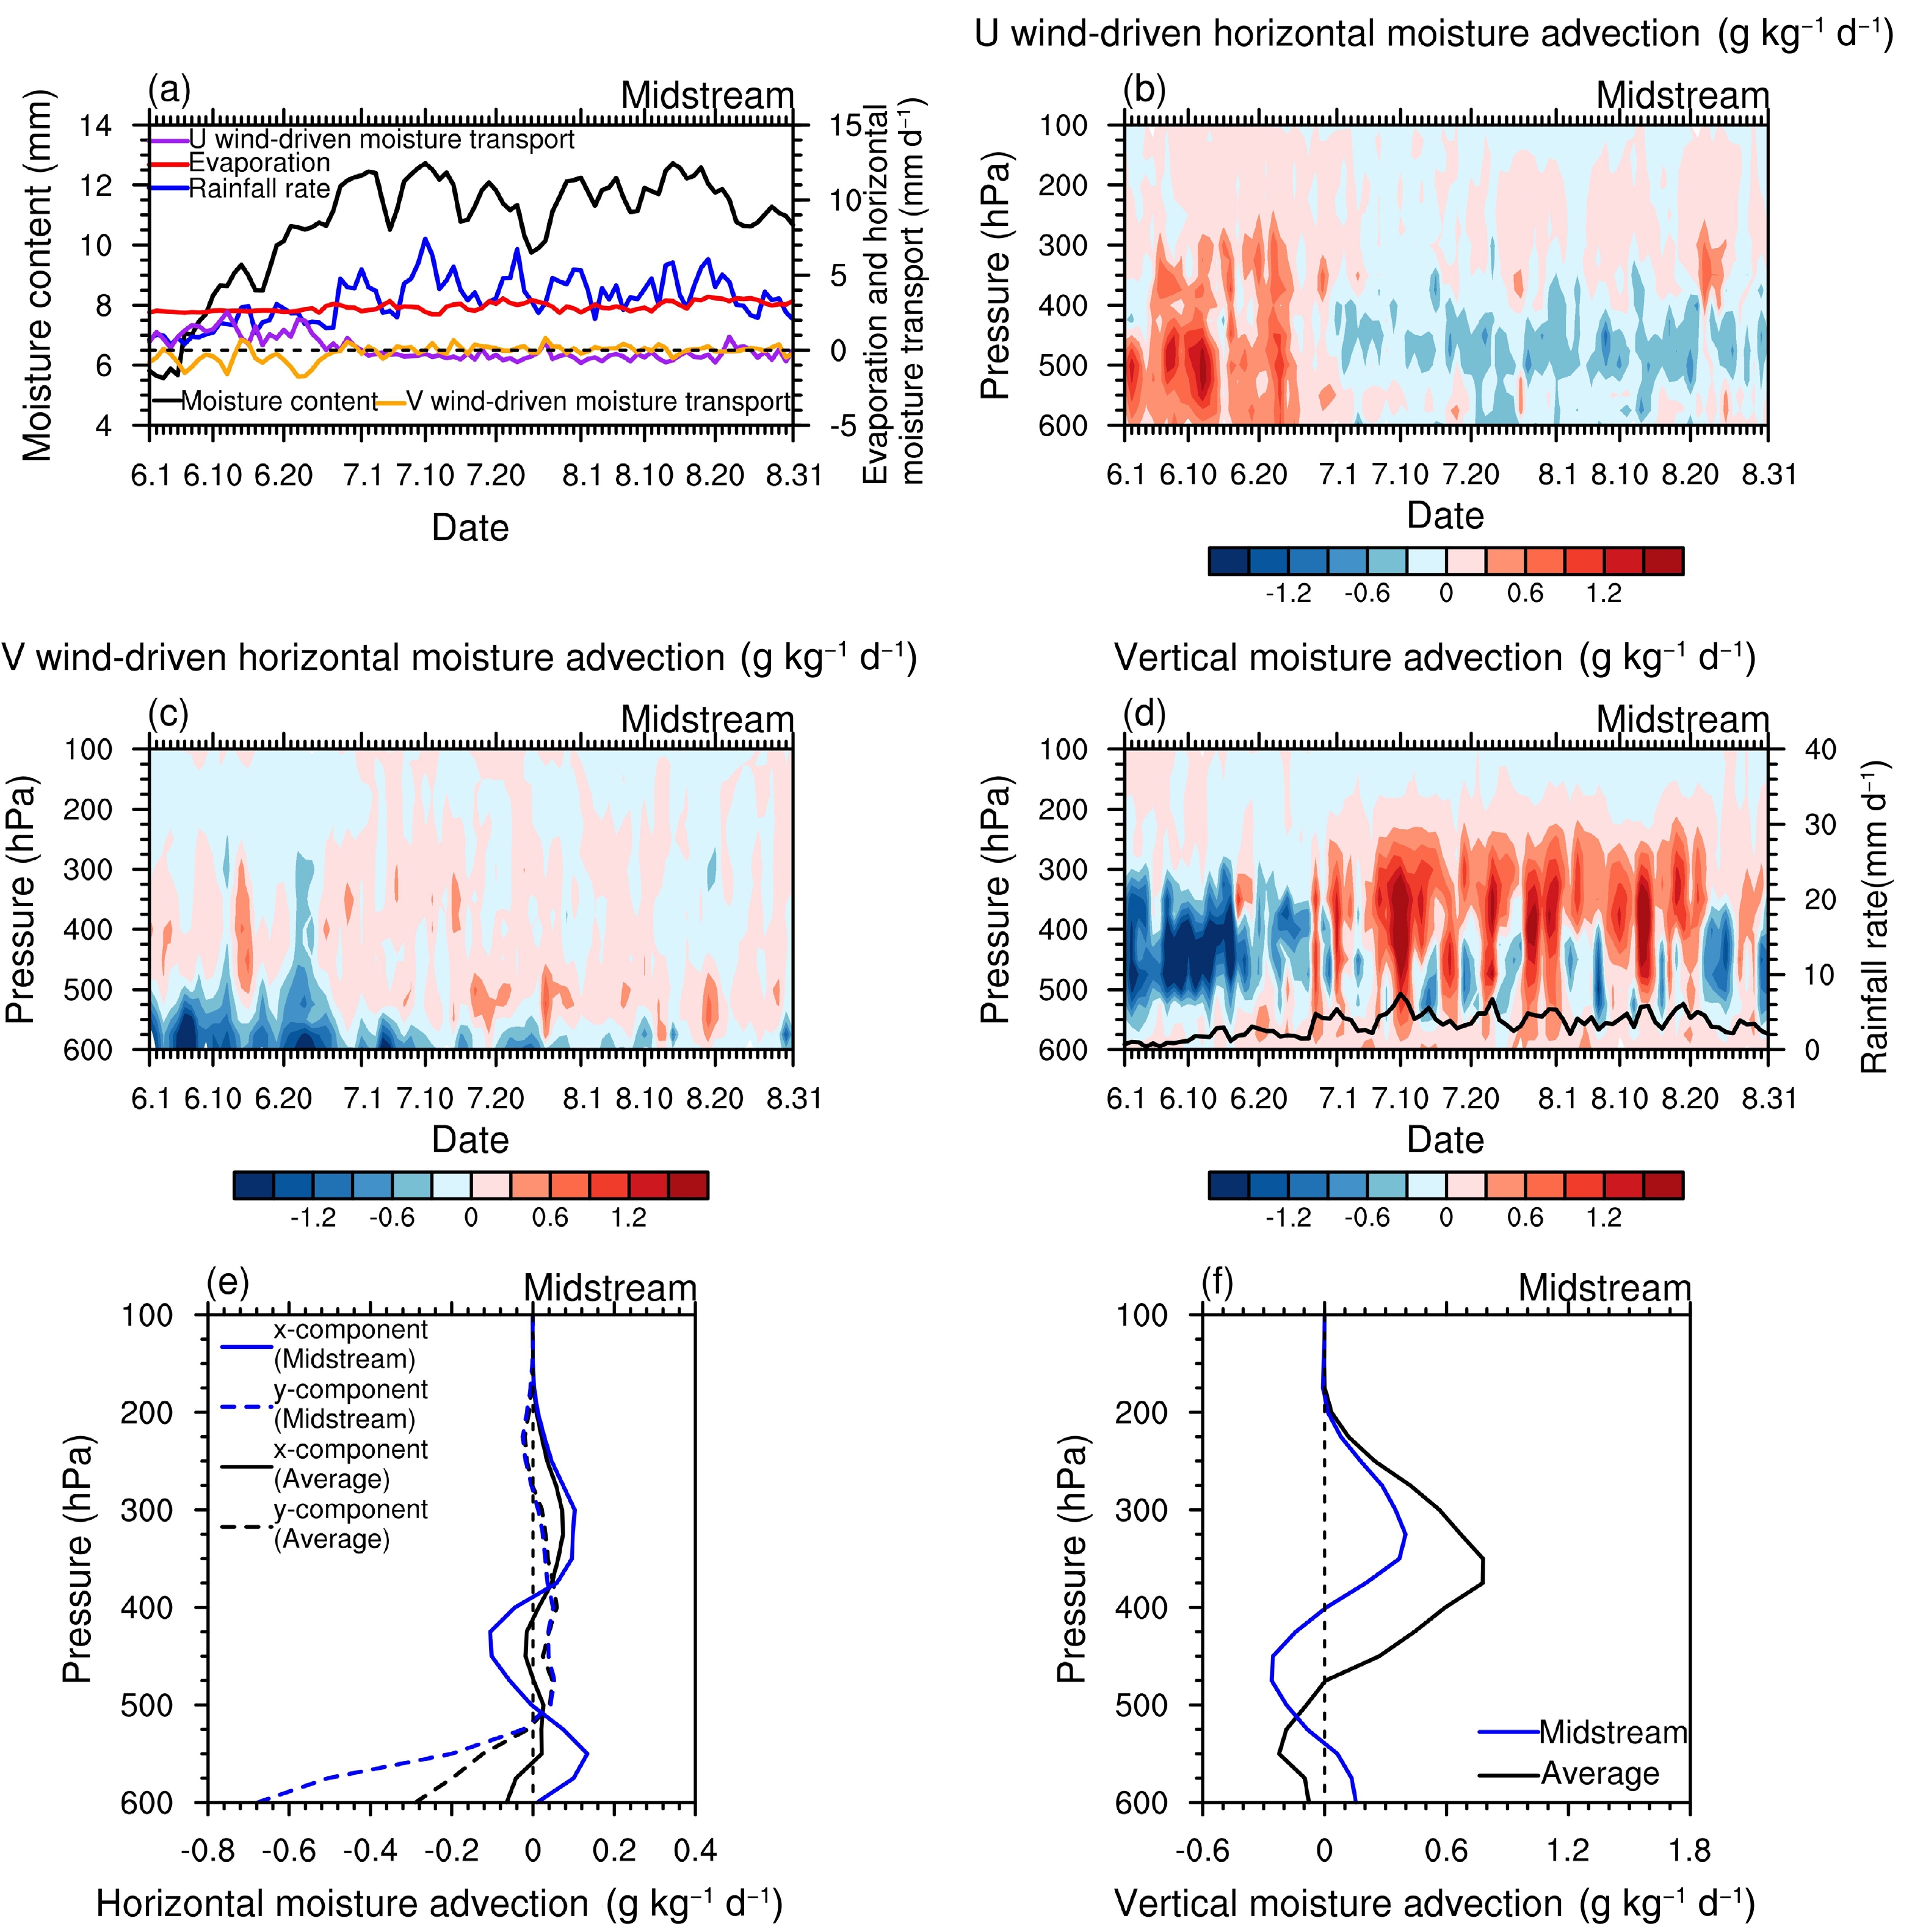
The midstream region is affected by the westerly in June, and the summer monsoon from July to August (Fig. 3). The transition between the westerly and summer monsoon at the end of June leads to a dramatic abrupt change in the moisture budget and advection (Fig. 7). In June, the broad strong westerly-driven moisture advection centered at 500 hPa offsets the drying effect of the southerly in the lower troposphere (Figs. 7a–c), forming a net moisture input, resulting in the increase of moisture in the mid-to-lower troposphere. However, the strong vertical dry advection (Fig. 7d) inhibits the upward transport of moisture, making the moisture in the upper troposphere, high clouds, and precipitation less (Figs. 5d–f). From July to August, under the continuous and significant influence of the summer monsoon, the westerly-driven moisture transport turns negative, and the drying maximum is located from 500–400 hPa (Fig. 7b). The external moisture is imported by the southerly (Fig. 7c). The vertical moisture advection quickly changes into wet advection, showing a higher maximum (325 hPa) than that in the upstream and downstream regions and thereby transporting more moisture to upper levels, which may be one of the reasons for the strongest high-cloud fraction in the midstream region (Figs. 5d–f). Vertical moisture advection below 400 hPa presents alternations between dry and wet advection (Fig. 7d), which explains the oscillation of precipitation intensity: The strong vertical wet advection in the whole troposphere can carry moisture into the upper levels, form a large number of high clouds, and produce strong precipitation. However, when dry advection occurs in the mid-to-lower troposphere, the precipitation process lacks the moisture supplement from the lower troposphere, which is not conducive to the generation of strong convection.
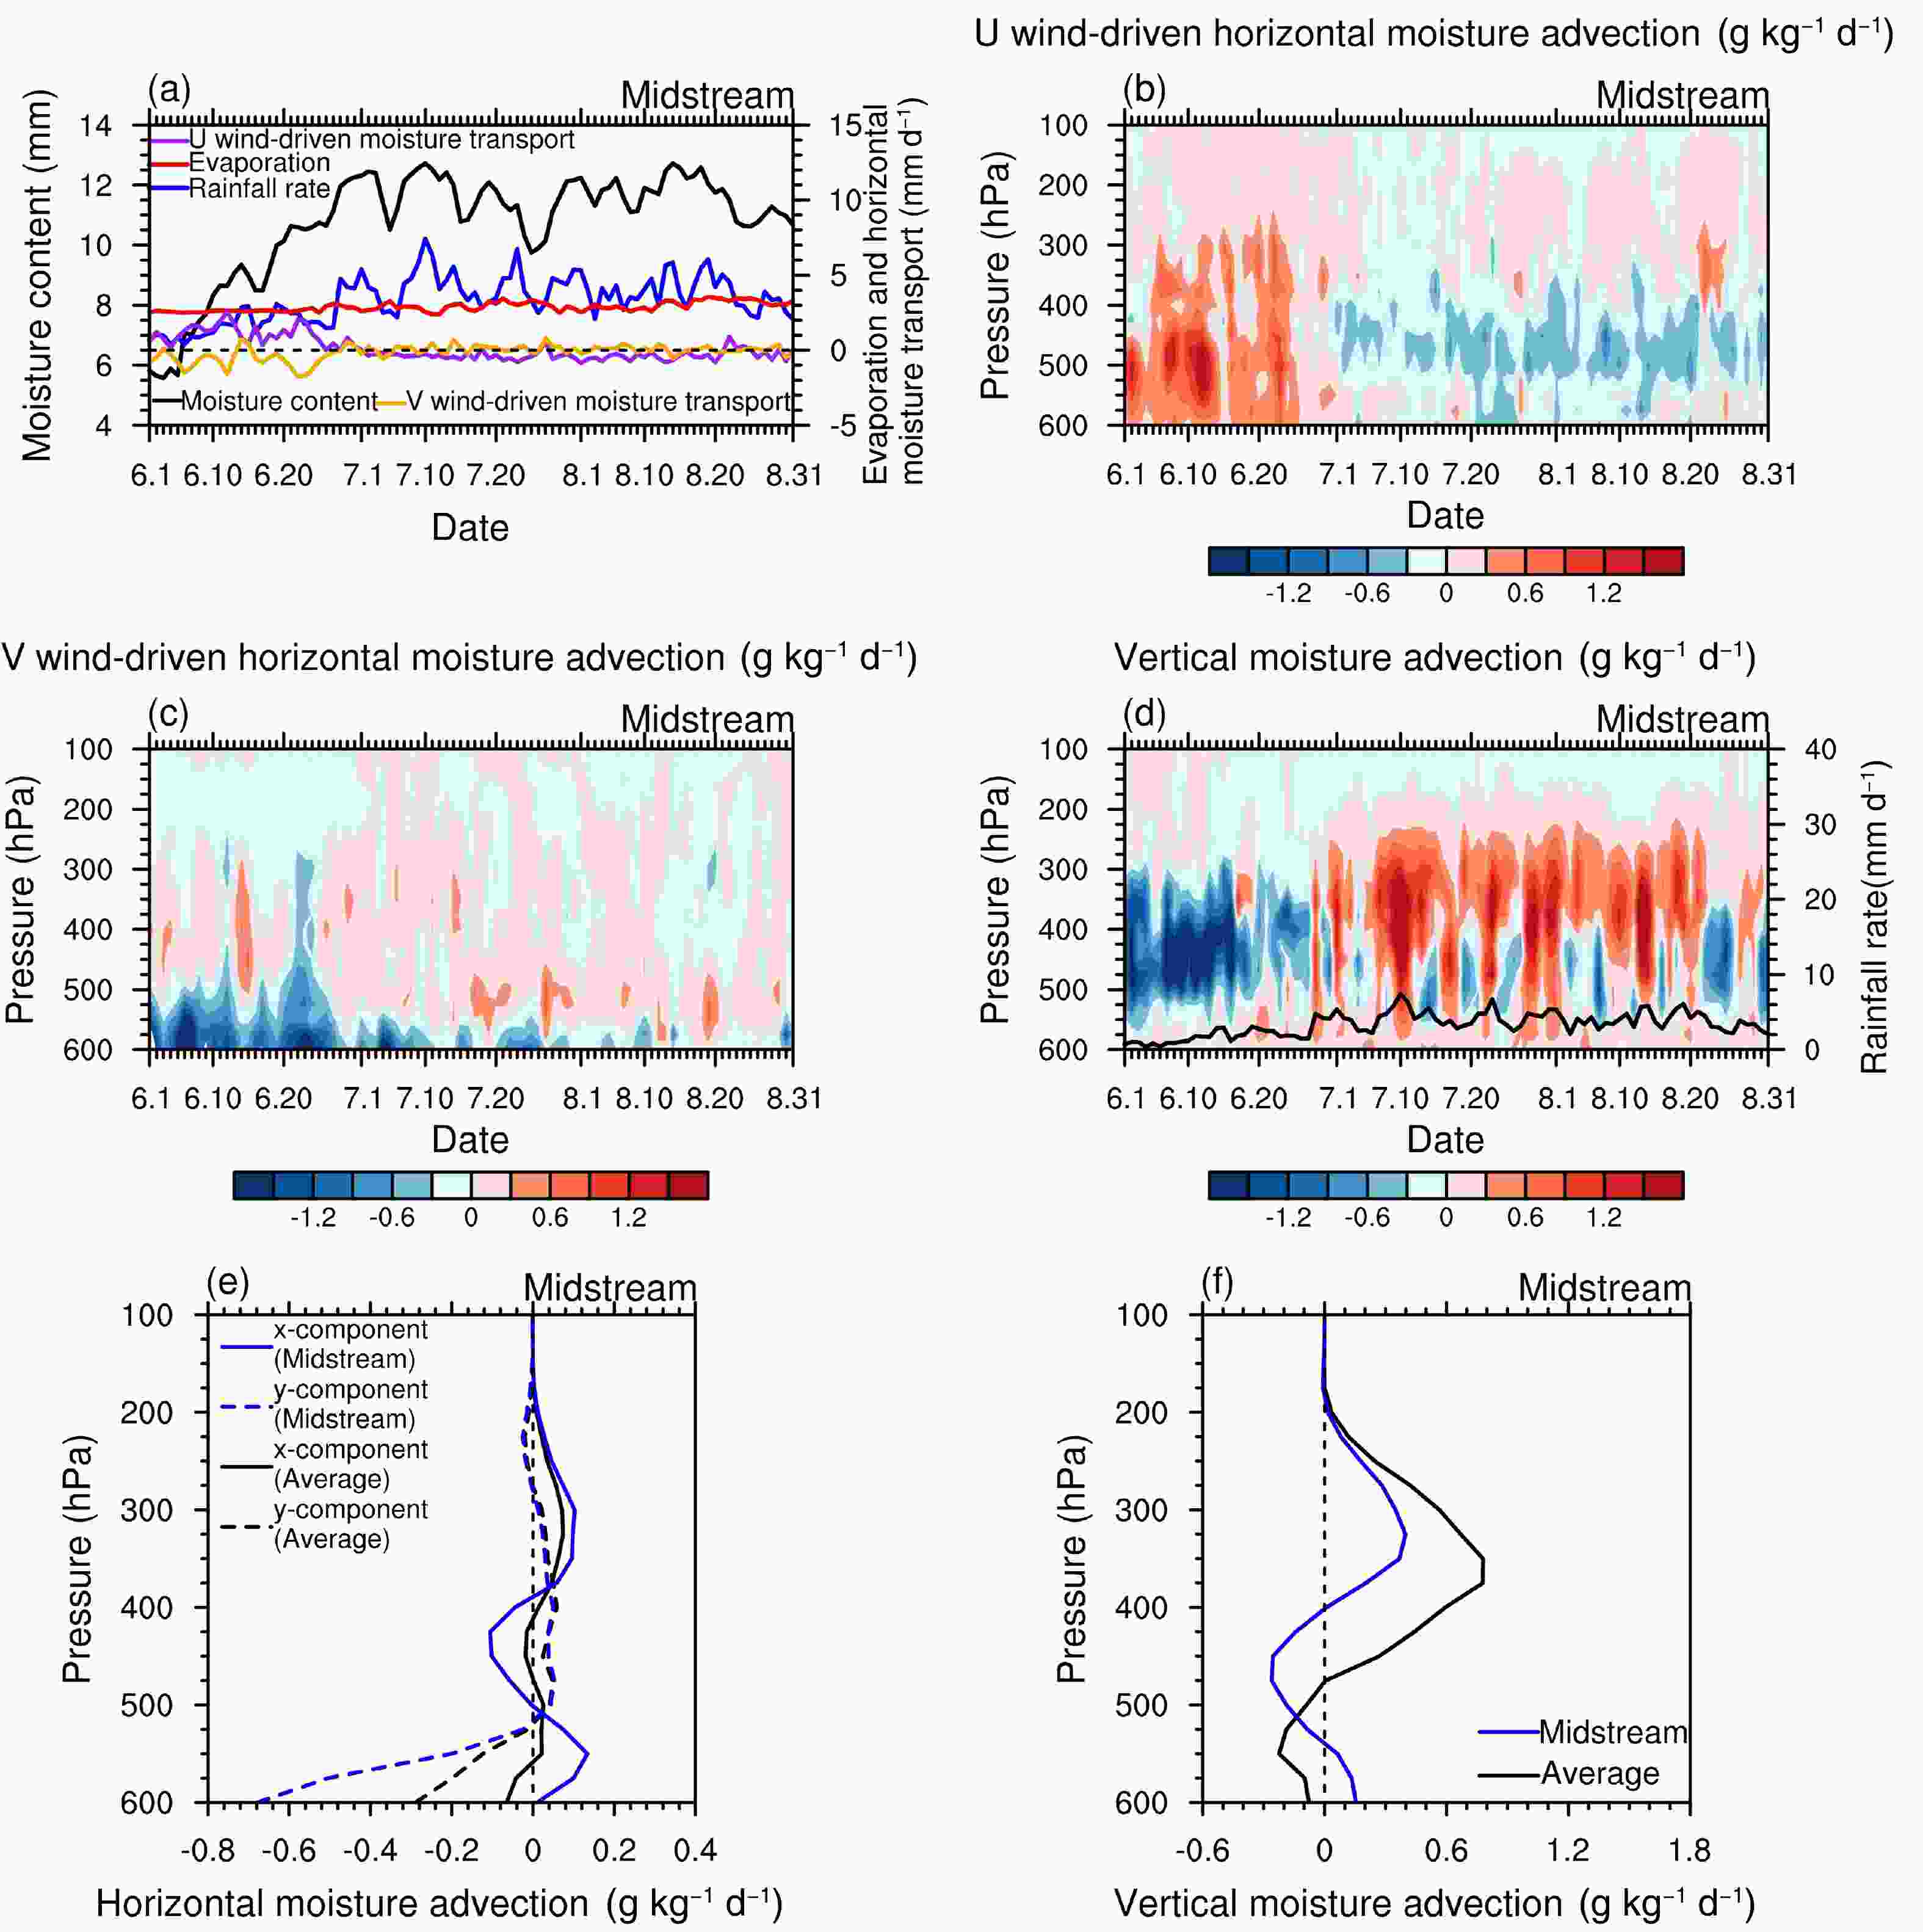
Figure 7. As in Fig. 6 but in the midstream region of the YZRB, which is represented by the blue lines in (e) and (f).
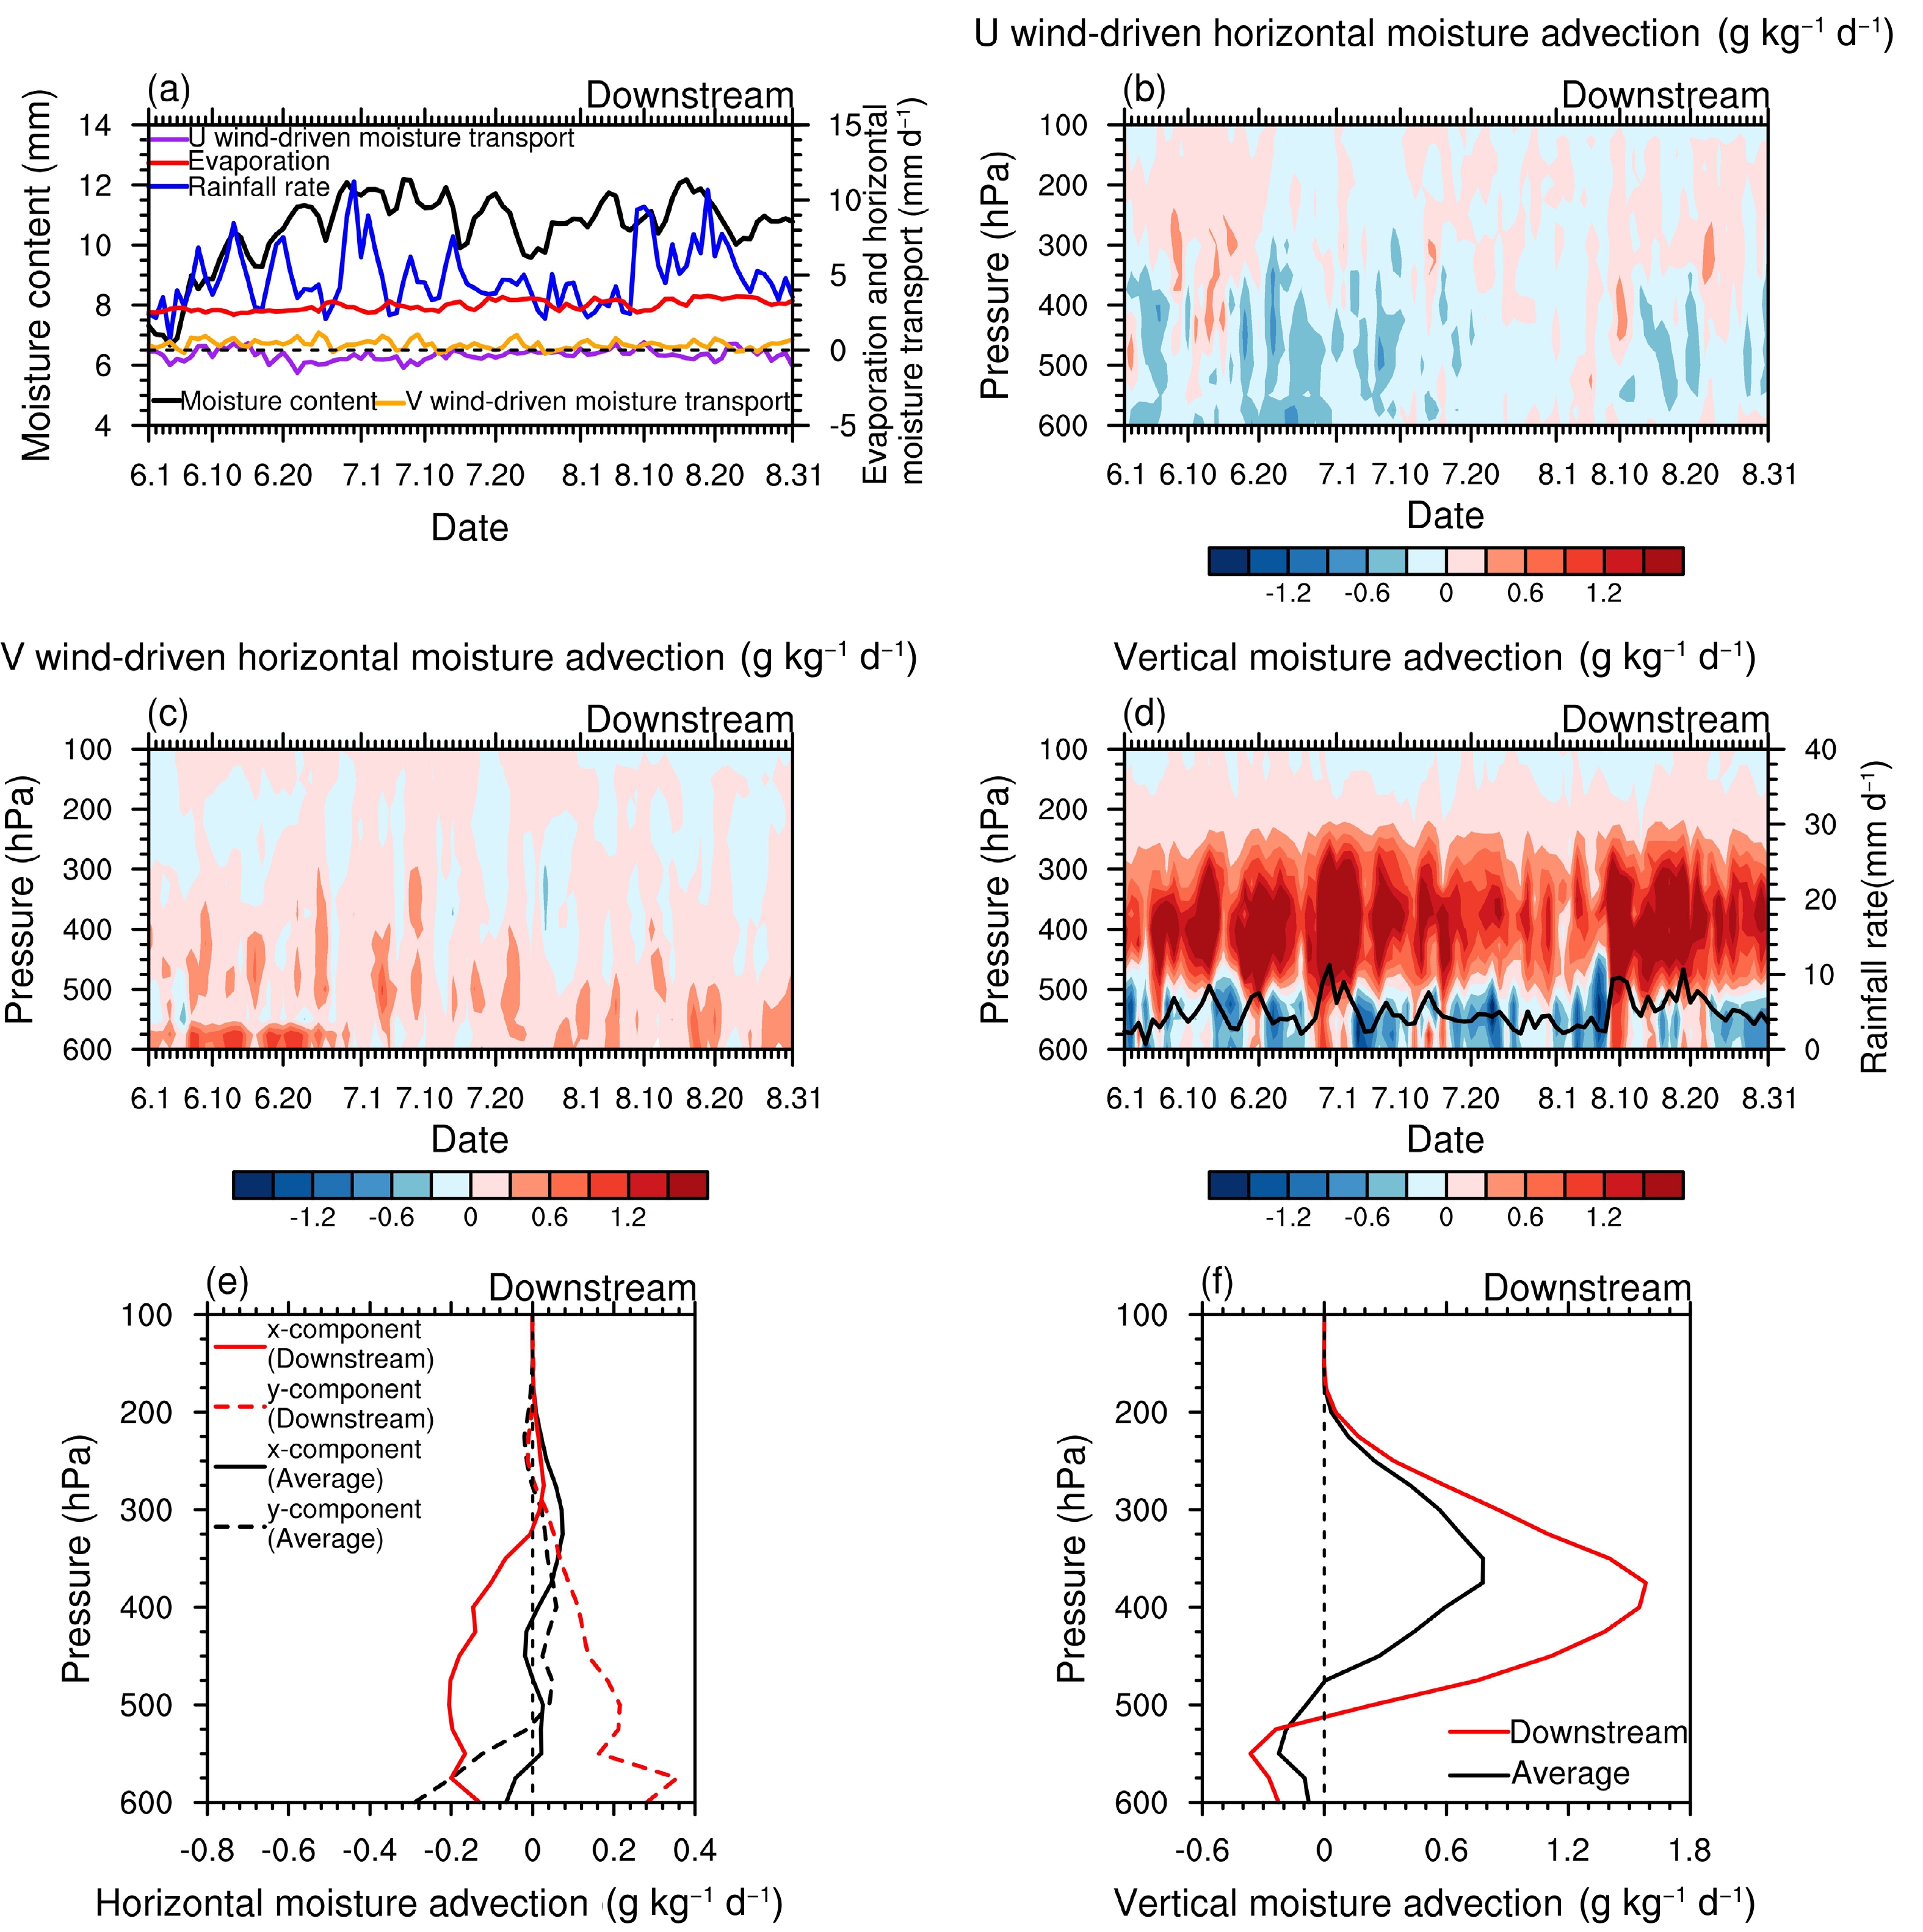
In the downstream region, the westerly-driven moisture transport is negative in summer (Figs. 8a, b and e). In contrast, strong southerly-driven wet advection can transport moisture from almost the whole troposphere (Figs. 8a, c and e) due to the remarkable influence of the summer monsoon (Figs. 3b, d and f), supplying large amounts of moisture to the downstream region (Figs. 8c and e). In the downstream region, there is very strong vertical wet advection in the whole summer. Its maximum is located at 375 hPa, and its intensity is nearly twice as strong as the maximum of the regional average (Figs. 8d and f), which can transport a large amount of moisture upward for convective consumption, thus producing the most abundant clouds and precipitation (Figs. 5h and i). However, from late July to early August, the downstream region is under the control of the easterly in the whole troposphere (figure not shown). At this time, the summer monsoon moves westward and the influence on the downstream region is broken, which makes the vertical wet advection weaken obviously (Fig. 8d), thus resulting in a significant reduction in high clouds and precipitation (Figs. 5h and i).
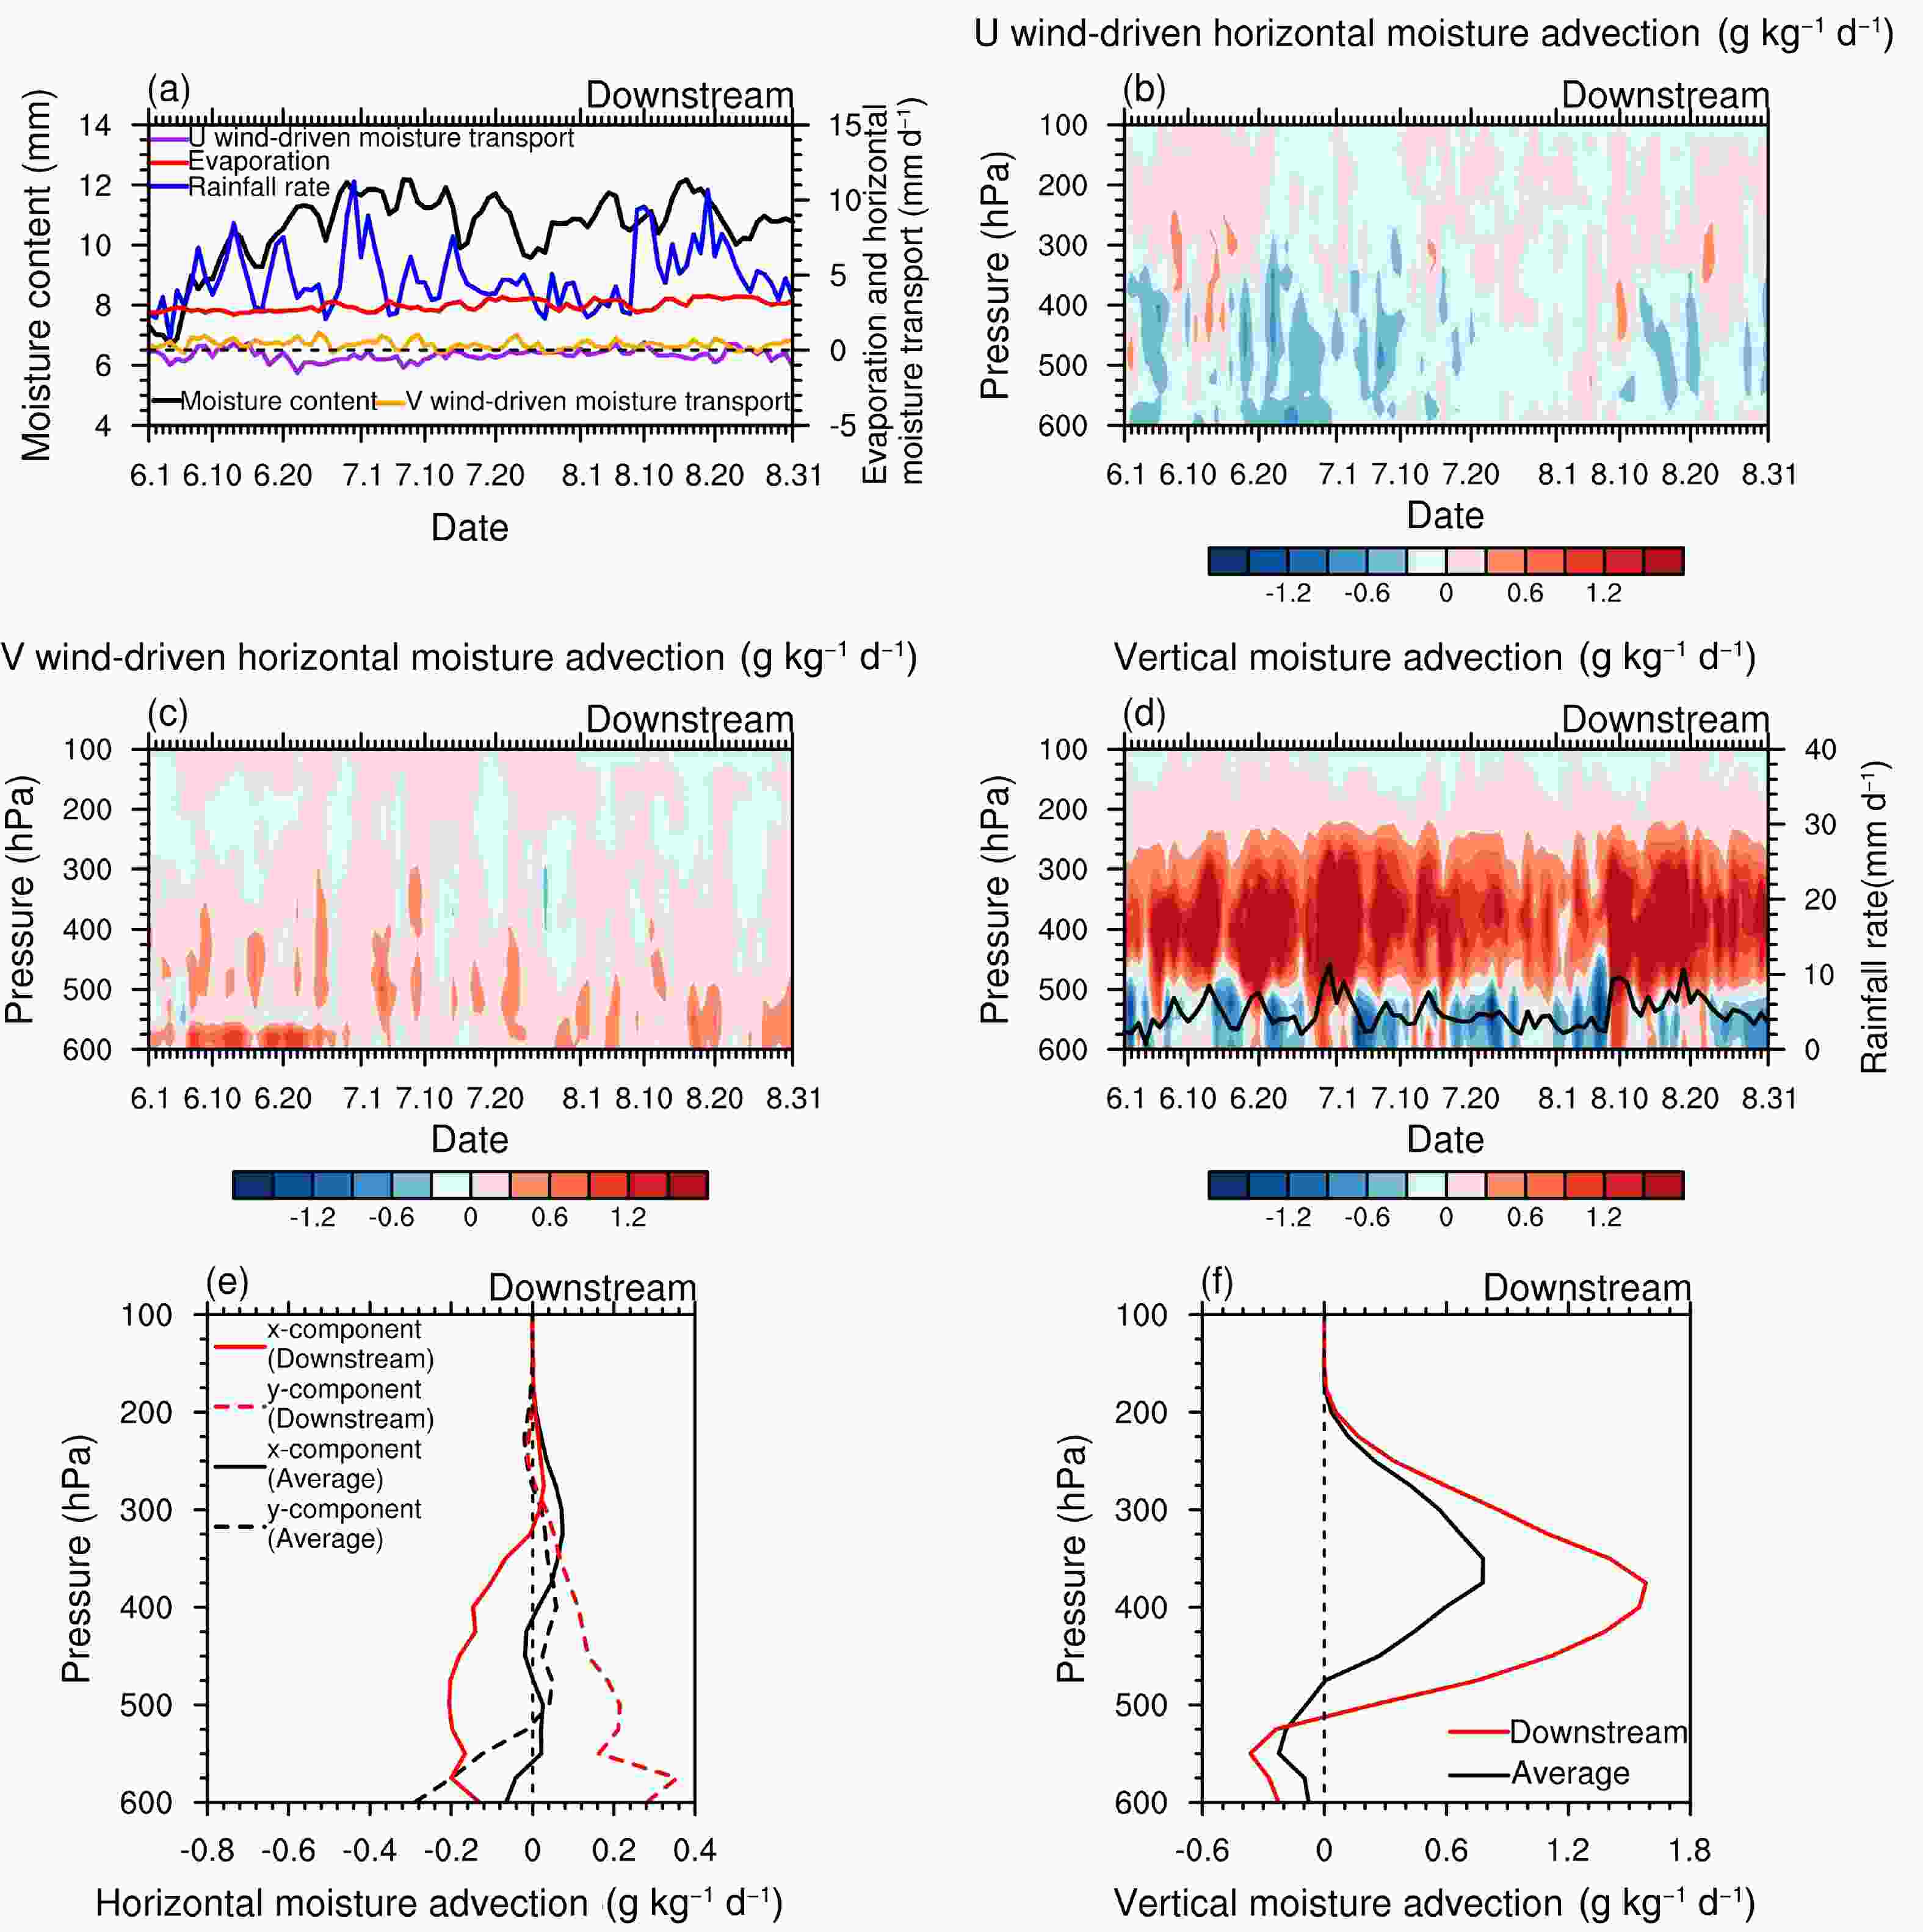
Figure 8. As in Fig. 6 but in the downstream region of the YZRB, which is represented by the red lines in (e) and (f).
The differences in moisture–cloud–precipitation features and moisture transport in the upstream, midstream, and downstream regions reflect the influence of the summer monsoon on the YZRB. The summer monsoon has already affected the downstream region in June (Figs. 3a and b) and caused obvious precipitation, with a peak on 30 June (Fig. 5i), while precipitation is rare in the upstream and midstream regions (Figs. 5c and f). From the end of June, the summer monsoon strengthens and extends westward to affect the midstream region (Figs. 3c and d), making the precipitation in the midstream region increase rapidly and reach a peak on 10 July (Fig. 5f). Then, under the continuous influence of the summer monsoon, the precipitation evolution in the midstream region is relatively stable (Fig. 5f). As the summer monsoon continues to advance westward (Figs. 3c–f), its influence on the upstream region gradually intensifies, until the precipitation reaches its maximum on 6 August in the upstream region (Fig. 5c). However, during this period, the summer monsoon influence on the downstream region is broken, resulting in a significant decrease of precipitation in the downstream region (Fig. 5i). After briefly affecting the upstream region, the summer monsoon retreats eastward rapidly and produces strong precipitation again in the downstream region around mid-August (Fig. 5i).
-
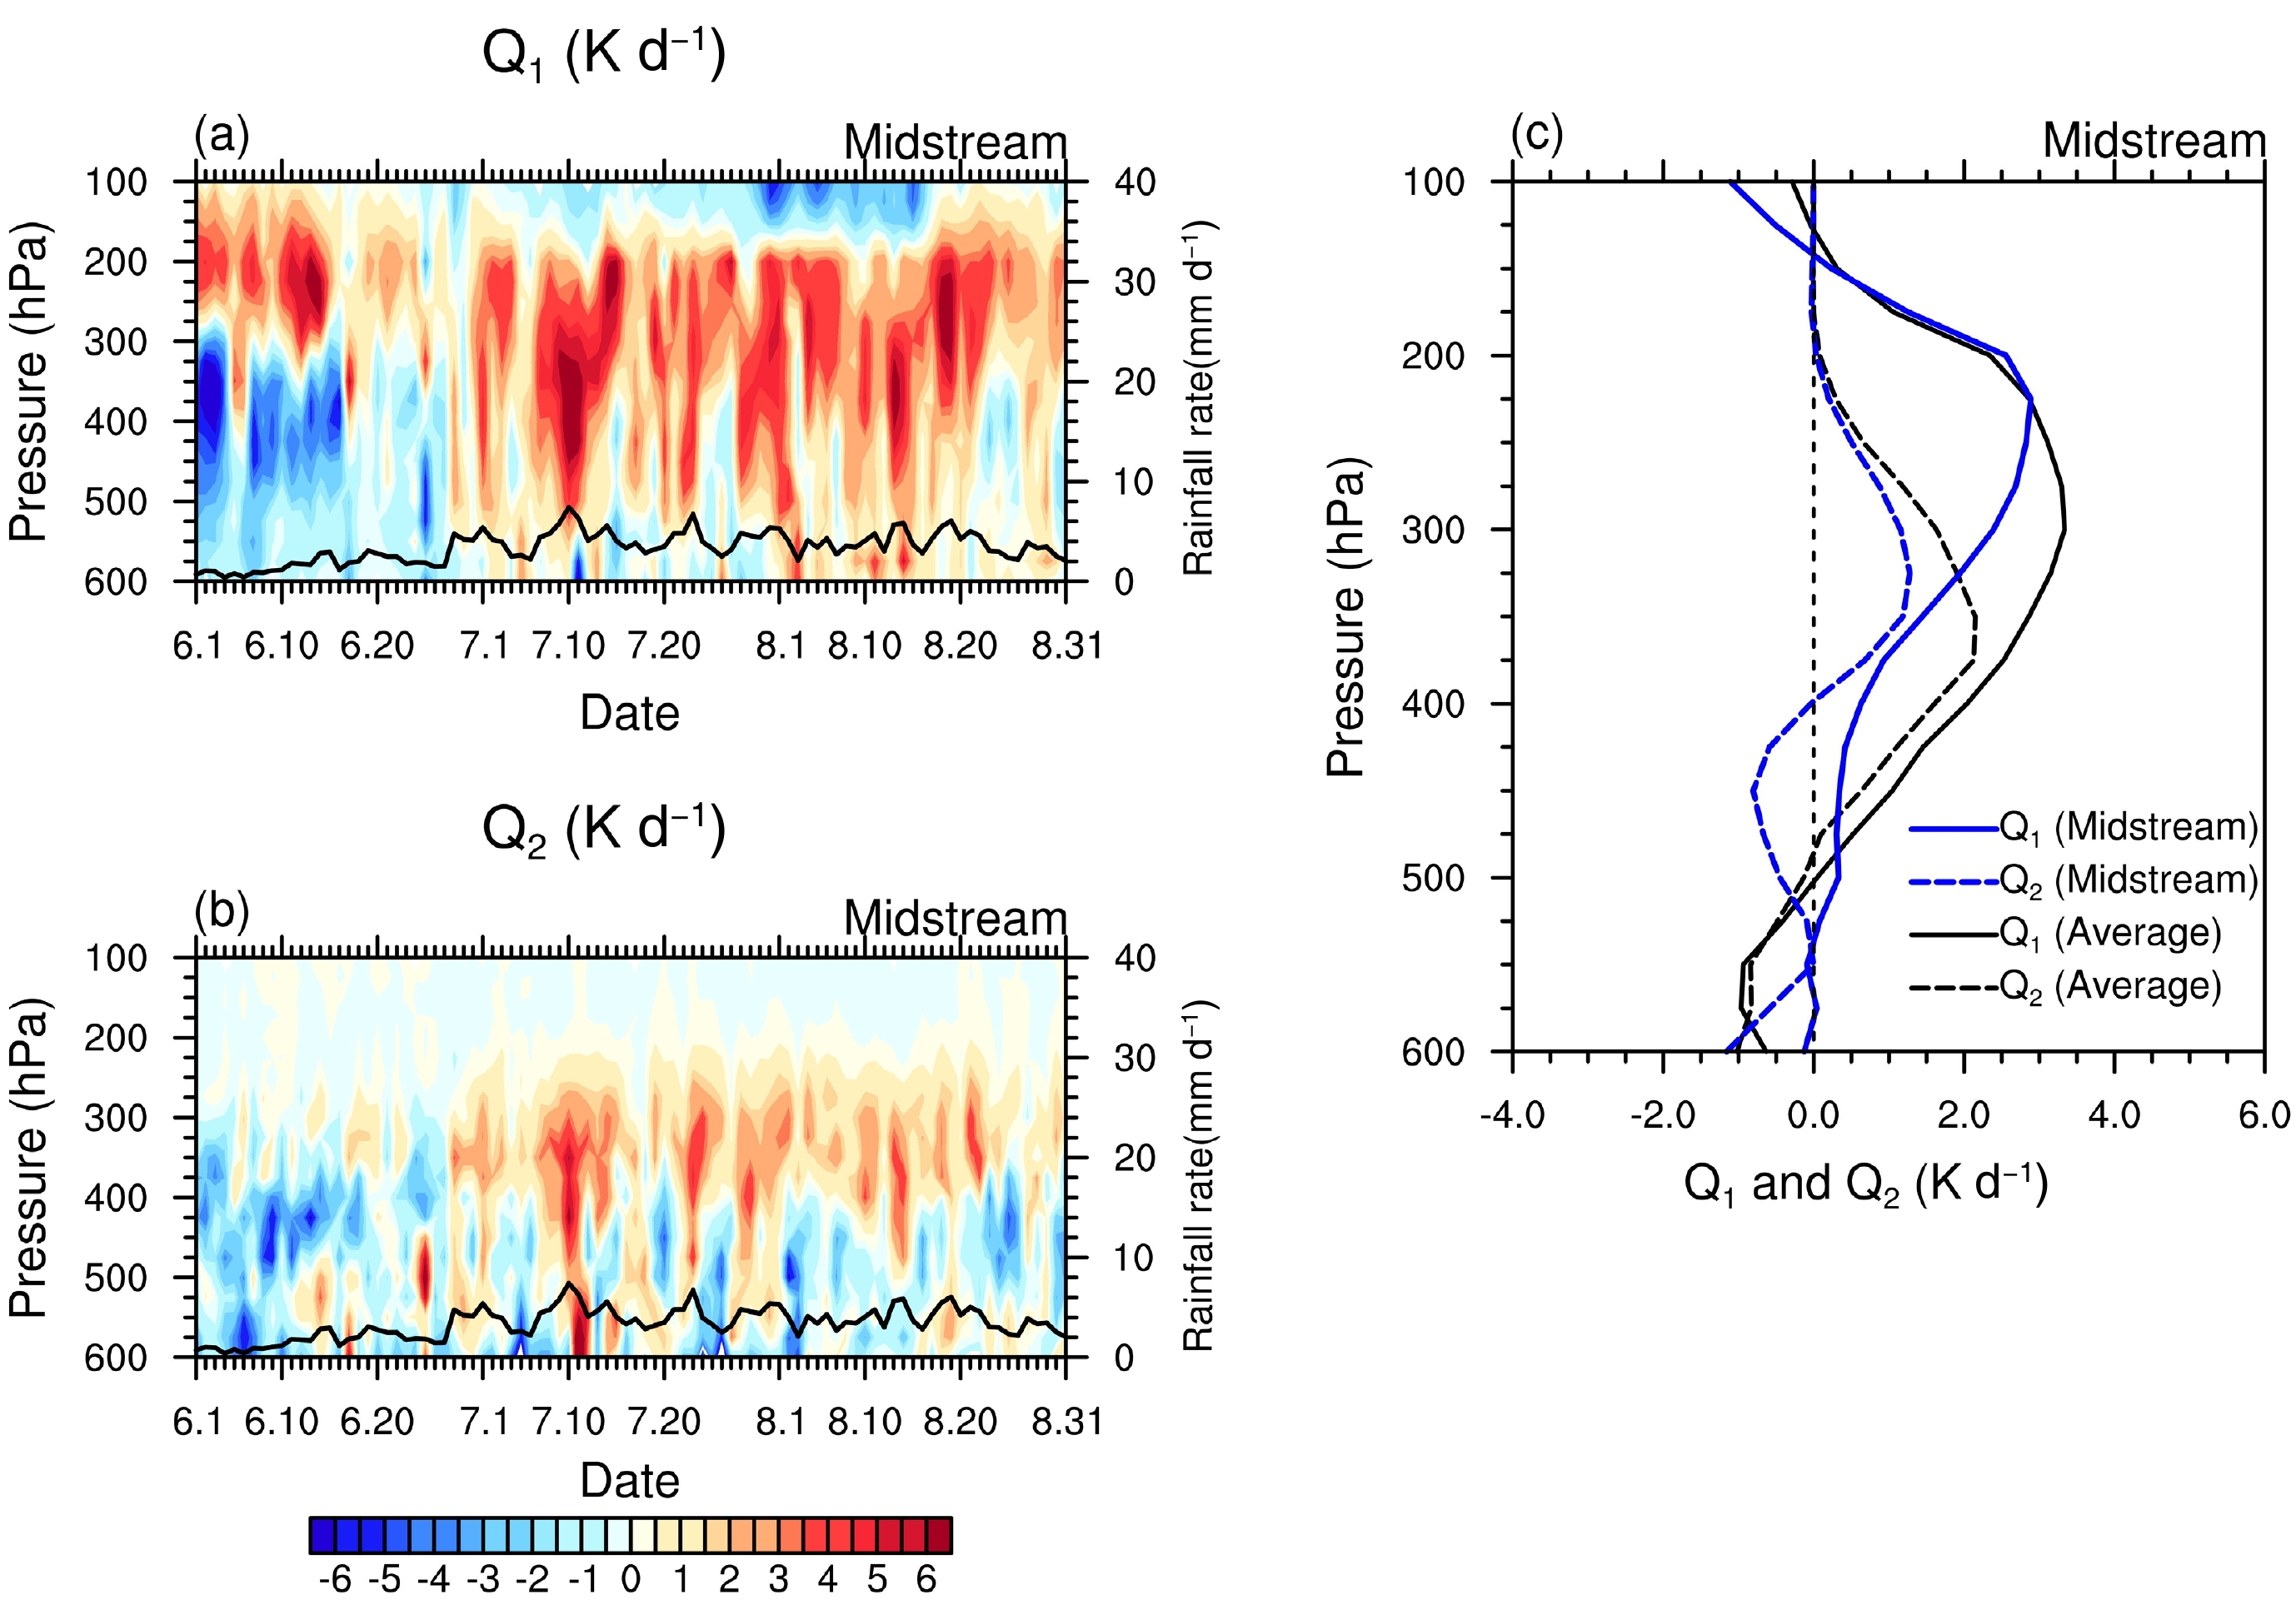
Moisture, cloud, and precipitation are different phases during the atmospheric water cycle, absorbing or releasing heat. The apparent heat source Q1 and apparent moisture sink Q2 defined by Yanai et al. (1973) can be regarded as the residuals of air-column heat and moisture budgets of large-scale motion over a limited area, and they play a role in relating large-scale circulation to convection, cloud type, and precipitation intensity (Yanai et al., 1973; Schumacher et al., 2007; Zhang et al., 2021a). Q1 represents diabatic heating that is associated with unresolved diabatic atmospheric processes, while Q2 mainly represents latent heating, which is the most important part of the diabatic heating (Schumacher et al., 2007; Zhang et al., 2021b) and closely associated with moisture condensation. From this perspective, Q2 links moisture change and latent heat release, so that it can describe how moisture is consumed. Therefore, in this section, Q1 and Q2 calculated by CVA are used to reflect the moisture consumption and its influence on the diabatic heating structure.
As shown in Yanai et al. (1973), Q1 and Q2 can be written as
where
$s = c_pT + gz$ is the dry static energy and$L$ is the latent heat rate.In addition,
$Q_1$ can also be expressed aswhere
$Q_{\mathrm{rad}}$ is the net radiative heating. It shows that$Q_1$ consists of three components: radiative heating, net latent heating, and vertical eddy transport of heat.Another form of
$Q_2$ is$Q_2$ consists of two components: net latent heating, and vertical eddy transport of moisture.It is noted that the latent heat of condensation is the most important component of atmospheric diabatic heating over the TP in the rainy season (Zhang et al., 2022b). Schumacher et al. (2007) gave the idealized latent heating profiles for different types of convection: The shallow convection has a heating maximum in the lower troposphere, while the deep convection heating maximum is in the mid-troposphere. The stratiform cloud has a heating maximum in the mid-to-upper troposphere and cooling in the lower troposphere. The strong cumulus cloud heats the lower troposphere and cools the mid-to-upper troposphere [see Fig. 1 of Schumacher et al. (2007)].
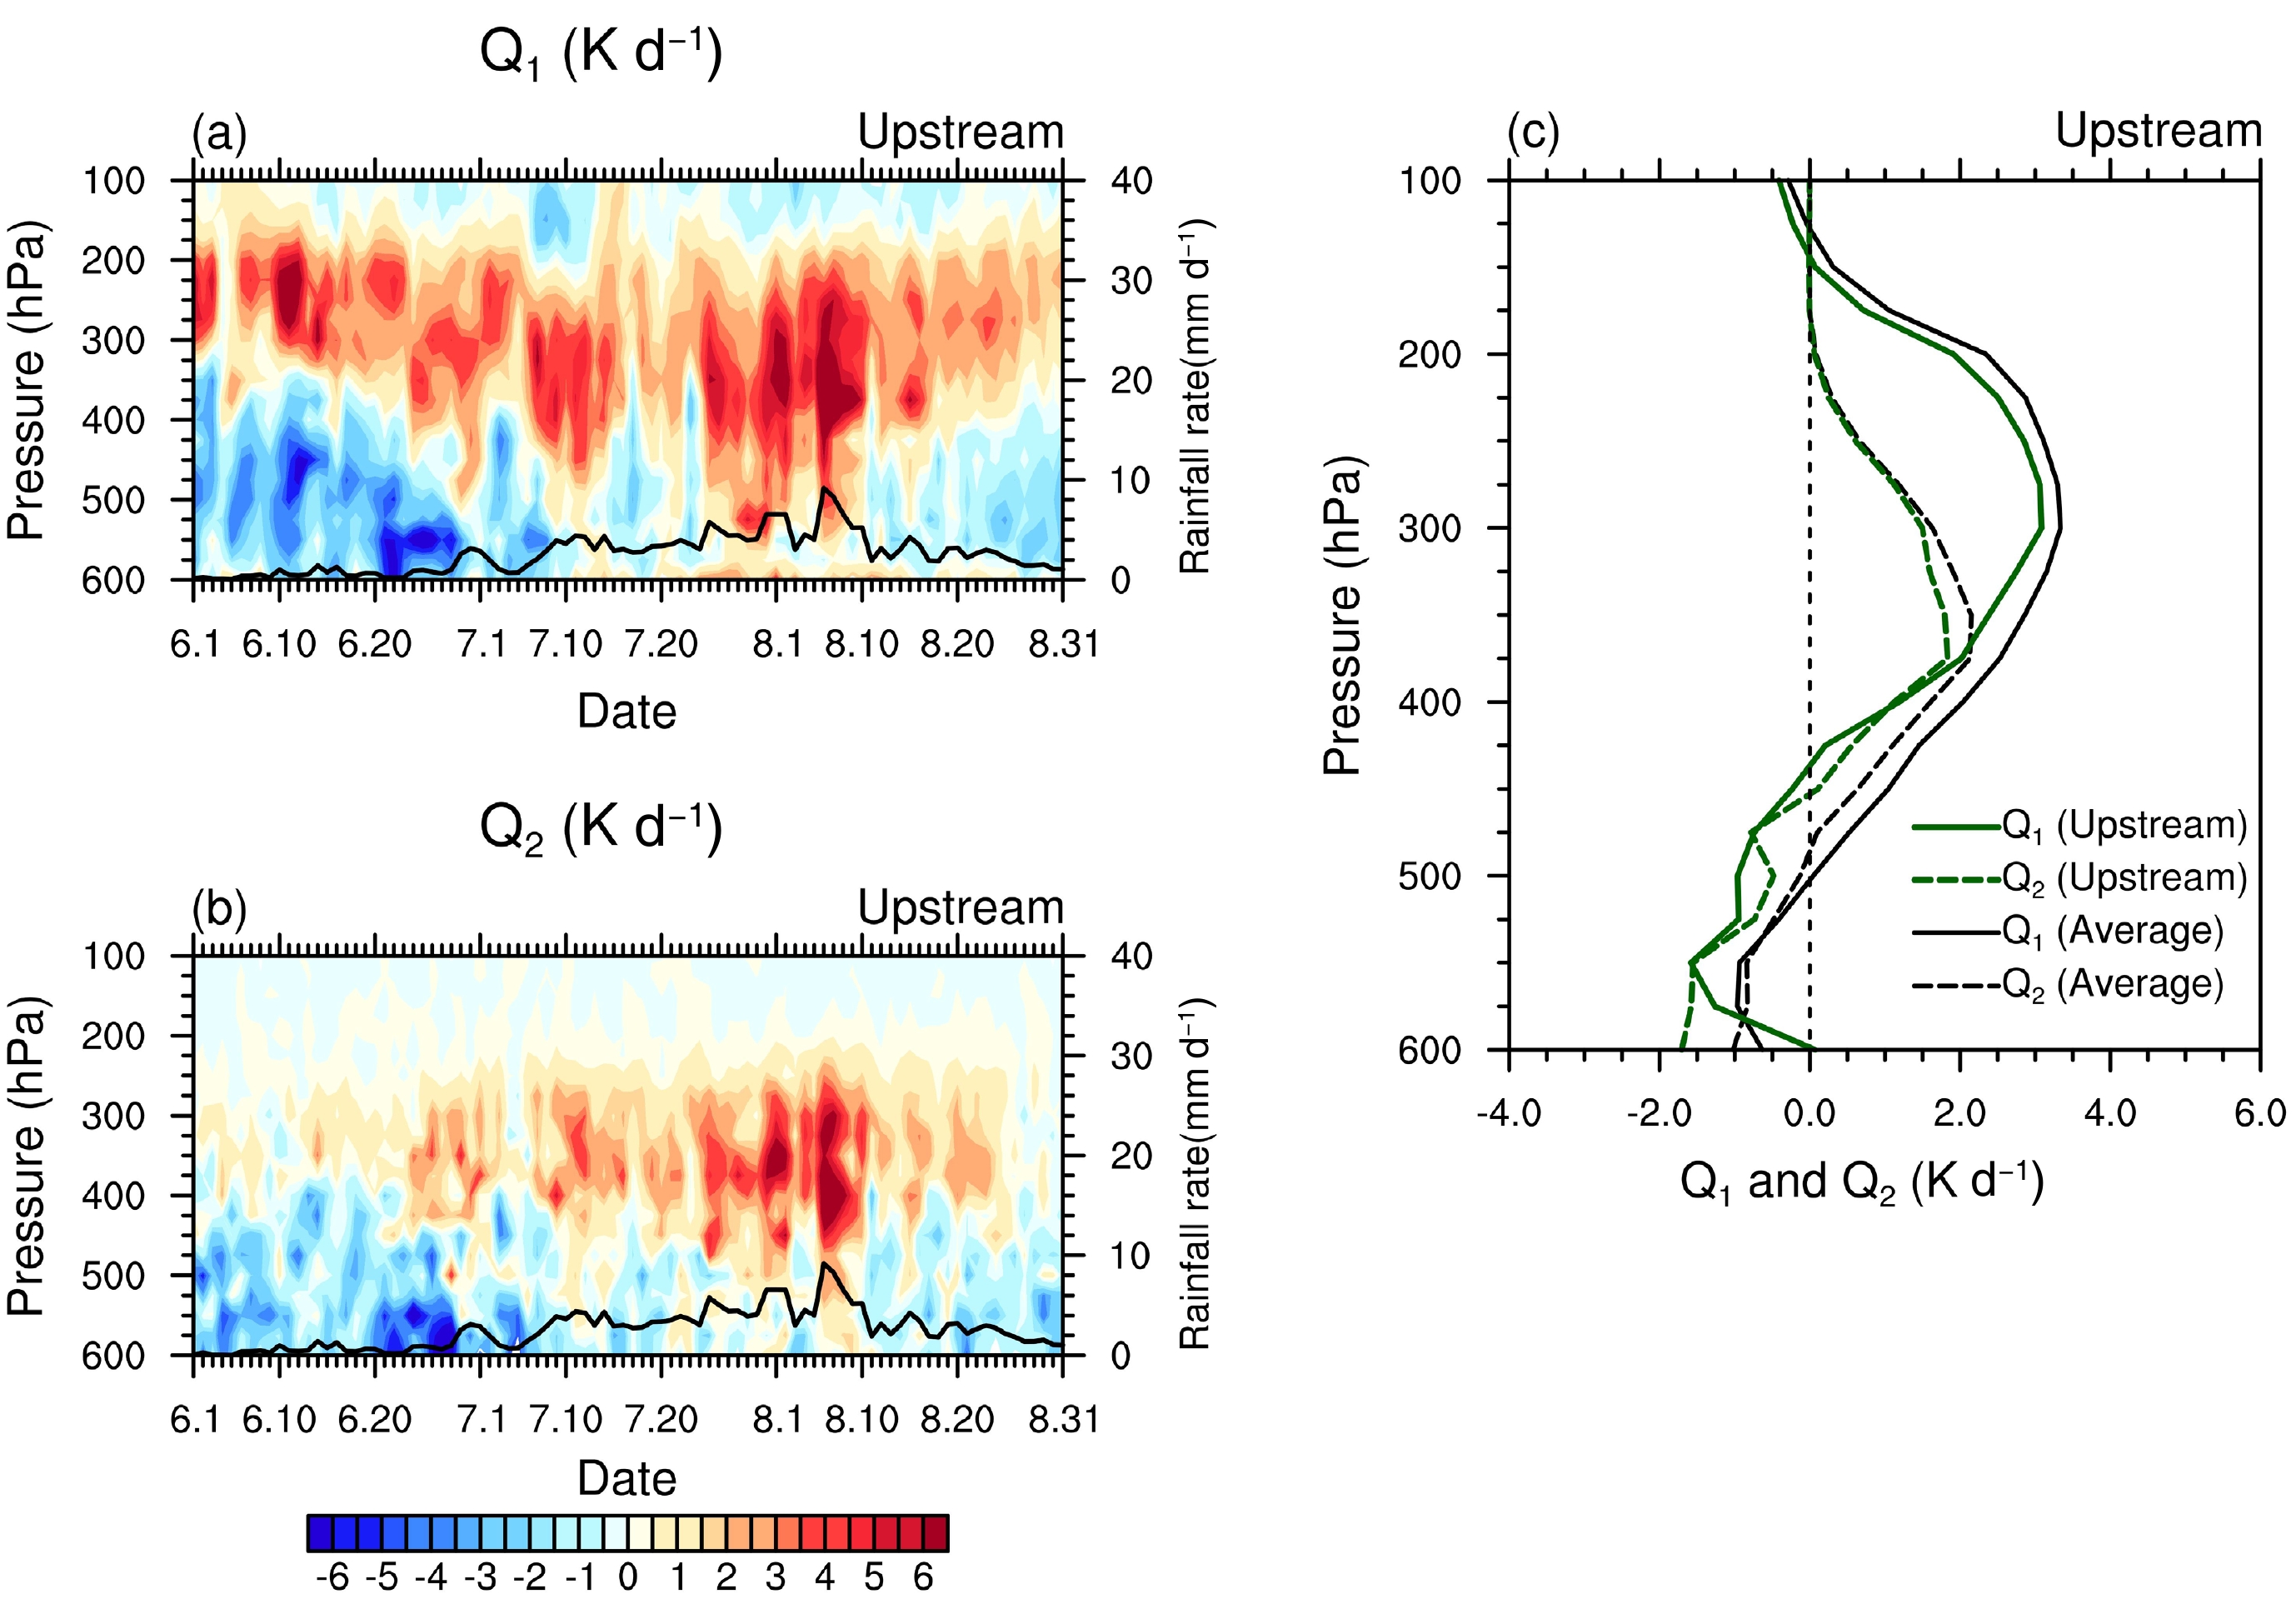
In the upstream region, the period-averaged profile of Q2 shows that the moisture evaporates below 450 hPa and condenses above 450 hPa, for which the moisture consumption maximum is located at 375 hPa, and above 200 hPa Q2 is close to zero due to scarce moisture content (Fig. 9c). The temporal evolution of Q2 is very similar to that of precipitation, indicating that moisture consumption is closely related to the intensity of precipitation (Fig. 9b). During June and early July, the strong evaporation is caused by both southerly-driven dry advection and vertical dry advection (compare Fig. 9b with Figs. 6c and d). From July to mid-August, the enhanced vertical wet advection produces the continuous enhancement of moisture consumption (compare Fig. 9b with Fig. 6d). The moisture consumption reaches its strongest in early August, and its vertical range can extend from 500 hPa to 200 hPa (Fig. 9b). In mid-August, the vertical dry advection causes increased moisture evaporation (compare Fig. 9b with Fig. 6d).
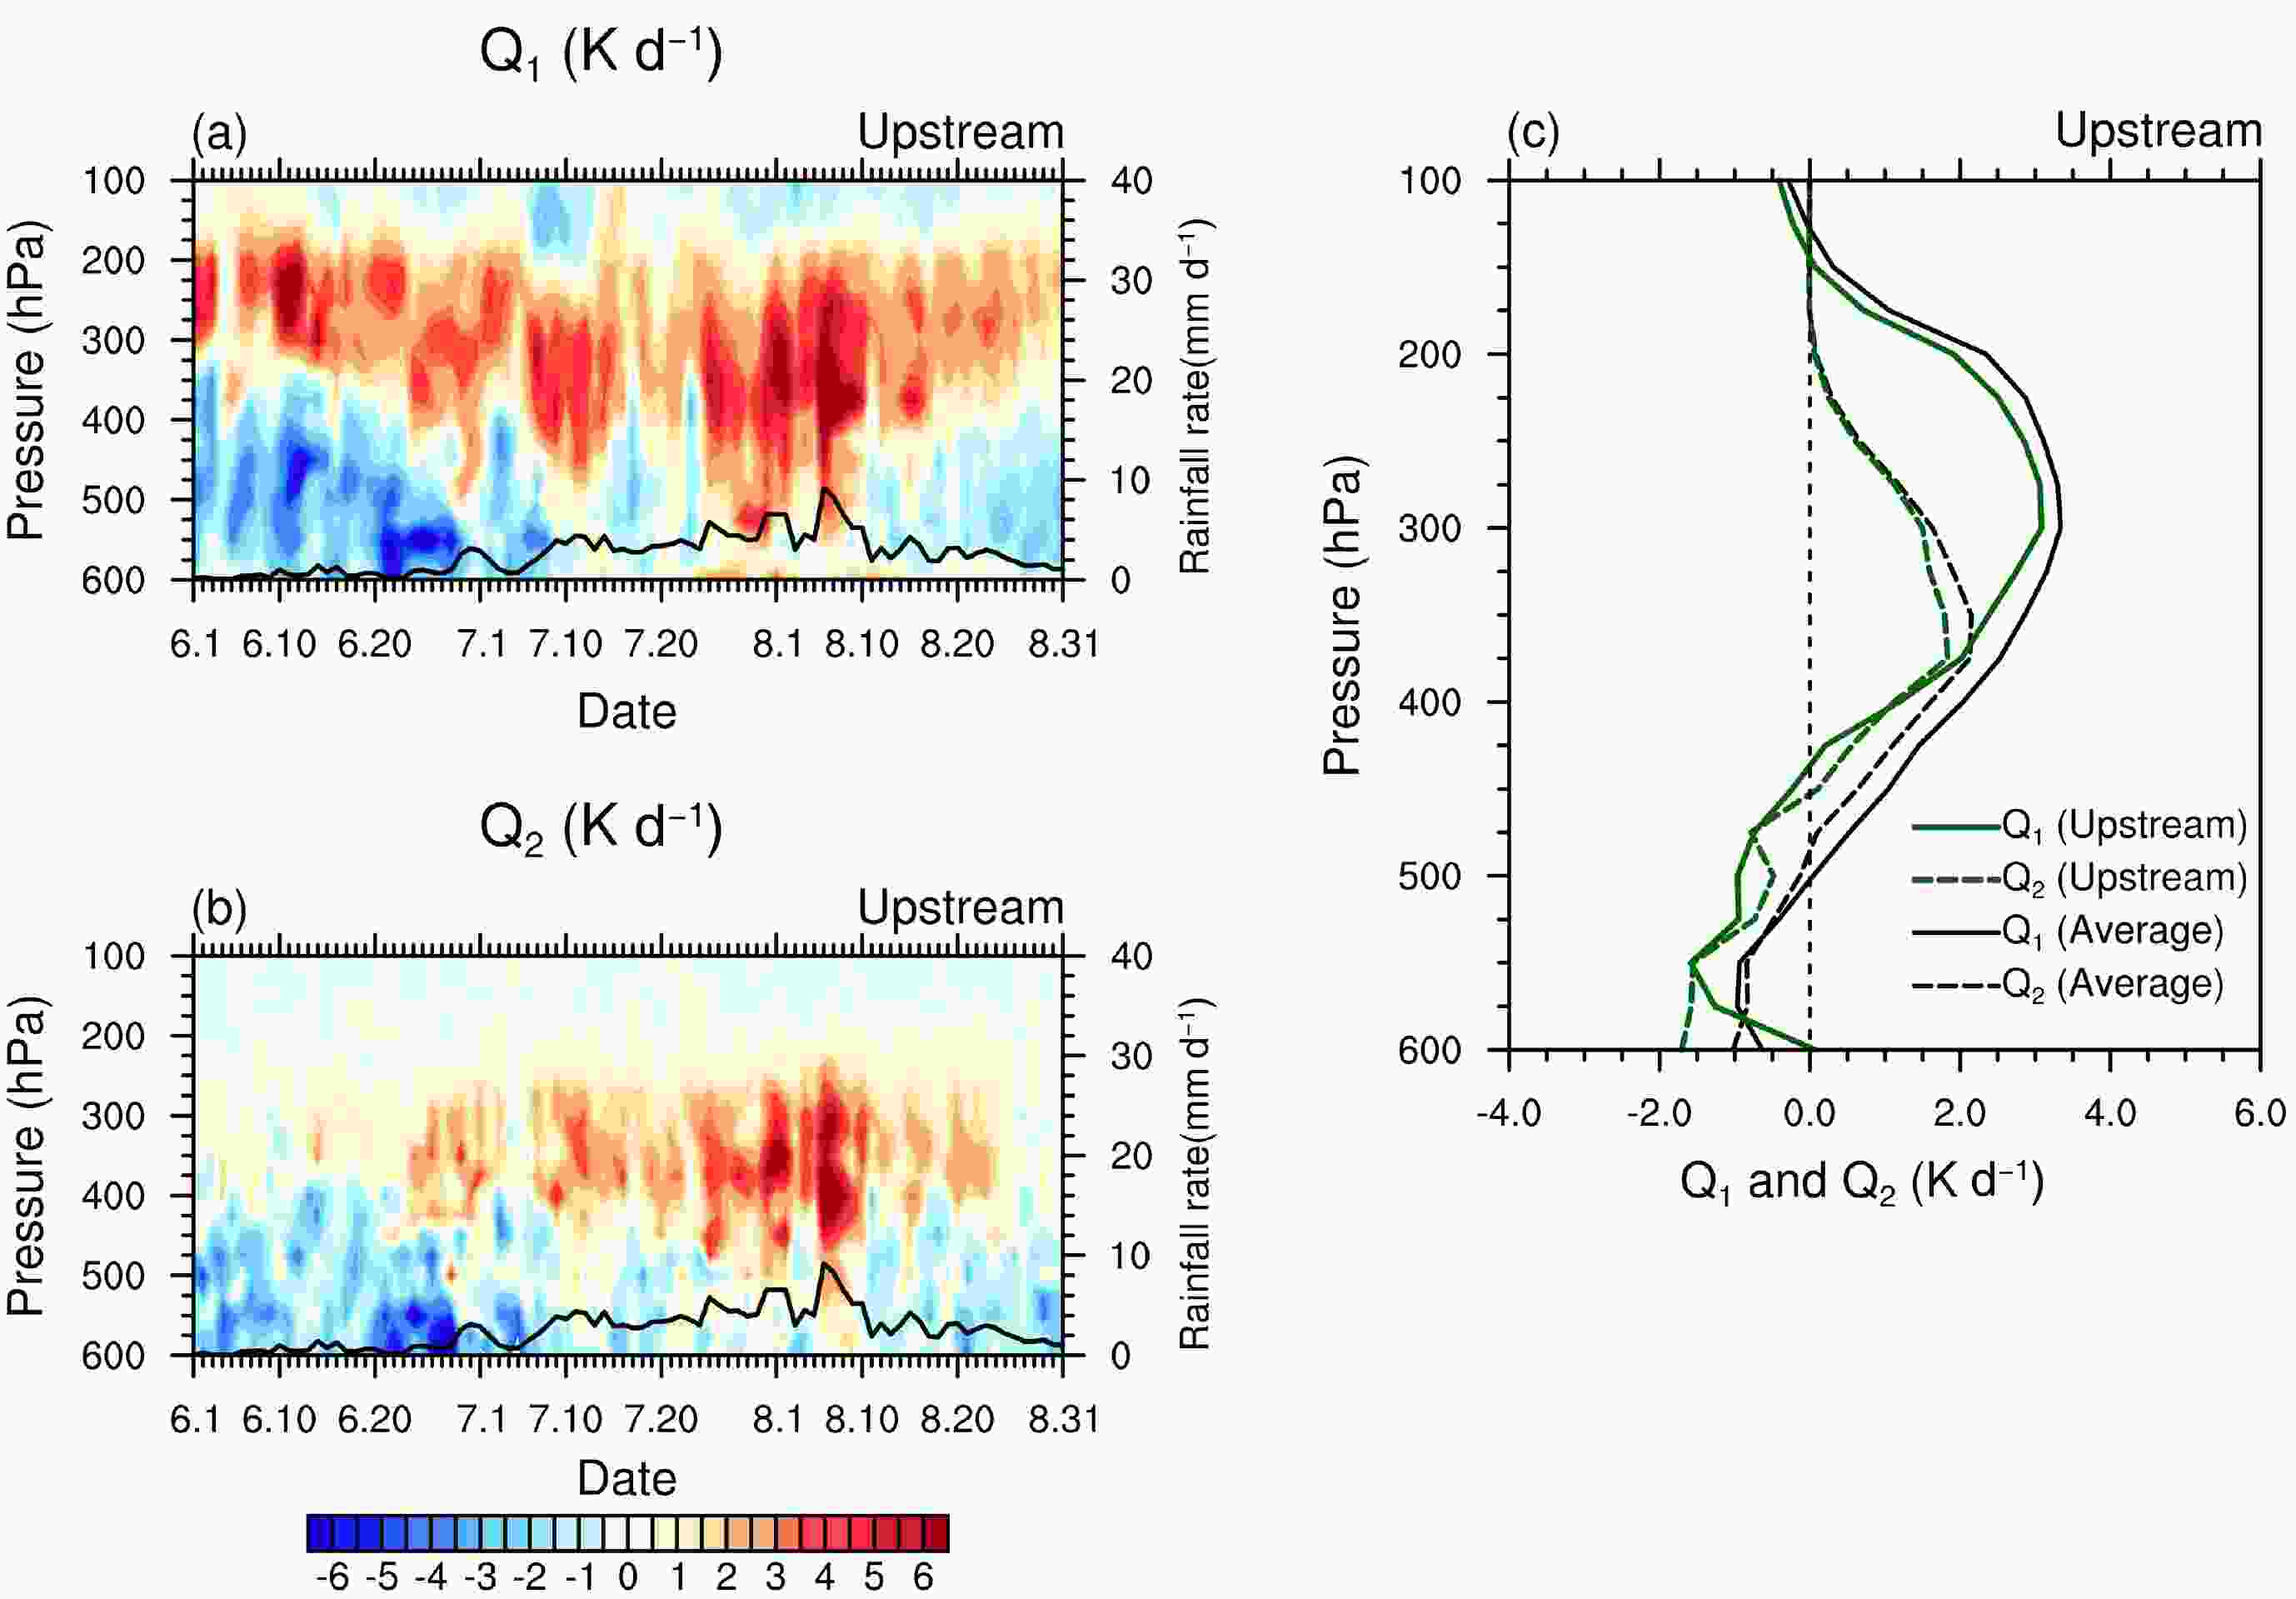
Figure 9. Time–pressure cross-sections of (a) apparent heat source Q1 (units: K d−1) and (b) apparent moisture sink Q2 (units: K d−1) in the upstream region of the YZRB. (c) Period-averaged profiles of Q1 (solid line) and Q2 (dashed lines) in the upstream region (green lines) and the regional average (black lines).
The latent heat released by moisture condensation is one of the most important factors affecting the heat source structure in the upstream region (Fig. 9). The intensity of Q1 and Q2 from 550 hPa to 375 hPa is approximately similar (Fig. 9c), implying that the heat source at this height is almost completely formed by the latent heating of condensation. Below 550 hPa, surface sensible heating weakens the cooling brought by evaporation. Above 375 hPa, Q1 is stronger than Q2, and the height of the heating maximum is higher than that of the drying maximum (Fig. 9c), indicating the impact of vertical eddy heat transport.
The period-averaged profile of Q1 in summer takes 300 hPa to 275 hPa as the location of the heating maximum and cools below 450 hPa, implying that the upstream region is mainly dominated by stratiform clouds in summer (Fig. 9c). In June, Q1 shows a vertical structure of heating in the upper troposphere and cooling in the mid-to-lower troposphere, with the heating maximum above 300 hPa (Fig. 9a), indicating that stratiform clouds dominate the upstream region in June. From early July, the cooling in the lower troposphere weakens significantly, while the heating in the mid-to-upper troposphere increases, and the height of the heating maximum moves down (Fig. 9a), implying that the proportion of deep convective clouds increases gradually. Until early August, strong heating covers almost the whole troposphere (Fig. 9a), which means the peak precipitation in the upstream region is caused by deep convection. In mid-to-late August, the vertical structure of Q1 is linked to stratiform clouds again (Fig. 9a).
Compared with the upstream region, the moisture condensation and evaporation in the midstream region are weaker. The moisture evaporates below 400 hPa and condenses above 400 hPa, with the maximum at 325 hPa, higher than in the upstream and downstream regions (Fig. 10c). This is due to the higher upward motion maximum in the midstream region (Fig. 4d), which can bring moisture to a higher level for consumption. In June, the vertical dry advection results in strong evaporation, while little moisture in the mid-to-upper troposphere can be condensed. From the end of June to the end of August, 400 hPa to 200 hPa is the main layer of moisture consumption in the upward process. Evaporation still exists in the mid-to-lower troposphere, and moisture consumption can appear in the whole troposphere only in several heavy precipitation processes (Fig. 10b).
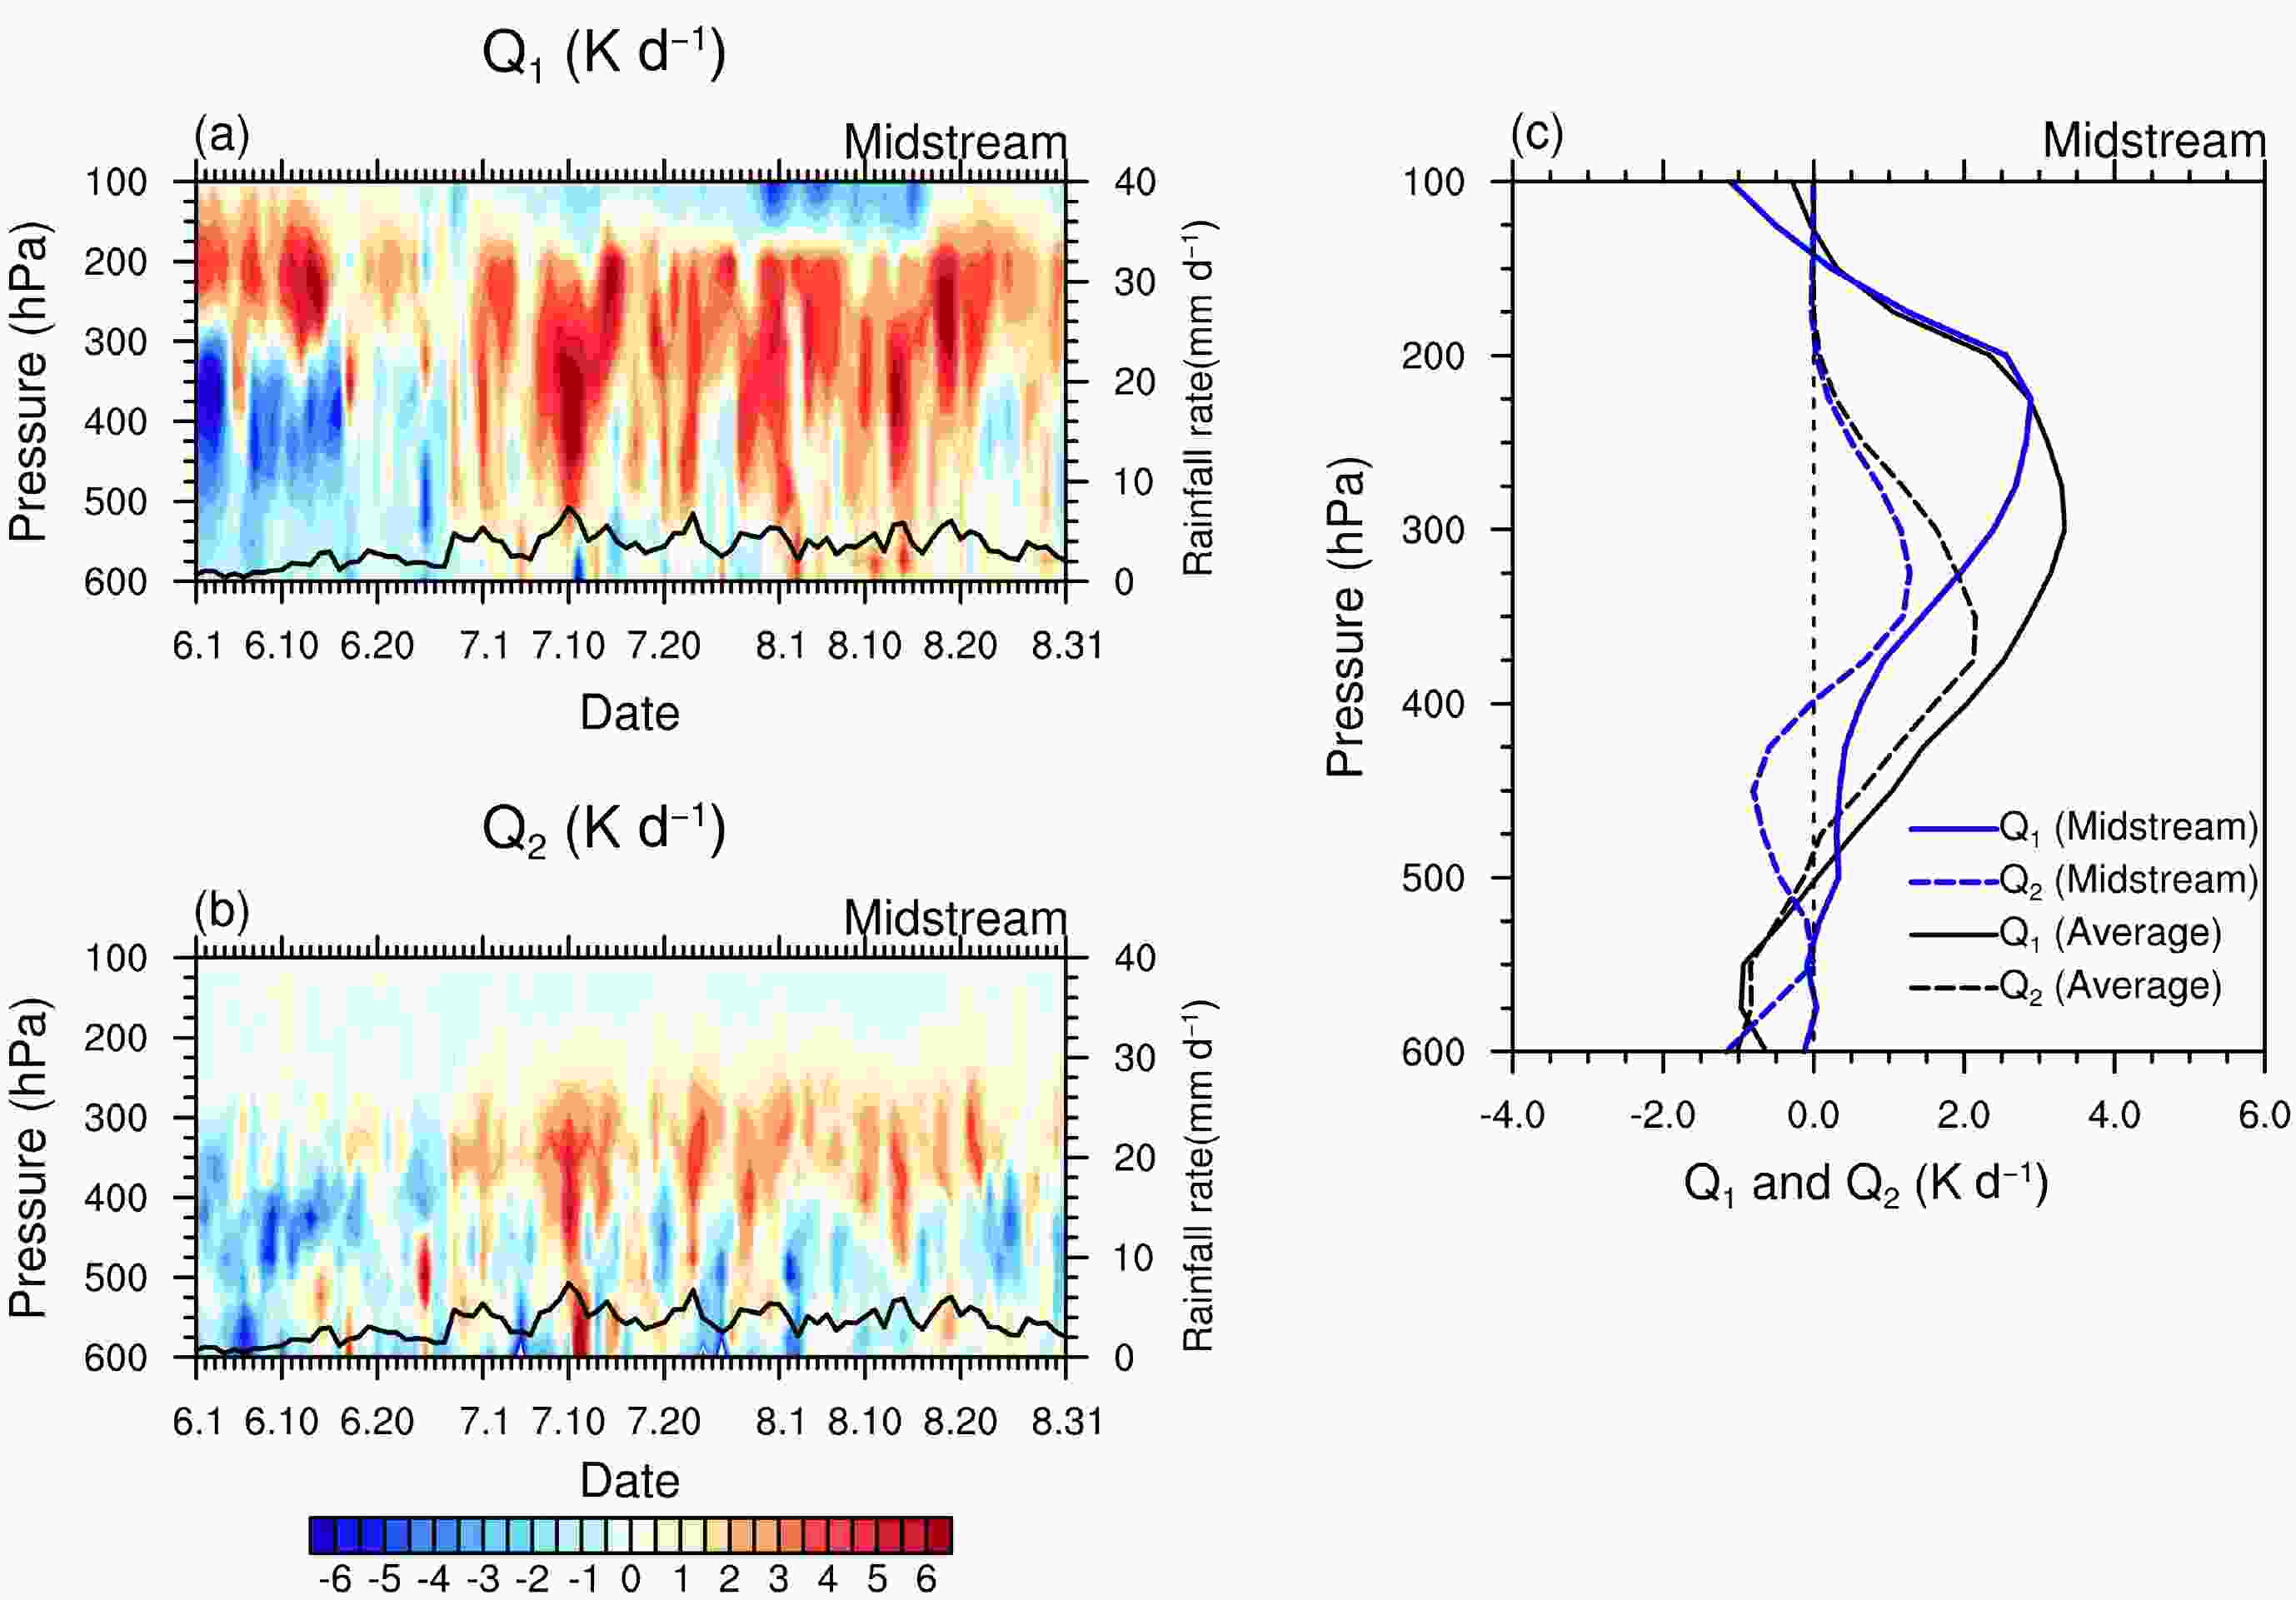
Figure 10. As in Fig. 9 but in the midstream region of the YZRB, which is represented by the blue lines in (c).
In summer, the period-averaged profile of Q1 acts as heating in the whole troposphere, and its intensity is stronger than Q2 at almost every level. Furthermore, the heating maximum can reach twice as strong as the drying maximum, and the height of the heating maximum is also higher than that of the drying maximum (Fig. 10c). This indicates that, in addition to the latent heat of condensation, vertical eddy transport of heat is also very important in the formation of the heat source in the midstream region.
The heating profile of Q1 has the highest maximum at 225 hPa, and the lower troposphere maintains a weak heating effect (Fig. 10c), which is mainly linked to stratiform clouds and relatively weak deep convective activities. The proportion of stratiform clouds and deep convective clouds varies at different precipitation intensities. In June, the vertical structure of heating in the upper levels and cooling in the mid-to-lower levels (Fig. 10a) indicates that weak precipitation is basically generated by stratiform clouds. From the end of June to the end of August, heating in the lower troposphere is enhanced, and moderate precipitation at this time is generated by both stratiform clouds and deep convective clouds, while heavy precipitation processes are produced by deep convective activities, resulting in strong heating in the whole troposphere (Fig. 10a).
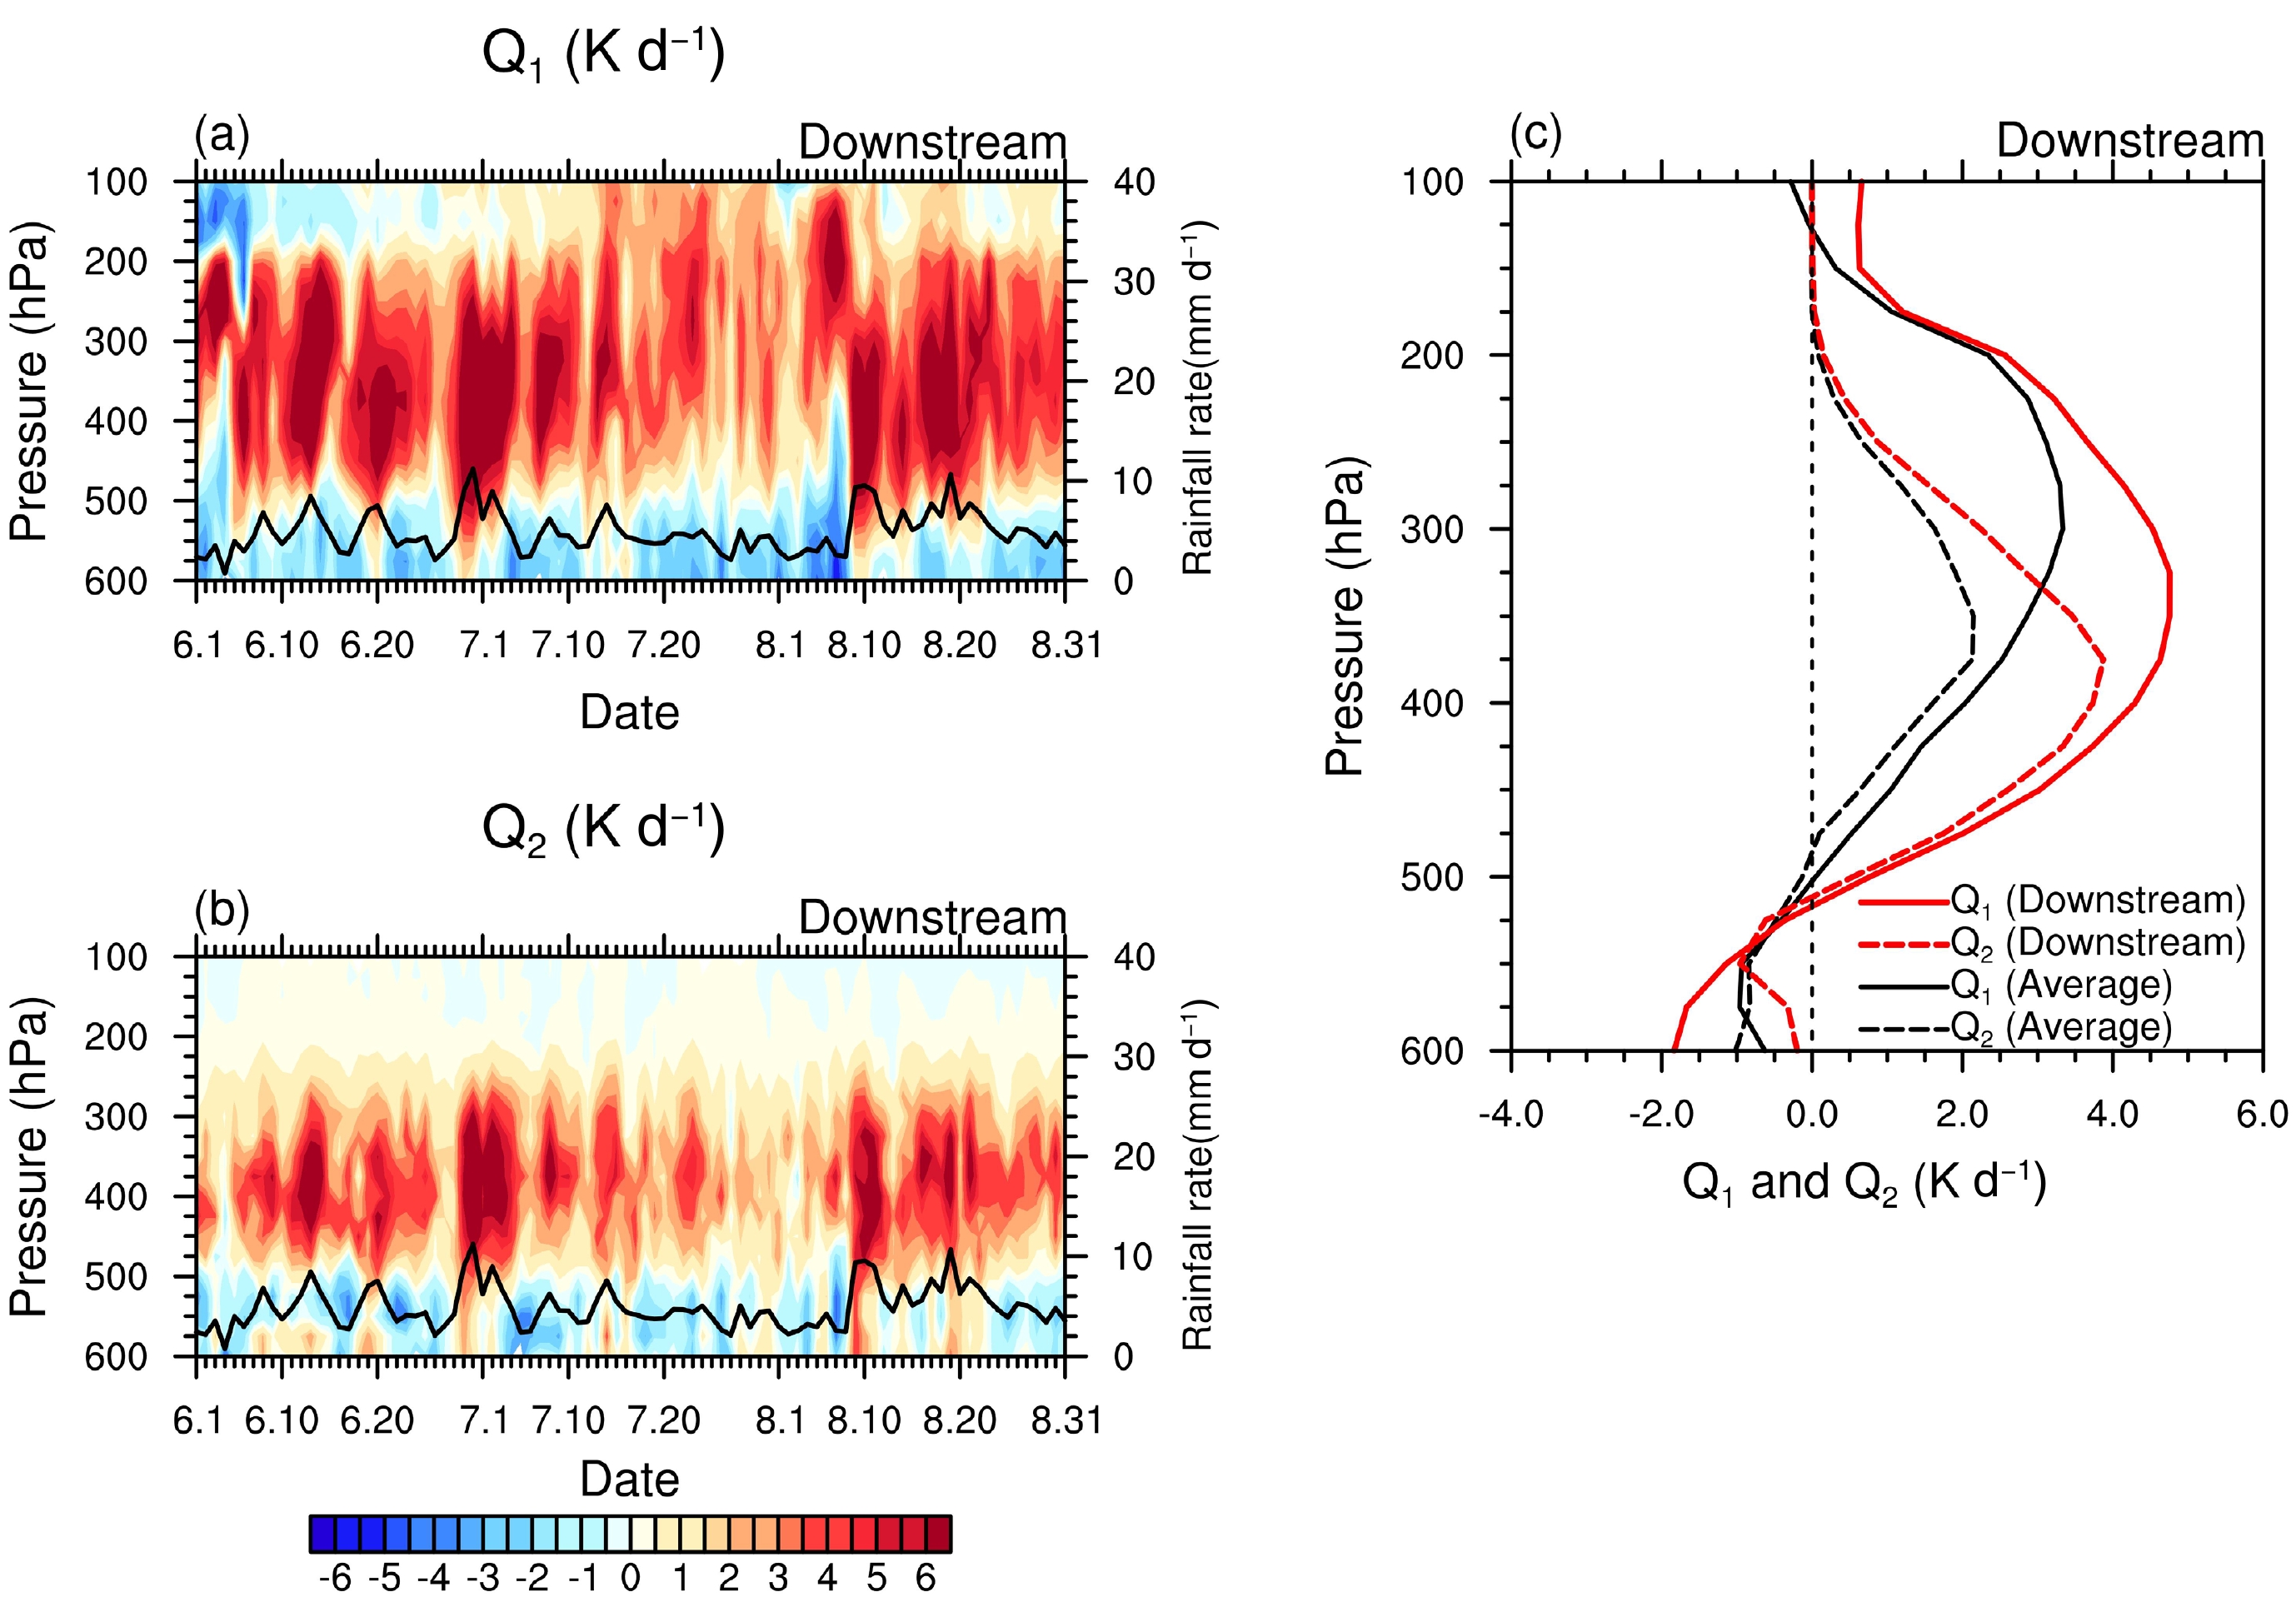
The moisture condensation in the downstream region is much stronger than that in the upstream and midstream regions. Almost the whole troposphere is in the process of moisture consumption, and its maximum is located at 375 hPa (Figs. 11b and c). Most moisture consumption is generated in the upward process of moisture by vertical wet advection (compare Fig. 11b with Fig. 8d). The latent heat produced by moisture condensation plays a more important role in the formation of the heat source in the downstream region than in the upstream and midstream regions (Fig. 11c). There is the strongest diabatic heating in the downstream region of the YZRB. The broad strong heating above 525 hPa can last the whole summer and even reaches upward to 100 hPa (Fig. 11a). The diabatic heating maximum is located at about 350 hPa in the mid-troposphere (Fig. 11a), implying that precipitation is generated by deep convective clouds.
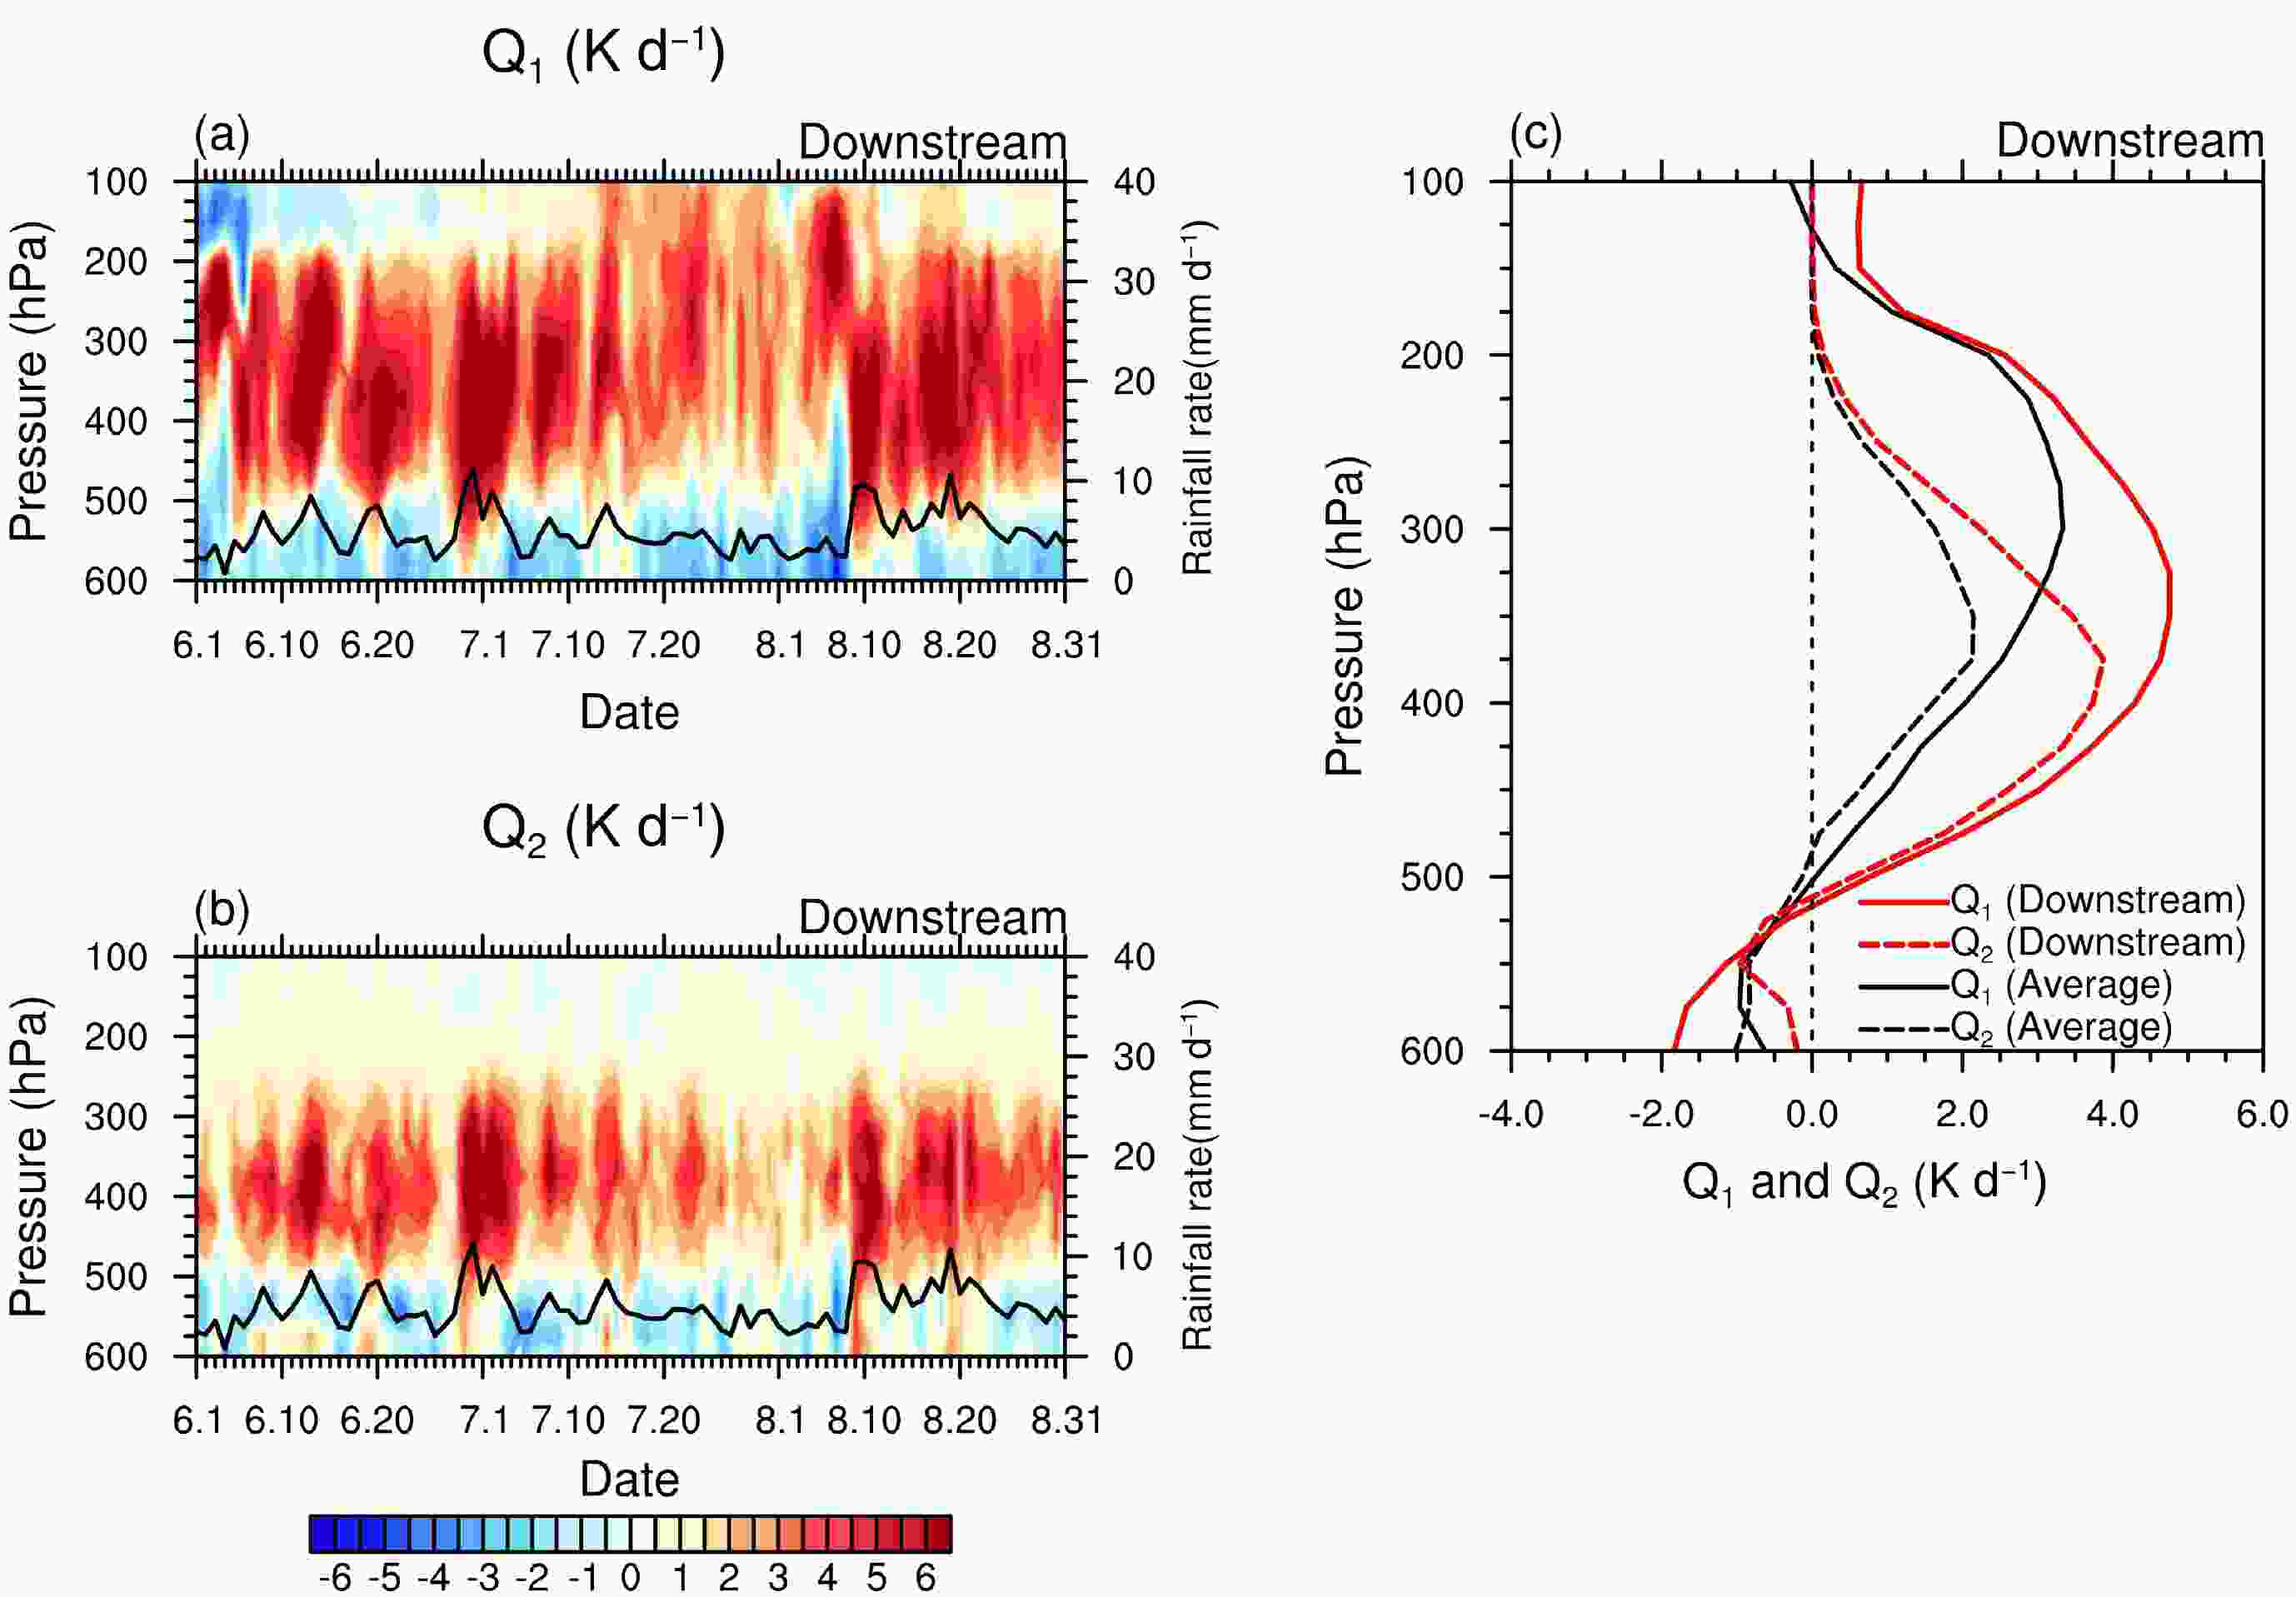
Figure 11. As in Fig. 9 but in the downstream region of the YZRB, which is represented by the red lines in (c).
-
The aim of this study is to explore and compare the atmospheric water cycle, as well as the moisture sources and consumption, in the STP–YZRB under the transition influence of the westerly and summer southerly monsoon, based on a five-year-averaged summer, physically consistent atmospheric analysis dataset calculated from surface, balloon-sounding, and satellite measurements. The upstream, midstream, and downstream regions of the YZRB are selected as the typical analysis domains for the STP. From an observational perspective, the relative contributions and regional differences of the westerly and southerly in summer moisture transport are compared. The vertical structure of the vertical moisture advection and its contribution to the moisture–cloud–precipitation cycle are presented. The maximum height of the moisture consumption and its contribution to the heat source are discussed. Furthermore, according to the heat source structures, the dominant cloud-precipitation types in each region of the YZRB are determined. The principal conclusions can be summarized as follows:
The YZRB is under the combined influence of the westerly and summer monsoon from June to August. In June, the YZRB is mainly controlled by the westerly, with the jet maximum at 200 hPa, and the vertical motion is weak. But from July to August, the YZRB is mainly affected by the summer monsoon, in which the vertical motion is significantly strengthened. The horizontal moisture advection is significantly affected by the westerly and the summer monsoon. Due to the enhanced summer monsoon, the westerly-driven wet advection weakens and the southerly advection strengthens from the west to east. The vertical moisture advection is much stronger than the horizontal, which significantly increases the moisture content in the upper levels to form a high cloud fraction and precipitation. The summer precipitation mainly generated by high clouds increases from west to east of the YZRB, with an average of 3.6 mm d−1. The moisture consumption is closely related to the precipitation intensity, and the latent heat released by moisture condensation is one of the most important contributors to the heat source in the YZRB. The vertical structure of the diabatic heating indicates that the summer cloud and precipitation types over the YZRB include both stratiform and deep convective clouds, and the proportion of deep convective activities is also strengthened from west to east.
In the upstream region of the YZRB, which is significantly affected by the westerly, the external moisture supply is contributed by westerly-driven wet advection throughout the whole summer. The upstream region shows the weakest moisture, cloud fraction, and precipitation among the three regions, with a precipitation peak on 6 August. The moisture condensation maximum is located at 375 hPa. The diabatic heating profile implies stratiform clouds dominate the upstream region.
In the midstream region of the YZRB, the transition between the westerly and summer southerly monsoon at the end of June leads to a dramatic abrupt change in the atmospheric water cycle. In June, the westerly-driven wet advection forms a net moisture input. From July to August, the southerly-driven moisture advection and vertical moisture advection become positive. The precipitation increases significantly and reaches its peak on 10 July. The maximum moisture condensation layer is located at 325 hPa. The cloud types in the midstream region are mainly linked to stratiform clouds and relatively weak deep convective activities, and their proportion varies at different precipitation intensities.
In the downstream region of the YZRB, the strong southerly-driven moisture advection transports more moisture in almost the whole troposphere, due to the remarkable influence of the summer monsoon. The rich moisture and strong vertical wet advection produce the most abundant clouds and precipitation. Precipitation in this region is mainly generated by the deep convective systems with a cloud top above 300 hPa, and shows peaks on 30 June (strongest) and 19 August (relatively weaker). At the same time, a large amount of moisture condenses in the upward transport, with a maximum at 375 hPa.
These results provide a detailed comparison of the summer atmospheric water cycle, including moisture transport, sources, and consumption in the upstream, midstream, and downstream regions of the YZRB, from an observational perspective. However, the research period of the analysis dataset is from June to August, 2014 to 2018, which only represents the average atmospheric conditions during this period. The period should be expanded to obtain more general features of the atmospheric water cycle in the YZRB. In addition, there is a complex interaction between the westerly and the summer monsoon. This study only compares the connections and differences in the atmospheric water cycle among the three regions when the westerly or the summer monsoon dominates the YZRB. A deeper understanding of the mechanism of influence of the synergistic effect of the westerly and the summer monsoon on the atmospheric water cycle is necessary. The CVA method can generate analysis data with high temporal resolution (1 h), which can be used for a diurnal analysis of the atmospheric water cycle, to understand the moisture structure in the YZRB from more perspectives.
Acknowledgements. This study is supported by The Second Tibetan Plateau Scientific Expedition and Research (STEP) program (2019QZKK0105), the National Natural Science Foundation of China (91437221, 91837204).
Summer Atmospheric Water Cycle under the Transition Influence of the Westerly and Summer Monsoon over the Yarlung Zangbo River Basin in the Southern Tibetan Plateau
- Manuscript received: 2023-05-10
- Manuscript revised: 2023-08-15
- Manuscript accepted: 2023-10-17
Abstract: This study compares the summer atmospheric water cycle, including moisture sources and consumption, in the upstream, midstream, and downstream regions of the Yarlung Zangbo River Basin in the southern Tibetan Plateau. The evolutions of moisture properties under the influence of the westerly and summer southerly monsoon are examined using 5-yr multi-source measurements and ERA5 reanalysis data. Note that moisture consumption in this study is associated with clouds, precipitation, and diabatic heating. Compared to the midstream and downstream regions, the upstream region has less moisture, clouds, and precipitation, where the moisture is brought by the westerly. In early August, the vertical wet advection over this region becomes enhanced and generates more high clouds and precipitation. The midstream region has moisture carried by the westerly in June and by the southerly monsoon from July to August. The higher vertical wet advection maximum here forms more high clouds, with a precipitation peak in early July. The downstream region is mainly affected by the southerly-driven wet advection. The rich moisture and strong vertical wet advection here produce the most clouds and precipitation among the three regions, with a precipitation peak in late June. The height of the maximum moisture condensation is different between the midstream region (325 hPa) and the other two regions (375 hPa), due to the higher upward motion maximum in the midstream region. The diabatic heating structures show that stratiform clouds dominate the upstream region, stratiform clouds and deep convection co-exist in the midstream region, and deep convection systems characterize the downstream region.
-
Keywords:
- Yarlung Zangbo River Basin,
- atmospheric water cycle,
- constrained variational analysis,
- moisture source and consumption
摘要: 本研究利用5年平均多源观测数据和ERA5再分析资料,对比了西风和夏季风影响下青藏高原南部雅鲁藏布江流域上、中、下游关键区夏季大气水分循环特征以及水汽来源和消耗结构,其中水汽消耗与云、降水和非绝热加热有关。相比于中游和下游,上游地区水汽、云量和降水量最少,水汽由西风输送,8月初垂直湿平流的加强形成了高云和降水峰值。中游地区水汽在6月由西风输送、在7-8月由东亚夏季风输送,当地较高的垂直湿平流中心有利于形成较多的高云云量,降水峰值出现在7月初。下游地区主要受南风湿平流影响,丰富的水汽和强烈的垂直湿平流使下游地区出现了最多的云量和降水,降水峰值出现在6月末。中游地区地区水汽最大消耗高度(325 hPa)高于另两个区域(375 hPa)。非绝热加热廓线表明上游地区以层状云降水为主,中游地区层状云和深对流共存,下游地区降水基本由深对流系统产生。


 AAS Website
 AAS WeChat