


 DownLoad:


-
The Tibetan Plateau (TP) covers an area of more than 5 million km2, with an average altitude surpassing 4000 m, earning it the appellation “Third Pole” by scientists (Qiu, 2008; Yao et al., 2012). Due to its considerable expanse and high elevation, the TP constitutes a unique region where extensive snow cover (SC) can persist for most of the year at mid-latitudes (Pu et al., 2007; Li et al., 2018). Snow plays a vital role in the global energy cycle, owing to its high albedo and emissivity, as well as its low thermal conductivity (Barnett et al., 1989; Brown and Mote, 2009; Yang et al., 2019). The snow cover over the Tibetan Plateau (TPSC) can profoundly impact the surface energy budget and regulate the thermal state of the plateau (Cohen and Rind, 1991; Qian et al., 2020), thereby exerting a significant influence on weather and climate both on regional and global scales through its interactions with atmospheric circulation systems (Pu and Xu, 2009; Xiao and Duan, 2016; Wang et al., 2017).
Extensive research has been conducted to investigate the effects of TPSC on climate variability, with a history spanning several decades (Dey and Kumar, 1983; Kang et al., 2010; You et al., 2020). More than a century ago, Blanford (1884) was the first to identify the negative correlation between Himalayan snow cover and the Indian summer monsoon, thereby initiating a new field of inquiry concerning the interplay between snow and climate. Due to data limitations at that time, research related to the effects of TPSC was not well developed. However, commensurate with the widespread establishment of meteorological stations on the eastern TP in the early 1950s (Xiao et al., 2008; Yang et al., 2010), extensive research was conducted on the snow cover in this region (Chen and Wu, 2000; Zhao et al., 2007; Xiao and Duan, 2016). In addition, the utilization of snow data obtained from satellite observations has enabled the examination of the impact of snow over the western TP, which has been demonstrated to impact the climate in surrounding regions, e.g., heat waves and precipitation in Eurasia (Wu et al., 2016; Wang et al., 2018a). Moreover, in recent years, the availability of longtime snow data has facilitated the study of the impact of long-term snow changes on climate (Qian et al., 2019; Wang et al., 2021).
Despite extensive research on how TPSC affects the global climate, significant knowledge gaps still exist regarding the mechanisms that regulate snow cover variability over the TP. According to previous studies, the changes in snow cover are driven by the interplay of snowfall and snowmelt processes, which are regulated by variations in precipitation and temperature patterns that are associated with both local and remote atmospheric circulations (Deng et al., 2017; Thackeray et al., 2019; Li et al., 2021). The snow-related external forcing factors controlling large-scale teleconnections have also been revealed, including atmospheric circulation patterns related to ocean-atmosphere coupling systems such as El Niño-Southern Oscillation (ENSO) (Shaman and Tziperman, 2005; Wang et al., 2022), the Indian Ocean Dipole (IOD) (Yuan et al., 2009, 2012), and sea surface temperature (SST) (Ye et al., 2015; Wang et al., 2019). In particular, the TPSC-related effects of SST anomalies in the North Atlantic (NA), an important source of Rossby waves upstream of the Tibetan Plateau, have been investigated in recent years (Qian et al., 2020; Han et al., 2022).
However, historical studies have been limited to single-factor effect, while the long-term changes of TPSC should be the result of the combined modulation of several relevant climatic factors. In addition, in the context of global warming, high-latitude Arctic sea ice (SIC) loss not only contributes to Arctic Amplification (AA) (Screen and Simmonds, 2010; Dai et al., 2019) but also exerts a strong control on remote warming of the climate (Deng et al., 2020; Li et al., 2020; Duan et al., 2022). In mid-latitudes, the increased contrast between land-sea thermal conditions (Braganza et al., 2004; Kamae et al., 2014) leads to enhanced subtropical stationary waves which can modulate large-scale moisture transport and thus affect regional precipitation (Nigam and DeWeaver, 2003; Yuan et al., 2015). We suggest that the above climatic factors that enable the influence of temperature and precipitation may act to impact the snow as well. For example, the latest research (Yang et al., 2023) confirmed that the anomalous circulation that arises from the reduction in Arctic sea ice can lead to favorable conditions for Eurasian snowfall, however, the relationship between SIC and TPSC has yet to be determined.
Notably, while most previous research has examined the TPSC anomaly as a whole, there are clear regional and seasonal differences in the selection of research targets. Wang et al. (2018b) documented the regional characteristics of snow variations over TP, based on seasonal stratification, with a particular focus on summer and winter. Instead, we observed that in the mid-1980s, the snow cover over the eastern TP exhibited significant increases in spring, which was markedly different from other seasons. Conversely, the western part of the TP displayed significant decreases in spring snow cover. The possible reasons behind the distinct changes characterized by an east increase-west decrease distribution in spring TPSC remain unclear. Therefore, this study focuses on the regional differences in long-term changes of spring TPSC and aims to investigate the possible physical mechanisms by considering the synergistic effects of multiple factors.
The remainder of this paper is organized as follows. Section 2 describes the data and methods used in this study. Section 3 presents the climatological characteristics and changes of spring TPSC. Section 4 documents the local atmospheric variables and circulation related to snow variation. Section 5 explores how the remote climate factors contribute to the regional changes of TP and finally, section 6 provides a summary and discussion.
-
The northern hemisphere snow cover extent (Robinson and Estillow, 2012) was obtained from the NOAA Climate Data Record (
https://data.noaa.gov/ ). Following Wang et al. (2018b), the snow data were converted to a monthly mean on regular 1° × 1° grids. The monthly mean atmospheric variables, including the geopotential, horizontal and vertical velocities, and specific humidity, at different pressure levels (Hersbach et al., 2023) were derived from ECMWF-ERA5 at a 0.25° × 0.25° spatial resolution(https://cds.climate.copernicus.eu ). The monthly mean meteorological variables, including surface latent and sensible heat fluxes, downward and upward shortwave radiation fluxes, downward and upward longwave radiation fluxes, and precipitation rate (Kalnay et al., 1996) were obtained from the National Centers for Environmental Prediction-National Center for Atmospheric Research Global Reanalysis 1 dataset at a 2.5° × 2.5° spatial resolution (https://psl.noaa.gov/data/ ). The monthly mean surface air temperature and land precipitation version TS4.05 (Harris et al., 2020) from the Climate Research Unit of the University of East Anglia at a 0.5° × 0.5° spatial resolution were utilized in the study (https://www.cru.uea.ac.uk/data ). The monthly mean sea surface temperature and sea ice concentration (Rayner et al., 2003) were obtained from the Met Office Hadley Center at a 1° × 1° spatial resolution (https://www.metoffice.gov.uk/hadobs/ ).In the present work, we analyze the spring months (March, April, and May) from 1985 to 2020. The preceding winter of 1985 refers to the average from December 1984 to February 1985.
-
In this study, linear regression is used to investigate the variables associated with the SC/SST/SIC anomalies. A composite analysis is employed to obtain the differences in the atmospheric variables based on high and low TPSC years. The confidence level of the above methods is estimated by a Student’s t-test. To identify the dominant mode of SC/SIC variations, an EOF analysis is applied to the corresponding variables.
The horizontal component of a phase-independent wave activity flux formulated by Takaya and Nakamura (2001) is used to investigate the propagation of Rossby waves. The formulation is expressed as follows:
where
$ p $ indicates the pressure scaled by 1000 hPa; λ and φ represent the longitude and latitude, respectively;$ U $ and$ V $ denote the climatology of the zonal and meridional wind velocities, respectively;$ a $ is the radius of the earth;$ {\psi }^{{'}} $ represents the 3-dimensional perturbation of the geostrophic streamfunction;$ {C}_{U} $ refers to the phase propagation speed in the same direction as$ U $ ;$ M $ is the wave-activity (angular) pseudomomentum.To understand the effect of SST/SIC anomalies on the atmosphere, the total heat source/sink in an atmospheric column (Q1) and the surface turbulent (latent + sensible) heat flux are calculated. Following Zhao and Chen (2001), Q1 is calculated by the following equation:
where SH denotes the sensible heating flux at the surface; RAD denotes the net radiation in an atmospheric column; LP denotes the condensation-related latent heat. The atmosphere is a heat source when Q1 is positive and a heat sink when Q1 is negative.
-
The climatological mean and the standard deviation of the spring TPSC during 1985–2020 are presented in Fig. 1a. The average spring TPSC indicates high values of SC over the eastern and western regions of TP with the maximum SC exceeding 80%, consistent with previous work (Pu et al., 2007; Pu and Xu, 2009; Wang et al., 2018b, 2019). The large amount of SC in the western TP region extends northeastward along the Tianshan Mountain Range. The spatial distribution of the standard deviation of SC is similar to the climate, but the center of maximum values in variance over the western TP is concentrated on the northwestern part of TP. The long-term trend in spring TPSC exhibits noticeable regional disparities during the period under examination, as illustrated in Fig. 1b. A substantial reduction in spring TPSC is observed in the western TP areas (defined as W_TPSC and denoted by the blue box in Fig. 1b), whereas a remarkable increase is detected in the eastern region (defined as E_TPSC and denoted by the red box in Fig. 1b). A spring TP snow cover index (SCI), presented as bars in Fig. 1c, is constructed as the normalized difference between the area-average of E_TPSC and W_TPSC to represent the variation of the distinct pattern of east increase-west decrease changes in the spring TPSC. The incremental series implies both E_TPSC increasing and W_TPSC decreasing trends. To investigate the covariation between the eastern and western spring TPSC, we have examined the correlation coefficients between the spring TP SCI and two normalized snow indices derived from the average TPSC in the eastern and western regions. Both indices exhibit statistically significant correlations at the 95% confidence level, suggesting that the spring TP SCI effectively captures the variations in spring TPSC across both the western and eastern TP regions. Figure 2a presents the spatial distribution of the leading EOF mode (EOF1) of the spring TPSC, obtained by regressing the principal component associated with EOF1 (PC1, Fig. 2b, solid bars). The EOF1 accounts for 38.44% of the variance in spring TPSC during the analysis period and exhibits significant increases and decreases in SC in the eastern and western TP regions, which closely resemble the patterns observed in Fig. 1b. The correlation coefficient between the PC1 and TP SCI is 0.94, exceeding the 95% confidence level, further confirming that the TP SCI can effectively capture the temporal variability in spring TPSC.
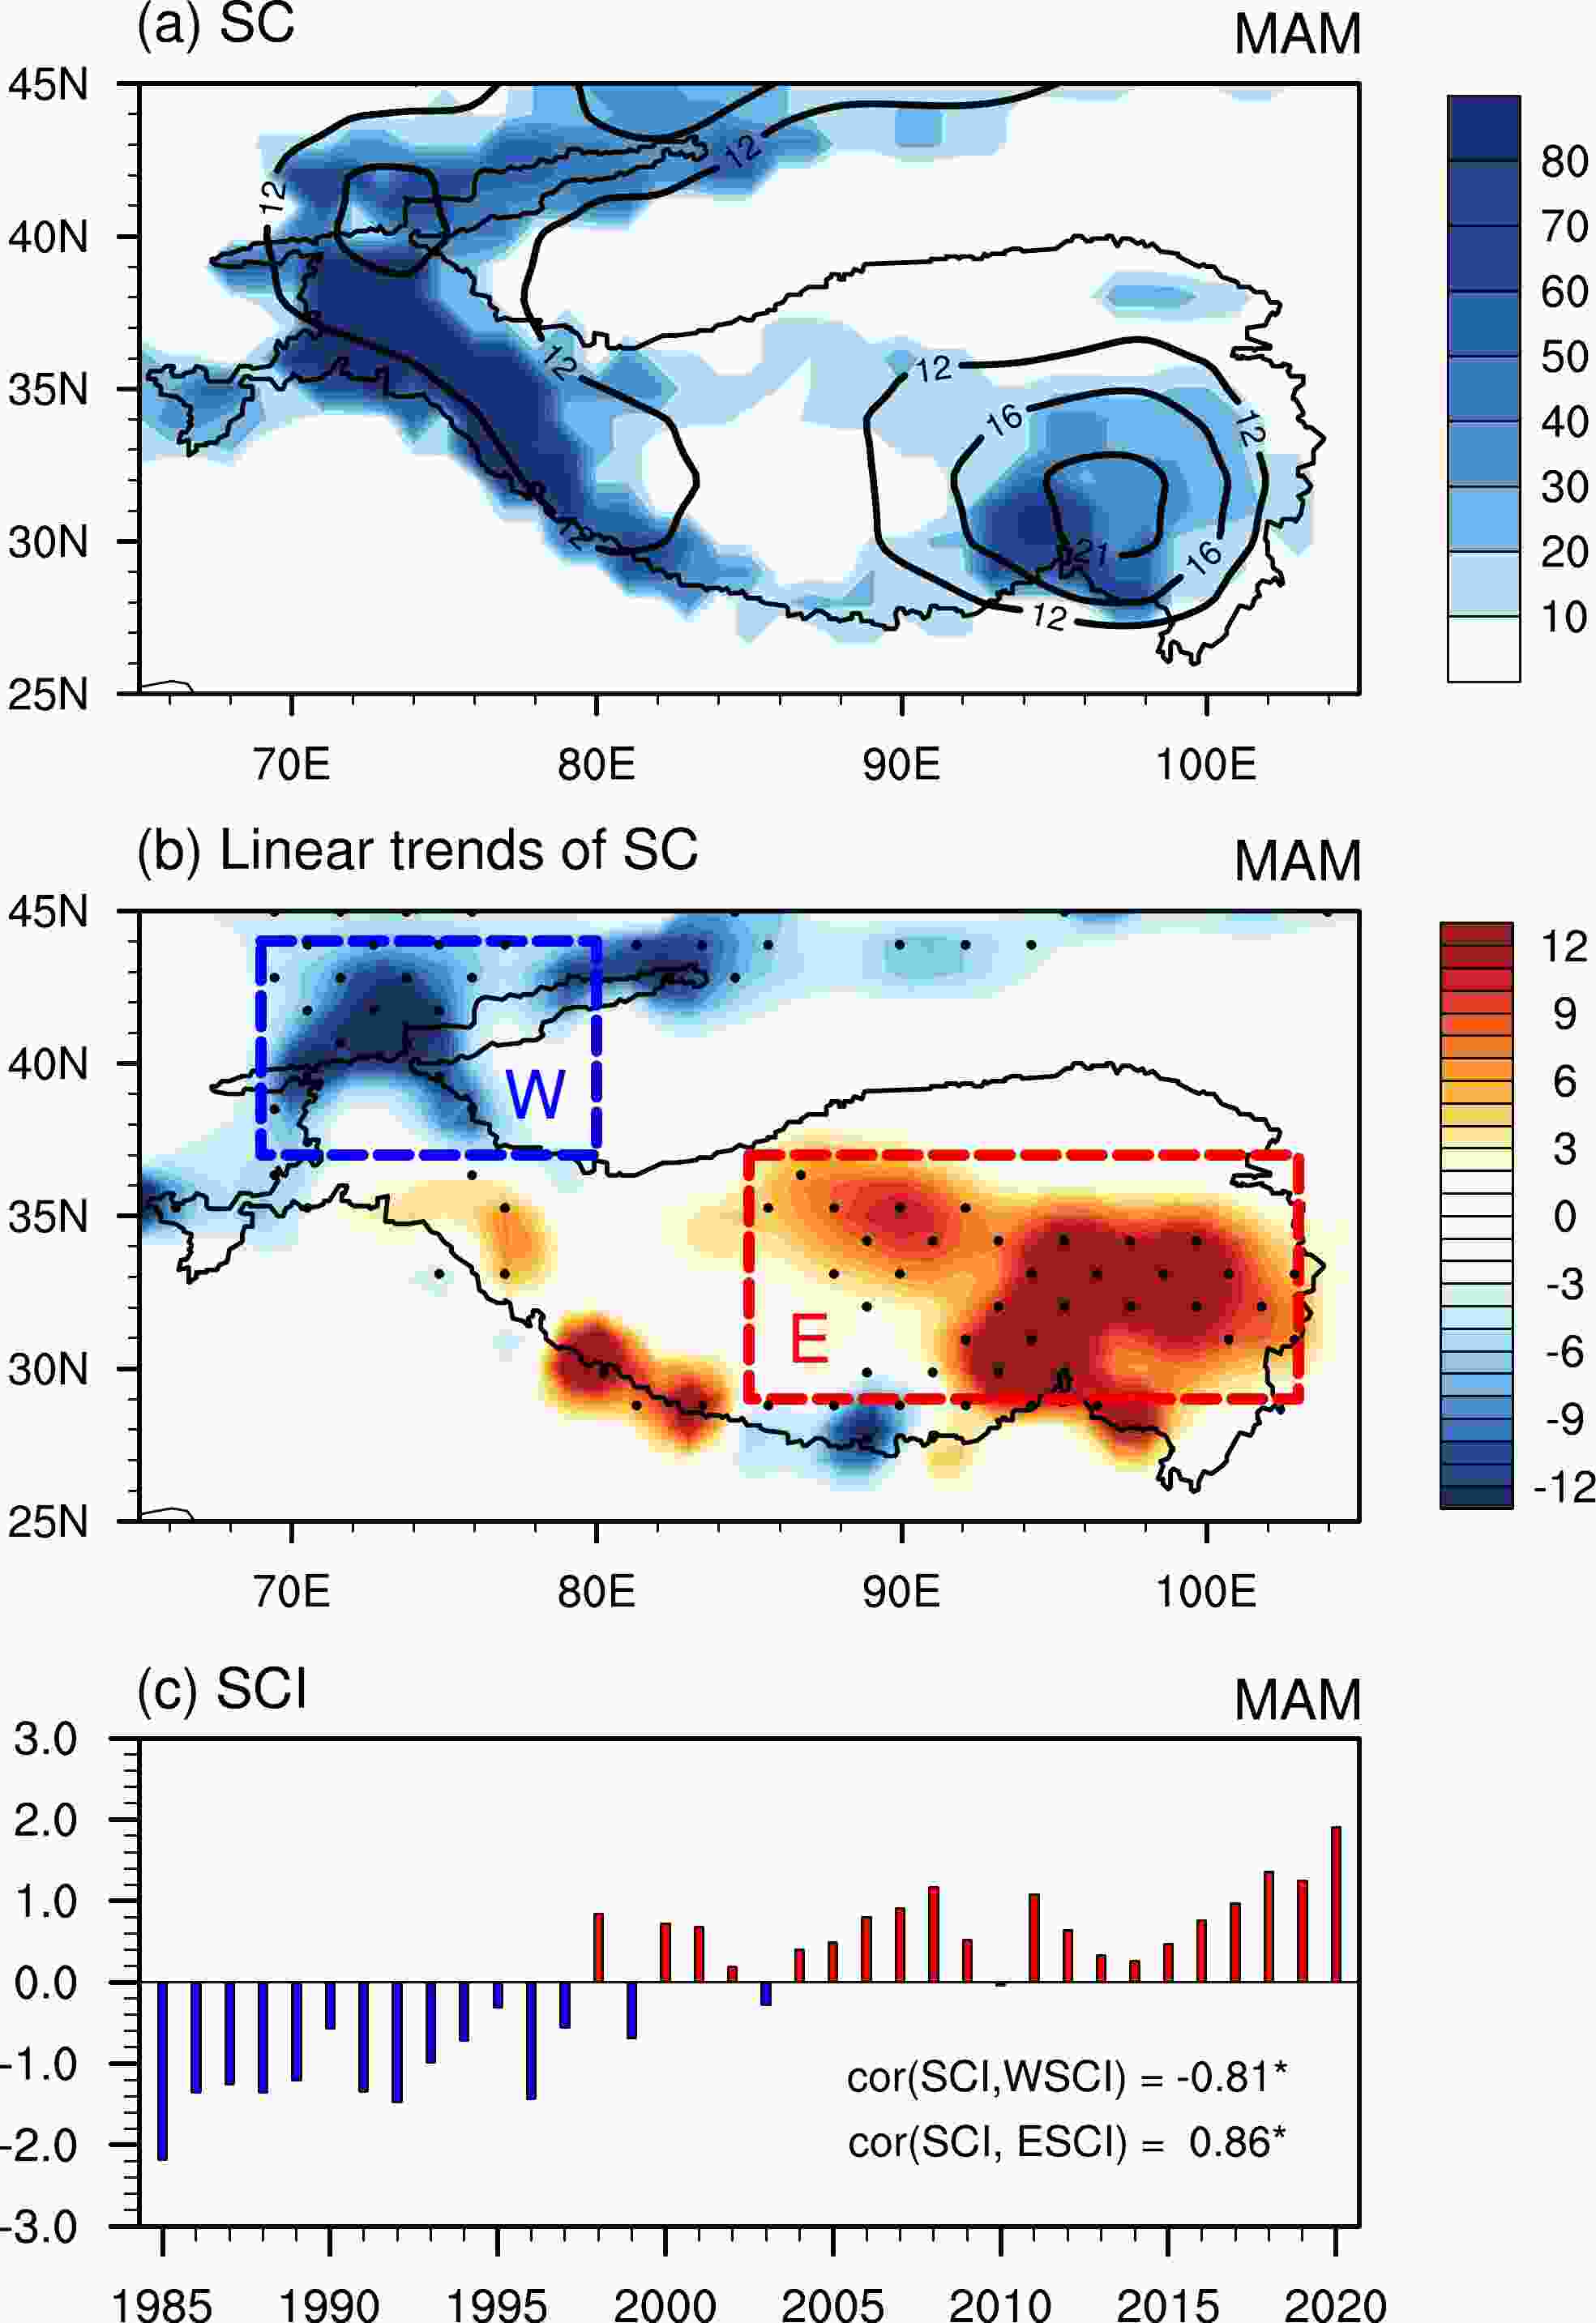
Figure 1. (a) The climatological means of the spring (March-April-May) snow cover (SC, units: %, shading) and standard deviation of the spring snow cover variations (contour) for the period 1985–2020. (b) Linear trends of the spring snow cover [units: % (10 yr)–1] for 1985–2020. The box denotes the domains of the west region (blue: 37°–44°N, 69°–80°E) and the east region (red: 29°–37°N, 85°–103°E,). The dotted areas represent the 95% confidence level. (c) The snow cover index (SCI) contained within the two boxes in (b), was calculated as follows: (E–W)/2, where E and W represent the area-weighted average over the key regions. The labels on the bottom right represent the correlation coefficients between the SCI and two indexes constructed by the blue and red boxes in (b), respectively, and * indicates that it exceeds the 95% confidence level.
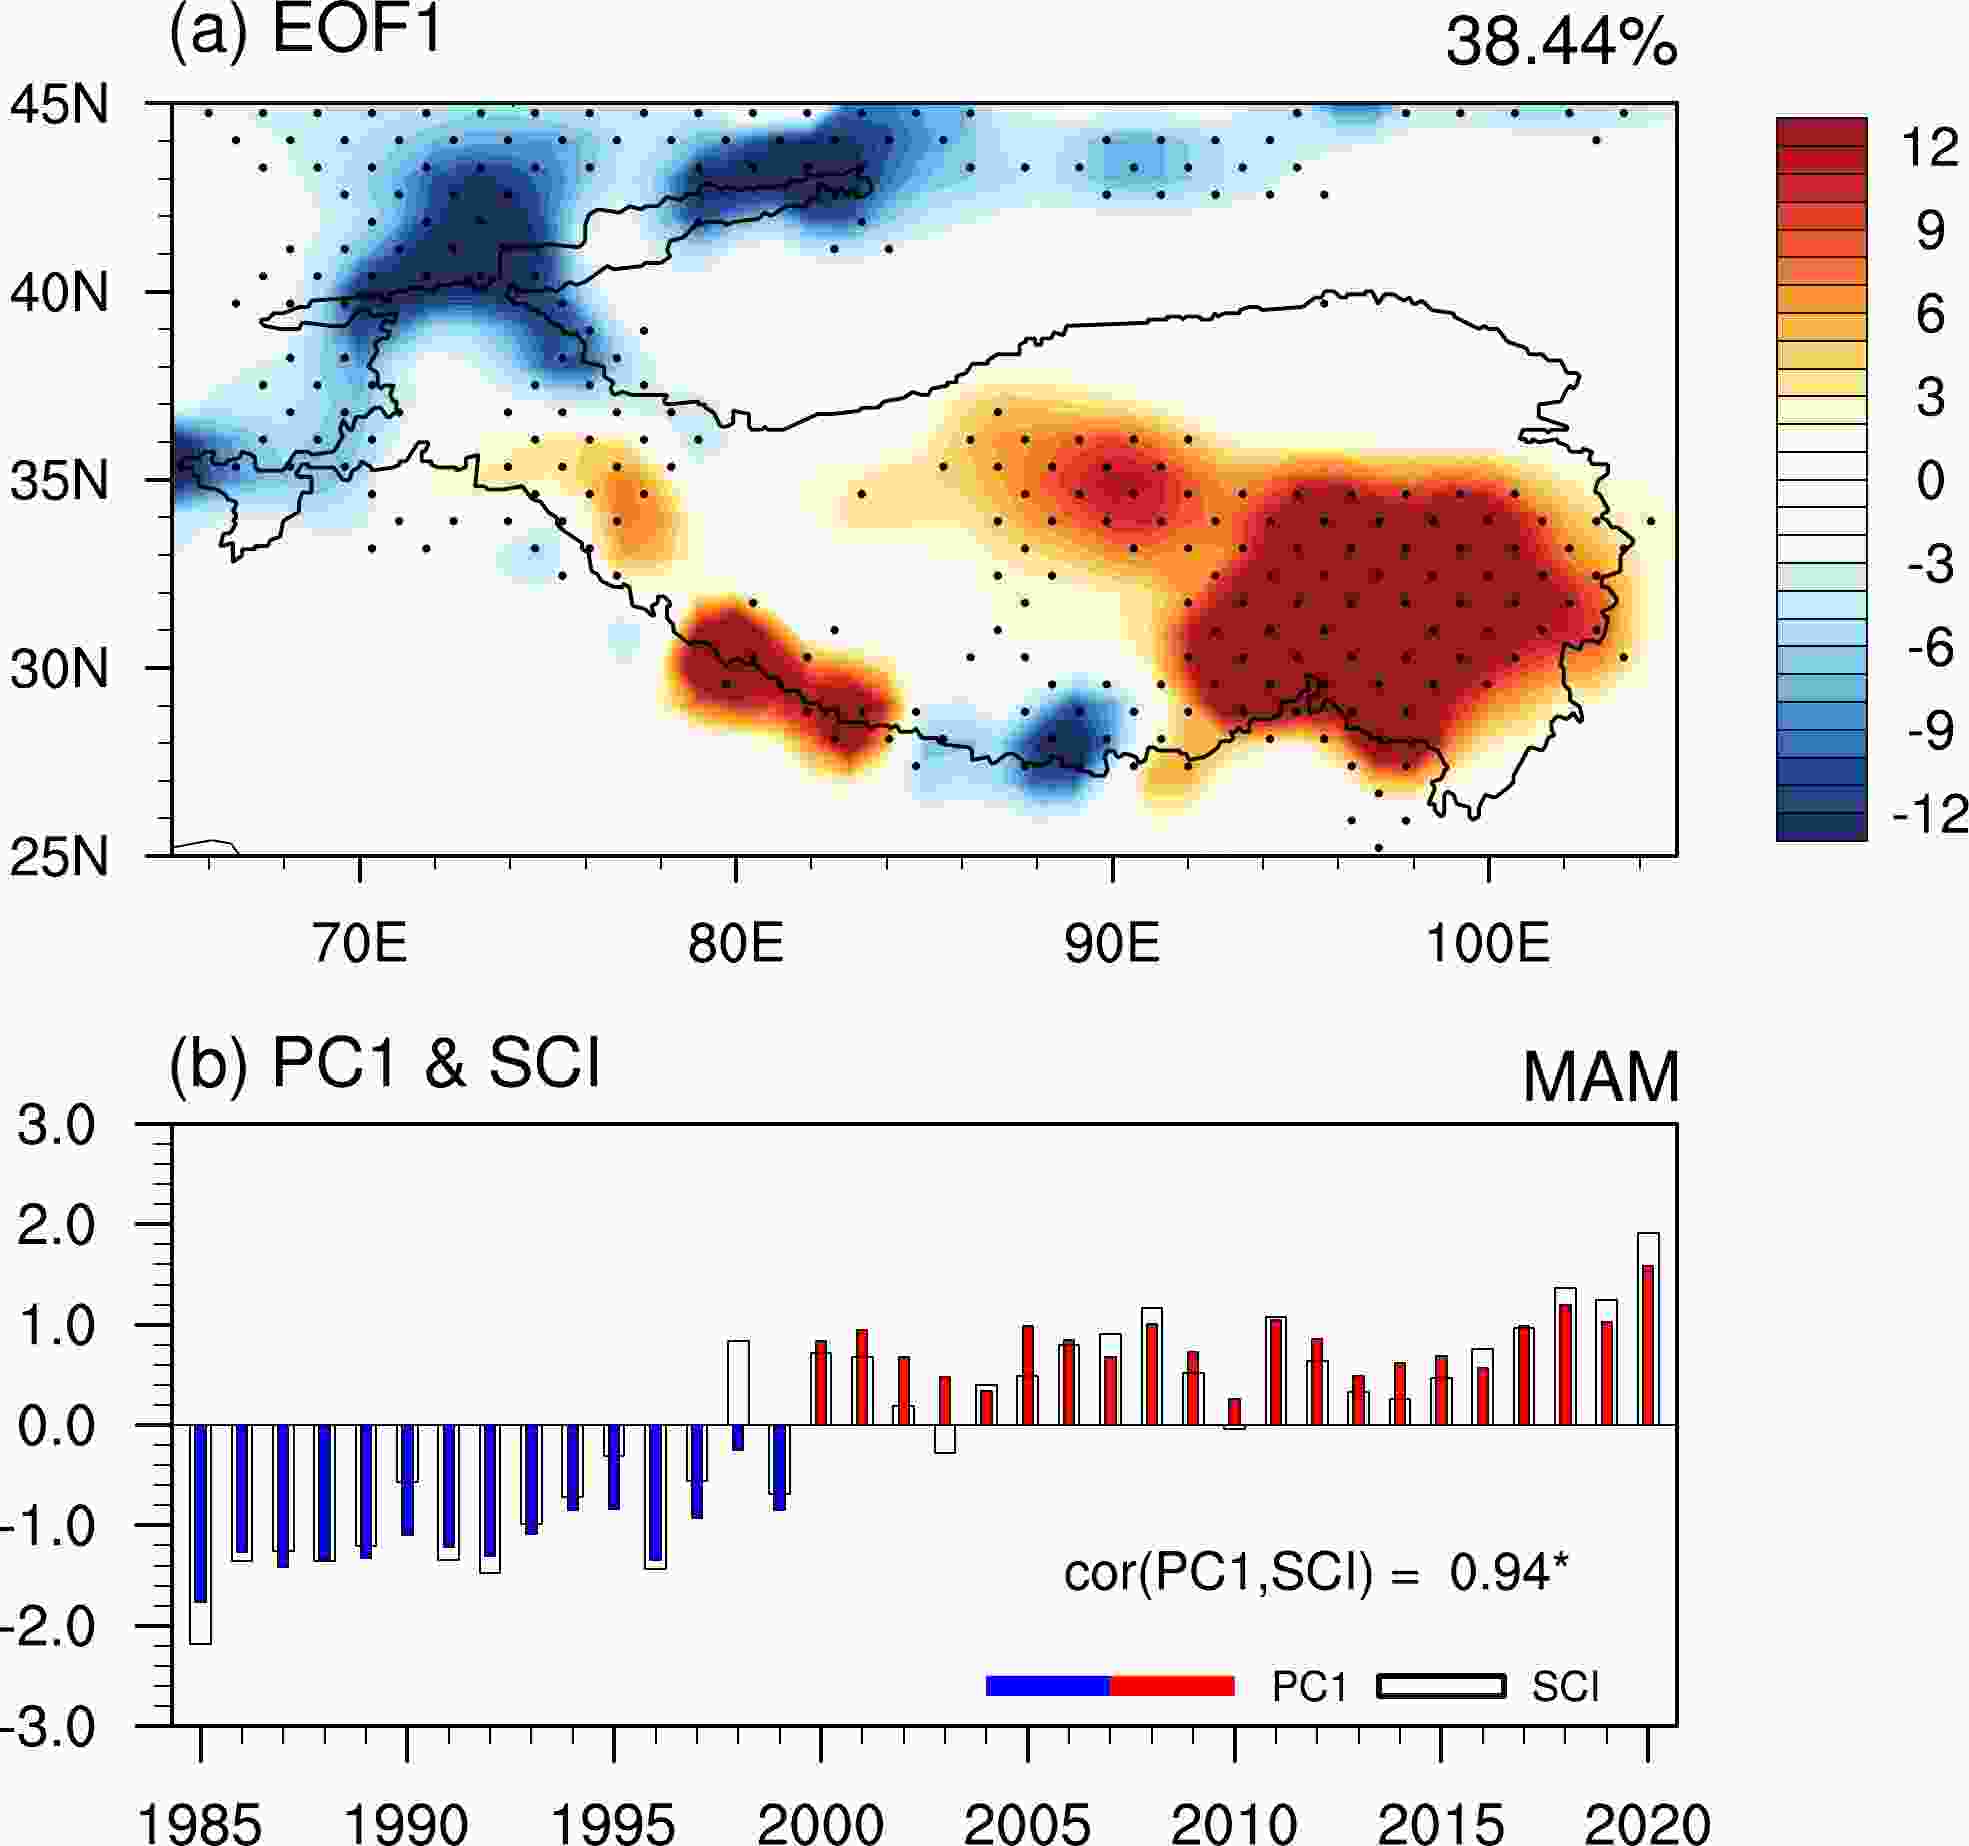
Figure 2. (a) Linear regression of the spring SC (units: %, shading) onto the time series associated with the leading EOF (EOF1) of the spring snow cover over the Tibetan Plateau (25°–45°N, 65°–105°E) for the period 1985–2020. The percentage on the top right indicates the percent variance explained by the EOF1 mode. The dotted regions represent the 95% confidence level. (b) The normalized time series associated with EOF1 (PC1, solid bar charts) and SCI (transparent bar charts). The label on the bottom right represents the correlation coefficient between PC1 and SCI; the * indicates that it exceeds the 95% confidence level.
-
In this section, we will examine the possible physical process associated with the long-term changes in spring TPSC. The anomalous local circulation related to the TPSC changes are obtained by regressing on TP SCI and are presented in Fig. 3. Associated with positive spring TP SCI, significant anomalous warm surface air temperature (SAT) prevail over the western TP and its adjacent areas, as depicted in Fig. 3a. However, the anomalies in SAT over the eastern TP are feeble and not significant. Figure 3a suggests that the increased temperature over the western TP may facilitate the melting of snow and contribute to the decrease of W_TPSC, while at the same time making a limited contribution to the changes of the E_TPSC. The spring TP SCI-related 500-hPa geopotential height and wind anomalies show a significant anticyclonic system dominating the TP, centered over the northwestern TP (Fig. 3b). The anomalous anticyclone is associated with adiabatic descending motion (Fig. 3c), which may promote increasing temperatures (Fig. 3a) and facilitates the melting of snow. The atmospheric subsidence is even more evident in the cross-section along western TP (69°–80°E), where significant descending motion can be observed dominating the troposphere (Fig. 3d).
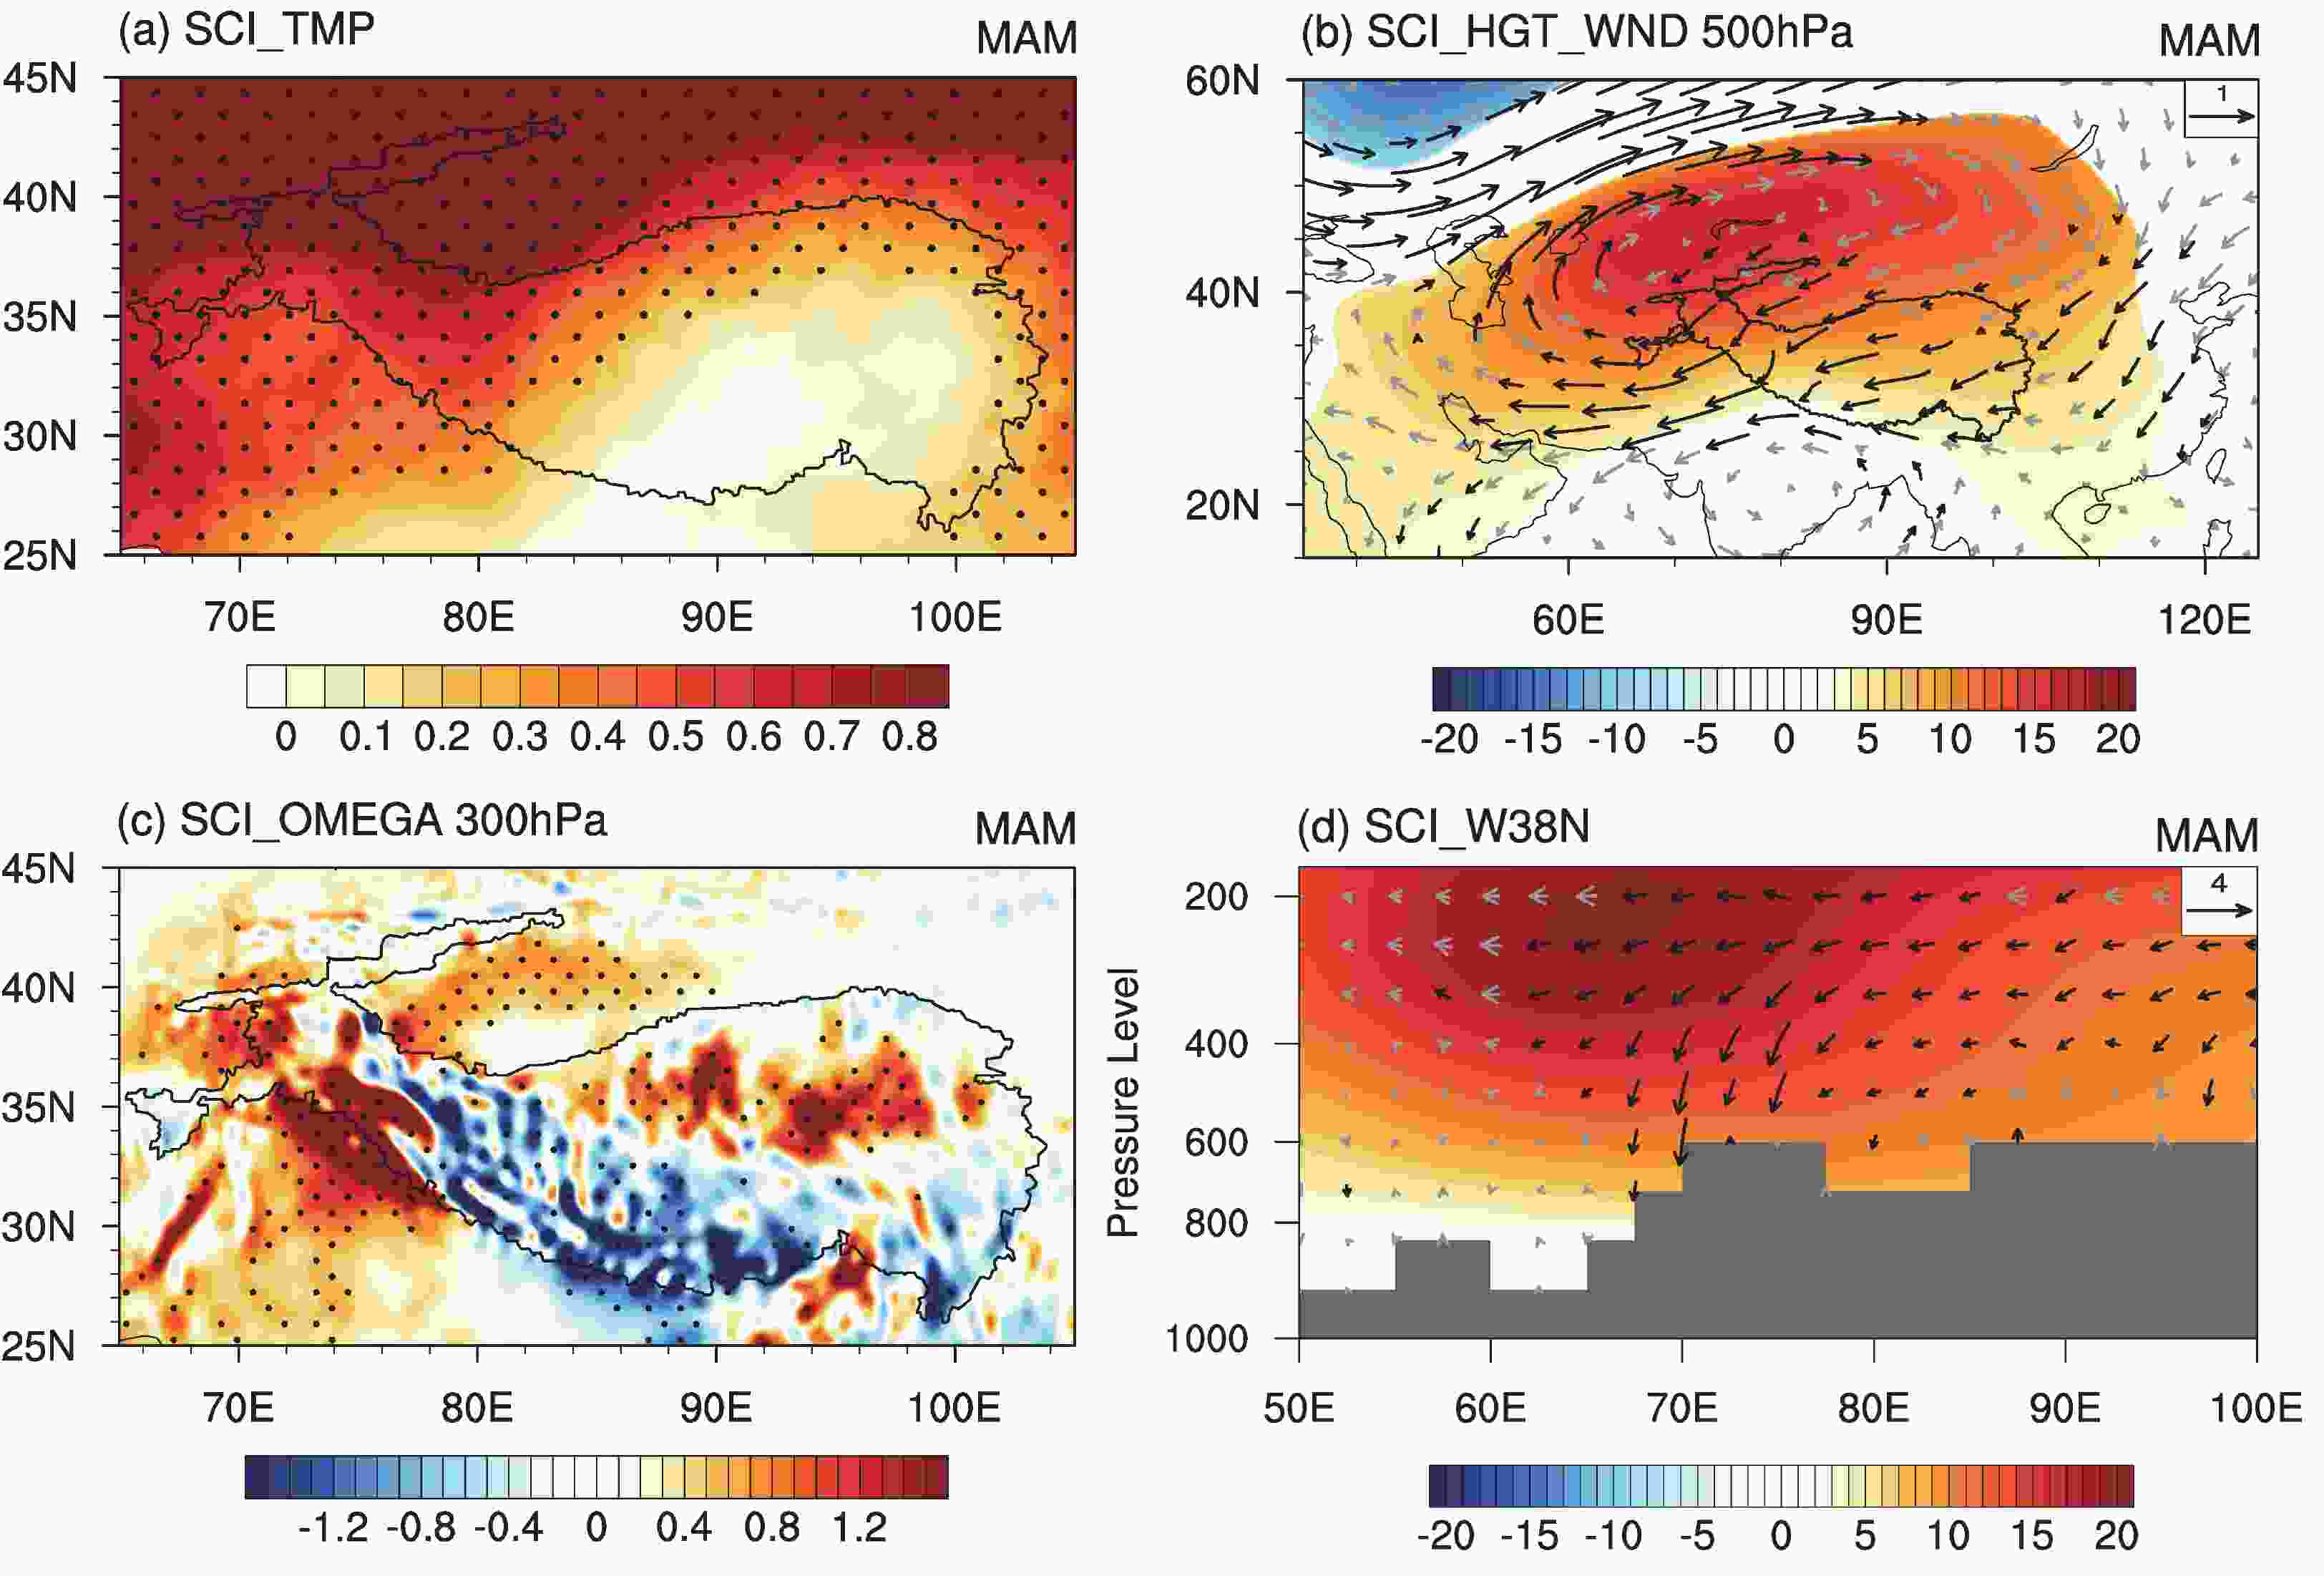
Figure 3. Regression maps obtained by regressing the spring (a) mean 2-m temperature (TMP, units: °C), (b) 500-hPa geopotential height (HGT, units: m, shading) and 500-hPa wind (units: m s–1, vector), (c) 300-hPa vertical velocity (units: Pa s–1) and (d) HGT (units: m, shading) and wind (units: m s–1, vector) along 38°N onto the SCI for the period 1985–2020. The dotted regions in (a, c) and shaded areas of (b, d) represent the 95% confidence level. The black vectors denote wind anomalies that are significant at the 95% confidence level. The gray shading indicates the topography.
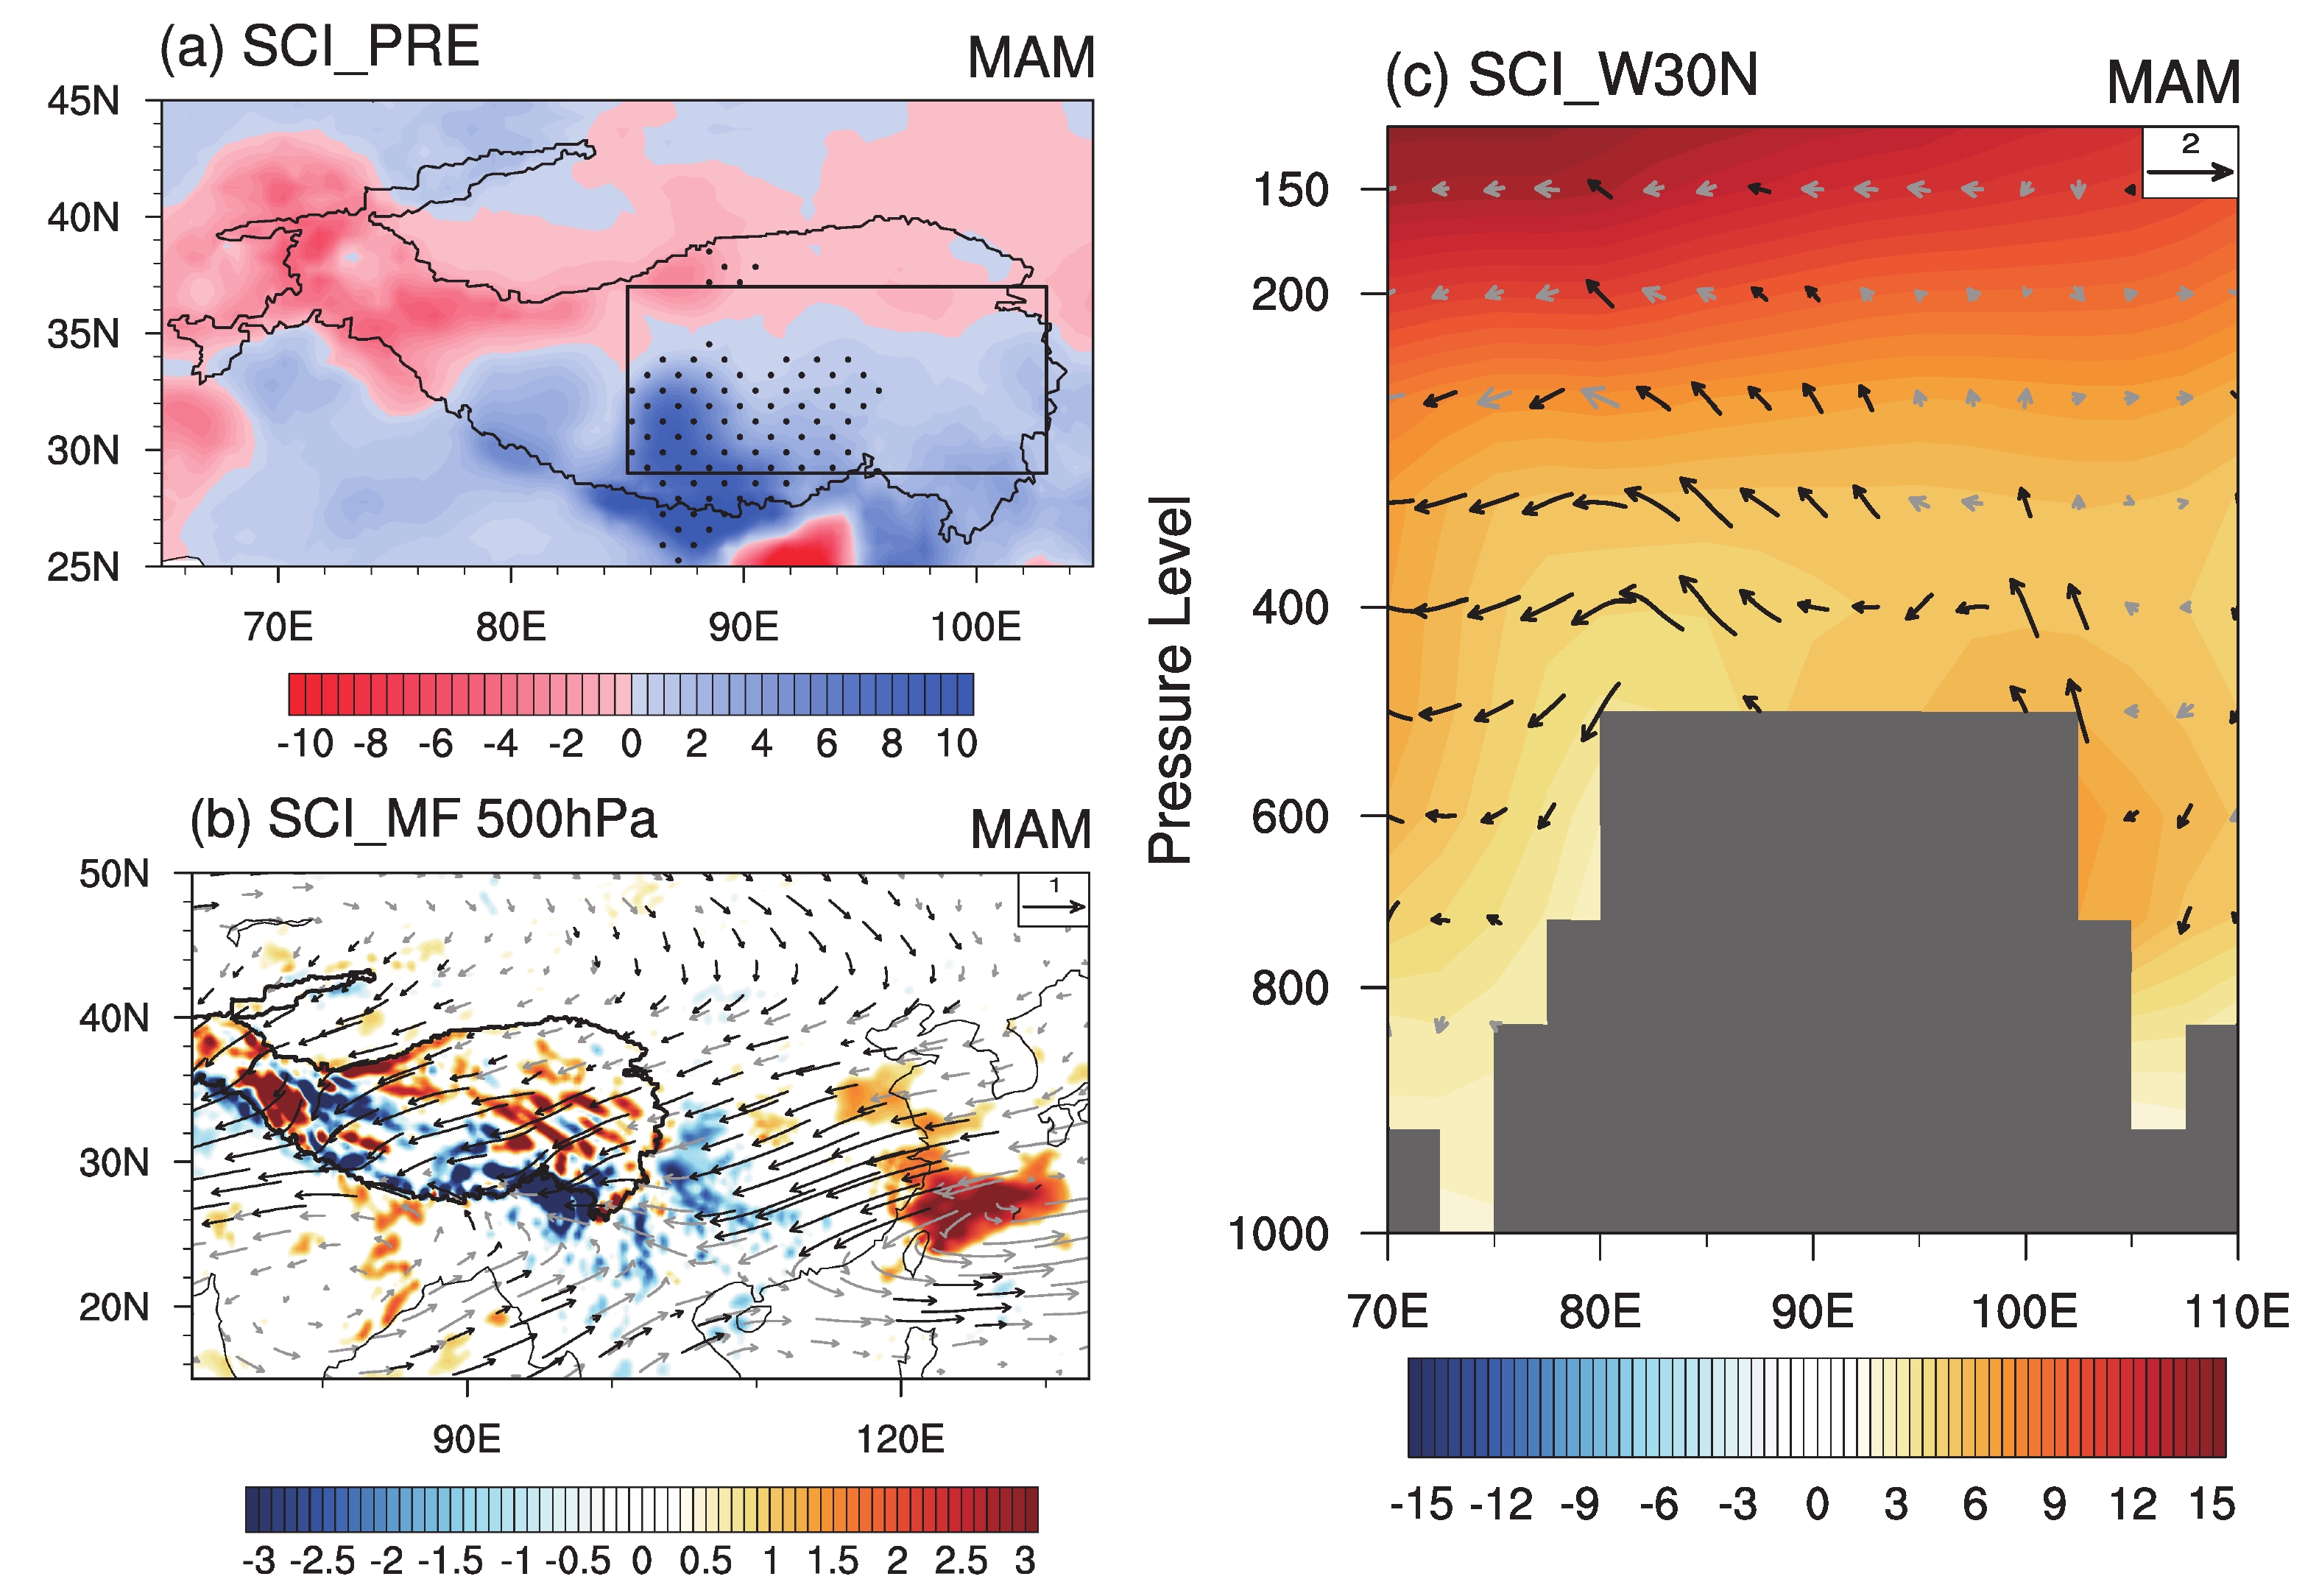
Pronounced positive precipitation anomalies (as depicted in Fig. 4a) are observed over the eastern Tibetan Plateau (TP), indicating a consistent pattern with increased E_TPSC. The presence of anomalous easterly winds along the southern flank of the anomalous anticyclonic system (Fig. 3b) is associated with the transport of abundant water vapor from the western North Pacific Ocean towards the continent (Fig. 4b). This transport leads to a significant convergence of moisture over the southeastern TP. Furthermore, this convergence, combined with notable ascending motion over the eastern TP (as evident in Fig. 3c and the cross-section along 30°N shown in Fig. 4c), creates favorable conditions for above-average snowfall in the E_TPSC region.

Figure 4. Regression maps obtained by regressing the spring (a) precipitation (PRE, units: mm), (b) 500-hPa divergence of moisture flux (MF, units: kg m–1 s–1, shading) and MF (vector), and (c) HGT (units: m, shading) and wind (units: m s–1, vector) along 30°N onto the SCI for the period 1985–2020. The dotted regions in (a) and shaded areas of (b, c) represent the 95% confidence level. The black vectors denote the vector variable anomalies that are significant at the 95% confidence level. The gray shading denotes the topography.
-
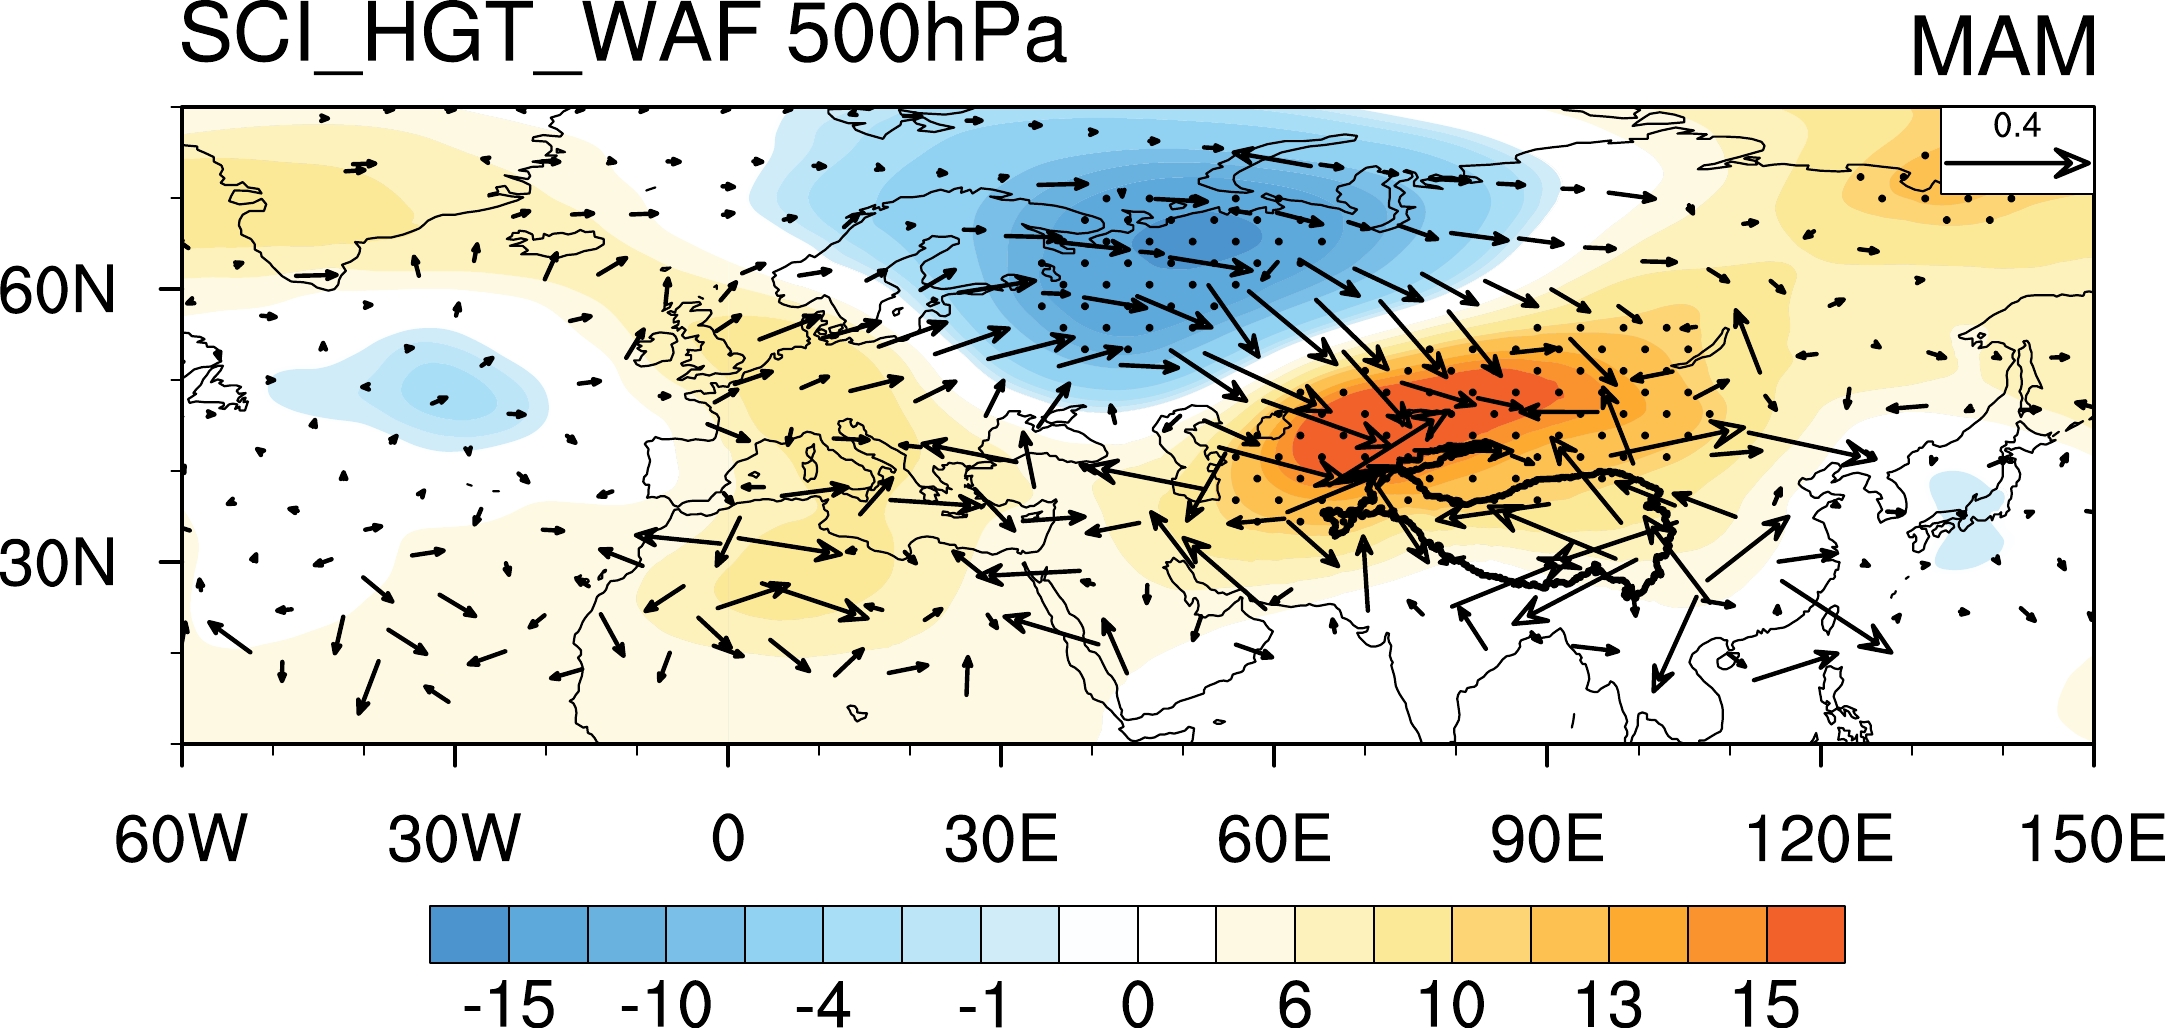
To investigate the possible impact on the changes in spring TPSC from remote climate factors, the snow-related 500-hPa geopotential height and wave activity flux anomalies in spring are obtained by regressing these variables onto the spring TP SCI (Fig. 5). This analysis shows that the variation of the spring TPSC related wave activity fluxes originates from the upstream North Atlantic (NA) region. The wave activity flux, accompanied by a Rossby wave-like atmospheric pattern, propagates northeastward from the subtropical NA to the high latitude Arctic, turns southeastward at approximately 50°E to the downstream Eurasian continent, and reaches the anomalous anticyclone over the northwestern TP, which is the most significant system contributing to the changes of TPSC as shown in Fig. 3. Therefore, Fig. 5 indicates that the changes of spring TPSC are related to a continental scale anomalous atmospheric circulation related to the NA forcing.
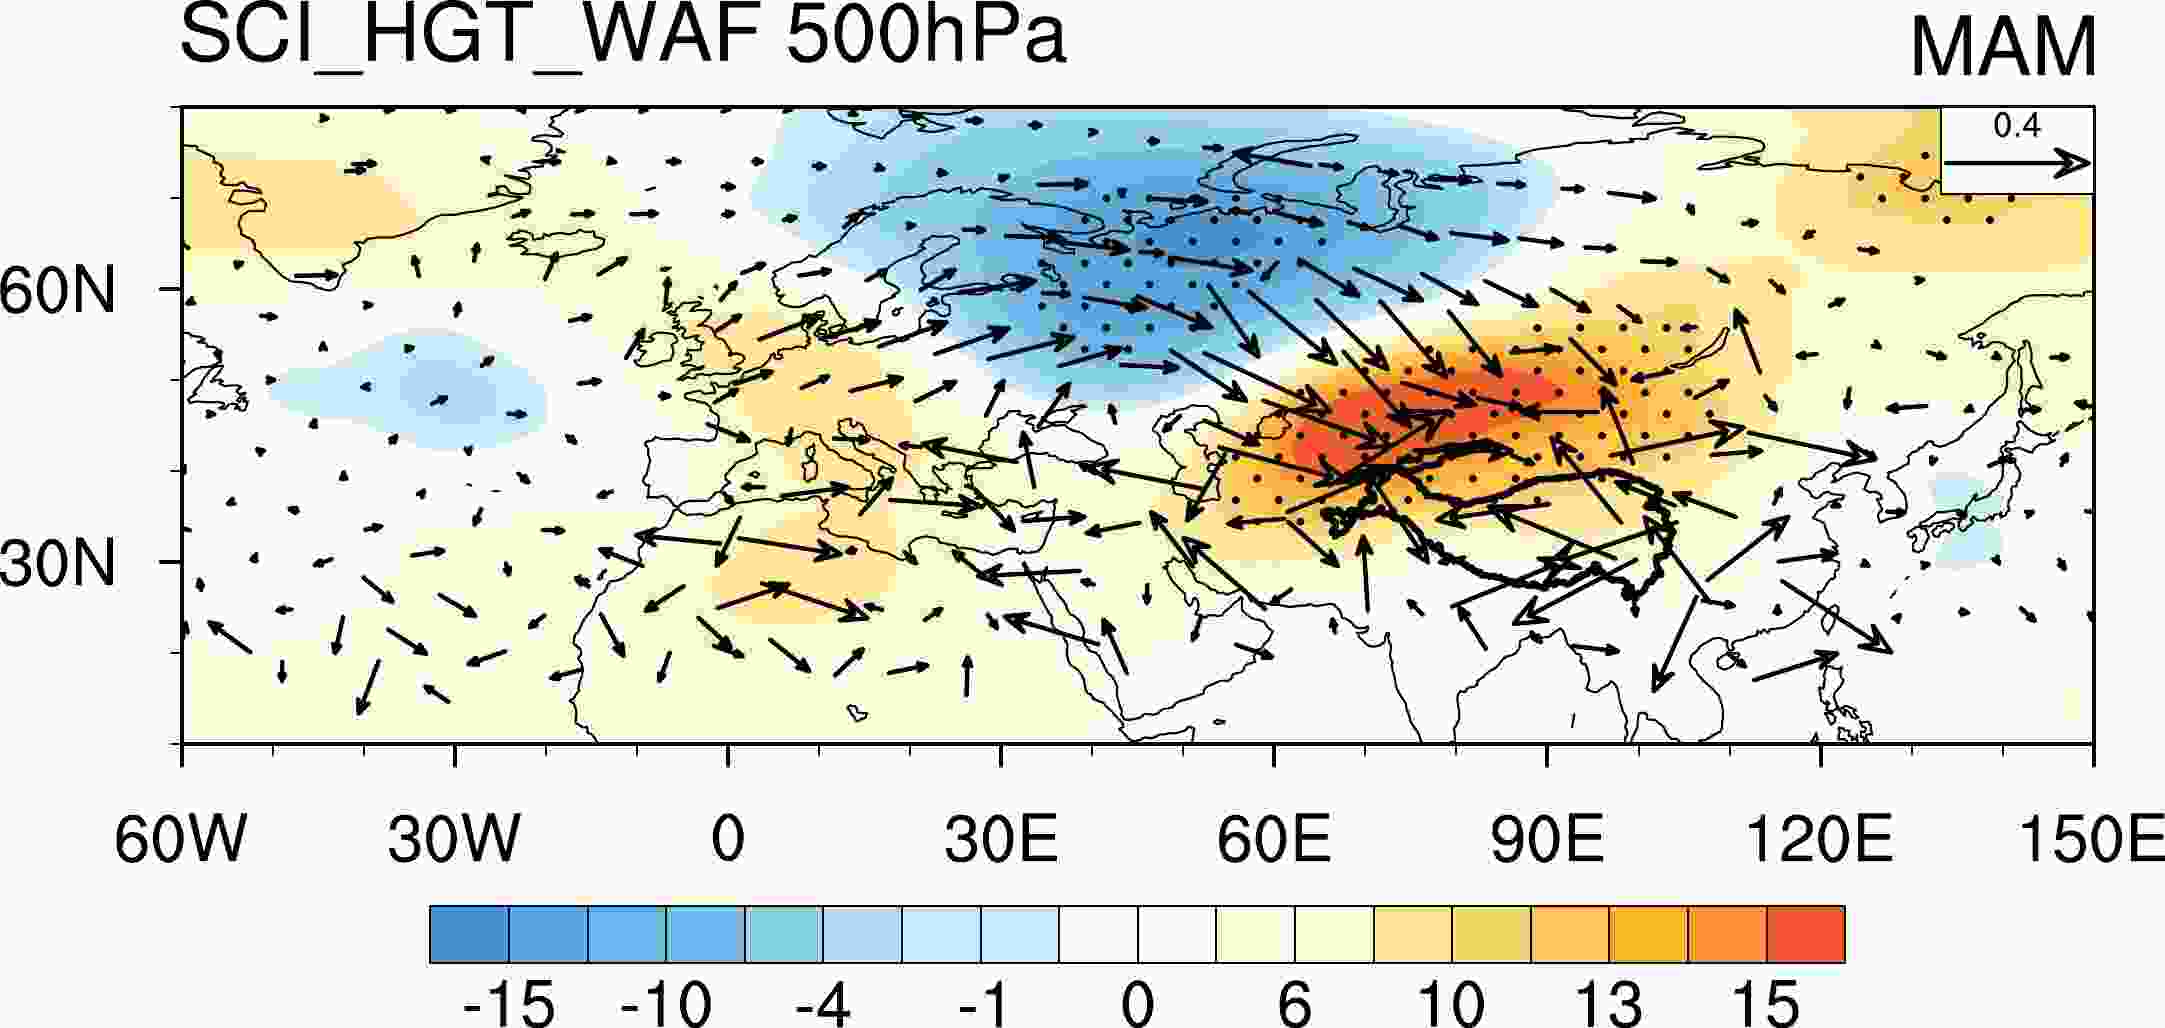
Figure 5. Regression maps of the spring 500-hPa HGT (shading) and 500-hPa wave activity flux (WAF, units: m2 s–2, vector) onto the SCI for the period 1985–2020. The dotted regions represent the 95% confidence level.
-
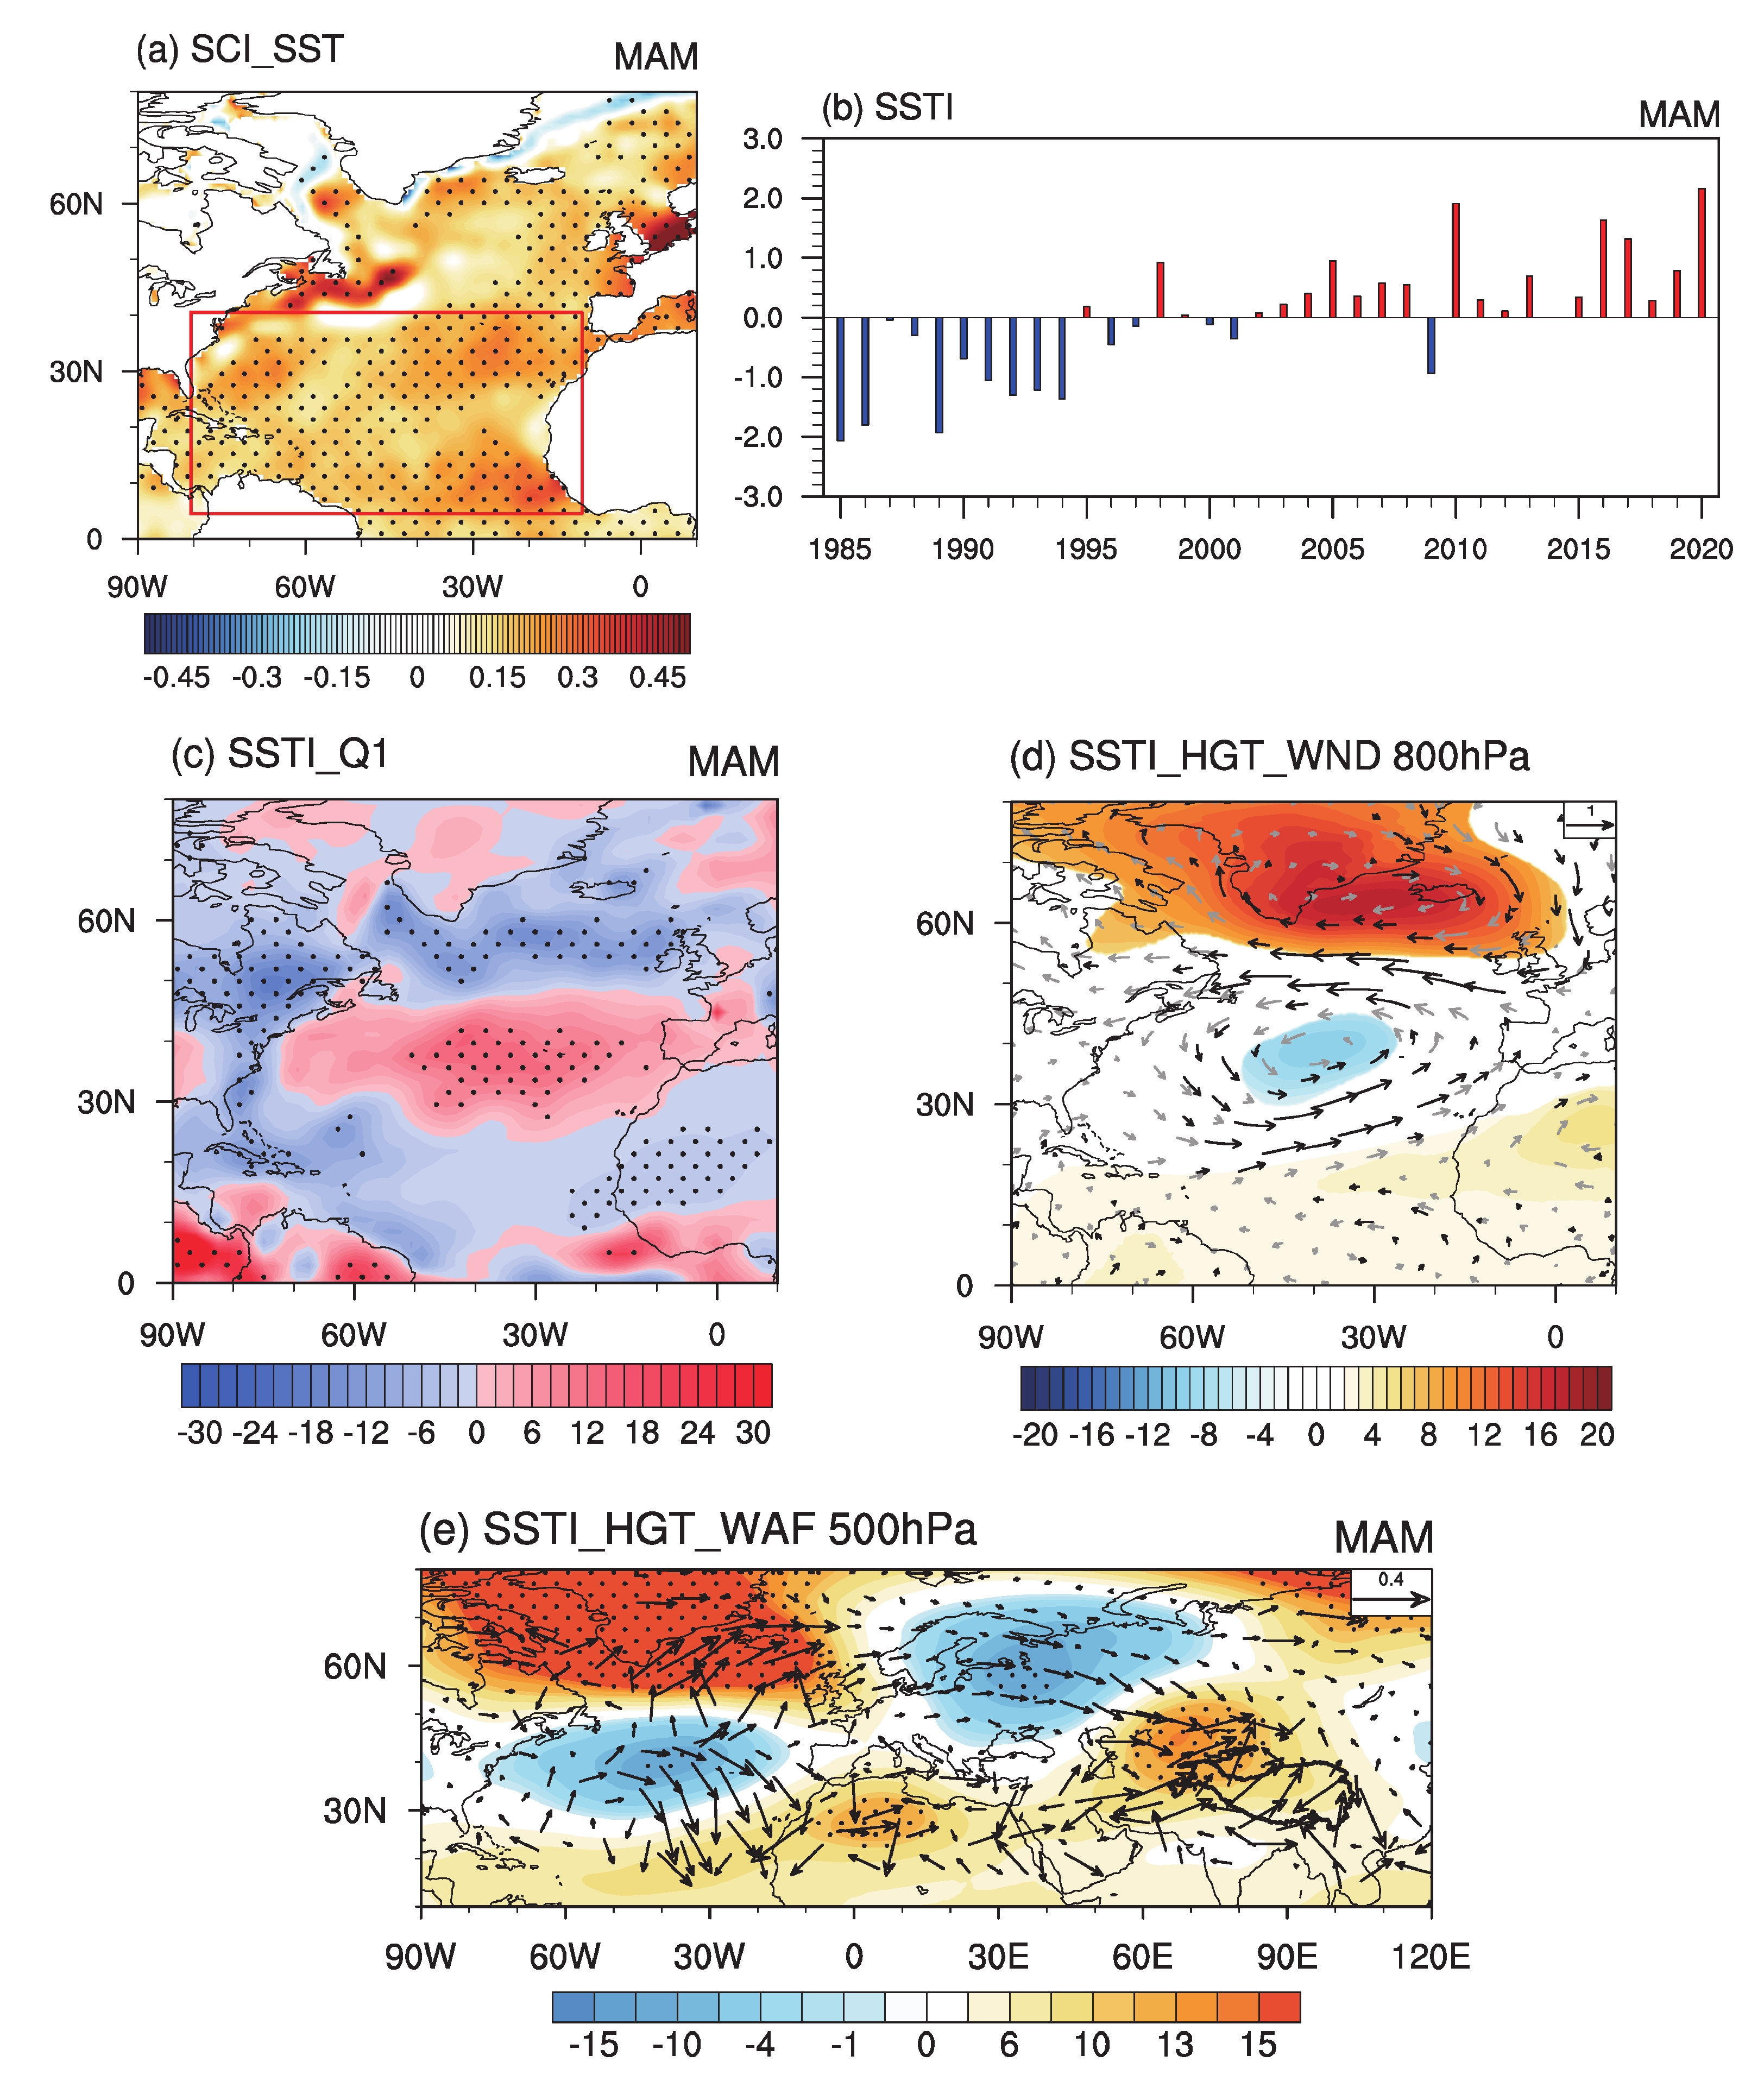
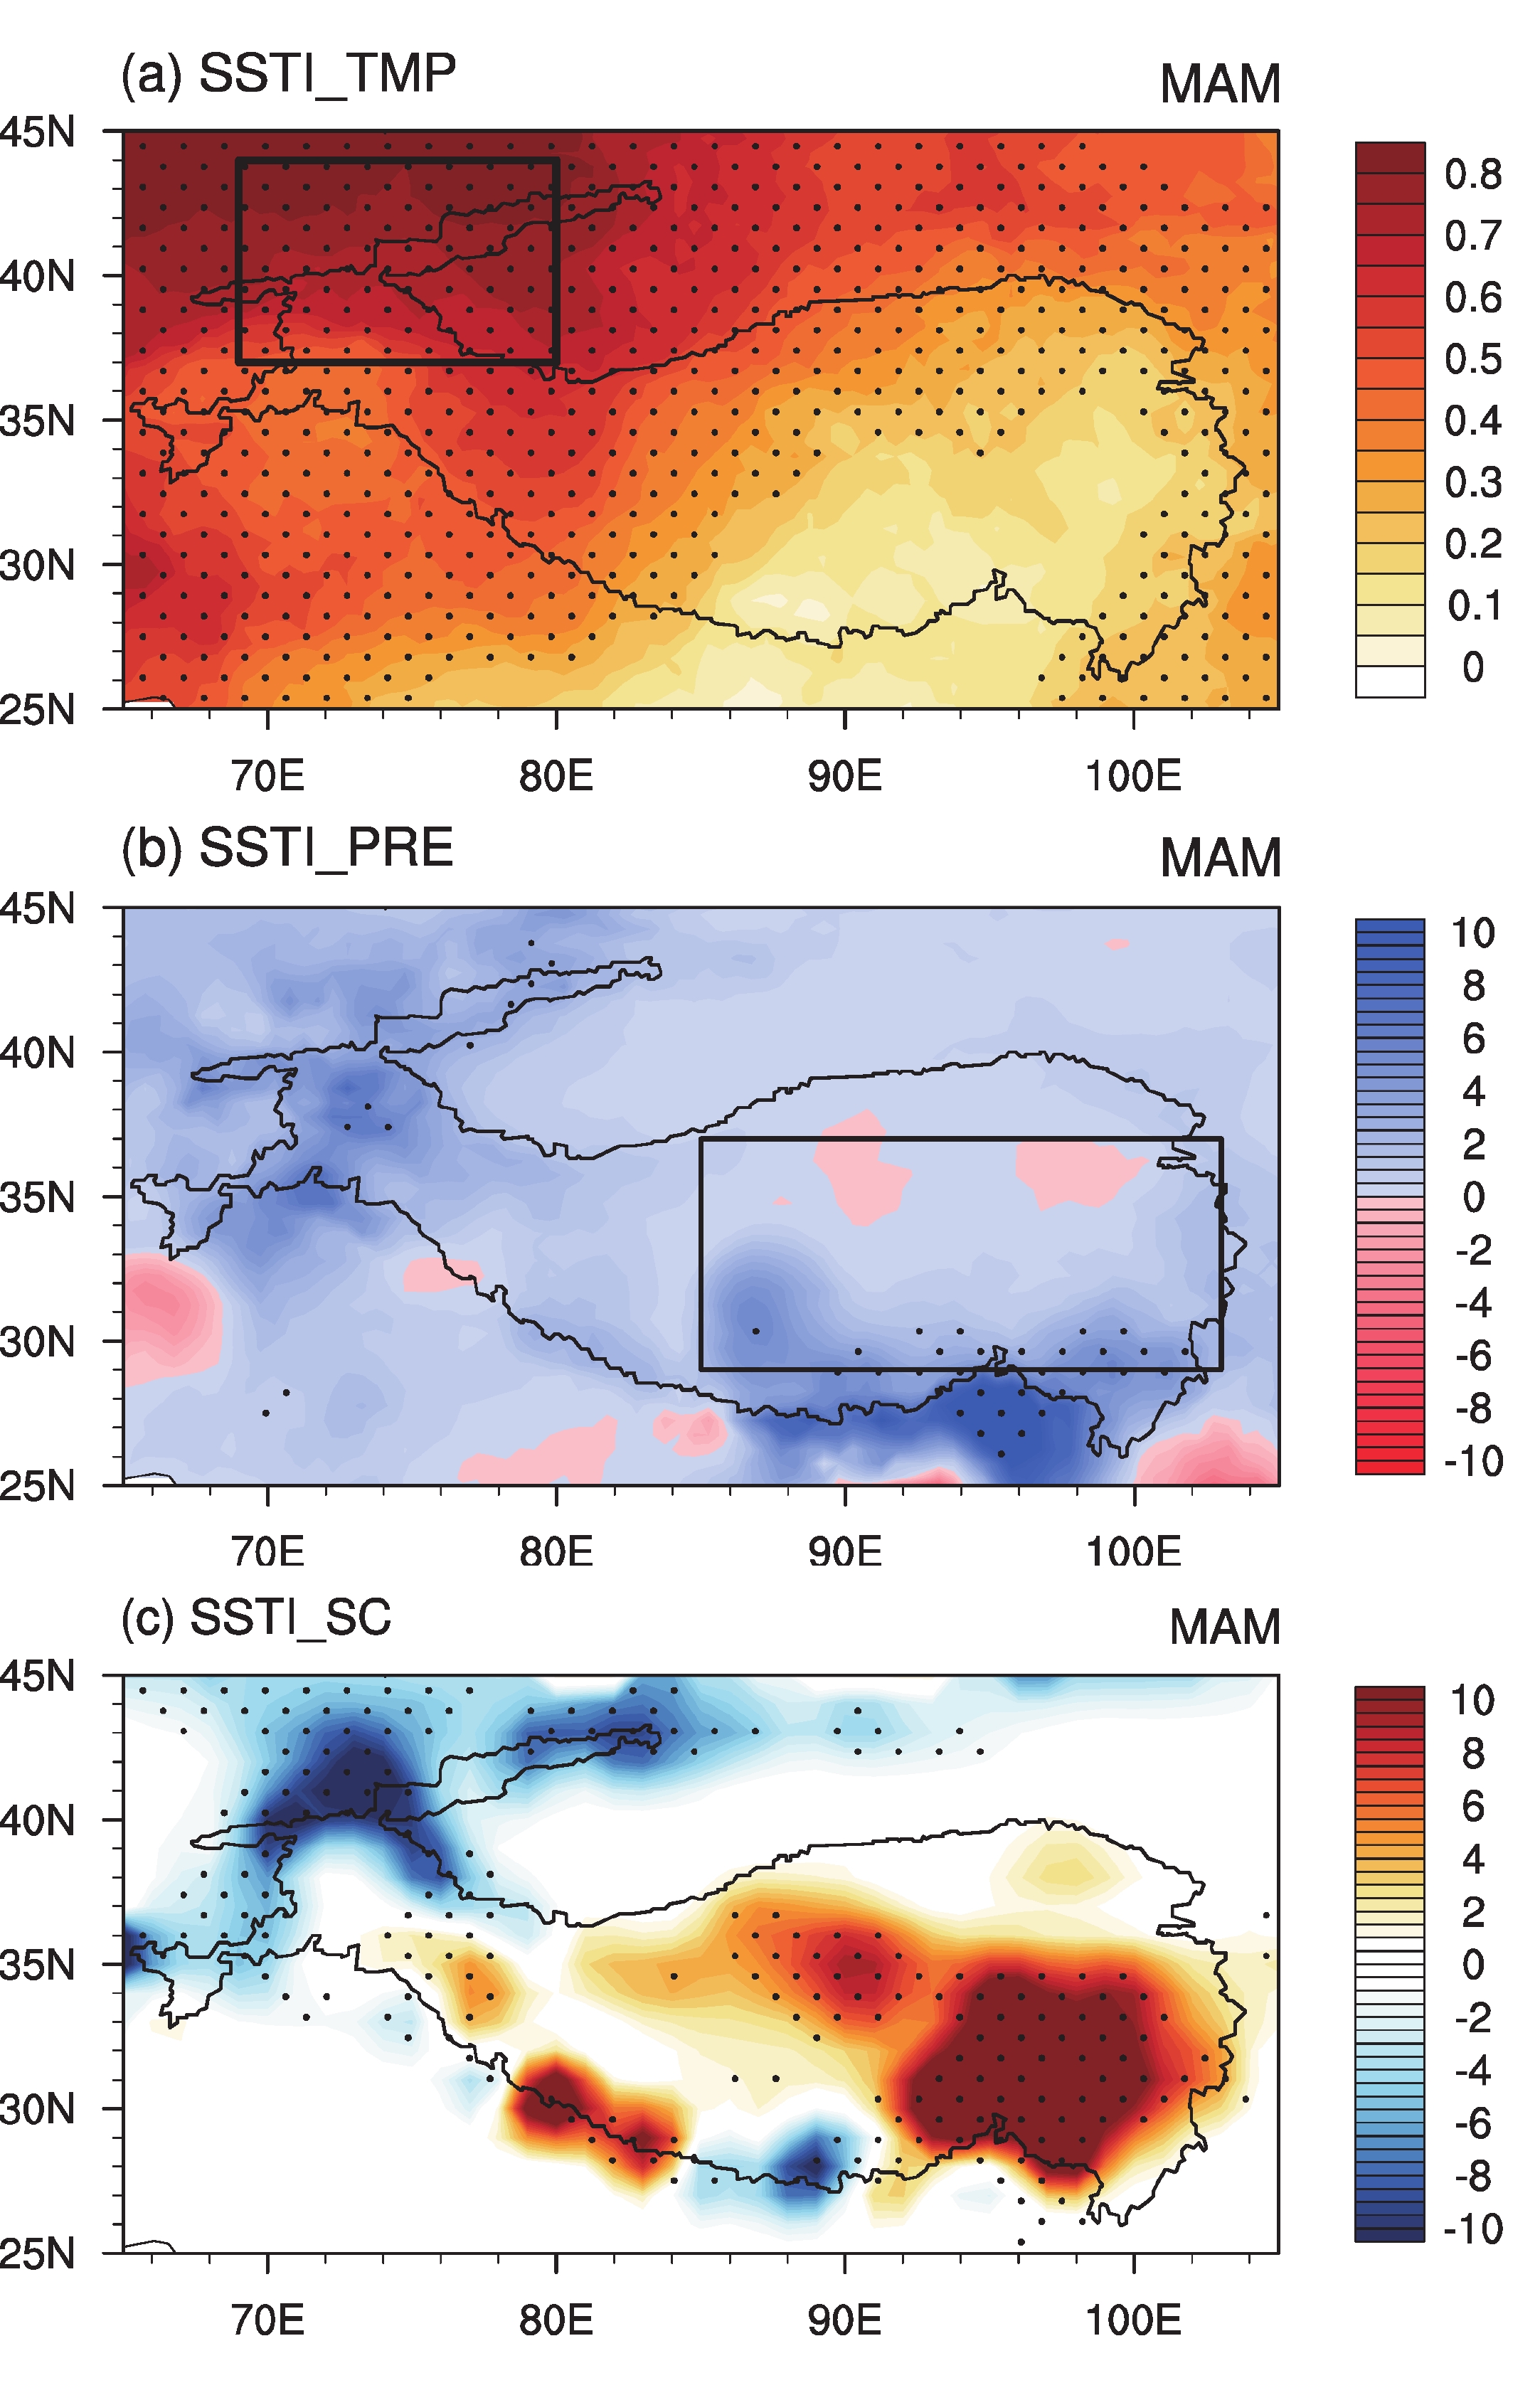
To further understand the relationship between the anomalous spring SST and the continental scale atmospheric circulation, the TP SCI regressed NA SST anomalies are examined (Fig. 6a). Significant positive SST anomalies appear over most parts of the NA basin with the most significant area over the subtropical NA. To examine how the warm NA SST impacts the above atmosphere, an SST index (SSTI, Fig. 6b) is constructed by averaging the significant area of SST (represented as the rectangle in Fig. 6a). Significant warming trends of the SSTI can be observed, consistent with the increasing trends of TP SCI during the period under examination. The anomalous NA SST-related effect on the column of the above atmosphere is obtained by regressing Q1 onto the SSTI (Fig. 6c). Corresponding to the pronounced subtropical NA warming, significant positive Q1 anomalies are observed, implying a significant heating effect to the above atmosphere by the underlying warming ocean. Consequently, the air is forced to rise and anomalous low-level cyclonic response is formed over the North Atlantic (Fig. 6d). The SSTI-related 500-hPa geopotential height and wave activity flux anomalies are presented in Fig. 6e. Significant negative and positive height anomalies can be observed over the subtropical and mid-high latitude NA, with negative height and positive height anomalies over central Eurasian and the northwestern TP, respectively, together forming a Rossby wave train-like pattern. A comparative analysis of Fig. 6e and Fig. 5 reveals several similarities, particularly in the central-eastern Eurasian continental sector. These similarities imply that the North Atlantic SST has the potential to influence the changes observed in spring TPSC by exerting a regulatory effect on the large-scale atmospheric circulation patterns, with a specific emphasis on the formation of the crucial anomalous anticyclone over the northwestern Tibetan Plateau. The positive height anomalies lead to descending motion and local warming (Fig. 7a). Meanwhile, the SST-associated circulations favor the transport of water vapor from the NA to the TP (figure not shown), allowing for greater-than-normal precipitation (Fig. 7b). The influence of North Atlantic SST on the spring TPSC can be further verified by Fig. 7c, derived through regression analysis onto the SSTI. Noteworthy negative and positive snow cover anomalies are observed over the TP region, exhibiting a strong resemblance to the prominent east increase-west decrease TPSC pattern observed in Fig. 1b.
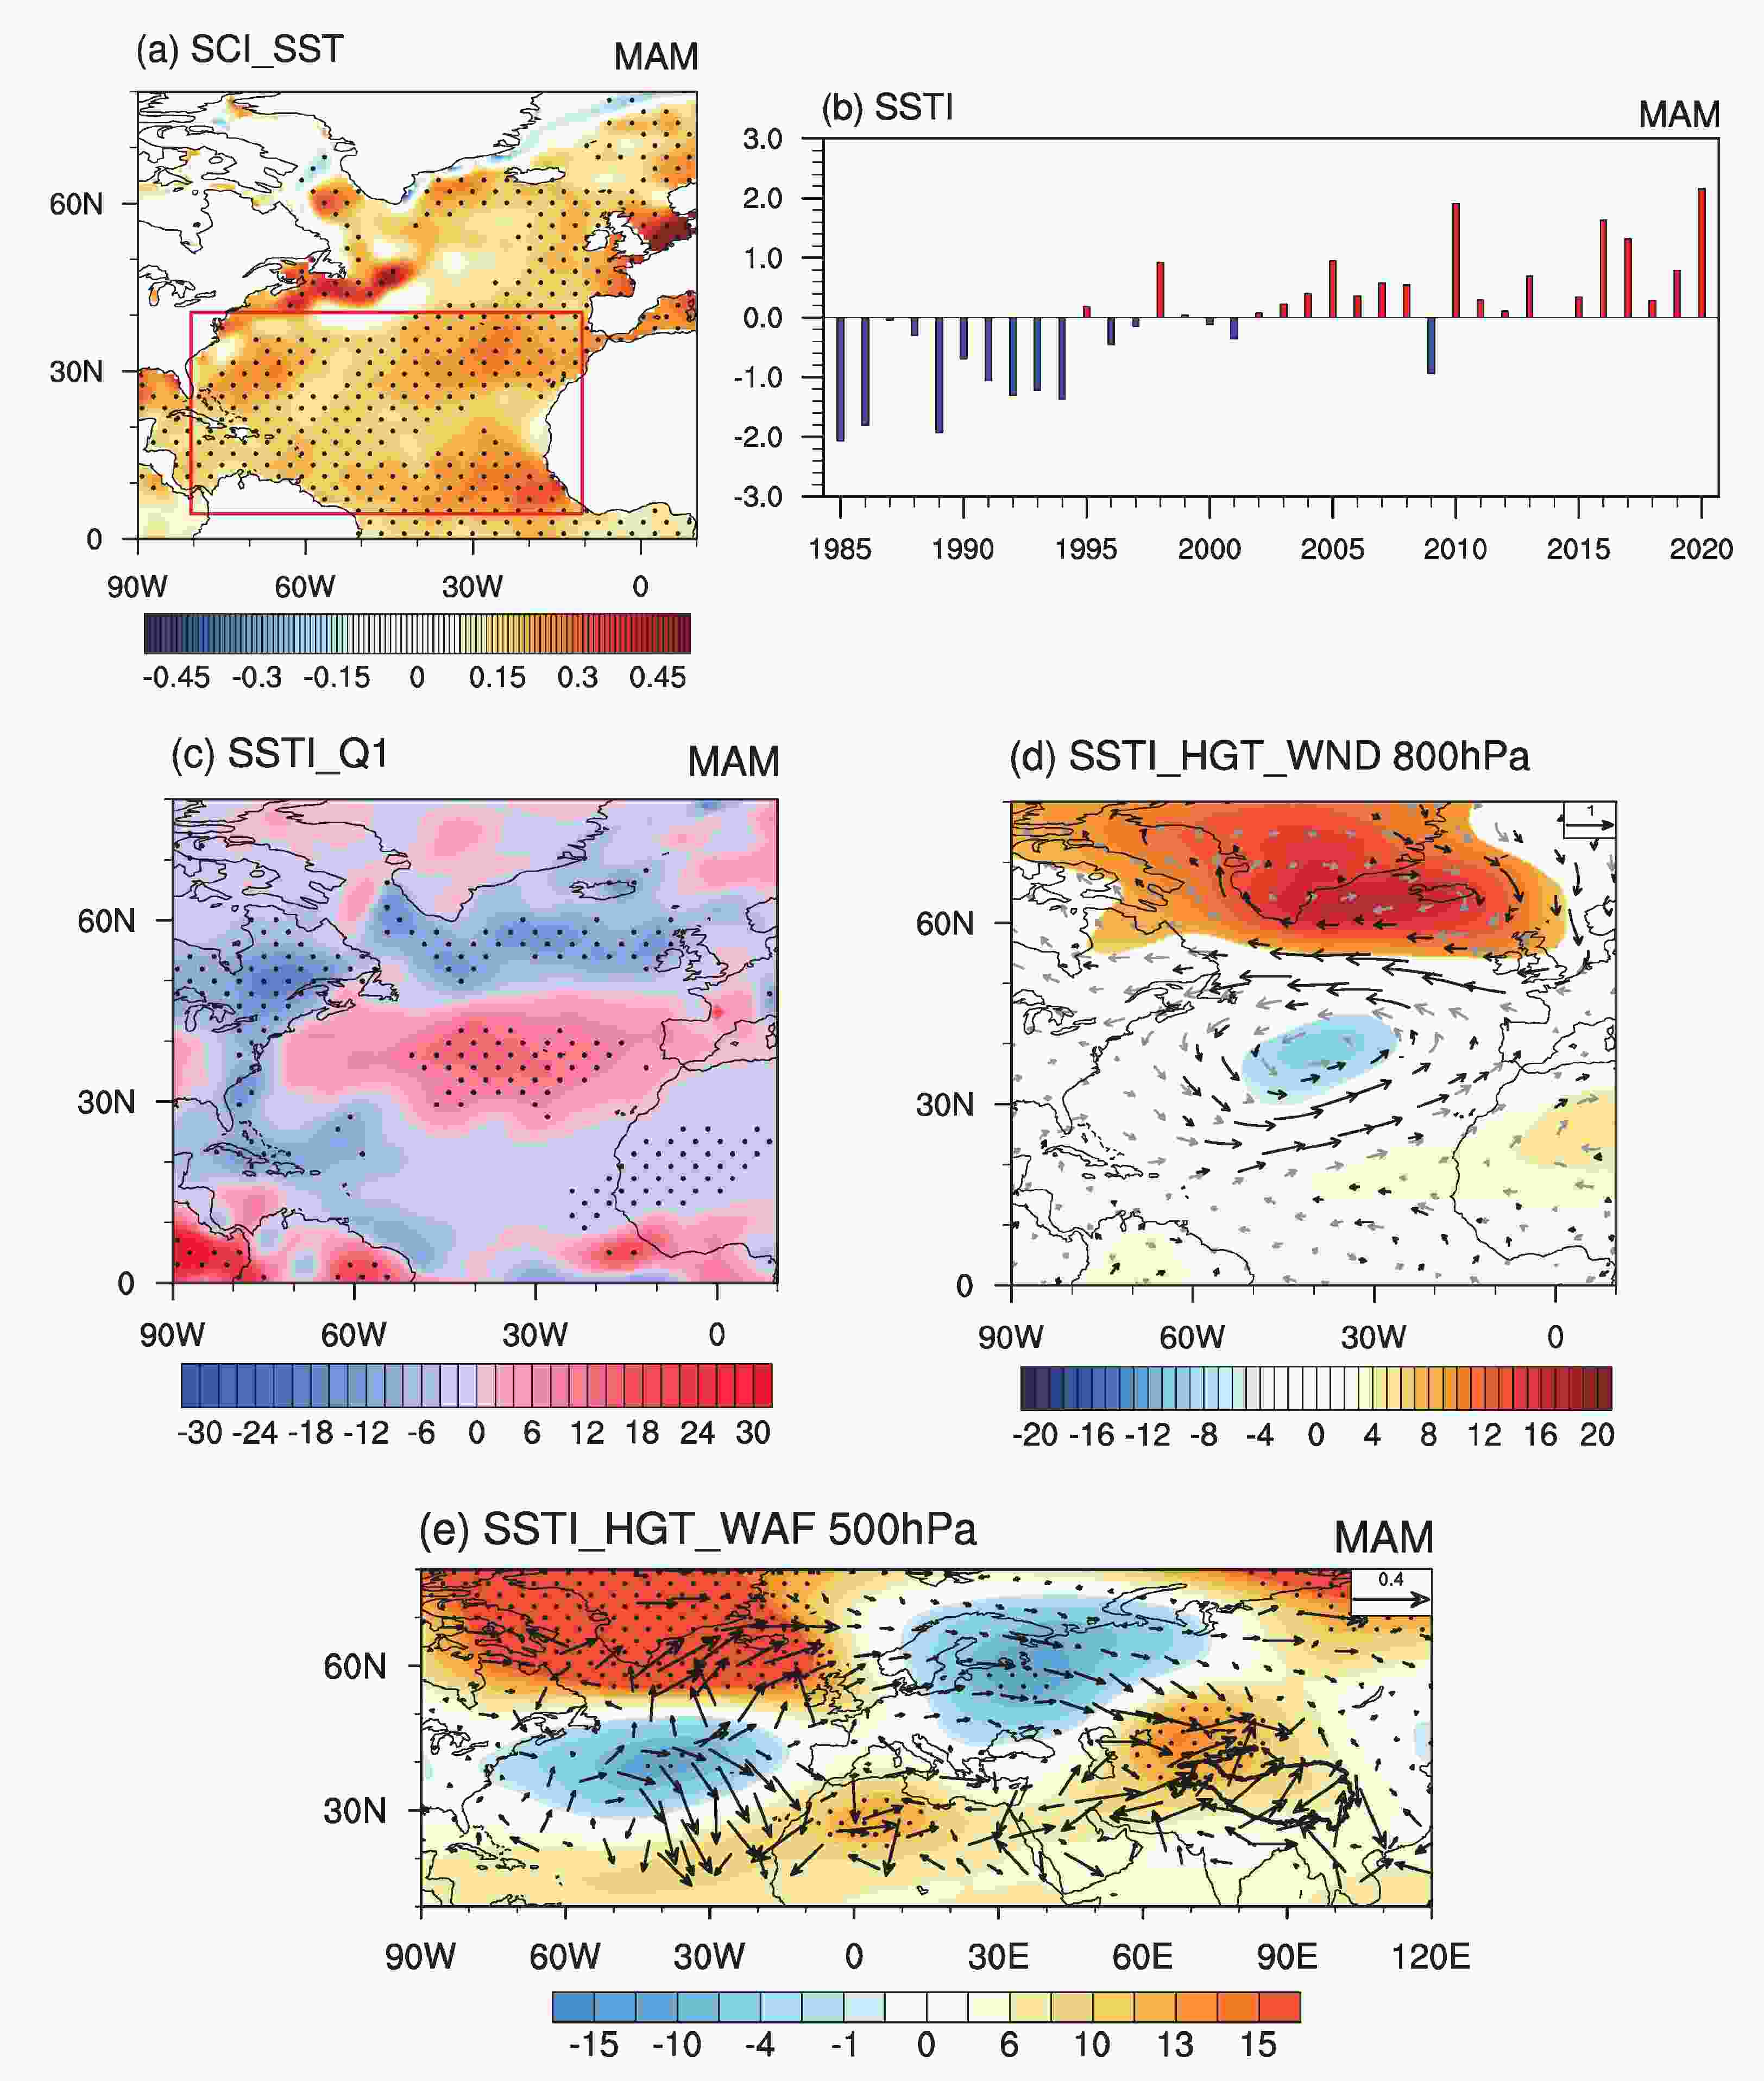
Figure 6. (a) Linear regression of the spring sea surface temperature (SST, units: °C) onto the SCI for the period 1985–2020. The red box denotes the region used to construct the North Atlantic SST index (SSTI). (b) The SSTI was obtained by an area-weighted average over the key region. The dotted regions represent the 95% confidence level. Linear regression of the (c) Q1 (units: W m–2), (d) 800-hPa HGT (units: m, shading) and wind (units: m s–1, vector), and (e) 500-hPa HGT (shading) and 500-hPa WAF (vector) that were obtained by regressing these metrics onto the SSTI for the period 1985–2020. The dotted regions represent the 95% confidence level. The shaded areas and black vectors of (d) denote the variable anomalies that are significant at a 95% confidence level.

Figure 7. Linear regression of the (a) TMP (units: °C), (b) PRE (units: mm), and (c) SC (units: %) obtained by regressing onto the North Atlantic SSTI for the period 1985–2020. The dotted regions represent the 95% confidence level.
-
A further examination of Fig. 5 reveals that the circulation anomalies related to NA SST over the continent (Fig. 6e) are weaker than those of the TP SCI (Fig. 5), especially for the negative height anomalies centered around the Barents Sea. There might be other climate factors engaging in the continental scale atmospheric circulation associated with the spring TPSC changes during this period, especially from high latitudes. Previous studies indicate that in the context of global warming, Arctic sea ice (SIC) loss contributed to climate changes in remote regions, especially over the Eurasian continent. Numerous studies have demonstrated the persistent cross-season climate impact of winter-spring Arctic SIC (Li et al., 2020; Du et al., 2022; Wu and Li, 2022). In addition, Duan et al. (2022) pointed out that the reduced sea ice over the Barents-Kara Sea could account for 18–32% of the winter warming over the TP. Given the aforementioned studies, in the following, we will explore whether the Arctic sea ice can affect the continental atmospheric circulations as well as the long-term changes of spring TPSC.
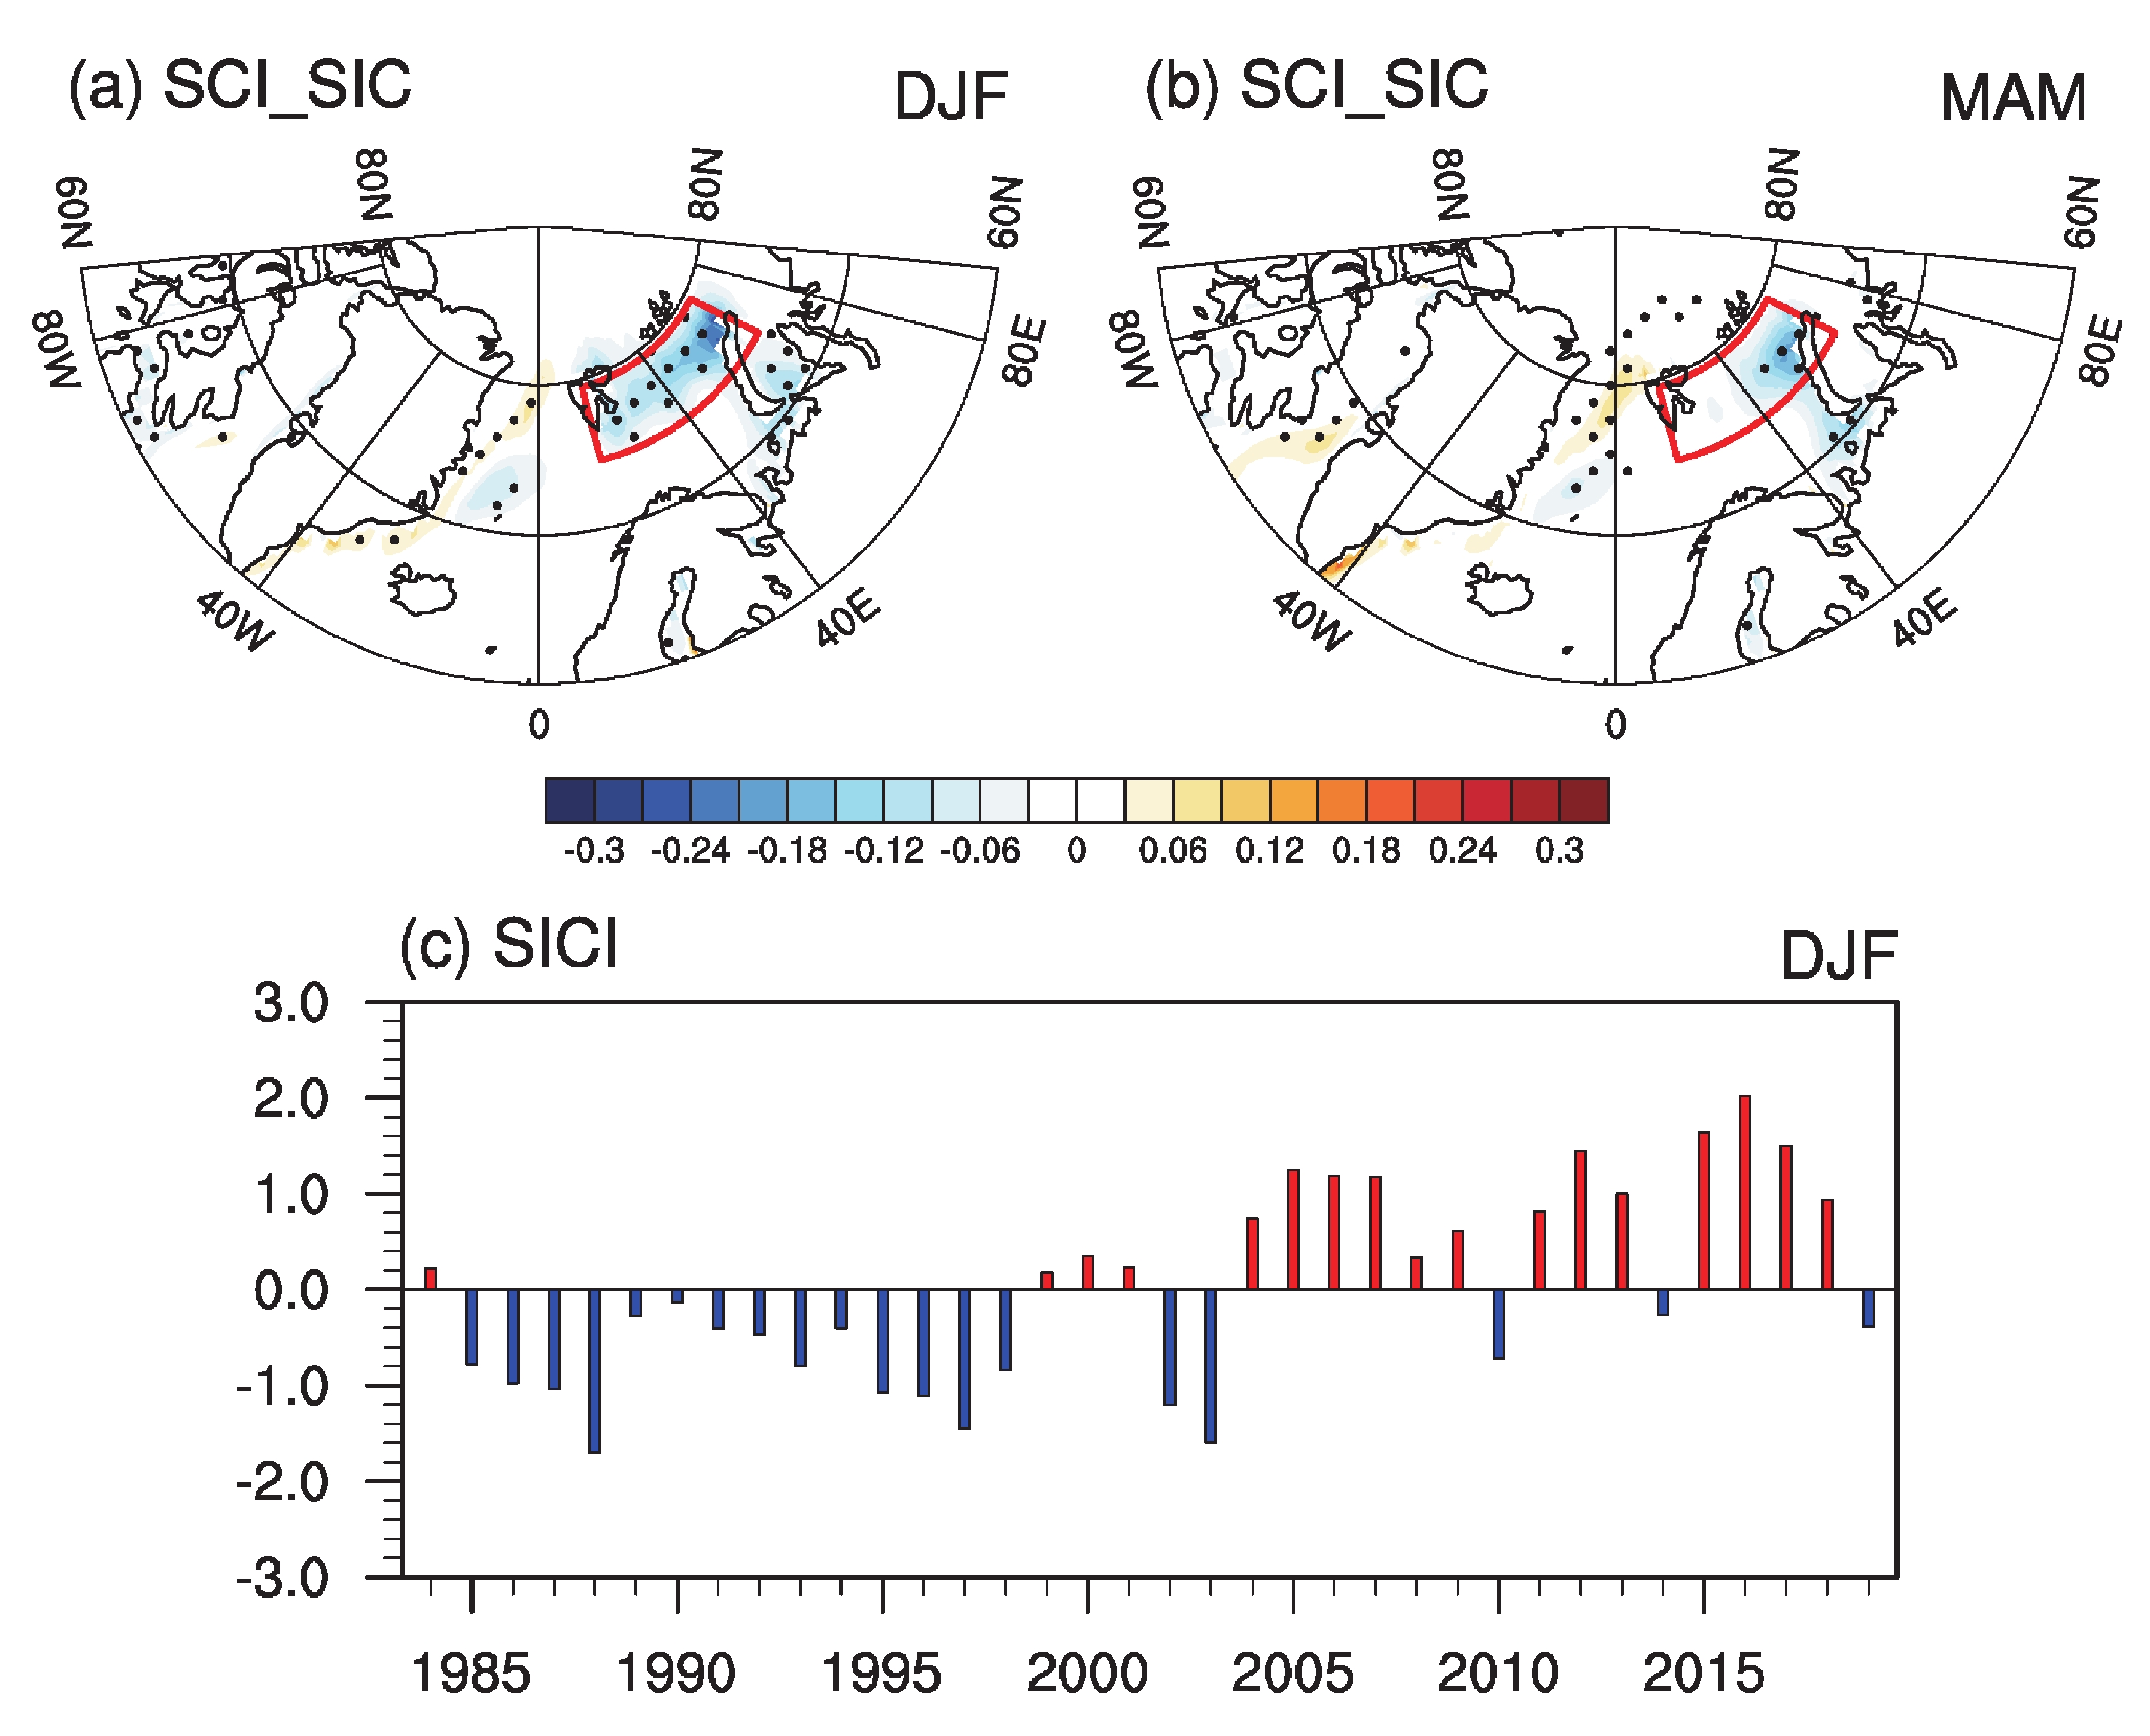
The relationship between anomalous winter Arctic SIC and TPSC changes is examined through regression analysis onto the spring TP SCI, as depicted in Fig. 8a. In conjunction with the observed spring TPSC changes, significant negative anomalies of winter SIC are evident in the vicinity of the Barents Sea (Fig. 8a), and these anomalies persist into the subsequent spring (Fig. 8b). To quantify this, a winter SIC index (SICI, Fig. 8c) is constructed by calculating the area-weighted average of winter SIC over the Barents Sea (indicated by the red rectangle in Fig. 8a). Since the correlation between the winter SICI and spring TP SCI is negative, the subsequent results have been presented after reversing the sign of the winter SICI. In other words, the following results represent anomalies associated with decreasing winter SIC around the Barents Sea. Consistent with previous studies (Stroeve et al., 2012; Comiso et al., 2017), significant increasing trends of the SICI are observed, indicating a continuous decrease in SIC over the Barents Sea during the past few decades. Additionally, the spatial distribution of the dominant empirical orthogonal function (EOF1) mode of winter Arctic SIC accounts for 47.04% of the variance in preceding winter SIC during the analyzed period (figure not shown). The correlation coefficient between the time series associated with EOF1 and SICI is 0.99, indicating that the Barents SICI serves as a representative indicator of the long-term variation in the leading mode of winter Arctic SIC.
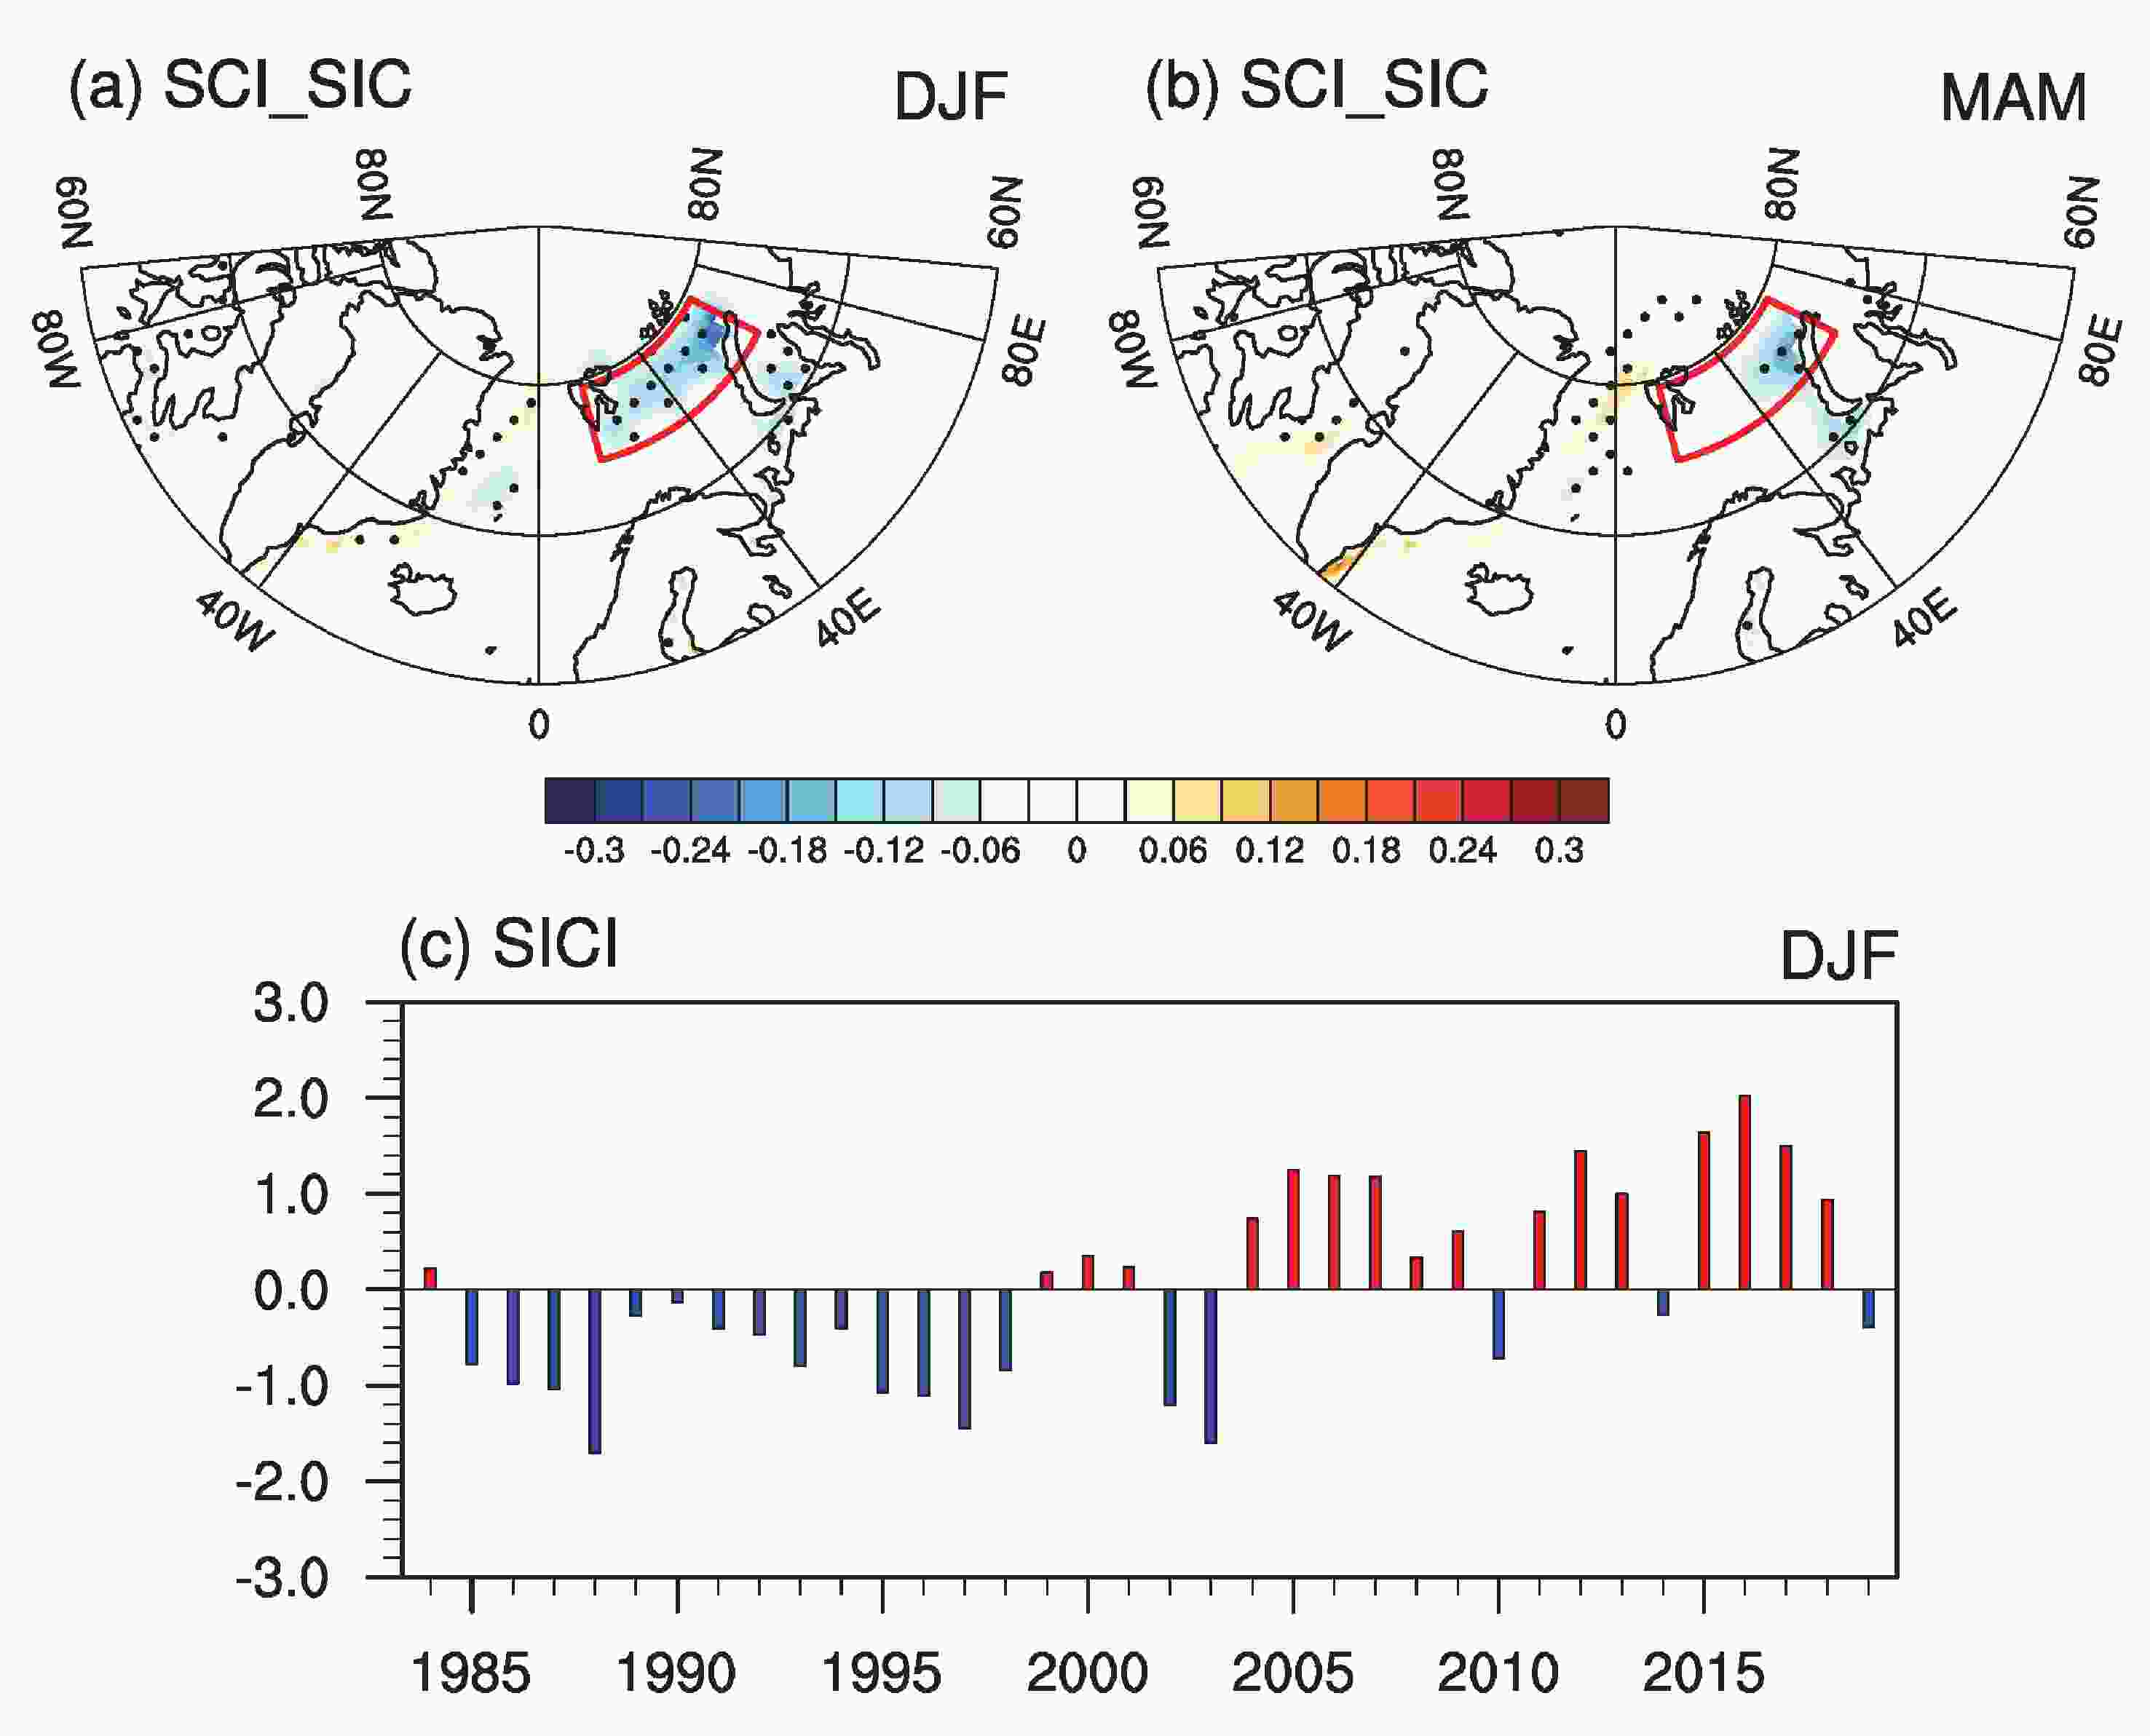
Figure 8. Linear regression of the (a) preceding winter (December-January-February) and (b) spring (March-April-May) sea ice concentrations (SIC, units: %) onto the SCI for the period 1985–2020. The red box denotes the region used to construct the Barents SIC index (SICI). Panel (c) shows the SICI that was obtained by an area-weighted average over the key region (solid bar charts which have been reversed). The dotted regions represent the 95% confidence level.
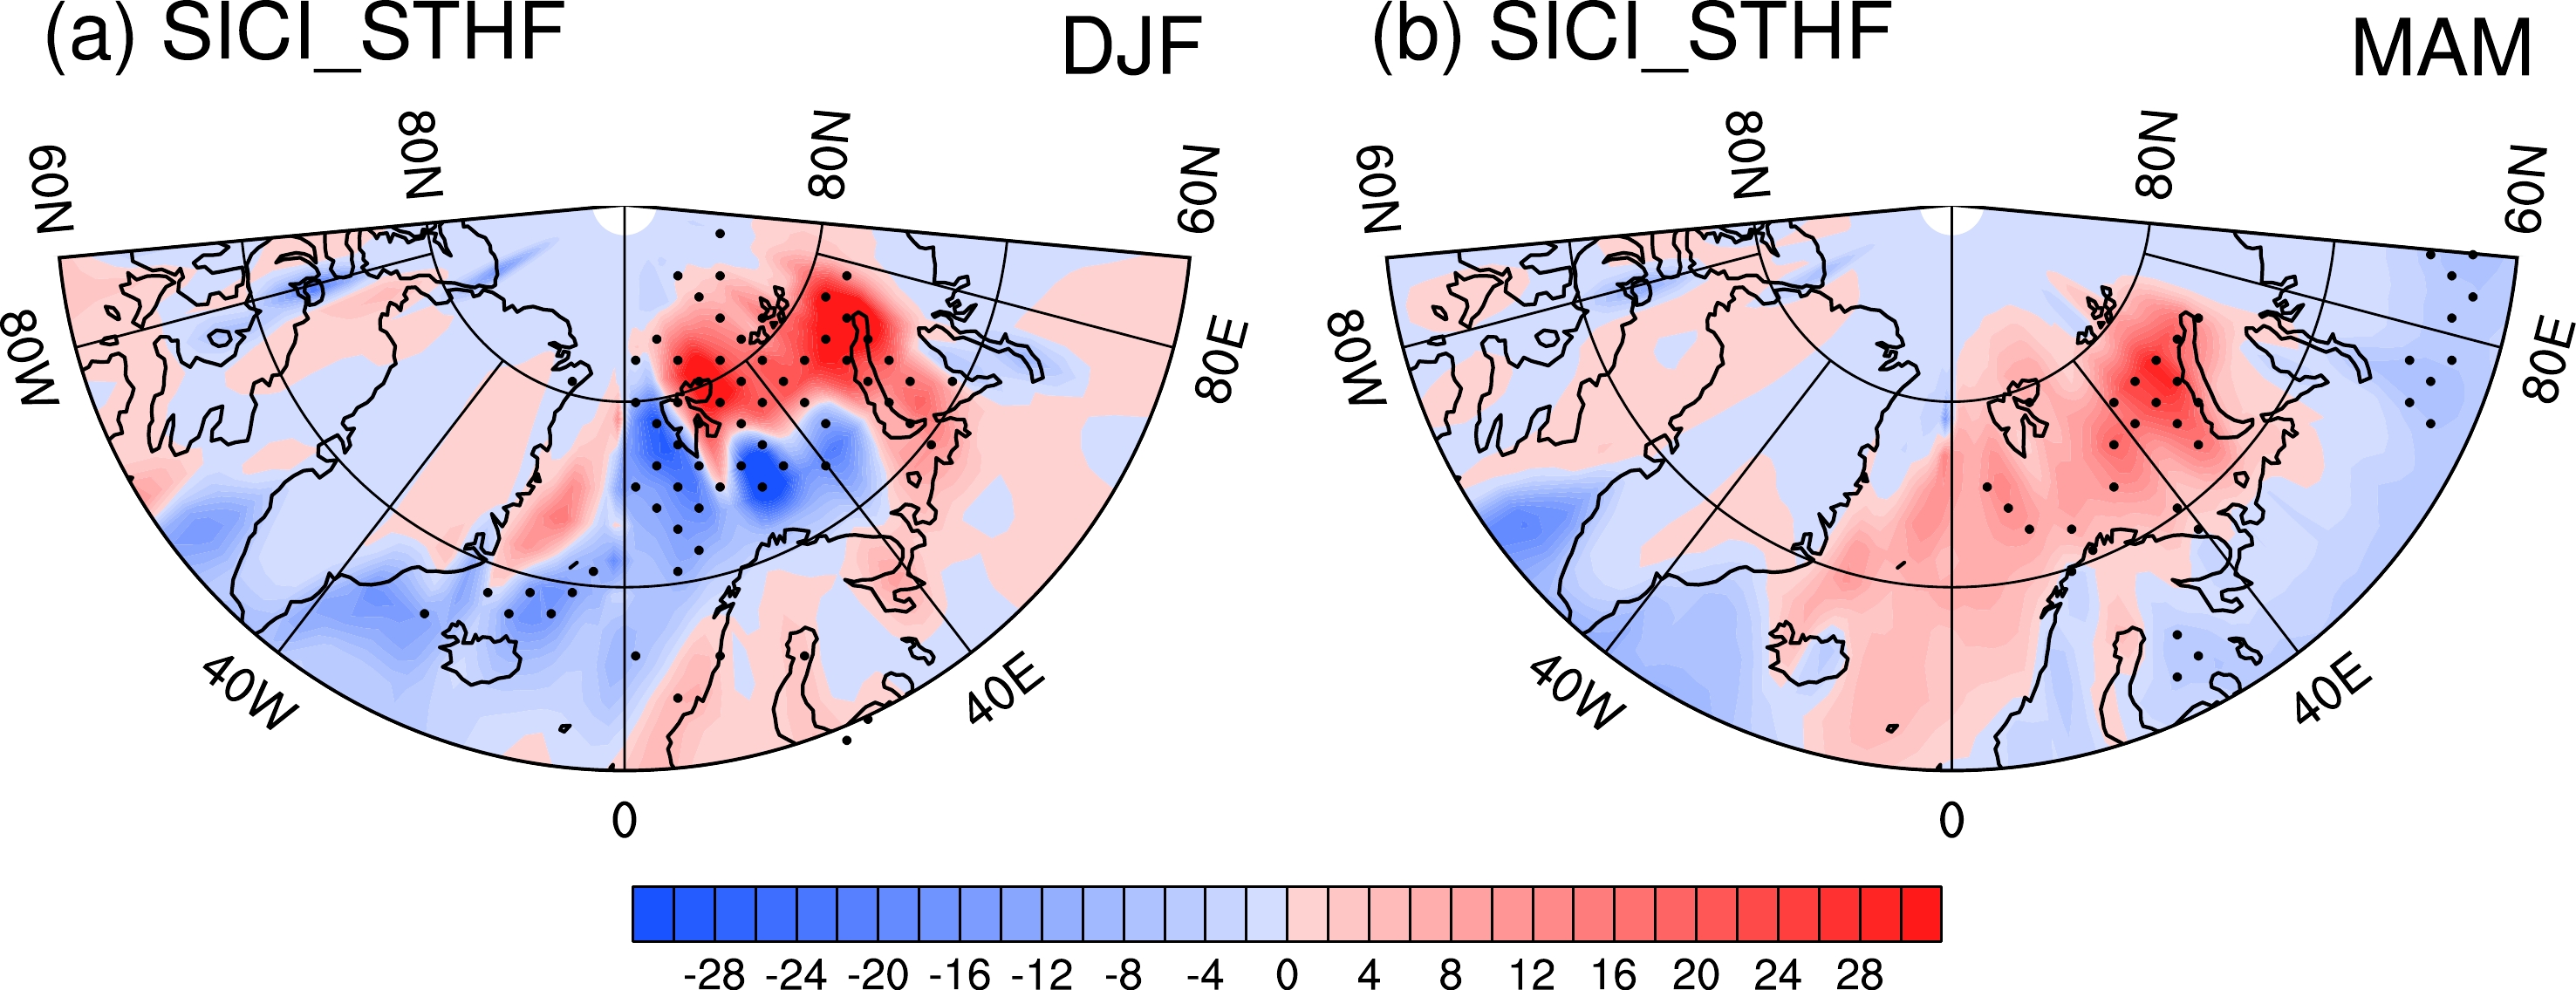
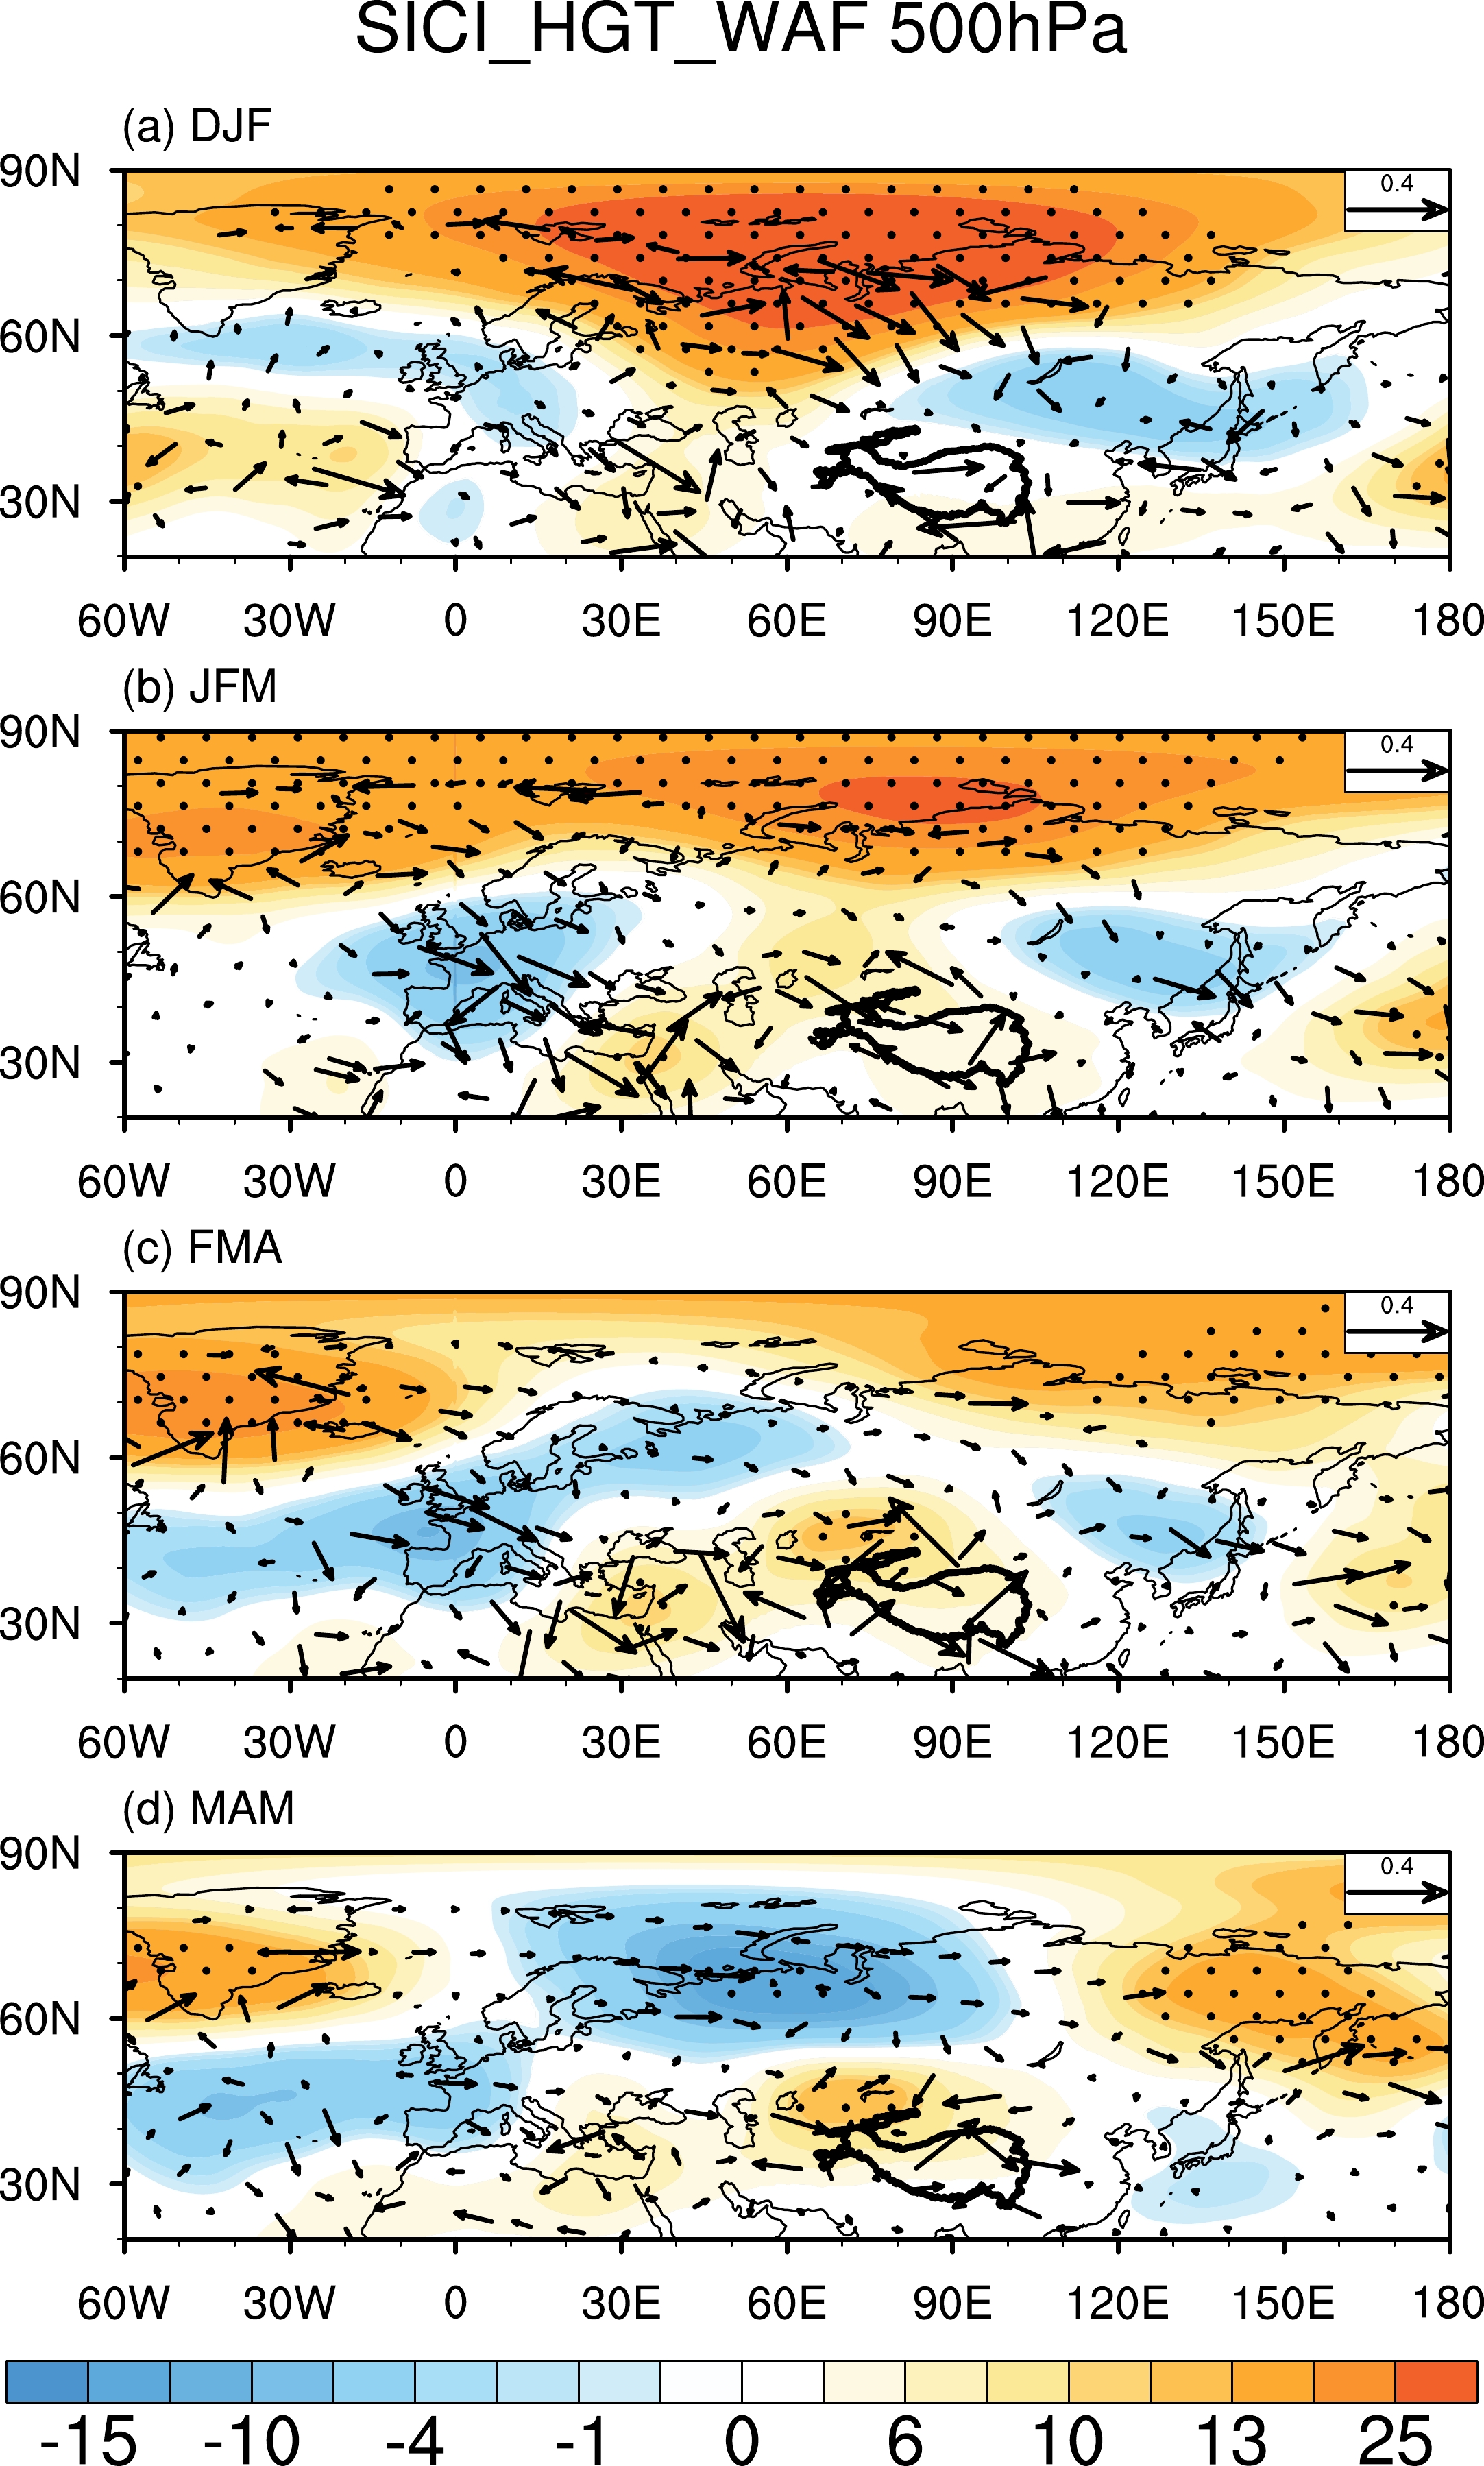
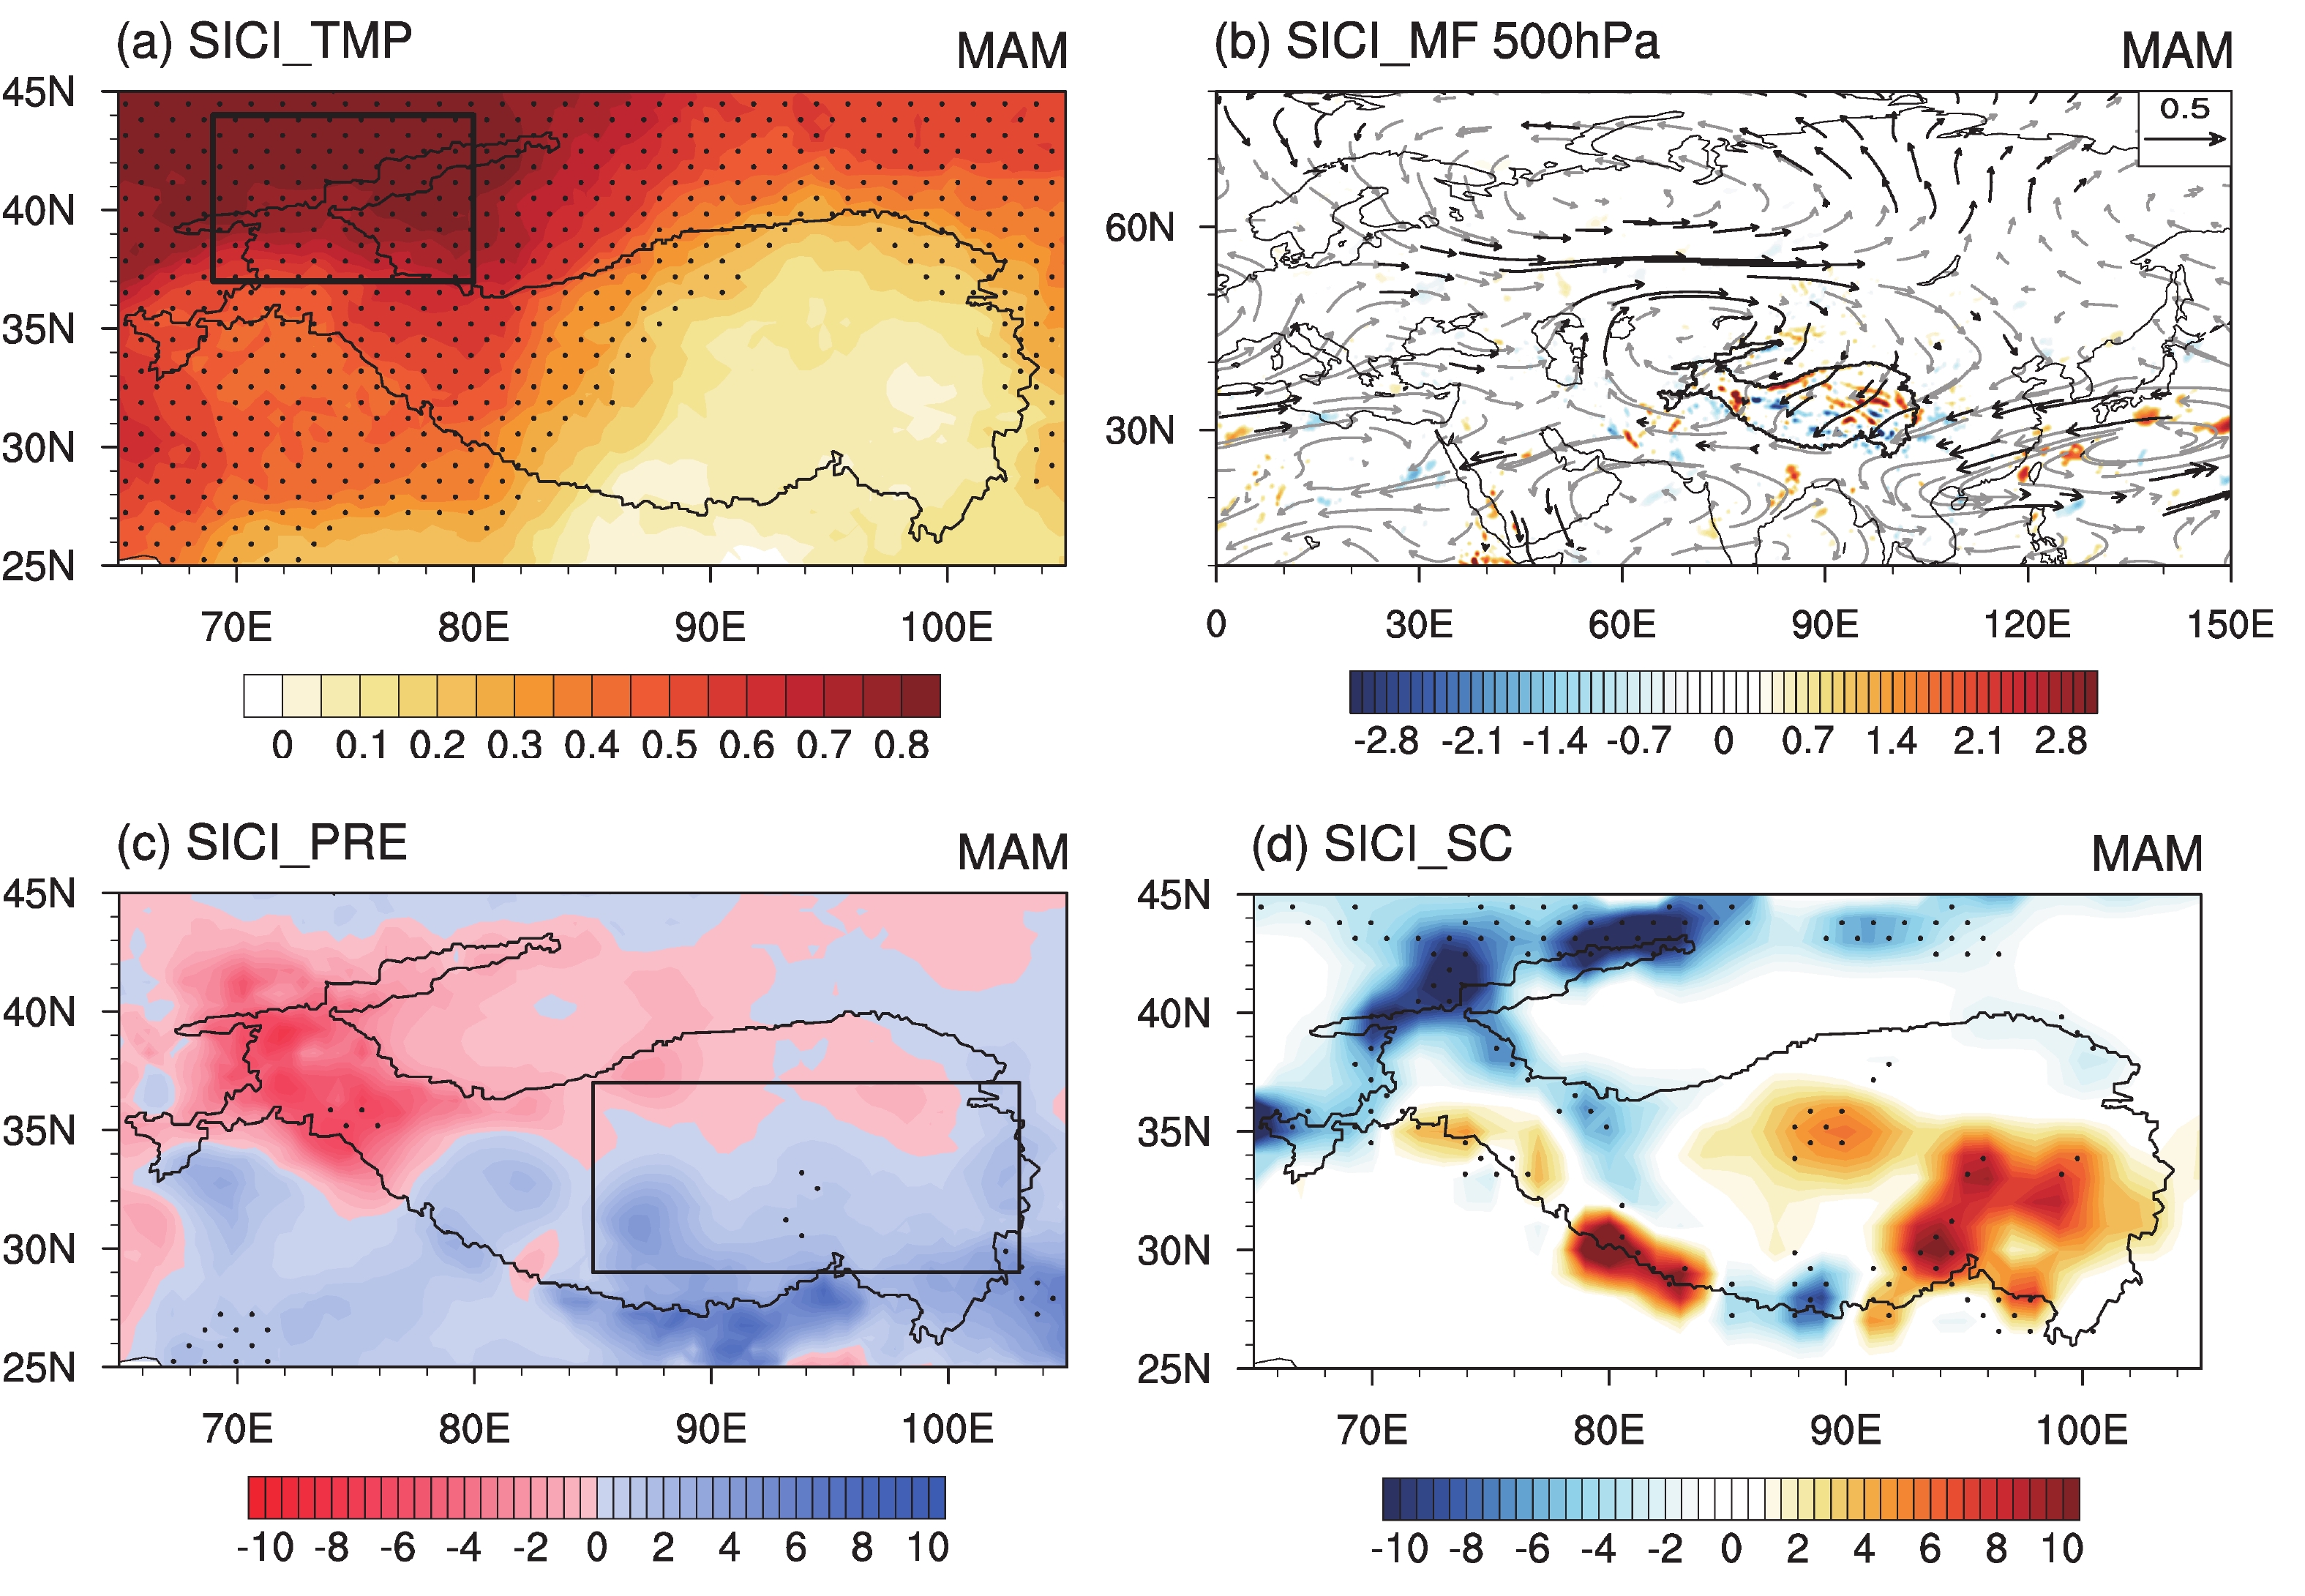
To understand the process of how the winter Barents SIC loss impacts the spring snow cover over TP, the Arctic ice-related surface turbulent heat flux (STHF) anomalies are calculated and presented in Fig. 9. Pronounced positive STHF anomalies are observed over the Barents Sea in the preceding winter (Fig. 9a), which maintain and expand westward in the following spring (Fig. 9b), suggesting that the ocean-to-atmosphere heating due to preceding winter Barents SIC loss can sustain its effects into the spring. Anomalous 500-hPa geopotential height and corresponding wave activity flux from the preceding winter to the following spring are obtained by regressing these variables onto the SICI to examine how the winter Barents SIC impacts the atmosphere (Fig. 10). In winter, associated with decreased Barents SIC, significant positive height anomalies can be observed in the polar region centered in (60°E, 70°N) (Fig. 10a). The positive height anomalies in the polar region extend and split into two centers in the following two months and form two branches of Rossby waves (Fig. 10b). One branch propagates eastward with time along a high-latitude path and to east Asia and Pacific region, and the other branch propagates southeastward and intensifies with time (Figs. 10c, d). In spring, negative and positive height anomalies appear around the Barents Sea and northwest TP, which cause local warming (Fig. 11a) and reduced snow cover over the western TP (Fig. 11d). The anomalous Arctic SIC-related moisture flux (MF) is presented in Fig. 11b which shows that more water vapor is transported from the Arctic to the TP. In addition, easterly winds along the southern flank of the anomalous anticyclone are brought in from the Pacific to the southeastern side of TP where an area of moisture convergence is formed and the SIC-related moisture fluxes cause a significant increase in regional precipitation (Fig. 11c) and snow cover (Fig. 11d) over the eastern TP. The above analysis suggests that the anomalous winter Arctic sea ice can impact the TPSC by modulating the atmospheric circulations and the transport of water vapor to the TP.
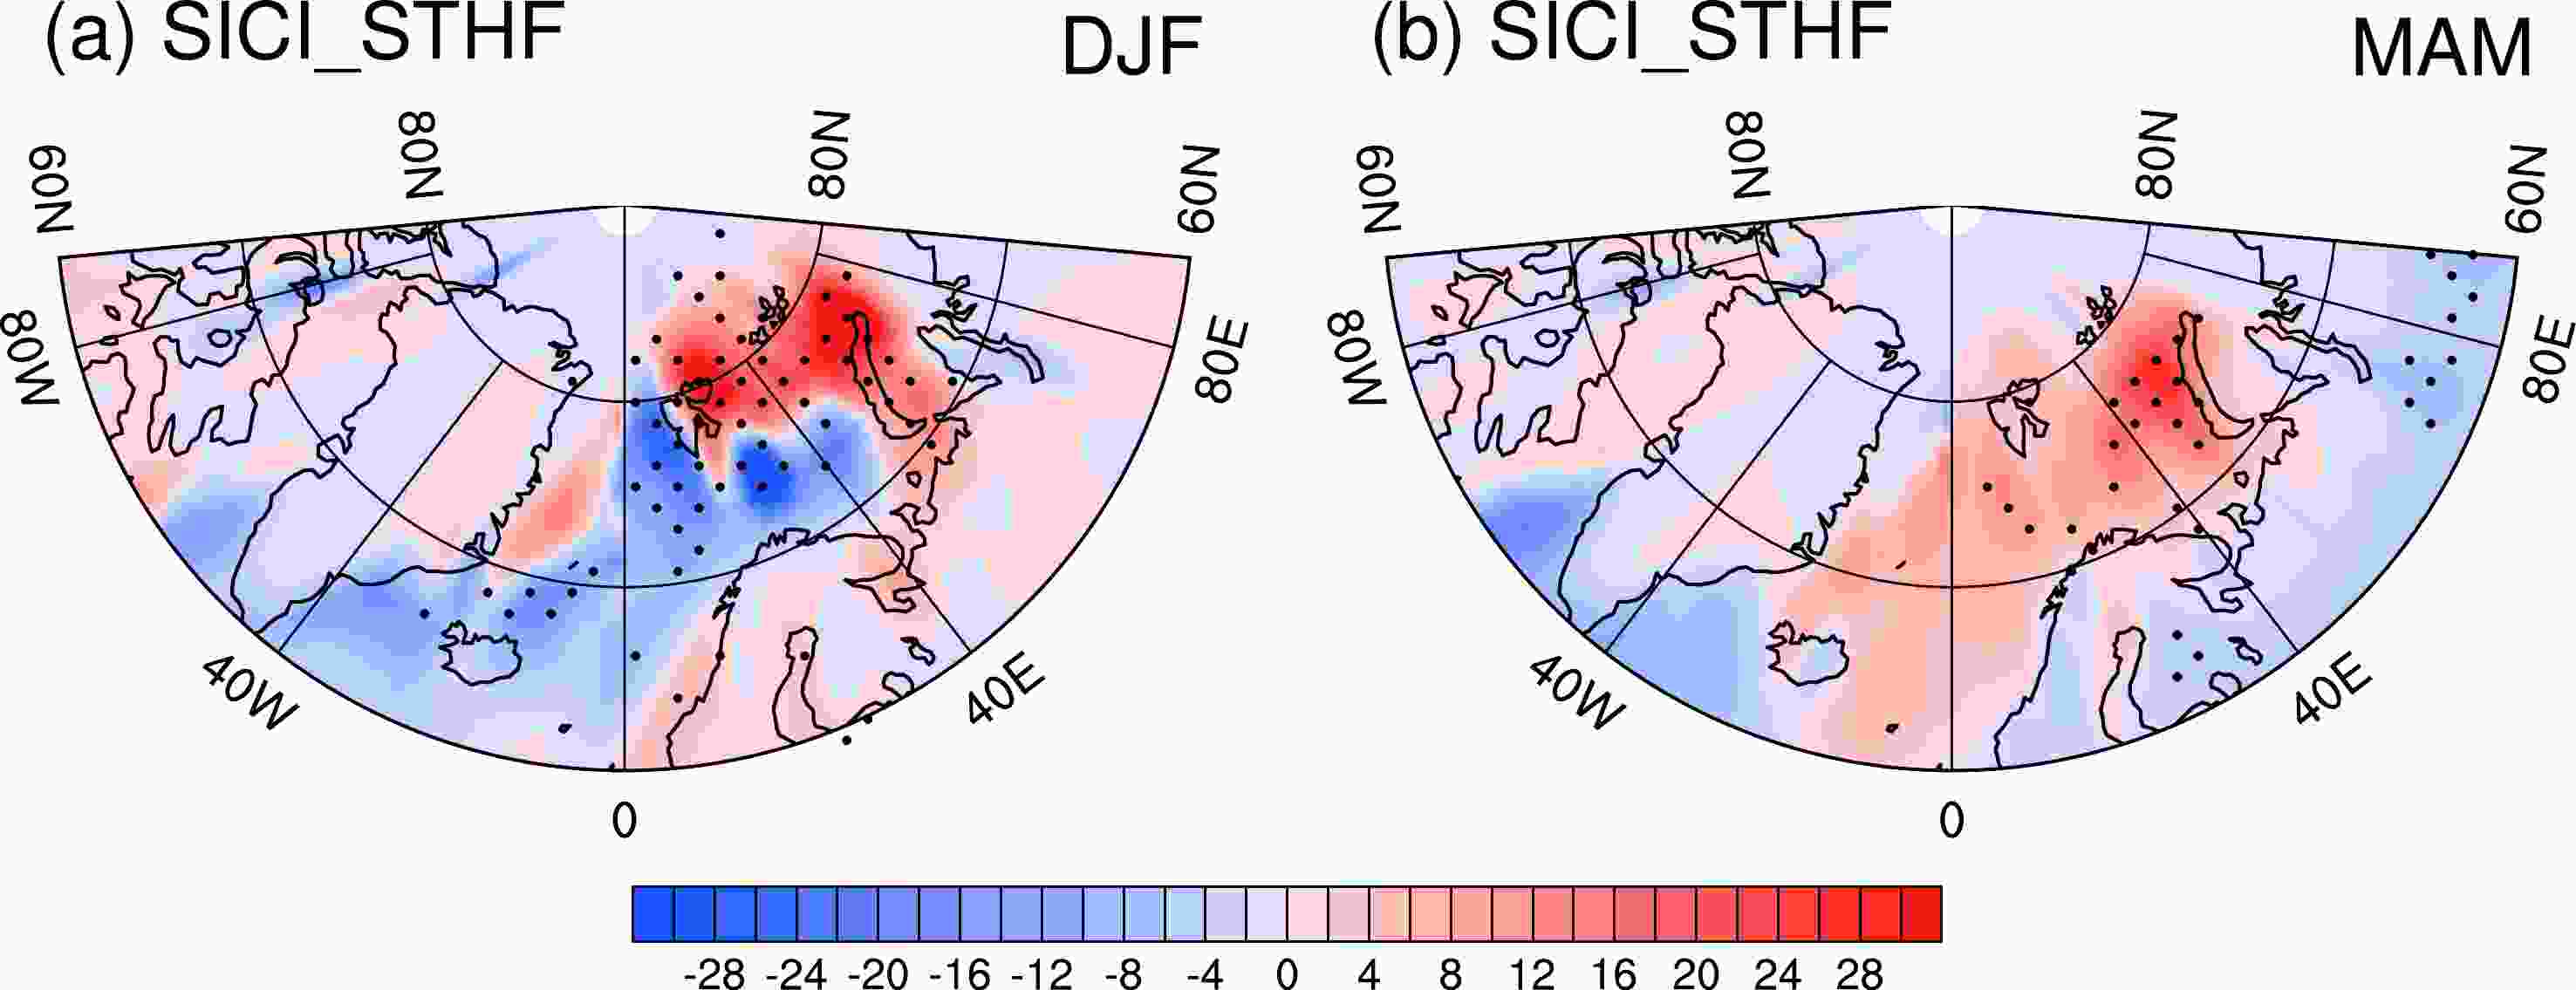
Figure 9. Regression maps of the (a) preceding winter and (b) spring surface turbulent (sensible + latent) heat flux (STHF, units: W m–2) onto the SICI for the period 1985–2020. The dotted regions represent the 95% confidence level.
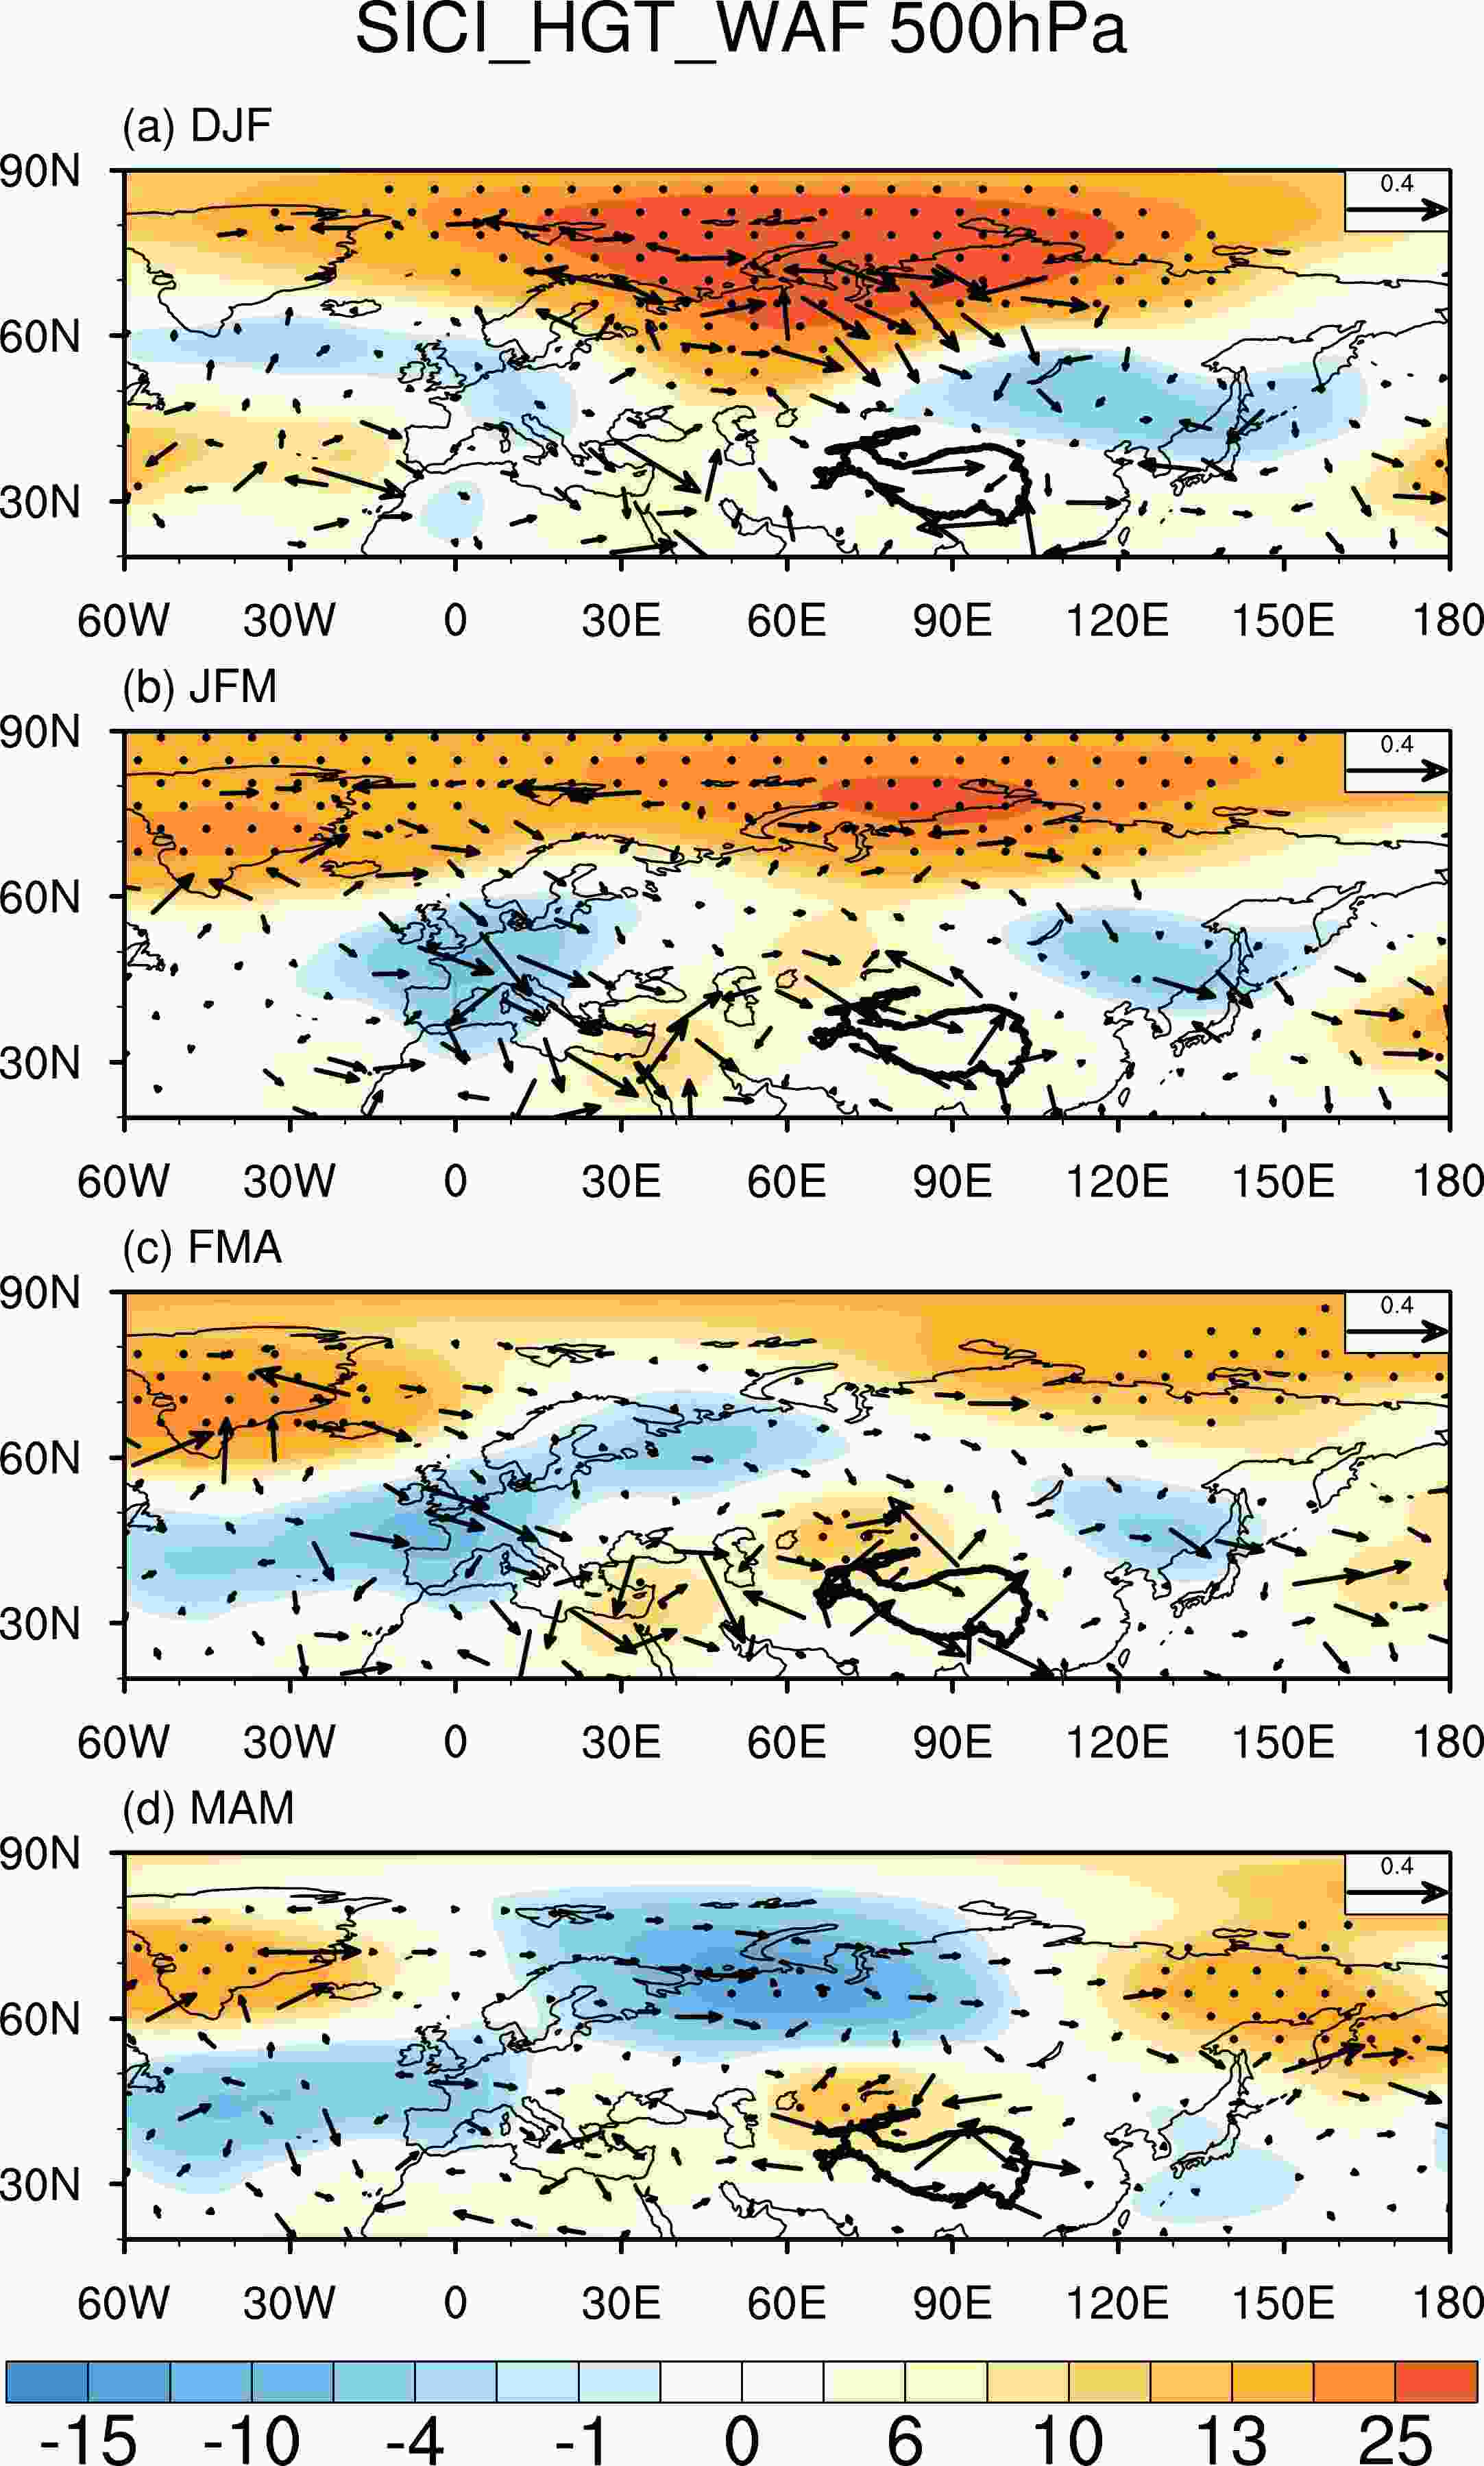
Figure 10. Regression maps of 500-hPa HGT (shading) and 500-hPa WAF (vectors) onto the SICI during (a) the preceding December-January-February (DJF), (b) the preceding January-February-March (JFM), (c) the preceding February-March-April (FMA), and (d) March-April-May (MAM) for the period 1985–2020. The dotted regions represent the 95% confidence level.
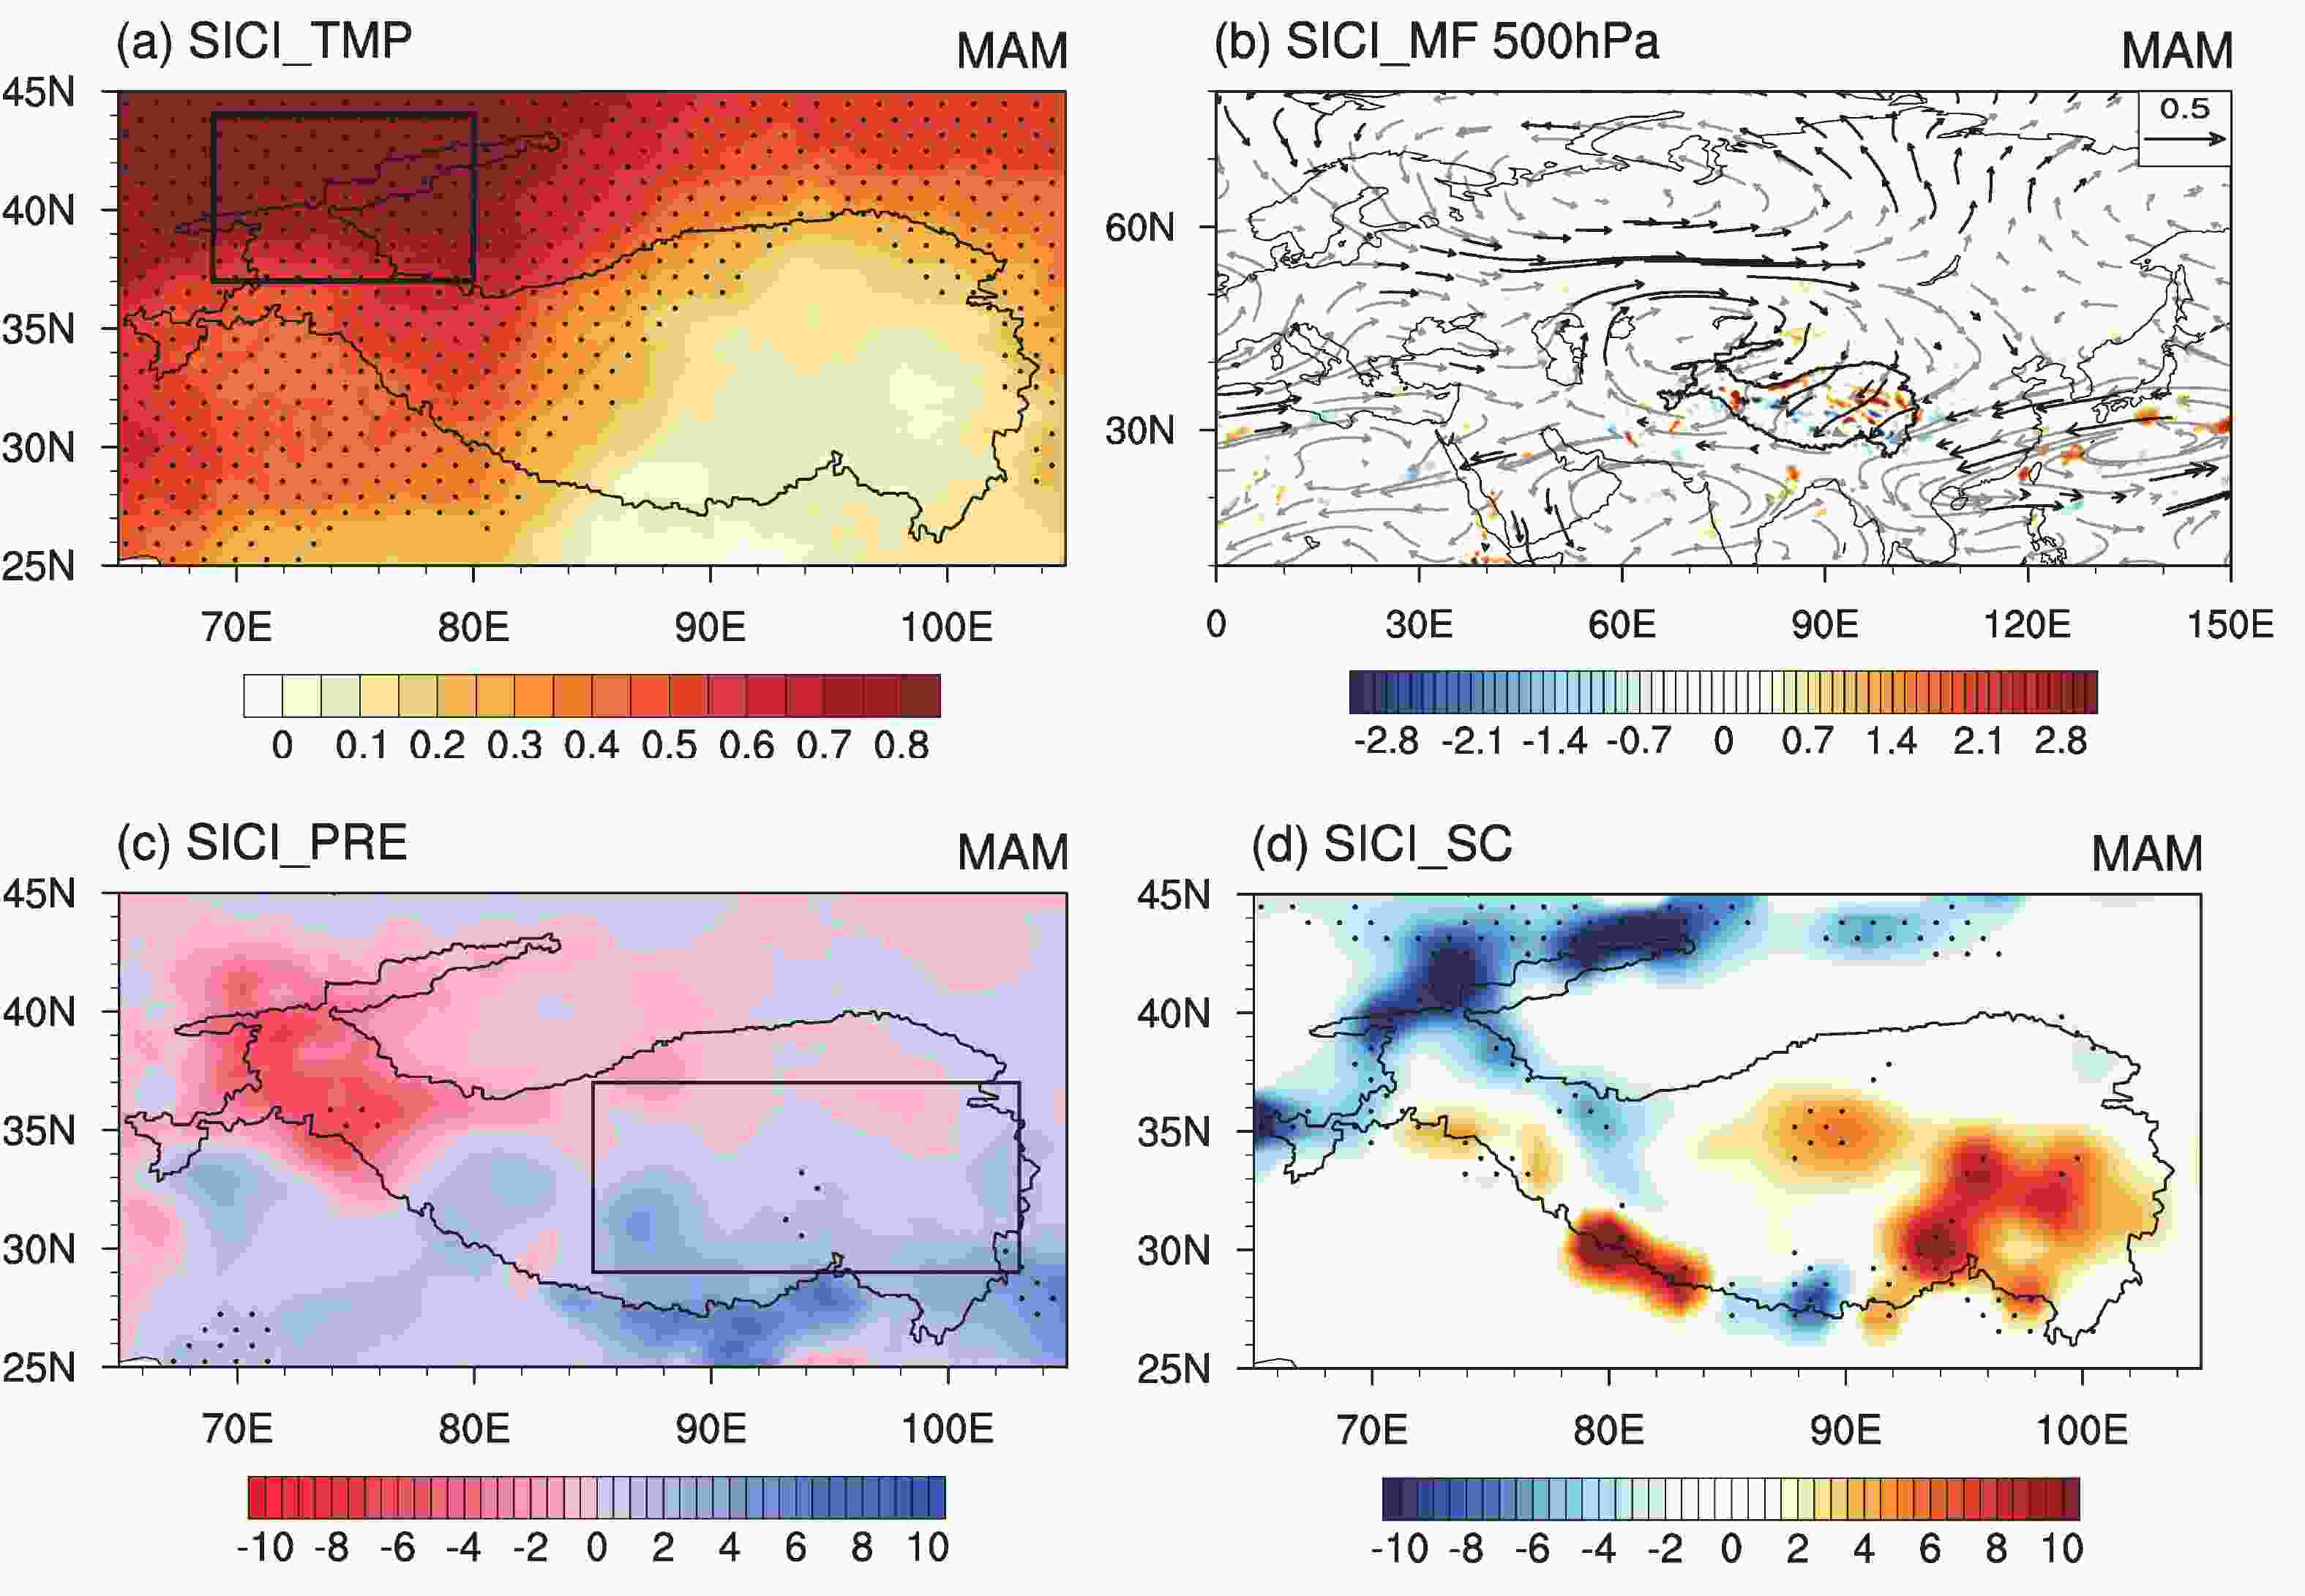
Figure 11. The SIC-related spring (a) TMP (units: °C), (b) 500-hPa divergence of MF (units: kg m–1 s–1, shading) and MF (vector), (c) PRE (units: mm), and (d) SC (units: %) obtained by regressing onto the SICI for the period 1985–2020. The dotted regions represent the 95% confidence level. The shaded areas and black vectors in (b) denote the variable anomalies that are significant at the 95% confidence level.
-
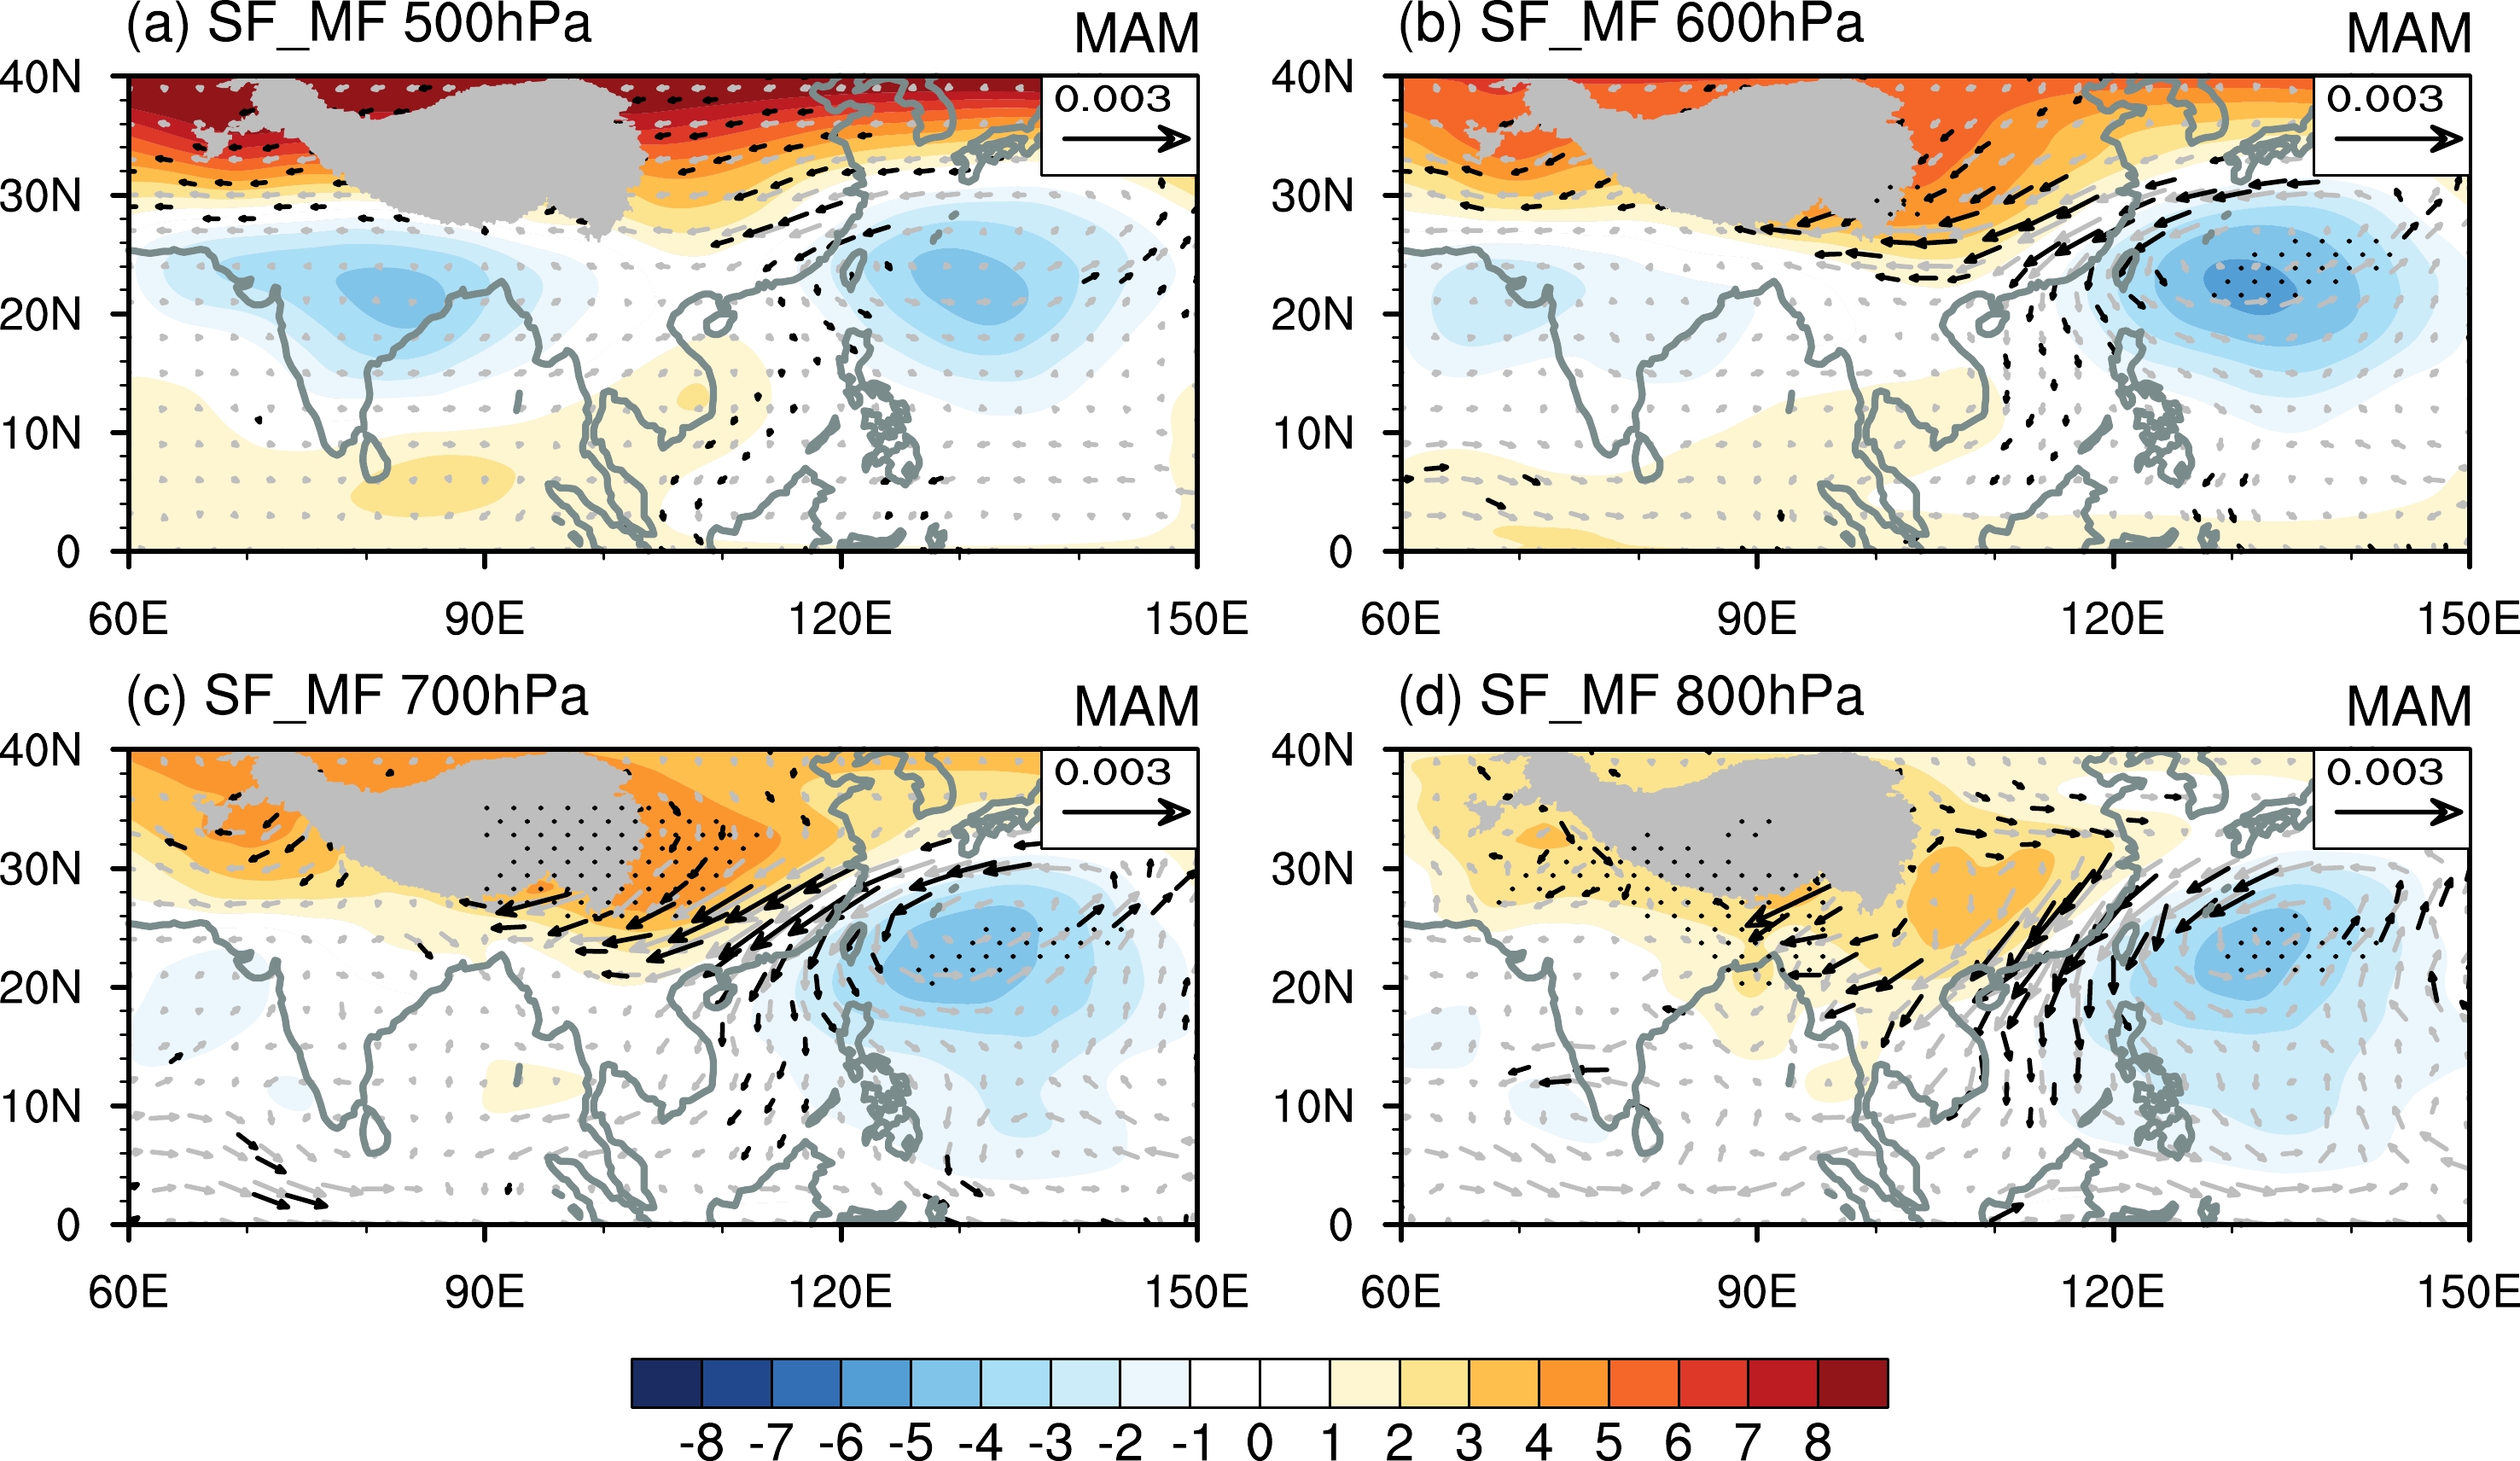
In the preceding section, we investigated the influence of SST and sea ice in upstream regions on the changes in spring snow cover over the TP. However, in addition to these factors, long-term variations in precipitation also play a crucial role in explaining TPSC changes. As mentioned earlier, previous studies have highlighted the role of intensified subtropical stationary waves in influencing regional hydroclimatic variability through the transport of moisture by large-scale atmospheric flows (Nigam and DeWeaver, 2003; Braganza et al., 2004; Yuan et al., 2015). To assess whether changes in subtropical stationary waves can impact spring TPSC changes, we conducted a composite analysis of the streamfunction and moisture flux (Fig. 12) based on selected high and low spring TP SCI years (Table 1).
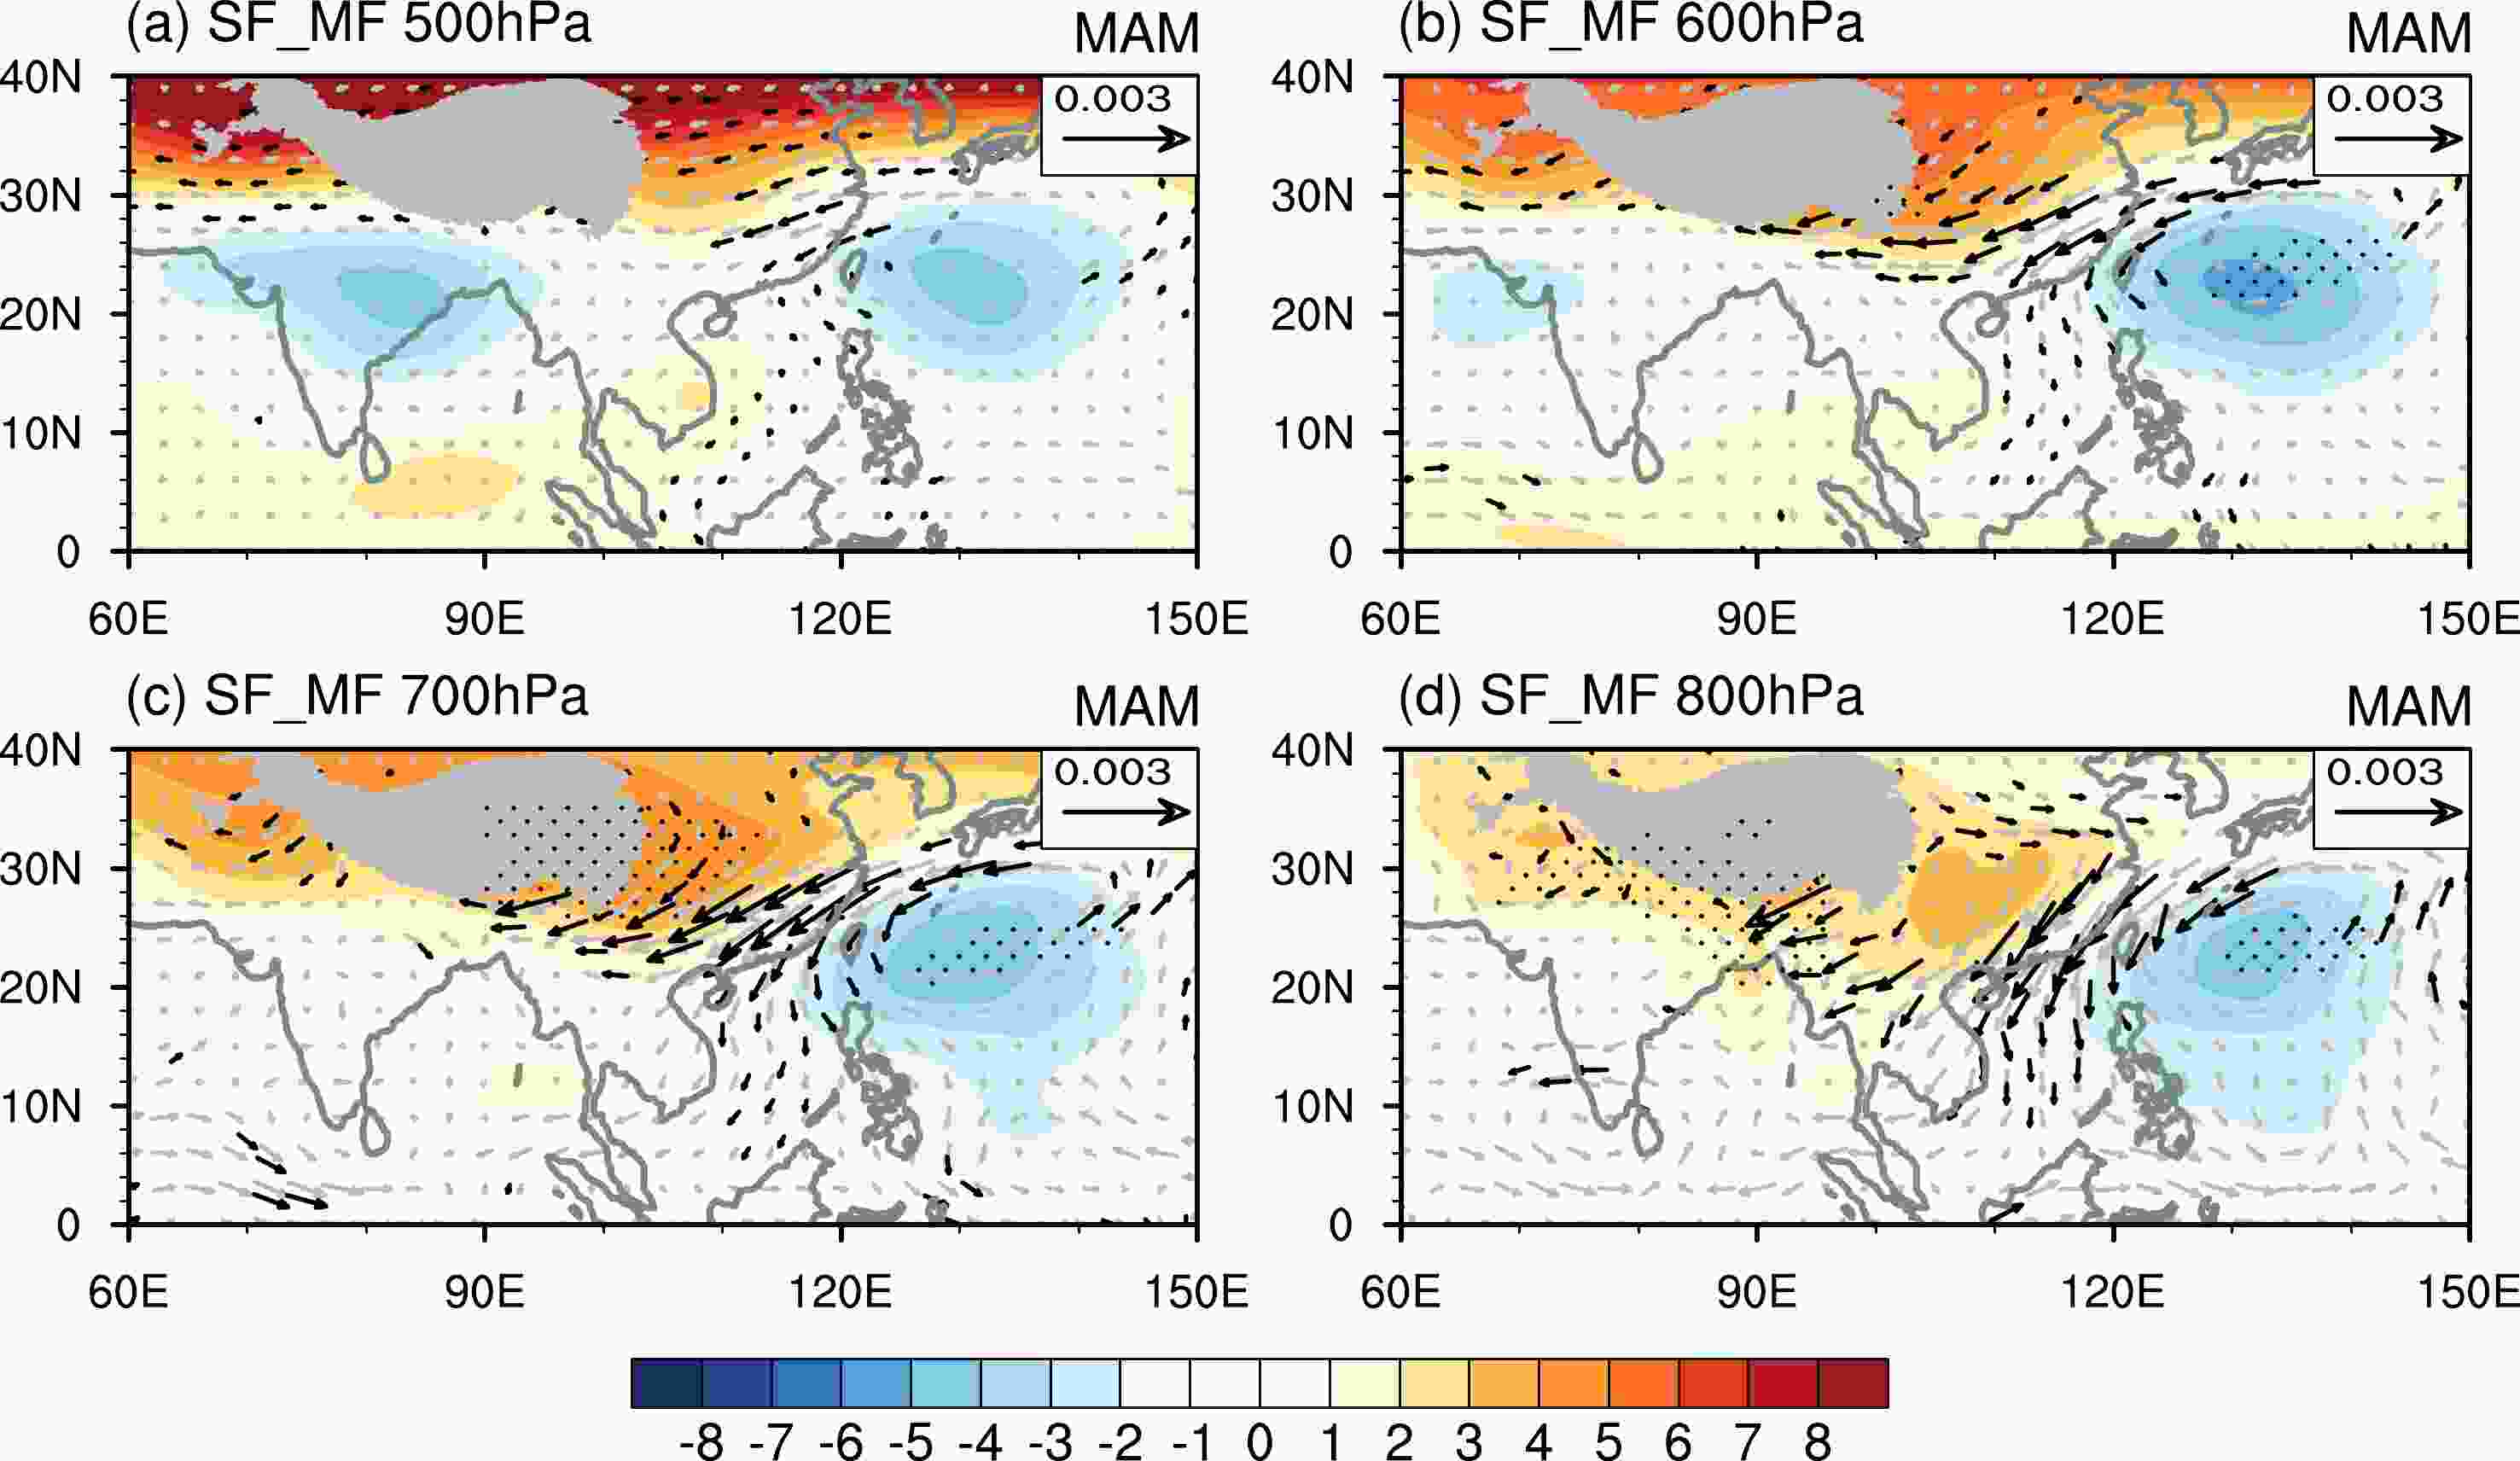
Figure 12. Composite of the spring eddy streamfunction (SF, units: m2 s–1, shading) and MF (vector) based on the selected high and low SCI years at (a) 500 hPa, (b) 600 hPa, (c) 700 hPa and (d) 800 hPa (units: m, shading). The dotted regions represent the 95% confidence level. The black vectors denote that the MF anomaly is significant at the 95% confidence level.
SCI Year Index High 2008 1.03 2018 1.12 2019 1.07 2020 1.59 Low 1985 −1.85 1986 −1.11 1987 −1.03 1988 −1.14 1989 −1.02 1991 −1.13 1992 −1.24 1996 −1.20 Table 1. Selected high SCI (higher than 1.0) and low SCI (lower than 1.0) snow cover years.
The composite analysis reveals the presence of negative and positive height anomalies over the North Pacific and Eurasian continent (Fig. 12), respectively, which are associated with changes in spring TPSC. Notably, these anomalies are more pronounced in the lower troposphere. In the lower troposphere, we observe a strengthening of the anticyclonic system over East Asia and a cyclone system over the western North Pacific Ocean (Figs. 12c, d). This configuration leads to increased westward moisture transport from the ocean towards the southeastern side of the TP. Consequently, this enhanced moisture convergence results in increased precipitation over the southeastern TP and creates favorable conditions for increased E_TPSC.
-
Tibetan Plateau snow cover, characterized by significant spatial and temporal variability, represents a crucial natural surface feature. Investigating the physical mechanisms underlying its regional and seasonal changes can enhance our understanding of the role and response of the TP within the climate system. This study examines the potential climate factors contributing to the long-term variations in spring TP snow cover (TPSC) over the period from 1985 to 2020. Distinct snow cover changes are observed between the western and eastern TP, with a significant decrease in snow cover in the west and an increase in the east. The findings suggest that the declining trend in western TPSC can be primarily attributed to rising temperatures, whereas the increase in eastern TPSC is closely linked to enhanced precipitation over the eastern TP.
Local-scale processes analysis reveals the presence of a prominent anticyclonic system situated over the northwestern TP, which plays a crucial role in driving the observed spring TPSC changes. This anomalous anticyclonic system is associated with descending motion and adiabatic heating, leading to local warming and snowmelt, subsequently reducing western TPSC. Additionally, easterly winds along the southern flank of this system intensify moisture transport from the ocean and are accompanied by ascending motion, thereby favoring increased eastern TPSC. Further investigation indicates that positive North Atlantic SST anomalies in spring exert a warming effect on the overlying atmosphere, triggering a wave train-like atmospheric pattern that propagates downstream and reaches the TP, contributing to the formation of the anomalous anticyclone over the northwest TP which serves to impact TPSC changes. The loss of ice in the Barents Sea during the preceding winter exerts a persistent heating effect on the atmosphere, modulating the atmospheric circulation over the Eurasian continent and contributing to the anticyclonic system located to the northwest of the TP. Furthermore, a composite analysis reveals that the positive precipitation anomaly observed over the eastern TP is also attributed to the amplification of subtropical stationary waves.
While this study comprehensively examines the impacts of the North Atlantic SST, Arctic sea ice, and stationary waves on the long-term variations in spring TPSC, it is important to acknowledge that other factors, such as certain slowly evolving atmospheric modes (You et al., 2020; Li et al., 2021), may also influence TPSC changes. Moreover, the study did not undertake a quantitative assessment of the individual contributions of these factors. Future research efforts that incorporate numerical models hold promise for addressing this limitation and providing a more in-depth understanding of the relative importance of each factor. Additionally, considering that the snow cover data from NOAA CDR used in this article has nonnegligible uncertainty, we also examine the linear trends of spring TPSC derived from MODIS and ERA5 reanalysis (not shown). The results of these two datasets both show the east increase-west decrease changes which are reasonably consistent with the pattern of spring snow cover trends in the NOAA data, indicating that the results obtained in the manuscript are reliable. However, it is crucial to recognize the presence of uncertainties associated with the satellite-based snow cover data. These uncertainties underscore the necessity for further investigation and exploration of supplementary datasets to enhance the robustness and reliability of the findings.
Acknowledgements. This research is funded by the National Natural Science Foundation of China (Grant No. 42075050) and Fundamental Research Funds for the Central Universities (Grant No. K20220232).
| SCI | Year | Index |
| High | 2008 | 1.03 |
| 2018 | 1.12 | |
| 2019 | 1.07 | |
| 2020 | 1.59 | |
| Low | 1985 | −1.85 |
| 1986 | −1.11 | |
| 1987 | −1.03 | |
| 1988 | −1.14 | |
| 1989 | −1.02 | |
| 1991 | −1.13 | |
| 1992 | −1.24 | |
| 1996 | −1.20 |


 AAS Website
 AAS WeChat