


 DownLoad:


-
The global mean temperature in 2022 was 1.15°C (1.02°C–1.28°C) above the 1850–1900 pre-industrial level. The years 2015 to 2022 were the eight warmest since 1850 as reported by the WMO State of the Global Climate report 2022 (WMO, 2022a). This report documented that one of the most prominent features in the ocean in 2022 was the “triple-dip” La Niña (persisting from 2020 to 2022), a condition which has only occurred three times in the past 50 years. In the Indian Ocean, a negative Indian Ocean Dipole (IOD) developed during austral winter in 2022 for the second consecutive year. The La Niña, combined with the negative IOD, affected regional temperature and precipitation anomalies as well as extreme climate events across the world.
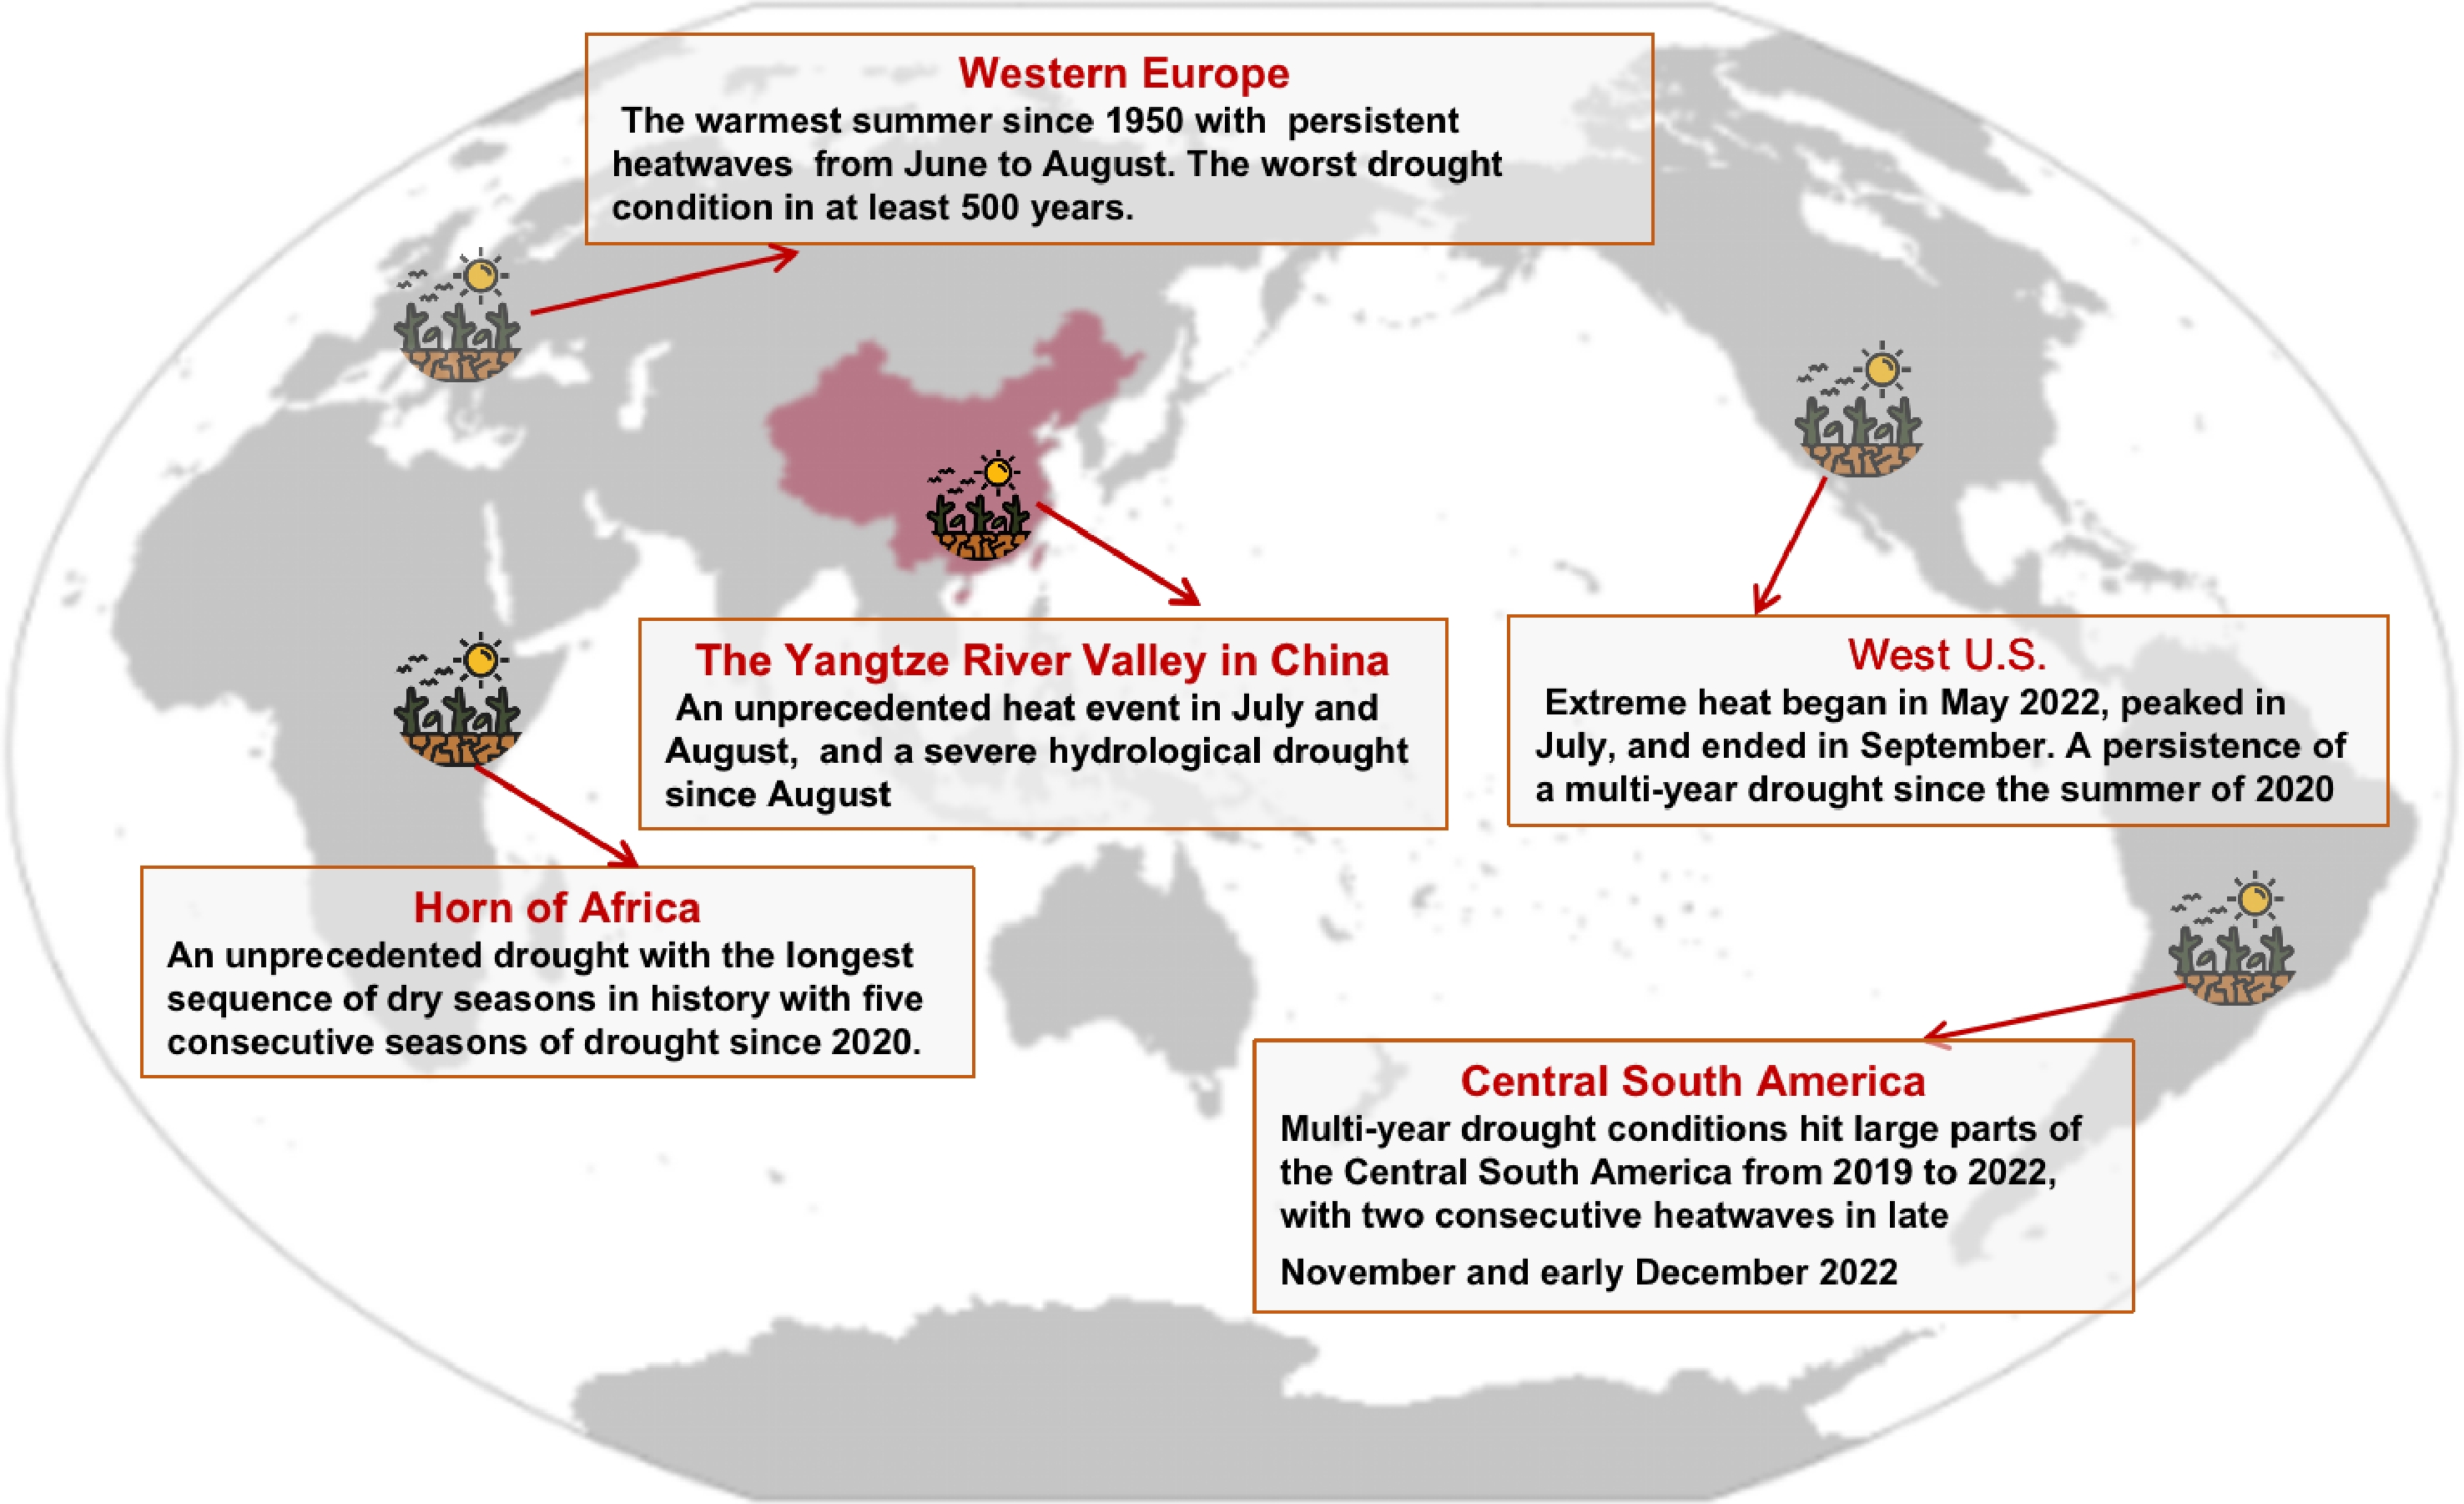
High-impact events occurred globally in 2022. Several of the extremes were selected in the WMO State of the Global Climate 2022 report (WMO, 2022a), including extremes related to heat and drought in China, Europe and the Mediterranean, India and Pakistan, the Horn of Africa region, South America, and western North America; cold extremes in the United States and Canada and Greece; flooding in Pakistan, Australia, the eastern Brazilian city of Petropolis and many parts of the Sahel; and the southern Africa floods caused by a series of cyclones in late January and February. These events and many others are given in WMO’s story map which highlights the proportion of these events characterized by heat and drought (WMO, 2022b). Due to this predominance, this review will mainly focus on these types of extreme events of 2022. Many of the events were also spatially extensive, of long duration and unusually intense, further meriting our focus.
In the following section, we introduce the severity of the extreme heat and drought events in 2022 by examining their cumulative intensity and areal coverage firstly and presenting the hotspots in 2022. We then review the current understanding and attribution of the regional heat and drought extremes in 2022. To finish, we discuss the challenges for the present understanding and future perspectives.
-
We used a cumulative intensity index and the areal extent of regions affected by extremely high maximum temperature (Tmax) and drought to quantify the severity of the extreme events in 2022 (Fig. 1). The definition of the cumulative intensity can be found in the caption of Fig. 1. Approximately 48.2% of the global land area, as a whole, suffered from unusually heat in 2022, with a globally averaged accumulative intensity of about 1.0°C (Fig. 1a). Aggregated worldwide, the intensity of extreme temperatures in 2022 reached an unprecedented 3.61 standard deviations (SDs) away from the 1981–2010 mean (Fig. 1c). The extreme temperatures were also accompanied by persistently reduced rainfall, resulting in unprecedented soil moisture (SM) deficits across large swathes of West Europe, the Yangtze River Valley (YRV) in China, the western U.S., East Africa and central South America (the box regions in Fig. 1d). We further calculated the accumulative intensity of extreme drought as the sum of Z scores (SD from the 1981–2010 mean) less than −1.0 (please see the definition of accumulative intensity in the caption of Fig. 1). The globally averaged accumulative extreme drought intensity reached −7.7 (Fig. 1d). The exceptional drought covered 47.3% of global land areas in 2022, with the globally aggregated intensity reaching −3.59 SDs away from the 1981–2010 mean (Fig. 1f).
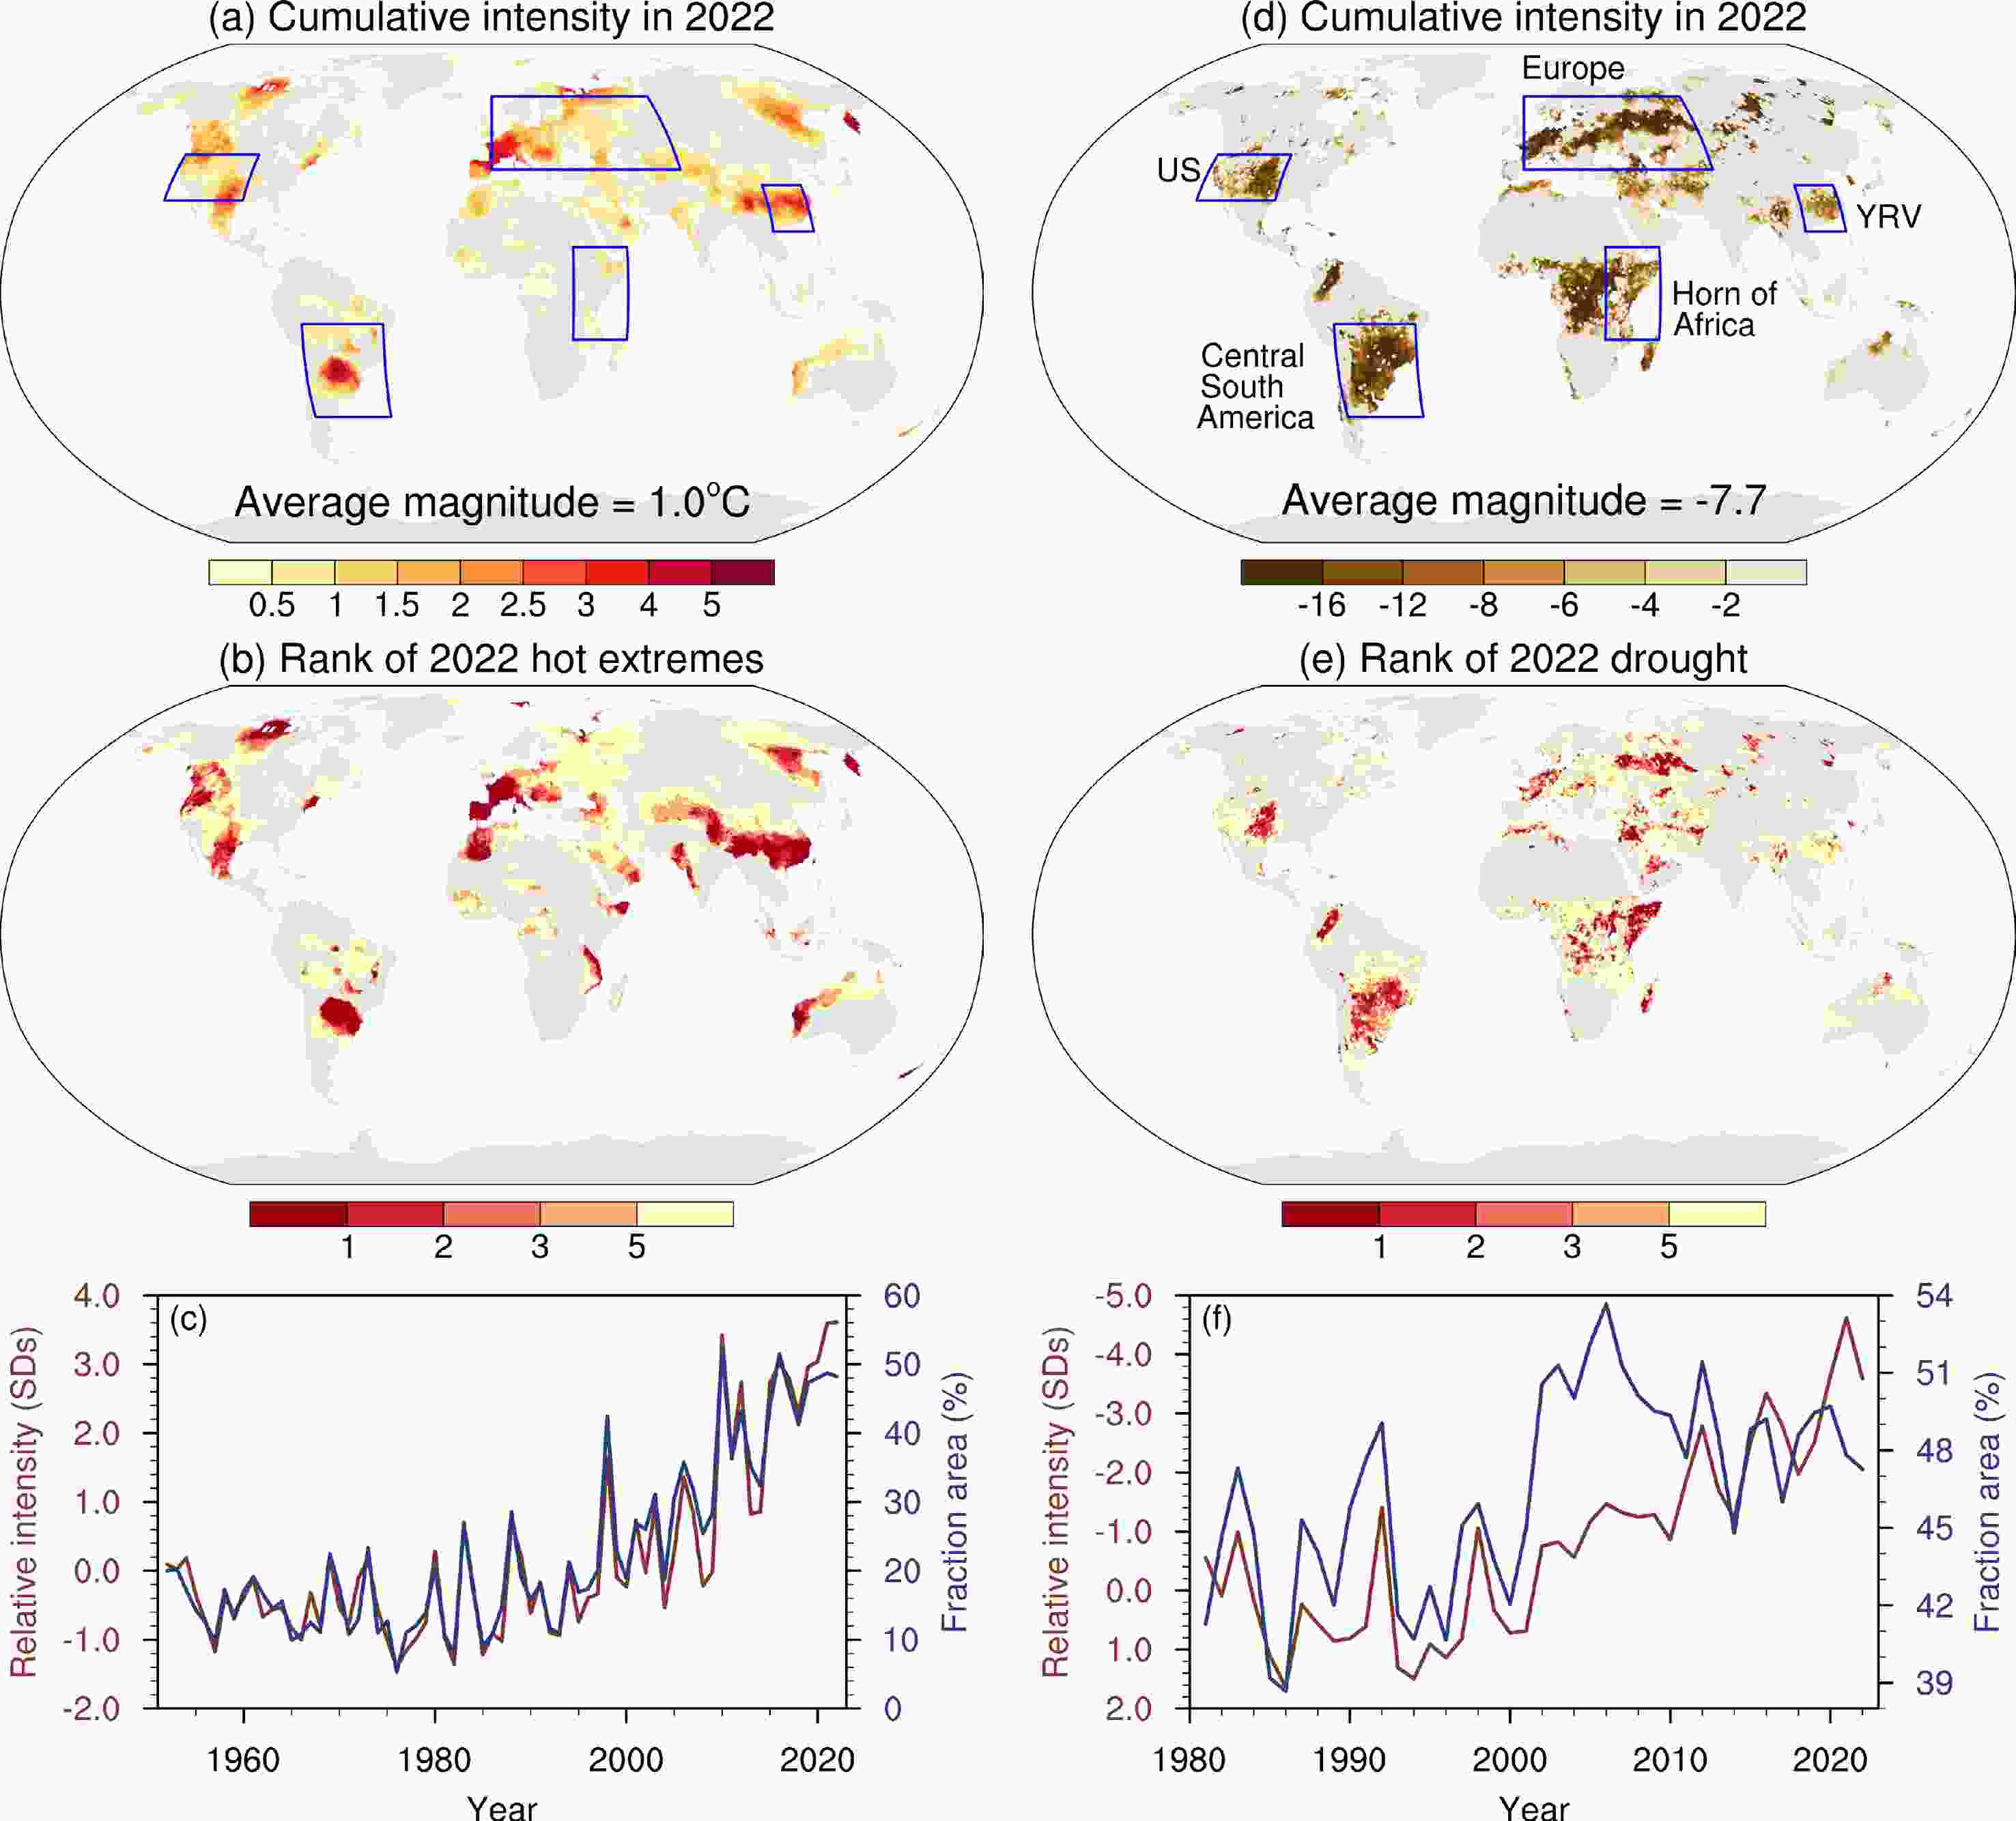
Figure 1. Characteristics of global (a–c) hot and (d–f) drought extremes in 2022: (a) global map of cumulative high temperature intensity (units: °C) for 2022 based on the monthly Tmax data from CRU TS v. 4.07 (Harris et al., 2020); (b) ranks of cumulative high temperature intensity in 2022 since 1950; (c) time series of annual aggregated extreme hot intensity (red; units: SDs) and fractional area (blue; %) of global land areas (excluding Antarctica) affected by extreme hot extremes. The aggregated intensity is normalized by the 1981–2010 climatology and SD. (d–f) As in (a–c) but for the extreme drought intensity based on the surface SM dataset from GLEAM v3.7a (Martens et al., 2017) for 1980–2022. The cumulative intensity for high temperature is calculated as the sum of monthly Tmax exceeding the 90th percentile of Tmax (Tmx90th) from 1981 to 2010 during the high-summer season within each grid cell. The cumulative intensity for SM drought is calculated as the sum of monthly Z scores less than −1.0, which is obtained on the basis of the 1981–2010 climatology. The span of one year was adjusted to October of the previous year to September of the current year to present the extremes that occurred over both the Northern and Southern Hemisphere. The blue boxes refer to five drought hotspots: the YRV, Europe, the Horn of Africa, the United States (US) and central South America.
Several hotspots experienced unprecedented hot extremes in 2022, such as western Europe and the western U.S., the YRV over central China and northwestern China in the Northern Hemisphere, and from the Horn of Africa to central South America in the tropics and Southern Hemisphere. In terms of the rank for the cumulative heat intensity, about 10.3% of the affected areas broke their historical record (Fig. 1b). Regarding extreme drought conditions, the regions that experienced unprecedented hot events in 2022 were also accompanied by extreme drought. Nearly 5.9% of the regions affected by drought broke their historical record, especially over central western Europe, the southwestern U.S., the Horn of Africa and central South America (Fig. 1e), suggesting the heat and droughts exacerbated each other. It was reported that the year 2022 set new temperature records in 28 countries with a combined population of 850 million people. Lakes and rivers in several countries reached extreme lows and dry conditions threatened crops and fueled dozens of destructive wildfires reported by European State of the Climate (C3S, 2022). According to the rank of extreme hot and drought events in 2022, we selected five extreme hot and drought events in 2022 to review in this study (Fig. 2).
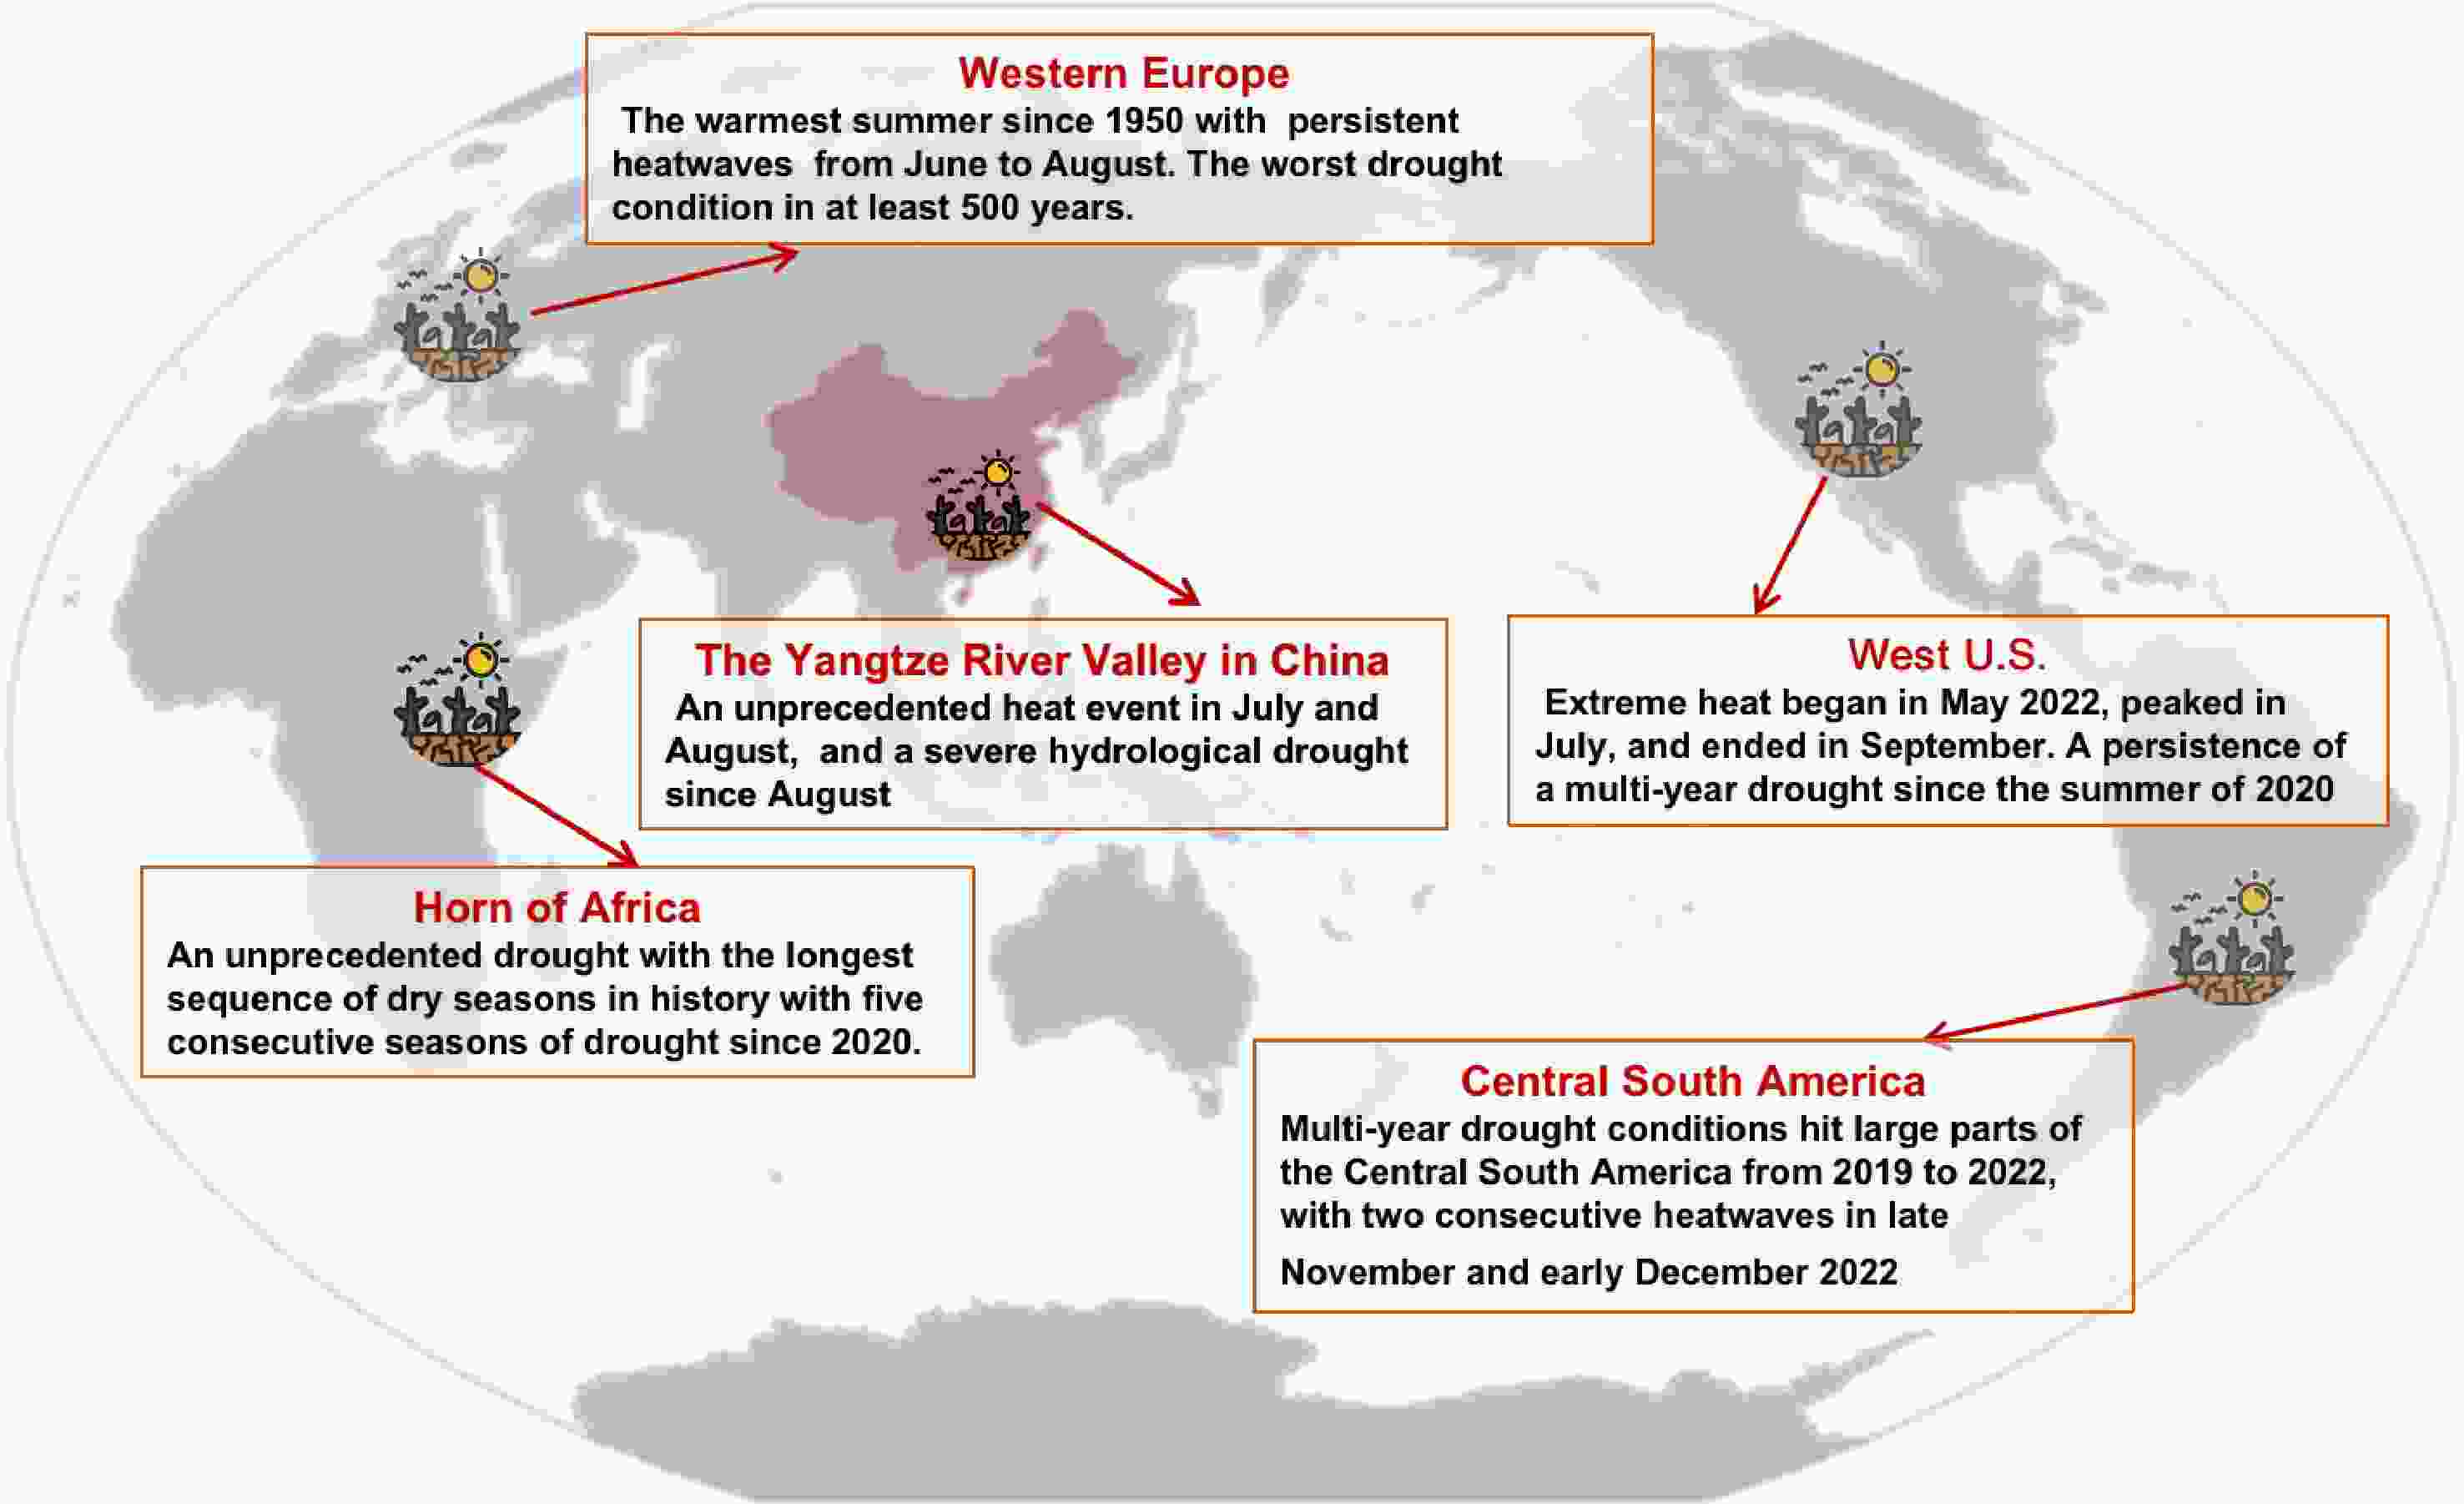
Figure 2. Global extreme hot and drought events in 2022 selected to review in this study.
-
Before we focus on the specific extreme events of 2022 in five hotspots, we first consider the background global situation. The year, as a whole, was the fifth warmest since 1950, with a globally averaged surface mean temperature of 1.1°C to 1.3°C greater than that during the pre-industrial era. After removing the effects of ENSO variability, the year was the second warmest (Hausfather, 2023). The globally averaged warming trend has consequently increased the likelihood of local events of excessive temperature. The anthropogenic influence is also detected for the drought over the Northern Hemisphere extratropics. It has increased the likelihood of root-zone SM drought by at least 20 times, and at least 5 times for surface SM, but the exact likelihood of changes is uncertain because the observed variables are hard to observe (Schumacher et al., 2022).
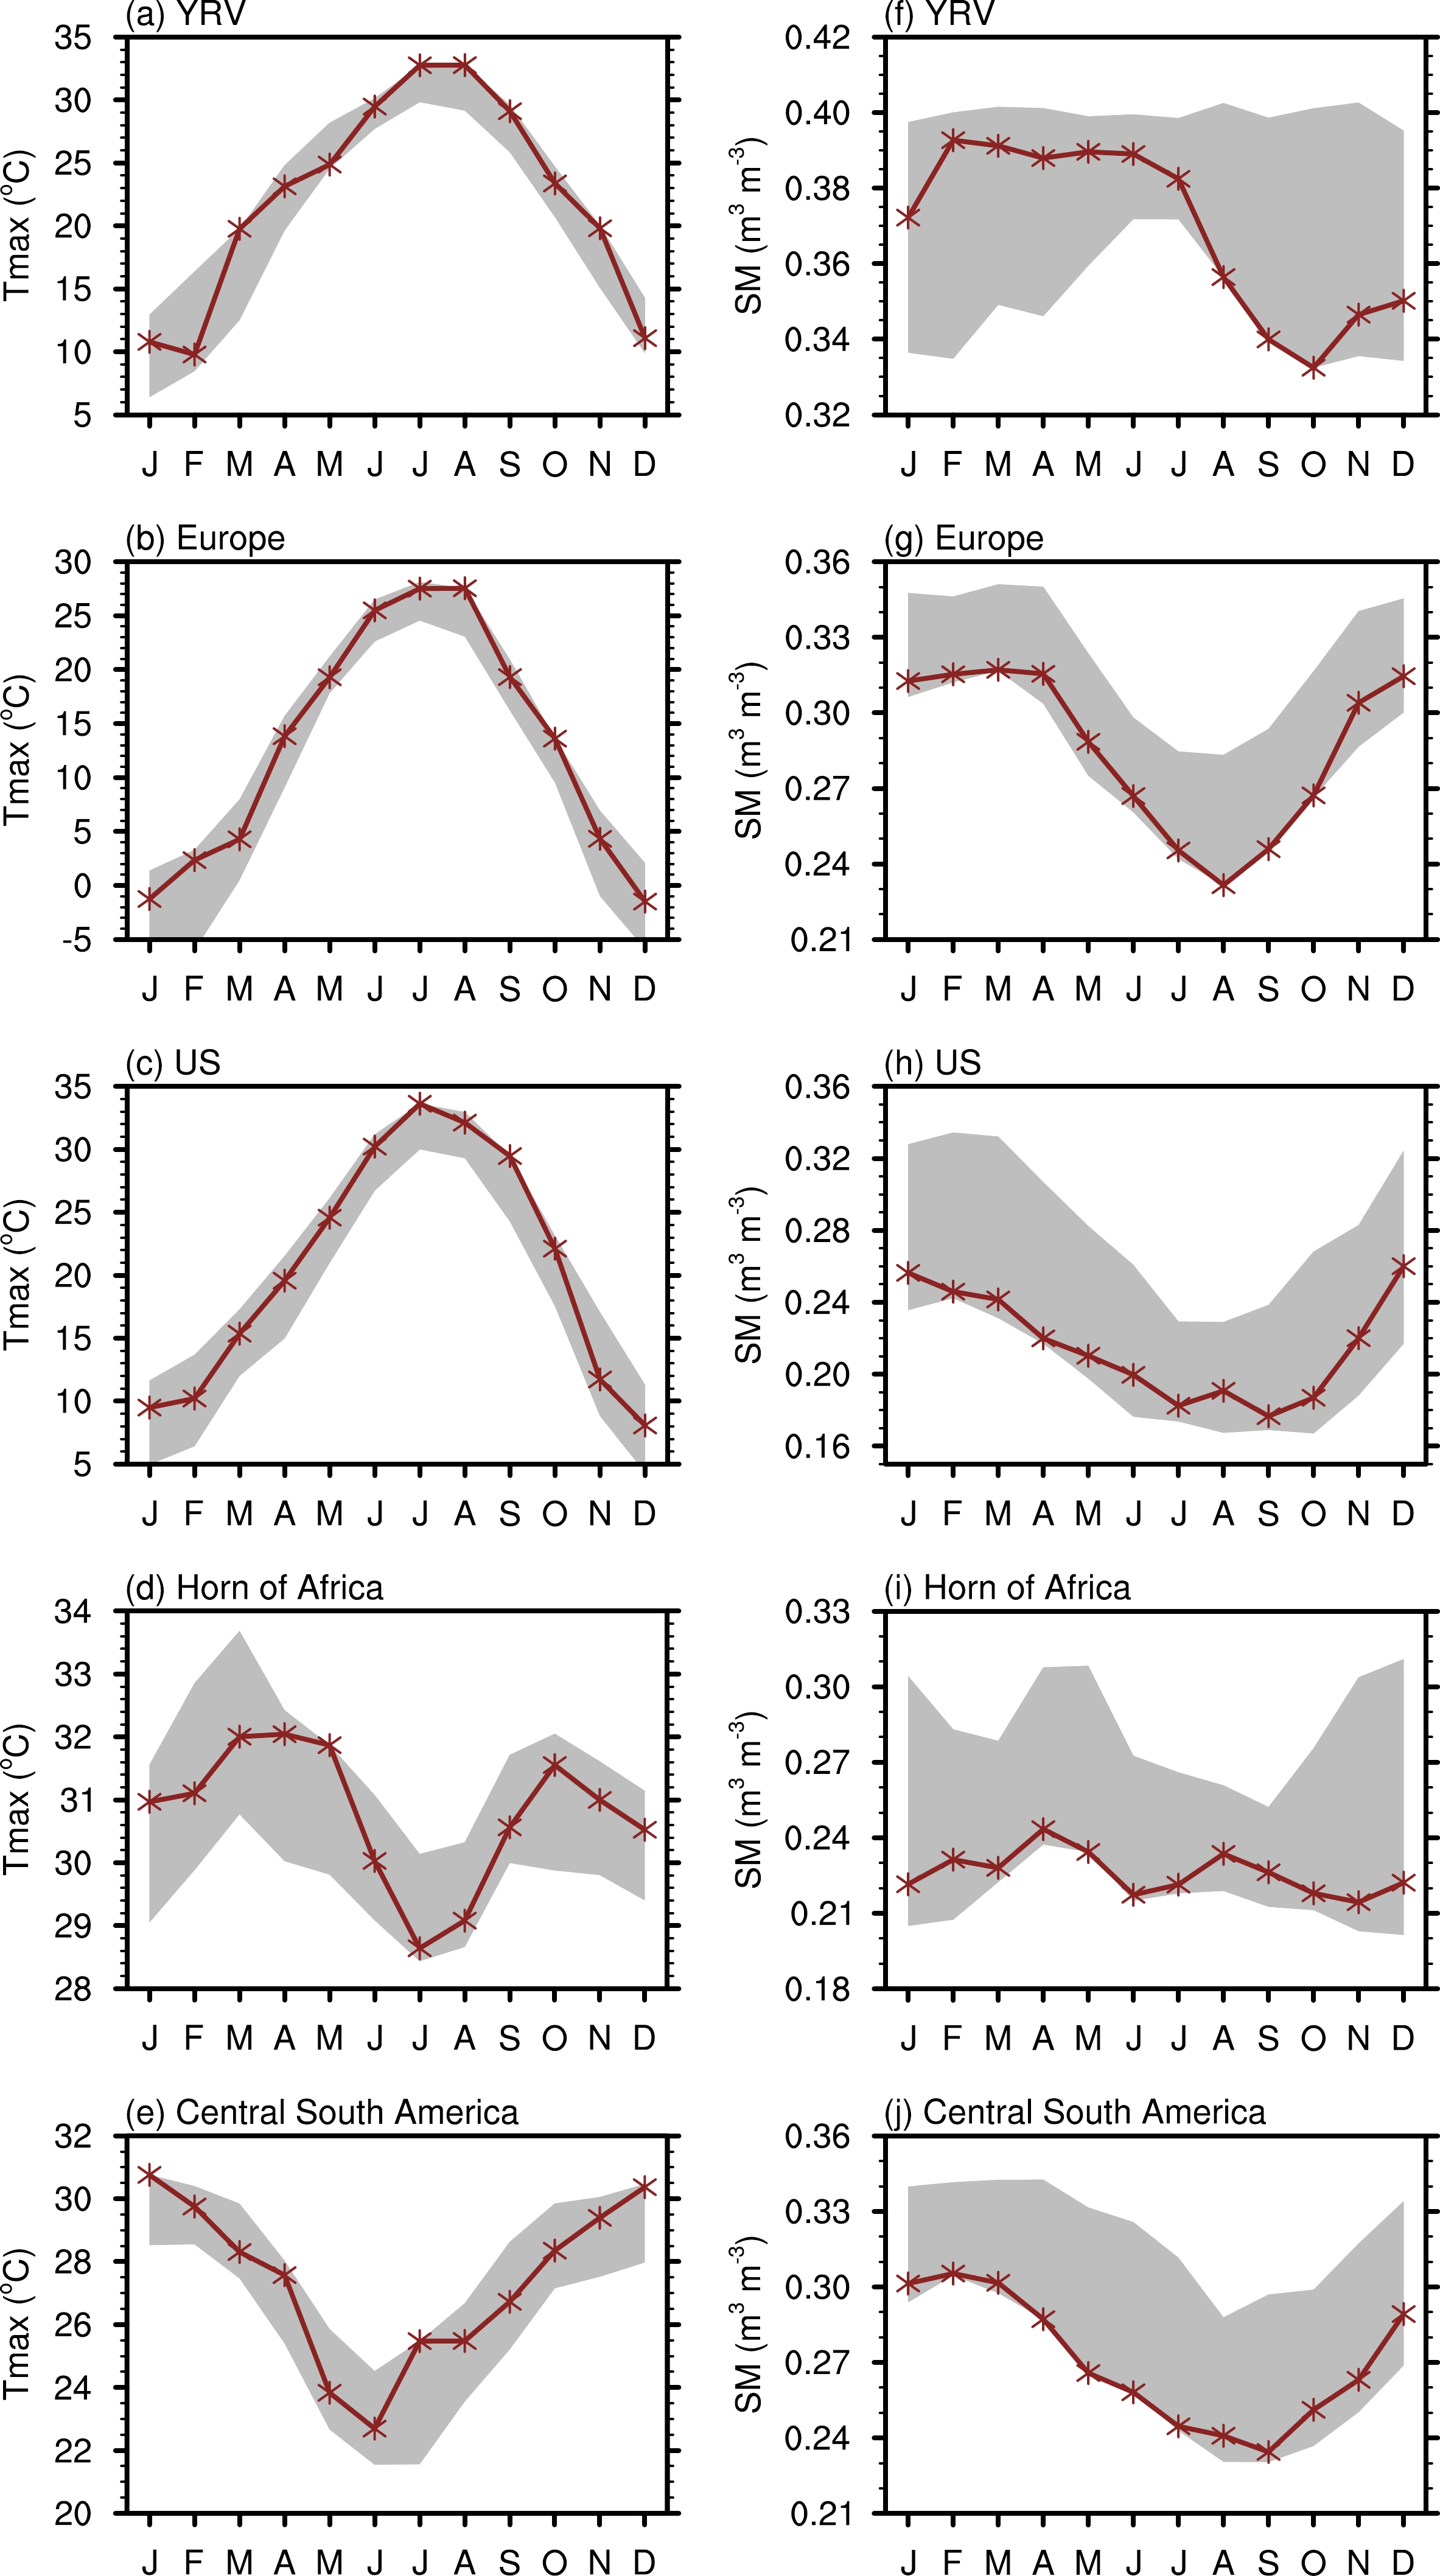
In the following, we will briefly review the current understanding and attribution of the five selected hotspots for hot and drought extremes. The preliminary attribution results for the selected events are summarized in Table 1. We also present, in Fig. 3, the monthly anomalies for Tmax and surface SM in 2022, area-averaged over each hotspot region, to interpret the evolution of regional extreme hot and drought conditions in 2022.
Region Severity Attribution conclusions Reference Yangtze River Valley in China The 12 consecutive days of red high-temperature warnings in 2022 was, under the current climate, a once-in-152-year event, approximately. Based on observational analysis, the likelihood of extreme high temperature such as that in 2022 has increased fivefold (0.4–284.0), and the intensity has increased by 1.3°C (0.5°C–1.9°C); and based on CMIP6 analysis, by 133 times (82.4–257.8) and 2.3°C (2.2°C–2.4°C). Ye et al. (2022) West Europe The hottest summer on record, and worst drought condition in at least 500 years. Human-induced climate change made the record high temperature in the UK at least 10 times more likely, and the root-zone (surface) SM drought 3–4 (5–6) times more likely. Zachariah et al. (2022);
Schumacher et al. (2022)The West U.S. California and Nevada were the driest on record in early 2022. Not available yet. — The Horn of Africa An unprecedented drought with the longest sequence of dry seasons in history. Human-induced climate change has increased the likelihood of low rainfall events during the long rains (MAM), but there is no attributable change when short (OND) and long rains are combined. By conservative estimate, the probability has increased by ~100 times in the present day, compared to a 1.2°C cooler world. Kimutai et al. (2023) Central South America The driest year over central Argentina since 1960. The worst SM and vegetation conditions in the lower part of the La Plata Basin. The low rainfall cannot be attributed to climate change. Human-induced rising temperatures decreased water availability and enhanced the drought in late 2022 in this region (the effect was not quantified). Arias et al. (2023) Table 1. A review of attribution conclusions for regional hot and drought events in 2022.
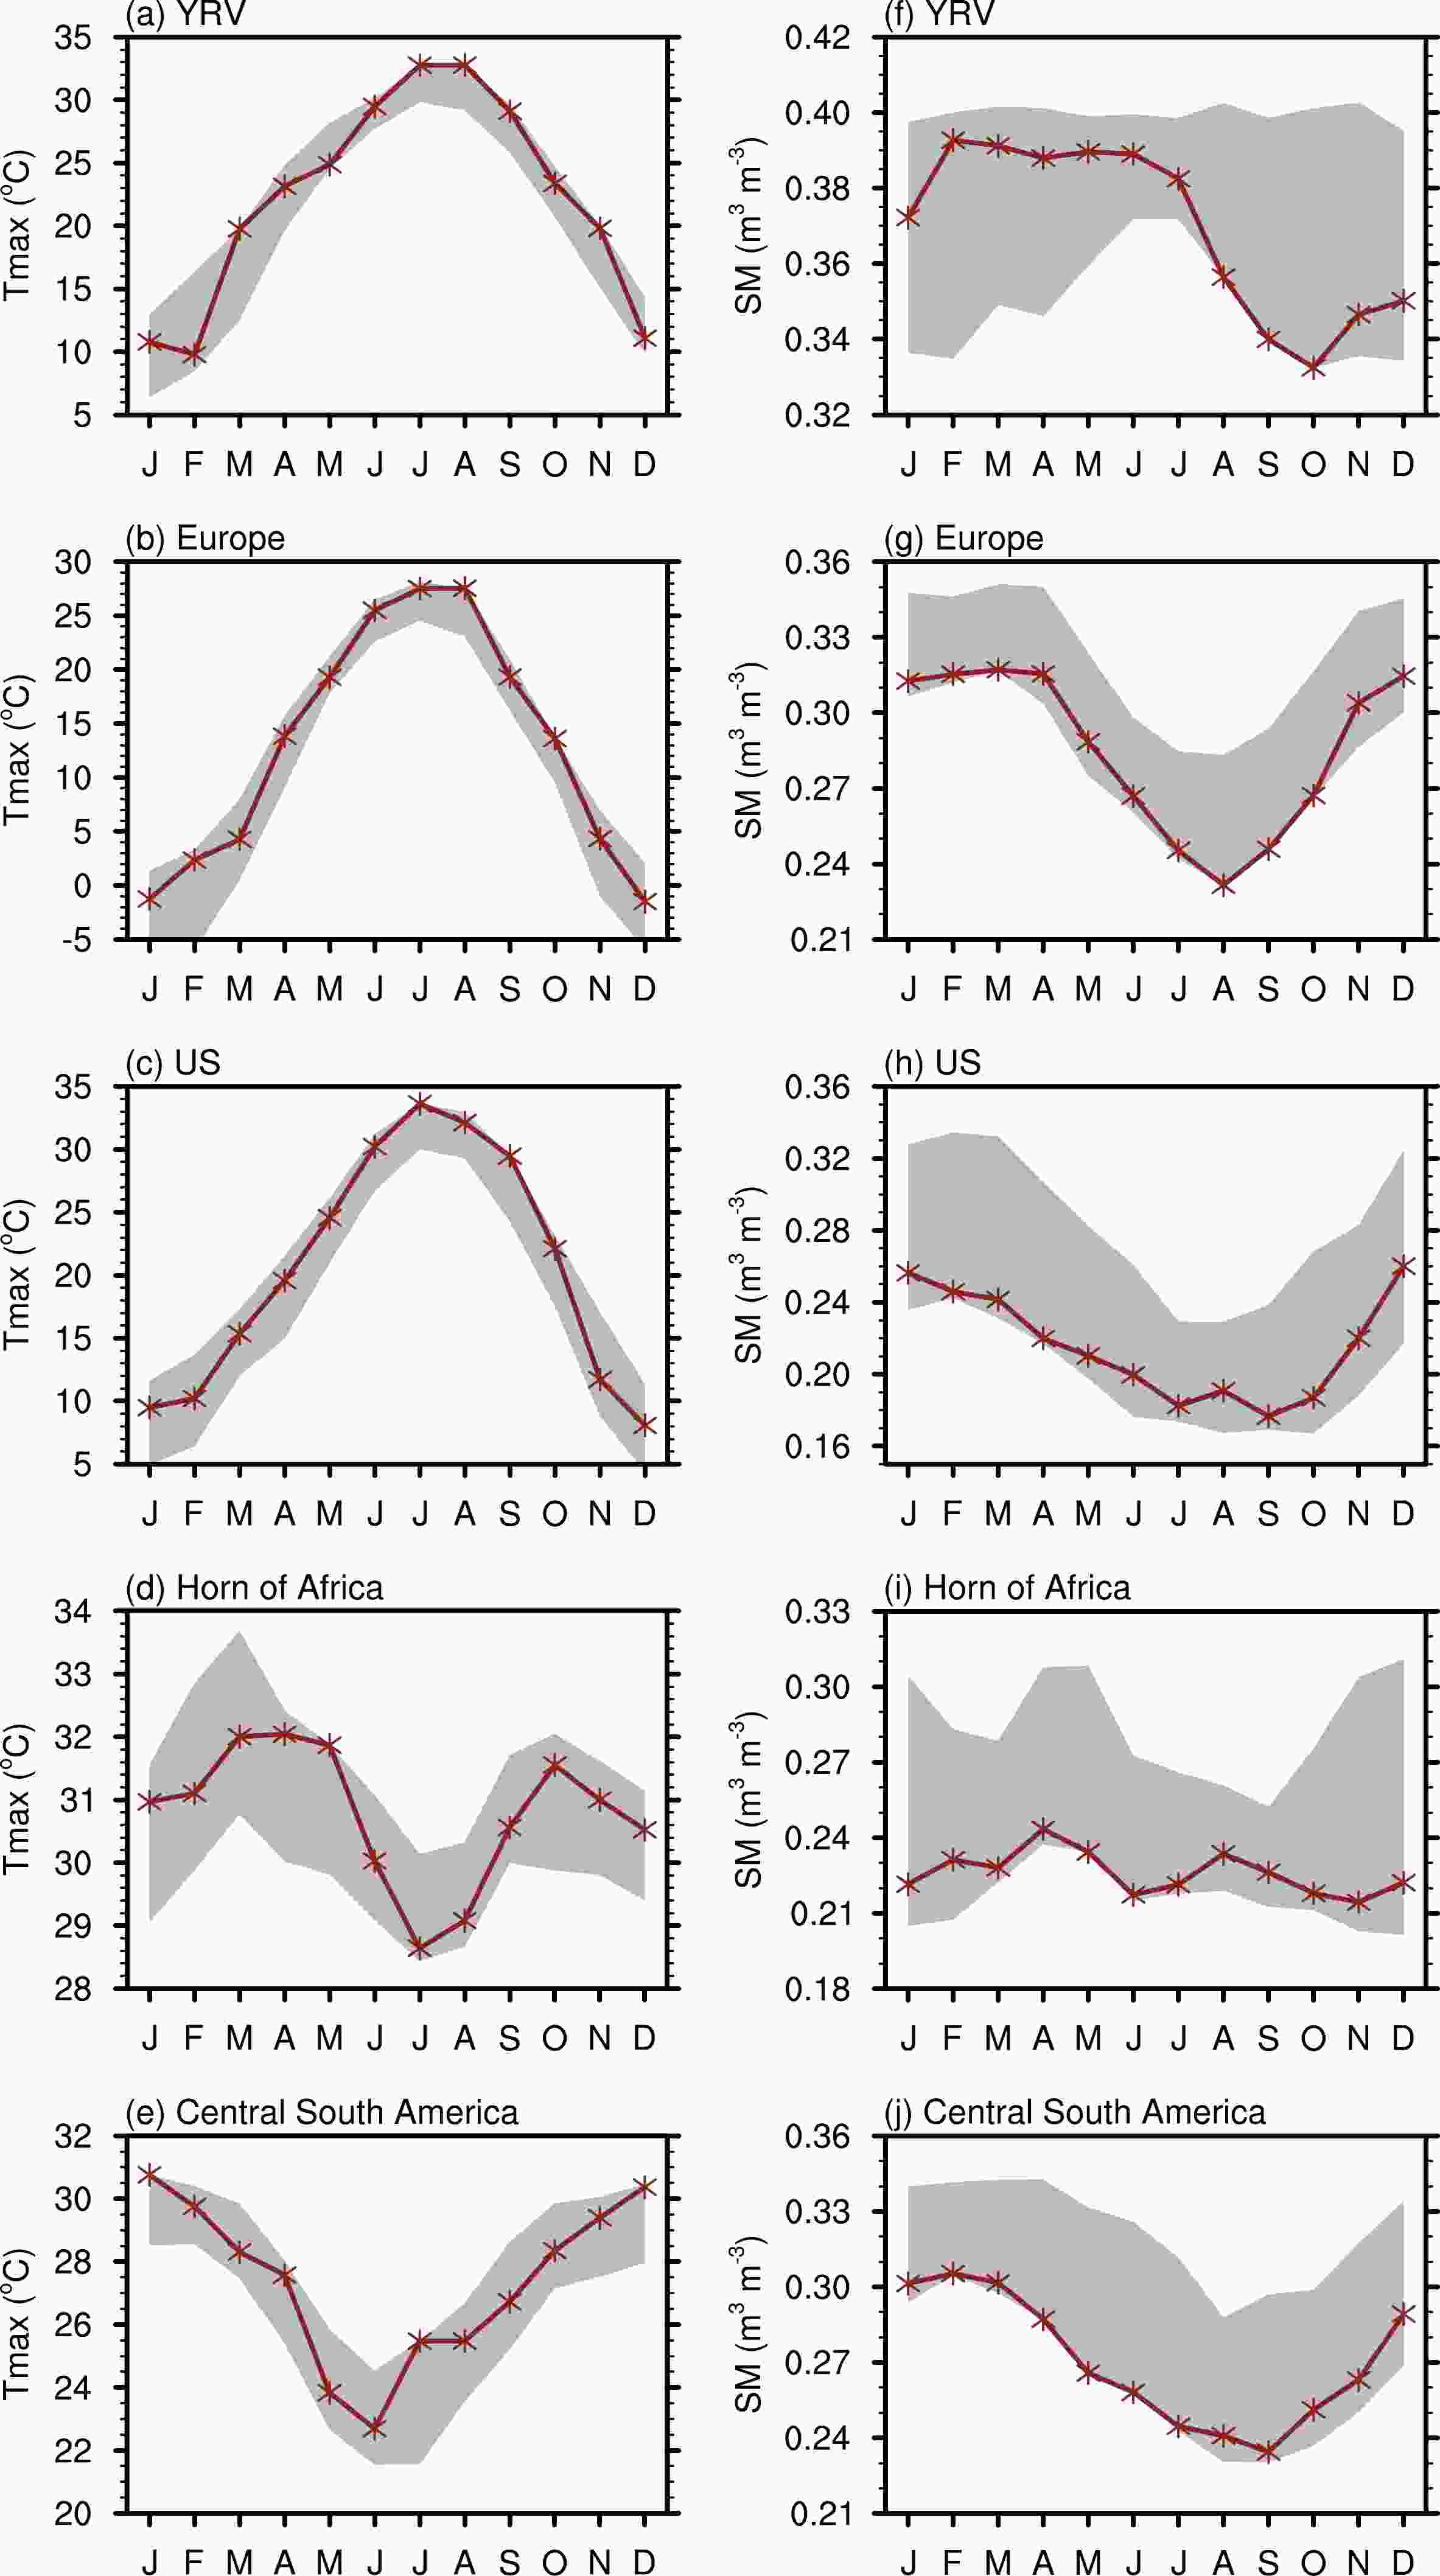
Figure 3. Monthly evolution of (a–e) Tmax (units: °C, left) and (f–j) surface SM (units: m3 m–3) in 2022 (lines), area-averaged over each hotspot region. Shading shows the annual cycle for the ranges of maximum and minimum values of (a–e) Tmax during 1950–2022 and (f–j) SM during 1980–2022. The specific area for each hotspot is outlined in Figs. 2a and d.
-
In July and August of 2022, the YRV experienced an unprecedented heat event, combined with a precipitation deficit, which ultimately drove the occurrence of a severe hydrological drought (Lu et al., 2023; Yuan et al., 2023). This can be seen from the strongest Tmax in July and August and rapid drying of the surface SM (Figs. 3a and f). The large-scale circulations associated with the heat event were the intensification and westward extension of the western North Pacific subtropical high (WNPSH) in the middle and lower troposphere, and the eastward extension of the South Asian high (SAH) in the upper troposphere (Chen and Li, 2023). The overlapping of these two subtropical highs favoured descending motion over the YRV, suppressing convection, cloud cover and rainfall, and enhancing the shortwave radiation reaching the surface.
Several studies have examined the contribution to the events of 2022 from anomalous large-scale circulation patterns. On the seasonal time scale, He et al. (2023) emphasized the role of the anomalous zonal flow over the subtropical Tibetan Plateau associated with the low SSTs in the tropical Indian Ocean. The intensification and westward extension of the WNPSH was associated with the La Niña-induced second-highest SST gradient in the equatorial western Pacific (Tang et al., 2023), and the eastward extension of the SAH was caused by the synergistic influence of diabatic heating associated with the extreme rainfall in Pakistan and the Silk Road Pattern (SRP) (Wang et al., 2023; Zhang et al., 2023). For the subseasonal processes, Zhang et al. (2023) revealed that the SRP contributed to the abnormal intensification of the YRV heat event in August of 2022, and Liu et al. (2023) underlined the importance of the intraseasonal oscillation at 10–25-day and 30–50-day time scales.
Anthropogenic climate change has increased the probability and intensity of extreme high temperature events such as that in 2022 in the middle and lower reaches of the Yangtze River in Sichuan. Observational analysis shows that, under the current climate, the 12 consecutive days of red high-temperature warnings in 2022 were a roughly once-in-152-years event. Based on observational analysis, the likelihood of extreme high temperatures such as those in 2022 has increased fivefold (0.4–284.0 for the 5%–95% uncertainty range), and the intensity has increased by 1.3°C (0.5°C–1.9°C); while based on CMIP6 analysis, these figures are an astonishing 133-fold increase (82.4–257.8) and a 2.3°C increase (2.2°C–2.4°C) (Table 1). The large numerical change in frequency is partly due to the events of 2022 previously being extremely rare.
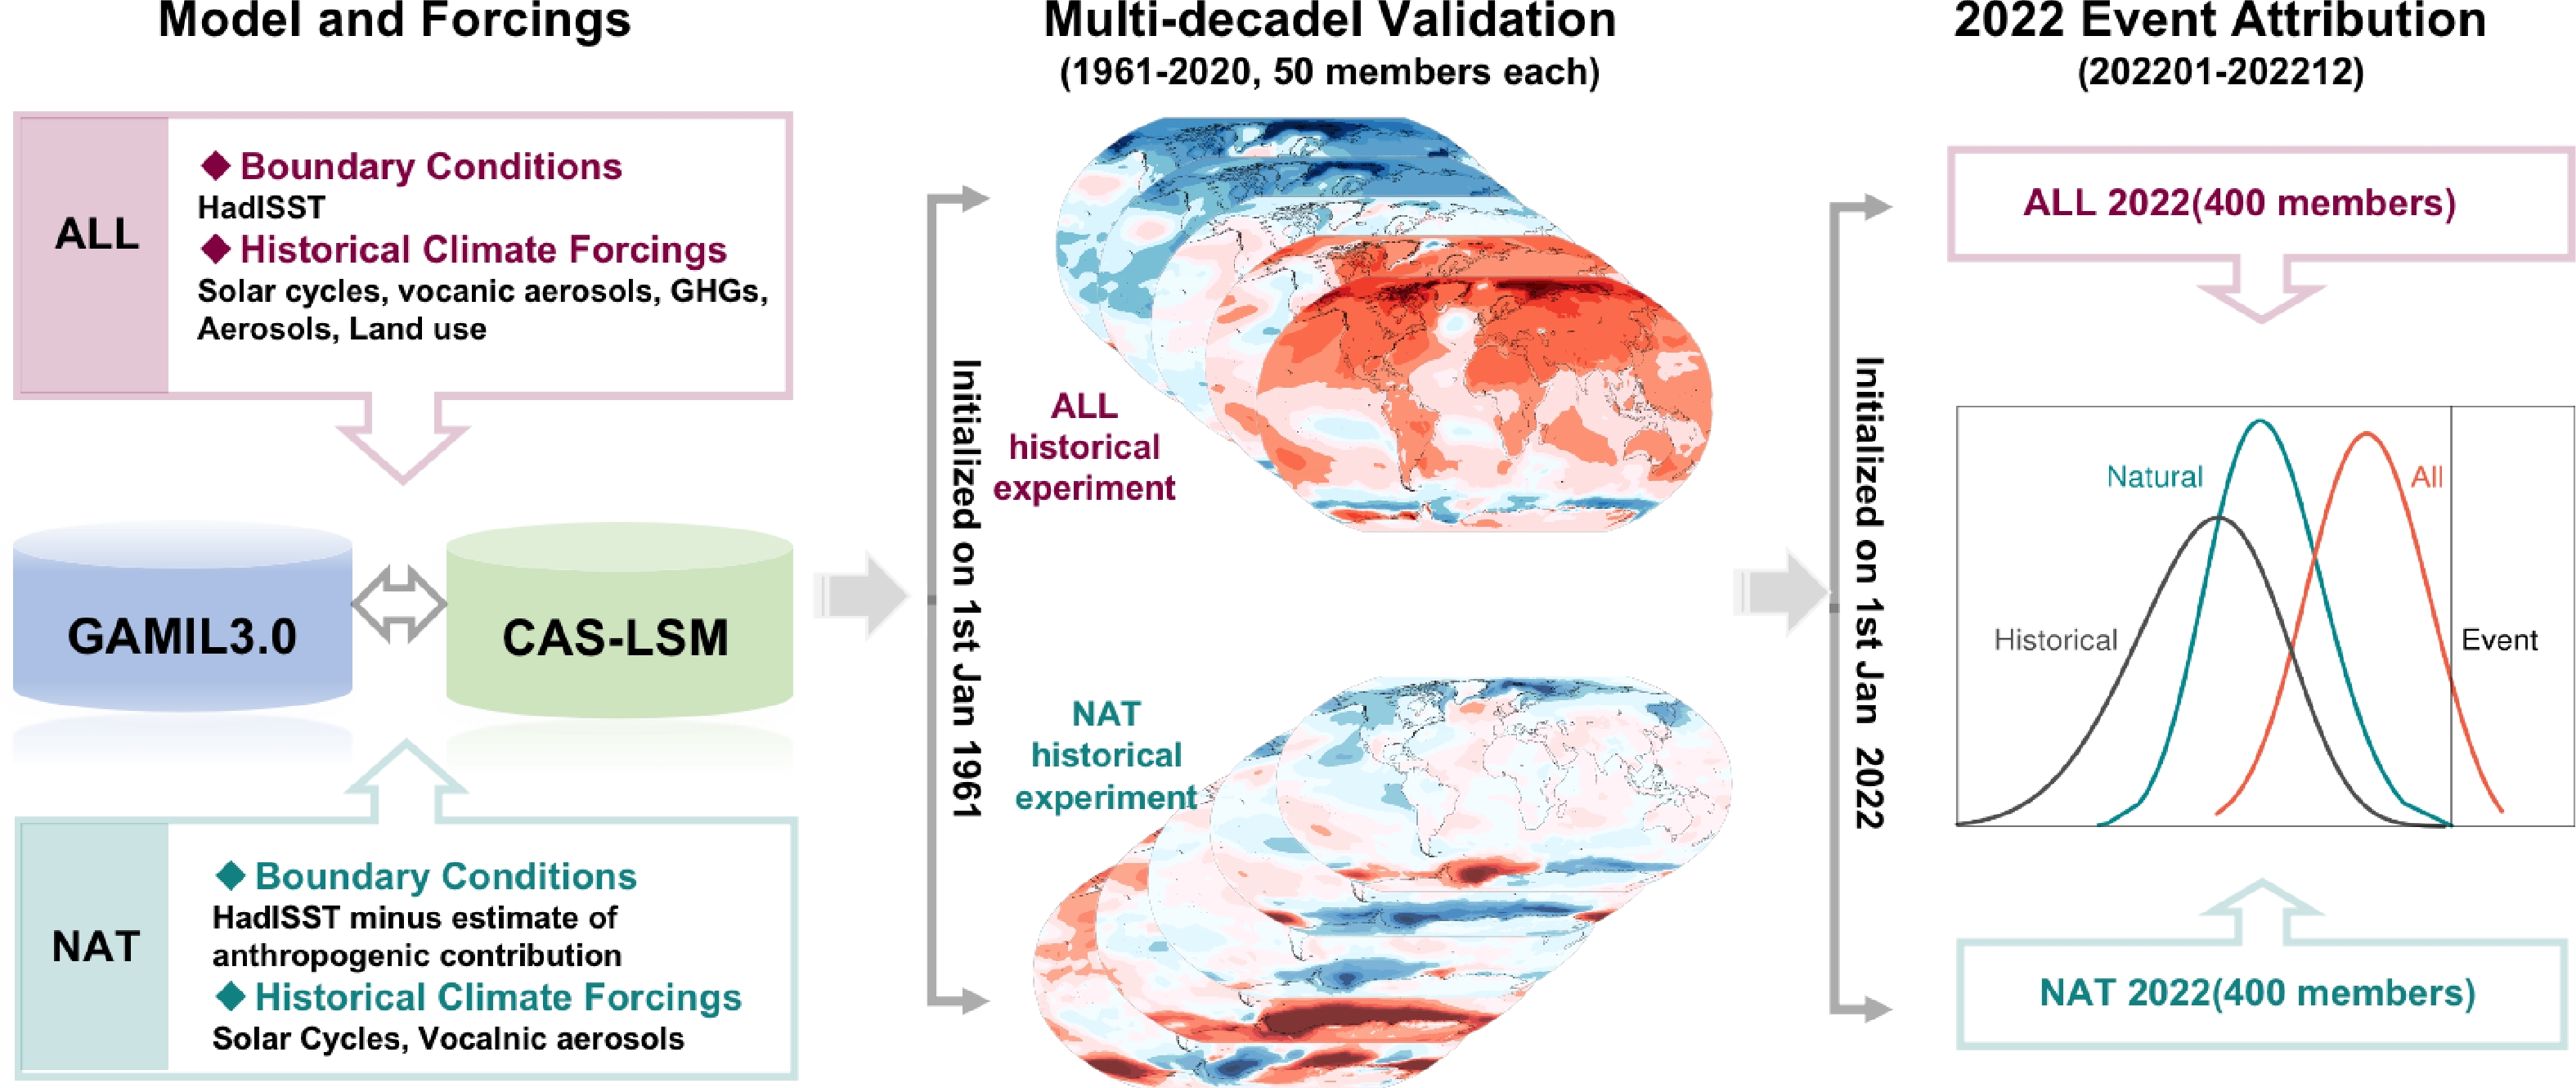
Attribution based on CMIP6 does not fully consider the role of observed interannual SST anomaly forcing. However, the triple-dip La Niña and Indian Ocean SST anomalies are important factors for the YRV heatwave, as documented by recent studies. It is necessary to carry out attribution analysis based on a framework of atmospheric general circulation model (AGCM) simulation to include the role of observed SST forcing. Thus, we ran two ensembles of simulations for the actual climate with all external forcing (“ALL”) and for a hypothetical natural climate without the effect of human influence (“NAT”), using GAMIL3.0 coupled with the land surface model CAS-LSM. Details about GAMIL3.0 and CAS-LSM can be found in Li et al. (2020) and Xie et al. (2018), respectively. The experiment was designed following the International CLIVAR C20C+ Detection and Attribution project (Stone et al., 2019). The detection and attribution system based on GAMIL is called the Chinese Academy of Sciences Detection and Attribution System (CAS-DAsys). A schematic of the experimental design can be found in Fig. 4. In CAS-DAsys, we generated 50-member historical simulations for 1960–2020 by perturbing the initial conditions, and 400 members for the year 2022.
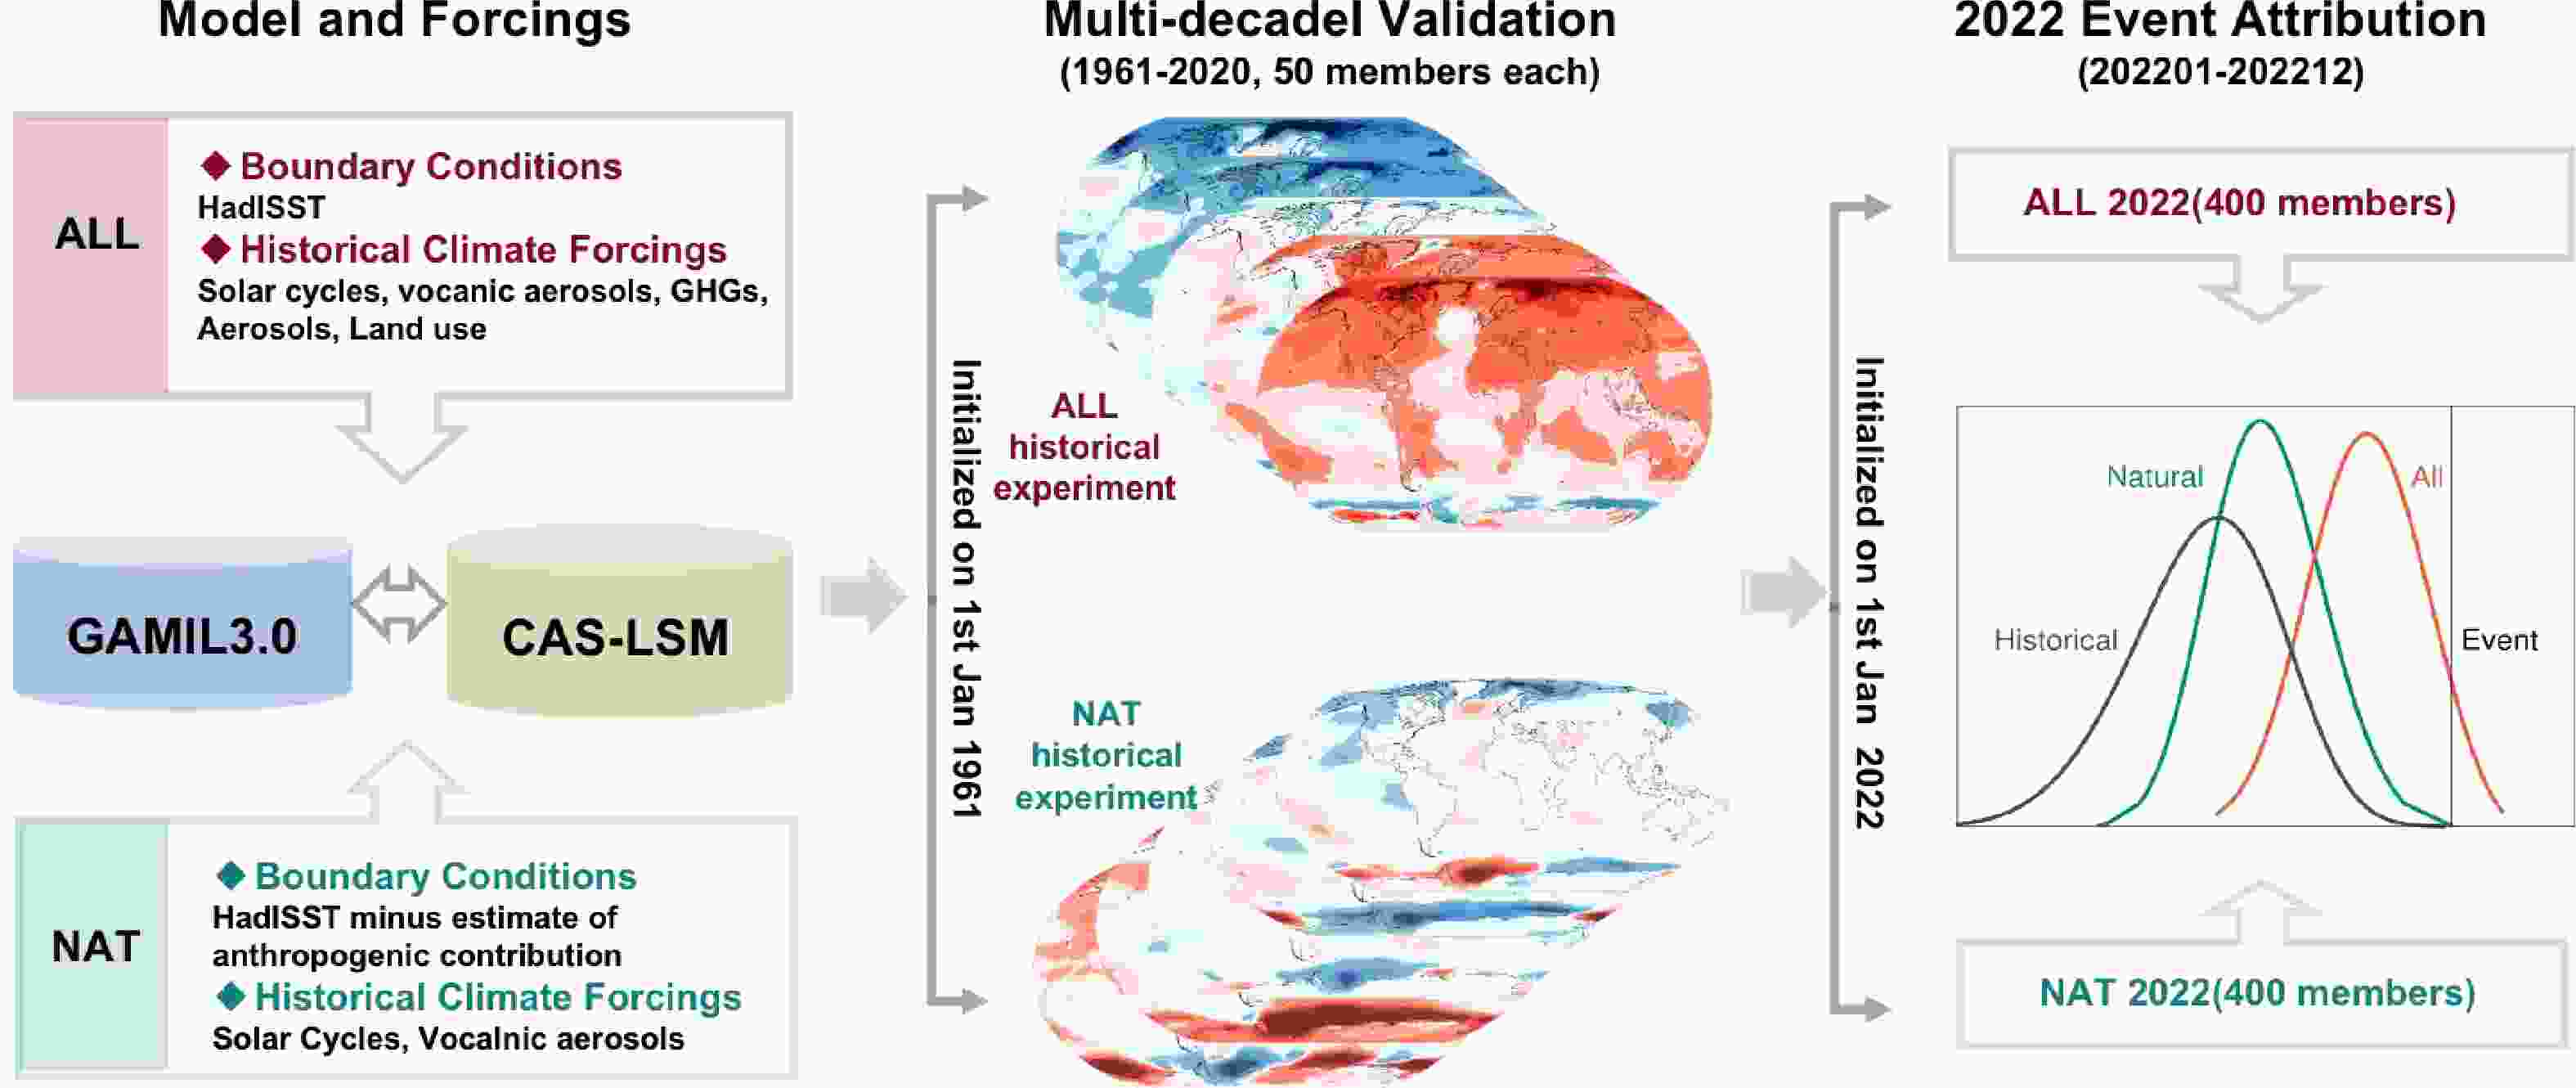
Figure 4. Schematic of the experimental design for CAS-DAsys.
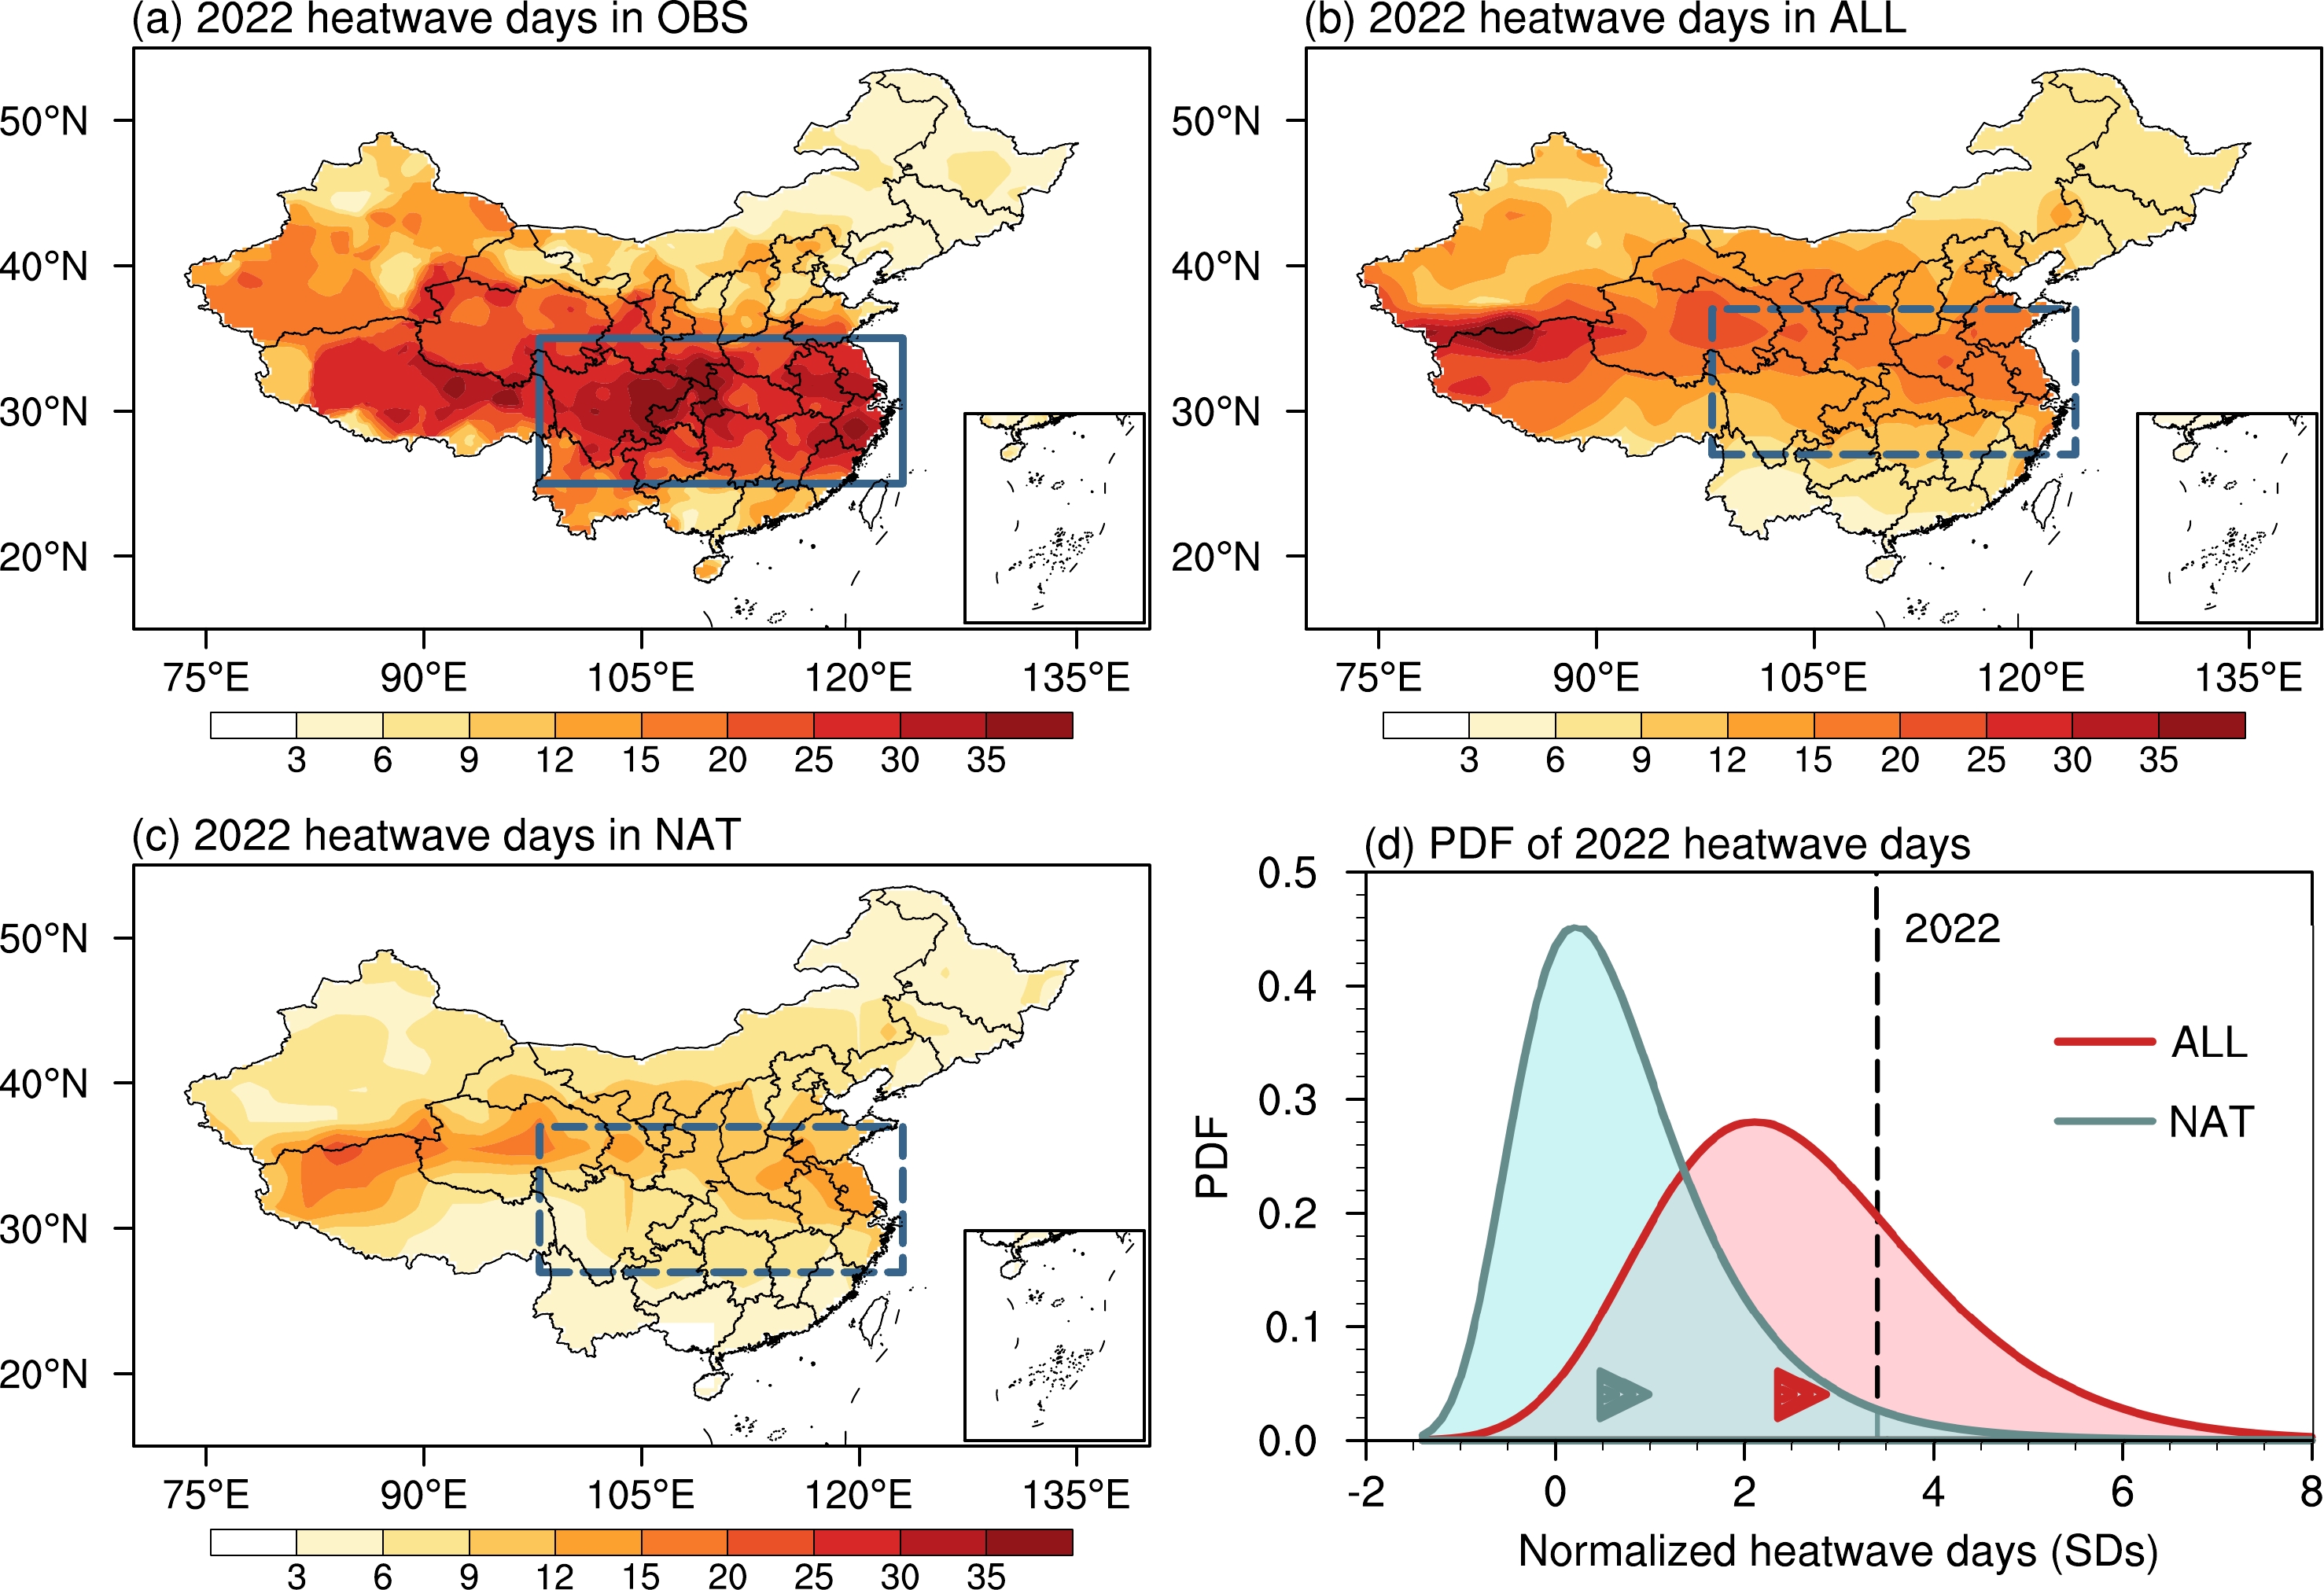
We present the attribution results for the hot days of 2022 in Fig. 5. Record-breaking hot days were observed in 2022 along the YRV, with the maximum number being higher than 35 days (Fig. 5a). The multi-member-mean (400 members) from CAS-DAsys simulated well the centers of heatwave days in 2022, both in ALL and NAT, albeit with a general underestimation and a northward shift (Figs. 5b and c). This indicates a reasonable skill of CAS-DAsys in simulating YRV hot days. An overall rightward shift of heatwave days in ALL relative to NAT is simulated for the year 2022 (Fig. 5d), demonstrating increases in the probability of YRV heatwave days with anthropogenic forcing. The likelihood of hot days such as those of the events in 2022 is around 27.91% (P1) from the 400 samples in ALL, while it is only 2.52% (P0) in NAT. Anthropogenic influences increased the risk of such heatwave days in 2022 by ~11.1 times. The two fitted probability density functions (PDFs) show that both the mean and variability of YRV heatwave days in ALL are larger than those in NAT, which is in line with previous studies (Rehfeld et al., 2020; Olonscheck et al., 2021). We then estimated their fractional contributions to the increased risk of extreme hot days over the YRV, with the mean shift and the variability accounting for ~63.1% and ~36.9%, respectively. A comprehensive physical understanding requires further study.
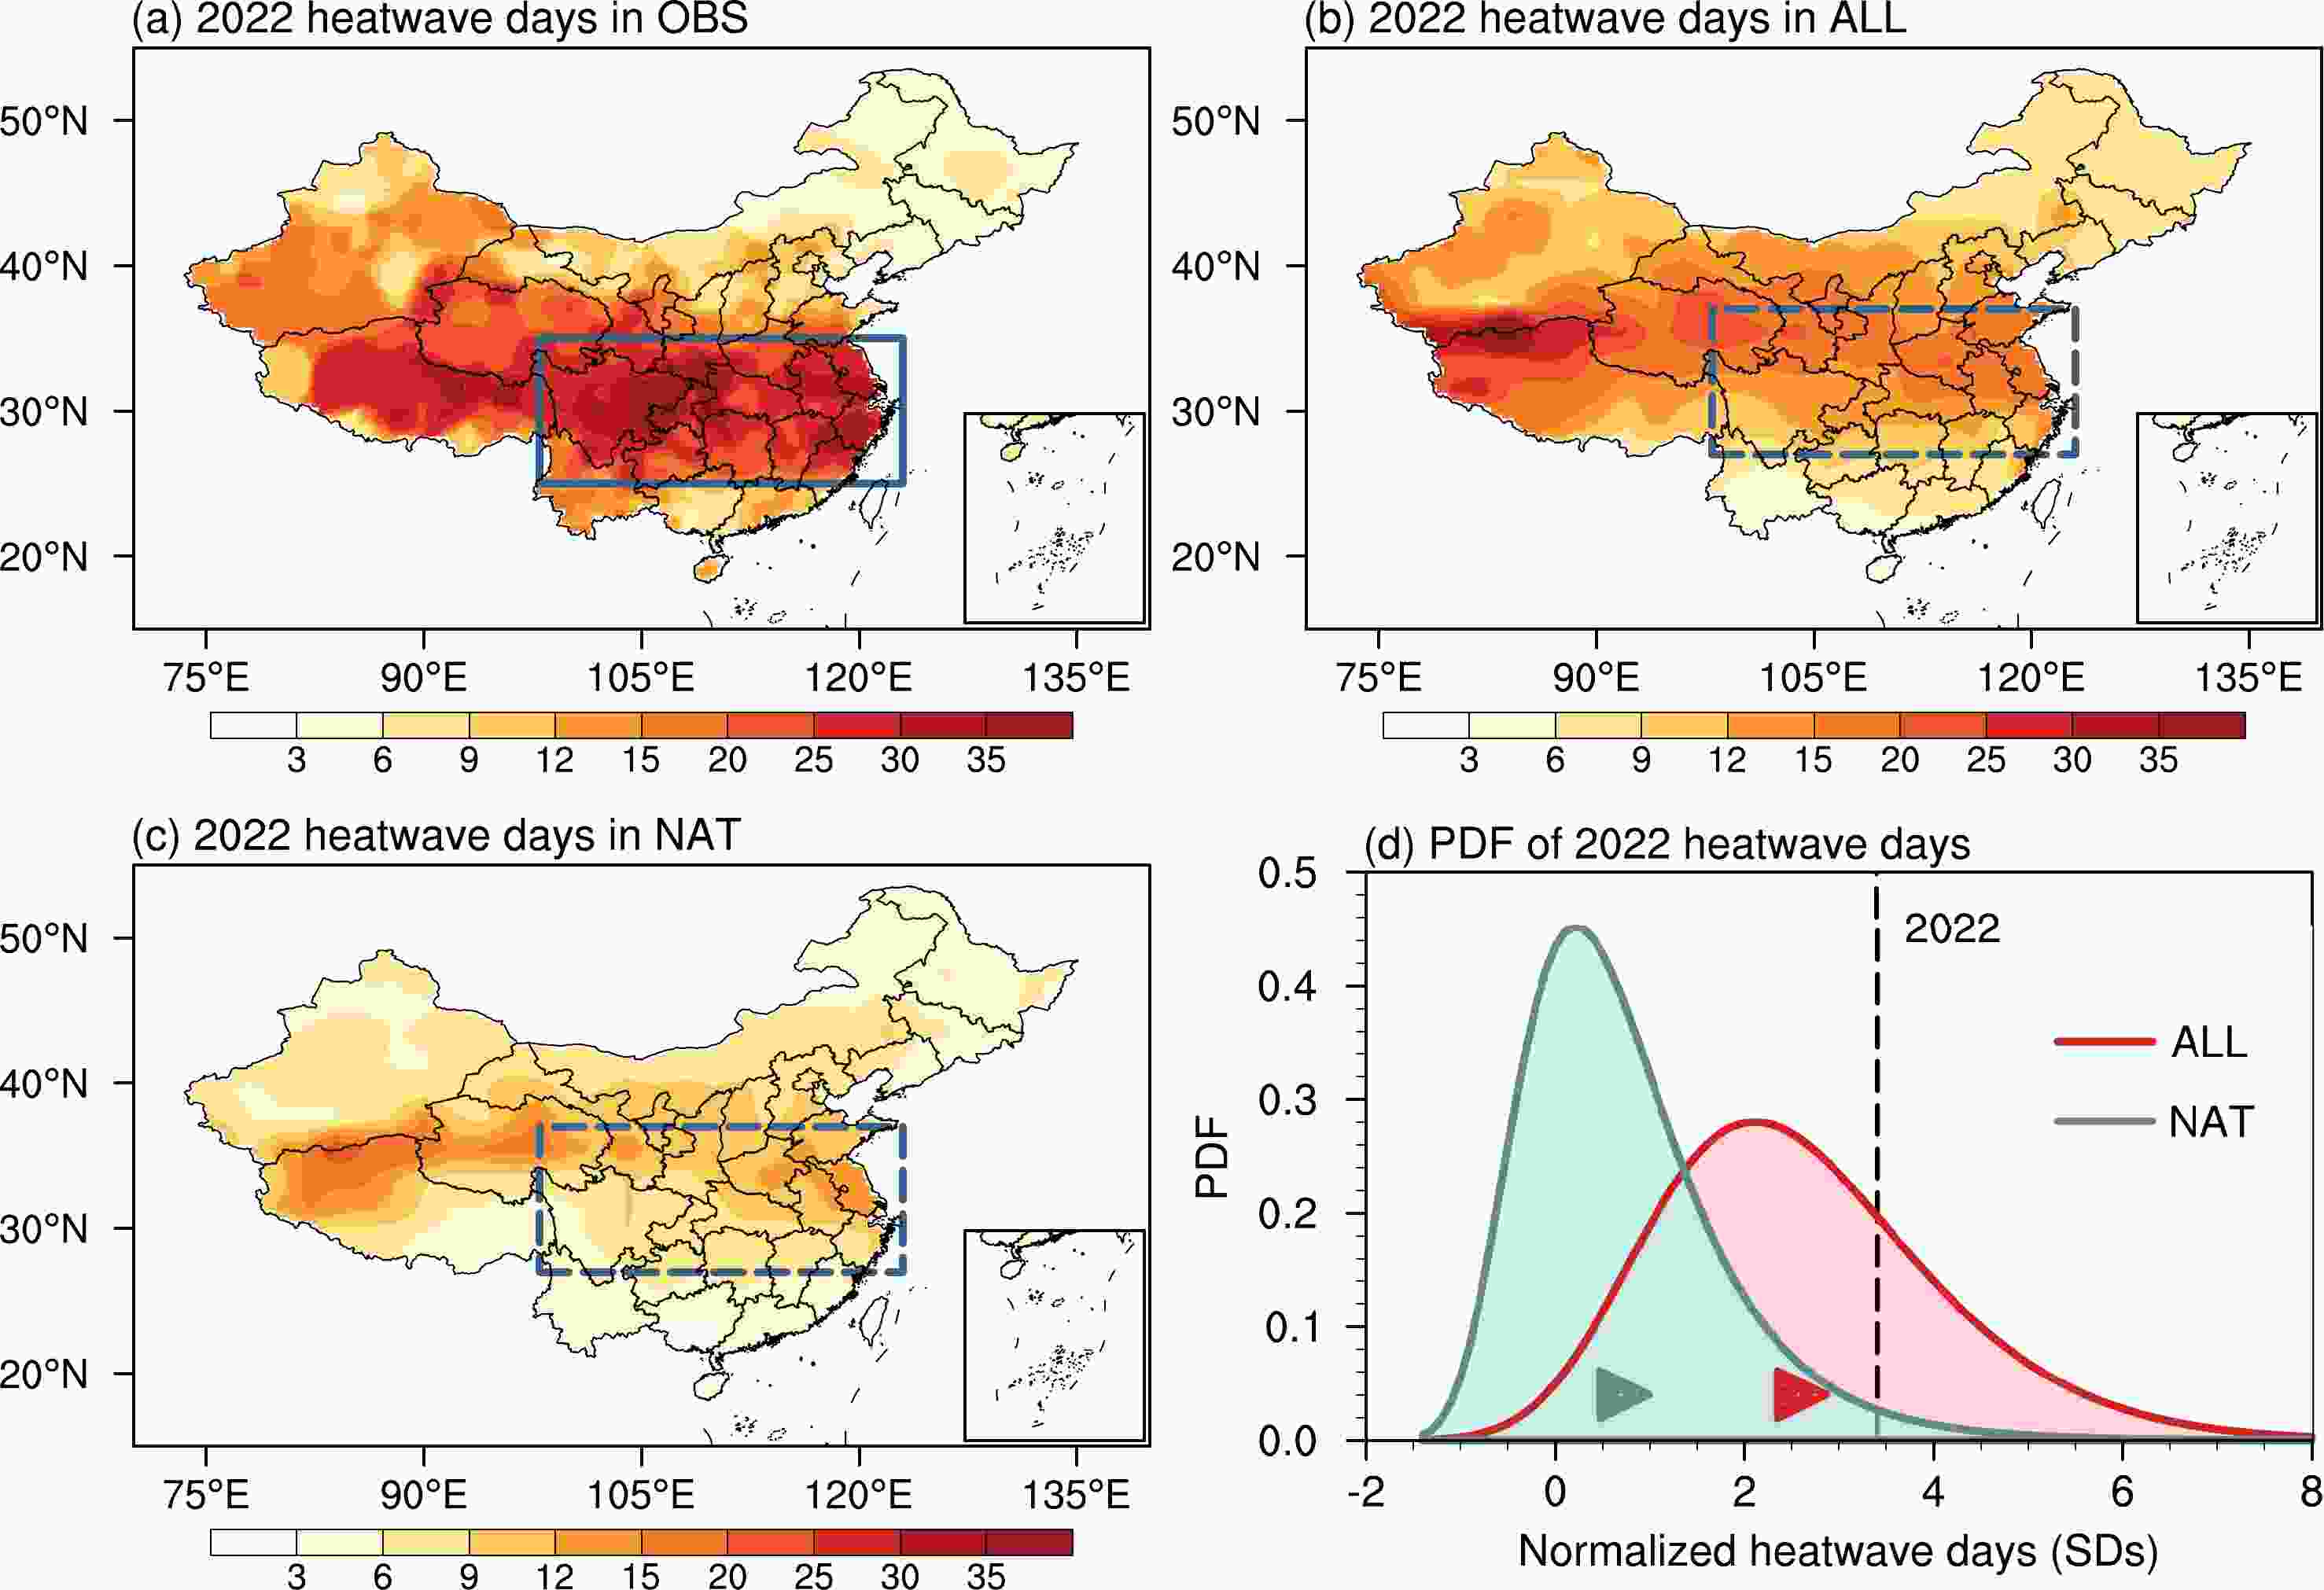
Figure 5. The spatial distributions of heatwave days (number of days with Tmax exceeding the 90th percentile for greater than three consecutive days) in 2022 derived from (a) observed daily Tmax based on 836 meteorological stations in China, (b) the ensemble mean of 400 members for ALL in 2022, and (c) the ensemble mean of 400 members for NAT in 2022. (d) Fitted PDFs of heatwave days over the YRV region (blue boxes in b and c) in 2022 for the 400 members of the ALL (red) and NAT (green) experiment, standardized by the variation during 1981–2010. The red and green rectangles are the multi-member mean in ALL and NAT, respectively. The dashed vertical line is the value of 2022 in the observation. ALL is forced by GAMIL3.0 with observed SSTs and external forcings, while NAT does not include the human influence. For the experimental design, readers are referred to Stone et al. (2019) and Fig. 4 in this paper.
-
The summer of 2022 in Europe, characterized by several persistent heatwaves, was the warmest since at least 1950 (Fig. 4b). France and Spain bore the brunt of the heat (Fig. 1a), although anomalies were extremely large over much of the continent. The UK, for example, reached 40°C for the first time ever, surpassing the previous record that had been set just three years earlier. The extreme heat likely contributed to 60 000 excess deaths in the summer across Europe as a whole (Ballester et al., 2023).
Hydrologically, the summer, as well as the preceding spring, was characterized by several months of below-average rainfall (Figs. 3b and g), leading to one of the worst droughts in the past 500 years. Impacts included greater wildfire activity, more carbon emissions, freshwater availability and pressure on energy (Toreti et al., 2022).
Anomalous anticyclonic conditions over northwestern Europe played a big part in the situation in summer 2022, preventing incursions of moisture-laden low pressure systems from the Atlantic (Faranda et al., 2023). The large-scale circulation can explain 44% of the anomalous dry days over western Europe, and thus led to a persistent lack of precipitation (Herrera-Lormendez et al., 2023). Once in place, descending motion, promoted by the anticyclonic conditions, helped to warm up the lower atmosphere in much the same way as over China. Statistical analysis by Faranda et al. (2023) suggested modest roles played by ENSO in the upper-level circulation and the Atlantic Multidecadal Oscillation.
Several studies have examined the emerging anthropogenic role in the probability of excessive heat events in the European region in recent years. All have drawn similar conclusions, highlighting how these types of events have become much more frequent. Stott et al. (2004), for example, showed how the risk of a summer (2003), similar to that of 2022, in the region had already doubled in 2003) owing to anthropogenic warming. More recently, Christidis et al. (2015) highlighted how the return period of extreme summers like those of 2003 has reduced from thousands of years to a hundred years, in just a decade. More recently still, Christidis et al. (2020) estimated that the possibility of the UK breaching 40°C, was, at the time of their study, a once in a 100–300-year event. And most recently of all, Zachariah et al. (2023) noted that the breach actually observed in 2022 would have been almost impossible without the role of anthropogenic climate change (Table 1).
Regarding droughts in Europe, attribution studies combining observation-based datasets with climate models show that human-induced climate change has resulted in an approximate 3–4- and 5–6-fold increase in the risk of severe root-zone and surface SM deficits over western to central Europe, respectively (Table 1) (Schumacher et al., 2022). For the moment, the changes appear to be thermodynamic, due to the warming climate, rather than dynamic, such as a change in the frequency or extent of anticyclonic circulation (Faranda et al., 2023). Projections suggest the risk of such SM drought will continue to increase with future warming, as reported in IPCC AR6 (Lee et al., 2021).
-
Unusually warm conditions also dominated much of the U.S. during most months of 2022 (Fig. 3c), especially in the west. An unusually early extreme heatwave began in May. It peaked in July, with a Tmax of 53°C, before finally ending in late September. Corresponding SM deficits, likely to have been strongly related to the unusually warm conditions, can also be seen for the year in Fig. 3h. The deficits over the western U.S. (i.e., from the Rocky Mountains to the Pacific Coast) appear to be part of a persistent multi-year drought that started in the summer of 2020 (see the low SM in January 2022; Fig. 3h). The 2020–2021 drought has been described by some as possibly the worst drought in modern history for the western U.S. (Williams et al., 2022). Conditions in California and Nevada were the driest on record in early 2022. By December 2022, a drought emergency was declared in southern California, with measures introduced to restrict water availability. NOAA’s National Centers for Environmental Information’s Monthly Drought Report for 2022 gives further information about the event (NOAA, 2023).
Historically, ENSO variability is known to strongly influence winter rainfall over the western U.S., with El Niño winters being typically wetter than normal. However, any role played by the “triple-dip” La Niña in the conditions in 2022 over the western U.S. is, for the moment, unclear. The historical dependence of drought in the Southern Great Plains region on La Niña is statistically significant in winter but not in spring and summer. The effect of La Niña on drought in the region is also dependent on conditions in the North Atlantic (Pu et al., 2016). La Niña’s influence on the 2020/21 Southwest U.S. drought is also uncertain. NOAA’s Drought Task Force Report, 2022, suggested a greater role from natural variability (Mankin, et al., 2021).
-
The Horn of Africa includes Eritrea, Ethiopia, Djibouti, Kenya and Somalia. In 2022, this region experienced five consecutive seasons of drought: October–December (OND) 2020, March–May (MAM) and OND 2021, and MAM and OND 2022 (Fig. 3i), with the warmest Tmax in May 2022 (Fig. 3d). The overall drought was unprecedented in length, with the longest sequence of dry seasons in the historical record. As a result, by early 2023, approximately 23 million people in Ethiopia, Kenya and Somalia faced high levels of acute food insecurity. The Famine Early Warning Systems Network, in partnership with 14 other agencies, jointly called for sustained “no regrets” humanitarian efforts to deal with the situation (FEWS NET, 2023).
The Horn of Africa is located in a region of typically descending flow, on the western edge of the Indian Ocean branch of the longitudinally orientated Indo-Pacific Walker Circulation, with a resulting semi-arid climate. Anomalous rainfall, heat and ascending motion on the eastern side of the circulation, over Indonesia, thus has a strong influence on the Horn’s rainfall. The triple-dip La Niña, which would have enhanced the anomalies over Indonesia, was thus likely to have contributed to the African drought (RCCC, 2022; Funk et al., 2023). It is worth noting that strong warming trends in the western Pacific and frequent La Niña episodes since the late 1990s may have contributed to more frequent drying seasons in the Horn of Africa (Funk et al., 2023).
Attribution of the meteorological drought (i.e., low rainfall) was conducted over the southern Horn of Africa for 24 consecutive months from January 2021 to December 2022, as well as the long rains (March–May) in 2022 and short rains (October–December) in 2022 (Table 1) (Kimutai et al., 2023). Observations show a decreasing trend in the long rains but a wetting trend in the short rains. There is no trend when short and long rains are combined. Model-based attribution shows that human-induced climate change has increased the likelihood of less wet long-rains events as seen in the observations; but there is no attributable change when short and long rains are combined. Warming in the region has also likely increased the probability and severity of drought, through greater evapotranspiration. Estimates from model simulations suggest that the risk of droughts in the region may already have become ~100 times more frequent because of anthropogenic warming (Kimutai et al., 2023).
-
As in the U.S. and the Horn of Africa, multi-year drought conditions also impacted large parts of central South America from 2019 to 2022, including Argentina, southern Bolivia, central Chile, and most of Paraguay and Uruguay. Observed SM levels were below each month’s fifth percentile of historical values in almost every month of 2022, with records broken in the months before June (Fig. 3j). Two consecutive heatwaves in late November and early December 2022 (Fig. 3e) (with Tmax reaching a record high of 46°C at Rivadavia station) made the prolonged drought even worse. The SM anomaly and vegetation conditions were the worst in the lower part of the La Plata Basin (EC et al., 2023). Central Argentina recorded its driest year since 1960 reported by the WMO State of the Global Climate report 2022. The combination of high temperatures and prolonged drought led to widespread crop failures and affected global crop markets. It also contributed to the loss of 30%–50% of glacial ice cover in the Andes (UNEP, 2023).
According to the high correlation between the rainfall deficit during OND in central South America and the Niño-3.4 index, the event can be partially attributed to La Niña (Arias et al., 2023). Other oceanic factors, such as warm SST anomalies over the tropical Atlantic Ocean, Indian Ocean variability (Taschetto and Ambrizzi, 2012; Chan et al., 2018) and the Southern Annular Mode (Vera and Osman, 2018) are also important for South American climate anomalies. However, their relative roles in this prolonged drought since 2019 are still unclear.
Attribution studies show that rainfall over this entire region has decreased over the last 40 years, but within the range of natural variability, and can thus not entirely be attributed to climate change. In particular, the deficit during OND in this region was strongly related to the ENSO conditions. Thus, the rainfall deficit of the three-year drought was partly driven by the “triple-dip” La Niña (Arias et al., 2023). Although the low rainfall cannot be attributed to climate change, human-induced warming appears to have decreased the availability of water and enhanced the level of drought in late 2022 in this region (the effect was not quantified; Arias et al., 2023) (Table 1).
-
Compound heatwave and drought events have been becoming more frequent in recent decades and, as part of a warming world, are projected to potentially become much worse in future, presenting significant challenges for sustainable development. Improving understanding of their causes is thus a key requirement of science in order to improve our preparedness for them in coming decades. As a possible foretaste of the future, such events were a major feature of the year 2022 in several large parts of the world. On a worldwide scale, the aggregated intensity of extreme high temperatures reached a record 3.61 SDs. Extreme drought covered 47.3% of global land areas, making 2022 the second worst year for this phenomenon since 1980. For four large parts of the world, the exceptional droughts of 2022 were part of a longer-term, multi-year trend of drought, partly driven by the “triple-dip” La Niña and anthropogenic climate change. However, understanding the causes and impacts of the “triple-dip” La Niña and other modes of variability on these types of extreme events is still a work in progress. In addition, the interaction between the tropics and extratropics caused by sea-ice coverage in the Arctic or the amplification of synoptic-scale Rossby waves could also play important roles (Petoukhov et al., 2013; Coumou et al., 2018), but the underlying mechanisms are still unclear and deserve further investigation. This, in particular, includes understanding of the feedbacks between heatwaves and drought and land–atmosphere interaction processes.
Another difficulty posed by the events of 2022 is their predictability. The spatial distribution and amplitude of the heatwave over the YRV, for example, was poorly predicted by currently available seasonal forecast systems, even just one month ahead. Part of this shortcoming may be due to the complexity of interactions between tropical and midlatitude dynamics and interplay between natural variability and external forcing. Conventional climate prediction systems generally perform better at foreseeing seasonal means but do less well with extremes. Current prediction systems are struggling to meet demand and will need to be improved in the future (Hu et al., 2023). Improvements are thus needed to reduce socioeconomic losses.
Currently available attribution studies on the hot and dry conditions in 2022 mostly focus on one aspect of the compound events (either extreme high temperatures or drought), based on well-established attribution approaches, e.g., a risk-based framework. The attribution and projection of such compound events, though, pose new challenges to existing methodologies. Firstly, the identification and definitions of compound events need to consider multiple variables at a variety of spatiotemporal scales, which may exhibit non-stationary statistical characteristics under climate warming. Secondly, more complex evaluation and bias corrections are required to take into account nonlinear interactions and feedbacks across different components of the earth system. More advanced attribution methodologies, in order to handle compound events, are also required beyond those currently available, such as the risk-based attribution framework.
As the world warms, and extreme events become increasingly frequent, real-time attribution of extremes will become a growing requirement for governance and society. So far, most of the existing real-time attribution studies for events such as in 2022 have been based on outputs from CMIP models, which are not initialized from real-time SST observations. They therefore miss some of the forcing patterns unique to those of actual years, such as 2022. A wide gap thus remains to be filled between current attribution capability and what could be possible. A real-time attribution system based on an AGCM is still rare. The most widely used AGCM-based quasi-real-time attribution experiments are from the Met Office, which has been updated from low resolution to high resolution. These experiments contributed greatly to the international Climate of the 20th Century Plus (C20C+) project, the European Climate and Weather Events: Interpretation and Attribution (EUCLEIA) event attribution project, and the Climate Science for Service Partnership (CSSP)-China programme (Ciavarella et al., 2018). At present, an AGCM-based real-time attribution system does not exist in China. CAS-DAsys, which includes 50-member historical ALL forcing and NAT forcing simulations for 1961–2020 and a large-ensemble simulation of the year 2022, provides a solid database for the real-time attribution and physical understanding of extreme events. It is hoped that development on a current system at IAP/CAS (CAS-DAsys) may start to fill this gap in the coming years.
Acknowledgements. This work was supported by the National Natural Science Foundation of China (Grant No. 42075037 and 42275033) and the UK–China Research and Innovation Partnership Fund through the Met Office Climate Science for Service Partnership (CSSP)-China programme as part of the Newton Fund. The CRU TS v. 4.07 datasets can be obtained from
https://crudata.uea.ac.uk/cru/data/hrg/ . The GLEAM database v3.7a is available athttps://www.gleam.eu/ .
| Region | Severity | Attribution conclusions | Reference |
| Yangtze River Valley in China | The 12 consecutive days of red high-temperature warnings in 2022 was, under the current climate, a once-in-152-year event, approximately. | Based on observational analysis, the likelihood of extreme high temperature such as that in 2022 has increased fivefold (0.4–284.0), and the intensity has increased by 1.3°C (0.5°C–1.9°C); and based on CMIP6 analysis, by 133 times (82.4–257.8) and 2.3°C (2.2°C–2.4°C). | Ye et al. (2022) |
| West Europe | The hottest summer on record, and worst drought condition in at least 500 years. | Human-induced climate change made the record high temperature in the UK at least 10 times more likely, and the root-zone (surface) SM drought 3–4 (5–6) times more likely. | Zachariah et al. (2022); Schumacher et al. (2022) |
| The West U.S. | California and Nevada were the driest on record in early 2022. | Not available yet. | — |
| The Horn of Africa | An unprecedented drought with the longest sequence of dry seasons in history. | Human-induced climate change has increased the likelihood of low rainfall events during the long rains (MAM), but there is no attributable change when short (OND) and long rains are combined. By conservative estimate, the probability has increased by ~100 times in the present day, compared to a 1.2°C cooler world. | Kimutai et al. (2023) |
| Central South America | The driest year over central Argentina since 1960. The worst SM and vegetation conditions in the lower part of the La Plata Basin. | The low rainfall cannot be attributed to climate change. Human-induced rising temperatures decreased water availability and enhanced the drought in late 2022 in this region (the effect was not quantified). | Arias et al. (2023) |
 AAS Website
 AAS WeChat