


 DownLoad:


-
The northwestern part of Beijing and neighboring Hebei and Tianjin provinces (hereinafter referred to as North China) is surrounded by mountains, forming a natural barrier with an average elevation of 1000 m, while the southeastern part is a gradually shifting plain. The region’s unique topographical conditions make it highly susceptible to the triggering of strong convective weather, particularly during the summer season (Jiao and Bi, 2005; Sun, 2005; Sun et al., 2006). Thunderstorm gusts are a frequent occurrence during such convective weather events, and in North China, the climatic probability of strong wind events occurring during the warm season (May to September) from 2001 to 2008 was as high as 42.3% (518 out of 1224 days produced thunderstorm gusts), using 17 m s−1 as the wind speed threshold (Ding et al., 2007a, b; Min, 2012). Thunderstorm gusts are characterized by a relatively small temporal and spatial scale, which renders them localized, sudden, and highly destructive. As such, the monitoring and forecasting of thunderstorm gusts presents major challenges. Studying the manner in which thunderstorm gusts are generated and how strong wind events evolve over time, and developing a successful prediction model for thunderstorm gusts, are important for early warning and mitigation measures. By doing so, we can significantly reduce economic losses and protect people’s everyday lives.
Many methods for forecasting thunderstorm gusts have been proposed over the past decades (Lagerquist et al., 2017; Jiang et al., 2019; Zhou et al., 2019; Li et al., 2020; Liu et al., 2021; Coburn and Pryor, 2022; Guastavino et al., 2022). Among these, two commonly used approaches are the nowcasting forecast and potential forecast. The nowcasting forecast method primarily relies on certain characteristic features of radar products (Guo et al., 2022b), including reflectivity, radial velocity, and vertically integrated liquid (VIL) data to determine the movement trajectory of thunderstorm cells and the physical structure of thunderstorm gusts. The nowcasting forecast method is suitable for the nowcasting of thunderstorm gusts (Dong and Wu, 2007; Yang et al., 2018). For example, Dong and Wu (2007) utilized VIL data obtained from a new generation of Doppler weather radars to statistically analyze the evolution of VIL before and after the occurrence of catastrophic gust weather. They concluded that VIL can serve as a crucial nowcasting factor for catastrophic gusts. Yang et al. (2018) selected the meteorological statistical features corresponding to various life stages of thunderstorm gusts and realized the nowcasting of thunderstorm gusts based on the radar reflectivity and radial velocity. However, the nowcasting forecast method, relying on radar product data for the forecasting of thunderstorm gusts, predominantly benefits short-term periods—specifically, when there are no significant changes in the convective system structure—and cannot meet the practical needs of longer-term (more than 6 h) forecasts.
The potential forecast method relies on various meteorological sounding data or numerical weather prediction (NWP) models. It achieves longer-term (more than 6 h) forecasts (Yan et al., 2013; Lü et al., 2020) by using the difference in temperature at the same time at different altitudes (e.g., the temperature difference between 850 hPa and 500 hPa), or at different times at the same altitude (e.g., the current and predicted 2-m surface temperature difference), the typical parameters of sounding curves and mesoscale atmospheric environments, and some meteorological physical parameters [e.g., convective available potential energy (CAPE), convective inhibition, and DCAPE (downdraft CAPE)]. Guo et al. (2022b) developed a continuous probability forecast model for thunderstorm gusts of up to 24 h under different weather conditions, using data from the Meteorological Data Center of the China Meteorological Administration (CMA) and National Centers for Environmental Prediction (NCEP) reanalysis data in 12 consecutive years of thunderstorm gust weather events in Hubei Province. Furthermore, Yan et al. (2013) selected specific dynamic thermal atmospheric physical indicators from NCEP reanalysis data to forecast thunderstorm gusts in particular areas within North China for six summers. Lü et al. (2020) utilized probability statistics and weighted assignment to construct a thunderstorm gusts prediction model based on NCEP reanalysis data in Henan Province. However, as high-resolution numerical model forecasts become increasingly extensive, it becomes increasingly difficult for forecasters to subjectively extract critical information such as convective occurrence and development characteristics. Relying solely on numerical models to extract key formation conditions related to severe convective weather can lead to a significantly higher false alarm rate (Schultz et al., 2009; Harris et al., 2010).
In recent years, machine learning techniques have made remarkable progress in many fields, including atmospheric science (Wang et al., 2018; Han et al., 2020, 2021; Huang et al., 2020, 2022; Xia et al., 2020; Duan et al., 2021; Jin et al., 2022; Zhang et al., 2022a, b, c). When a large amount of data is fed into a machine learning model and “trained” by a suitable algorithm, the model itself can learn how to execute a task (Jordan and Mitchell, 2015). Since Hinton and Salakhutdinov (2006) proposed a deep artificial neural network encoded by a restricted Boltzmann machine, artificial neural networks with a high number of hidden layers have appeared in various fields, and deep learning (DL) is coming of age, but is still a part of machine learning. Traditional machine learning typically relies on feature engineering, which requires human processing and often introduces unnecessary human factors. In contrast, DL can automatically extract high-level abstract features from diverse historical data when dealing with large-scale complex datasets, and this capability allows DL models to handle intricate patterns and make accurate predictions in various domains (Janiesch et al., 2021; Sarker, 2021; Sharma et al., 2021). After initializing the model weights, the use of a back-propagation algorithm (Rumelhart et al., 1986) makes it possible to update their internal weight parameters so that a task-specific DL model can be trained (LeCun et al., 2015). Because of its wide availability and ease of portability, the convolutional neural network (CNN) (LeCun et al., 1998; Si et al., 2022) and various extensions have become very popular in the field of DL, and are frequently applied in the nowcasting of severe convective weather (Lagerquist et al., 2017; Jiang et al., 2019; Zhou et al., 2019; Li et al., 2020; Guastavino et al., 2022). The National Oceanic and Atmospheric Administration (NOAA) and Cooperative Institute for Meteorological Satellite Studies (CIMSS) from the University of Wisconsin have developed the NOAA/CIMSS Probabilistic Intense Convective Weather (ProbSevere) modeling system, based on years of research in satellite, radar, lightning, NWP, and image processing. The system incorporates a variety of datasets to predict the probability of any given thunderstorm that can lead to hail, thunderstorm gusts, tornadoes, and other strong convective weather in the continental United States from 0–60 min (Cintineo et al., 2014, 2018). Lagerquist et al. (2017) used a DL algorithm to combine thunderstorm features tracked through radar data with sounding observation features near convective systems. The results showed that it could predict gust-front gales within 10 km of convective systems with a lead time of 60–90 min, which has good practical value. Jiang et al. (2019) constructed some multi-source CNNs based on different feature backbone extraction networks for the comparison of thunderstorm gust forecast results. Zhou et al. (2019) employed a CNN to forecast strong convective probability by utilizing over 100 convective indices and physical quantities from NCEP reanalysis data. Li et al. (2020) also constructed four different CNNs for detecting thunderstorm gusts, which performed better compared to 10 traditional machine learning algorithm models—namely, Decision Tree Regressor, Linear Regression, Ridge Regression, Lasso Regression, Random Forest Regressor, K-Nearest Neighbor Regressor, Bayesian Ridge Regressor, Adaboost Regressor, Support Vector Regressor, and Gradient Boosting Regressor. Guastavino et al. (2022) utilized a combination of CNN and Long Short Term Memory algorithms to facilitate nowcasting and warning of incoming thunderstorm weather by using radar data. Xiao et al. (2023) introduced an innovative neural network model termed CGsNet, designed to integrate gust factor and average surface wind speed for the explicit purpose of quantitatively forecasting thunderstorm gusts within a lead time of 0–2 hours. Their findings revealed that, in comparison to traditional NWP methods such as INCA (Haiden et al., 2011), CGsNet exhibits superior performance across all evaluation criteria. In addition, the forecasting skill of CGsNet becomes increasingly pronounced with escalating peak wind gust speed thresholds. Notably, when the peak wind gust speed threshold reached 17.2 m s−1, the probability of detection (POD) and critical success index (CSI) of CGsNet is 0.25 and 0.15, respectively, representing a substantial improvement over the corresponding values of 0.07 and 0.03 obtained using INCA.
However, the current DL algorithms for predicting thunderstorm gusts mainly focus on supercell storms, and the datasets used for training primarily comprise observation and reanalysis data, lacking the incorporation of high spatial and temporal resolution nowcasting, rapidly updated assimilated NWP data, and high-frequency multi-source observations as inputs to DL algorithms. As a result, these models are unable to realize high-resolution gridded forecasting of thunderstorm gusts with a seamless transition from a few minutes to a few hours (Cintineo et al., 2014; Lagerquist et al., 2017; Jiang et al., 2019; Zhou et al., 2019; Guastavino et al., 2022).
To obtain gust forecast products with a resolution of 500 m in North China, the Rapid-refresh Integrated Seamless Ensemble (RISE) in the Rapid-Refresh Multi-Scale Analysis and Prediction System (RMAPS) (hereinafter referred to as RMAPS-RISE) from the Institute of Urban Meteorology (IUM) (Cheng et al., 2019; Song et al., 2019; Yang et al., 2019, 2021; Chen et al., 2020a) utilizes a combination of climatological grid-based gust factors, observations, and average wind speed and direction forecasts to predict gust winds (Yang et al., 2023a). RMAPS-RISE has shown good skill in systematic gust forecasting (Yang et al., 2023a), so we use the gust forecast of RMAPS-RISE as a reference standard (hereinafter referred to as RISEgust). However, thunderstorm gusts are often associated with strong convective weather such as downbursts, bow echo gales, and gust fronts (Zheng et al., 2015), which occur suddenly and are highly localized. The gust forecast of RMAPS-RISE is primarily based on gust coefficient models and average wind data and do not take into consideration the key formation conditions of strong convective weather such as CAPE, vertical wind shear, and the temperature difference between 850 hPa and 500 hPa, and the performance for convective gust forecasting requires further evaluation.
In summary, this paper proposes a fine-grained forecasting method for thunderstorm gusts with a resolution of 500 m for the next 1–6 forecast hours by combining artificial intelligence methods with multi-source dense and high-frequency observational data and key dynamic and microphysical parameters from numerical models available in real time. The multi-source data are used for training, validation, and testing, and the predictors used as inputs to the model are multiple, high-resolution data from observation, RMAPS-RISE, and NWP at a specific moment prior to the occurrence of thunderstorm gusts. (For example, to implement a 1-h forecast, select the NWP data 1 h before the moment of thunderstorm gusts). The ground truth (treated as correct answers) of thunderstorm gusts is created by various observed meteorological data (e.g., radar, lightning and AWSs) with specific treatment. Given the favorable performance of U-net-based networks in meteorology (Han et al., 2020, 2021, 2022), a DL model called Thunderstorm Gusts TransU-net (TG-TransUnet) is developed to evaluate the forecasting accuracy of thunderstorm gusts with lead times up to 6 h, drawing inspiration from the TransU-net method introduced by Chen et al. (2021a). In addition, several other U-Net family networks are compared.
The remainder of this paper is organized as follows. Section 2 describes the input data and dataset processing procedure. Section 3 introduces our DL methodology, and section 4 analyzes the experimental results. Conclusions are presented in section 5.
-
To identify thunderstorm gusts in North China between 2021 and 2023, this study utilizes wind field information from automatic weather stations (AWSs), as well as data obtained from lightning locators and radars.
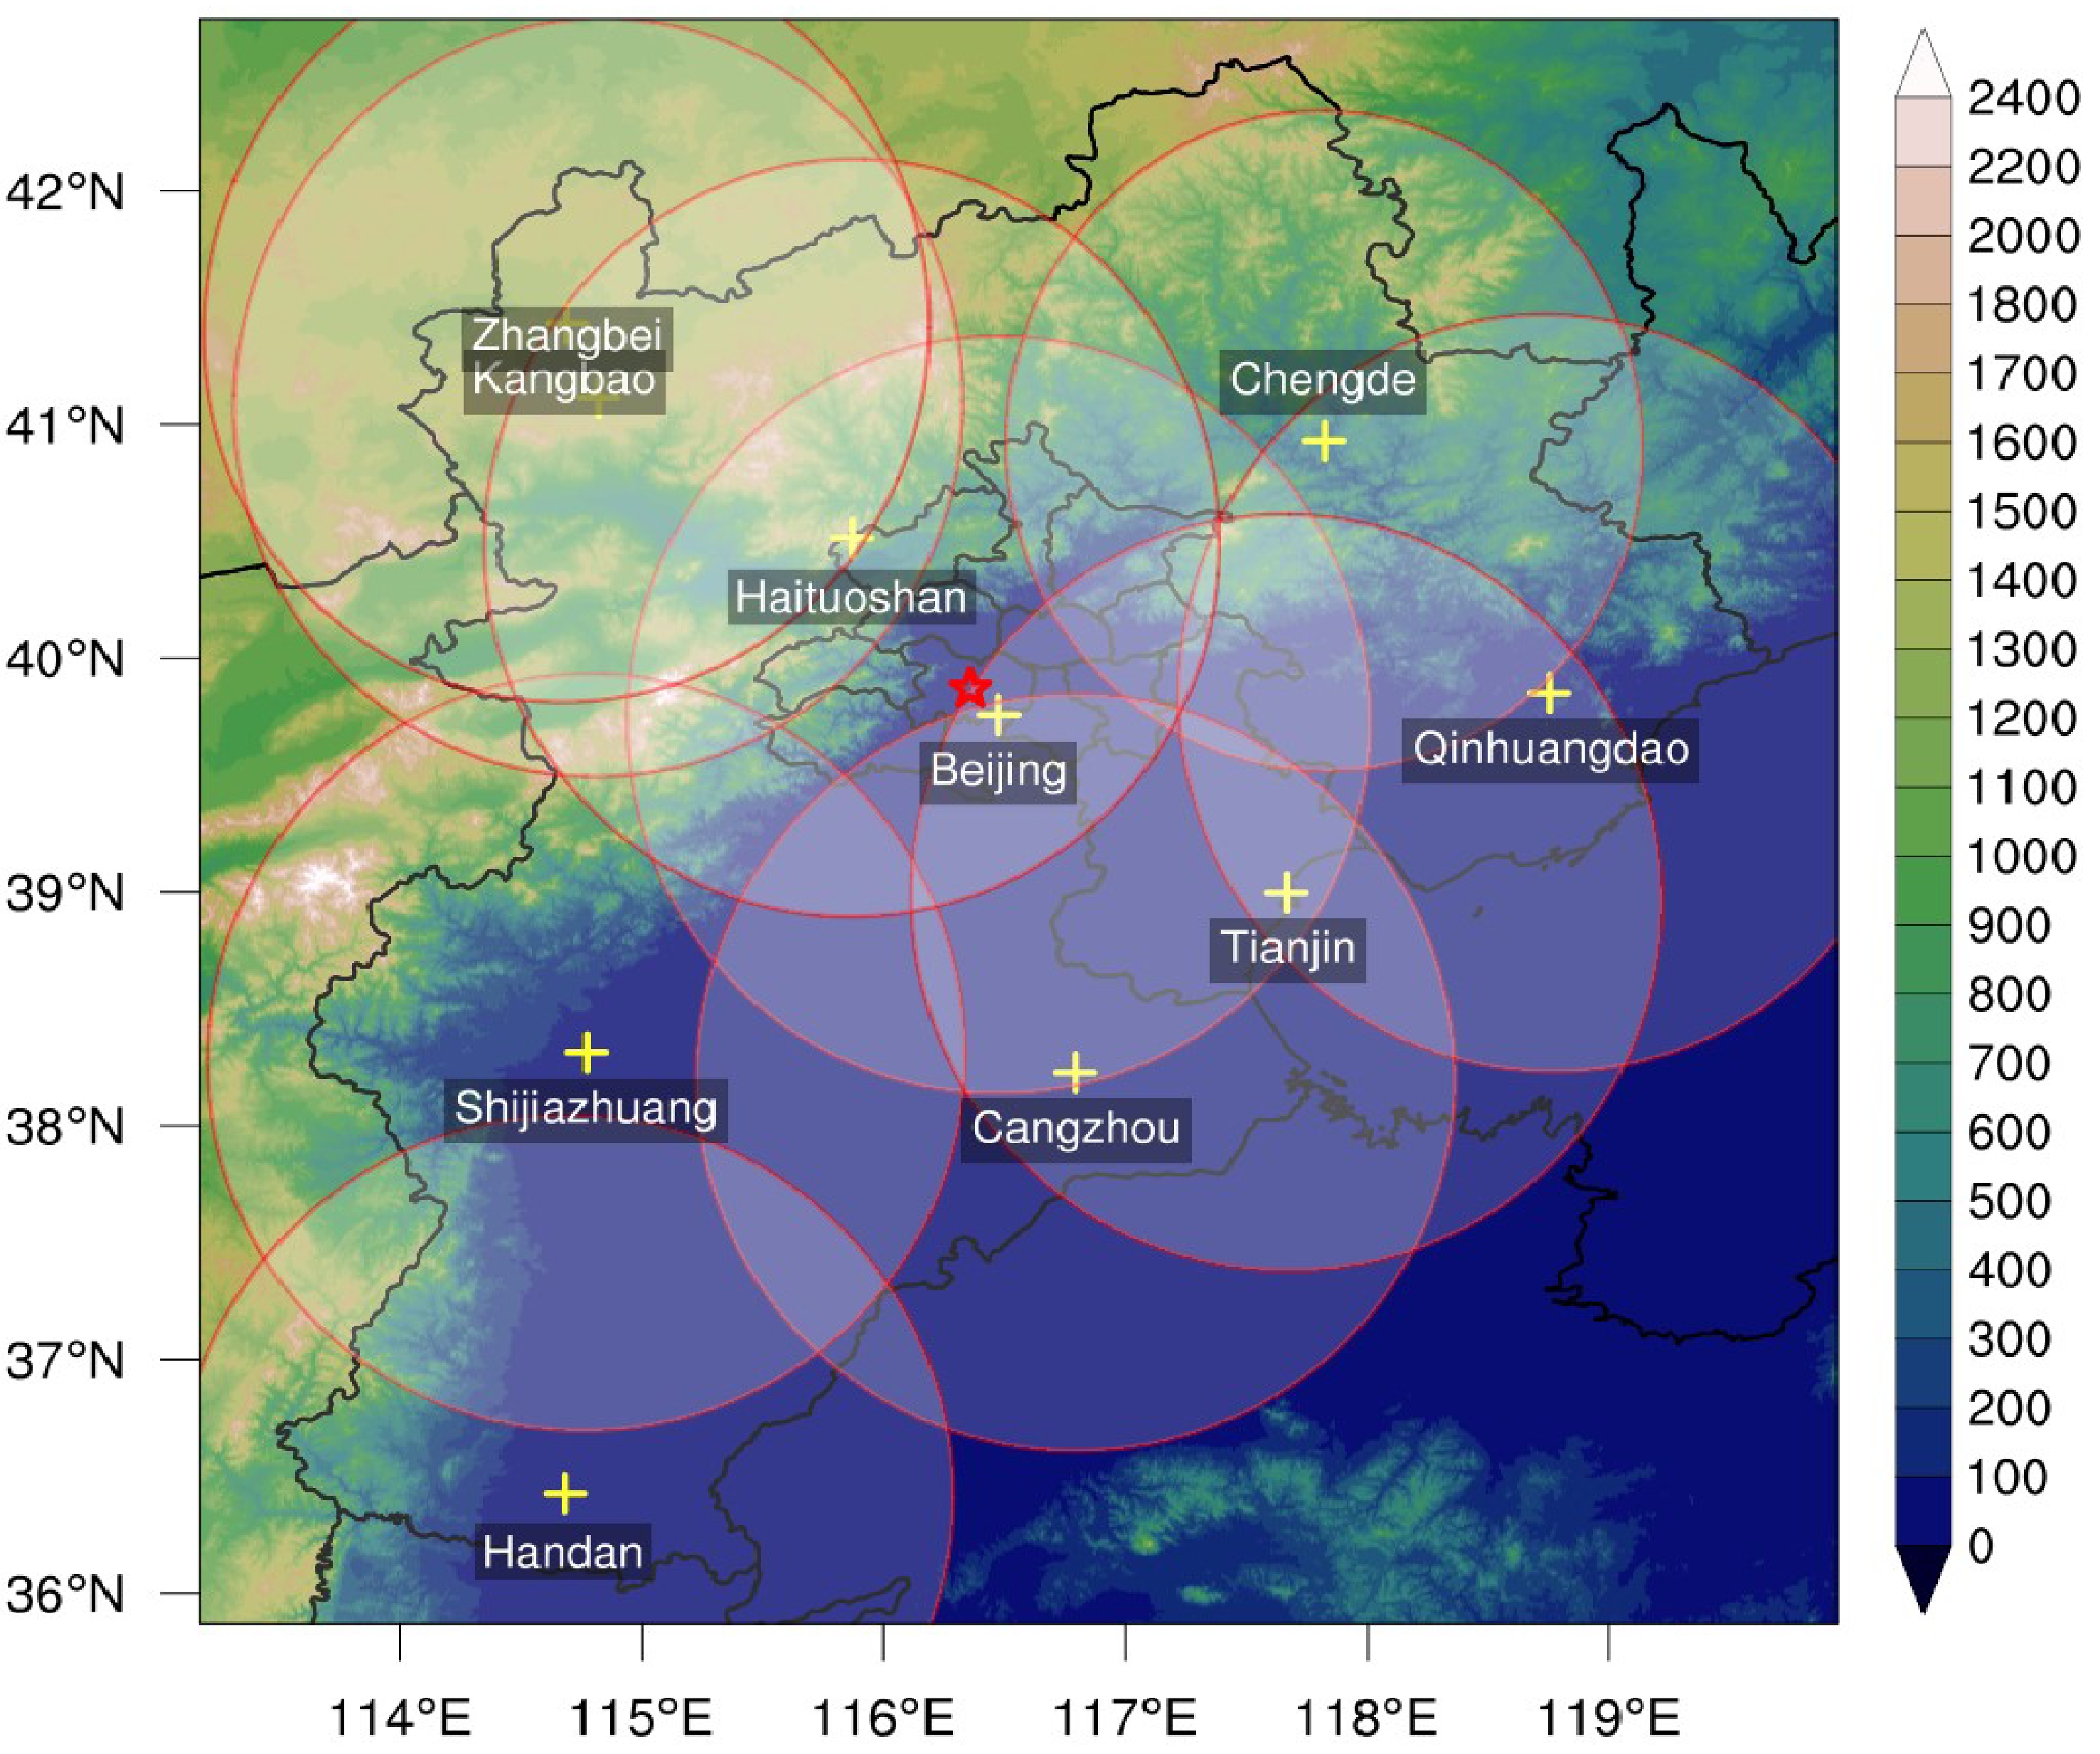
Each piece of thunderstorm gust data contains the following elements: AWS data, lightning data, radar data, RMAPS-RISE data, and rapidly updated high-resolution NWP products of every thunderstorm gust process. The AWS data, lightning data, and radar data are used to make the ground truth of thunderstorm gusts, and the radar data, RMAPS-RISE data, and rapidly updated high-resolution NWP products are used to produce the training, validation, and testing datasets, respectively. Among them, the AWS data come from more than 3000 national and regional surface AWSs in North China, where extreme wind speed in 1 h (WSX) is used. The lightning data are cloud-to-ground lightning data from the National Lightning Monitoring Network, which mainly contain two-dimensional spatial information (LOCATION) and the time of occurrence (TIME). North China is covered by the entire lightning monitoring network, the positioning accuracy is better than 300 m, the detection efficiency is greater than or equal to 80%, and the detection range of a single station is greater than or equal to 300 km (Zhou et al., 2021). The weather radar data are obtained from the composite reflectivity factor mosaic of eight S-band radars (Beijing radar, Cangzhou radar, Qinhuangdao radar, Shijiazhuang radar, Tianjin radar, Handan radar, Haituoshan radar, and Kangbao radar) and two C-band radars (Chengde radar and Zhangbei radar) in North China (Yang et al., 2023b) (Fig. 1).

Figure 1. The topographic characteristics of the study area and the location of radar stations (red circles represent the coverage of radar stations; color shading represents terrain height; units: m).
RMAPS-RISE was developed by the IUM. With a lead time of 24 h, the system is updated every 10 min and there is a 1-h forecast gap. The spatial resolution is 500 m. The fundamental principle of RMAPS-RISE is to improve upon NWP model output by utilizing the most recent surface observational and high-resolution topographical data. Through the assimilation of multi-source observation data, the error of RMAPS-RISE has been greatly reduced, especially in nowcasting and short-range forecasts (Cheng et al., 2019; Song et al., 2019; Yang et al., 2019, 2021; Chen et al., 2020a). Therefore, one of the main input datasets used in this study is from RMAPS-RISE. There are 1221 and 1521 grid points in the x- and y- directions, respectively. The dataset mainly includes a 10-m height analysis of current gusts (UVana), a 10-m height prediction of future gusts (UVpred_RISE), a 1-h cumulative precipitation forecast (RRpred), and the difference between the current and predicted 2-m surface temperature (TQdiff).
The high-resolution NWP product is derived from the Rapid-Refresh Multi-Scale Analysis and Prediction System for Short-Term weather (RMAPS-ST) (Chen et al., 2020b, 2021c; Feng et al., 2021), which is a fast-updating cyclic mesoscale numerical prediction system with a spatial grid spacing of 3 km. There are 320 and 265 grid points in the x- and y- directions, respectively. It mainly includes air pressure (PRES), average wind speed at 80-m height (UVpred_ST), CAPE, composite radar reflectivity of RMAPS-ST (RADARST), vertical wind shear at 0–1 km (SHEAR1) and 0–6 km (SHEAR2), and temperature difference between 850 hPa and 500 hPa (TMPdiff). The parameters used in this study are shown in Table 1.
Product Parameter (s) Specific meaning Unit AWS DATA WSX Extreme wind speed in 1 h m s−1 LIGHTNING DATA LOCATION Two-dimensional spatial information ° TIME Time of occurrence UTC RMAPS-RISE UVana 10-m height analysis of current gusts m s−1 UVpred_RISE 10-m height prediction of future gusts m s−1 RRpred 1-h cumulative precipitation forecast mm TQdiff Difference between current and predicted 2-m surface temperature °C RADAR DATA RADAR Composite radar reflectivity factor dBZ RMAPS-ST PRES Pressure Pa TMPdiff Temperature difference between 850 hPa and 500 hPa K CAPE Convective available potential energy J kg−1 RADARST Composite radar reflectivity dBZ UVpred_ST Average wind speed at 80-m height m s−1 SHEAR1 0–1 km vertical wind shear m s−1 SHEAR2 0–6 km vertical wind shear m s−1 Table 1. Description of physical quantity parameters used in this study.
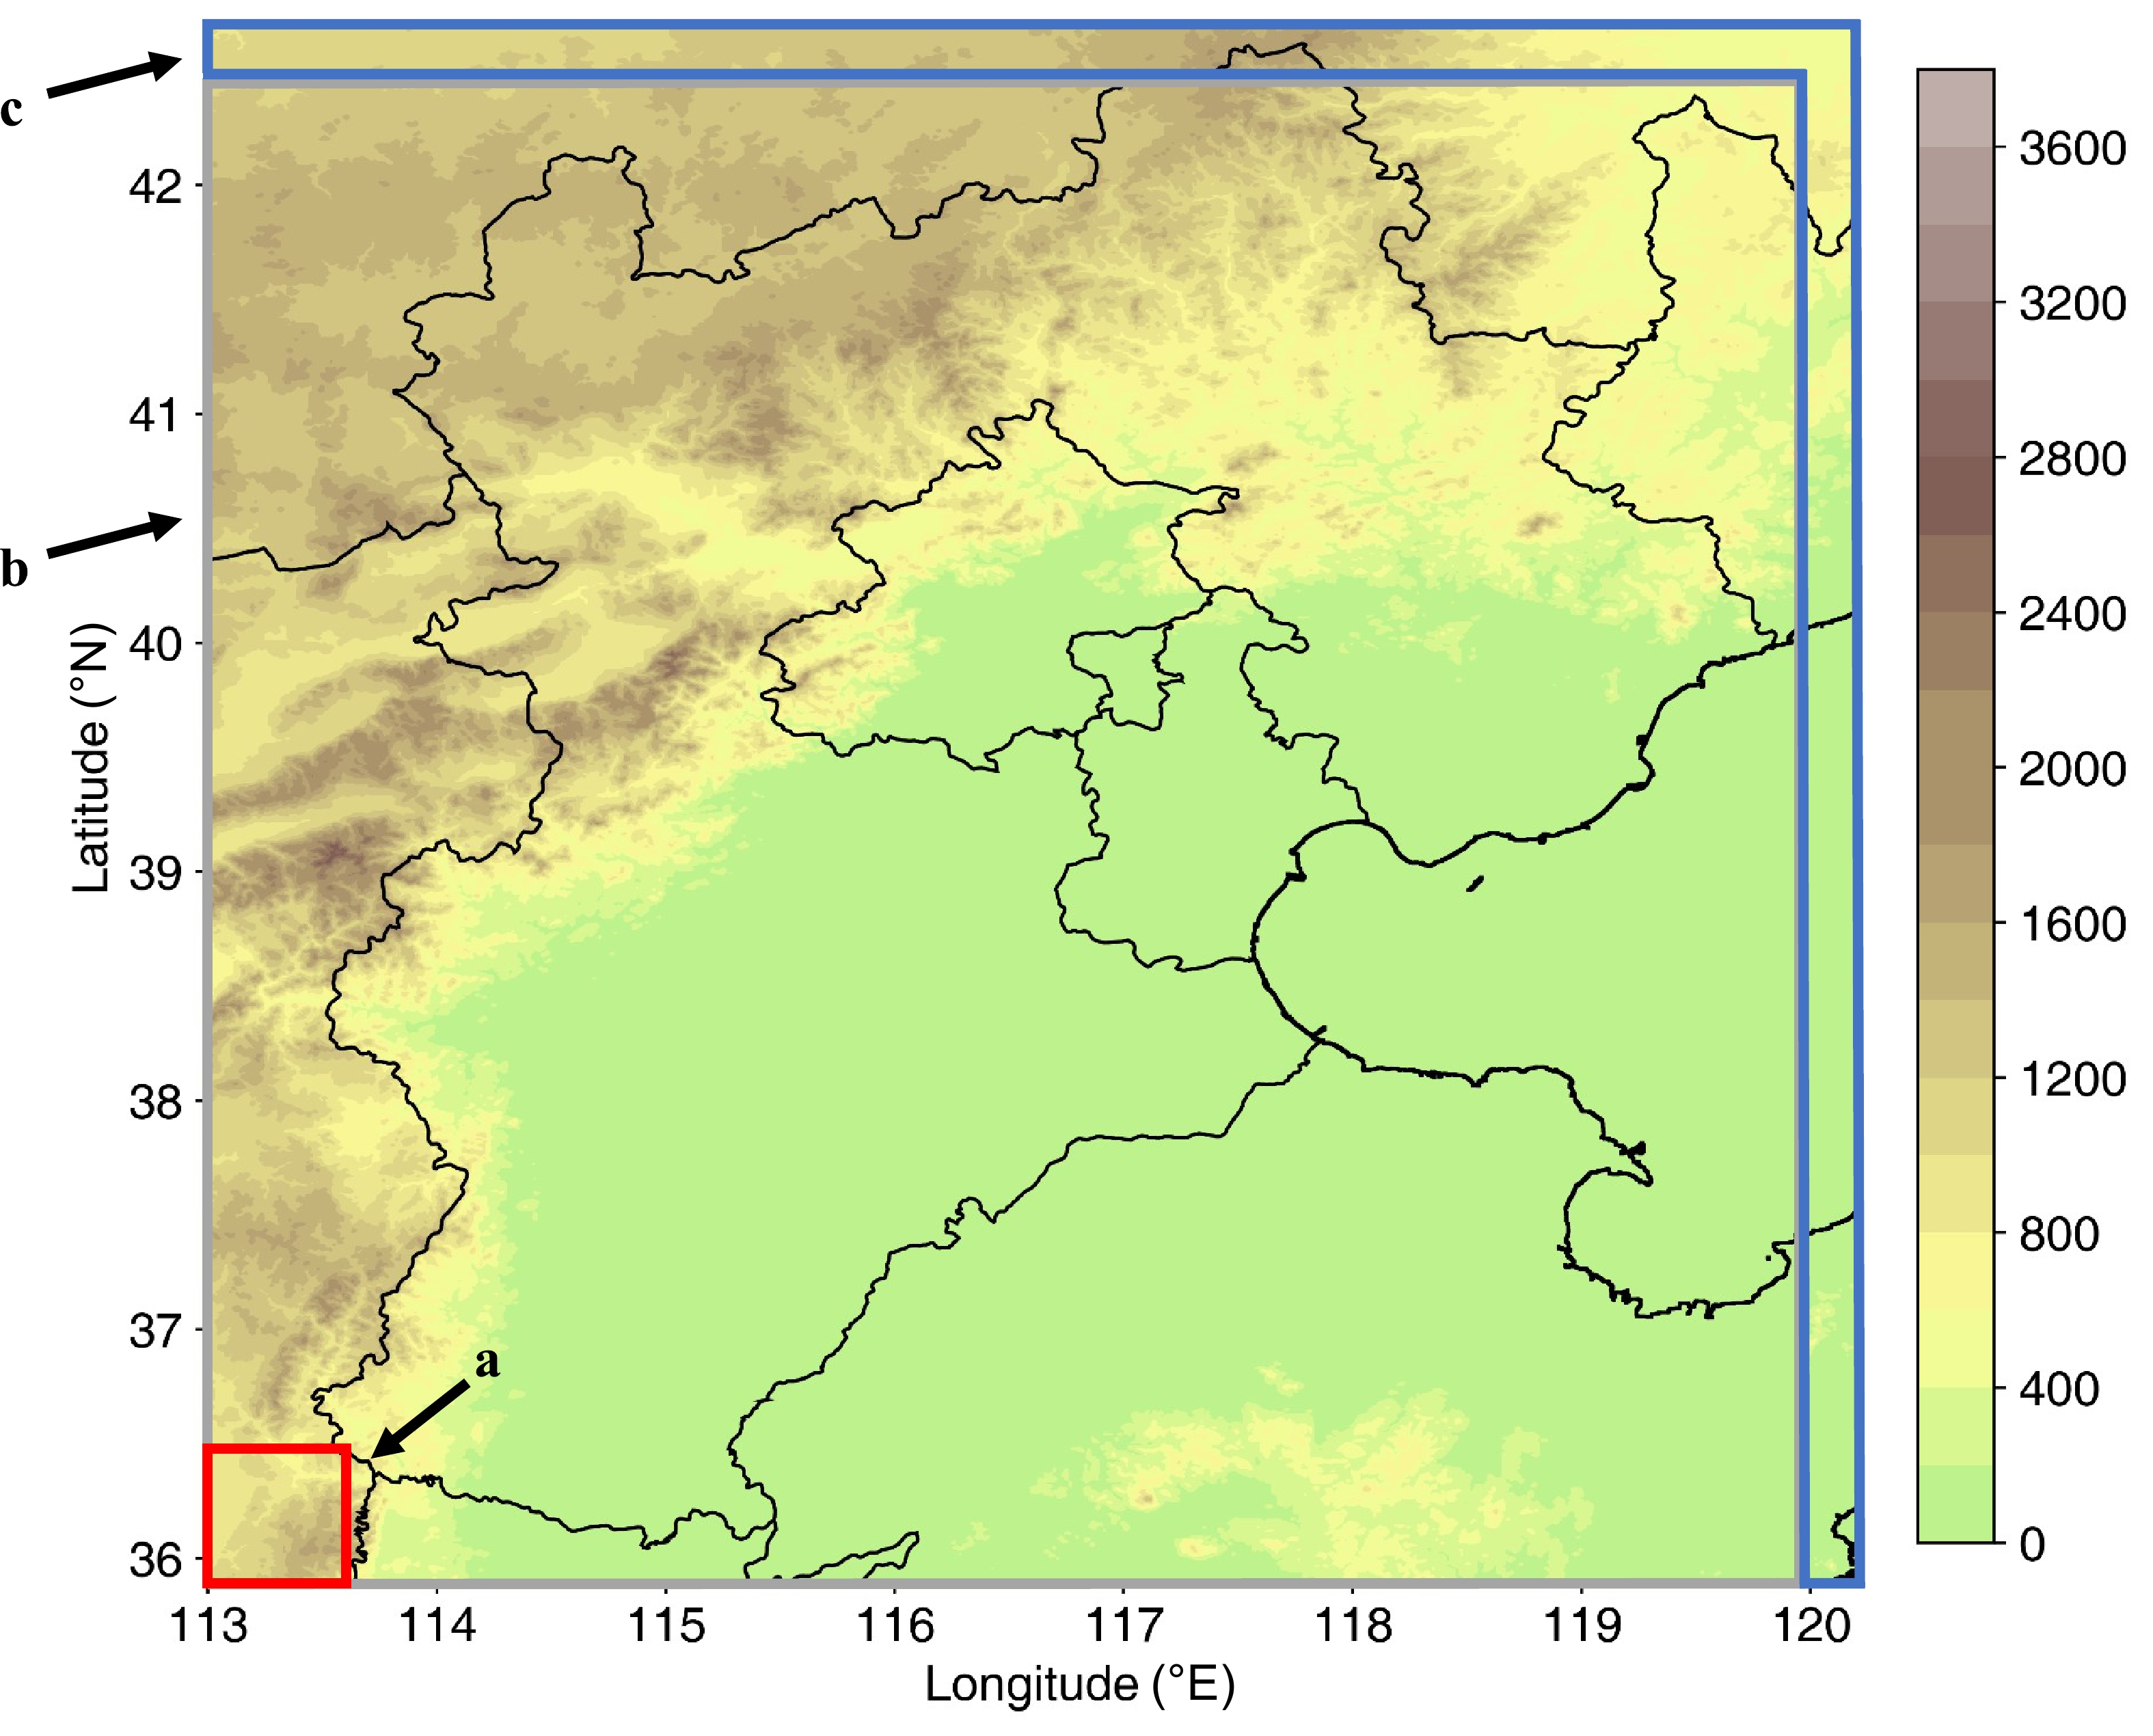
The study area is located within 35.9°–42.7°N and 113.2°–120.2°E, roughly covering North China. As the input data resolution varies, we standardize all the data into a 500 m grid spacing using an interpolation method. The x- and y- directions in the input data contain 1221 and 1521 grid points, respectively.
-
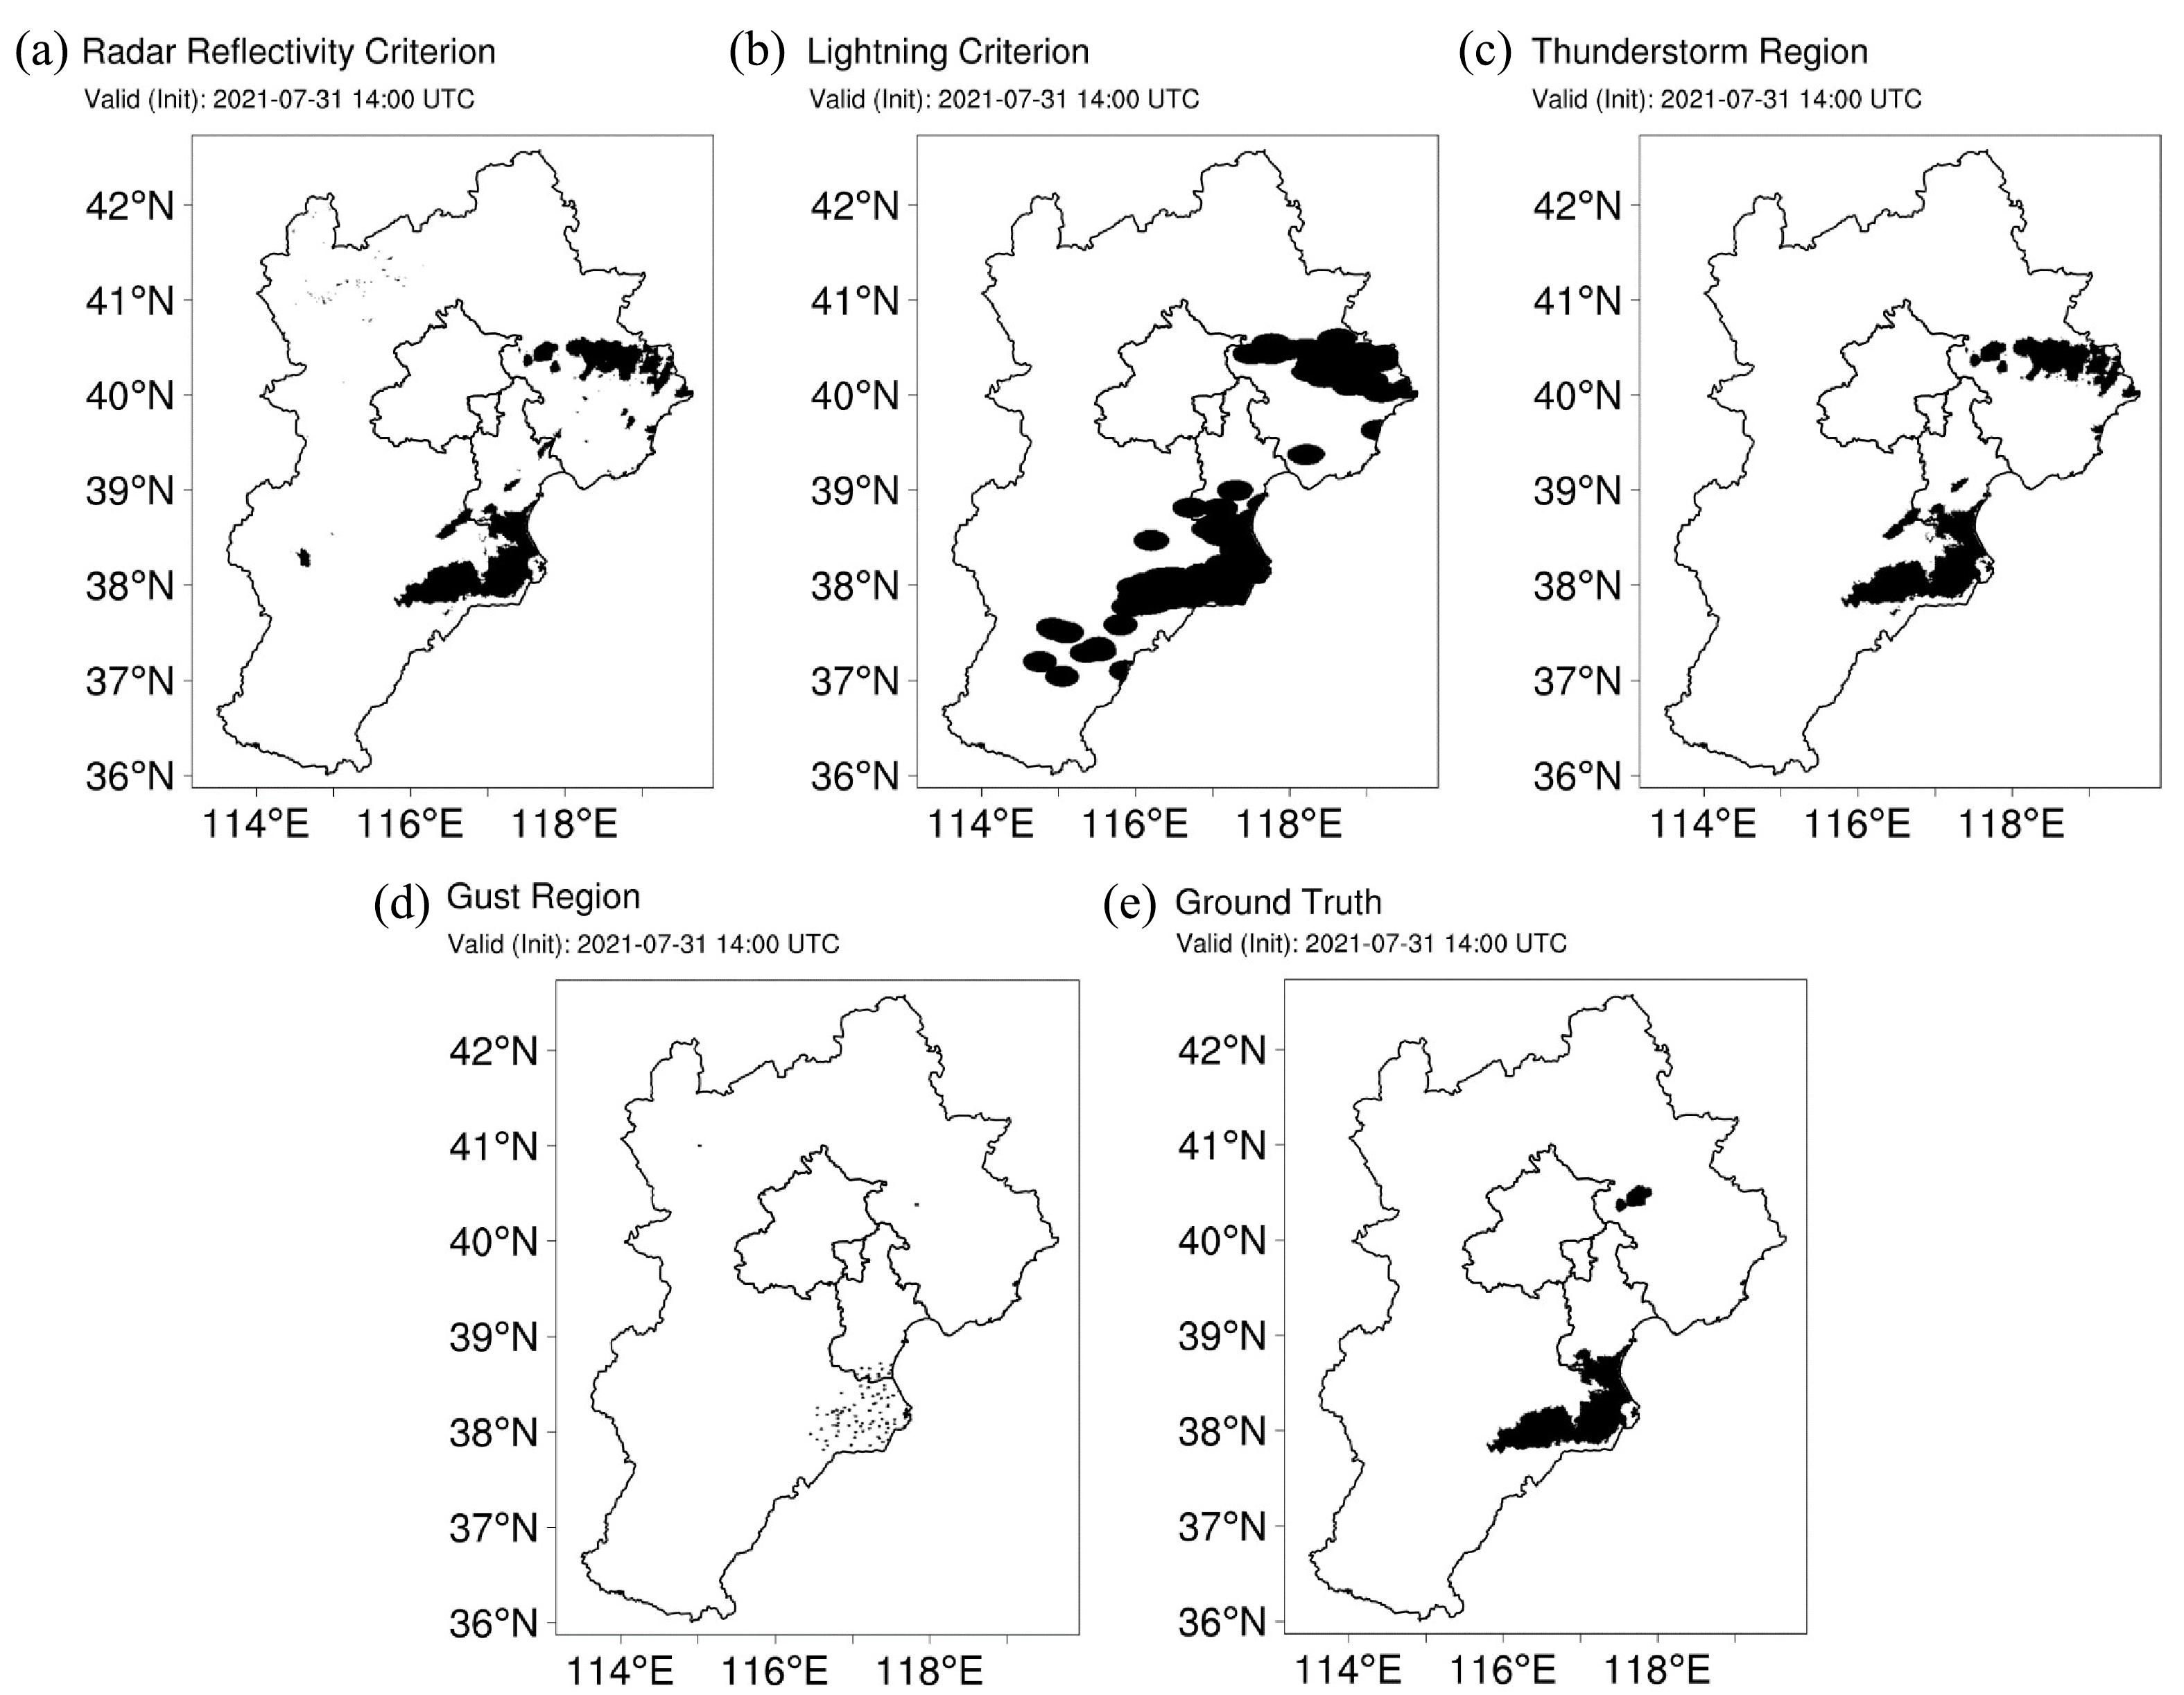
Thunderstorm gusts are extreme strong convective weather events with limited samples (Zhou et al., 2019). Therefore, an under-sampling method is used to solve the problem of possible unbalanced proportions of positive and negative samples. The specific process for diagnosing the ground truth for thunderstorm gusts is illustrated in Fig. 2. In order to generate a suitable ground truth for model training, we construct the ground truth of thunderstorm gusts (i.e., locations where it is believed that thunderstorm gusts occurred) by utilizing radar data, lightning data, and AWS data, as well as specific selection criteria. Generally, when the reflectivity factor in radar data exceeds 35 dBZ, it is believed that strong convective weather has occurred. In order to enrich the sample data, the reflectivity factor threshold is defined as 30 dBZ. That is, only when the radar reflectivity factor corresponding to a grid point is higher than the threshold is that grid point defined as meeting the radar reflectivity criterion (Fig. 3a).

Figure 2. The framework for diagnosing ground-truth thunderstorm gusts.

Figure 3. Five different grid types at 1400 UTC 31 July 2021: (a) grid points meeting the radar reflectivity criterion; (b) grid points meeting the lightning criterion; (c) grid points in the thunderstorm region; (d) grid points in the gust region; (e) ground truth.
Thunderstorms are often accompanied by lightning. Therefore, we focus on the exact location of lightning events. We extract latitude and longitude geographic coordinate information of all lightning events from 10 min before the current moment until now (i.e., if the current moment is 1400 UTC, we pick all lightning events that occurred between 1350 UTC and 1400 UTC). A circular area with a radius of 20 km is made with this coordinate as the center of the circle. All grid points located in this circular region are defined as meeting the lightning criterion (Fig. 3b).
Combining both the radar reflectivity criterion and lightning criterion at the same time, the thunderstorm region is determined. Inspired by the concept of the image connectivity domain in digital image processing, we propose the following approach: if a grid point is identified as meeting both the radar reflectivity criterion and lightning criterion, then all adjacent grid points meeting the radar reflectivity criterion are considered as the thunderstorm region (Fig. 3c).
The selection criteria for gust wind are based on the ground-based meteorological observation specifications compiled and issued by the CMA (Cui, 2011), which classify winds with instantaneous speeds of 17.2 m s−1 or higher (or visually estimated winds of magnitude 8 or higher) as high winds. Therefore, if the gust wind speed from AWS data is greater than or equal to 17.2 m s−1, a circular region with a radius of 2 km is made with the latitude and longitude coordinates of this specific AWS as the center. All grid points located in this circular region are considered as the gust region. (Fig. 3d).
If a grid point is in the thunderstorm region and the gust region, an intersection of the thunderstorm region and the gust region will be taken. If this intersection contains 50 or more grid points, we classify all thunderstorm regions that contain this portion as the ground truth for thunderstorm gusts (Fig. 3e). Taking the moment of 1400 UTC 31 July 2021 as an example, the intuitive meaning of the above five different grid types, explained in detail, can be seen in Fig. 3.
-
This paper selects 34 days on which thunderstorm gusts definitely occurred in North China from 2021 to 2023 during the summer season. The occurrence times of thunderstorm gusts can be found in Table 2. We split the dataset into a training and validation dataset and a testing dataset. The testing dataset consists of data from three days [20210731 (YYYYMMDD): 0800, 0900, 1000, 1100, 1200, 1300, 1400, 1500, 1600, 1700 UTC; 20220612: 1100, 1200, 1300, 1400, 1500, 1600, 1700, 1800, 1900 UTC; 20220818: 1300, 1400, 1500, 1600, 1700, 1800, 1900 UTC] on which thunderstorm gusts definitely occurred. The remaining 31 days constitute the data for training (90%) and validation (10%). We process all the data into the RMAPS-RISE format, which, along with the grid spacing, was detailed in section 2.1. In order to enrich the dataset and take into account the continuity of data splicing, the original 1521 × 1221-sized grid point graph is cropped into multiple 48 × 48-sized subgraphs, and some subgraphs located at the edge of the study are discarded (while they are also at the edge of North China). This is done by constructing a square of size 48 × 48 starting at 35.9°N and 113.2°E (lower left corner of the study area) and moving it in non-recombining order over the study area: (1) The square is moved in non-recombining order from left to right up to the right boundary of the study area; (2) All the squares produced by process (1) are moved in non-recombining order from bottom to top, up to the upper boundary of the study area; (3) Processes (1) and (2) produce a total of 775 squares. Therefore, each original graph is divided into 775 subgraphs by sequential cropping. The specific size of the whole dataset is shown in Table 3, and the process of enriching the dataset can be seen in Fig. 4.
Date (YYYYMMDD) Moments of occurrence (UTC) Number of true grid points 20210613 0500 0600 0700 0800 0900 1000 1100 1200 1300 1500 407 792 20210625 0800 1000 1100 1200 1300 1400 1500 1600 1700 392 061 20210626 0400 1100 1200 1300 1400 1500 1600 2000 93 081 20210629 1000 21 772 20210630 0500 0600 0700 0800 0900 1000 1100 1300 1400 182 532 20210701 0700 0800 0900 1000 1100 1200 1300 1400 590 772 20210702 0900 1000 1100 2100 2300 294 398 20210705 0300 0700 0800 0900 1000 1100 1200 1300 1400 1500 1600 1700 1800 1 210 975 20210707 0600 0700 0800 0900 1000 1100 1200 1300 279 714 20210708 0800 0900 1000 1200 1400 2200 76 834 20210710 1600 1700 1800 1900 2000 288 313 20210711 0400 0500 0600 0700 0800 0900 1000 1100 1200 1300 1400 1500 1600 1700
1800 1900 2000 2100 2200 23003 026 709 20210712 0100 0200 0300 0400 0500 0600 0700 1200 1500 1600 904 921 20210731 0800 0900 1000 1100 1200 1300 1400 1500 1600 1700 553 150 20210805 0500 0600 0700 0800 0900 1000 1100 1200 1300 1400 1500 1600 163 705 20210808 1000 1100 1200 1300 1400 1700 1800 1900 2000 2100 2200 392 908 20210809 0900 1000 1100 1200 1300 44 978 20210816 1100 1200 1300 1400 1500 1600 65 088 20210823 0800 0900 1000 1100 1200 1300 1400 1500 531 181 20210907 0900 1000 1100 1200 1300 1400 78 512 20210912 0800 0900 1000 56 768 20210919 1400 1500 1600 161 755 20220524 0600 0700 0800 0900 1200 1300 1400 104 367 20220604 0900 1000 1100 1200 1300 1400 49 878 20220612 1100 1200 1300 1400 1500 1600 1700 1800 1900 626 609 20220726 0400 0600 13 233 20220804 0500 0600 0700 0800 0900 1000 1100 1200 1300 1400 1600 1700 1800 269 587 20220806 0400 1000 1100 1300 1400 69729 20220818 1300 1400 1500 1600 1700 1800 1900 289 698 20220904 1000 1100 1200 32 567 20230428 0700 0800 0900 1000 1100 1200 1300 1800 1900 2000 318 338 20230628 0000 0100 0200 0300 0400 0500 0600 0700 0800 391 332 20230724 0700 0800 0900 1000 1100 1200 1300 1400 1500 1600 1700 1800 1900 2000 650 974 20230820 0200 0400 0600 0700 0800 0900 1100 1200 1600 1700 1800 276 525 Table 2. Occurrence times of thunderstorm gusts, 2021–23.
Lead time Size of training set Size of validation set Size of testing set 1 h 78300 8700 5394 2 h 77064 8562 4845 3 h 75721 8413 4328 4 h 71862 7984 4058 5 h 68571 7618 3819 6 h 64494 7165 3636 Table 3. Statistics of the training, validation, and testing datasets for six different models in DL (corresponding to 1–6 h forecast timescales).

Figure 4. Process of enriching the datasets: (a) one 48 × 48-sized subgraph (each original graph has 775 subgraphs); (b) the coverage of all subgraphs in each original graph (sequential stitching of 775 subgraphs); (c) the edge of North China (discarded in this study). Color shading represents the terrain height (units: m).
-
Figure 5 is a flowchart of the DL approaches developed in this study. We compare the performances of different models for the next 1–6 h, including DL methods. It should be noted that all the input data used in this study are gridded data, which are very similar to pixel-based images. Therefore, the problem of forecasting thunderstorm gusts is transformed into the problem of image-to-image translation in DL. The original image is split into multiple images of the same size, and these sub-images are input separately into the model. The final output is obtained by combining the predictions of all sub-images. While this process inevitably results in some information loss in the border areas of the sub-images, it is generally acceptable. Four DL models (U-net, CU-net, TransU-net and TG-TransUnet) are employed in this study.

Figure 5. Flowchart of the DL approaches.
In the following subsections, the basic concepts of U-net and transformer are briefly reviewed. Not only is CU-net briefly introduced, but the construction of the TG-TransUnet model is also introduced in detail. In addition, the loss function, as a commonly used approach in imbalanced datasets, is briefly introduced.
-
U-net (Ronneberger et al., 2015) is a DL model based on the CNN method, and was first applied in the field of medical image segmentation. Since then, this model has become popular in various tasks related to image segmentation, and various innovations have emerged on the basis of this research (Du et al., 2020; Siddique et al., 2021). The basic modules of a CNN include convolution, pooling, and activation functions. The convolution process realizes feature extraction by weighting the pixels in a small region of the image to each corresponding pixel in the output image. This process relies on convolution kernels, similar to filters in image processing, but its weights are learned autonomously through the training process. The most important feature of U-net is that the overall model is presented as a “U” structure, which is mainly divided into downsampling, upsampling, and feature splicing. The left side of the whole system is the encoder and the right side is the decoder. The main purpose of downsampling is to reduce the size of the input image and generate a coarser representation of the image, filter redundant information, increase robustness, and extract deeper image features. Upsampling enlarges the image by inserting new elements above the original image size through appropriate algorithms to improve the resolution of the image. Copying and cropping are used to combine image information between different levels in a more appropriate way to fuse multi-scale features of contextual information and location information. Compared with U-net, CU-net uses sub-pixel convolution instead of the traditional bilinear interpolation method in the upsampling part. Shi et al. (2016) showed that “sub-pixel” is better than “interpolation” because interpolation methods will inevitably introduce artificial factors, while reconstruction through sub-pixel convolution is a state-of-the-art approach that can expand the channels and learn mapping relations that work better for upsampling (Han et al., 2021). The CU-net network structure is shown in Fig. 6.

Figure 6. Architecture of CU-net.
-
The transformer concept (Vaswani et al., 2017) discards the traditional CNN and recurrent neural network (RNN), and proposes that the deep neural network (DNN) structure can be completely composed of the attention mechanism (Bahdanau et al., 2014). More precisely, it consists of multi-head self-attention (MHSA) and a feed forward neural network (FFNN). A trainable transformer-based DNN requires a stack of transformer layers to form the encoder and decoder parts of the entire network. MHSA is equivalent to the integration of several different self-attention modules. The original data are input into these different self-attention blocks, and the weighted feature matrix is spliced to obtain the final output through a complete concatenation step. The FFNN connects and normalizes the output of MHSA with the residual, completes the linear transformation, and uses a novel normalization approach (layer normalization—a method that normalizes the output of the middle layer of a neural network) to avoid the over-fitting problem. The transformer structure has lower computational complexity and can better solve the long dependence problem compared with the RNN (Tang et al., 2018).
The advent of the transformer method has injected new vitality into the field of computer vision and remote sensing (Khan et al., 2022; Aleissaee et al., 2023; Amjoud and Amrouch, 2023; Han et al., 2023). Vision Transformer (ViT) (Dosovitskiy et al., 2020) was not the first model to apply transformer structure to vision tasks, but it is popular in the field of computer vision because of its simplicity, effectiveness, and scalability. If there are enough data for the pre-training process, ViT is superior to traditional CNNs, breaking through the limitation of insufficient inductive bias. ViT divides the input image into multiple patches, each of which is mapped into a fixed-length vector and passed to the transformer structure. During this period, special tags need to be added to achieve position encoding to compensate for the possible loss of spatial correlation. This is done by calculating the position encoding value and encoding the position information as a fixed-length vector (position encoding vector). The dimension of the position encoding vector is the same as that of the input word embedding vector, and the two vectors are finally added together. This provides the model with additional information about the individual positions in the input sequence, which helps it to process the sequence data by taking the positional information into account. Subsequently, the visual problem is transformed into a sequence-to-sequence (seq2seq) problem. There are a number of transformer-based models that have been applied in weather forecasting (Pathak et al., 2022; Bi et al., 2023; Chen et al., 2023a, b).
Although the seq2seq transformer structure has shown great promise in some scenarios, there are still some issues that need to be addressed. For example, the use of local feature information is less robust than with traditional CNNs; it requires much more computational power, and consumes more memory resources. However, traditional CNNs have their own limitations, such as the inability to capture long-term dependencies, due to the relatively small size of convolutional kernels. This is also a challenge faced by U-net models. Integrating transformer and U-net models together could potentially leverage the strengths of each approach while mitigating their respective weaknesses, resulting in a more effective and robust model. TransU-net is proposed to realize this idea (Chen et al., 2021a). Its overall structure is still “U” type, but the encoder part of TransU-net has undergone tremendous changes compared with the traditional structure. The strategy of the encoder is to combine the CNN and transformer to construct the encoder, which can enhance its feature extraction ability, resulting in a more robust and effective model. ResNet-50 and ViT form the backbone of the CNN and transformer parts, respectively. The ResNet network (He et al., 2016) performs initial feature extraction and 3-layer convolutional downsampling of the input image. The obtained feature map is then embedded into the image block encoded at a specific position, and the sequence of token embedding is fed into the 12-layer transformer structure. Although transformers excel at obtaining a better global perceptual field, they have some shortcomings in processing detailed features. Therefore, TransU-net replaces only part of the downsampling module with a transformer structure, while still retaining the traditional upsampling mechanism in the decoder, which restores the image pixels through a standard upsampling module and realizes a cascade of downstream information through skip connections with the same resolution.
Since subpixel convolution has great potential in the upsampling part, we attempt to use subpixel convolution in the upsampling part based on the idea of the original network. In addition, a large number of feature channels are input in the network, and the channel attention mechanism (e.g., Hu et al., 2020; Wang et al., 2020; Yang et al., 2020; Hou et al., 2021) may be useful for our research. The channel attention mechanism assigns different weights to each input channel through automatic learning, and can filter out the most important information from a large amount of information, which can better capture the details and differences in the image. This mechanism is often used in image segmentation tasks to improve the accuracy of the results. We try applying a novel attention mechanism for mobile networks, which can embed location information into the channel attention mechanism, also known as “coordinate attention” (CA) (Hou et al., 2021). It adds little computational overhead and performs well in the field of image segmentation (Chen et al., 2021b; Guo et al., 2022a; Wen et al., 2023). Therefore, we use a combination of sub-pixel convolution and a CA module in the upsampling part to enhance the perceptual field and feature representation of the network, which could help to solve the problems of information loss and insufficient resolution in the upsampling process, and improve network generalization. We call it “Thunderstorm Gusts TransU-net” (or TG-TransUnet for short) in order to correspond to the previous network name. The TG-TransUnet network structure is shown in Fig. 7.

Figure 7. Architecture of TG-TransUnet.
-
During the model training process, it is crucial to set appropriate hyperparameters to improve the learning performance and prediction accuracy of the model within a reasonable interval. The loss function is defined as a combination of dice loss (Milletari et al., 2016) and focal loss (Lin et al., 2020), considering that thunderstorm gusts are extreme strong convective weather and the proportion of positive and negative samples is extremely unbalanced. The loss function is defined as follows:
where dice loss is given by
in which
${y_i}$ is the ground truth and$y'_i$ is the forecasting result. Focal loss is an improvement based on the widely used cross-entropy loss function (Wang et al., 2019). Taking binary classification as an example, cross entropy can be defined as follows:For notational convenience, we define
$ {y_t} $ asThe original cross-entropy loss function can be integrated as follows:
According to Lin et al. (2020), accurate target classification can be achieved through special processing of indistinguishable samples. The loss is calculated by computing the similarity between the model predictions and the ground truth, and the appropriate weight is assigned to the category with smaller sample size. The samples with different
$ {y_t} $ are treated differently by adding a weighting factor to the original cross-entropy loss function. After several experiments and comparisons, we choose the most suitable hyperparameters where$\gamma $ is 2 and$\alpha $ is 0.25. The definition of focal loss isIn the loss function,
$ N $ is the number of grid points per batch. The size of$ N $ is 256 × 48 × 48 because the batch size is set to 256 in order to utilize the GPU resources as much as possible. The Adam optimizer (Kingma and Ba, 2014) is used during the training process, and the number of epochs is set to 50, which is determined based on the amount of data and the decline of the loss function. The learning rate is usually set manually. Based on previous experience and the number of batch sizes, this study sets the initial learning rate to 0.01, and adopts a strategy of dynamically updating the learning rate: if the testing set does not decline in two consecutive scoring metrics, the learning rate will decay to half of the original. -
The confusion matrix is introduced as an evaluation metric. In order to evaluate the performance of the prediction, the following metrics are used: the POD, false alarm ratio (FAR), CSI, and equitable threat score (ETS), where the values of POD, FAR and CSI are between 0 and 1, and the value of ETS is between negative 1/3 and 1. When the values of POD, CSI and ETS are closer to 1, and the value of FAR is closer to 0, the prediction effect of the model is better. POD, FAR, CSI and ETS are defined as
where TP indicates the number of actual thunderstorm gust samples that are correctly predicted as thunderstorm gusts, FN refers to the number of actual thunderstorm gust samples that are erroneously predicted as non-thunderstorm gusts, FP represents the number of actual non-thunderstorm gust samples that are mistakenly predicted as thunderstorm gusts, and TN signifies the number of actual non-thunderstorm gust samples that are accurately predicted as non-thunderstorm gusts. The confusion matrix can be seen in Table 4.
Ground truth Thunderstorm gusts Non-thunderstorm gusts Predicted results Thunderstorm gusts TP FP Non-thunderstorm gusts FN TN Table 4. Confusion matrix in this study.
-
The specific classification comparison results can be seen in Table 5. Forecasting thunderstorm gusts poses a slightly greater challenge than forecasting other types of strong convective weather. Therefore, our approach is to prioritize achieving higher values of CSI and ETS.
Lead time Models POD FAR CSI ETS 1 h RISEgust 0.150 0.518 0.129 0.121 U-net 0.420 0.468 0.307 0.266 CU-net 0.580 0.582 0.321 0.267 TransU-net 0.571 0.537 0.344 0.293 TG-TransUnet 0.588 0.512 0.364 0.314 2 h RISEgust 0.115 0.571 0.100 0.092 U-net 0.425 0.691 0.218 0.168 CU-net 0.417 0.664 0.229 0.181 TransU-net 0.557 0.693 0.247 0.192 TG-TransUnet 0.525 0.664 0.258 0.206 3 h RISEgust 0.092 0.523 0.083 0.077 U-net 0.374 0.716 0.193 0.150 CU-net 0.378 0.702 0.200 0.158 TransU-net 0.538 0.738 0.214 0.164 TG-TransUnet 0.421 0.678 0.223 0.181 4 h RISEgust 0.066 0.565 0.061 0.056 U-net 0.226 0.761 0.132 0.103 CU-net 0.354 0.771 0.162 0.125 TransU-net 0.387 0.728 0.190 0.156 TG-TransUnet 0.436 0.692 0.220 0.186 5 h RISEgust 0.054 0.609 0.050 0.045 U-net 0.216 0.884 0.082 0.052 CU-net 0.209 0.868 0.088 0.060 TransU-net 0.269 0.872 0.095 0.064 TG-TransUnet 0.316 0.868 0.103 0.071 6 h RISEgust 0.036 0.683 0.034 0.030 U-net 0.136 0.893 0.064 0.044 CU-net 0.185 0.895 0.072 0.049 TransU-net 0.251 0.897 0.079 0.054 TG-TransUnet 0.180 0.868 0.082 0.062 Table 5. Skill scores of RISEgust and four different DL algorithms in forecasting thunderstorm gusts with a lead time from 1 to 6 h. The bolded entries correspond to the highest CSI and ETS scores among the five methods.
RISEgust, as a traditional method, is used in this study. The experimental results clearly show that the values of CSI and ETS with the RISEgust method are the lowest, and the TransU-net family (including TransU-net and TG-TransUnet) yields significantly better values of CSI and ETS than does the U-net family (including U-net and CU-net). This improvement can be largely attributed to the integration of the transformer and CNN mechanisms in the TransU-net family, which effectively compensates for some of the limitations of solely using the CNN. The transformer has strong modeling capability as it can be considered as a graph-based modeling approach. Its data-driven method enables it to learn the relationships between nodes effectively, making it highly adaptable and versatile. A CNN is a local operation where a convolution layer typically captures the relationship between neighboring pixels. A transformer, on the other hand, is a global operation where a transformer layer can effectively model relationships between all pixels. MHSA can produce more interpretable models, as each attention head has the ability to learn and perform distinct tasks. CU-net yields significantly better results than U-net, demonstrating that the sub-pixel convolution module can effectively enhance the forecasting performance for thunderstorm gusts. The experimental findings of Han et al. (2021) support the superiority of the sub-pixel convolution module over traditional methods like bilinear interpolation in upsampling, as it reduces the impact of human factors.
Since the location of the thunderstorm gusts is the focus of our attention, we introduce a method (CA module) by embedding the location information into the channel attention mechanism. In the forecast results of 1–6 h, the values of CSI and ETS with TG-TransUnet are slightly higher throughout than those with TransU-net. This can mainly be attributed to the fact that feature extraction becomes harder with longer forecasting periods, whereby the attention mechanism and sub-pixel convolution exhibit a positive impact on performance. Despite the increased difficulty of forecasting for the 4–6 h timescale, TG-TransUnet outperforms TransU-net with the assistance of attention mechanisms and sub-pixel convolution. These techniques enable TG-TransUnet to achieve better forecasting results. For example, in the case of a 6–h ahead forecast, TG-TransUnet achieves a CSI of 0.082, surpassing TransU-net’s score of 0.079. Overall, as the forecasting time increases, the values of CSI and ETS gradually decline except for TG-TransUnet’s ETS and HSS at 4–h compared to 3–h, which increase slightly.
-
In this section, separate cases within one specific individual process of thunderstorms gusts, which started at 1300 UTC 12 June 2022 and ended at 1500 UTC 12 June 12 2022, are selected to analyze the forecasting effectiveness of RISEgust, U-net, CU-net, TransU-net, and TG-TransUnet at lead times of 1–3 h.
-
Figure 8 shows the results of the thunderstorm gusts forecast at a lead time of 1 h at 1300 UTC 12 June 2022. In the forecast, RISEgust forecasts the existence of a portion of the ground truth of thunderstorm gusts with wind speed at 10-m height greater than or equal to 17.2 m s−1 (or visually estimated winds of magnitude 8 or higher), but the range is much smaller than the ground truth, and the other four DL models produce better forecast results than RISEgust. In addition, RISEgust forecasts areas with winds of magnitude 8 or higher across the southern part of Tianjin as well as the southern part of Hebei, but according to the radar reflectivity these areas cannot be considered as having experienced thunderstorm gusts. However, this affects the forecast results of the other four DL models: both U-net and CU-net forecast thunderstorm in the south of Tianjin, which is a very obvious empty report. In contrast, TransU-net and TG-TransUnet do not produce such a situation. CU-net, TransU-net and TG-TransUnet all forecast thunderstorm gusts to occur in parts of southern Hebei, which corresponds to the areas forecasted by RISEgust. The forecast ranges of CU-net and TransU-net are significantly smaller than those of U-net and TG-TransUnet in the areas similar to the ground truth of thunderstorm gusts, and the results of the CU-net and TransU-net forecasts are not consistent with a whole connected area.

Figure 8. Thunderstorm gust forecasts at a lead time of 1 h at 1300 UTC 12 June 2022: (a) ground truth of thunderstorm gusts; (b) gust forecast results at 10-m height produced by RISEgust (color shading represents wind speed; units: m s−1); (c) thunderstorm gusts forecast results of the U-net model; (d) thunderstorm gusts forecast results of the CU-net model; (e) thunderstorm gusts forecast results of the TransU-net model; (f) thunderstorm gusts forecast results of the TG-TransUnet model.
Figure 9 shows the results of the thunderstorm gusts forecast at a lead time of 2 h at 1300 UTC 12 June 2022. This time, there is basically no cross over between the RISEgust forecast of winds of magnitude 8 or higher and the ground truth of thunderstorm gusts, but the other four DL models show some forecasting capability. Specifically, their forecast results include not only part of the area in and around the ground truth of thunderstorm gusts, but also part of the area with winds of magnitude 8 or higher as forecasted by RISEgust. Among the four DL models, U-net has a large number of empty reports in the southern, central and eastern parts of Hebei, while TG-TransUnet has the fewest empty reports and avoids the discontinuity of the forecast range, which is significantly better than with the other three models.

Figure 9. As in Fig. 8 but at a lead time of 2 h.
Figure 10 shows the thunderstorm gusts forecast at a lead time of 3 h at 1300 UTC 12 June 2022. In this forecast, RISEgust basically only forecasts the occurrence of winds of magnitude 8 or higher in some areas of southern Hebei, which is completely incommensurate with the ground truth of thunderstorm gusts, while the other four DL models forecast a range larger than that of RISEgust. Among them, the forecast effect of U-net is the worst, and there is basically no cross-correlation with the ground truth of thunderstorm gusts; the forecast results can basically be regarded as all empty reports. The forecasts of the remaining three DL models are hardly comparable, but it is worth noting that TG-TransUnet has relatively fewer empty reports, especially in the Beijing area and at the junction of Beijing, Tianjin, and Hebei.
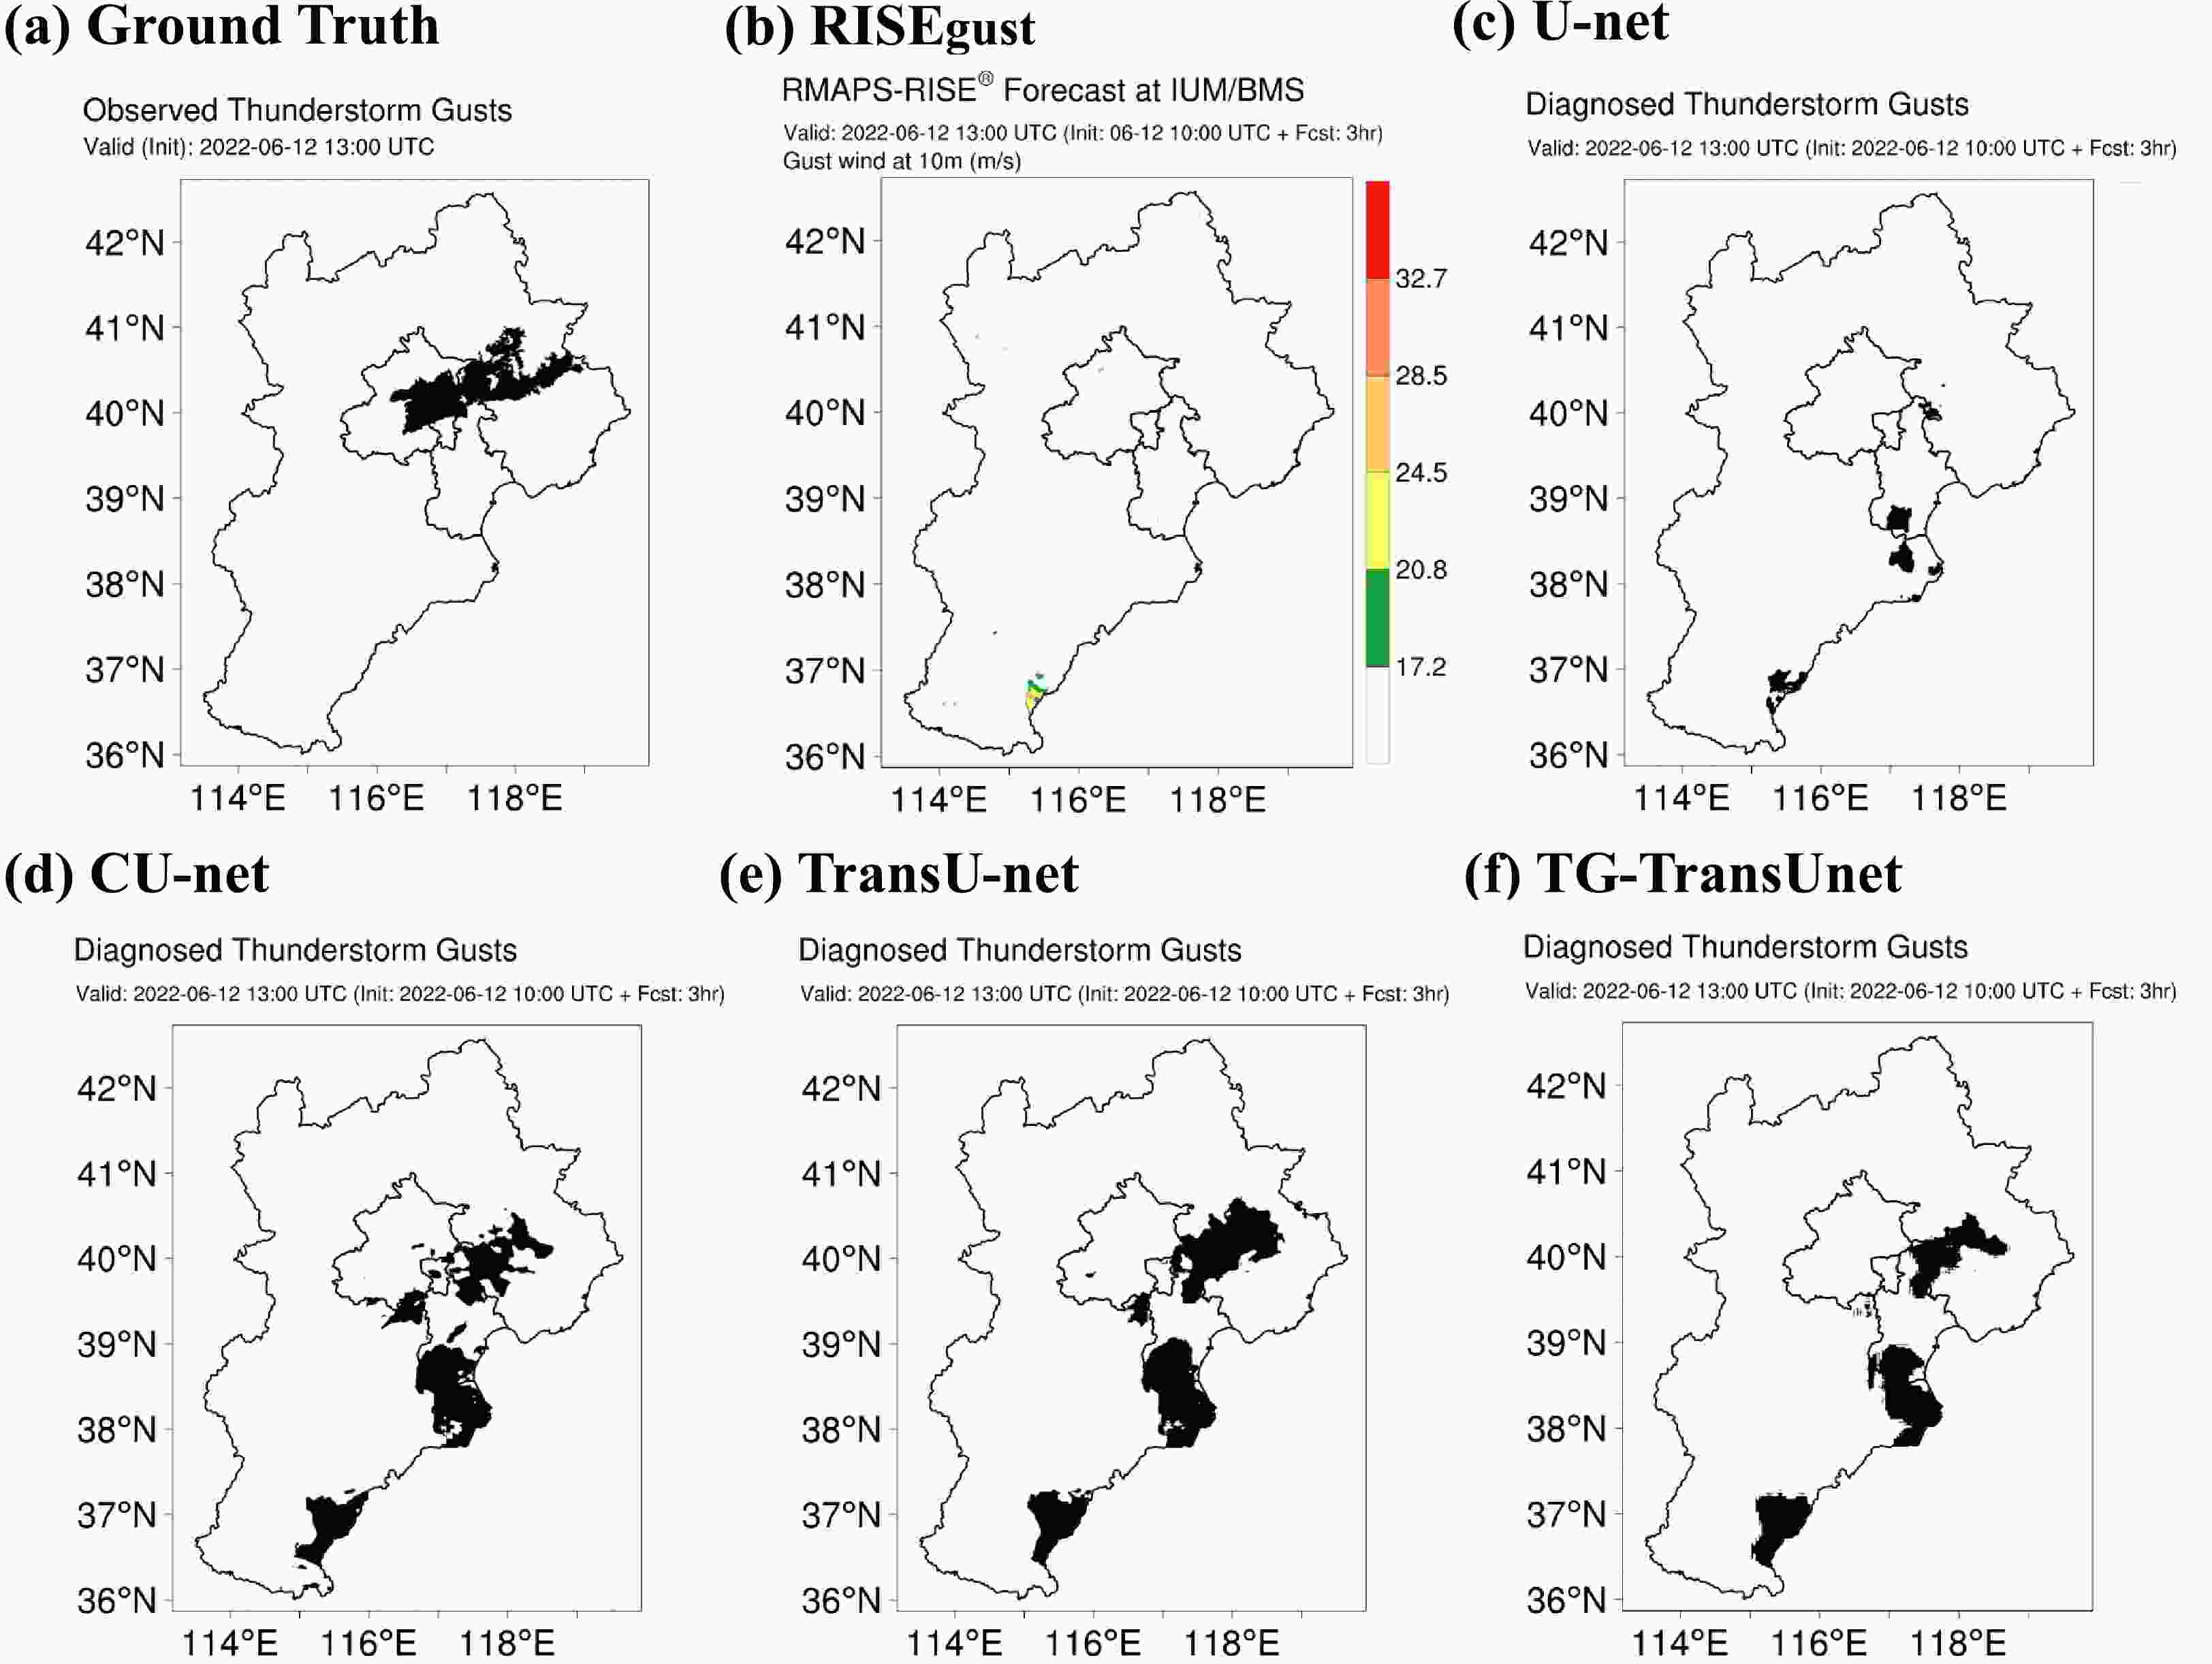
Figure 10. As in Fig. 8 but at a lead time of 3 h.
-
Figure 11 shows the thunderstorm gusts forecast at a lead time of 1 h at 1400 UTC 12 June 2022. In the forecast, RISEgust forecasts the area with winds of magnitude 8 or higher mainly in the southern part of Hebei and the northern part of eastern Beijing, as well as the adjacent Hebei area of Tianjin, which is also the main area of the ground truth of thunderstorm gusts. All four DL models forecast the approximate area of thunderstorm gusts, but with some slight differences. Among them, U-net has a large range of empty reports in the western part of Hebei, while the remaining three DL models all forecast thunderstorm gusts in the southern part of Hebei, which is mainly due to the large wind speeds in this part of the region. The range of the TG-TransUnet accurate forecast is larger than that of CU-net and TransU-net, and the forecast results of TransU-net do not form a continuous through area.

Figure 11. Thunderstorm gusts forecast at a lead time of 1 h at 1400 UTC 12 June 2022: (a) ground truth of thunderstorm gusts; (b) gust forecast results at 10-m height produced by RISEgust (color shading represents wind speed; units: m s−1); (c) thunderstorm gusts forecast results of the U-net model; (d) thunderstorm gusts forecast results of the CU-net model; (e) thunderstorm gusts forecast results of the TransU-net model; (f) thunderstorm gusts forecast results of the TG-TransUnet model.
Figure 12 shows the thunderstorm gusts forecast at a lead time of 2 h at 1400 UTC 12 June 2022. This time, RISEgust only forecasts thunderstorm gusts in some areas, but its forecasts of winds of magnitude 8 or higher in southern Tianjin and southern Hebei affect the forecasts of the other four DL models, with all of them forecasting thunderstorm gusts in southern Hebei, which is contrary to the ground truth. However, it is obvious that TG-TransUnet has significantly fewer nulls than the other DL models, and produces better forecasts.

Figure 12. As in Fig. 11 but at a lead time of 2 h.
Figure 13 shows the thunderstorm gusts forecast at a lead time of 3 h at 1400 UTC 12 June 2022. In this forecast, RISEgust has essentially no forecasting effect. The remaining four DL models also produce worse forecasts than those at a 2-h lead time. TG-TransUnet forecasts better coverage than U-net and has fewer short reports than CU-net and TransU-net.
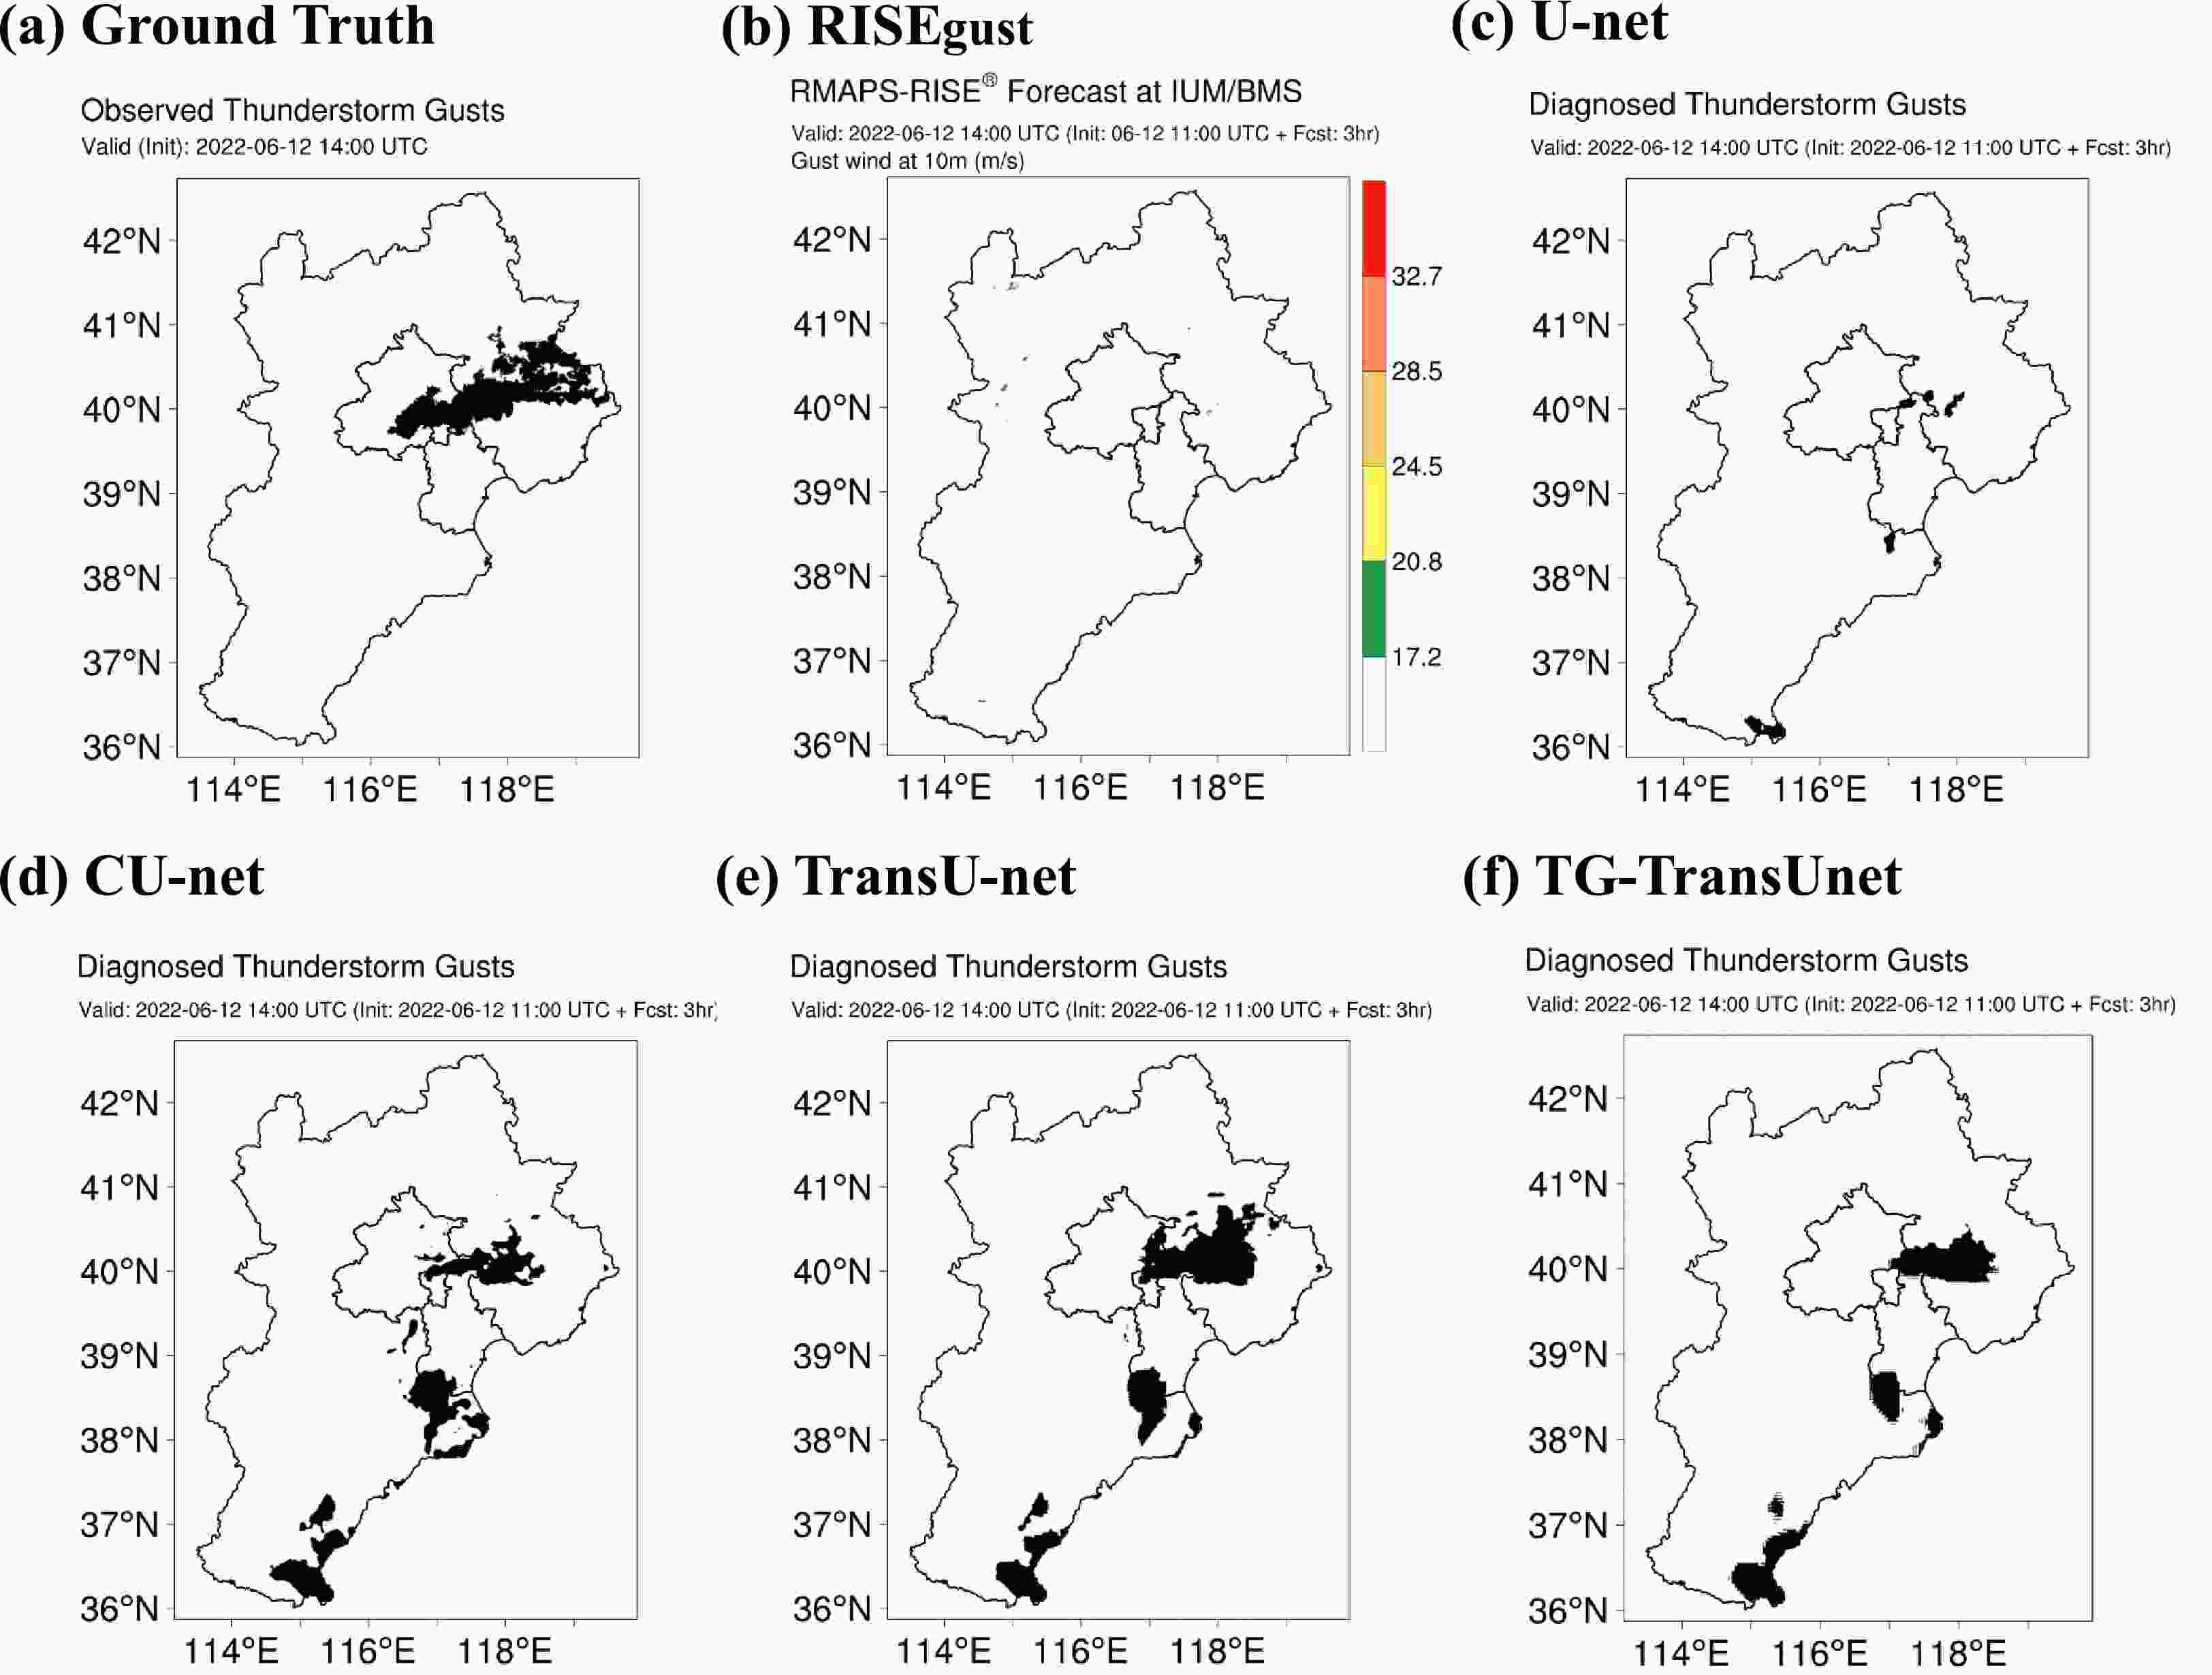
Figure 13. As in Fig. 11 but at a lead time of 3 h.
-
Figure 14 shows the thunderstorm gusts forecast at a lead time of 1 h at 1500 UTC 12 June 2022. In the forecast, RISEgust forecasts winds of magnitude 8 or higher mainly in the north-central and eastern parts of Hebei Province, which has some overlap with the ground truth. The remaining four DL models all forecast the general area of thunderstorm gust occurrence, but U-net has a certain range of shortcomings in the western part of Hebei, and the TransU-net forecast does not form a continuous through-area. Meanwhile, the CU-net and TG-TransUnet forecasts are relatively good, and the range of the TG-TransUnet forecast is slightly larger.

Figure 14. Thunderstorm gusts forecast at a lead time of 1 h at 1500 UTC 12 June 2022: (a) ground truth of thunderstorm gusts; (b) gust forecast results at 10-m height produced by RISEgust (color shading represents wind speed; units: m s−1); (c) thunderstorm gusts forecast results of the U-net model; (d) thunderstorm gusts forecast results of the CU-net model; (e) thunderstorm gusts forecast results of the TransU-net model; (f) thunderstorm gusts forecast results of the TG-TransUnet model.
Figure 15 shows the thunderstorm gusts forecast at a lead time of 2 h at 1500 UTC 12 June 2022. This time, RISEgust forecasts wind gusts of magnitude 8 and above mainly in the northwestern and eastern regions of Hebei, which overlap somewhat with the ground truth. Among the other four DL models, both U-net and TransU-net have large-scale empty reports in the central and southern regions of Hebei, and the forecasts of CU-net and TG-TransUnet are relatively better. Meanwhile, the number of empty reports produced by TG-TransUnet are fewer compared with those of CU-net, and the overall forecasts are slightly better.

Figure 15. As in Fig. 14 but at a lead time of 2 h.
Figure 16 shows the thunderstorm gusts forecast at a lead time of 3 h at 1500 UTC 12 June 2022. In this forecast, RISEgust is essentially ineffective. U-net only forecasts the general area, but this is far from the ground truth. CU-net, TransUnet, and TG-TransUnet all roughly forecast thunderstorm gusts, but all produce empty reports in parts of southern Hebei. On the whole, TG-TransUnet produces a smaller number of empty reports compared to the other DL models.

Figure 16. As in Fig. 13 but at a lead time of 3 h.
-
This paper presents a newly proposed DL approach, named TG-TransUnet, for predicting thunderstorm gusts in North China. The TG-TransUnet model integrates the sub-pixel convolution module and the channel attention mechanism, and transforms the thunderstorm gusts forecast problem into an image-to-image problem based on the DL model. By combining radar, lightning and AWS data, the range of the ground truth of thunderstorm gusts is determined. The analysis and prediction fields of RMAPS-ST and RMAPS-RISE data for three consecutive years are artificially divided into training, validation and testing datasets. Specifically, due to the unavailability of longer time series of input data, maintaining data consistency and continuity becomes challenging. Therefore, we only collect data for three years (2021–23), resulting in a relatively small dataset. In addition, we use the forecast results of RMAPS-RISE (RISEgust) and several DL methods from the “U-net” family as comparison objects. Based on multiple DL methods, the prediction results of different methods are compared and analyzed. The experimental results demonstrate superior performance of TransU-net and TG-TransUnet over U-net and CU-net at all lead times ranging from 1 to 6 h. Specifically, the “TransU-net” family outperforms the “U-net” family in North China, as evidenced by the higher values of CSI and ETS. Notably, TG-TransUnet outperforms TransU-net in terms of the CSI and ETS.
While this study has yielded promising results, the dataset size is still relatively small. To further improve the performance of DL models, it would be beneficial to increase the number of case studies and introduce additional datasets. The original graph is cropped into multiple subgraphs, which will enrich the dataset and enhance its robustness considerably. Future studies should also explore the feasibility of forecasting thunderstorm gusts beyond the lead time of 6 h. Furthermore, the thunderstorm gusts area considered in this study is larger than the real situation, potentially leading to inaccuracies in the forecast results. Therefore, obtaining a more specific ground truth can be a crucial factor in improving the accuracy of future forecasts.
Due to computational constraints, we do not employ an excessively large model. However, as a rule, increasing the model’s complexity usually improves its prediction accuracy. Given sufficient hardware resources, incorporating more complex downsampling methods would enable us to extract deeper features from the data, thereby enhancing our predictions. Additionally, the choice of loss function is crucial in evaluating the model’s effectiveness. If we can develop a specific loss function tailored for predicting thunderstorm gusts in North China based on our existing results, it will further enhance the model’s performance.
Acknowledgements. This work was supported in part by the Beijing Natural Science Foundation (Grant No. 8222051), the National Key R&D Program of China (Grant No. 2022YFC3004103), the National Natural Foundation of China (Grant Nos. 42275003 and 42275012), the China Meteorological Administration Key Innovation Team (Grant Nos. CMA2022ZD04 and CMA2022ZD07), and the Beijing Science and Technology Program (Grant No. Z221100005222012). We are very grateful for the support of the Beijing Meteorological Service Data Center for the GPU computing resources.
| Product | Parameter (s) | Specific meaning | Unit |
| AWS DATA | WSX | Extreme wind speed in 1 h | m s−1 |
| LIGHTNING DATA | LOCATION | Two-dimensional spatial information | ° |
| TIME | Time of occurrence | UTC | |
| RMAPS-RISE | UVana | 10-m height analysis of current gusts | m s−1 |
| UVpred_RISE | 10-m height prediction of future gusts | m s−1 | |
| RRpred | 1-h cumulative precipitation forecast | mm | |
| TQdiff | Difference between current and predicted 2-m surface temperature | °C | |
| RADAR DATA | RADAR | Composite radar reflectivity factor | dBZ |
| RMAPS-ST | PRES | Pressure | Pa |
| TMPdiff | Temperature difference between 850 hPa and 500 hPa | K | |
| CAPE | Convective available potential energy | J kg−1 | |
| RADARST | Composite radar reflectivity | dBZ | |
| UVpred_ST | Average wind speed at 80-m height | m s−1 | |
| SHEAR1 | 0–1 km vertical wind shear | m s−1 | |
| SHEAR2 | 0–6 km vertical wind shear | m s−1 |


 AAS Website
 AAS WeChat