


 DownLoad:


-
The South China Sea (SCS) summer monsoon (SCSSM) onset has been regarded as the beginning of the East Asian summer monsoon (Lau and Yang, 1997; Wang et al., 2004; Martin et al., 2019). Due to the inter-related significant socioeconomic impacts of the SCSSM (He and Zhu, 2015; Xue et al., 2015; Yan et al., 2021), a large number of studies have been devoted to investigating its variability (Xie et al., 1998; Wu and Wang, 2000; Wu, 2010; Luo et al., 2016) and onset prediction (Kajikawa and Wang, 2012; Lee et al., 2015; Martin et al., 2019).
The SCSSM onset generally occurs in mid-May (Mao et al., 2004; Wang et al., 2004; Shao et al., 2015). The processes of the SCSSM onset are complicated along with their multidimensional and multivariate changes. The crucial physical processes for the SCSSM onset include an eastward extension of the South Asian high in the upper troposphere (Liu and Zhu, 2016), the eastward withdrawal of the western North Pacific subtropical high in the mid-lower troposphere (He et al., 2017), and the generation of convection and cross-equatorial flow over the SCS (Gao et al., 2013; Lin et al., 2017), the latter of which is considered an expansion of circulation and deep convection from the tropics.
Many studies have tried constructing proper indices and criteria to define the SCSSM onset. According to the selection of variables, the indices for the SCSSM onset can be roughly classified into three types. One is solely defined by circulation factors, such as the 850-hPa zonal wind (Wang et al., 2004; Kajikawa and Wang, 2012) and the area-averaged upper-tropospheric (200 to 500-hPa) meridional temperature gradient (Mao et al., 2004; Liu and Zhu, 2020). While the other is defined by convection factors, such as outgoing longwave radiation (OLR) and precipitation (Qian and Yang, 2000). Still, another is defined by the combination of both circulation and convection (Shao et al., 2015). Since the upper and lower circulations, as well as the convection, are usually well coupled during the SCSSM onset processes (Mao et al., 2004; Wang et al., 2004; Shao et al., 2015), the onset dates by these indices are generally consistent with one another. However, sometimes they are very inconsistent, which makes it difficult to judge the onset time of the SCSSM (He et al., 2017; Zhu and Li, 2017).
The indices for the SCSSM onset definitions include the upper-tropospheric (200 to 500-hPa) meridional temperature gradient (Mao et al., 2004; Liu and Zhu, 2020), the 850-hPa zonal wind (Wang et al., 2004; Kajikawa and Wang, 2012) and convection factors (Shao et al., 2015). Therefore, any inconsistencies among these definitions can result from the vertical profile of circulation differences and the inconsistent establishment between the circulation and the convection. The SCSSM onset can be influenced by seasonal (Yuan et al., 2008; Zhang et al., 2019; Feng et al., 2021), sub-seasonal (Wen et al., 2004; Kikuchi and Wang, 2009; Guan et al., 2019; Li et al., 2020b), and synoptic processes (Mao and Wu, 2008; Yuan and Chen, 2013; Hu et al., 2020; Liu and Zhu, 2020), because these factors would regulate circulation and convection at different time scales. El Niño-Southern Oscillation (ENSO) has been cited as the most important seasonal predictor for the SCSSM onset (Martin et al., 2019). Generally, a warm (cold) ENSO event in winter tends to be followed by a delayed (an advanced) SCSSM onset (Zhou and Chan, 2007). However, in recent decades, this relationship between ENSO and the SCSSM onset has been disturbed (Liu and Zhu, 2019; Jiang and Zhu, 2021; Hu et al., 2022a), and increasing impacts from sub-seasonal and synoptic processes (Zhou and Chan, 2005; Huangfu et al., 2018; Wang et al., 2018) are frequently reported. The coexistence of influencing factors at different time scales not only interferes with the judgment of the SCSSM onset date (Jiang and Zhu, 2021; Hu et al., 2022a) but also strongly limits our forecasting capability for the SCSSM onset (Liu and Zhu, 2021).
The SCSSM onset in 2021 is a typical case with some unique features. Following the La Niña event in the previous winter (2020/2021), an early SCSSM onset was expected (Zhou and Chan, 2007; Martin et al., 2019). However, according to different definitions, the 2021 SCSSM onset dates varied from normal to late (Fig. 1) and featured significant circulation-convection inconsistency (Fig. 1a). The above characteristics indicate that the SCSSM onset processes in 2021 may be influenced by multi-scale processes, contributing the uncertainties to the predictions. To better understand the SCSSM onset, this study attempts to resolve the following two questions. 1) Which factors or processes accounted for the circulation-convection inconsistency of the late SCSSM onset in 2021; 2) How do such phenomena affect a numerical model’s forecast skill regarding the SCSSM onset?

Figure 1. (a) Daily-mean time series of the 850-hPa zonal winds (USCS; blue line; averaged between 5°–15°N and 110°–120°E) and outgoing longwave radiation (OLR; red line; averaged between 10°–20°N and 110°–120°E). (b) Time series of the 200–500 hPa mean air temperature over the Northern SCS (15°–25°N, 100°–130°E; blue line), the Southern SCS (5°–15°N, 100°–130°E; red line) and their difference (stands for the MTG of SCS; black line). Onset dates determined by USCS alone (20 May) and by combining USCS and OLRSCS (1 June) are shown in (a), while those determined by the MTG criteria (20 May) are shown in (b).
In an attempt to answer the above questions, the remainder of this paper is organized as follows. Section 2 describes the data and methods, section 3 outlines the definition of the SCSSM onset, section 4 investigates the SCSSM onset processes, section 5 outlines the forecast skill of the European Center for Medium-Range Weather Forecasts (ECMWF) Subseasonal-to-Seasonal (S2S) forecasting system, and section 6 provides a brief discussion and concludes.
-
The atmospheric variables were obtained from the National Centers for Environmental Prediction-National Center for Atmospheric Research (NCEP-NCAR) reanalysis products (Kalnay et al., 1996). The daily outgoing longwave radiation (OLR) dataset was provided by the National Oceanic and Atmospheric Administration (NOAA) (Liebmann and Smith, 1996). The monthly and daily sea surface temperature (SST) were extracted from the NOAA High-resolution Blended Analysis (Reynolds et al., 2007). The RMM index data was obtained from the Australian Bureau of Meteorology (Wheeler and Hendon, 2004), and the typhoon tracks were obtained from the Reginal and Mesoscale Meteorology Branch (RAMMB) of NOAA (
http://rammb-data.cira.colostate.edu/tc_realtime/storm.asp?storm_identifier=wp042021 ).The present study investigated the predictability of the onset of the SCSSM in 2021 using the real-time S2S prediction released by the ECMWF. This product is based on 51 members and runs twice a week up to day 46. Outgoing longwave radiation (OLR) was estimated by the accumulated top net thermal radiation (TTR) (Text S1 and Fig. S1 in the Electronic Supplementary Material, ESM).
The anomalies in 2021 were obtained by subtracting the 1981–2010 climatological values from the original variables.
-
As mentioned above, various indices and associated criteria are proposed to define the SCSSM onset dates. In the present study, the definitions by Kajikawa and Wang (2012), Shao et al. (2015), and Mao et al. (2004) are used with the corresponding indices and criteria. These definitions have already been analyzed comprehensively and widely used. Details about the definitions can be found in the supporting information and the corresponding references (Text S2).
In the lower troposphere, the SCSSM onset is usually characterized by an apparent turning of the seasonal circulation accompanied by bursts of deep moist convection (Xie et al., 1998; Wang et al., 2004; Shao et al., 2015). Accordingly, Kajikawa and Wang (2012) used the USCS (the 850-hPa zonal wind averaged over 110°–120°E, 5°–15°N) to define the SCSSM onset time, and they were focused on the steady establishment of the low-level westerlies. Further, Shao et al. (2015) combined the USCS and the OLRSCS (averaged over 110°–120°E, 10°–20°N) to define the SCSSM onset. It means that besides the presence of steady westerlies, the establishment of the SCSSM also necessitates persistent active convection. Aside from these lower-tropospheric variables, Mao et al. (2004) proposed that the area-averaged upper tropospheric (200–500 hPa) meridional temperature gradient (MTG) is appropriate to serve as an index to measure the SCSSM onset. The onset of the SCSSM is accompanied by the “warm-in-north” and “cold-in-south” tropospheric temperature pattern surrounding the SCS, presenting the winter-to-summer (negative-to-positive) seasonal transition of the MTG.
In 2021, the USCS index turned to easterly during April 25−26 and persisted (Fig. 1a) until the westerlies steadily established themselves on 20 May (Fig. 1a), which meets the criteria of Kajikawa and Wang (2012). According to the USCS, the SCSSM onset seemed normal (20 May). However, when the convective criteria were also considered (Shao et al., 2015), the onset time occurred much later (June 1) (Fig. 1a). For the convenience of description, the 2021 SCSSM onset processes can be roughly divided into three periods according to the variations of the indices (Fig. 1). The period spanning 21 April–15 May (P1) is the pre-onset stage featured by persistent easterlies and suppressed convection. The second stage (P2: 16 May–29 May) is characterized by the transition to westerlies and a positive MTG but with suppressed convection. Both the circulation and convection for the SCSSM onset were finally established after 29 May (P3). Particular to the specific time points, P2 began when the MJO propagated eastward from the Indian Ocean, whereas P3 began with the formation of TC “Choi-wan” (2021).
During P1, with the demise of the typhoon “Surigae” (2021) east of the Philippines (Fig. S2 in the ESM), the USCS turned to easterly along with persistently suppressed convection. Obvious fluctuations in both USCS and OLRSCS were found in P2. The USCS turned westerly with weak active convection around 20 May, before the weak convection was suppressed again until 1 June in P3. In contrast, the westerlies (positive USCS) had been persistent since 20 May in P2 with only a two-day disruption. Compared to the onset date defined by Kajikawa and Wang (2012) using the USCS, the SCSSM onset date based on the convection criteria defined by Shao et al. (2015) occurred 12 days later. The evolution of the MTG (Fig. 1b) shows that it turned to a positive phase abruptly on May 20 and persisted afterward along with significant warming in the north part (thick blue line in Fig. 1b), signifying a complete switch over of the circulation from the winter to the summer pattern in the upper levels.
It is obvious that the USCS and MTG indices are in good agreement with the transition on 20 May. However, a simultaneous transition of USCS at 850-hPa was still accompanied by suppressed convection. It is speculated that the establishment of the low-level westerlies on May 20 without the generation of moist convection and obvious cross-equatorial flow over the SCS did not correspond to a comprehensive onset of the SCSSM. This lies in contrast to both the seasonal transition of the MTG in the upper troposphere and the results of Wang et al. (2004).
-
To ascertain the 2021 SCSSM onset processes, the evolution of the circulation fields for the three periods (P1, P2, and P3 marked in Fig. 1) were analyzed, respectively. In the previous winter, the tropical Pacific sea surface temperature (SST) anomalies exhibited a La Niña state (Fig. 2c). Similar to the composite of La Niña events followed by notable early SCSSM onsets (1999, 2000, 2001, 2008, and 2009), which were named as “typical La Niña events” (Jiang and Zhu, 2021), the related vertical circulation was located to the east of 140°E (Figs. 2a, e). Though weak upward motion was located over the SCS, it seemed independent of the Pacific Walker circulation as part of the vertical circulation over the Indian Ocean (Fig. 2a). However, compared to these typical La Niña events (Fig. 2g), the cooling SST anomalies around the dateline were accompanied with stronger surface meridional wind divergence in 2021 (Fig. 2c). Such a La Niña pattern resembled the cold tongue (CT) La Niña events to some extent (Jiang and Zhu, 2021), especially in terms of the surface meridional wind divergence.
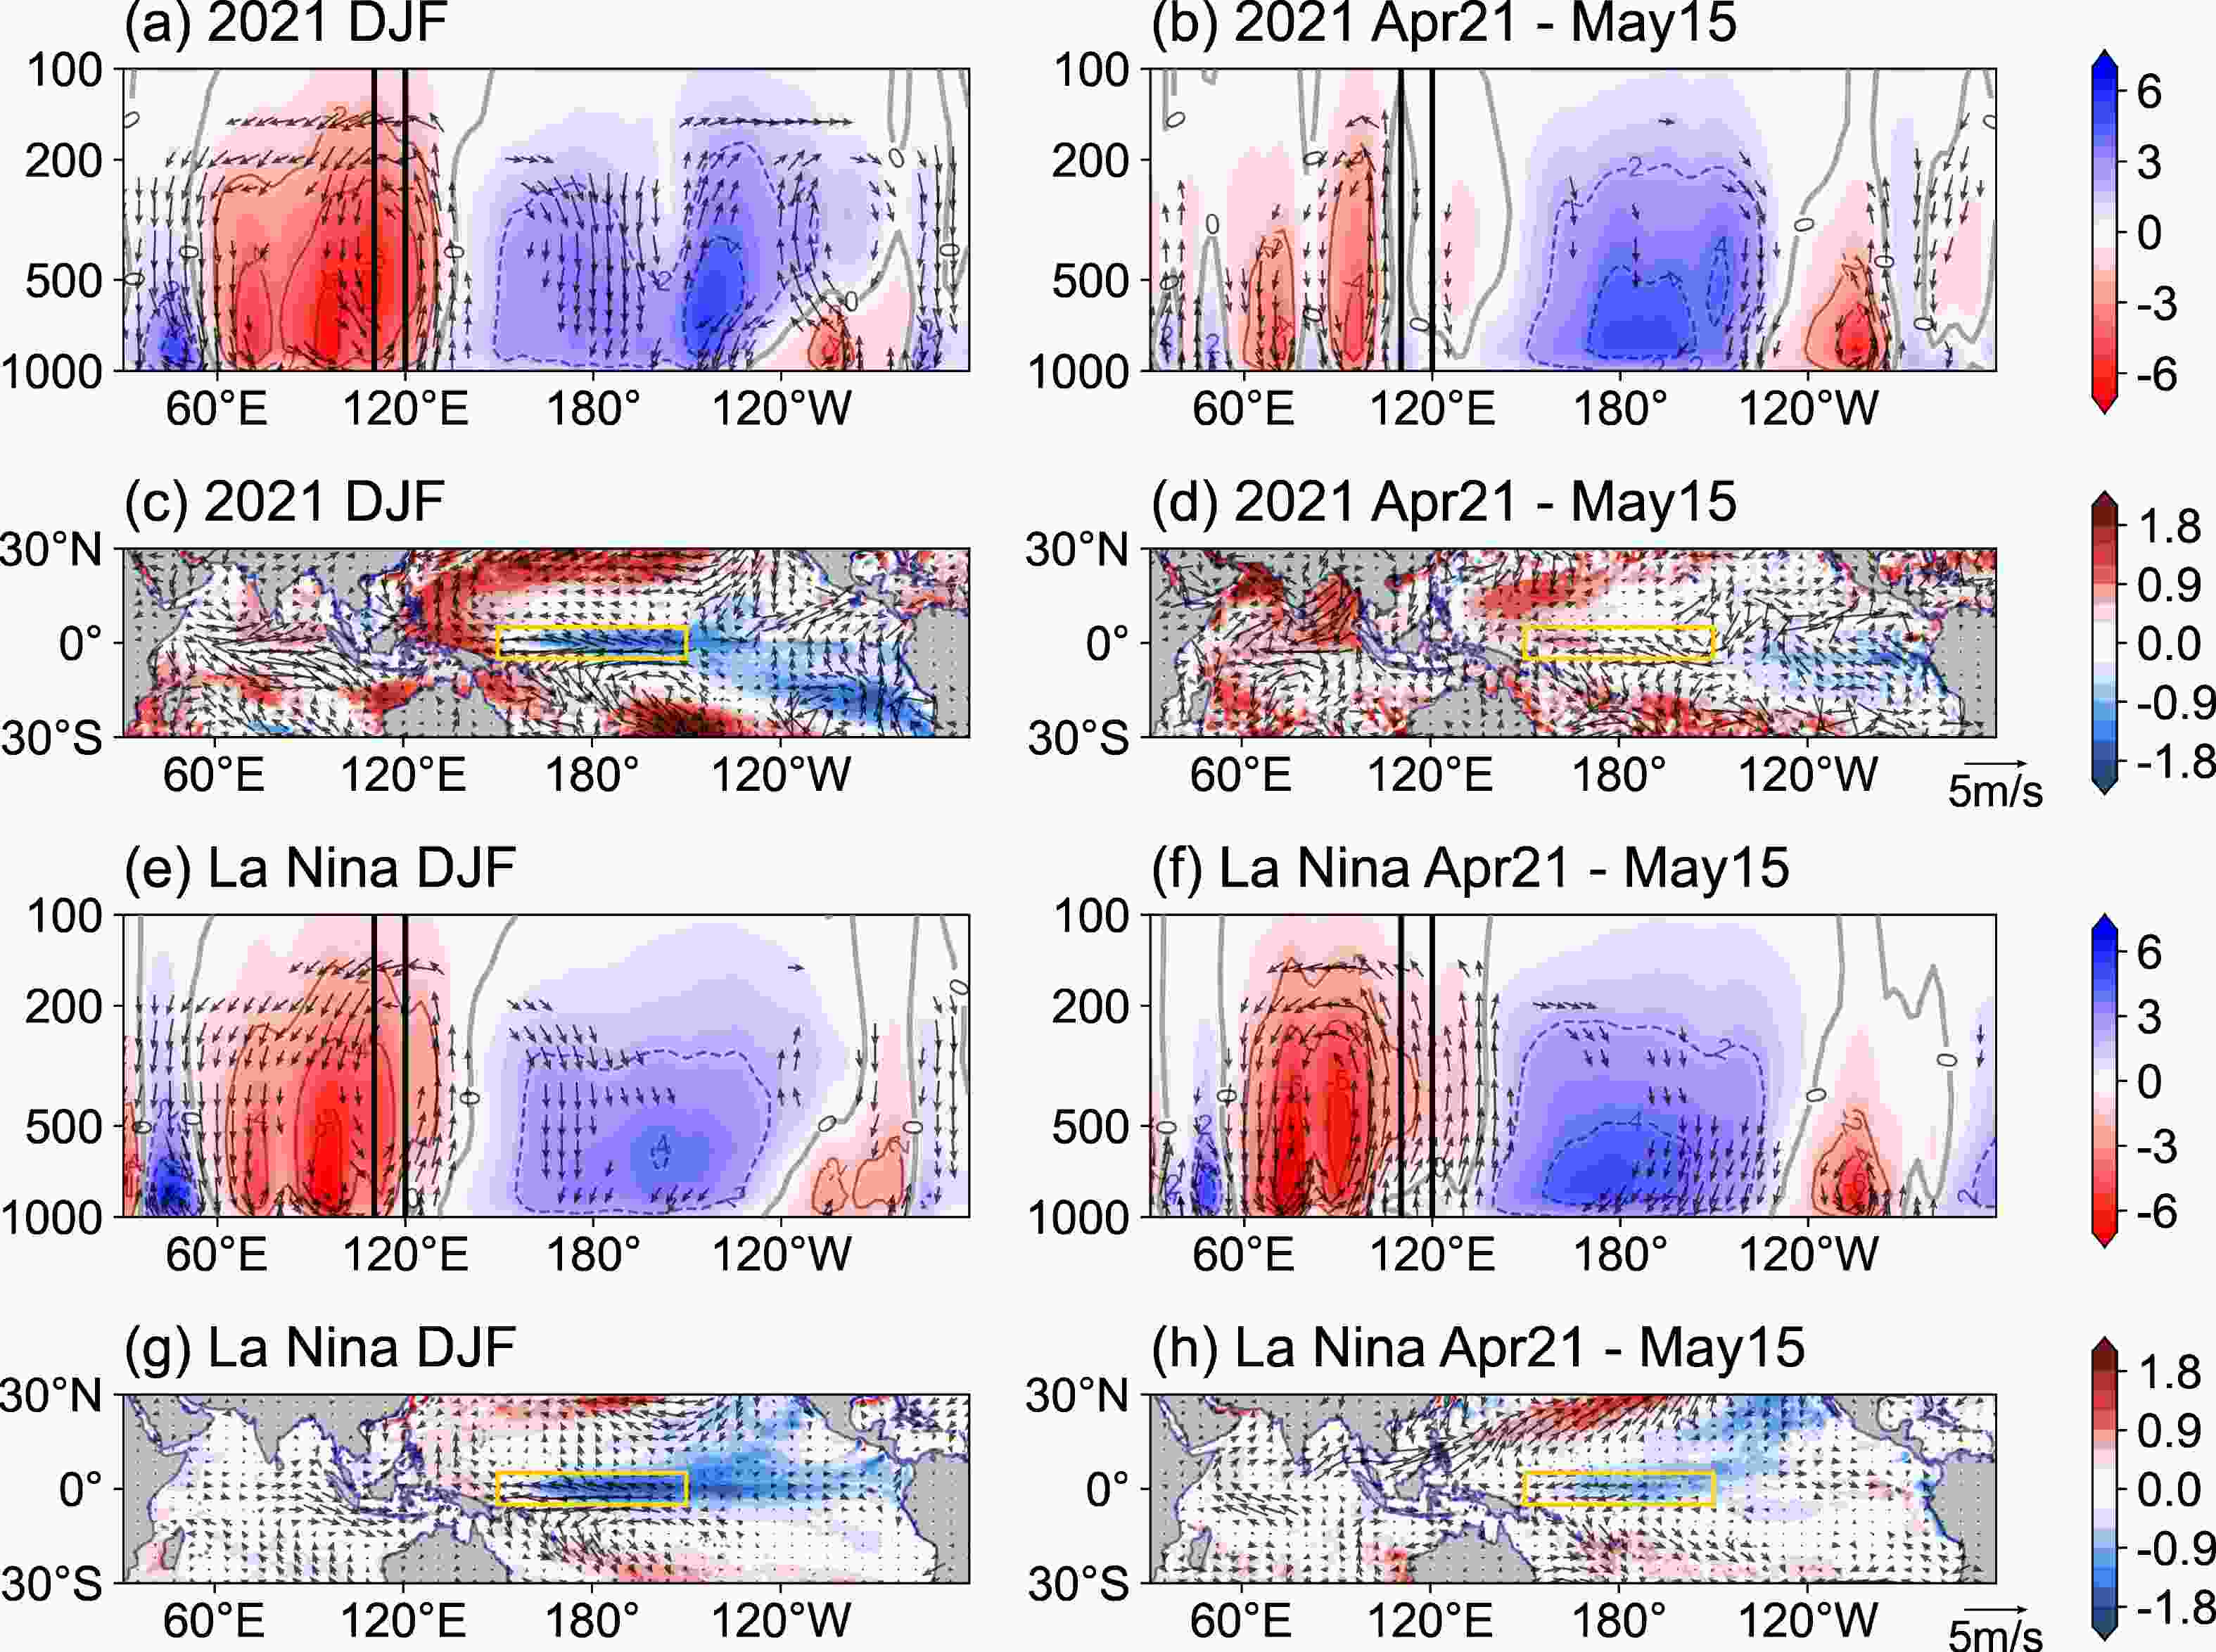
Figure 2. The condition of (a–d) 2021 and (e–h) the composite of an early SCSSM onset following selected La Niña events (1999, 2000, 2001, 2008, and 2009) during the previous winter (DJF) and from April 21 to May 15. Panels (a-b) and (e-f) are the zonal cross sections within 10°–20°N for the pressure velocity (omega
$ \times $ –100; units: Pa s–1; speed greater than 2 m s–1 are indicated in vectors), and the zonal mass stream function (shading and contours; red: clockwise circulation; blue: counterclockwise circulation). The SCS region (110°–120°E) is marked by black lines. Panels (c-d) and (g-h) are the spatial distribution of anomalous SST (shading) and 10-m winds (vectors). The orange rectangles denote the key region (5°S–5°N, 150°E–150°W) of surface meridional wind divergence.Our previous work has pointed out that the frequent CT La Niña can induce subtropical Pacific warming via the wind-evaporation-sea surface temperature feedback (WES) in late spring, and the warming SST anomalies surrounding the SCS can delay the SCSSM onset (Jiang and Zhu, 2021). In particular, the impacts of a warming northern Indian Ocean are suggested to suppress the convection over the SCS (Ai et al., 2022). Compared to the composite of typical La Niña events (Figs. 2g, h), the La Niña state in 2021 decayed quickly (Figs. 2c, d), and an anomalous anticyclone with sinking movement was located over the SCS in late spring (Fig. 2d), which seemed to be induced by the convention over the Bay of Bengal (Fig. 2b). There was no widespread rising motion over the SCS like the composite of typical La Niña events (Fig. 2f), which means that the SCSSM in 2021 would be delayed. In addition, on the seasonal scale, such an air-sea state was very similar to that of 2018, when the SCSSM onset time was late. From the perspective of the convection criteria, such a seasonal prediction result seemed to be correct in that the SCSSM onset was late in 2021; however, the early establishment of the circulations and the circulation-convection inconsistency for the SCSSM onset were not anticipated.
During period P2, the USCS rapidly turned to westerly around May 20 and then weakened on May 24, accompanied by a similar fluctuation of the MTG (Fig. 1). It is speculated that although weakened westerlies can still favor continuous moisture transport into the SCS, the lack of other necessary conditions may have suppressed the convection after May 20. In the meantime, an MJO event developed in the western Indian Ocean and propagated eastward, and decayed in Maritime Continent towards the end of May (Fig. 3a). Along with the MJO transit, two TCs moved northward and landed on the west coast of India [TC “Tauktae” (2021)] and the Bay of Bengal [TC “Yaas” (2021)], respectively (Figs. 3d–g).
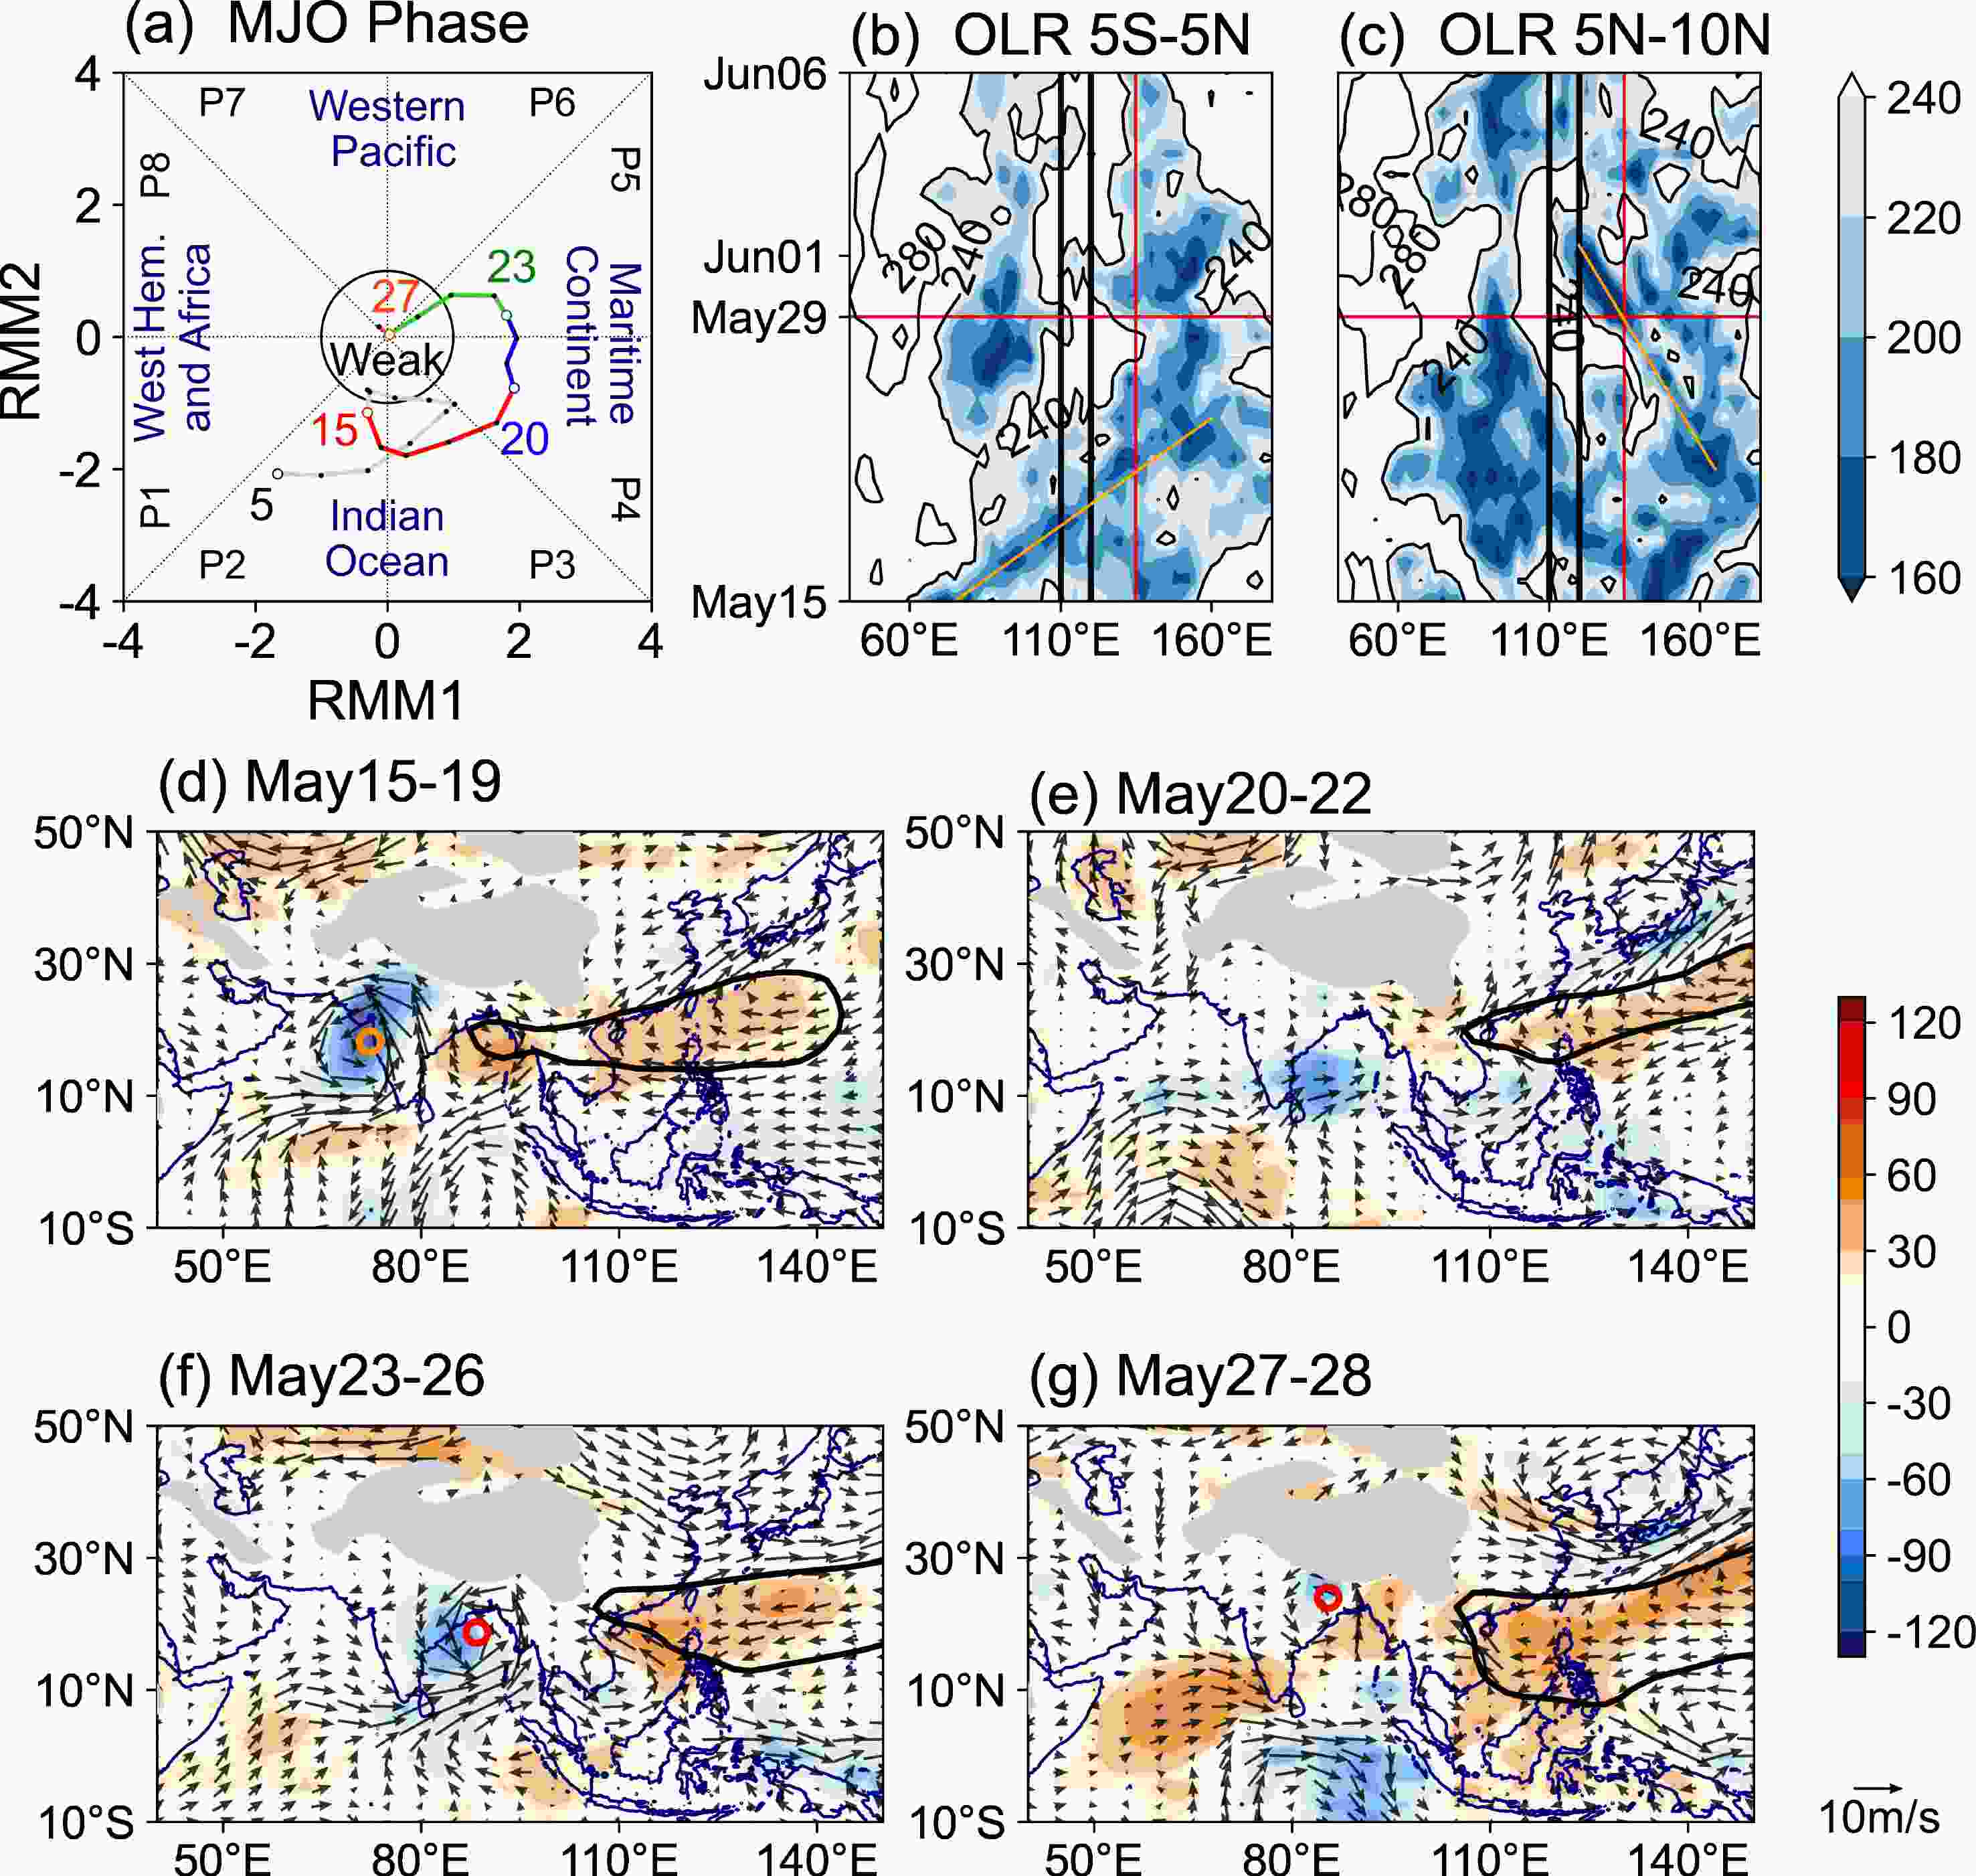
Figure 3. (a) The MJO phase propagation from May 5 to 28. The gray line represents the partial phase of another MJO that existed before May 15, while the red, blue, and green lines correspond to the MJO phase of periods in (d), (e), and (f), respectively. (b, c) Time-longitude cross sections of daily OLR (W m–2) averaged between 5°S–5°N and between 5°–10°N (the values less than 240 W m–2 are shown in the color bar else in contours), the SCS is marked by black lines and the crossing point of red lines indicates the time and location of the TC “Choi-wan” (2021). The convection propagation is illustrated by thin solid orange lines in (b, c). (d–g) Spatial distributions for the OLR anomalies (shading; W m–2) and 850-hPa winds anomalies (vectors; m s–1), solid black lines represent the location of WPSH (5890-gpm geopotential height), and grey shading denotes the 1500-m topography. The orange dot in (d) represents TC “Tauktae” (2021), and the red one in (f) and (g) represents TC “Yaas” (2021).
When the MJO event propagated into the west of the Maritime Continent during 20–22 May, TC “Yaas” (2021) began to form over the Bay of Bengal (Fig. 3e). At this time, weak westerly winds and moist convection were located to the south of the SCS (Fig. 1a). As a barrier for the MJO propagation (Li et al., 2020a), the Maritime Continent would weaken the MJO event rapidly, causing the weakening and interruption of low-level westerlies over the SCS. Meanwhile, TC “Yaas” (2021) made landfall over the Bay of Bengal along with an abrupt increase in the MTG (Figs. 3f, g). Similar to TC “Fani” in 2019, the anomalous condensational heating released by this TC also heated the northern part of the SCS in the upper levels through advection (Fig. S3 in the ESM), which accelerated the MTG seasonal transition as well as the SCSSM onset (Liu and Zhu, 2020).
On the other hand, ahead of the MJO convection, a TC with active convection formed to the east of the Maritime Continent (Figs. 3b, c). With the MJO decaying, the low-level atmosphere over the SCS was controlled again by the edge of the western Pacific subtropical high (WPSH) during the end of May (Figs. 3g and 4a). While a weak tropical disturbance over the eastern Maritime Continent gradually developed and became a TC named “Choi-wan” (2021). After the dissipation of the MJO, TC “Choi-wan” (2021) moved northward. Its track was to the east of the SCS along the edge of the WPSH (Fig. 4). Before “Choi-wan” (2021) entered the SCS during 29–31 May, the Somali cross-equatorial flows and the equatorial Indian Ocean westerlies had already tended to converge toward the SCS on account of the strong convergence of the TC, but the convection over the SCS was still suppressed by Choi-wan (2021) (Fig. 4a). That can explain the persistence of the westerlies and the inconsistent transitions for the zonal wind in the low-levels and the convection. When TC “Choi-wan” (2021) peaked at the eastern edge of the SCS, the WPSH retreated eastward (Fig. 4b). Meanwhile, significant convection and westerlies were established over the SCS, indicating the comprehensive onset of the SCSSM (Fig. 4c). Such processes were similar to the SCSSM onset triggered by TC “Chanchu” in 2006 (Mao and Wu, 2008).

Figure 4. The evolution of low-level circulation (850-hPa winds; vectors; units: m s–1) and convection (convective precipitation; shading; units: mm) during P3. The thick black line marked the situation of the WPSH is the 5890-gpm geopotential height, and grey shading denotes the 1500-m topography. The red dots and the yellow dotted curves represent TC “Choi-wan” (2021) and its track, respectively. The blue rectangles denote the SCS region (10°–20°N, 110°–120°E).
In summary, following a CT La Niña-like state in the previous winter, the upward movement over the SCS was suppressed by the enhanced convection over the Indian Ocean and the subtropical Pacific during P1. Afterward, along with the eastward propagation of the MJO, a TC named “Yaas” (2021) made landfall over the Bay of Bengal during P2, which heated the north part of the SCS in the upper levels and induced the MTG seasonal transition. The other TC, “Choi-wan” (2021), formed with the dissipation of the MJO. At first, it suppressed the convection over the SCS but assisted with the persistence of low-level westerlies. Upon its northward movement, TC “Choi-wan” (2021) acted as an immediate trigger for the SCSSM onset in the low levels. Both TC events seemed to be triggered by the MJO event (Wang and Moon, 2017; Zhao and Li, 2019; Ye et al., 2020), which is supported by the analysis of the empirical genesis potential index (Camargo et al., 2009; Moon et al., 2018) in the supporting information (Text S3, Figs. S4, S5 in the ESM). Therefore, we further examine the validity of the S2S prediction of the ECMWF, which can not only evaluate the model’s forecast skill but also verify the above analysis of the onset processes, such as the relationship between the MJO and the TCs.
-
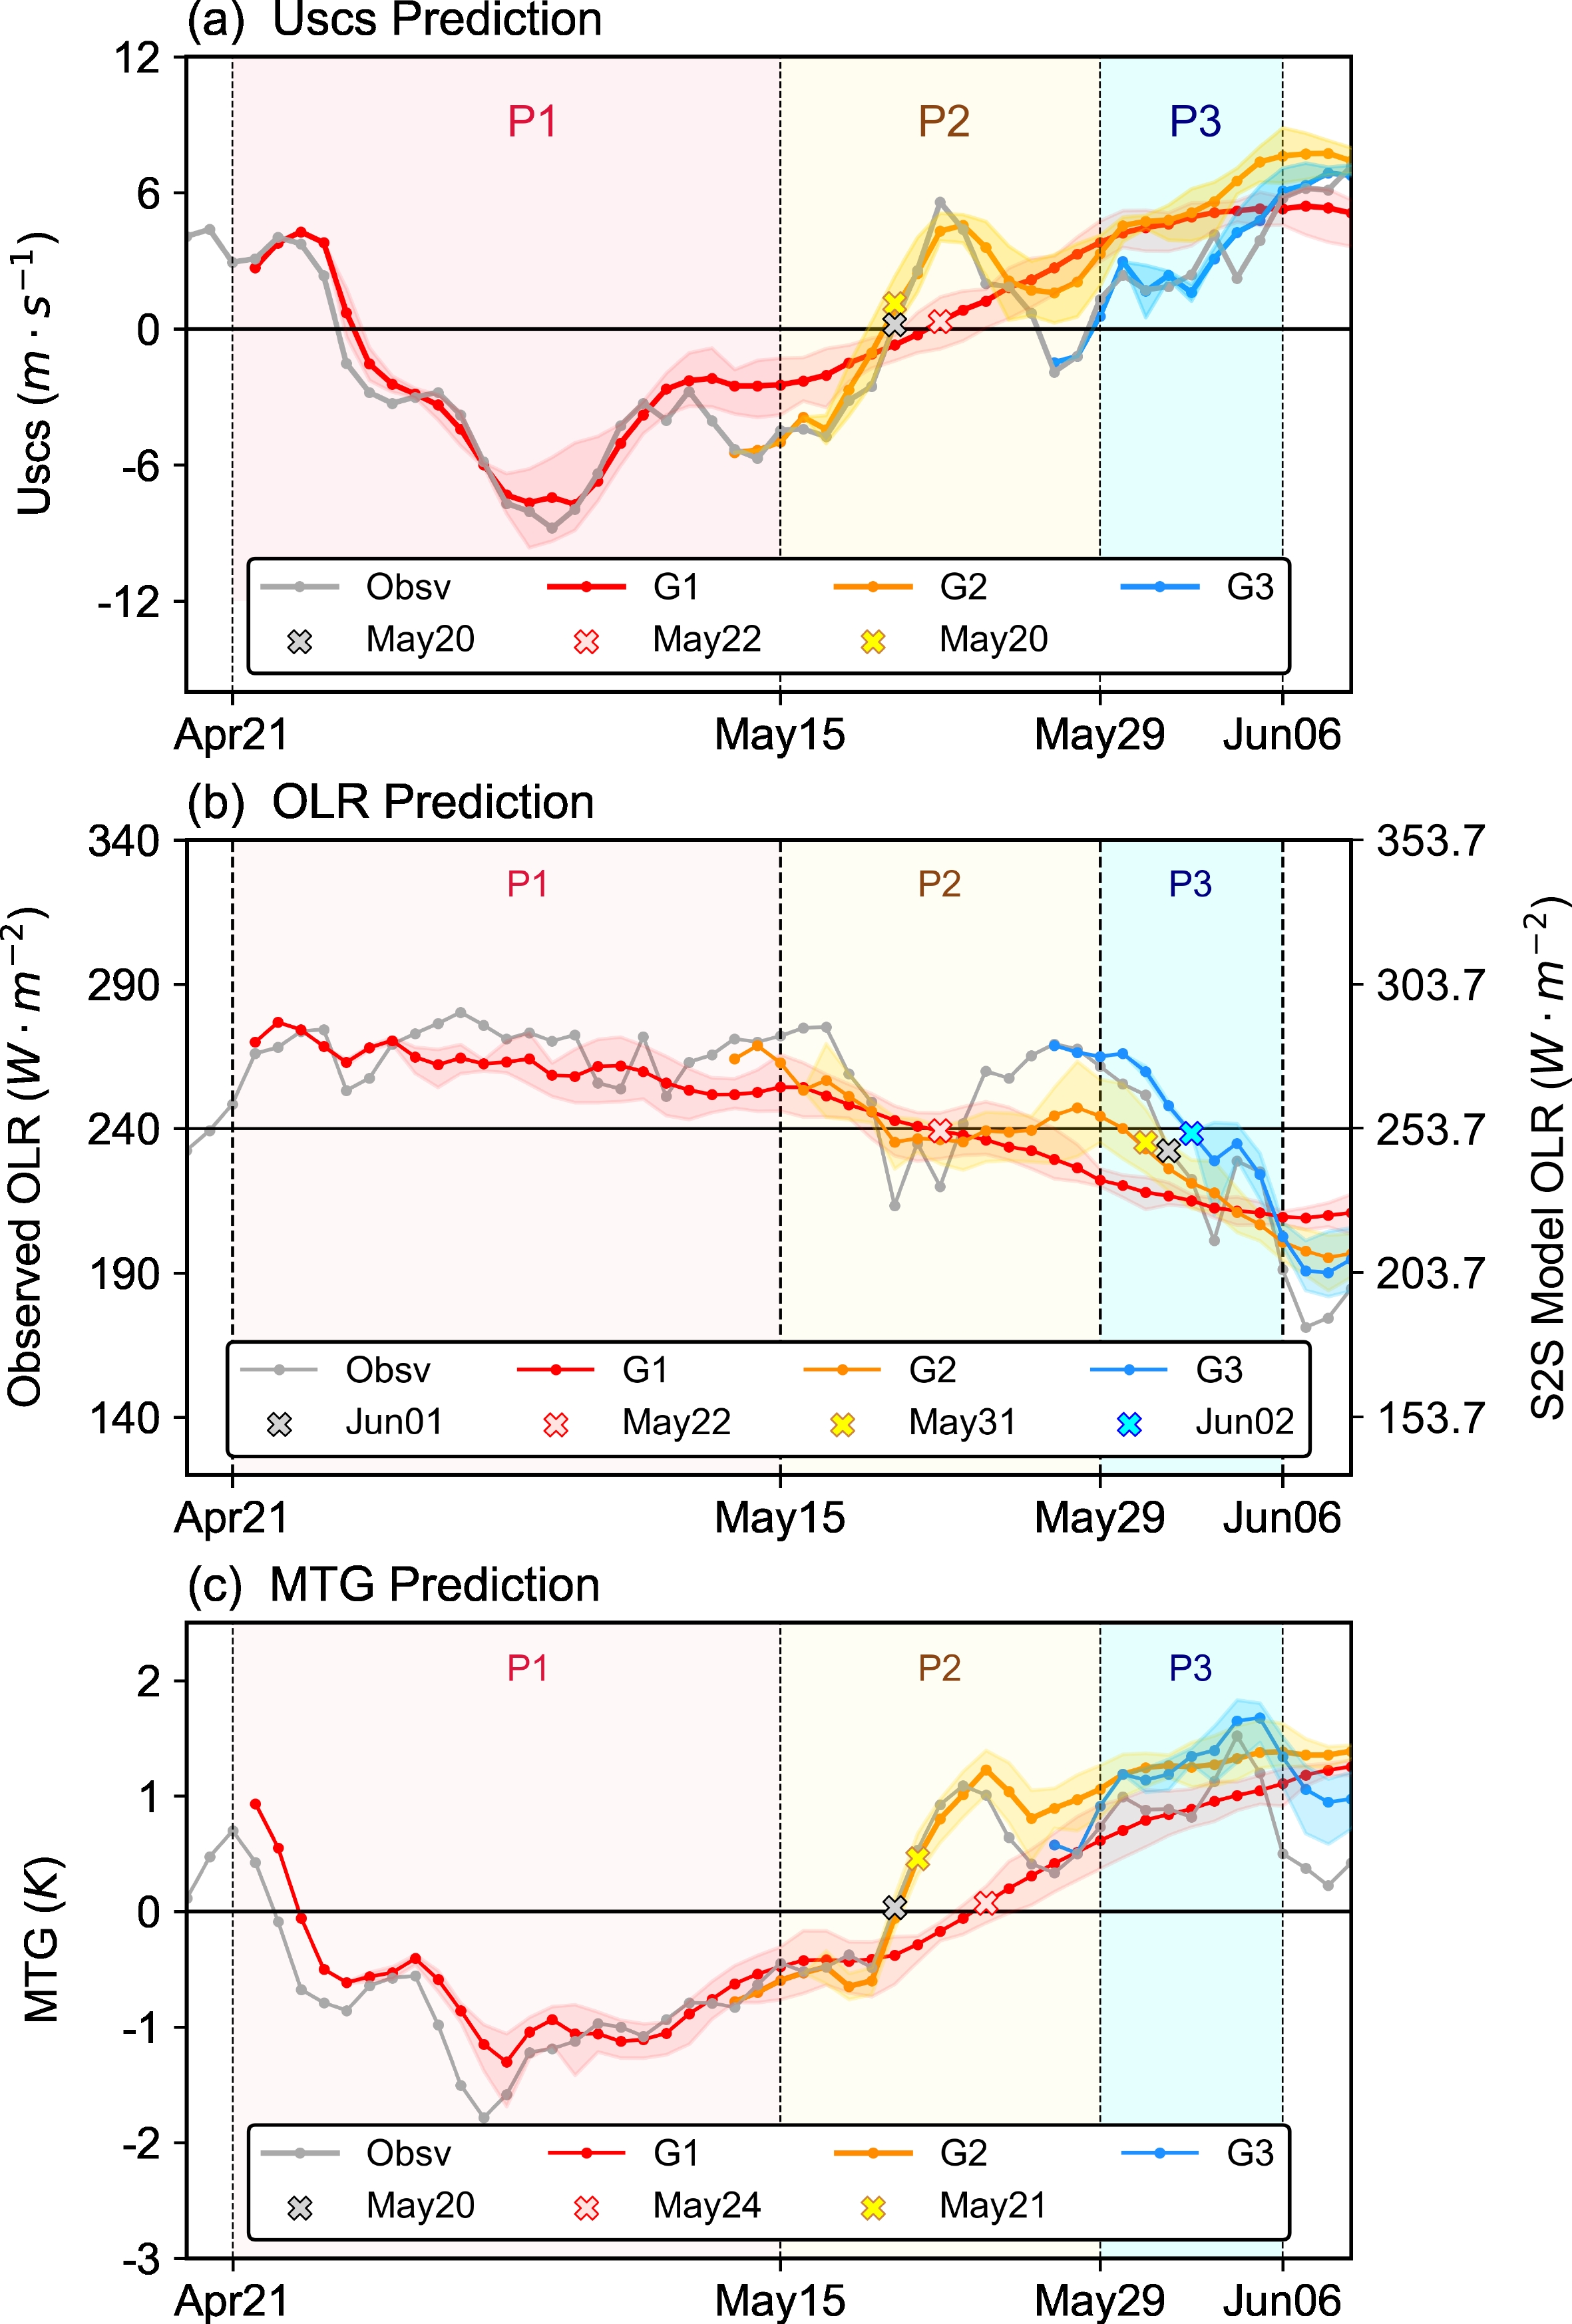
It is obvious that the forecast results starting from different periods are dissimilar (Fig. 5). Accordingly, the predictions of different initial dates can be roughly divided into three groups: G1 (initial time before May 13), G2 (initial time between May 13 and May 27), G3 (initial time after May 27).
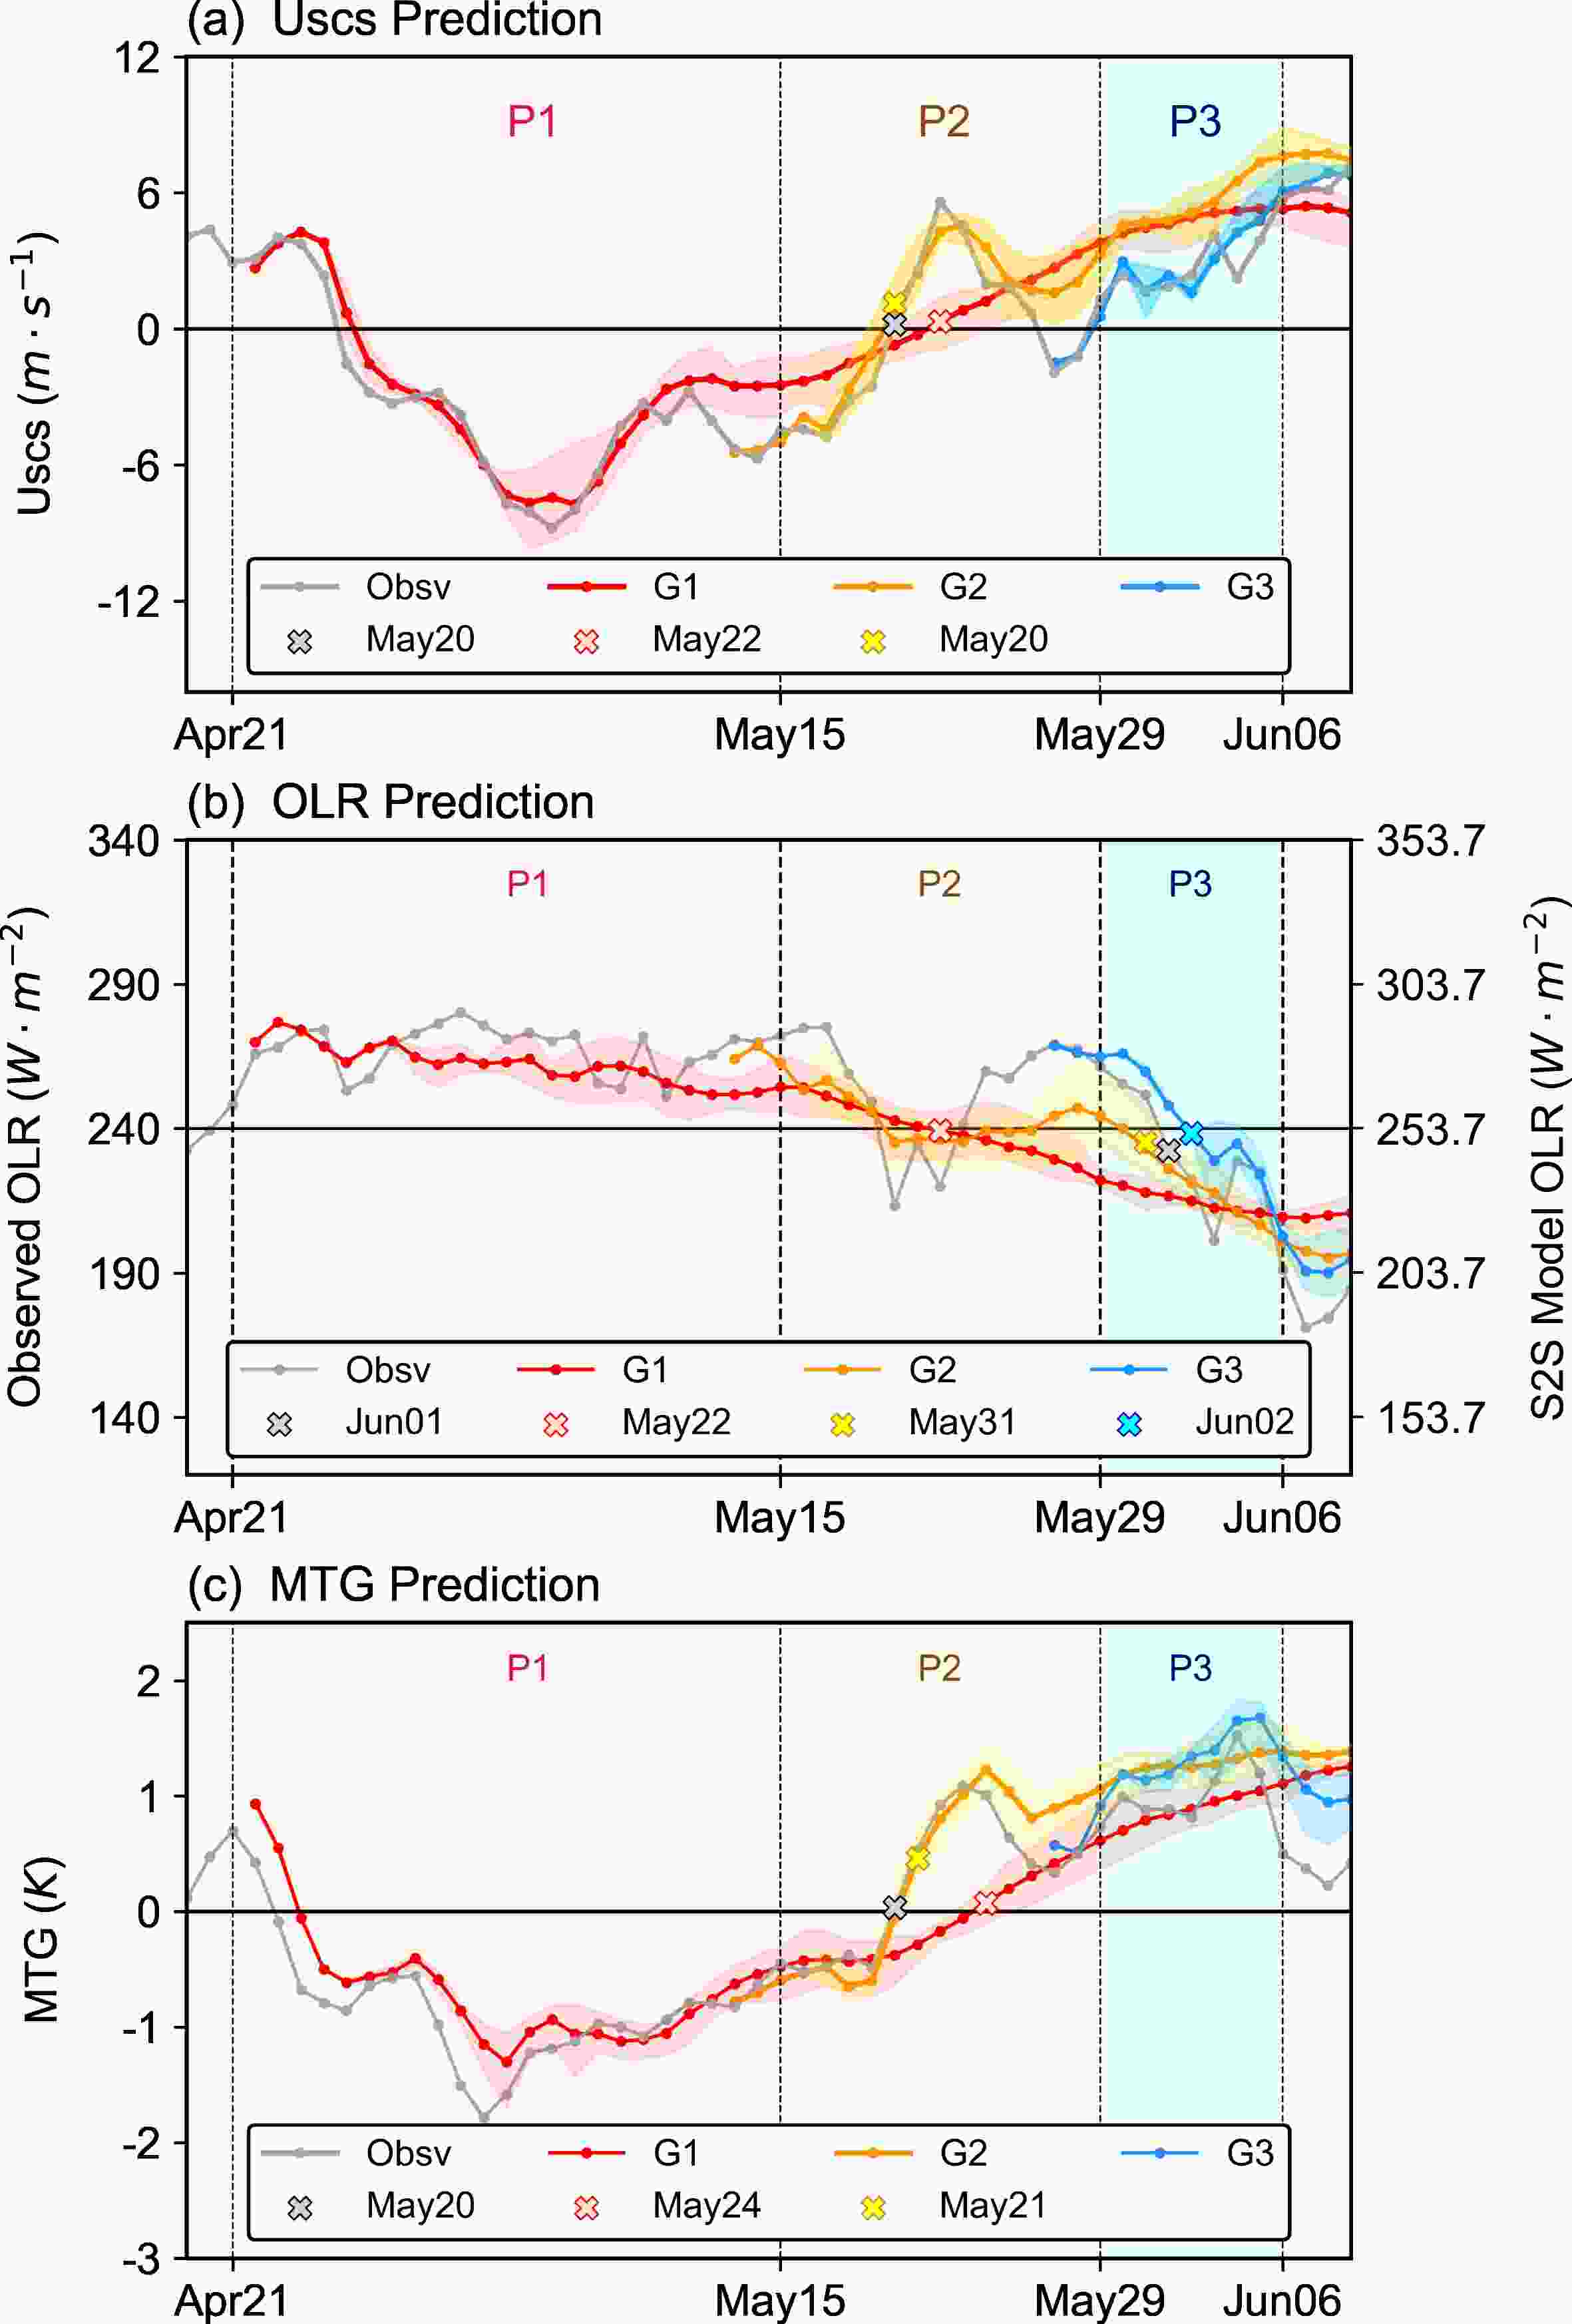
Figure 5. Real-time prediction of G1 (initial time before May 13), G2 (initial time between May 13 and May 27), and G3 (initial time after May 27) in the ECMWF S2S production for (a) USCS, (b) OLR, and (c) MTG. The onset dates for the predictions of G1–G3 defined by Kajikawa and Wang (2012), Shao et al. (2015), and Mao et al. (2004) are marked by “×” in (a), (b), and (c), respectively. The light color shadings indicate the spread of the ensemble members in the predictions of G1, G2, and G3.
The predictions of G1 (red lines in Fig. 5) correctly predict the fluctuations of the USCS and MTG indices caused by the dissipation of TC “Surigae” (2021) around the SCS and the westward movement of WPSH during P1 (red lines in Figs. 5a, c). The onset date predicted starting from G1 according to different variable criteria is about May 22–24, exhibiting synchronous seasonal evolutions for both circulation and convection criteria (Figs. 5 and S6 in the ESM).
If only the USCS criterion is considered, it seems that there is a useful skill in the SCSSM onset prediction at more than a month lead time in 2021. Based on the USCS criteria in GloSea5, Martin et al. (2019) have demonstrated useful skill at up to a three-month lead time in predicting the SCSSM onset, originating from a skillful prediction of Pacific SST associated with ENSO. On the other hand, Yan et al. (2021) found that the ECMWF model can provide an accurate prediction of the SCSSM onset date only ten days in advance and that the forecast skill is hindered by synoptic disturbances. For the 2021 case, if only the onset dates obtained by the circulation criteria were used to evaluate the predictive skill of the ECMWF, in line with the conclusion of Martin et al. (2019), there were accurate predictions at more than a month lead time. However, the fast transition of the indices and the circulation-convection inconsistency of the SCSSM onset are not captured by the prediction of G1. It is speculated that the predictive skill of SCSSM onset could be misestimated by only considering the onset dates according to the index criteria.
Compared to predictions of G1, the evolution of the indices and the circulation-convection inconsistency were accurately predicted by G2 (yellow lines in Fig. 5). Most especially, the abrupt transitions of the USCS and the MTG around May 20 were consistent with observations. Meanwhile, the tropical cyclone that made landfall over the Bay of Bengal was well predicted (Fig. S6). Afterward, the convection over the SCS in the observation was suppressed until late May and recovered at the beginning of June. Such asynchronous fluctuations of the circulation and convection indices (Figs. 5 and S6 in the ESM) were accurately predicted by the G2 forecast. However, the magnitudes of the variables in the predictions of G2 were much smaller than observations.
The improvements for the SCSSM onset prediction from G1 to G2 are suggested to originate from the predictions for the MJO event after 15 May. Therefore, the predictions of the MJO of G1 and G2 are also compared. Obviously, compared to the predictions of G1, the MJO event since 15 May is only predicted successfully by the predictions of G2, which contributes to the accurate predictions for the SCSSM onset (Fig. 6). Compared to the TC “Choi-wan” (2021) in observations, only a weak cyclone was predicted to be triggered over the western Pacific by the MJO event (Fig. S7 in the ESM), which accounted for the small magnitudes of the SCSSM onset indices in the predictions of G2. After the formation of TC “Choi-wan” (2021), the various magnitudes of the indices in the predictions since May 27 were comparable to observations (Fig. S7 and blue lines in Fig. 5). Hence, it is verified that TC “Choi-wan” (2021) acted as an immediate trigger for the SCSSM onset at lower levels.
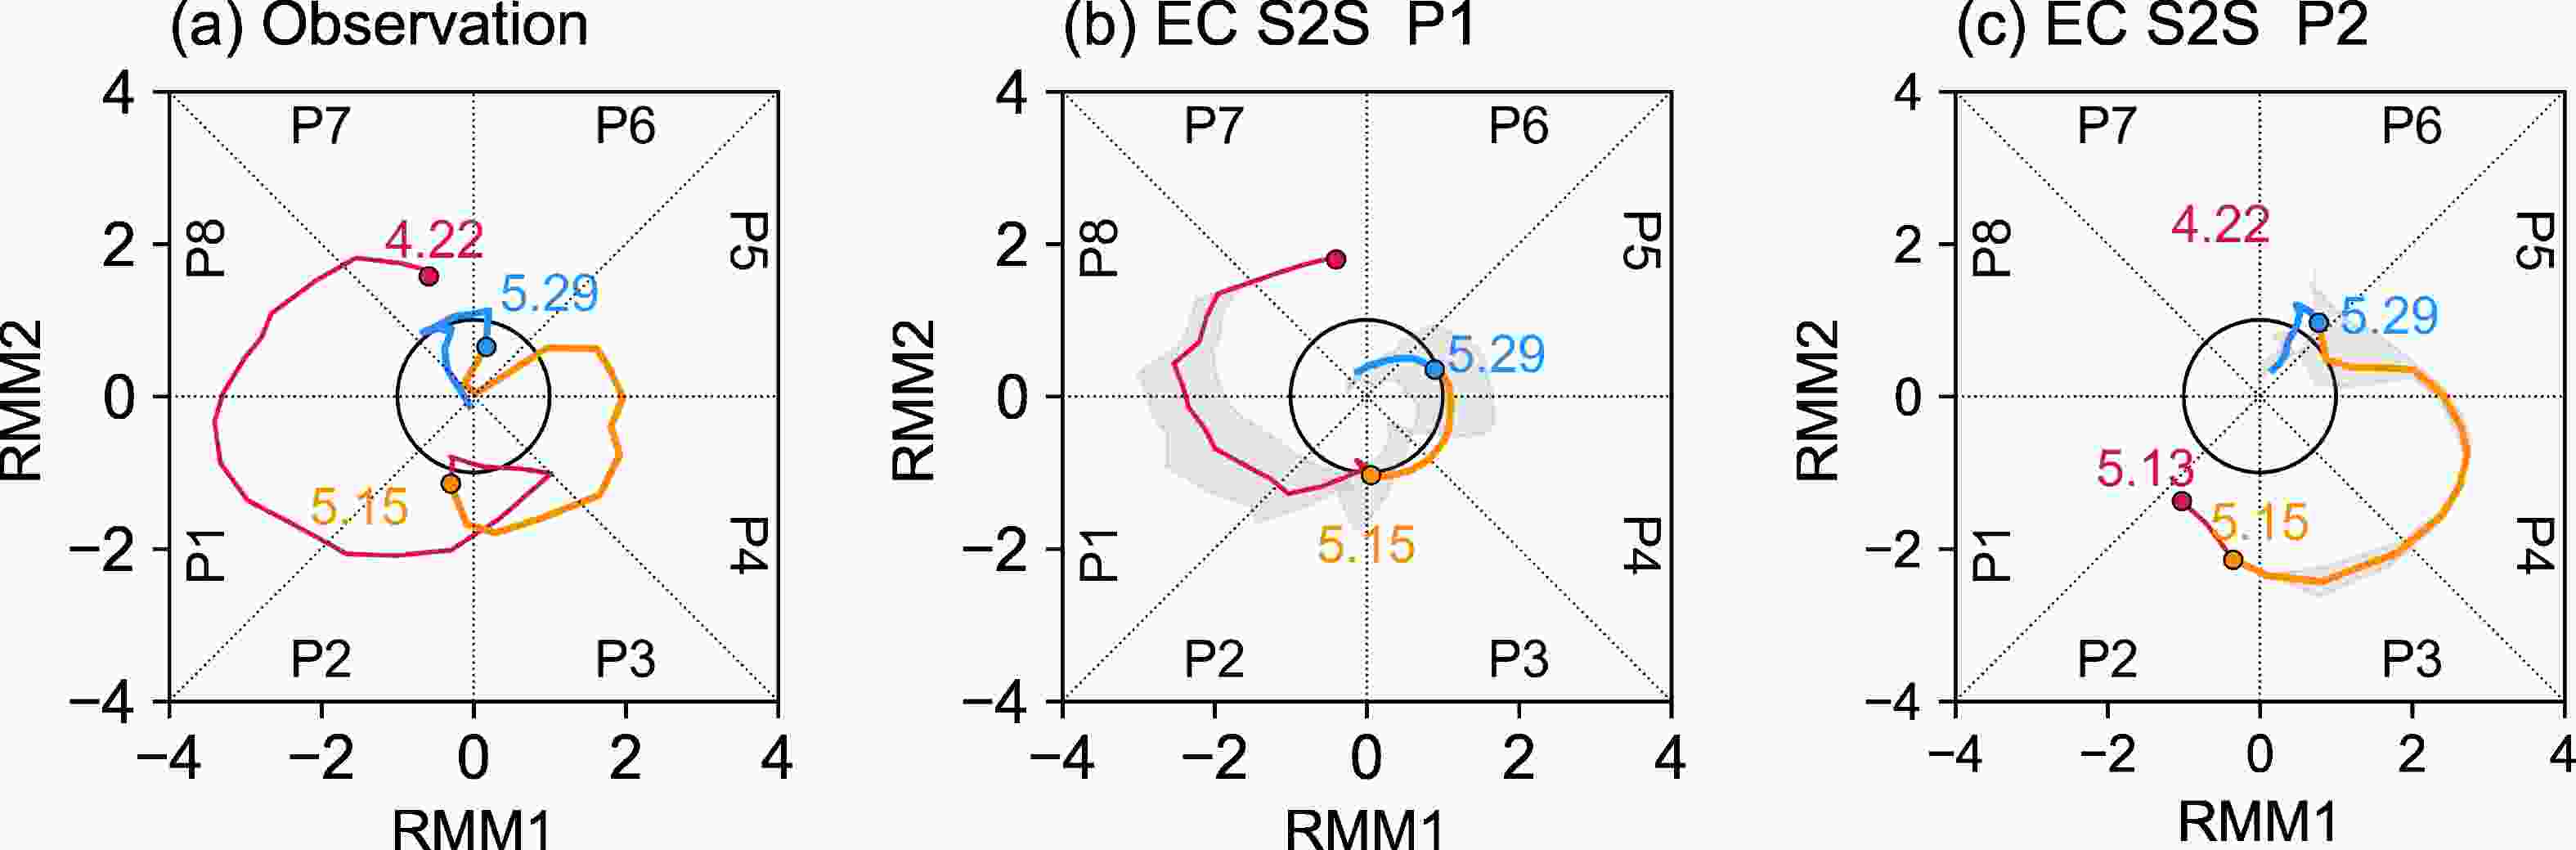
Figure 6. The MJO phase propagation for the observation and predictions in G1 and G2. The grey shadings in (b) and (c) represent the spread of the members. The different periods are marked by red, yellow, and blue colors, respectively.
In conclusion, according to the variations for the predictive skill from different periods, we found that the SCSSM onset processes were strongly regulated by sub-seasonal and synoptic activities. In particular, two TCs played an important role in controlling the evolution of the SCSSM onset. Further, the formation of these two TCs was closely tied to the MJO events. The forecasting skill for the SCSSM onset in 2021 is suggested to largely depend upon the prediction of the MJO.
-
The SCSSM onset in 2021 showed an inconsistent establishment according to circulation and convection evaluation parameters. According to the circulation indices (USCS and MTG) criteria, the onset time of the SCSSM in 2021 was 20 May, but when considering the convection criteria (OLR) in conjunction with the circulation criteria, the onset time was 1 June, which was much later than normal considering the decaying La Niña event from the previous winter. This evaluation not only disrupted the traditional relationship between ENSO and the onset time of the SCSSM but also exhibited inconsistent onset timing according to circulation and convection indices.
In the present study, the circulation-convection inconsistency for the SCSSM was mainly ascribed to the activities of TCs triggered by the MJO. Along with the eastward propagation of the MJO, TC “Yaas” (2021) formed over the Bay of Bengal and moved northwestward toward and made landfall during May 20–28. Its convection produced upper-level diabatic heating in the northern part of the SCS via advection, facilitating the MTG seasonal transition. On the other hand, when TC “Choi-wan” (2021) formed over the western Pacific and moved northward, it tracked through the eastern SCS along the western periphery of the WPSH. It assisted with the persistence of low-level westerlies but, at the same time, suppressed convection over the SCS. When TC “Choi-wan” (2021) peaked at the eastern edge of the SCS, the WPSH retreated eastward, inducing the comprehensive onset of the SCSSM. Both TCs were closely tied to the MJO activities, which were confirmed by the accurate prediction after the formation of the MJO.
The indices defined by area-averaged variables are commonly used to identify the SCSSM onset time (Mao et al., 2004; Kajikawa and Wang, 2012; Shao et al., 2015), and they are also applied to evaluate the related prediction skills of numerical and empirical models (Zhu and Li, 2017; Martin et al., 2019). Sometimes, the onset times, as defined by different indices, are inconsistent (He et al., 2017), which makes it difficult to judge the early and late onset of the SCSSM. In addition, by only considering the onset criteria of the indices, the prediction skill of the SCSSM onset may be misestimated. For the case in 2021, considering the convection criteria, the seasonal forecast result seems accurate following our theory related to the seasonal evolution for the CT La Niña event (Jiang and Zhu, 2021). However, the SCSSM onset in 2021 was directly triggered by TC “Yaas” (2021) and TC “Choi-wan” (2021), which was closely tied to the MJO activities rather than the seasonal evolution of the CT La Niña event. Our recent study has noted that in recent decades, northwest Indian Ocean warming induces more convective activities, which serve to trigger the SCSSM onset (Ai et al., 2022). In 2021, the SCSSM onset processes were also closely related to the convective activities originating from the Indian Ocean.
Under the context of uneven ocean warming, the broken relationship between ENSO and the SCSSM onset and increasing impacts from sub-seasonal and synoptic processes are frequently reported. The seasonal predictability of the SCSSM onset seems strongly hampered by synoptic activities (Hu et al., 2022b; Huangfu et al., 2022), such as TCs (Mao and Wu, 2008; Hu et al., 2020; Liu and Zhu, 2020). On the other hand, the SCSSM onset time is steadily locked to the late spring. The skillful prediction of the MJO during that period provides an opportunity to accurately predict the SCSSM onset time several weeks in advance. During the late spring, the establishment of the SCSSM onset is sensitive to the surrounding convective activity, such as the TCs over the Bay of Bengal and the western Pacific. Such convective activities can be generated from the MJO propagation. Although the onset dates defined by various indices sometimes show significant differences, these indices are all reasonable in depicting the establishment processes of the SCSSM in different aspects (Mao et al., 2004; Kajikawa and Wang, 2012; Shao et al., 2015). Accurate prediction of terrestrial monsoon precipitation on a sub-seasonal time scale has become mandatory (Liu et al., 2022). Rather than arguing over accurate onset dates, we should focus more on the indicated significance of the different indices for subsequent monsoon and precipitation anomalies in China.
Acknowledgements. This study was jointly supported by the National Natural Science Foundation of China (Grant Nos. 42005011, 41830969) and the Basic Scientific Research and Operation Foundation of CAMS (Grant Nos. 2021Z004). This study was also supported by the Jiangsu Collaborative Innovation Center for Climate Change.
Electronic supplementary material: Supplementary material is available in the online version of this article at
https://doi.org/10.1007/s00376-022-2103-5 .
Influences of MJO-induced Tropical Cyclones on the Circulation-Convection Inconsistency for the 2021 South China Sea Summer Monsoon Onset
- Manuscript received: 2022-04-08
- Manuscript revised: 2022-07-29
- Manuscript accepted: 2022-08-12
Abstract: The South China Sea Summer Monsoon (SCSSM) onset is characterized by an apparent seasonal conversion of circulation and convection. Accordingly, various indices have been introduced to identify the SCSSM onset date. However, the onset dates as determined by various indices can be very inconsistent. It not only limits the determination of onset dates but also misleads the assessment of prediction skills. In 2021, the onset time as identified by the circulation criteria was 20 May, which is 12 days earlier than that deduced by also considering the convection criteria. The present study mainly ascribes such circulation-convection inconsistency to the activities of tropical cyclones (TCs) modulated by the Madden-Julian Oscillation (MJO). The convection of TC “Yaas” (2021) acted as an upper-level diabatic heat source to the north of the SCS, facilitating the circulation transition. Afterward, TC “Choi-wan” (2021) over the western Pacific aided the westerlies to persist at lower levels while simultaneously suppressing moist convection over the SCS. Accurate predictions using the ECMWF S2S forecast system were obtained only after the MJO formation. The skillful prediction of the MJO during late spring may provide an opportunity to accurately predict the establishment of the SCSSM several weeks in advance.
-
Keywords:
- tropical cyclone,
- South China Sea summer monsoon,
- monsoon onset,
- MJO
摘要: 南海夏季风爆发以显著的季节性环流与对流转换为特征。根据此,很多指标已经被提出用于定义南海夏季风爆发的日期。然而,根据不同指数决定的爆发日期可能非常不一致。这不仅限制了爆发日期的确定,而且会误导预报技巧的评估。在2021年,根据环流标准定义的爆发日期为5月20日,与考虑了对流标准推演得到的爆发日期相比提早了12天。本文主要将这样环流-对流不一致的现象归因于由MJO (Madden-Julian Oscillation) 引发的台风。热带气旋“Yass”作为南海北部高层非绝热加热的热源,加速了环流的转换。此后,西太平洋上空的热带气旋“Choi-wan”协助低层西风的持续,但同时也抑制了南海上空的湿对流。使用ECMWF的季节-次季节预报系统仅仅在得到MJO信息之后可以准确预报2021年南海夏季风爆发。在晚春时期MJO预报技巧的提高,可能会为提前几周准确预报南海夏季风的建立提供一个机会窗口。
 AAS Website
 AAS WeChat