


 DownLoad:


HTML
-
Atmospheric fine aerosols have attracted much attention from the public owing to their adverse effects on visibility, global climate and human health (Dockery et al., 1993; Charlson and Heintzenberg, 1995; Haywood and Boucher, 2000; Ramanathan et al., 2001; IPCC, 2013). The North China Plain (NCP), which is one of the most important city clusters in China, is a global hotspot of aerosol pollution originated from both natural (e.g., dust storms) and anthropogenic (e.g., industrial emissions, vehicle emissions and biomass burning) sources. As a result, numerous studies on the sources, formation and evolution processes of aerosols have been conducted in urban regions, such as Beijing, Tianjin, and some cities in Hebei Province that have experienced severe air pollution (Song et al., 2006; Gu et al., 2010; Huang et al., 2010; Liu et al., 2012; Sun et al., 2012; Wang et al., 2014; Li et al., 2017). Compared to studies on the urban atmosphere, studies focusing on aerosol characterization in rural NCP areas are much more limited. For example, as a key property for aerosols, volatility can greatly influence the mass concentration and size distribution of aerosols via gas–particle partitioning (Lazaridis, 1999; Pankow and Barsanti, 2009; Bilde et al., 2015), and previous studies suggest that the volatility of different aerosol compounds may vary from site to site (Huffman et al., 2009a, b; Bi et al., 2015; Cao et al., 2018, 2019; Xu et al., 2019). However, to the best of our knowledge, aerosol volatility measurements in rural NCP areas do not exist. Research on the volatility of different aerosol compounds in rural NCP areas is needed to obtain a more comprehensive understanding of aerosol fate on the regional scale. Three methods are frequently applied to measure the volatility of aerosols: VTDMA (volatility tandem differential mobility analyzer) (Dassios and Pandis, 1999; Kuhn et al., 2005; Saleh et al., 2008), dilution samplers (Shrivastava et al., 2006), and the combination of a thermodenuder and aerosol mass spectrometer (TD-AMS system) (Huffman et al., 2008). Among them, the TD-AMS system can measure the volatility of different chemical compositions with a high temporal resolution and has been widely used in field campaigns (Huffman et al., 2009a, b; Bi et al., 2015; Cao et al., 2018, 2019; Xu et al., 2019) and laboratory studies (Kolesar et al., 2015; Saha and Grieshop, 2016).
Organonitrates (ON) are generating increasing interest owing to their crucial role in the chemistry of atmospheric oxidation and potentially significant influence on regional air quality, climate change and global biogeochemical cycles (Bertman et al., 1995; Jenkin and Clemitshaw, 2000; Russo et al., 2010). The broad definition of ON includes peroxy nitrates (RO2NO2) and multifunction alkyl nitrates (RONO2). Lacking the ideal analytical instruments to detect the bulk ON was the biggest obstacle for fully understanding the chemistry of ON in the past. In recent years, several advanced techniques have emerged that are capable of measuring various kinds of ON, especially for particulate ON. Aerosol mass spectrometry (AMS), which has been widely used to characterize organic compounds of aerosols with high temporal resolution, can quantify the number of ON species based on indirect estimation methods (Farmer et al., 2010; Hao et al., 2014; Xu et al., 2015a, b). Rollins et al. (2012) reported the first direct ambient measurement of particulate ON by the Berkeley thermal dissociation-laser induced fluorescence method. These measurements provided significant evidence that ON contribute a substantial portion of the secondary organic aerosols (Rollins et al., 2012; Fry et al., 2013; Ayres et al., 2015; Boyd et al., 2015; Xu et al., 2015b; Lee et al., 2016; Yu et al., 2019). There are two main secondary formation pathways for ON: OH-initiated oxidation of hydrocarbons in the presence of NOx in the daytime, and NO3-induced oxidation of alkenes at night. For the secondary formation pathway, several studies have shown that particulate ON yields were high via nighttime NO3 reacting with biogenic unsaturated alkenes (i.e., isoprene and monoterpene) (Fry et al., 2009; Ayres et al., 2015; Boyd et al., 2015, 2017). Very recently, Joo et al. (2019) reported that particulate ON can be formed from the reaction of NO3 oxidation of 3-Methylfuran, which is an important tracer species in biomass burning plumes. However, the properties, sources and formation mechanisms of particulate ON are still not well understood (Perring et al., 2013). To the best of our knowledge, most research on particulate ON has been conducted in the U.S. and Europe (Perring et al., 2013; Ng et al., 2017), and very few studies have reported detailed particulate ON results for urban areas in China (Xu et al., 2017; Yu et al., 2019), which are characterized by an atmosphere with a large variety of anthropogenic pollutants.
In this study, we conducted aerosol measurements using a TD coupled with an Aerodyne high-resolution time-of-flight aerosol mass spectrometer (TD-HR-AMS) and other collocated instruments at a rural site in the NCP region in summer 2013. Besides investigating the sources and volatility of organic aerosol (OA), we also focused on characterizing the particulate ON with mass concentration, volatility and their possible sources in the NCP rural region.
-
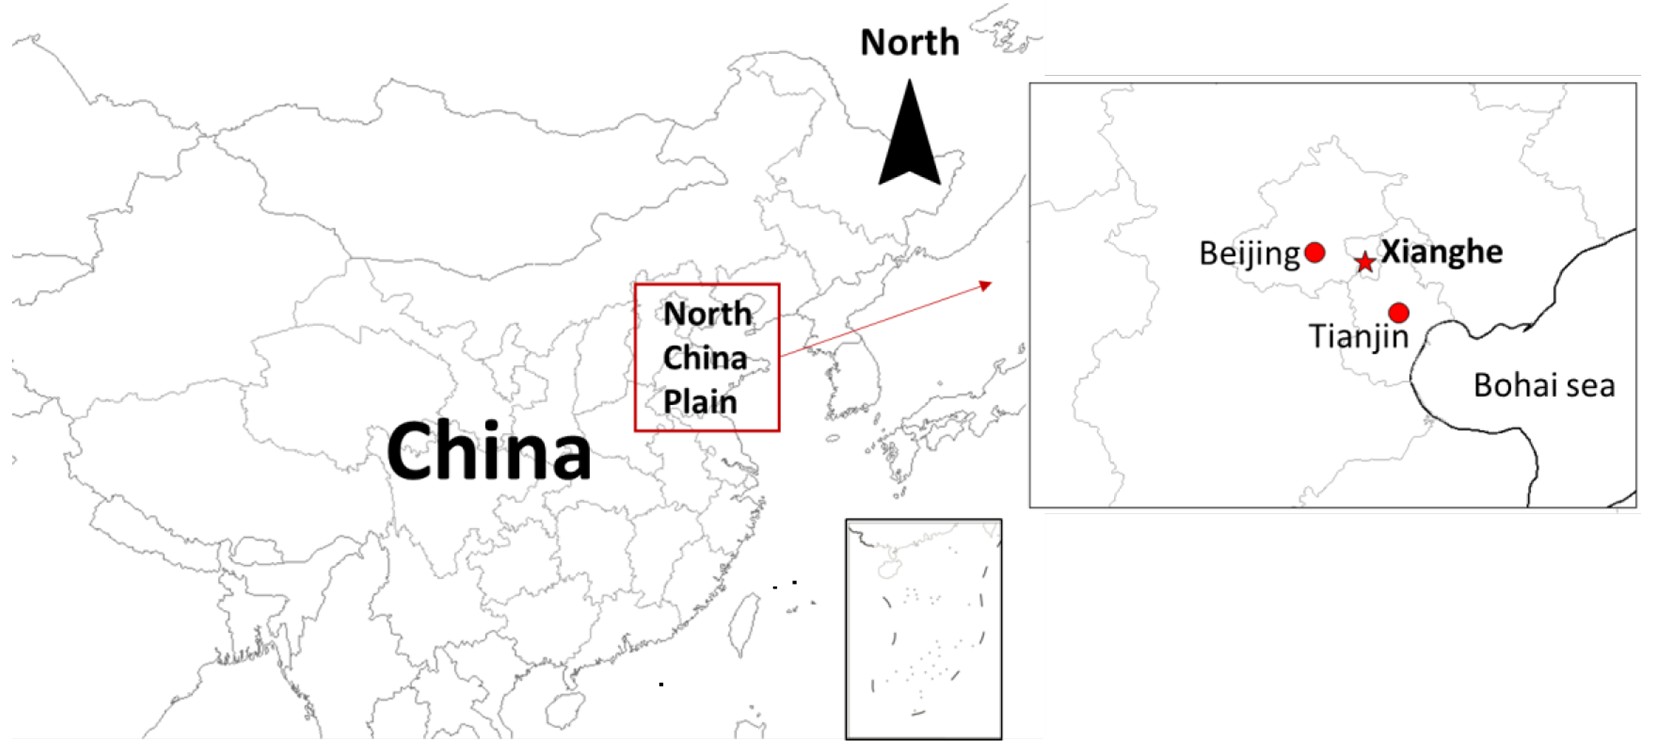
The sampling site (39.80°N, 116.96°E; 15 m MSL) was at Xianghe Atmospheric Observatory of the Institute of Atmospheric Physics, Chinese Academy of Sciences. This site is a rural site surrounded by agricultural fields and located between Beijing and Tianjin, which are the two most important megacities in the NCP region (Fig. 1). The site’s location means that it experiences plumes derived from local agricultural activities or regional transport from urban areas. Measurements were performed from 9 June to 9 July 2013.
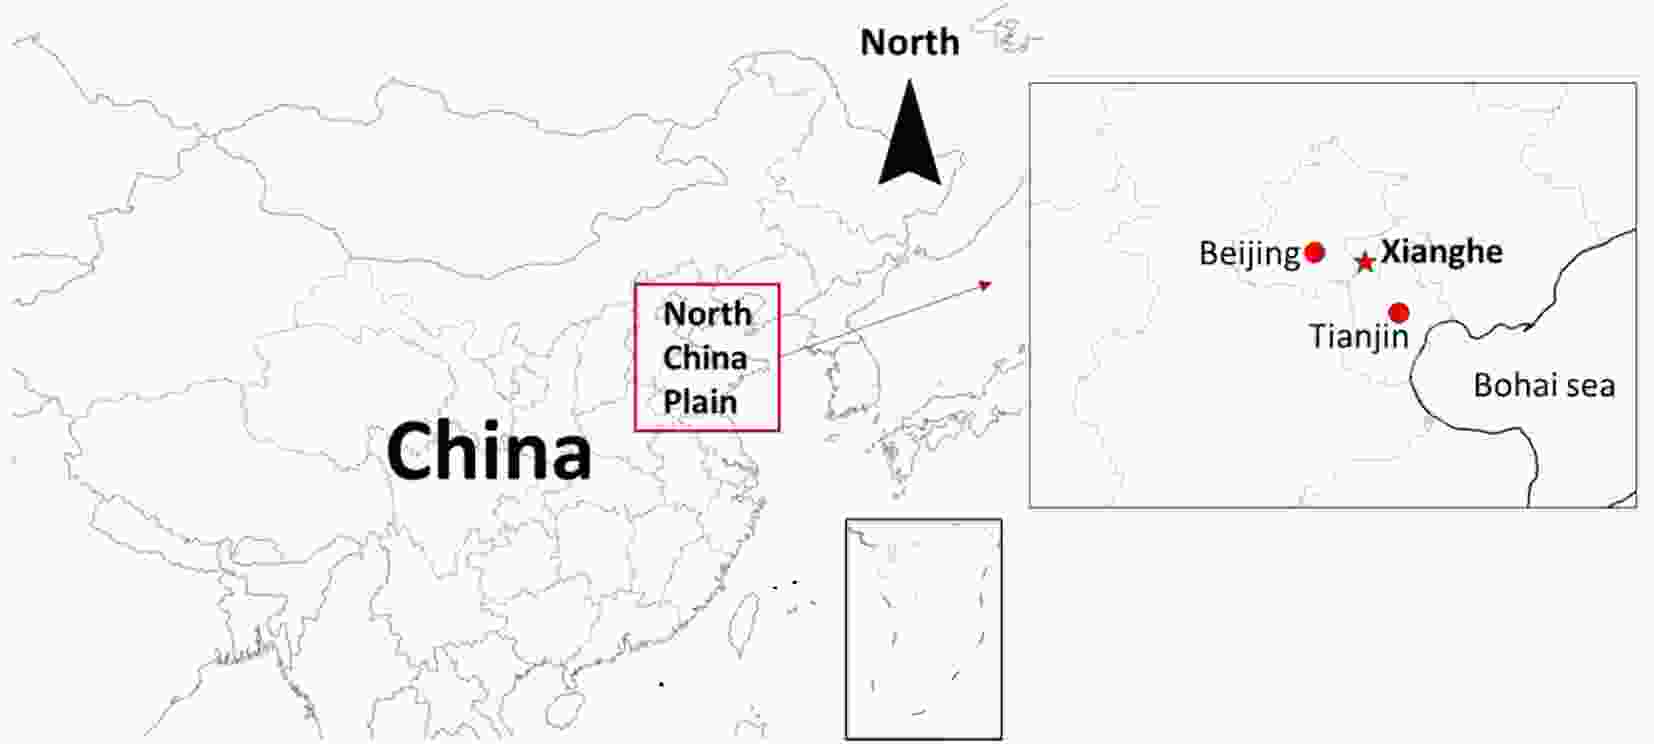
Figure 1. Location of the sampling site (Xianghe).
The TD-HR-AMS system was deployed at the site to characterize the chemical compositions, mass concentrations and volatility of non-refractory particulate matter (NR-PM1) (DeCarlo et al., 2006; Canagaratna et al., 2007). A detailed description of the setup and operation of the TD-HR-AMS during measurements can be found in our previous studies (Cao et al., 2018, 2019). Briefly, a PM2.5 cyclone was used to remove coarse particles and introduce the ambient air into the TD-HR-AMS and a scanning mobility particle sizer system (3775 CPC and 3080 DMA, TSI Inc.) through a copper tube with a flow of 10 L min−1. The TD was positioned upstream of the HR-ToF-AMS, and the flow rate passing through the TD was 0.45 L min−1 with a residence time of ~27.9 s in the heating section. The TD included a heating section and denuder section. The temperatures in the heating section were set at 48°C, 95°C, 143°C and 192°C, corresponding to the measured temperatures of 50°C, 100°C, 150°C and 200°C, respectively. Ambient aerosols can pass through directly (bypass flow) or through the TD section (TD flow), and are then dried by a nafion to eliminate the potential influence of relative humidity on the particle collection efficiency (CE) (Matthew et al., 2008). The ionization efficiency (IE) and size calibrations were performed with size-selected pure ammonium-nitrate particles every two weeks. A composition-dependent CE was applied to the data based on the method of Middlebrook et al. (2012). The NR-PM1 species were quantified by the V-mode with unit mass resolution, while the high-resolution mass spectral data were obtained by the W-mode. We operated the HR-ToF-AMS in four menus: bypass flow in V-mode, TD flow in V-mode, TD flow in W-mode, and bypass flow in W-mode, each with a sampling time of 2 min. Besides the TD-HR-AMS system, an aethalometer (AE-31, Magee Inc.) was simultaneously used to measure refractory black carbon (BC) with a temporal resolution of 5 min. The wavelength of 880 nm was used to calculate the mass concentration of BC. The total measured BC can be divided into BC derived from traffic emissions (BC_tr) and biomass burning (BC_bb) based on the aerosol absorption as described in Sandradewi et al., (2008), shown in Text S1 in the Electronic Supplementary Material (ESM).
-
The HR-ToF-AMS data routine analysis was performed using the software SQUIRREL (version 1.57) and PIKA (version 1.16) downloaded from the ToF-AMS software downloads webpage (
http://cires1.colorado.edu/jimenezgroup/ToFAMSResources/ToFSoftware/index.html ) written in Igor Pro 6.37 (Wave Metrics Inc.). The relative IEs for organics, nitrates and chlorides were assumed to be 1.4, 1.1 and 1.3, respectively. A composition-dependent CE was applied to the data based on the method of Middlebrook et al. (2012). Organic elemental analyses, such as the oxygen-to-carbon ratio (O:C), and hydrogen-to-carbon ratio, are determined by the latest procedures proposed by Canagaratna et al. (2015).Positive matrix factorization (PMF) analysis is a mathematical technique for solving bilinear unmixing problems (Paatero and Tapper, 1994), and has been widely applied in the aerosol community for source apportionment (Lanz et al., 2007; Jimenez et al., 2009; Ulbrich et al., 2009; Huang et al., 2010, 2013; Ng et al., 2010; Xu et al., 2015a, b; Beddows and Harrison, 2019). PMF analysis for AMS data describes the measured matrix as the linear combination of different factors with a constant mass spectrum and their corresponding time series. The observed data matrix and error matrix were generated with the default fragmentation table in PIKA v1.16 and pretreated the error matrix using PMF Evaluation Toolkit software, following the procedure described in Ulbrich et al. (2009). Ions with a signal-to-noise ratio (SNR) less than 0.2 were removed and ions with an SNR ranging between 0.2 and 2 were downweighted by a factor of 2. The ions of H2O+, HO+, O+, and CO+, which are related to
${\rm{ CO}}_2^+ $ , were also downweighted since they could introduce additional weight to${\rm{ CO}}_2^+ $ (Ulbrich et al., 2009). Then, we performed PMF runs with a range from 1 to 10 factors with FPEAK ("FPEAK" is a tool used to explore rotations of the solutions of a given number of factors) varying from −1 to 1 in steps of 0.1, and SEED ("SEED" is a tool used to choose different random starts for the PMF algorithm) varying from 0 to 250 in steps of 10. The obtained solution of PMF was evaluated carefully according to the procedure outlined in Zhang et al. (2011). According to the diagnostic plots shown in Fig. S1 in the ESM, we found that PMF solutions with factor numbers greater than 4 provided no new distinct meaningful factors and instead split the existing factors. The optimal solution was a 4-factor (FPEAK = 0 and SEED = 0) solution—namely, a hydrocarbon-like OA (HOA), a biomass burning OA (BBOA), a less-oxidized oxygenated OA (LO-OOA), and a more-oxidized oxygenated OA (MO-OOA)—after examining the Q/Qexpected value, the residuals of PMF fits, mass spectrum (MS) signatures, their correlation with tracers, diurnal trends, and other characteristics. -
In this study, we used two indirect methods to quantify nitrate functionality of ON mass concentration (i.e., NO3,org) based on HR-ToF-AMS measurements. The first method was based on the NO+/
${\rm{NO}}_2^+ $ ratio (denoted as the${\rm{NO}}_x^+ $ ratio hereafter) in the HR-AMS spectrum (Farmer et al., 2010). The${\rm{NO}}_x^+ $ ratio in AMS is significantly higher for ON than ammonium nitrates, according to previous laboratory studies (Fry et al., 2009; Bruns et al., 2010; Farmer et al., 2010; Boyd et al., 2015). Based on this, Farmer et al. (2010) proposed the NO2 and NO concentrations for ON (NO2,ON and NOON) can be quantified with the HR-AMS data as follows:where Robs is the
${\rm{NO}}_x^+ $ ratio from the observation,${R_{{\rm{NH}}_4{\rm{NO}}_3}} $ is determined by IE calibration using pure ammonium nitrate particles (in this study, the average value of${R_{{\rm{NH}}_4{\rm{NO}}_3}} $ was 2.15 and 2.31 for the first and second IE calibration, respectively), and RON represents the${\rm{NO}}_x^+ $ ratio for ON, which varies between instruments and precursor volatile organic compounds (VOCs) (Fry et al., 2009; Boyd et al., 2015). Fortunately, RON/${R_{{\rm{NH}}_4{\rm{NO}}_3}} $ has been assumed to be instrument-independent (Fry et al., 2013). In this study, we adopted an RON/${R_{{\rm{NH}}_4{\rm{NO}}_3}} $ range from 1.4 to 3.99, which was based on laboratory study results of ON formed from different VOCs (i.e., 1.4 for 3-Methylfuran, 2.08 for isoprene, 2.25 for the organic nitrate standards, 3.99 for β-pinene) (Bruns et al., 2010; Farmer et al., 2010; Sato et al., 2010; Boyd et al., 2015; Joo et al., 2019), to determine RON in estimating ON.The second method was based on PMF analysis. We performed the same PMF analysis on HR organic mass spectra combining NO+ and
${\rm{ NO}}_2^+ $ ions to quantify the contributions of ON and ammonium nitrates (Hao et al., 2014; Xu et al., 2015b; Yu et al., 2019). In this method, the NO+ and${\rm{ NO}}_2^+ $ ions were distributed among different OA factors and inorganic aerosol (NIA) factor. Three organic factors (HOA, BBOA and OOA) and one NIA factor were identified using PMF analysis on organic and${\rm{NO}}_x^+ $ fragments (denoted as${\rm{PMF}}_{{\rm{org}}+{\rm{NO}}_x} $ hereafter). It should be noted that we cannot resolve subtypes of OOA factors from${\rm{PMF}}_{{\rm{org}}+{\rm{NO}}_x} $ analysis. However, OOA factor from${\rm{PMF}}_{{\rm{org}}+{\rm{NO}}_x} $ show a good correlation on time series with the sum of LO-OOA and MO-OOA factors from PMF on organic spectra (Fig. S3 in the ESM), suggesting${\rm{PMF}}_{{\rm{org}}+{\rm{NO}}_x} $ also provided a reasonable result in resolving factors. After determining the optimal solution, the NO+ and${\rm{ NO}}_2^+ $ ions were distributed among different OA factors and the NIA factor. The concentration of NO3,org is equal to the sum of NO+ and${\rm{ NO}}_2^+ $ in the organic nitrates (i.e.,${\rm{NO}}_{{\rm{org}}}^ + $ and${\rm{NO}}_{{\rm{2,org}}}^ + $ ), which are estimated via Eqs. (3) and (4), respectively (Xu et al., 2015b):where [OA factor]i represents the mass concentration of the ith OA factor and fNOi and fNO2,i represent the mass fractions of NO+ and
${\rm{NO}}_2^+ $ , respectively.
2.1. Site description and instrumentation
2.2. HR-ToF-AMS data routine processing and positive matrix factorization analysis


2.3. Estimation of ON mass concentration


-
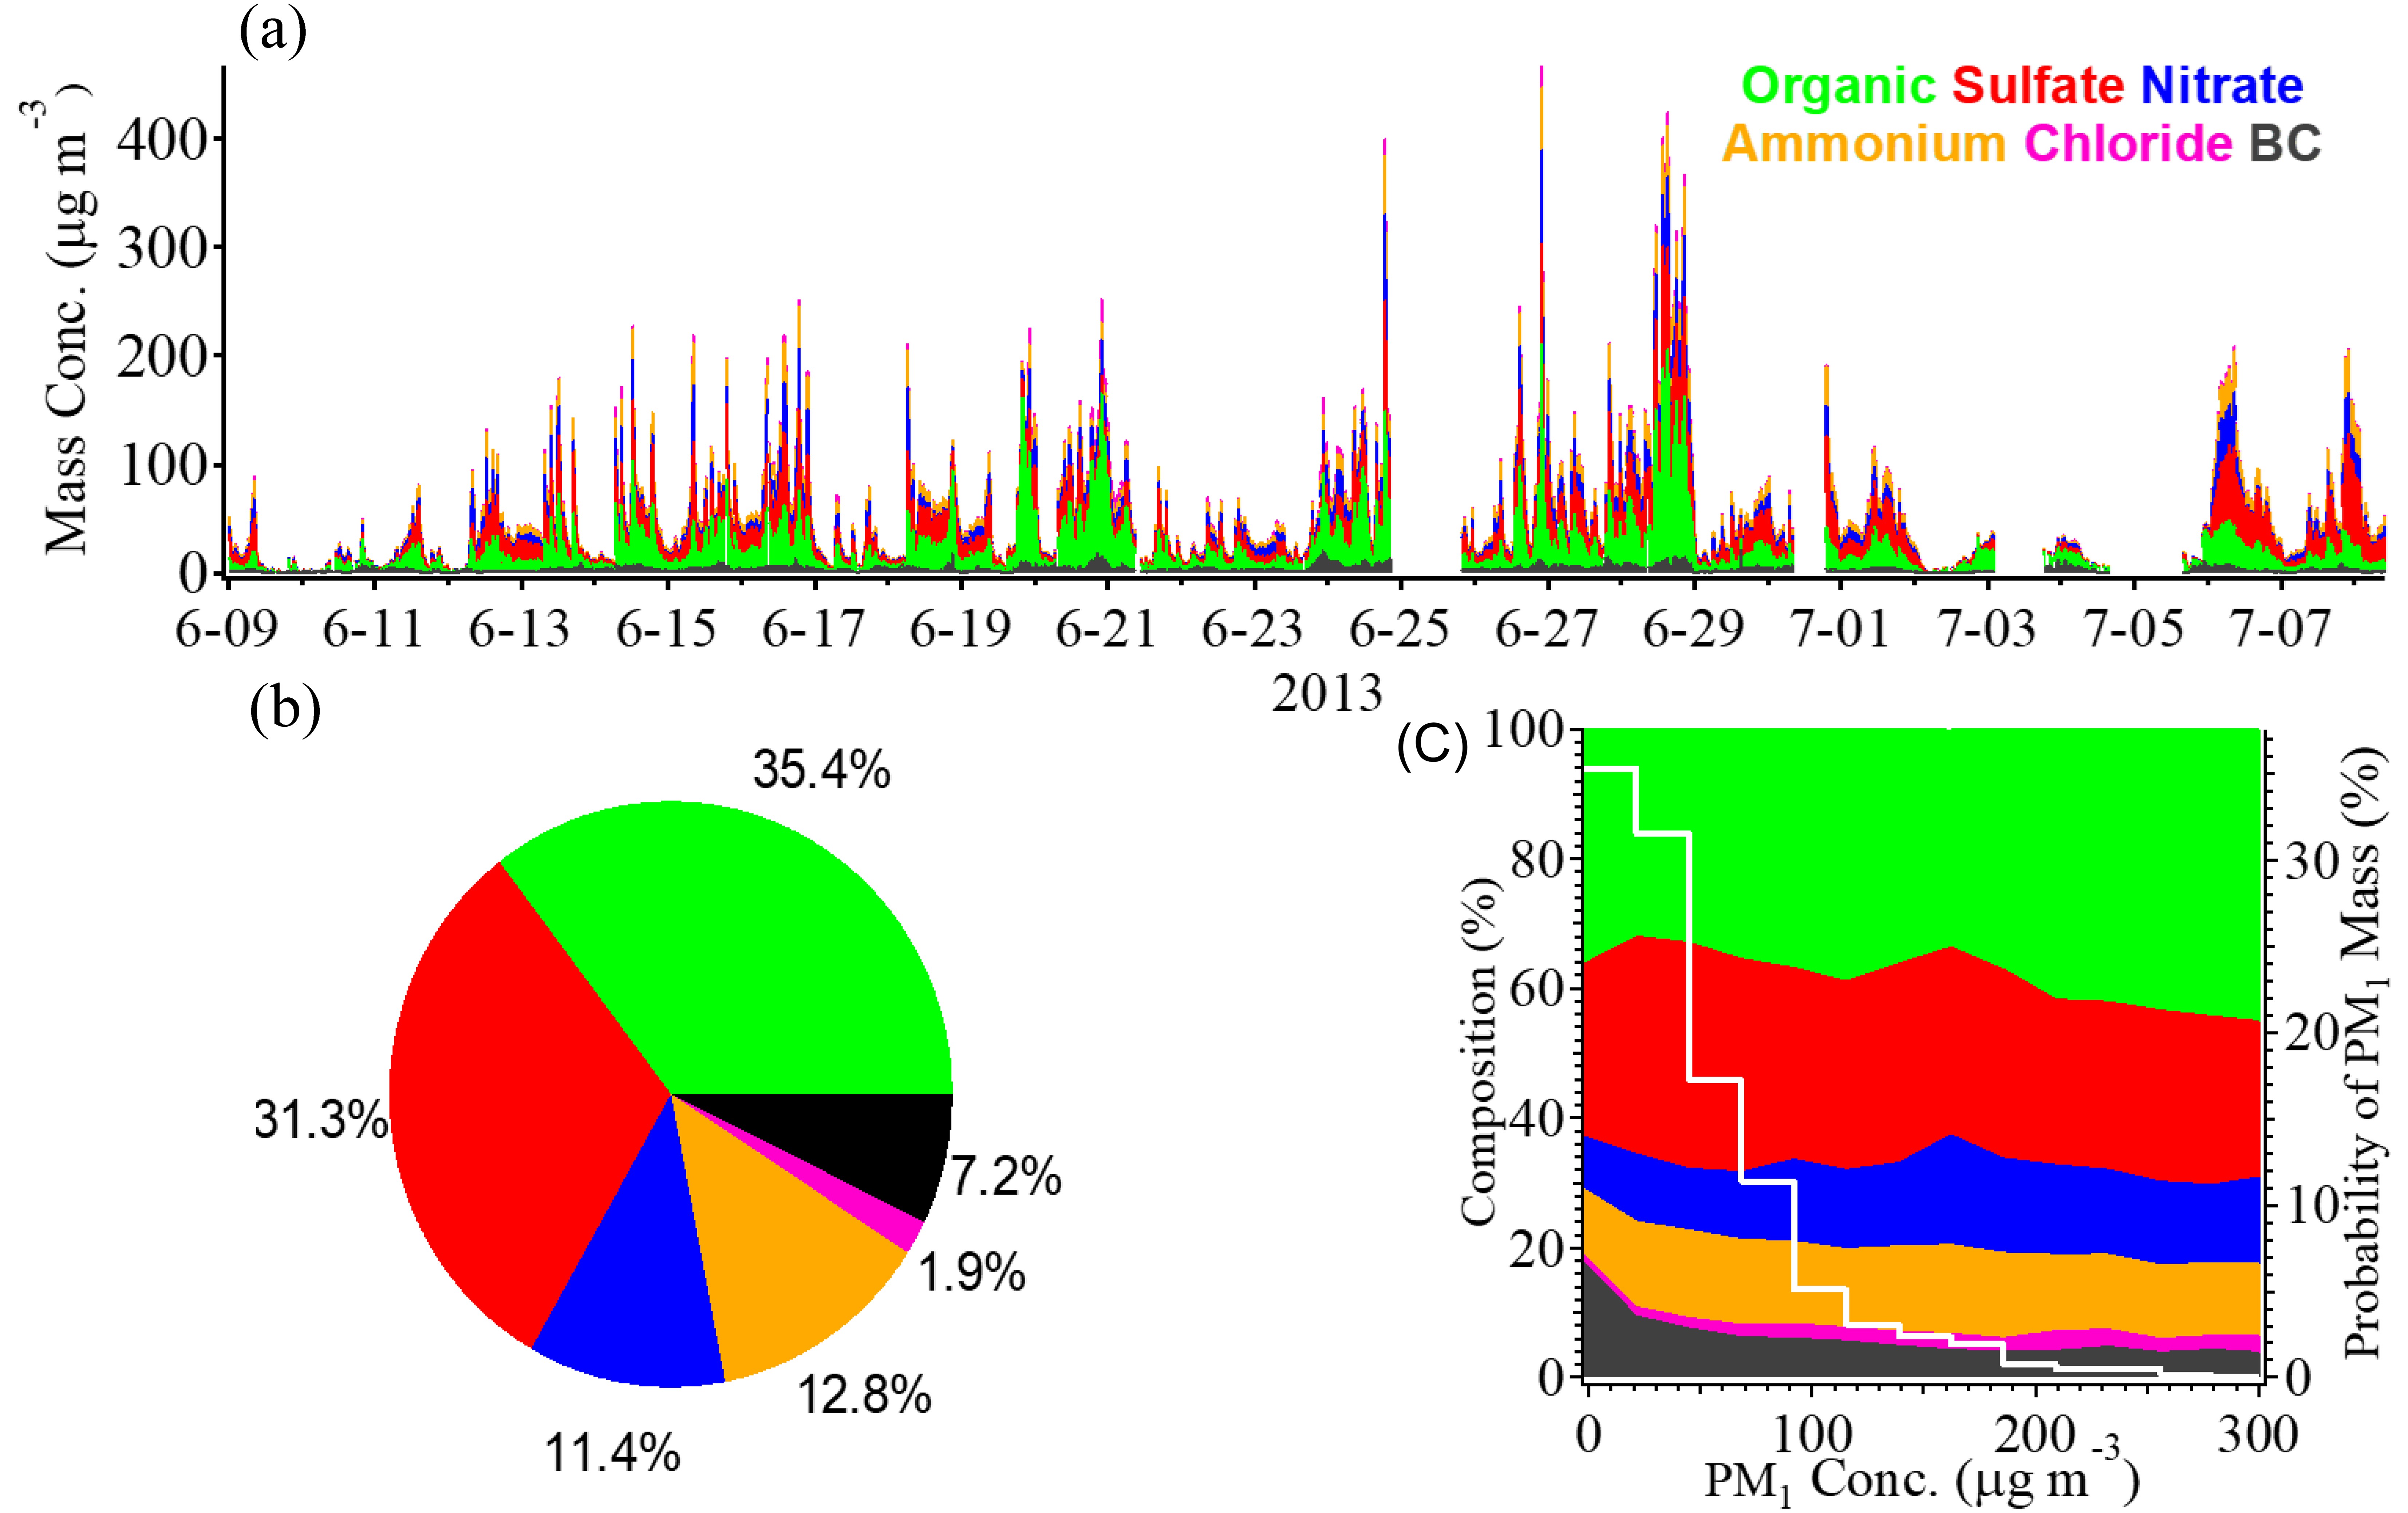
The daily average ambient PM1 mass concentration was 51.2 ± 48.0 µg m−3 (mean ± standard deviation), ranging from 1.5 to 466 µg m−3, shown in Fig. 2a. The biggest contributor of PM1 mass loading during summer 2013 was organic (35.4%), followed by sulfate (31.3%), ammonium (12.8%) and nitrate (11.4%) (Fig. 2b). Figure 2c indicates the variation in relative contributions of different species as a function of the total PM1 mass loading. We can see that organics show a continuously increasing fraction when PM1 was accumulating, implying OA played a more important role in extremely polluted periods. Therefore, we discuss the source apportionment of OA further below.
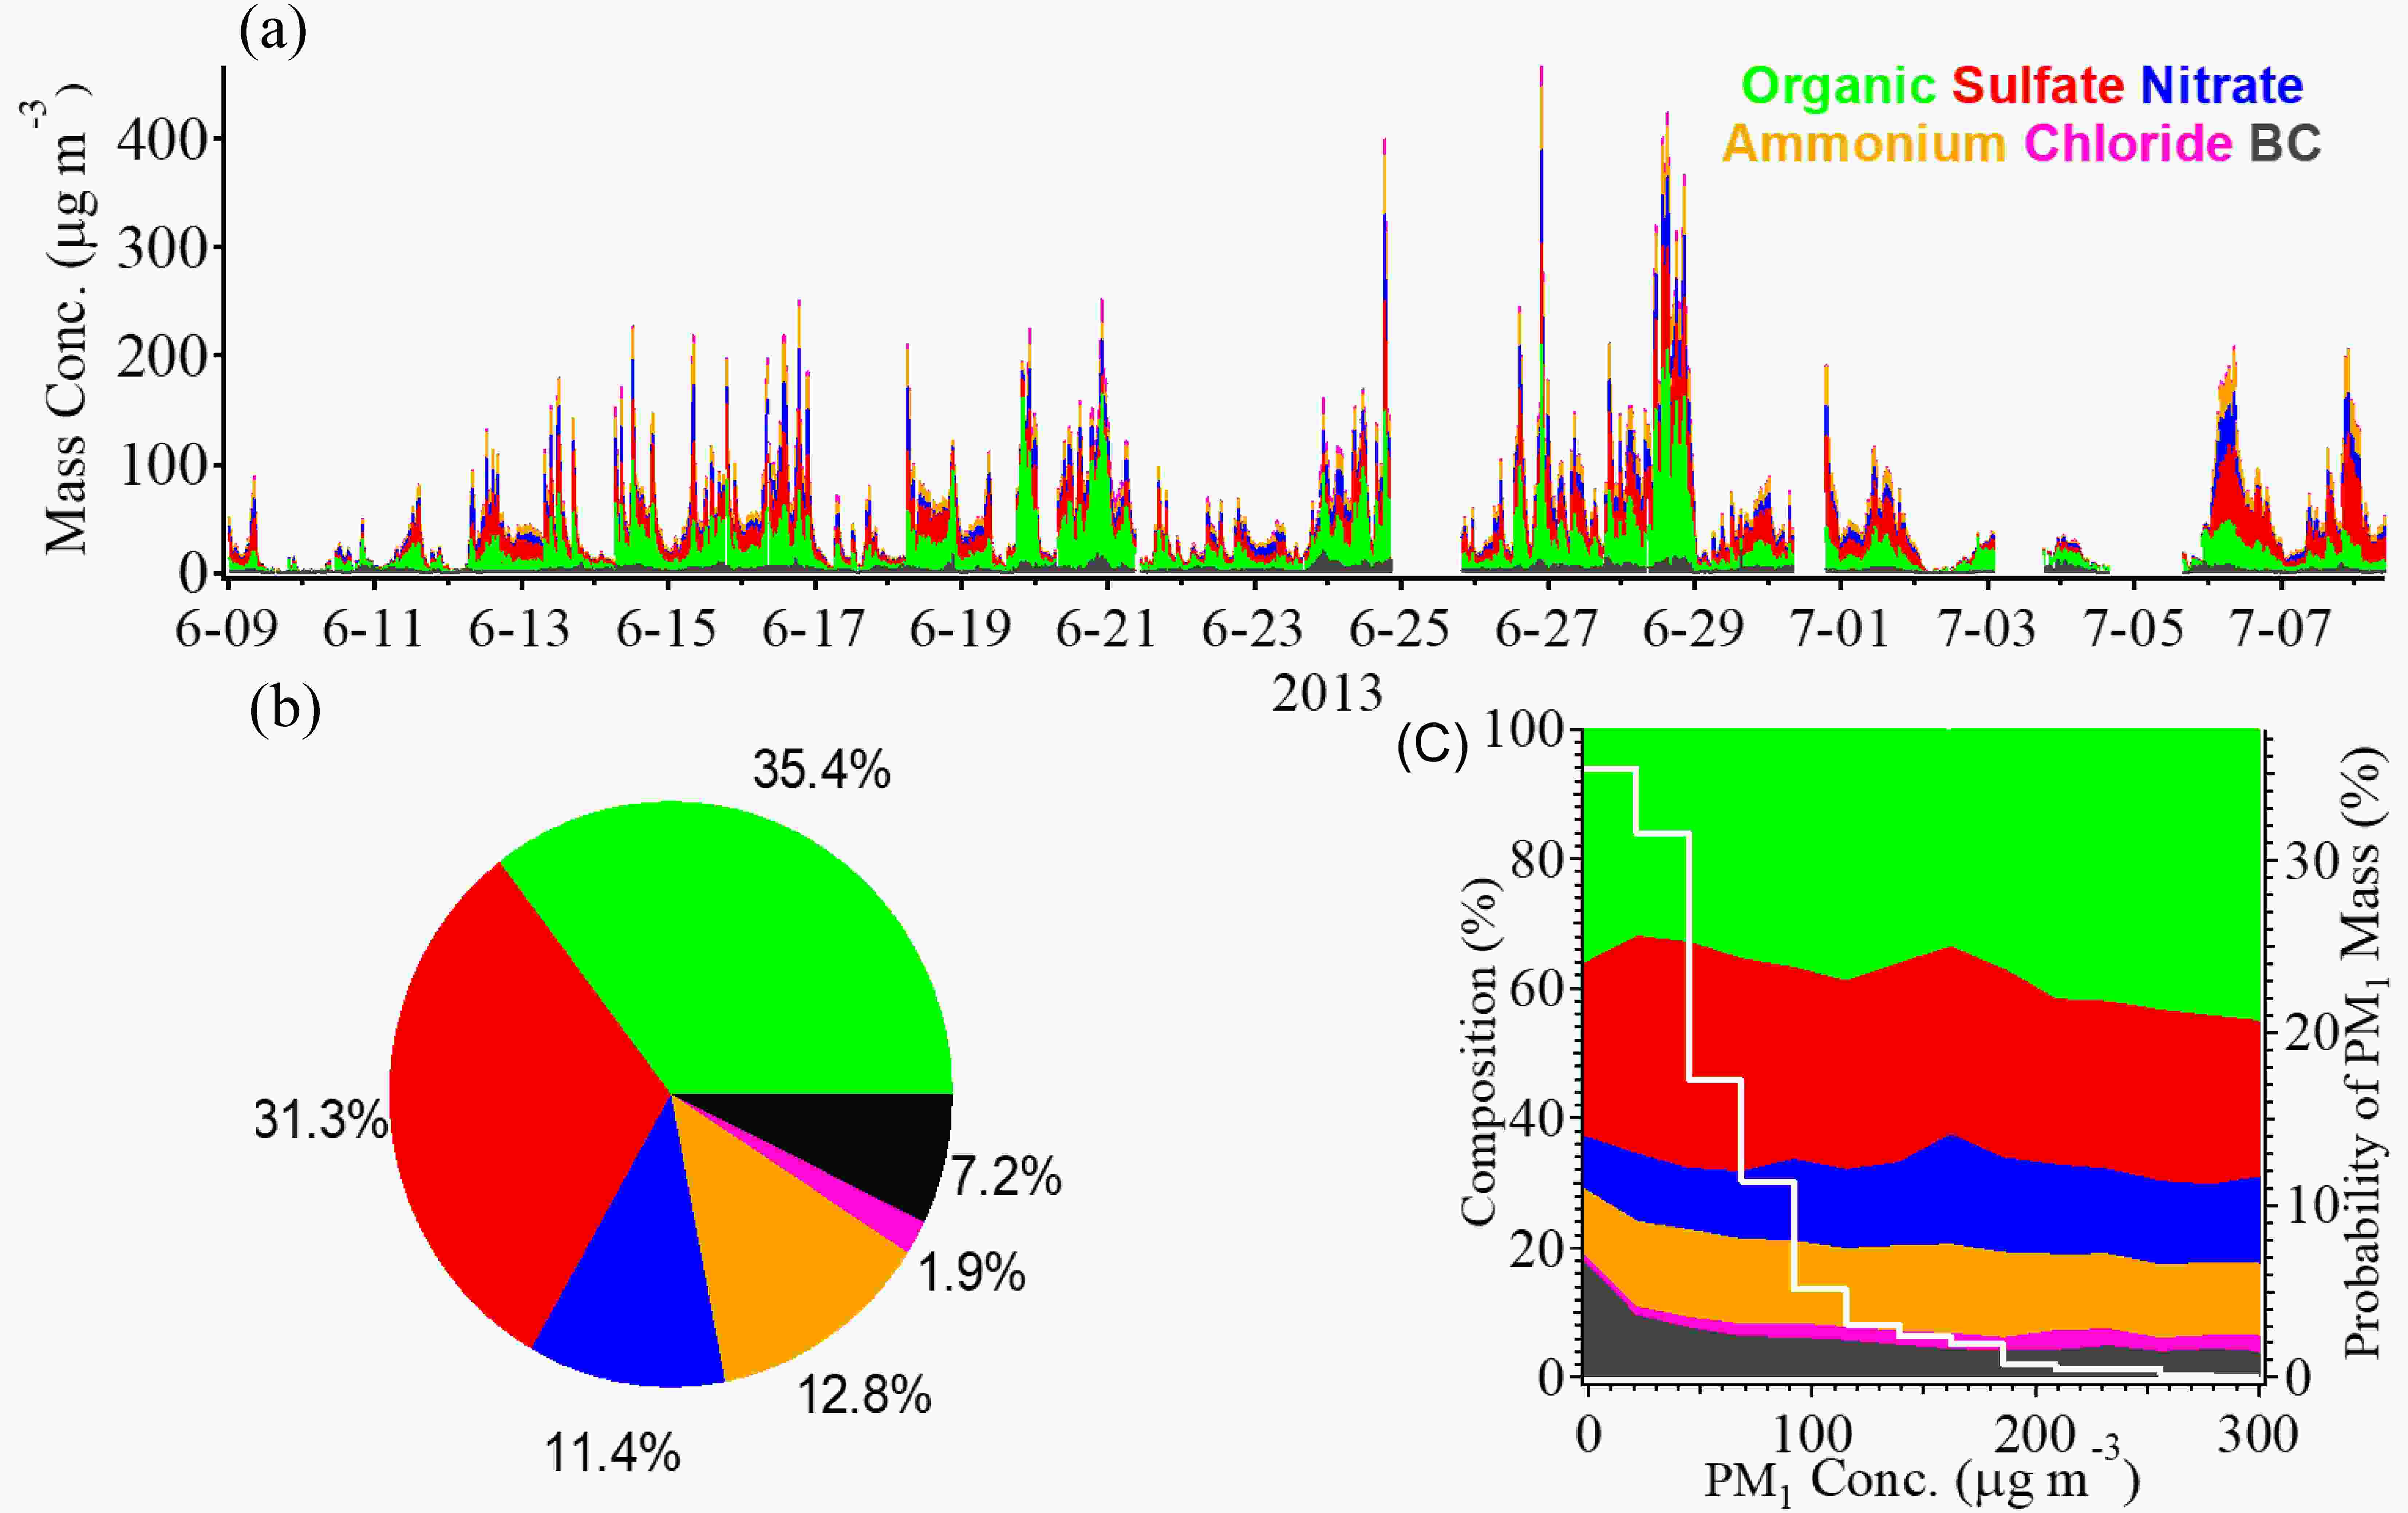
Figure 2. (a) Time series of PM1 species. (b) Pie chart showing the average chemical compositions. (c) Evolutions of PM1 compositions (left-hand axis) as a function of PM1 mass concentration, and the probability distributions of PM1 mass concentration (white line to the right-hand axis).
PMF analysis for OA resolved four OA factors: HOA, BBOA, LO-OOA and MO-OOA. The MS profiles and the mass contributions of each factor are shown in Figs. 3a and b. The mass fractions of HOA, BBOA, LO-OOA and MO-OOA were 18.4%, 29.4%, 21.4% and 30.8%, respectively. Note that biomass burning is a large contributor to OA due to the summer wheat harvest in the NCP region. BBOA was found to contribute 36%–39% to OA during harvest seasons in China (Zhang et al., 2015). The characteristics of the mass profile for each factor are distinct. HOA had an MS profile characterized by a large fraction of
${\rm{C}}_x{\rm{H}}_y^+ $ fragments and the lowest O:C ratio of 0.11, as well as the best correlation with BC emitted from traffic (BC_tr) (shown in Fig. S4 in the ESM), indicating its primary nature and high relevance to traffic emissions (Aiken et al., 2009; Huang et al., 2012, 2013; Mohr et al., 2012). The BBOA MS profile contained the highest f60 (ratio of the integrated signal at m/z 60 to the total organics signal) value of 0.9% compared to other factors (Schneider et al., 2006; Alfarra et al., 2007; Cubison et al., 2011). BBOA correlated best with acetonitrile (Fig. S4), which is a VOC tracer for biomass burning (Holzinger et al., 1999). However, its O:C ratio reaches up to 0.62. Therefore, BBOA in this case can be regarded as a factor that undergoes chemical aging from fresh emissions, considering the distance between the sampling site and biomass burning fields. Several studies have reported that fresh BBOA could be oxidized rapidly and converted to OOA in less than one day (Bougiatioti et al., 2014; Zhou et al., 2017). The MS profiles of two subtype OOAs were characterized by${\rm{C}}_x{\rm{H}}_y{\rm{O}}_z^+ $ ions, with different fractions of${\rm{CO}}_2^+ $ , and have better correlations with sulfate and nitrate (Fig. S4). The diurnal variations of the four OA factors are shown in Fig. 3c. HOA had two pronounced “rush hour” increases in the morning (starting from 0700 LST) and in the evening (starting from 1800 LST). The diurnal trend of BBOA had several peaks, which may suggest biomass burning events occurred frequently. LO-OOA and MO-OOA had a similar variation pattern, with an increase starting from 0700 LST and a decrease at 1800 LST, mainly driven by photochemical oxidation accumulation.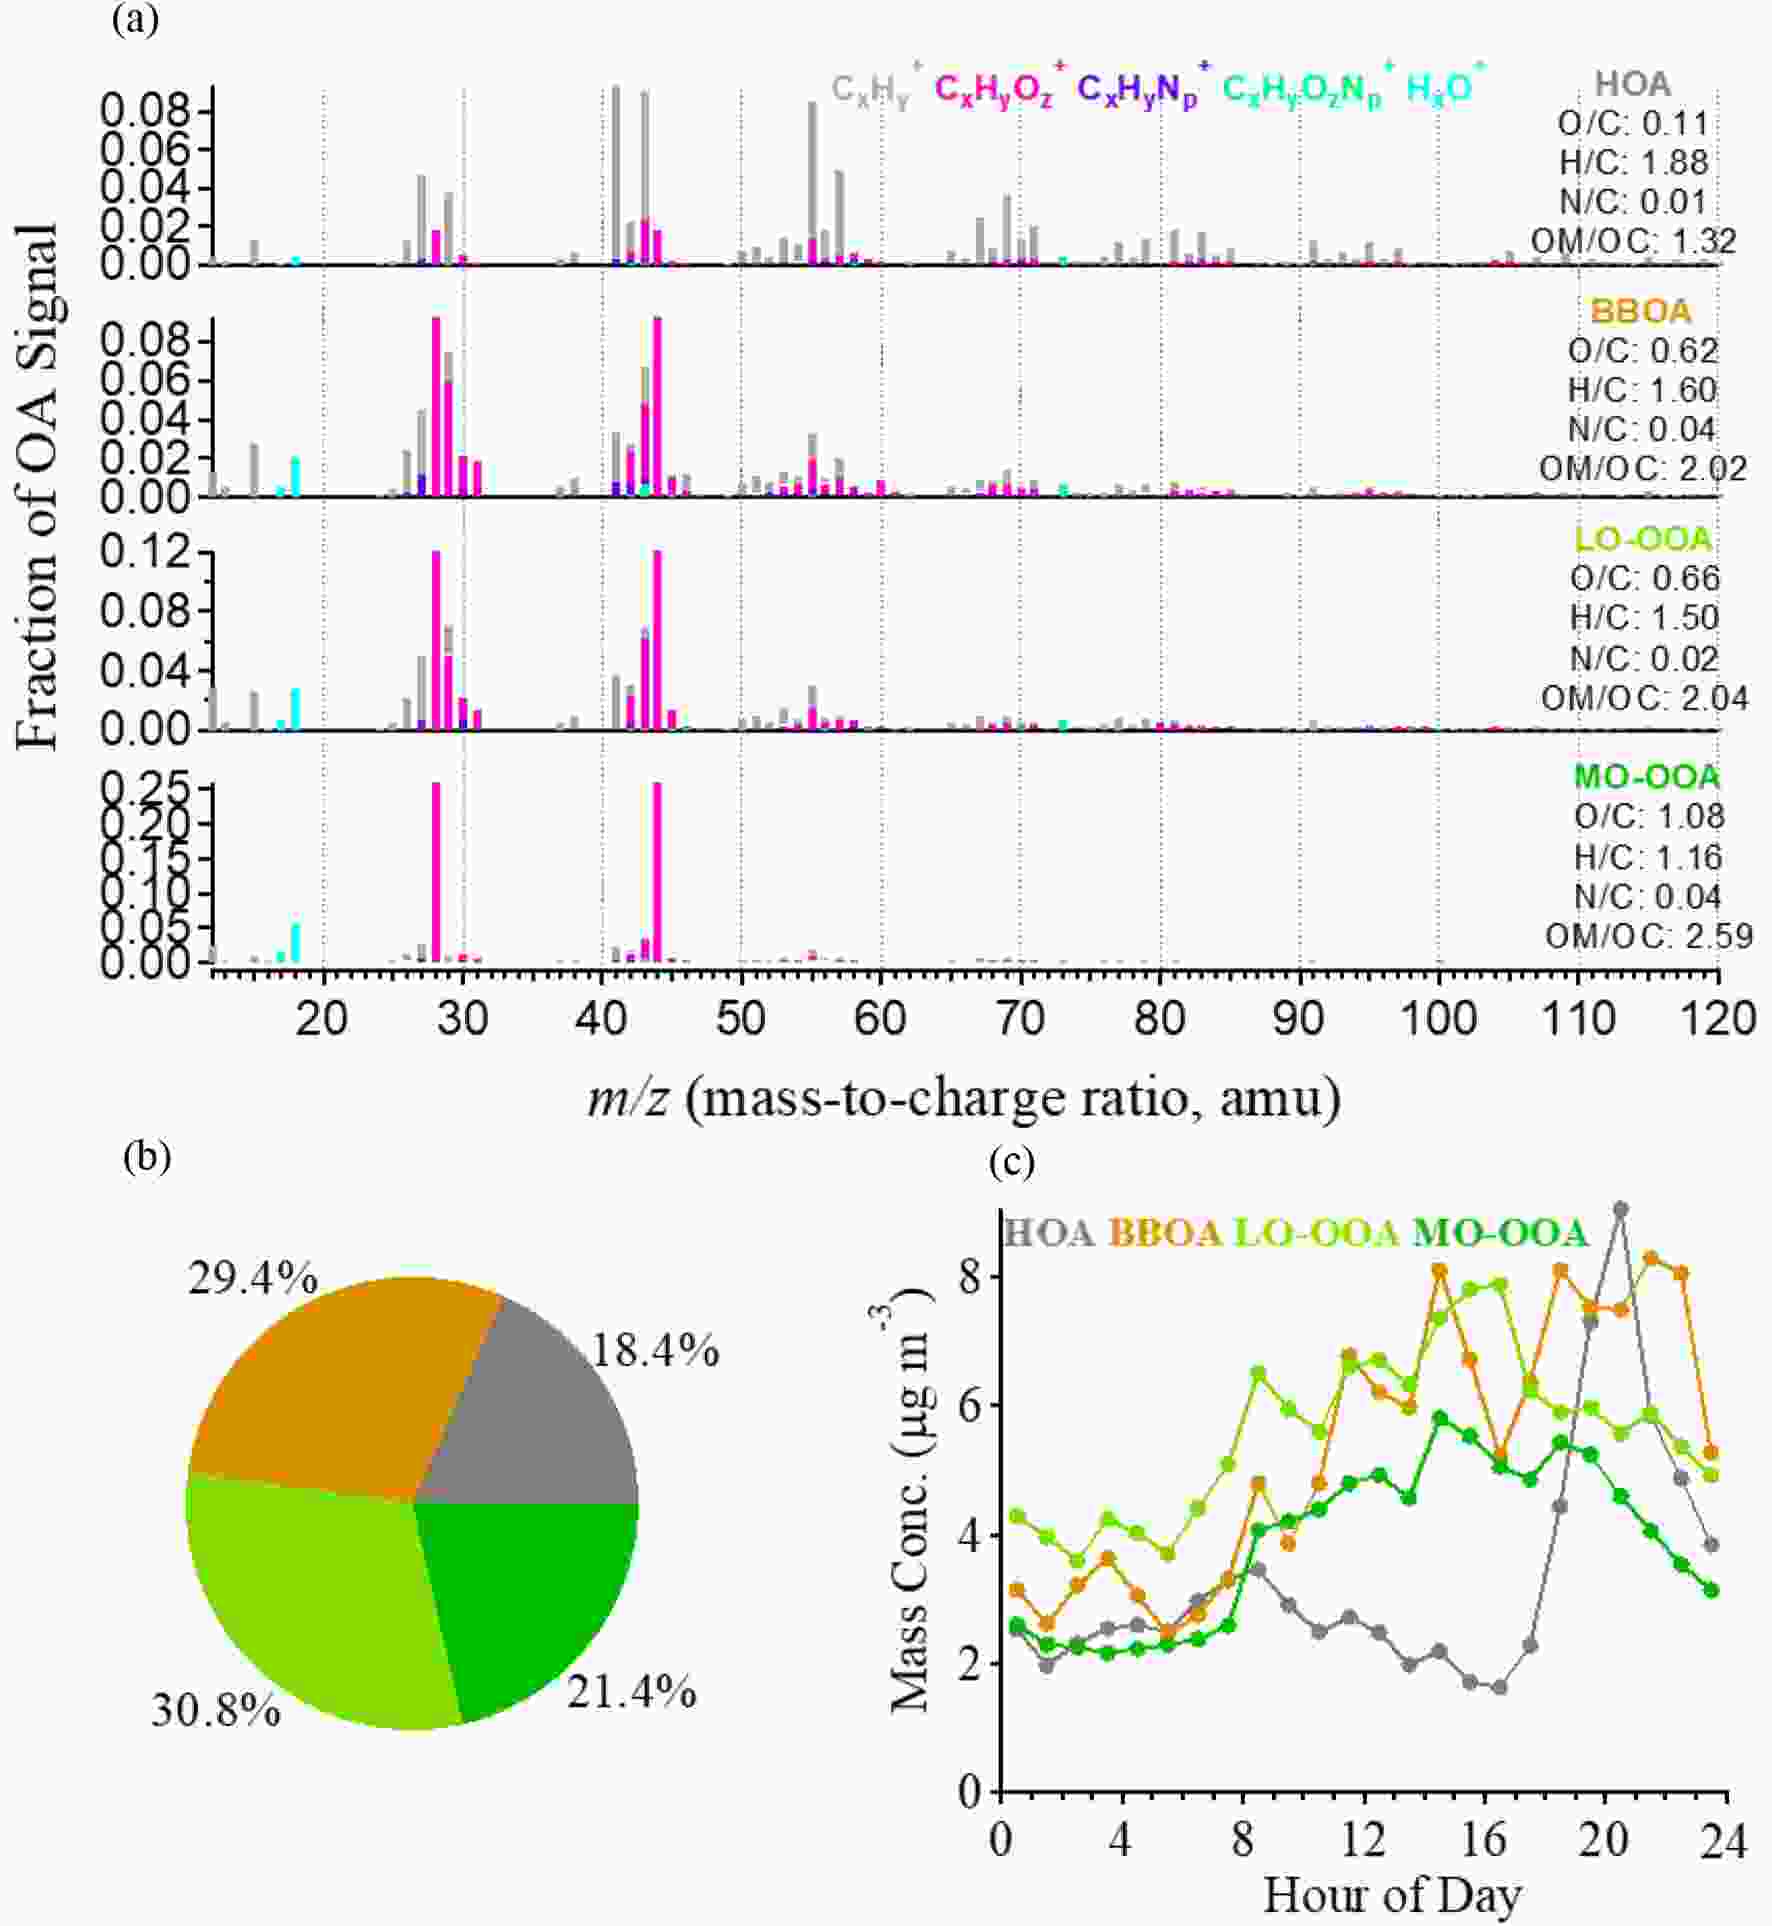
Figure 3. (a) MS profiles of the OA factors. (b) Pie chart showing the average OA components. (c) Diurnal patterns of the OA components.
-
We first applied the
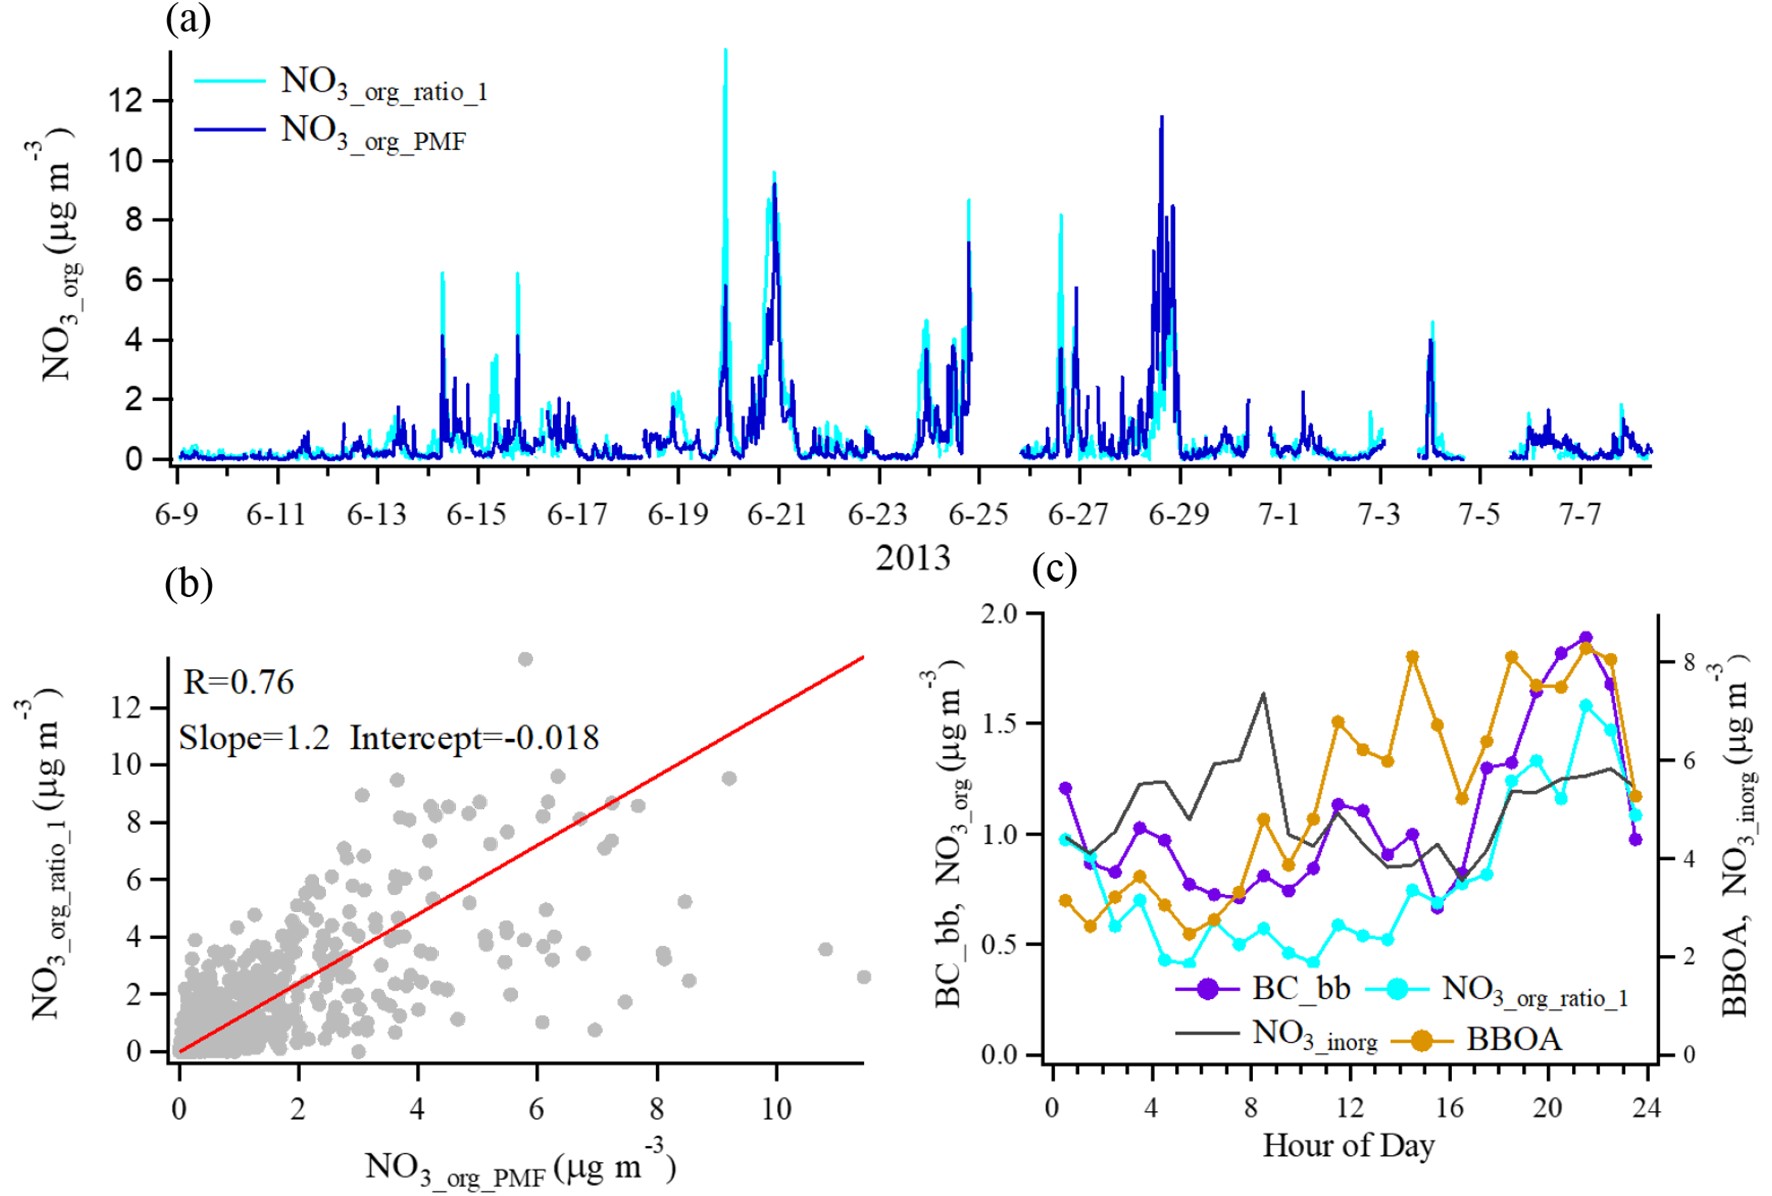
${\rm{NO}}_x^ + $ ratio method to estimate the concentration of nitrate functionality of ON (i.e., NO3,org). The concentration of NO3,org and the mass fraction of NO3,org in total measured NO3 (total NO3) are shown in Table 1. NO3,org accounted for 7.8% to 12% in NO3 by using the upper and lower bound values of RON/$R_{\rm{NH_4NO_3}}$ in the${\rm{NO}}_x^ + $ ratio method. Then, we used the PMF method to estimate NO3,org to verify the reliability of the results. The MS of the NIA factor is dominated by${\rm{NO}}_x^ + $ , and the mass fractions of${\rm{NO}}_x^ + $ > in HOA, BBOA, OOA were 11.8%, 85% and 3.2%, respectively (Fig S2). Figure 4a shows the time series of the NO3, org concentration calculated by the two methods and the computed correlation coefficient between them is good (r = 0.76), and the slope of the fitting line is 1.2, indicating that similar results were achieved. We further calculated that ON contributed 8.1%–19% to total OA assuming an average molecular weight of ON of 200–300 g mol−1 (Rollins et al., 2012), which is comparable to the fraction of ON in OA in Shenzhen during summertime (11%–25%) reported in Yu et al. (2019), indicating ON was the significant component of OA in the rural NCP atmosphere in summer.Values (a) NO+/NO2+ ratio method Lower Upper NO3,org (µg m−3)a 0.46 0.70 NO3,org/total NO3 0.078 0.12 (b) PMF method NO3,org (µg m−3)b 0.54 NO3,org/total NO3 0.093 Notes: aNO3, org for upper bound is denoted as NO3_org_ratio_1, and NO3, org for lower bound is denoted as NO3_org_ratio_2; bNO3, org estimated using the PMF method is denoted as NO3_org_PMF. Table 1. Summary of ON estimations using the NO+/NO2+ ratio method and the PMF method.

Figure 4. (a) Time series of NO3, org concentration estimated by the NO+/NO2+ ratio method and PMF method for the study period. (b) Correlations between NO3_org_ratio_1 and NO3_org_PMF. (c) Diurnal trends of NO3_org_ratio_1, BC_bb (left-hand axis), inorganic nitrates (NO3_inorg) and BBOA (right-hand axis).
Figure 5a shows scatterplots of NO3_org_ratio_1 versus OA factors resolved by PMF analysis, BC from biomass burning (BC_bb), and BC from traffic emissions (BC_tr). We find that NO3_org_ratio_1 had good correlations with BBOA (r = 0.71) and BC_bb (r = 0.67), but a poor correlation with LO-OOA (r = 0.20), which is quite different from the results in other regions that show the highest ON correlation with LO-OOA (Xu et al., 2015a, b; Yu et al., 2019). Particulate ON formation is found to be through photooxidation of biogenic VOCs in the presence of NOx in the daytime (Teng et al., 2015, 2017) and NO3 radicals oxidation of biogenic VOCs at night (Fry et al., 2013; Ayres et al., 2015; Boyd et al., 2015; Xu et al., 2015b; Lee et al., 2016; Yu et al., 2019). However, recent studies show that NO3 radicals reacting with typical VOCs in biomass burning plumes could also produce a substantial fraction of particulate ON (Ahern et al., 2019; Joo et al., 2019). The good correlation between ON and biomass burning aerosols in this study indicate the possible existence of different formation mechanisms of ON relevant to biomass burning plumes in the real atmosphere. Here, we further compared the diurnal variation of NO3_org_ratio, inorganic nitrates (NO3_inorg), BBOA and BC_bb in Fig. 4c. First, the result shows that NO3_org_ratio had a quite different diurnal variation from NO3_inorg, implying that ON has been well separated from inorganic nitrates in this study. Furthermore, NO3_org_ratio increased by nearly two times from 1700 LST to 2200 LST and maintained a relative high mass loading level during the nighttime. We note that there were two similar peaks at 2100–2200 LST and 0300–0400 LST in the NO3_org_ratio, BBOA and BC_bb variation trends. A number of studies have proposed that nighttime biomass burning contributes to OA compositions in field campaigns, in particular with some specific ON species formation (Allan et al., 2010; Iinuma et al., 2010, 2016; Mohr et al., 2013). However, these studies did not describe the influence of biomass burning on overall ON. In order to better understand ON in this case, we will attempt to characterize it from the property of volatility in the following section.
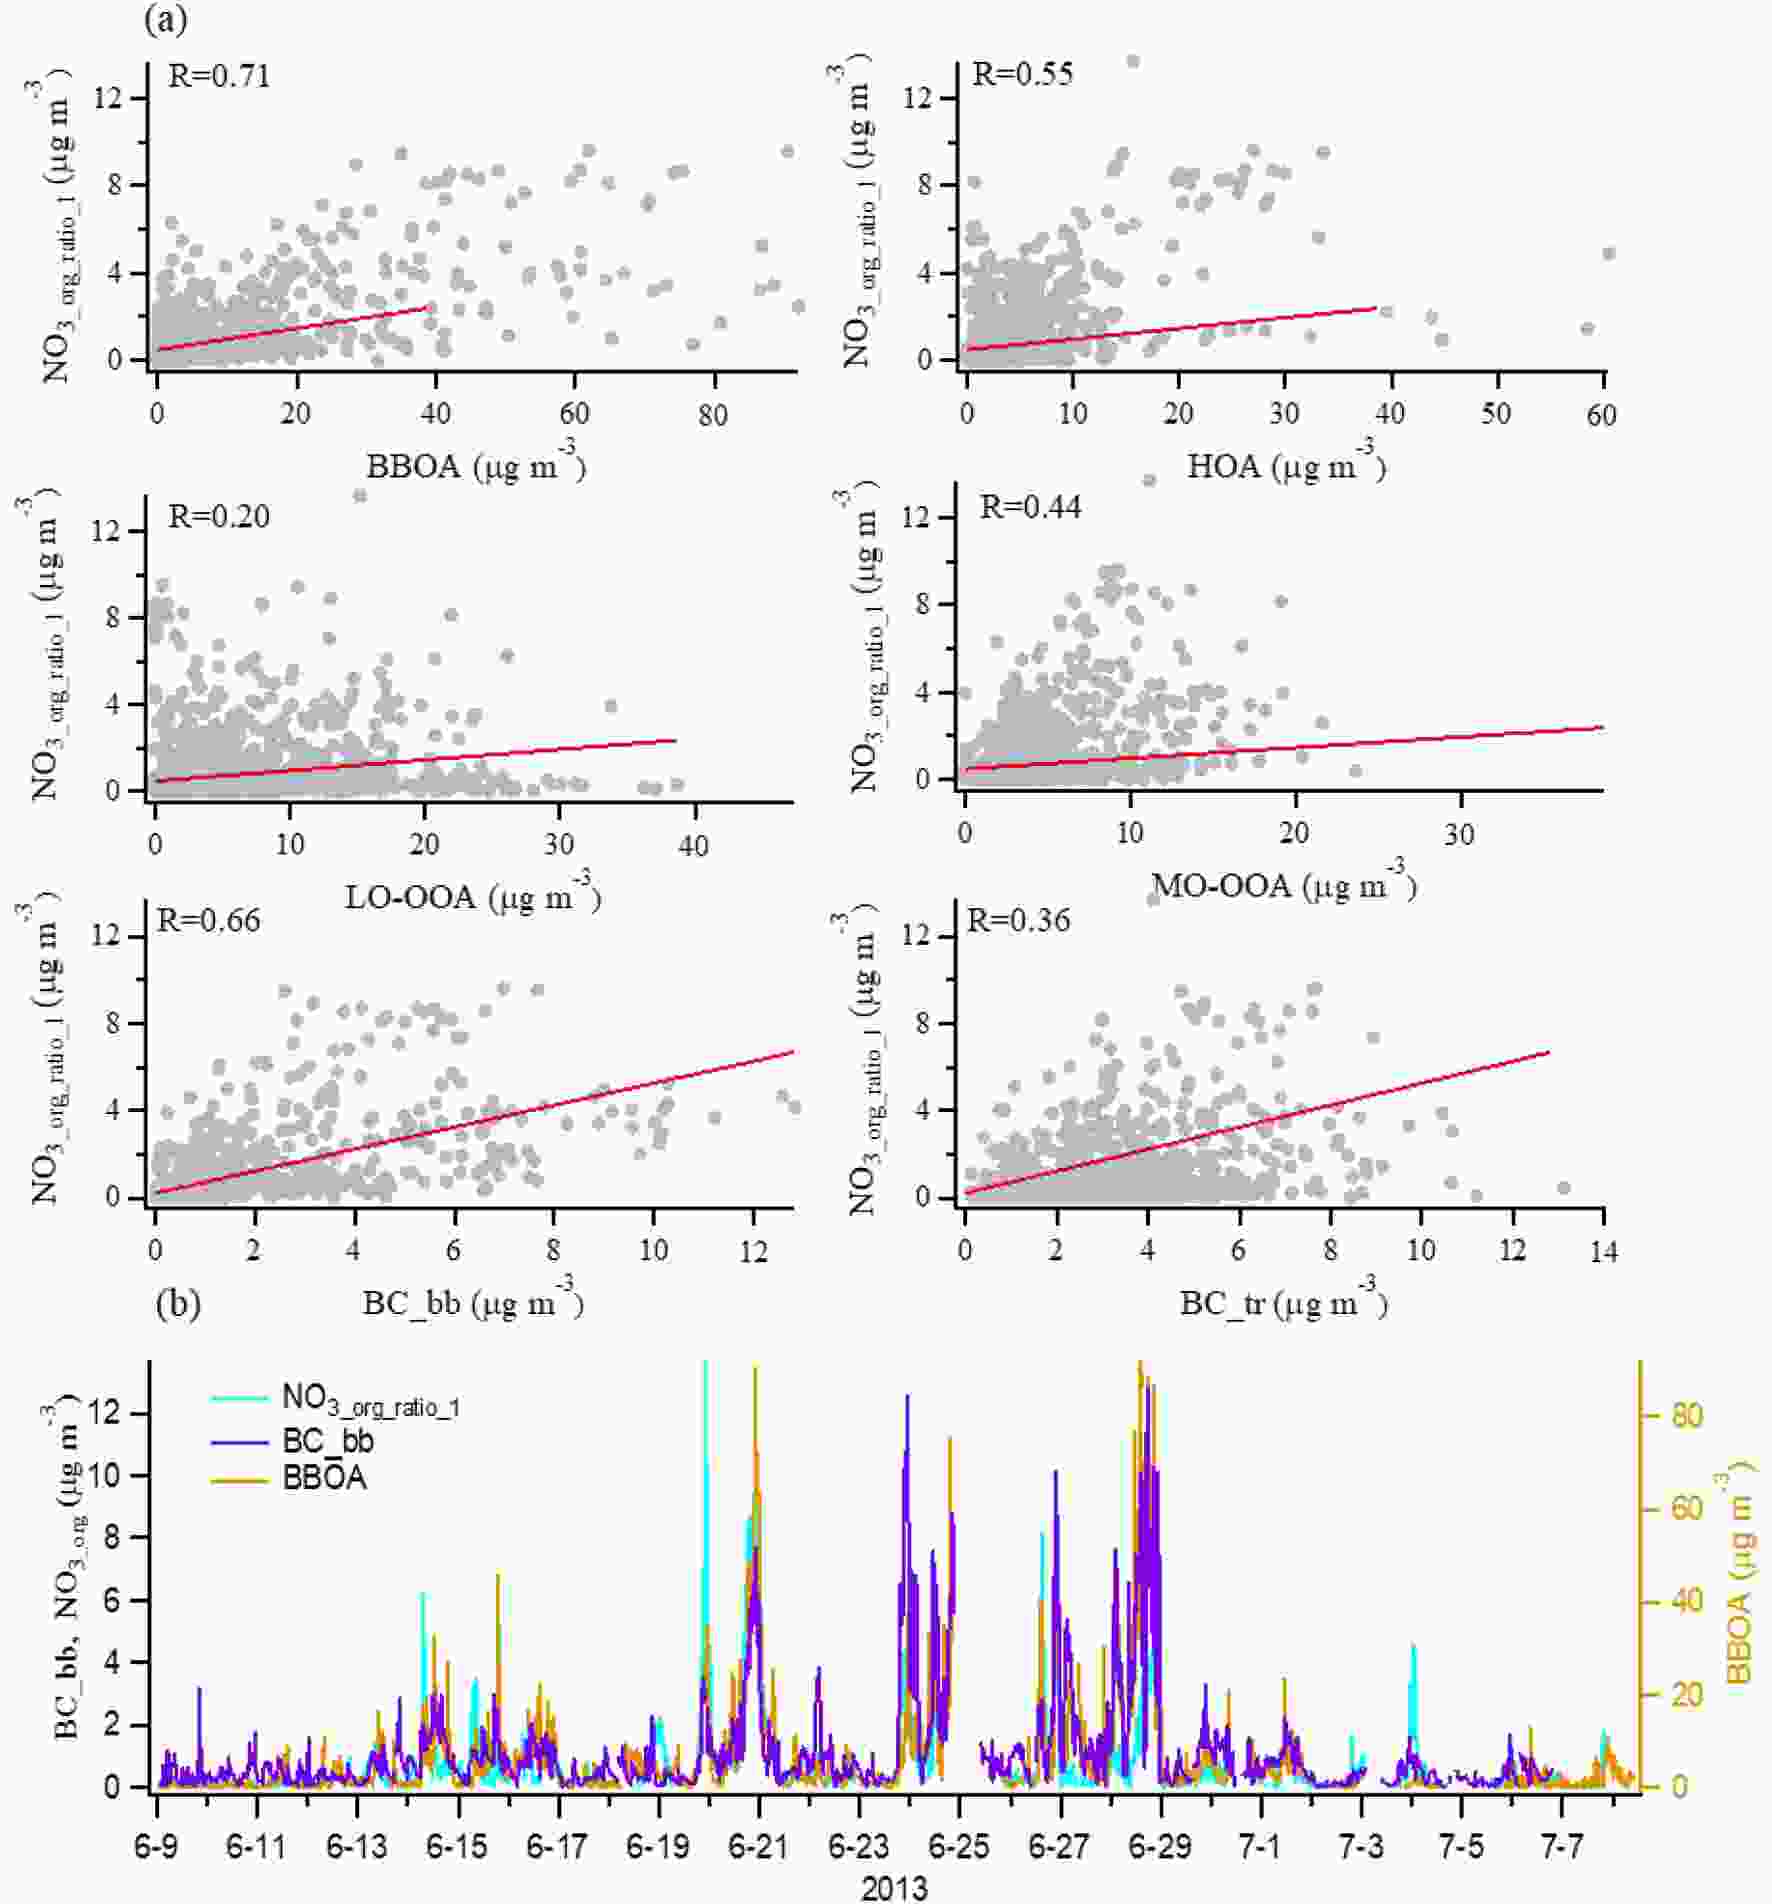
Figure 5. (a) Correlations of NO3, org1_ratio with OA factors resolved by PMF, BC from biomass burning (BC_bb), and BC from traffic emissions (BC_tr). (b) Time series of NO3, org concentration estimated by the NO+/
${\rm{NO}}_2^+ $ ratio method (NO3_org), BC_bb (left axis) and BBOA (right-hand axis). -
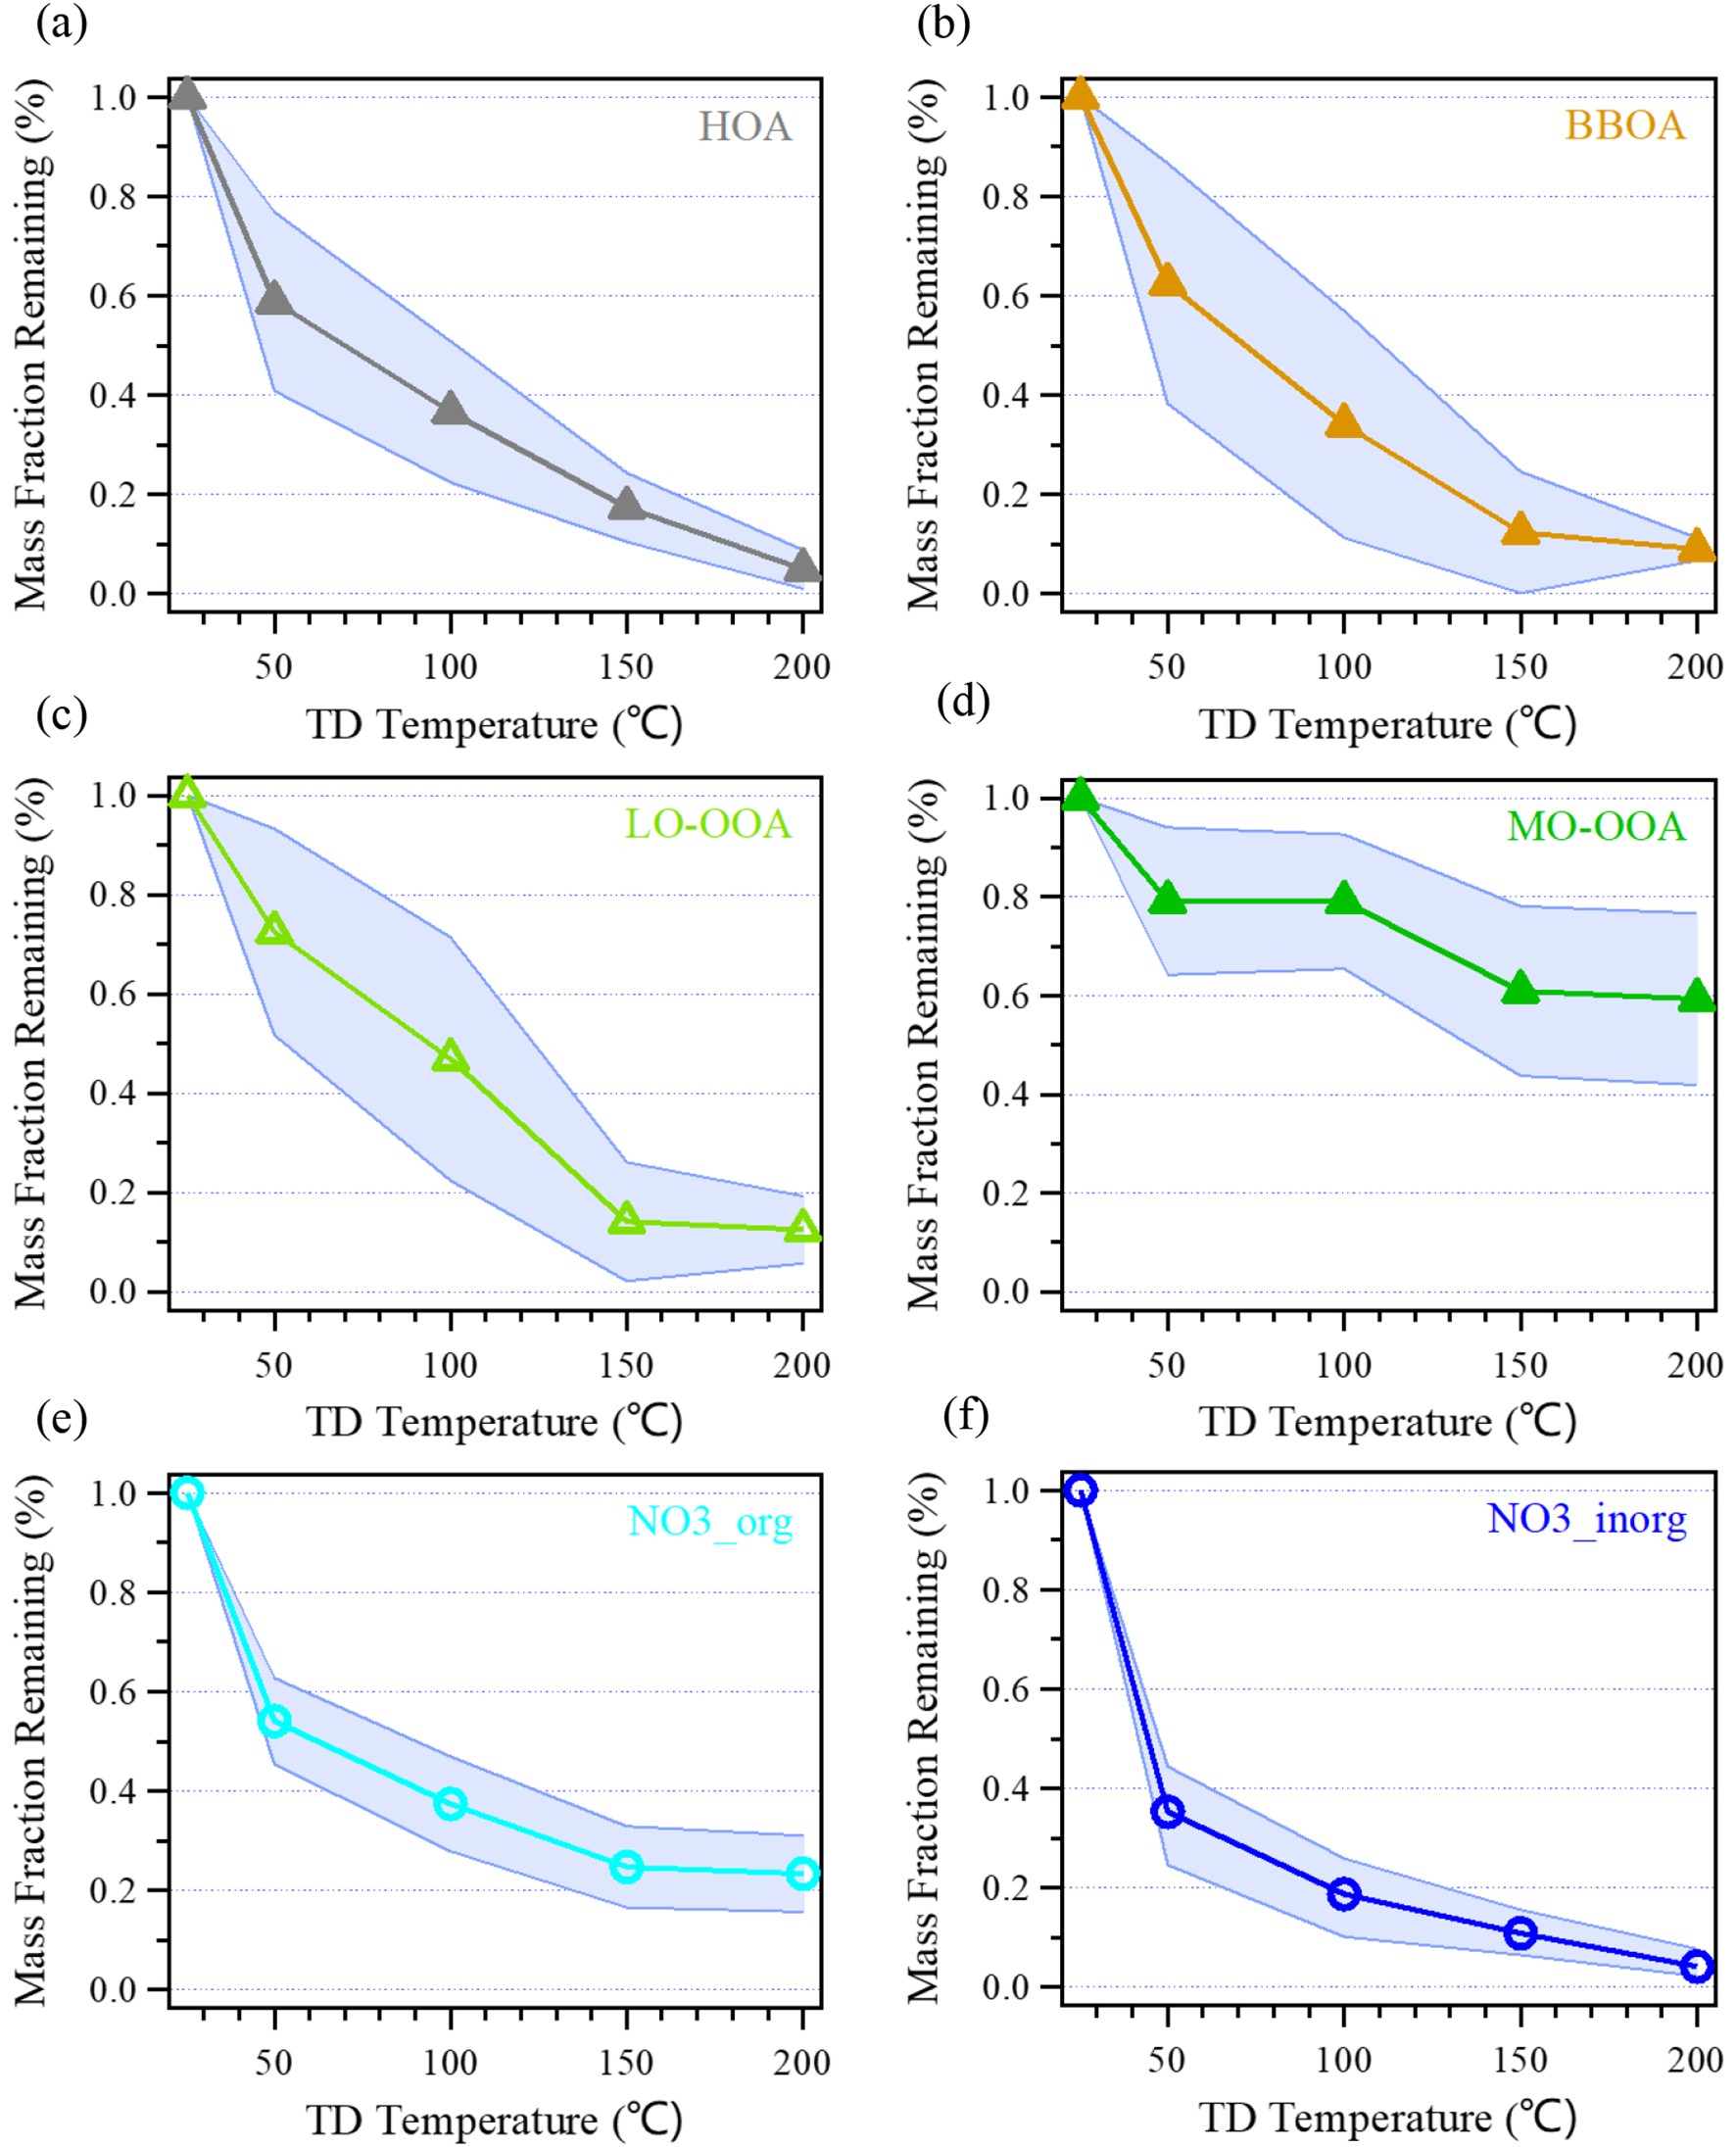
The mass fraction remaining (MFR) of different OA factors resolved by PMF analysis, ON and inorganic nitrates are shown in Fig. 6. MFRs varied differently among different OA factors. The MFR of HOA was 0.58 at 50°C and decreased by 1.70 % °C−1; then the evaporation rate slowed down from 50°C to 200°C with a nearly constant rate of 0.35% °C−1, and only 4.9% was left at 200°C. BBOA had a similar MFR variation to HOA, with a fast decrease from ambient temperature to 50°C (evaporation rate was 2% °C−1) and a slower decrease from 50°C to 200°C (0.5% °C−1 for 50°C–150°C and 0.006% °C−1 for 150°C–200°C), but much wider standard deviation (SD) areas at temperature stages, suggesting BBOA contained more compounds that have different evaporation, which agrees with the BBOA factor in this case consisting of fresh and aged ones. The MFR of LO-OOA at 50°C was 0.72, lower than that of MO-OOA (0.80) and with increased temperature, and the MFR of MO-OOA decreased much slower than LO-OOA and other OA factors, both implying that MO-OOA was less volatile compared to other OA factors. The volatility sequence of OA factors in this study was HOA > BBOA > LO-OOA > MO-OOA, determined by the MFR at 50°C (Cao et al., 2018, 2019; Xu et al., 2019).
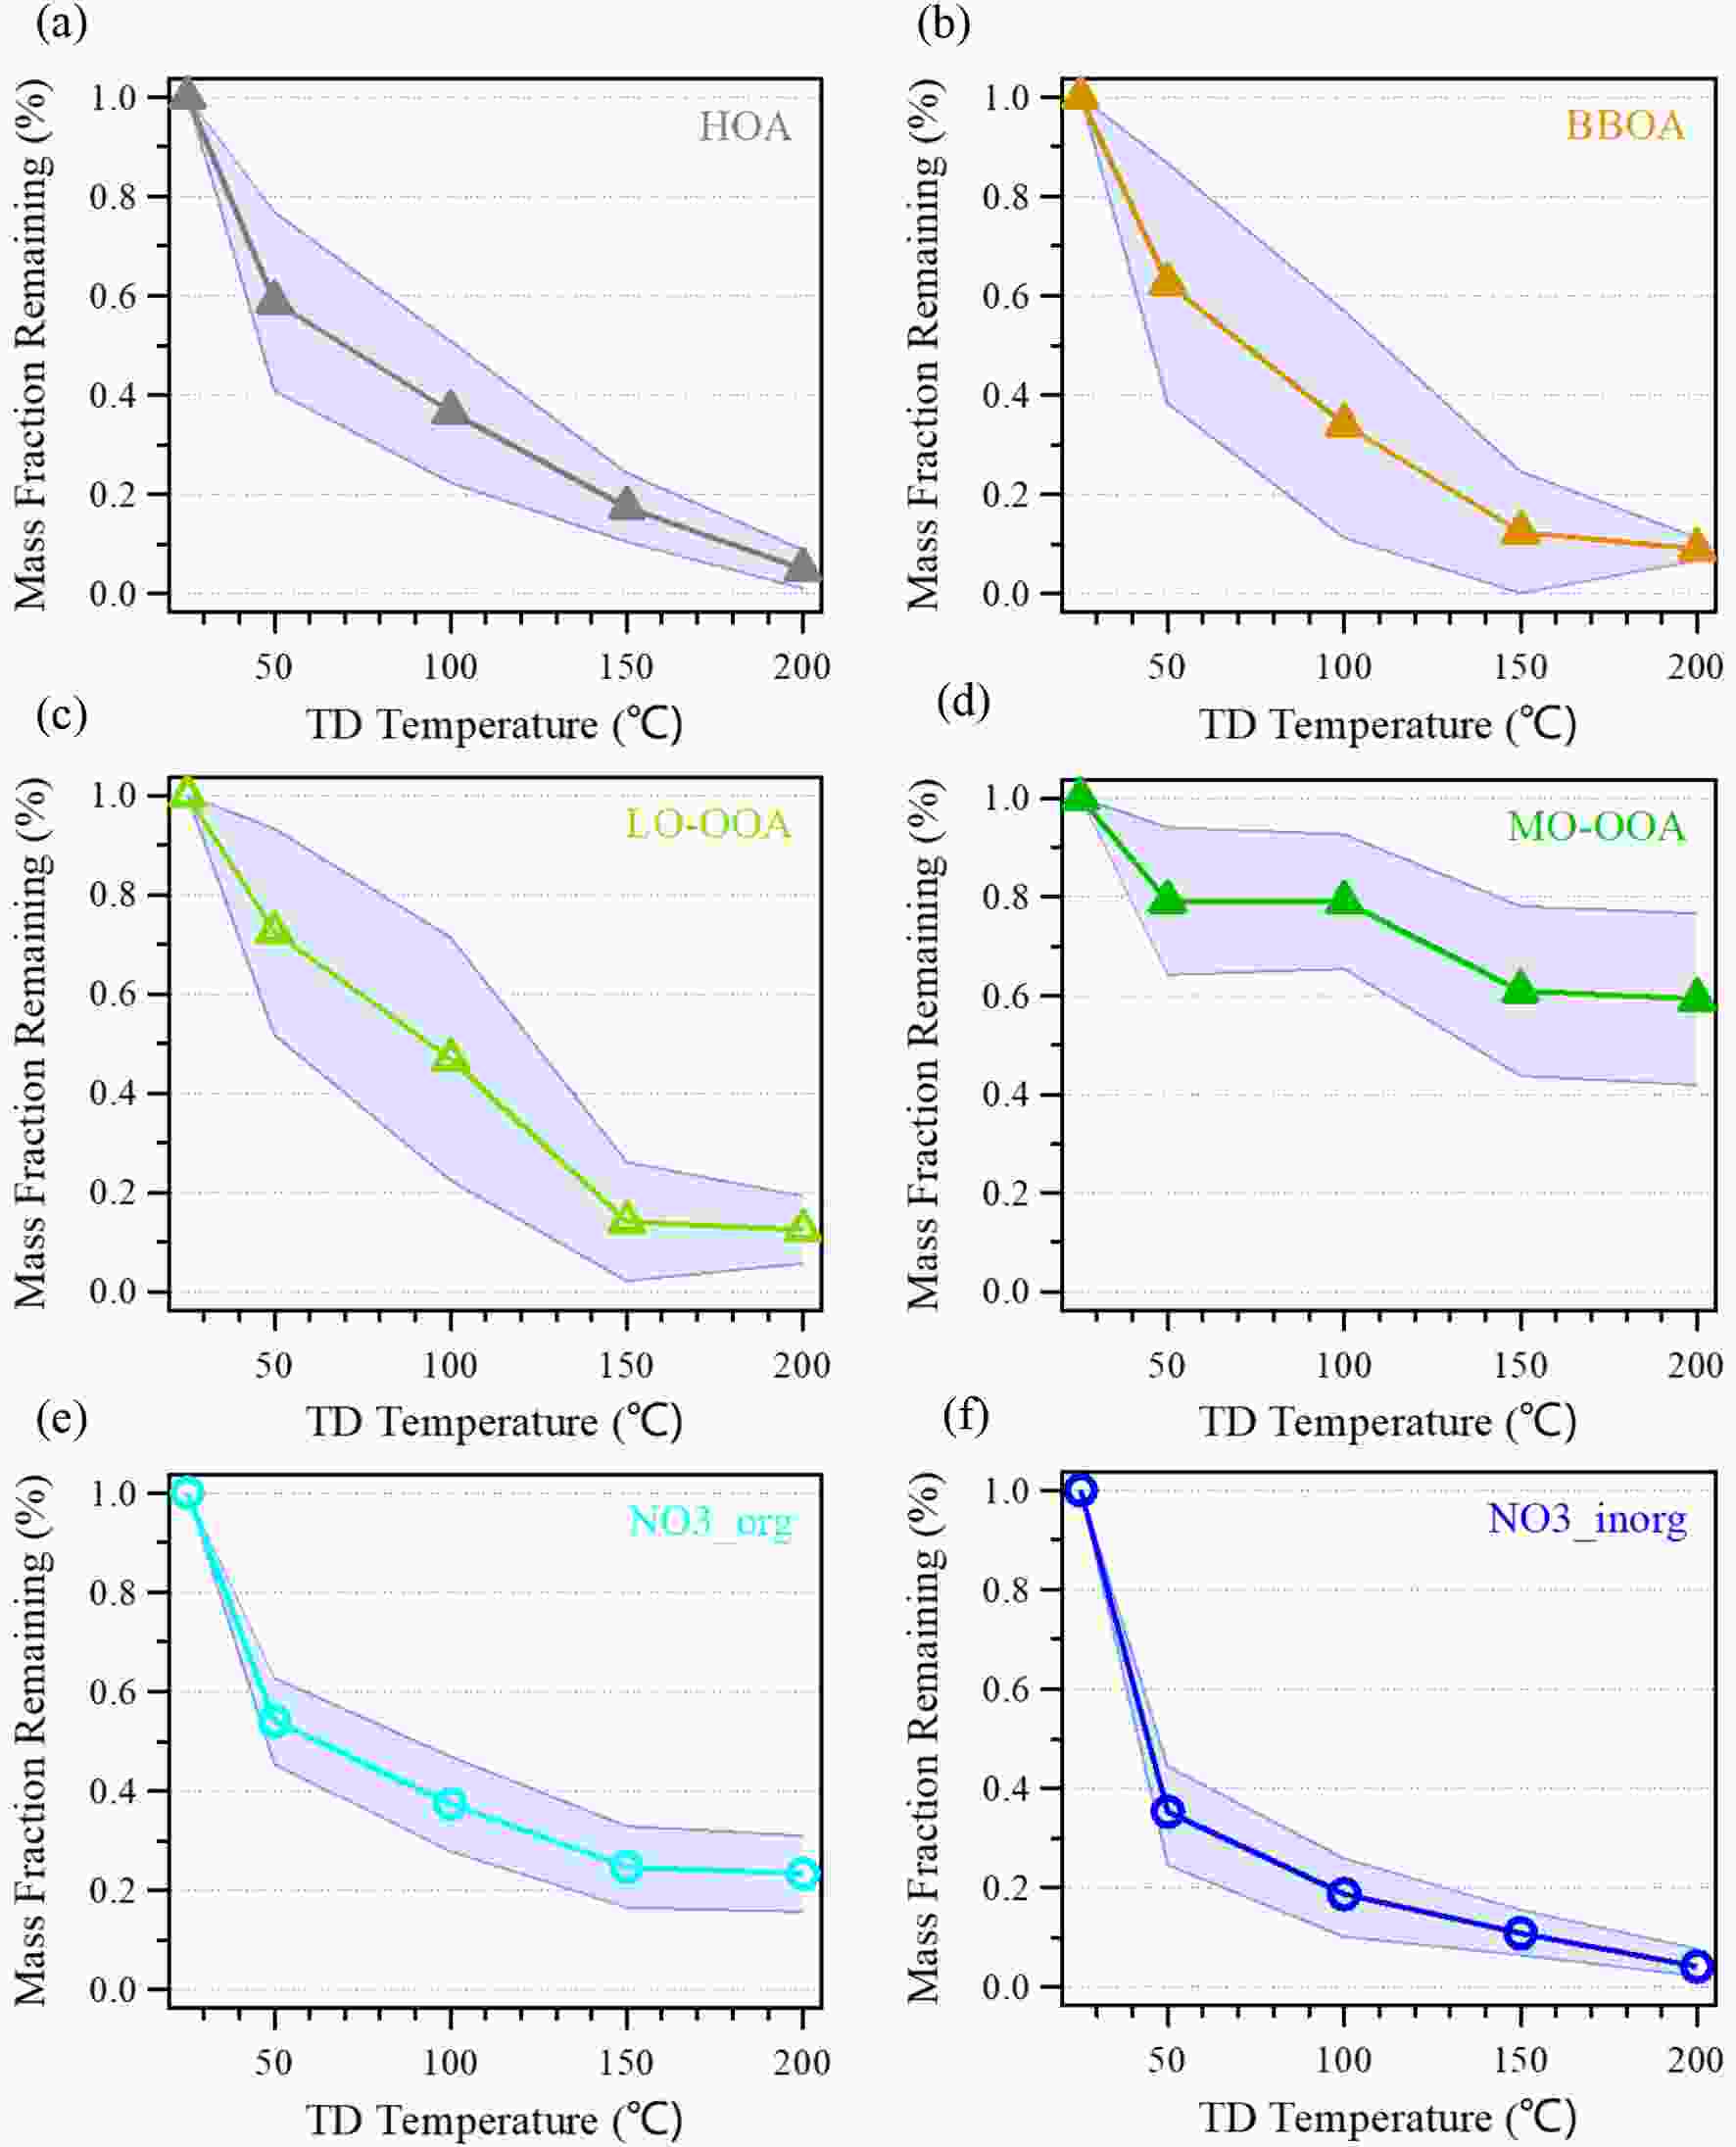
Figure 6. Variation of the average MFR of OA factors (a–d) resolved by PMF, ON (NO3_org) (e), and inorganic nitrates (f) with the TD temperature. The shaded regions indicate the average ± SD.
In order to investigate the volatility of ON, we estimated the mass concentration of NO3,org at different temperatures using the
${\rm{NO}}_x^+ $ ratio and PMF method as well. Table S1 lists the estimated results and comparison coefficients between the two methods. The good correlation coefficients (R = 0.68–0.75) between the two methods validate the ON estimated results. Based on that, the MFR of ON were further calculated, as shown in Fig. 6f. The MFR of ON was 0.54 at 50°C, 0.37 at 100°C, 0.24 at 150°C, and 0.22 at 200°C. Compared to OA factors, ON evaporate faster from ambient temperature to 50°C (1.86% °C−1), implying a volatile feature for primary emissions. However, ON show a much slower decrease than all OA factors except MO-OOA from 50°C–150°C (0.29% °C−1) and remained flat from 150°C−200°C, suggesting about 20% of the fraction of ON were very difficult to volatilize. In addition, we calculated the MFR for inorganic nitrates, which evaporate much faster than ON and only 4.1% of inorganic nitrates were left at 200°C, confirming the semi-volatility property of inorganic nitrates. Our result provides direct evidence that a considerable remaining fraction of nitrate measured by AMS at high temperature is due to the influence of ON contained within (Cao et al., 2018, 2019; Xu et al., 2019). It should be noted that a laboratory study reported that pure ammonium nitrates can completely evaporate at 50°C (Huffman et al., 2009b), but 35.3% of inorganic nitrates were left at 50°C in our study. The discrepancy may be due to the significant influence of the composition differences and mixing state of ambient aerosols, which has been proposed in previous studies (Huffman et al., 2009b; Nie et al., 2017), and the inaccuracy of the estimation of ON. Therefore, more related studies need to be conducted in the future.
3.1. PM1 composition and OA source apportionment


3.2. Estimating results of ON and correlation analysis


3.3. Volatility characteristics of OA factors and ON

-
In this study, we characterized submicron aerosols based on TD-HR-AMS measurements at a rural site in NCP during summer 2013. The mean PM1 mass loading was 51.2 ± 48.0 µg m−3, with organics as the most abundant species. Sulfate, ammonium, nitrate, BC and chloride contributed 31.3%, 12.8%, 11.4%, 7.2% and 1.9% to the total PM1, respectively. PMF analysis of OA identified four OA factors: HOA, BBOA, LO-OOA and MO-OOA. Among them, two subtype OOAs accounted for 52.2% of OA, and BBOA also made a substantial contribution (29.4%) to OA. In terms of volatility, HOA was the most volatile species (MFR was 0.58 at 50°C), followed by BBOA (0.62), LO-OOA (0.72) and MO-OOA (0.80).
The ON were quantified by two methods, i.e.,
${\rm{NO}}_x^+ $ ratio method and PMF method. Both methods provided reasonable and comparable results in abstracting ON functionality from total measured nitrates. The nitrate functionality of ON (i.e., NO3,org) accounted for about 7.8%–12% of total measured nitrates (NO3). Furthermore, the mass concentration of ON was estimated assuming the molecular weight of bulk ON, and they contributed a substantial fraction (8.1%–19%) to total OA. ON show good correlations with BBOA (r = 0.71) and BC from biomass burning (r = 0.67) but poor correlation with LO-OOA (r = 0.20). High levels of biomass burning emissions at night and several similar nighttime peaks of ON, BBOA and BC from biomass burning in diurnal trends suggest ON were influenced by biomass burning. The volatility analysis shows that the overall ON were more volatile than other OA factors at 50°C. Based on these results, we can conclude that particulate ON in rural NCP areas are more relevant to primary emissions, with biomass burning as the most likely source responsible.Acknowledgements. This work was supported by the Ministry of Science and Technology of China (Grant No. 2017YFC0210004), the National Natural Science Foundation of China (Grant No. 91744202), and the China Postdoctoral Science Foundation and Guangdong Province Outstanding Young Talents for the International Education & Development Plan: Post-Doctoral Program.
Electronic supplementary material: Supplementary material is available in the online version of this article at
https://doi.org/10.1007/s00376-020-0127-2 .

 AAS Website
 AAS WeChat