


 DownLoad:


HTML
-
Global climate models (GCMs) are the most important tool available for simulating climate, for investigating the response of climate to various forcings, and for making predictions and projections of future climate (Flato et al., 2013). They are built on the laws of physics, fluid dynamics, chemistry, and biology. Despite the broad application of GCMs in simulating the past, present, and future climate, there are still inadequacies due to the lack of and/or insufficient representation of key processes (e.g., carbon and nitrogen cycles), parameterizations for physical processes (e.g., convection and cloud microphysics), and methods to numerically solve the dynamical equations. Therefore, it is of great necessity to evaluate the skill of GCMs for modern climate from various aspects to gain faith in their applications for the climate system.
With the continuous development of GCMs, their fidelity has been extensively assessed—not least in China, which has received much attention owing to its sensitivity to climate change. Under the framework of phase 3 of the Coupled Model Intercomparison Project (CMIP3; Meehl et al., 2007) and phase 5 (CMIP5; Taylor et al., 2012), considerable efforts have been devoted to evaluating GCMs in simulating the climatic mean and variability of China (Chen, 2014; Chen and Frauenfeld, 2014a, b; Gu et al., 2015; Kusunoki and Arakawa, 2015; Jiang et al., 2016; Zhang et al., 2016; Chen et al., 2017; Fu and Lu, 2017; Wu et al., 2017; Xu et al., 2017; Salunke et al., 2019). It has been found that GCMs can successfully capture the large-scale geographical distributions of fundamental variables over China, but they also have common deficiencies such as topography-related cold biases and exaggerated precipitation (Xu et al., 2007; Chen and Frauenfeld, 2014a, b; Jiang et al., 2016; Chen et al., 2017; Salunke et al., 2019). Furthermore, the superiority of the CMIP5 over the CMIP3 GCMs has been revealed in certain respects (Chen and Frauenfeld, 2014a, b; Kusunoki and Arakawa, 2015; Jiang et al., 2016), although most conclusions are based on a direct comparison among multiple GCMs from the two generations without considering whether they come from the same modeling group. Additionally, it has been proposed that the horizontal resolution affects the ability of GCMs to a certain degree (Gu et al., 2015; Kusunoki and Arakawa, 2015; Jiang et al., 2016).
Recently, a newly coordinated set of climate experiments were performed in the framework of phase 6 of CMIP (CMIP6; Eyring et al., 2016). The CMIP6 GCMs differ from the previous generations in many aspects, including finer spatial resolutions, improved parameterizations for cloud microphysical processes, and the inclusion of additional processes and components in the Earth system such as biogeochemical cycles and ice sheets (Eyring et al., 2019). Assessments of single CMIP6 GCMs in reproducing the present climate over China have been preliminarily carried out (Wu et al., 2019), but the skill of multiple CMIP6 GCMs remains to be investigated. Moreover, whether or not GCMs have improved from CMIP5 to CMIP6 remains unclear. Therefore, it is of great interest to systematically assess the performance of CMIP6 GCMs for the climate over China against observations and compare it with the previous generation of GCMs.
The overall aim of this paper is to reveal the ability of available CMIP6 GCMs in simulating the climate over China, and compare their performance with that of CMIP5 GCMs. The specific questions to address are: (1) To what extent can the CMIP6 GCMs reproduce the observed climatology and year-to-year climate variability over China and monsoon over East Asia? (2) Do the CMIP6 GCMs have advantages over their CMIP5 predecessors? (3) What is the influence of horizontal resolution?
-
The model data come from the historical experiments of 49 CMIP5 and 43 CMIP6 GCMs for an all-forcing simulation of the recent past. Based on data availability, the results of 92 and 91 GCMs are used for analysis of temperature and precipitation, and 71 and 90 GCMs for winter (December–January–February; DJF) wind at 10 m and summer (June–July–August; JJA) wind at 850 hPa, respectively. Basic information on the models and experiments is given in Table 1. Further details can be found in Taylor et al. (2012) and Eyring et al. (2016) and are available online at
https://www.wcrp-climate.org/wgcm-cmip. Model ID Country or
UnionAtmospheric
resolutionIntegration
periodWind at
10 mWind at
850 hPa1 ACCESS1.0 Australia 1.875° × 1.25°, L38 1850–2005 Yes Yes 2 ACCESS1.3 Australia 1.875° × 1.25°, L38 1850–2005 Yes Yes 3 BCC-CSM1.1 China ~2.8° × 2.8°, L26 1850–2012 Yes Yes 4 BCC-CSM1.1(m) China 1.125° × ~1.1°, L26 1850–2012 Yes Yes 5 BNU-ESM China ~2.8° × 2.8°, L26 1850–2005 Yes Yes 6 CanCM4 Canada ~2.8° × 2.8°, L35 1961–2005 − Yes 7 CanESM2 Canada ~2.8° × 2.8°, L35 1850–2005 Yes Yes 8 CCSM4 USA 1.25° × ~0.9°, L26 1850–2005 − Yes 9 CESM1(BGC) USA 1.25° × ~0.9°, L26 1850–2005 − Yes 10 CESM1(CAM5) USA 1.25° × ~0.9°, L26 1850–2005 − Yes 11 CESM1(FASTCHEM) USA 1.25° × ~0.9°, L26 1850–2005 − Yes 12 CESM1(WACCM) USA 2.5° × ~1.9°, L23 1850–2005 − Yes 13 CMCC-CESM Italy 3.75° × ~3.7°, L39 1850–2005 Yes Yes 14 CMCC-CM Italy 0.75° × ~0.75°, L31 1850–2005 Yes Yes 15 CMCC-CMS Italy 1.875° × ~1.9°, L95 1850–2005 Yes Yes 16 CNRM-CM5 France ~1.4° × 1.4°, L31 1850–2005 Yes Yes 17 CNRM-CM5-2 France ~1.4° × 1.4°, L31 1850–2005 Yes Yes 18 CSIRO-Mk3.6.0 Australia 1.875° × ~1.9°, L18 1850–2005 Yes Yes 19 EC-EARTH Europe 1.125° × ~1.1°, L62 1850–2009 − − 20 FGOALS-g2 China ~2.8° × 3–6°, L26 1850–2014 − Yes 21 FGOALS-s2 China ~2.8° × 1.7°, L26 1850–2005 Yes Yes 22 FIO-ESM China ~2.8° × 2.8°, L26 1850–2005 − Yes 23 GFDL-CM2.1 USA 2.5° × 2°, L24 1861–2015 Yes Yes 24 GFDL-CM3 USA 2.5° × 2°, L48 1860–2005 Yes Yes 25 GFDL-ESM2G USA 2.5° × 2°, L24 1861–2005 Yes Yes 26 GFDL-ESM2M USA 2.5° × 2°, L24 1861–2005 Yes Yes 27 GISS-E2-H USA 2.5° × 2°, L40 1850–2005 Yes Yes 28 GISS-E2-H-CC USA 2.5° × 2°, L40 1850–2010 Yes Yes 29 GISS-E2-R USA 2.5° × 2°, L40 1850–2005 Yes Yes 30 GISS-E2-R-CC USA 2.5° × 2°, L40 1850–2005 Yes Yes 31 HadCM3 UK 3.75° × 2.5°, L19 1860–2005 Yes Yes 32 HadGEM2-AO South Korea 1.875° × 1.25°, L38 1860–2005 Yes Yes 33 HadGEM2-CC UK 1.875° × 1.25°, L60 1860–2005 Yes Yes 34 HadGEM2-ES UK 1.875° × 1.25°, L38 1860–2005 Yes Yes 35 INM-CM4 Russia 2° × 1.5°, L21 1850–2005 Yes Yes 36 IPSL-CM5A-LR France 3.75° × ~1.9°, L39 1850–2005 Yes Yes 37 IPSL-CM5A-MR France 2.5° × ~1.3°, L39 1850–2005 Yes Yes 38 IPSL-CM5B-LR France 3.75° × ~1.9°, L39 1850–2005 Yes Yes 39 MIROC4h Japan ~0.56° × 0.56°, L56 1950–2005 Yes Yes 40 MIROC5 Japan ~1.4° × 1.4°, L40 1850–2012 Yes Yes 41 MIROC-ESM Japan ~2.8° × 2.8°, L80 1850–2005 Yes Yes 42 MIROC-ESM-CHEM Japan ~2.8° × 2.8°, L80 1850–2005 Yes Yes 43 MPI-ESM-LR Germany 1.875° × ~1.9°, L47 1850–2005 Yes Yes 44 MPI-ESM-MR Germany 1.875° × ~1.9°, L95 1850–2005 Yes Yes 45 MPI-ESM-P Germany 1.875° × ~1.9°, L47 1850–2005 Yes Yes 46 MRI-CGCM3 Japan 1.125° × ~1.1°, L48 1850–2005 Yes Yes 47 MRI-ESM1 Japan 1.125° × ~1.1°, L48 1850–2005 Yes Yes 48 NorESM1-M Norway 2.5° × ~1.9°, L26 1850–2005 Yes Yes 49 NorESM1-ME Norway 2.5° × ~1.9°, L26 1850–2005 Yes Yes 50 AWI-CM-1-1-MR* Germany ~0.9° × 0.9°, L95 1850–2014 − Yes 51 BCC-CSM2-MR China 1.125° × ~1.1°, L46 1850–2014 Yes Yes 52 BCC-ESM1 China 2.8125° × ~2.8°, L26 1850–2014 Yes Yes 53 CAMS-CSM1-0 China 1.125° × ~1.1°, L31 1850–2014 Yes Yes 54 CanESM5 Canada 2.8125° × ~2.8°, L49 1850–2014 Yes Yes 55 CESM2 USA 1.25° × ~0.9°, L32 1850–2014 − Yes 56 CESM2-FV2 USA 2.5° × ~1.9°, L32 1850–2014 − Yes 57 CESM2-WACCM USA 1.25° × ~0.9°, L70 1850–2014 − Yes 58 CESM2-WACCM-FV2 USA 2.5° × ~1.9°, L70 1850–2014 − Yes 59 CNRM-CM6-1 France ~1.4° × 1.4°, L91 1850–2014 Yes Yes 60 CNRM-CM6-1-HR France 0.5° × ~0.5°, L91 1850–2014 Yes Yes 61 CNRM-ESM2-1 France ~1.4° × 1.4°, L91 1850–2016 Yes Yes 62 E3SM-1-0 USA 1° × 1°, L72 1850–2014 − Yes 63 E3SM-1-1 USA 1° × 1°, L72 1850–2014 − − 64 EC-Earth3 Europe ~0.7° × 0.7°, L91 1850–2014 Yes Yes 65 EC-Earth3-Veg Europe ~0.7° × 0.7°, L91 1850–2014 Yes Yes 66 FGOALS-f3-L China 1.25° × 1°, L32 1850–2014 Yes Yes 67 FGOALS-g3 China 2° × ~2−5°, L26 1850–2014 − Yes 68 FIO-ESM-2-0 China 1.25° × ~0.9°, L26 1850–2014 − Yes 69 GFDL-CM4 USA 1.25° × 1°, L33 1850–2014 Yes Yes 70 GFDL-ESM4 USA 1.25° × 1°, L49 1850–2014 Yes Yes 71 GISS-E2-1-G USA 2.5° × 2°, L40 1850–2014 Yes Yes 72 GISS-E2-1-G-CC USA 2.5° × 2°, L40 1850–2014 Yes Yes 73 GISS-E2-1-H USA 2.5° × 2°, L40 1850–2014 Yes Yes 74 HadGEM3-GC31-LL UK 1.875° × 1.25°, L85 1850–2014 Yes Yes 75 HadGEM3-GC31-MM UK ~0.8° × 0.6°, L85 1850–2014 Yes Yes 76 INM-CM4-8 Russia 2° × 1.5°, L21 1850–2014 Yes Yes 77 INM-CM5-0 Russia 2° × 1.5°, L73 1850–2014 Yes Yes 78 IPSL-CM6A-LR France 2.5° × ~1.3°, L79 1850–2014 Yes Yes 79 KACE-1-0-G Korea 1.875° × 1.25°, L85 1850–2014 Yes Yes 80 MCM-UA-1-0 USA 3.75° × ~2.2°, L14 1850–2014 Yes Yes 81 MIROC-ES2L Japan 2.8125° × ~2.8°, L40 1850–2014 Yes Yes 82 MIROC6 Japan ~1.4° × 1.4°, L81 1850–2014 Yes Yes 83 MPI-ESM-1-2-HAM Germany 1.875° × ~2°, L47 1850–2014 Yes Yes 84 MPI-ESM1-2-HR Germany ~0.9° × 0.9°, L95 1850–2014 Yes Yes 85 MPI-ESM1-2-LR Germany 1.875° × ~2°, L47 1850–2014 Yes Yes 86 MRI-ESM2-0 Japan 1.125° × ~1.1°, L80 1850–2014 Yes Yes 87 NESM3 China 1.875° × ~1.9°, L47 1850–2014 Yes Yes 88 NorCPM1 Norway 2.5° × ~1.9°, L26 1850–2029 Yes Yes 89 NorESM2-LM Norway 2.5° × ~1.9°, L32 1850–2014 − Yes 90 NorESM2-MM Norway 1.25° × ~0.9°, L32 1850–2014 − Yes 91 SAM0-UNICON Korea 1.25° × ~0.9°, L30 1850–2014 − Yes 92 UKESM1-0-LL UK 1.875° × 1.25°, L85 1850–2014 Yes Yes * Note that precipitation data are not available for AWI-CM-1-1-MR. Table 1. Basic information about the 92 GCMs and their historical experiments included in this study, along with the data availability of wind at 10 m and 850 hPa. Model IDs 1−49 are from CMIP5, and 50−92 from CMIP6.
Temperature and precipitation data applied for evaluation are obtained from the CN05.2 monthly dataset established by the Chinese National Climate Center through in-situ data at 2416 stations over China, with a horizontal resolution of 0.5° × 0.5° (Wu and Gao, 2013). Monthly wind data at 10 m and at 850 hPa are taken from the National Centers for Environmental Prediction and National Center for Atmospheric Research (NCEP–NCAR) reanalysis, with a horizontal resolution of 1.875° × ~1.9° and 2.5° × 2.5° (Kalnay et al., 1996), respectively. For convenience, in the following analysis, we refer to both kinds of data simply as “observation”.
Considering only one integration is performed by most modeling groups for the historical experiment, the first ensemble run of each model is applied for analysis. Given that the horizontal resolution varies with GCMs, we remap all models and NCEP–NCAR wind data to the horizontal resolution of the CN05.2 products with a bilinear interpolation algorithm. Both the arithmetic mean and the median of GCMs are used to calculate the multi-model mean. Because part of the historical experiments ends in the year 2005, the CN05.2 data start from the year 1961, and the NCEP–NCAR reanalysis data are more reliable when satellite data have been available since 1979, the period 1961–2005 is chosen for evaluation of temperature and precipitation, and 1979–2005 for wind analysis. In addition, the interannual variability is measured by the interannual standard deviation at each spatial grid point in the present study.
-
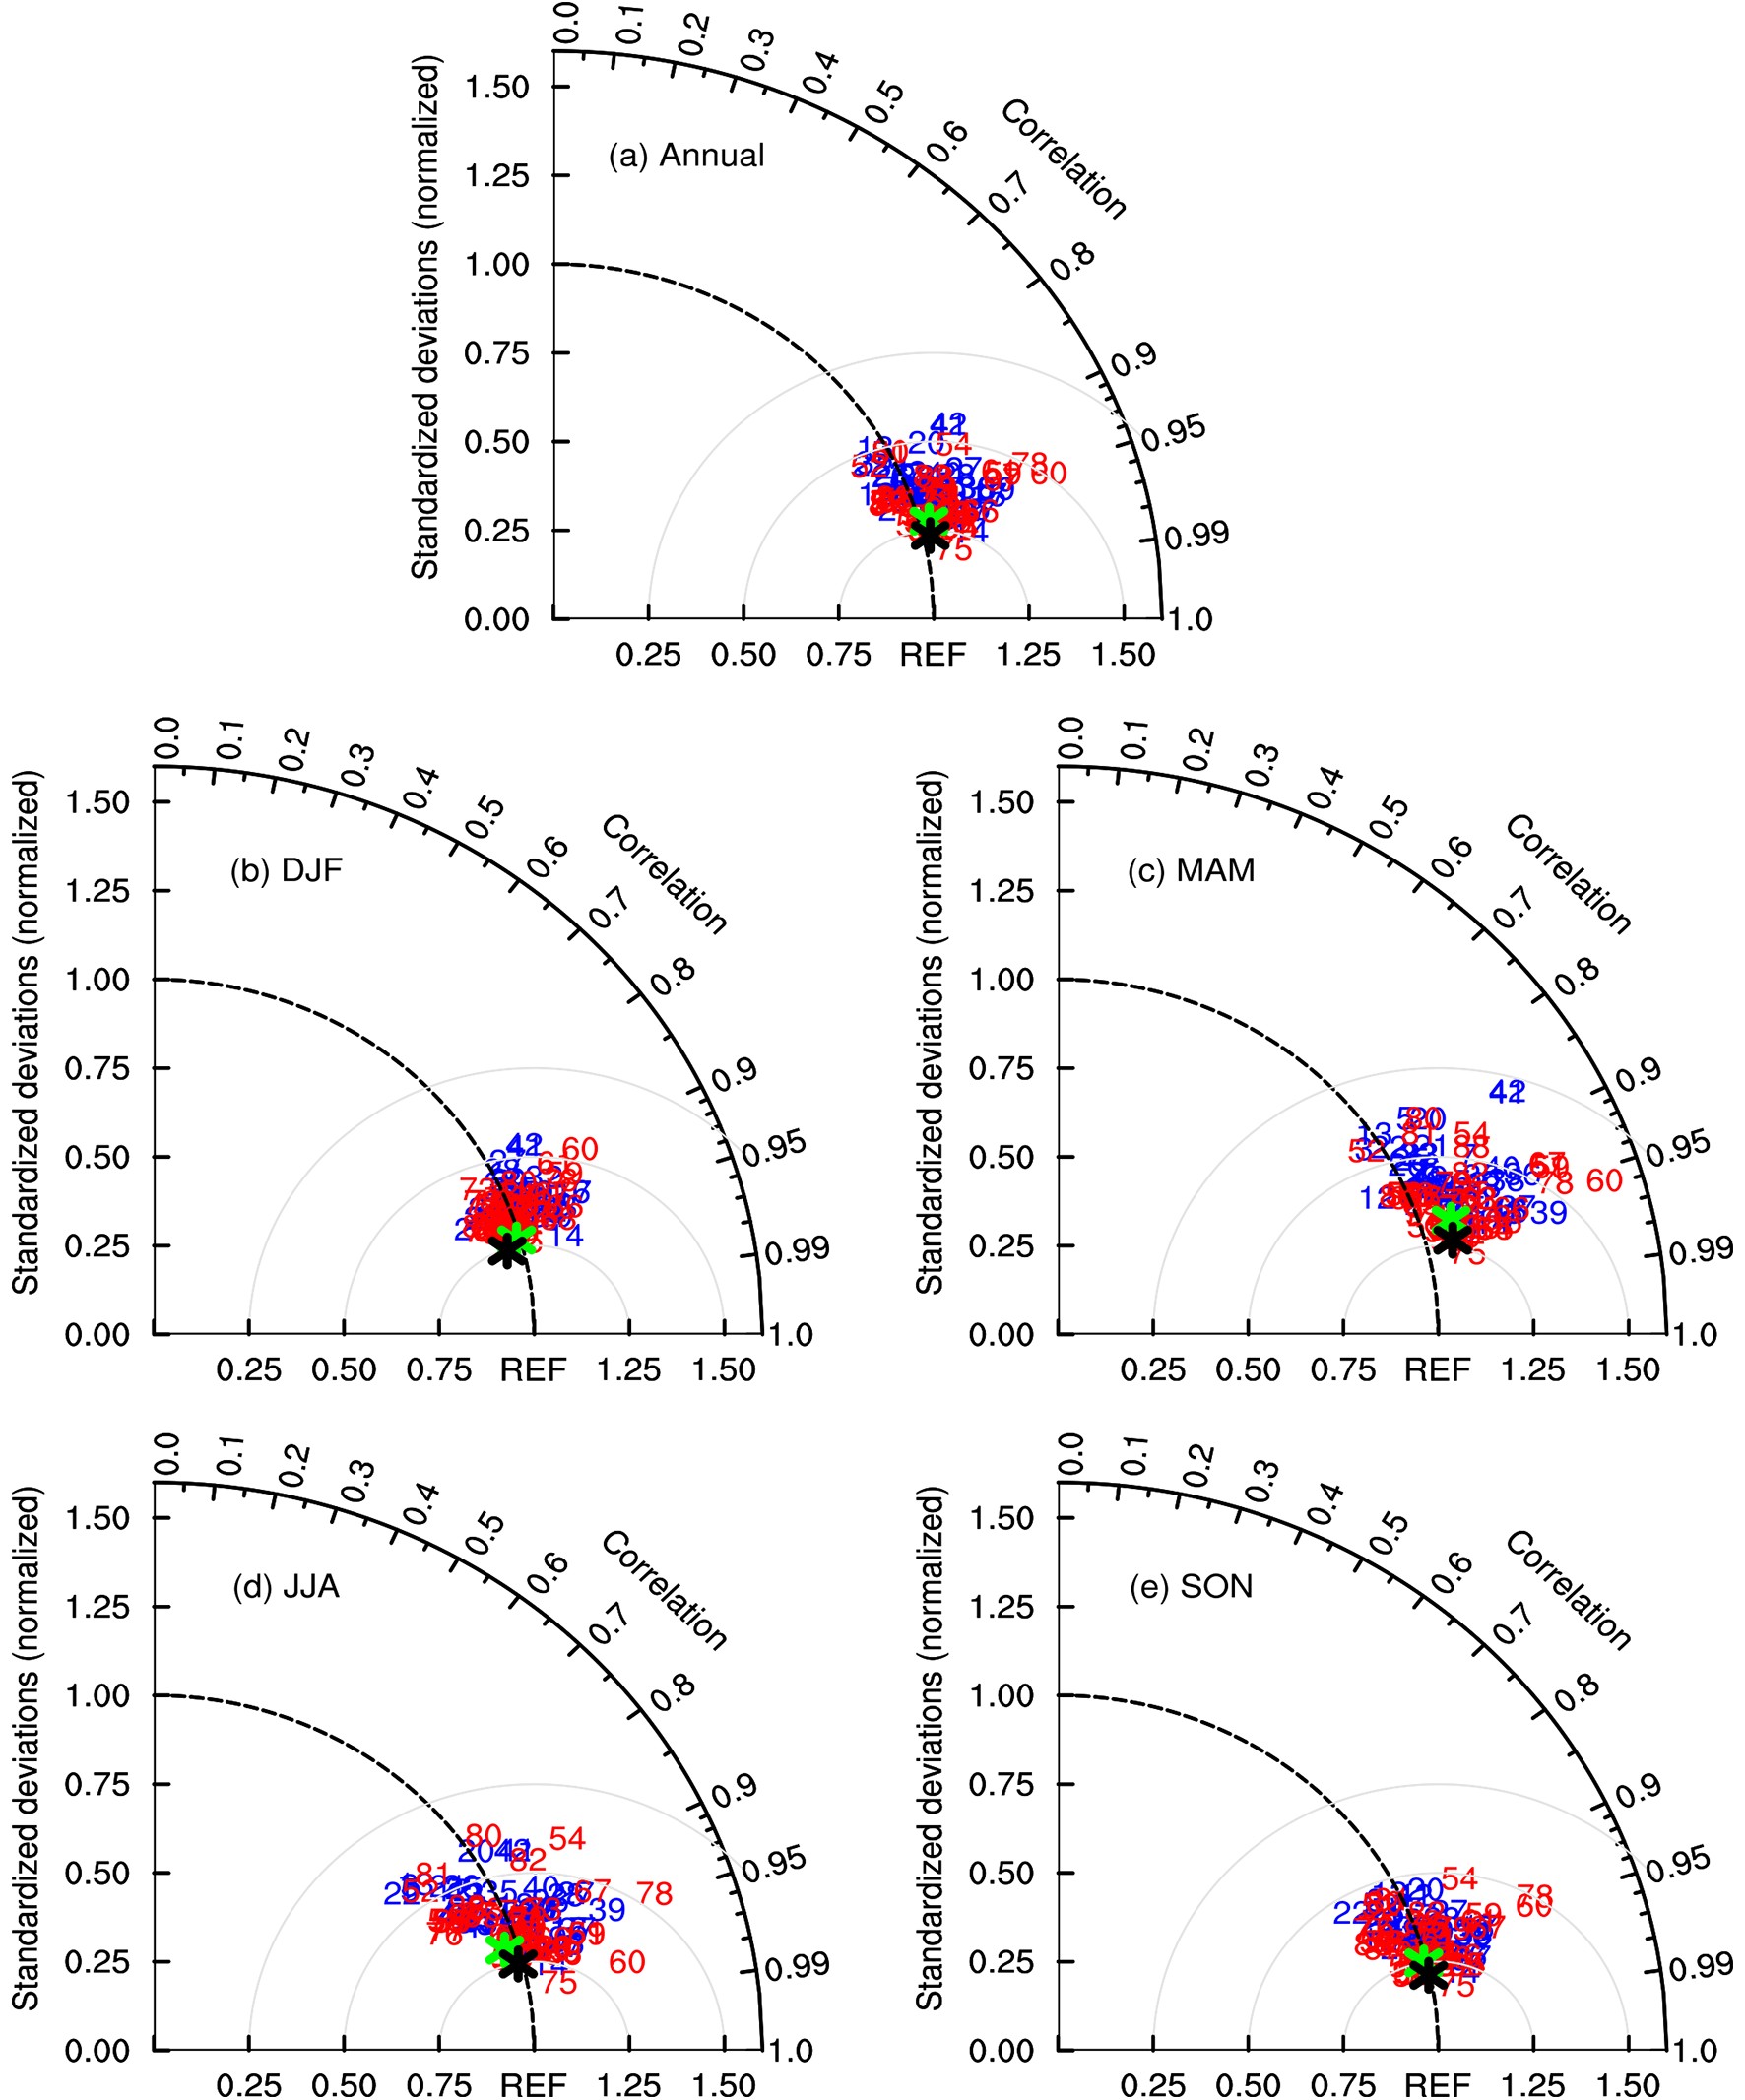
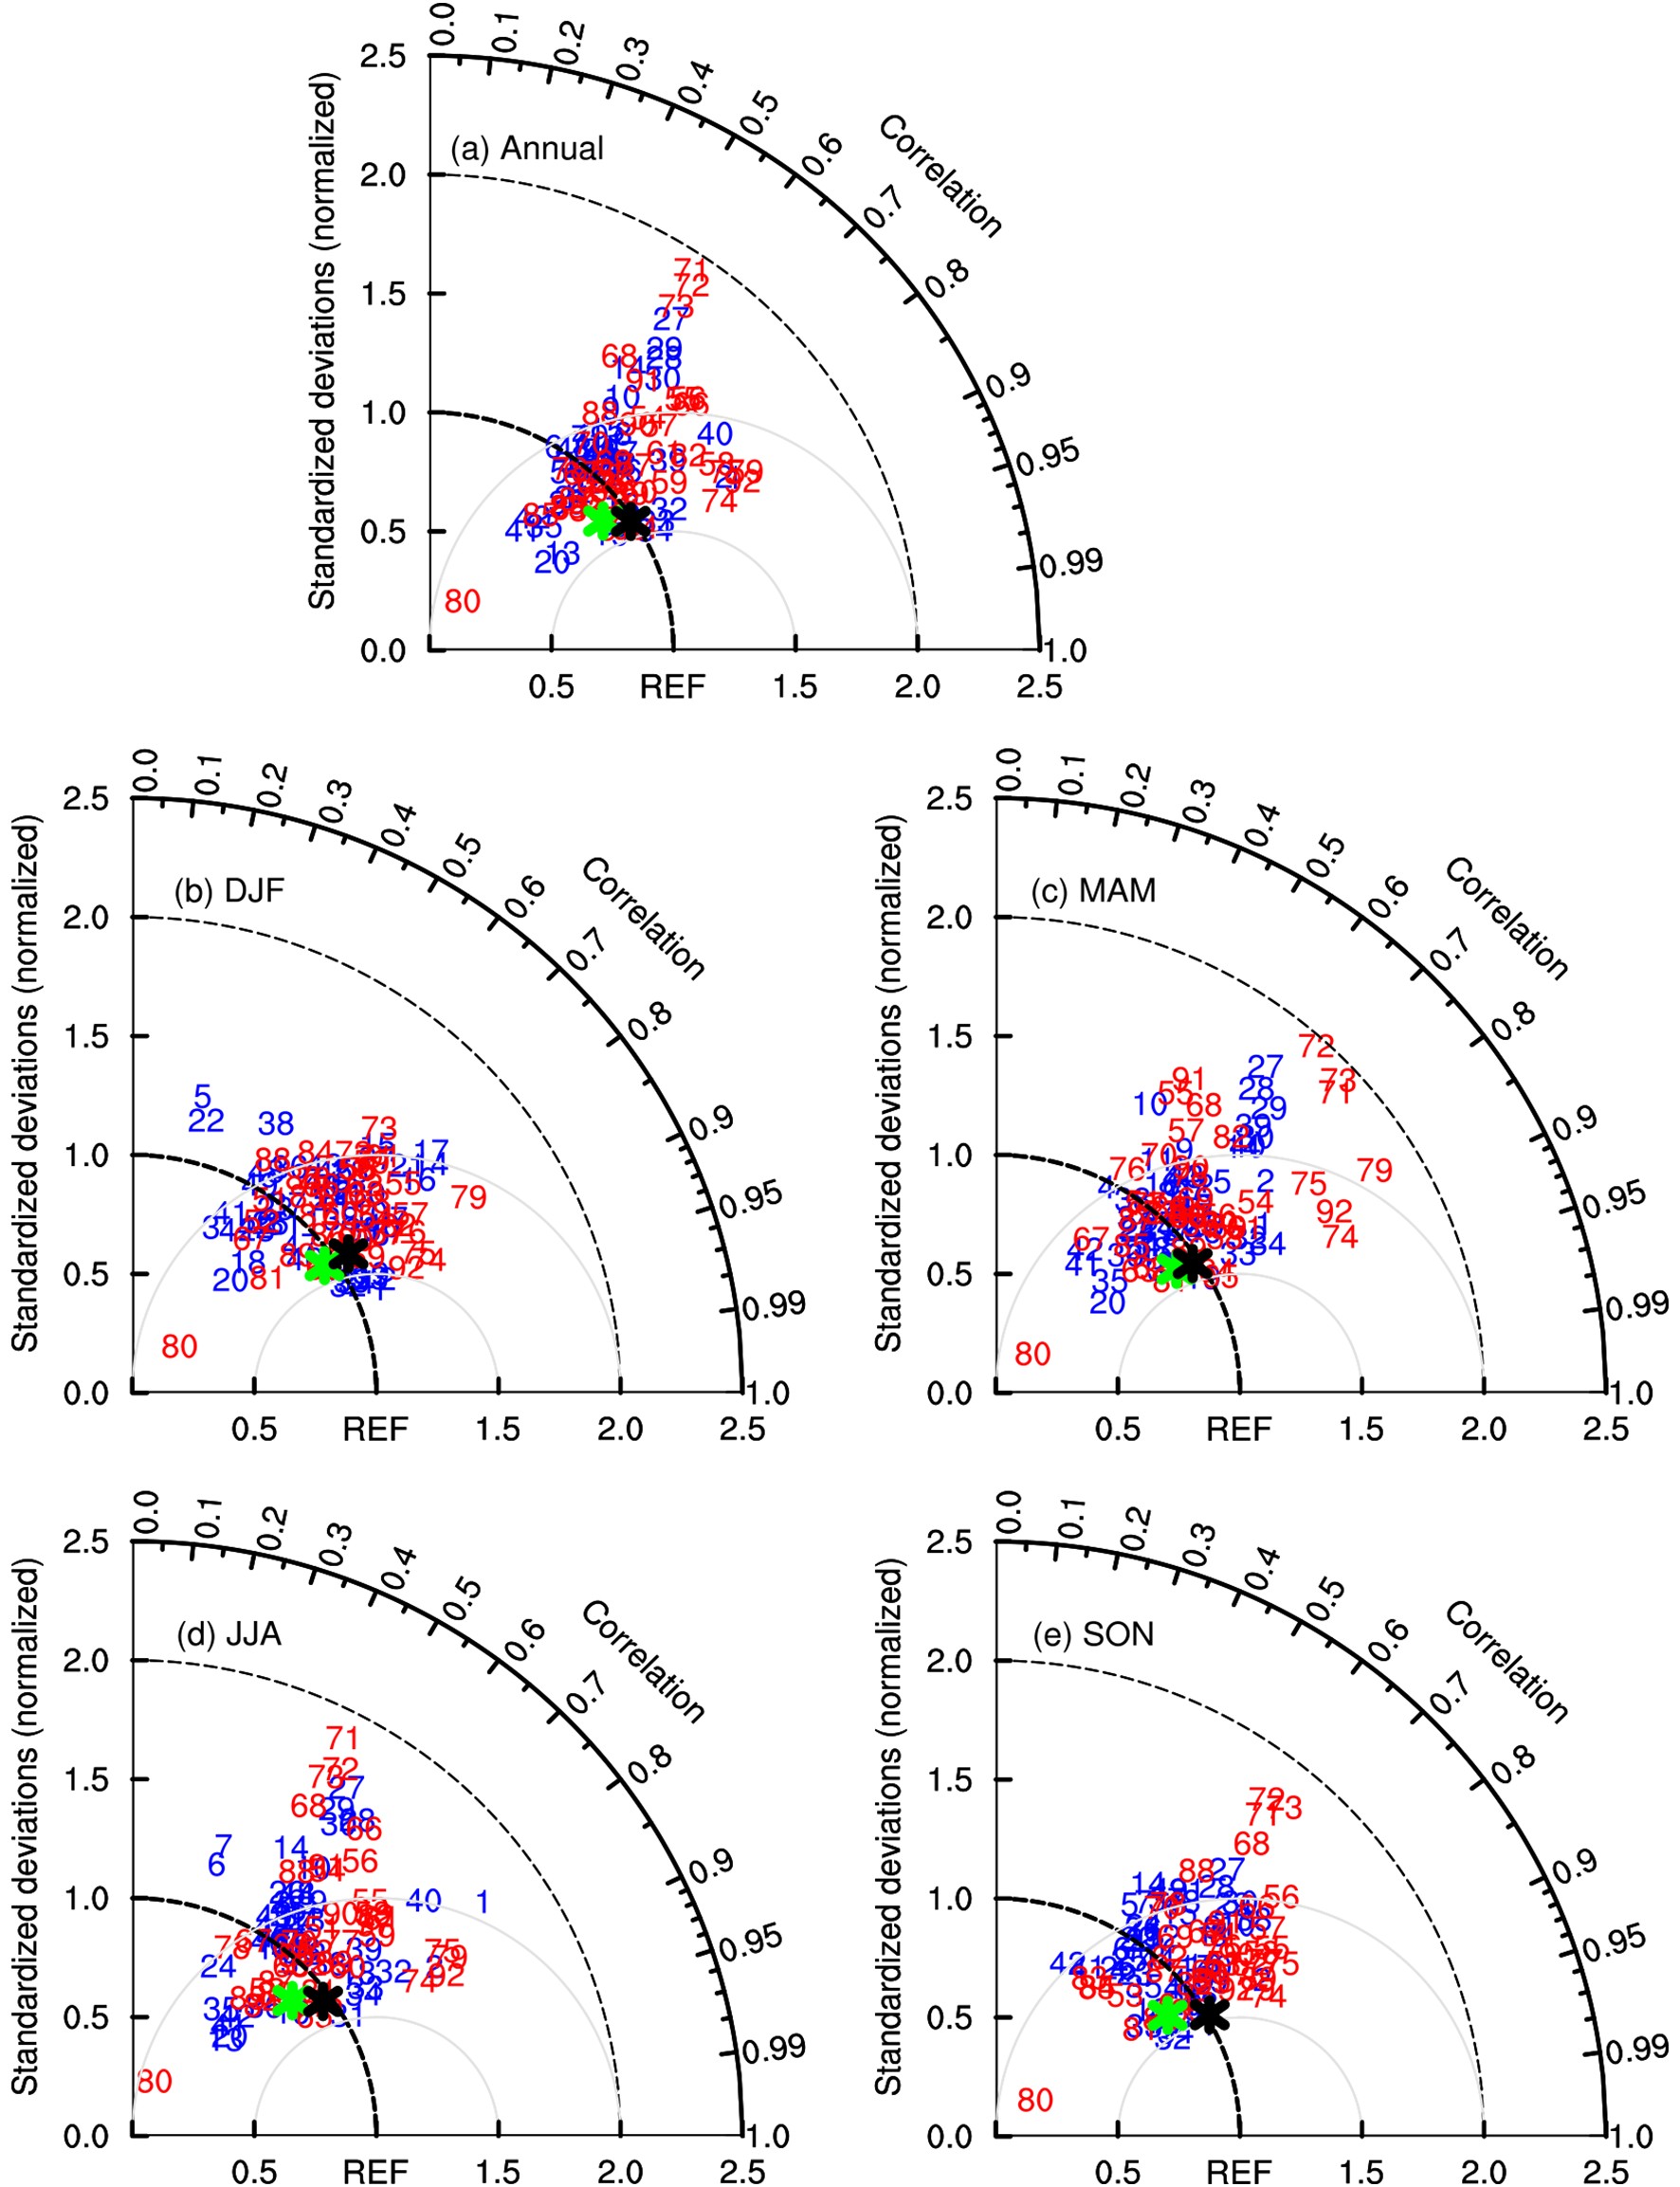
The Taylor (2001) diagram, which illustrates the spatial correlation coefficient (SCC), the standard deviation, and the centered root-mean-square error (CRMSE) of climatological annual and seasonal temperature over China between each experiment and observation for the period 1961–2005, is shown in Fig. 1. Based on 4470 grid points across China, the SCCs vary between 0.83 and 0.99 in CMIP6 GCMs, indicating that the simulated geographical distributions of annual and seasonal temperature match well with the observed ones. Normalized standard deviations (CRMSEs), defined by ratios of the standard deviation (CRMSE) between each model and observation, are 0.92–1.36 (0.17–0.49) for the annual mean, 0.90–1.22 (0.23–0.50) in winter, 0.94–1.49 (0.21–0.59) in spring (March–April–May; MAM), 0.81–1.38 (0.17–0.59) in summer, and 0.87–1.32 (0.16–0.47) in autumn (September–October–November; SON). This means that most CMIP6 GCMs reasonably simulate the spatial variability of temperature climatology over China. Altogether, the CMIP6 GCMs have reliable capabilities in simulating the annual and seasonal temperature, which perform better for winter and autumn than for the other seasons owing to a better reproducibility of both geographical distribution and spatial variability.

Figure 1. Taylor diagrams displaying normalized pattern statistics of climatological (a) annual, (b) DJF, (c) MAM, (d) JJA, and (e) SON temperature over China between 92 GCMs and observations for the period 1961–2005. The radial coordinate gives the standard deviation normalized by the observed value, and the angular coordinate gives the correlation with observation. The normalized CRMSE between a GCM and observation (marked as REF) is their distance apart. Blue and red numbers indicate CMIP5 and CMIP6 GCMs listed in Table 1, respectively. Green and black asterisks represent the median of the 49 CMIP5 and 43 CMIP6 GCMs, respectively.
The CMIP6 GCMs have generally higher SCCs and smaller normalized CRMSEs than the CMIP5 GCMs. In other words, the former outperforms the latter overall. Meanwhile, the normalized standard deviations are larger for the CMIP6 than for the CMIP5 GCMs, indicating a slightly worse performance in simulating the spatial variability of temperature for the former than for the latter, especially in spring and summer. Moreover, we compare 25 CMIP6 GCMs to their CMIP5 predecessors. It is found that 17 (four) CMIP6 GCMs show a better (poorer) score than their CMIP5 parents, because the CRMSEs of the former are smaller (larger) than those of the latter, while the remaining four pairs of CMIP5 and CMIP6 GCMs have similar scores (Table S1 in the Electronic Supplementary Material, ESM). Taken together, the capability of GCMs to reproduce the climatological temperature over China increases from CMIP5 to CMIP6, which may be partly due to improvements of physics schemes and processes in association with the cloud representation (Yukimoto et al., 2019).
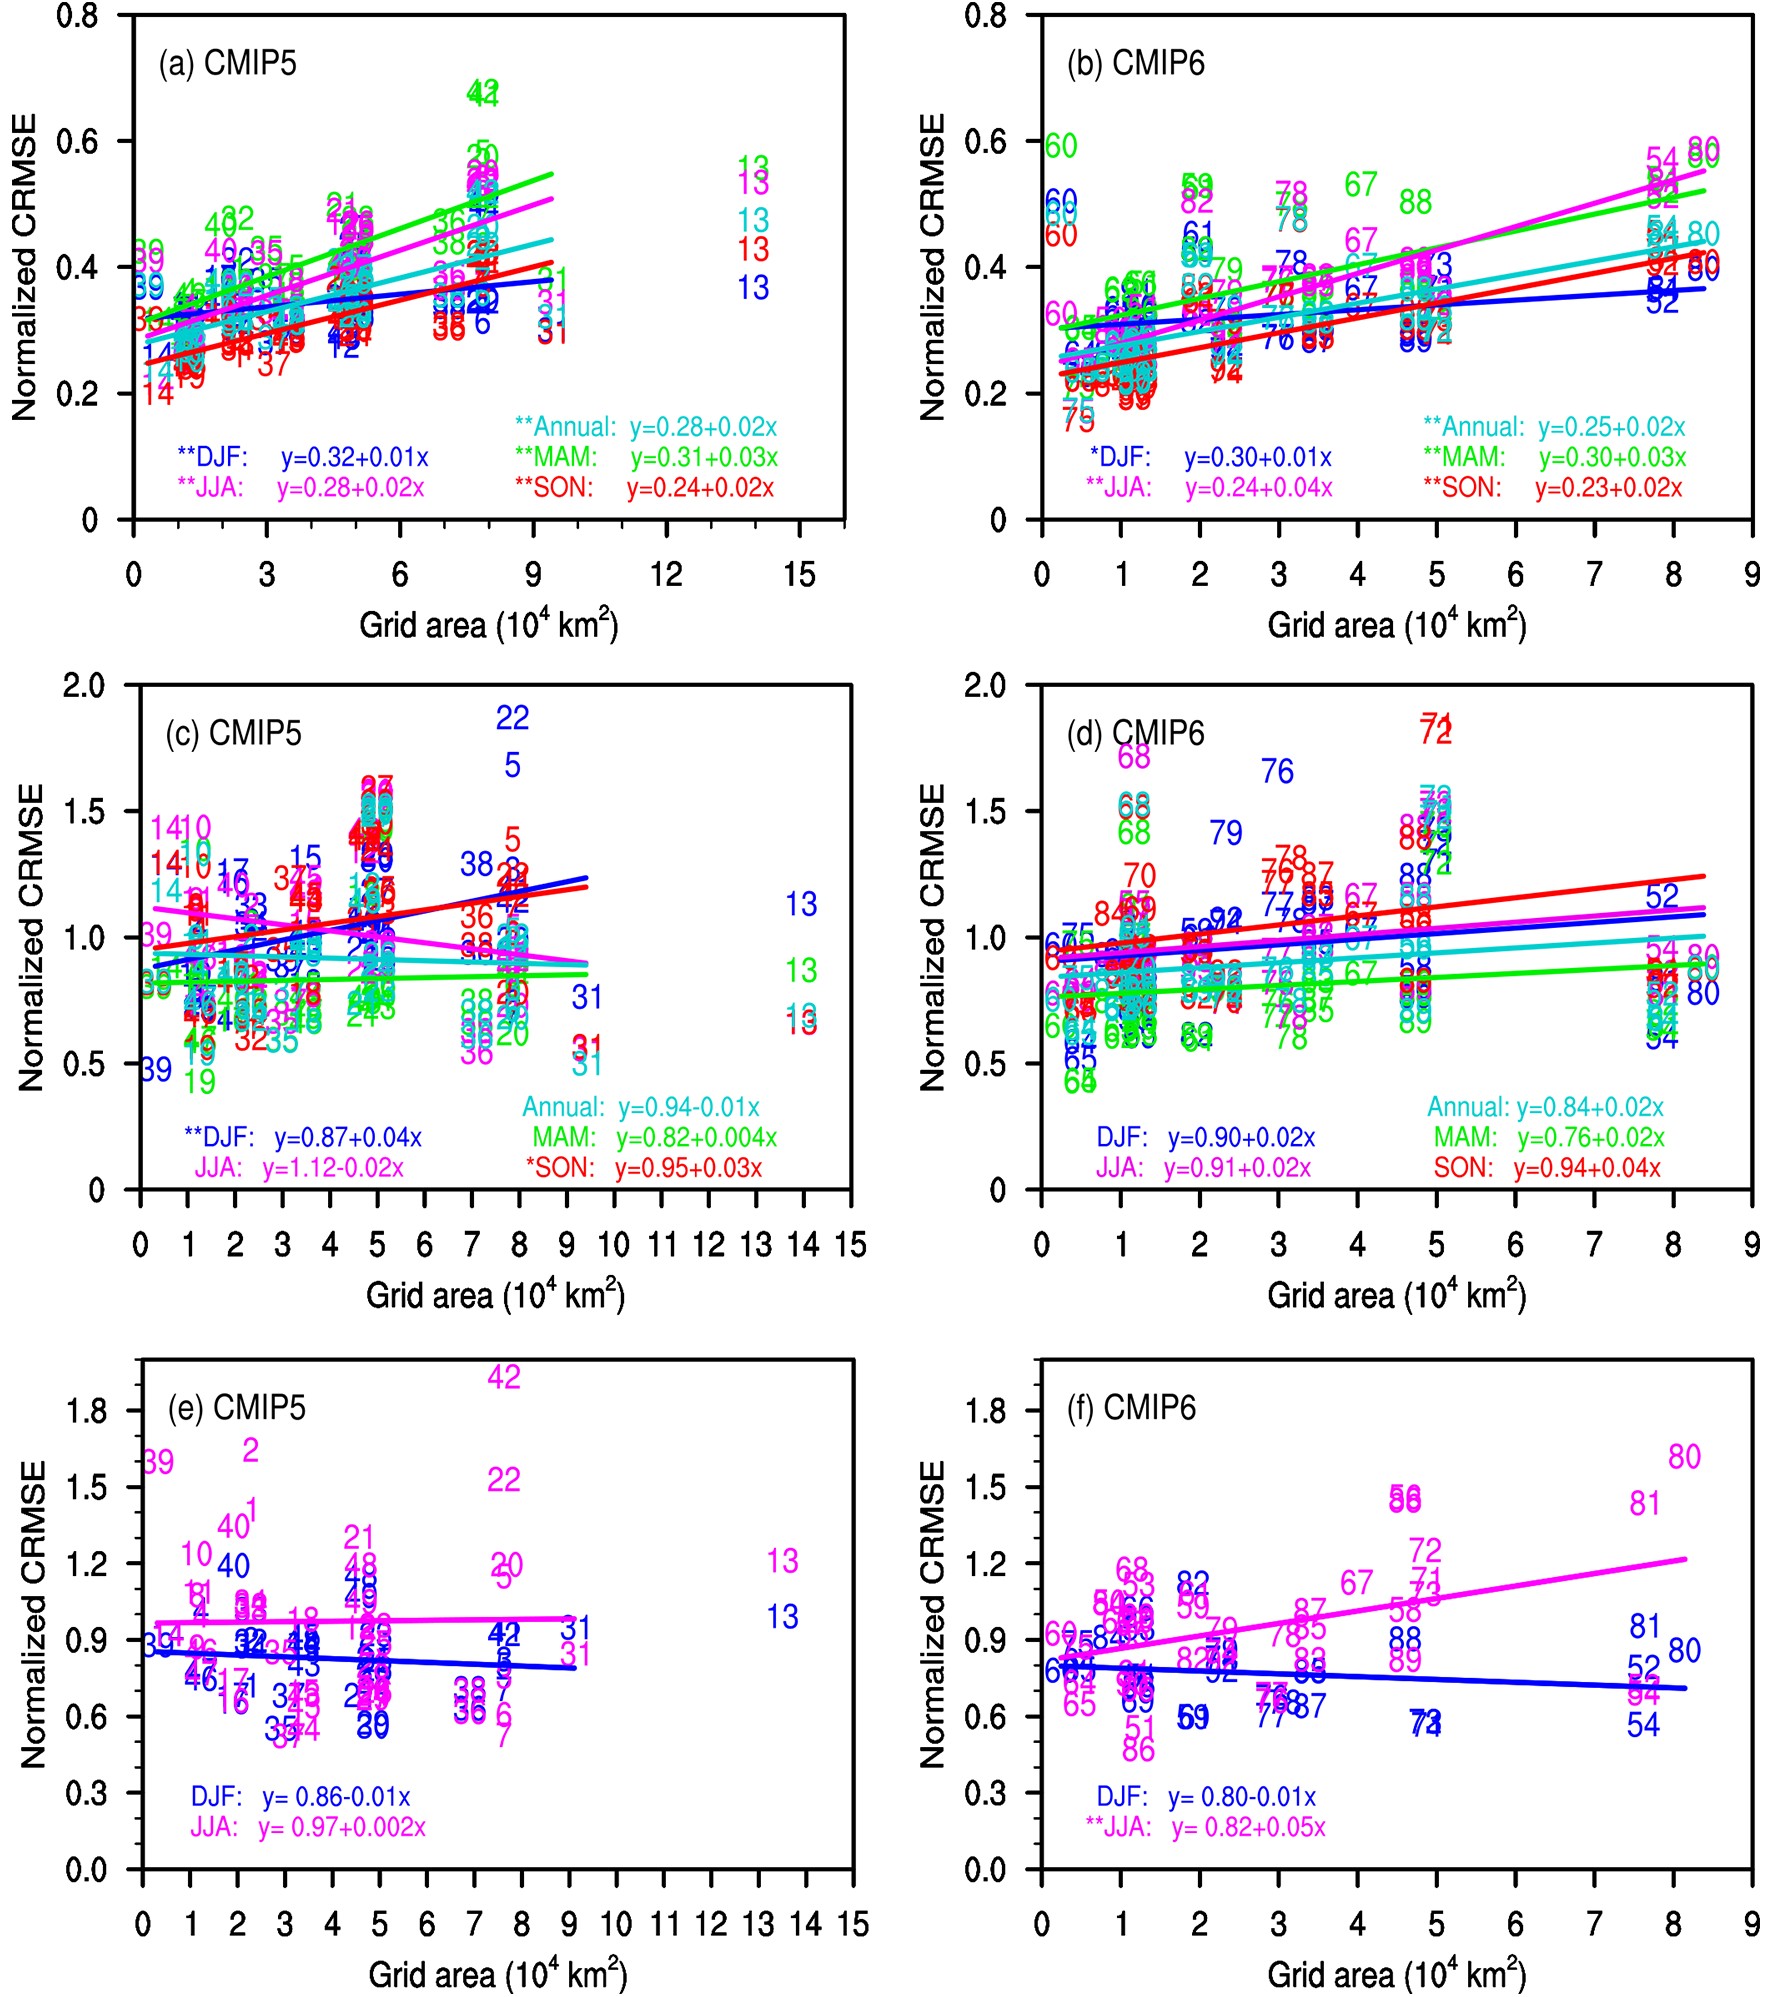
Note that one significant improvement from the CMIP5 to CMIP6 GCMs lies in their finer model resolutions. The original horizontal resolutions vary from approximately 0.56° × 0.56° to 3.75° × 3.7° in the 49 CMIP5 GCMs, whereas they range from 0.5° × 0.5° to 3.75° × 2.2° in the 43 CMIP6 ones. In order to examine the influence of resolution, Fig. 2 displays changes in the normalized CRMSEs of CMIP5/6 GCMs with the original grid mesh area. It is found that the normalized CRMSE decreases with a finer horizontal resolution and thus better skills of GCMs in simulating the temperature climatology over China, and all correlation relationships are statistically significant at the 99% confidence level except in winter. Such a result also holds for 27 CMIP5 GCMs (Gu et al., 2015) and 77 GCMs through the Intergovernmental Panel on Climate Change Third to Fifth Assessment Reports (Jiang et al., 2016). Compared to the CMIP5 GCMs, the normalized CRMSE overall reduces more in the CMIP6 GCMs with the same unit promotion of horizontal resolution (Fig. S1 in ESM), indicating a more significant improvement of model ability.
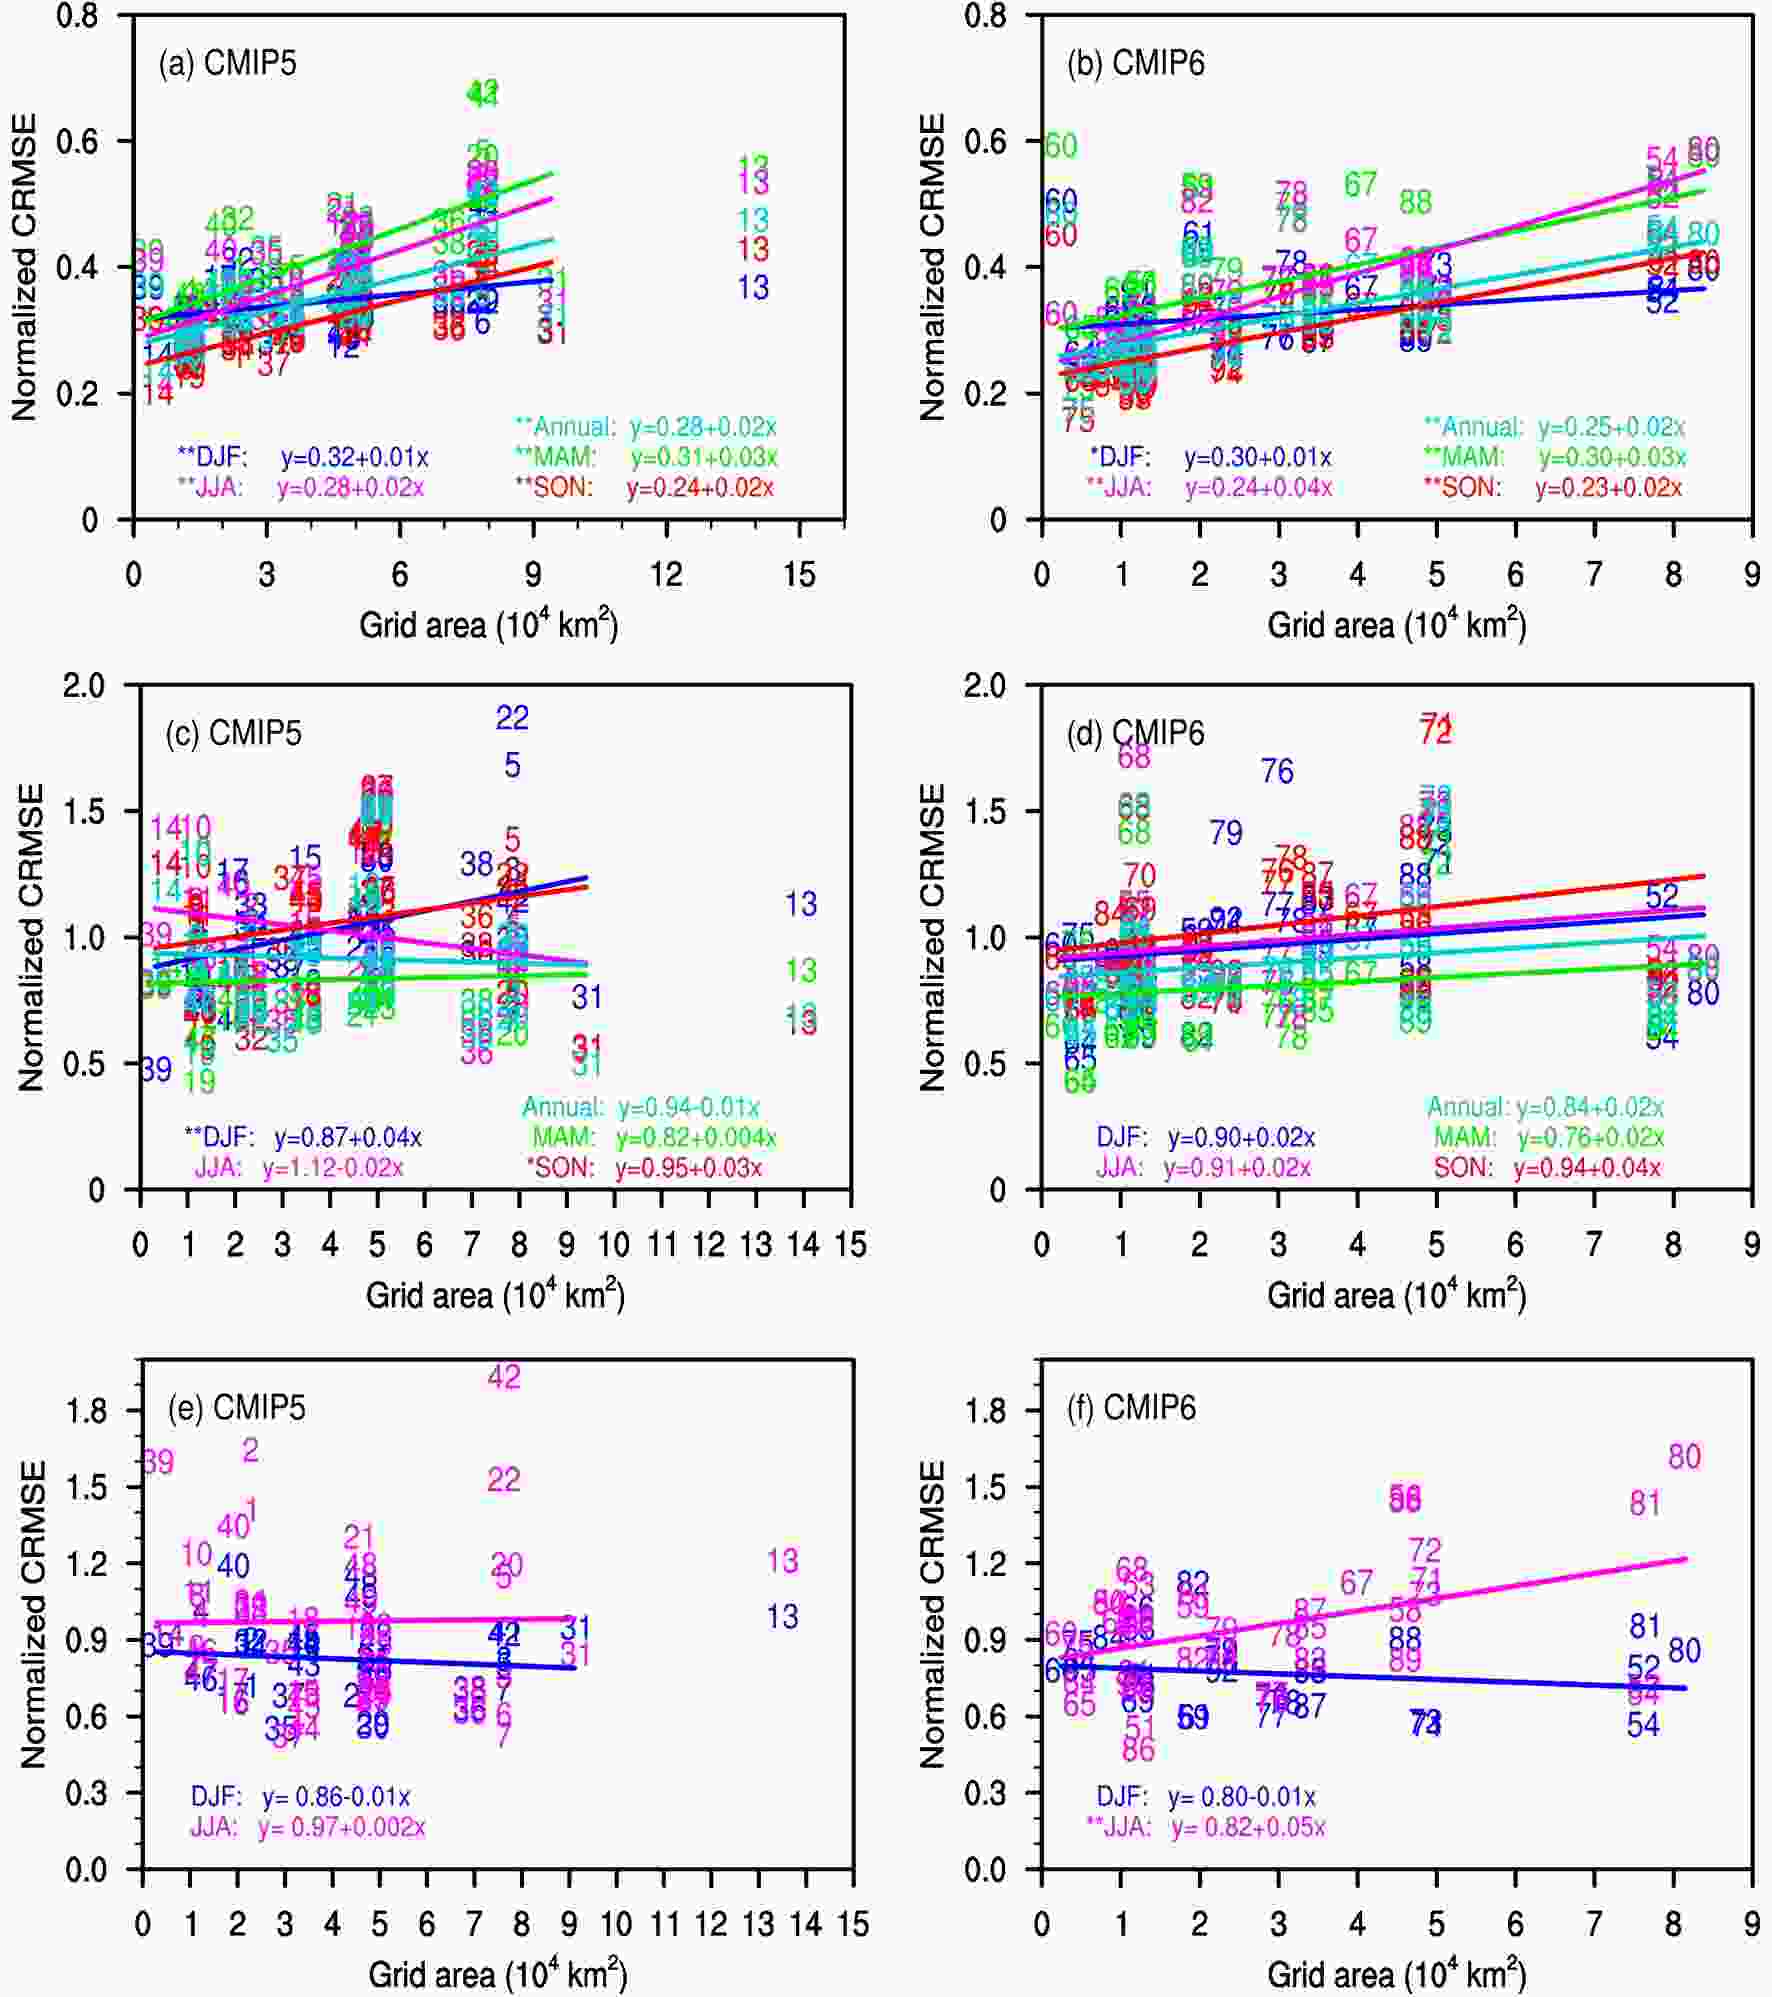
Figure 2. The vertical axis is the normalized CRMSE of (a, c, e) CMIP5 and (b, d, f) CMIP6 GCMs against observation for (a, b) temperature and (c, d) precipitation over China for the period 1961–2005 and (e, f) the East Asian monsoon (see subsection 3.5 for definition) for the period 1979–2005; the horizontal axis is the original grid mesh area averaged over China for the GCMs. Cyan, blue, green, magenta, and red indicate the annual, DJF, MAM, JJA, and SON mean, respectively. Straight lines represent the least-squares linear fitting with equal weight for all CMIP5 GCMs except number 13 because that GCM has too coarse a resolution, and for all CMIP6 GCMs. The fitting equations are shown in the lower corner of the panels, in which * (**) indicates that the correlation relationship is statistically significant at the 90% (95%) confidence level.
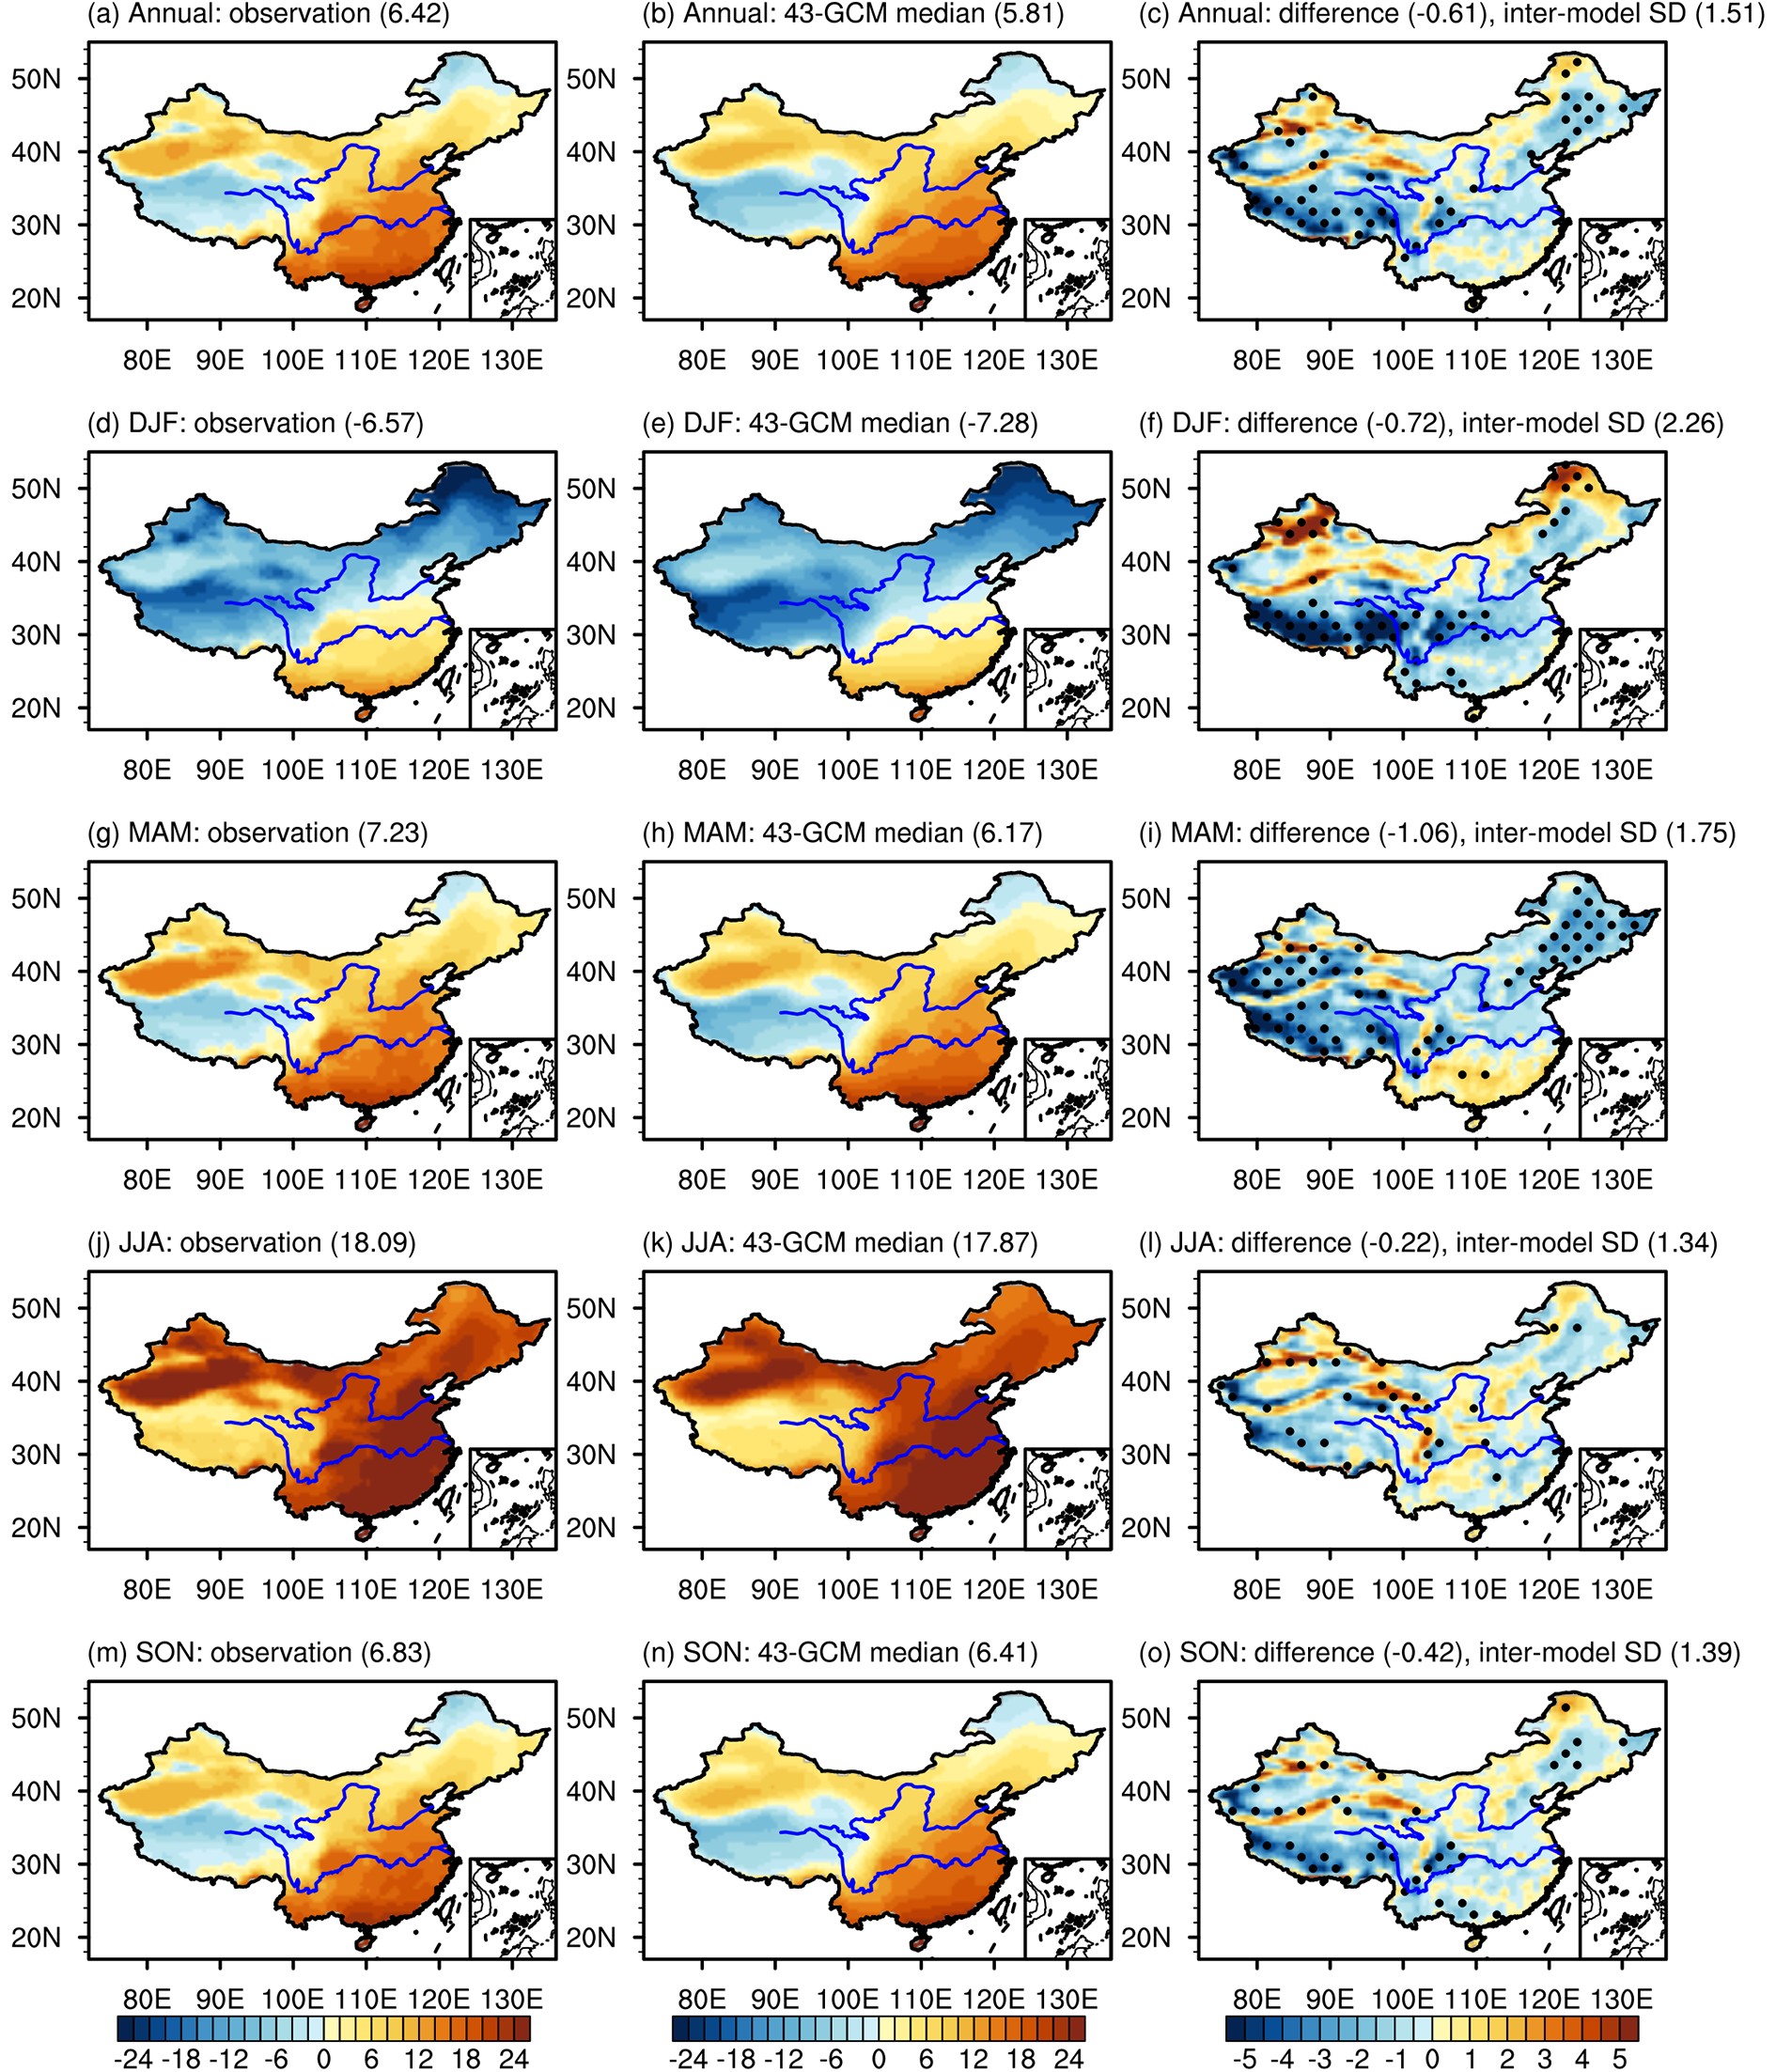
Since the distribution of GCMs is relatively concentrated in the Taylor diagram (Fig. 1), we use all 92 GCMs to obtain the multi-model mean. It is shown that the arithmetic mean and the median results are comparable and outperform most of the individual GCMs (Fig. 1). In a qualitative manner, the observed geographical distribution of temperature climatology over China is reasonably reproduced by individual GCMs and their means, including the south–north gradient and the low values over the Tibetan Plateau, while the underestimation found in previous studies (Xu et al., 2007; Guo et al., 2013; Chen and Frauenfeld, 2014b; Jiang et al., 2016) still exists at the national scale (Fig. 3). Quantitatively averaged over the country, cold biases are 0.61°C, 0.72°C, 1.06°C, 0.22°C, and 0.42°C for the annual, winter, spring, summer, and autumn mean, respectively, in terms of the median of the 43 CMIP6 GCMs. These values are smaller than the cold biases of 0.81−2.37°C by 22 CMIP3 and 20 CMIP5 GCMs (Chen and Frauenfeld, 2014b) except in spring. The cold biases are larger in cold than in warm seasons, implying that snow–albedo feedbacks may be inadequately represented by GCMs. As compared to the estimate from the 49-CMIP5-GCM median, the cold bias in the 43 CMIP6 GCMs is notably weaker by an average of 0.04−0.70°C on annual and seasonal scales, with an obvious improvement for the annual mean, winter, and autumn (Fig. S2). It should be mentioned that external forcings are different between CMIP5 and CMIP6 historical experiments, such as greenhouse gas concentrations and aerosol forcings, and such changes might play important roles in temperature biases over China (Nie et al., 2019). Regionally associated with the topography, cold biases occur all year round over the Tibetan Plateau and the Tarim Basin, with weaker magnitudes for summer and autumn than for the other seasons, while warm biases are simulated along the Tien Shan and the Altun-Qilian Mountains (Fig. 3). Cold biases occur in most of eastern China except for summer. Temperature is generally underestimated in southeastern Northeast and North China, but overestimated in northwestern Northeast China except for spring. Spring temperature is higher than observed in South China. Compared to the CMIP5 GCMs, cold biases over the Tarim Basin and Tibetan Plateau (except for summer) for the whole year, in southeastern Northeast China for winter, and in most of eastern China for autumn, have reduced, while those in southeastern Northeast China for the annual mean and spring have aggravated in the CMIP6 GCMs (>Fig. S2). Furthermore, individual GCMs show agreement in sign with most of the above median biases, with the model consistency averaging from 70% to 75% on annual and seasonal scales.

Figure 3. Climatological annual and seasonal temperature (units: °C) over China for the period 1961–2005 as obtained from observation (left column), the median of the 43 CMIP6 GCMs (middle column), and the difference between the median and observation (right column). The regional average value in China and the inter-model standard deviation of the difference averaged over the country (right column, inter-model SD, units: °C) are given in parentheses. The two solid blue lines indicate the Yellow River valley in the north and the Yangtze River valley in the south, respectively. The dotted areas in the right panels represent regions where at least 80% of the GCMs share the same sign of bias.
-
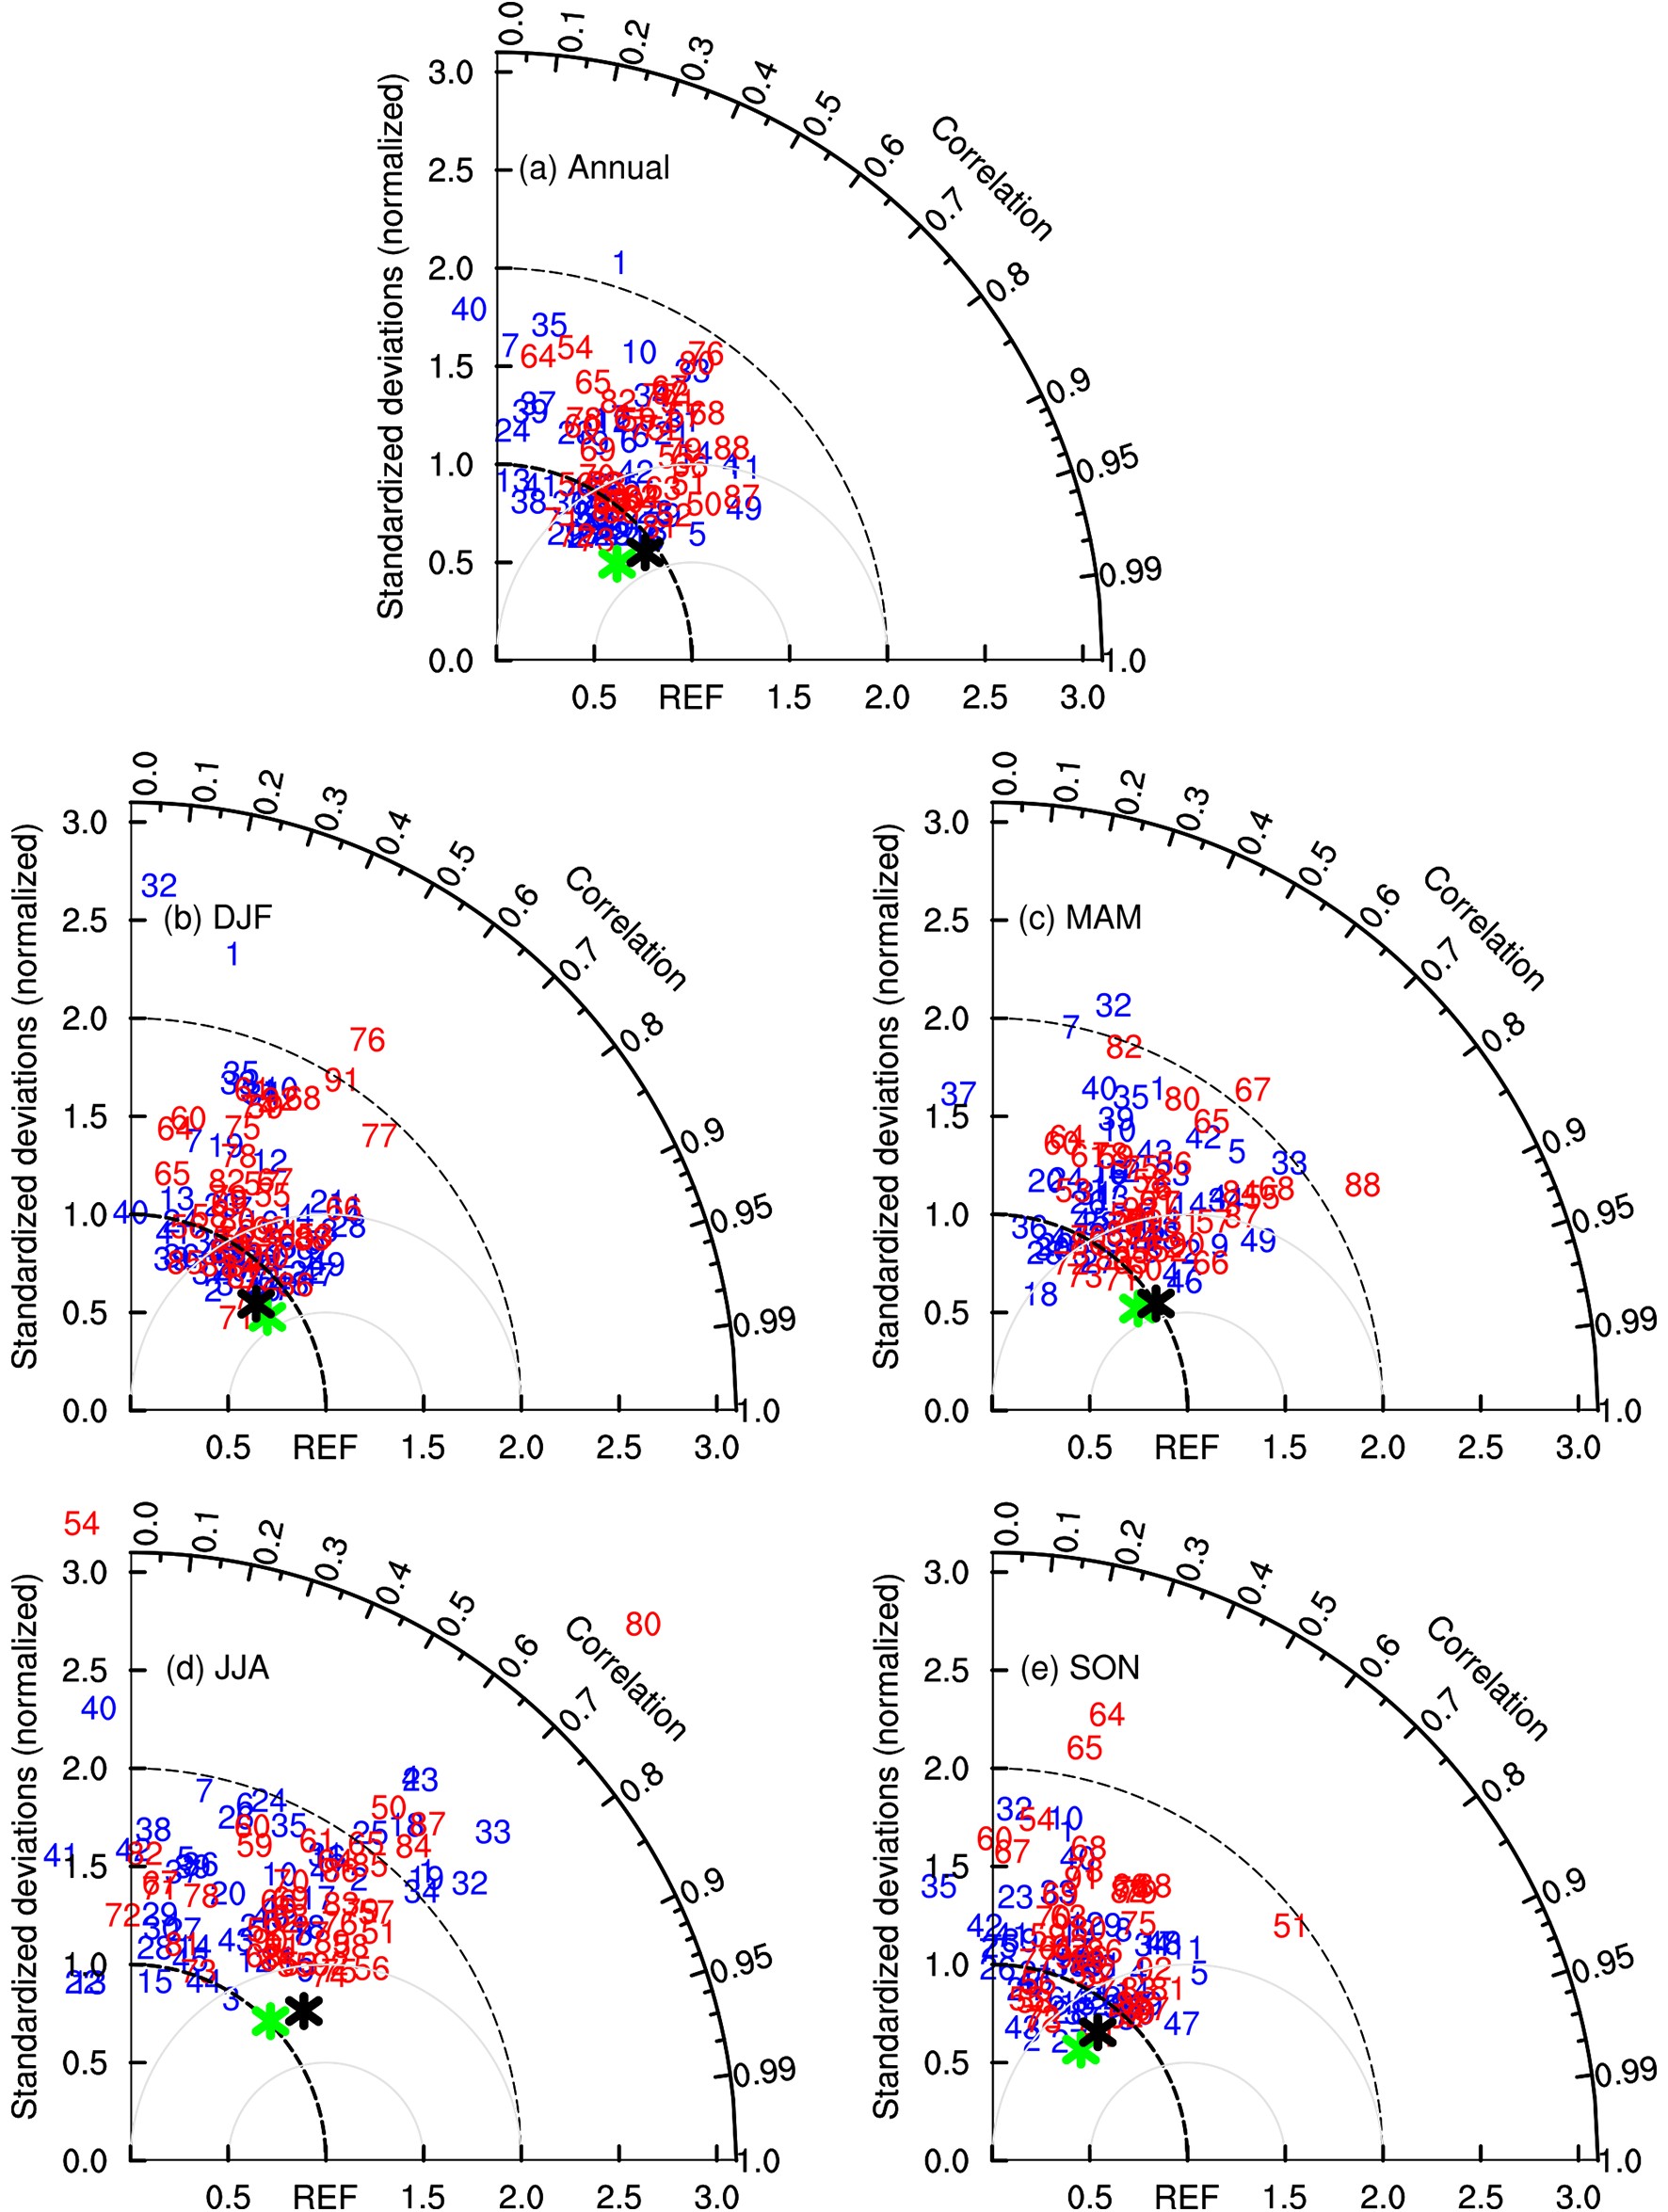
The scores of GCMs in simulating the interannual variability of temperature are poorer than for its climatology over China (Table S2, Figs. 1 and 4). Annual and seasonal SCCs range from −0.07 to 0.87 for the CMIP6 GCMs, with several outliers showing negative or very small values in summer and autumn. Normalized standard deviations vary from 0.67 to 3.75, with most values being greater than one. Normalized CRMSEs are 0.65–1.68, 0.60–1.84, 0.70–1.82, 0.89–3.39, and 0.74–2.25 for the annual, winter, spring, summer, and autumn mean, respectively. Therefore, most CMIP6 GCMs reasonably simulate the geographical pattern in terms of relatively high SCCs, but overestimate the spatial variability of interannual temperature variability over China, particularly in spring and summer, as their standard deviations are greater than observed. The performance is overall worse for spring and summer than for the annual mean and the other seasons owing to a worse reproducibility of the spatial pattern and variability.

Figure 4. Taylor diagrams displaying normalized pattern statistics of the interannual variability of (a) annual, (b) DJF, (c) MAM, (d) JJA, and (e) SON temperatures over China for the period 1961–2005 between 92 GCMs and observations. Other aspects are the same as in Fig. 1.
SCCs of individual CMIP5 GCMs are more dispersive than those of CMIP6 because of more outliers with negative or very small SCCs (Fig. 4). Compared to the CMIP5 GCMs, normalized standard deviations are closer to one for the annual mean and winter but larger for the other seasons in CMIP6 GCMs. As a whole, the median of the 49 CMIP5 GCMs performs similarly to the 43-CMIP6-GCM median. As further shown by comparisons from the same model family, seven (eight) of 25 CMIP5 GCMs outperform (underperform) their CMIP6 successors owing to overall smaller (larger) normalized CRMSEs, while the remaining 10 pairs of CMIP5 and CMIP6 GCMs have comparable performance (Table S2). In other words, there is little improvement from the CMIP5 to CMIP6 GCMs in simulating the interannual temperature variability over China.
When the grid area decreases in the CMIP6 GCMs, the normalized CRMSEs decrease statistically significantly for summer but increase for the annual mean and the other seasons, with the latter being statistically significant at the 90% confidence level for winter and autumn (Fig. S3b). Thus the skill of CMIP6 GCMs in simulating the interannual temperature variability relates to model resolution for winter, summer, and autumn, which is less discernible in CMIP5 GCMs (Fig. S4).
The statistics on the Taylor diagrams are very close between the arithmetic mean and median of GCMs, which are better than most (all) individual GCMs for the interannual variability of annual, winter, and autumn (spring and summer) temperature (Fig. 4). At the large scale, the geographical distribution of interannual temperature variability is reliably reproduced by most GCMs and their means, such as the south–north gradient and an obvious seasonality, with the largest variability in winter, followed by spring and autumn, and the smallest in summer (Fig. S5). Note that the interannual variability of annual and seasonal temperature are overestimated at the national scale, which is averaged by 0.08–0.29°C as obtained from the 43-CMIP6-GCM median. Moreover, the overestimation is relatively large (small) for the season with a relatively large (small) interannual variability. These values are also comparable to the median of the 49 CMIP5 GCMs (Fig. S6). Regionally, the interannual variability of temperature is underestimated in part of northern Xinjiang except for summer, part of Inner Mongolia and Northeast China for the annual mean, winter, and autumn, part of South China for winter and spring, and part of central China and the middle and lower reaches of the Yangtze River for summer. In winter, the overestimation is stronger in western and eastern China but weaker in central and southwestern China, while the underestimation is stronger in northwestern Northeast China but weaker in northern Xinjiang and South China in the median of CMIP6 GCMs as compared to the CMIP5-GCM median. The differences of model biases for the interannual variability of annual, spring, summer, and autumn temperature are small between CMIP5 and CMIP6 GCMs (Fig. S6). On the whole, the average agreement of CMIP6 GCMs in sign with the median bias is 79%−88% on annual and seasonal scales, which is higher than that of CMIP5 ones.
-
Concerning the climatic mean, GCMs perform worse for precipitation than for temperature over China (Figs. 1 and 5). SCCs, normalized standard deviations, and normalized CRMSEs are 0.53−0.89, 0.16−1.90, and 0.62−1.55, respectively, for annual precipitation in the 42 CMIP6 GCMs. Those three statistics for the seasons are comparable to the annual values except for winter, during which they show a large dispersion among GCMs. Most SCCs are at relatively high values, indicating that CMIP6 GCMs have reliable abilities in simulating the spatial pattern of precipitation climatology. Most standard deviations are greater than the observed values, indicating an overestimation of the spatial variability of precipitation. It is noteworthy that the model MCM-UA-1-0 greatly underestimates the annual and seasonal spatial variabilities with a very low normalized standard deviation of 0.15−0.31. In general, CMIP6 GCMs show the best performance in spring owing to the best reproducibility of spatial variability, followed by summer and autumn, and the worst in winter due to the poorest reproducibility of both spatial pattern and variability.
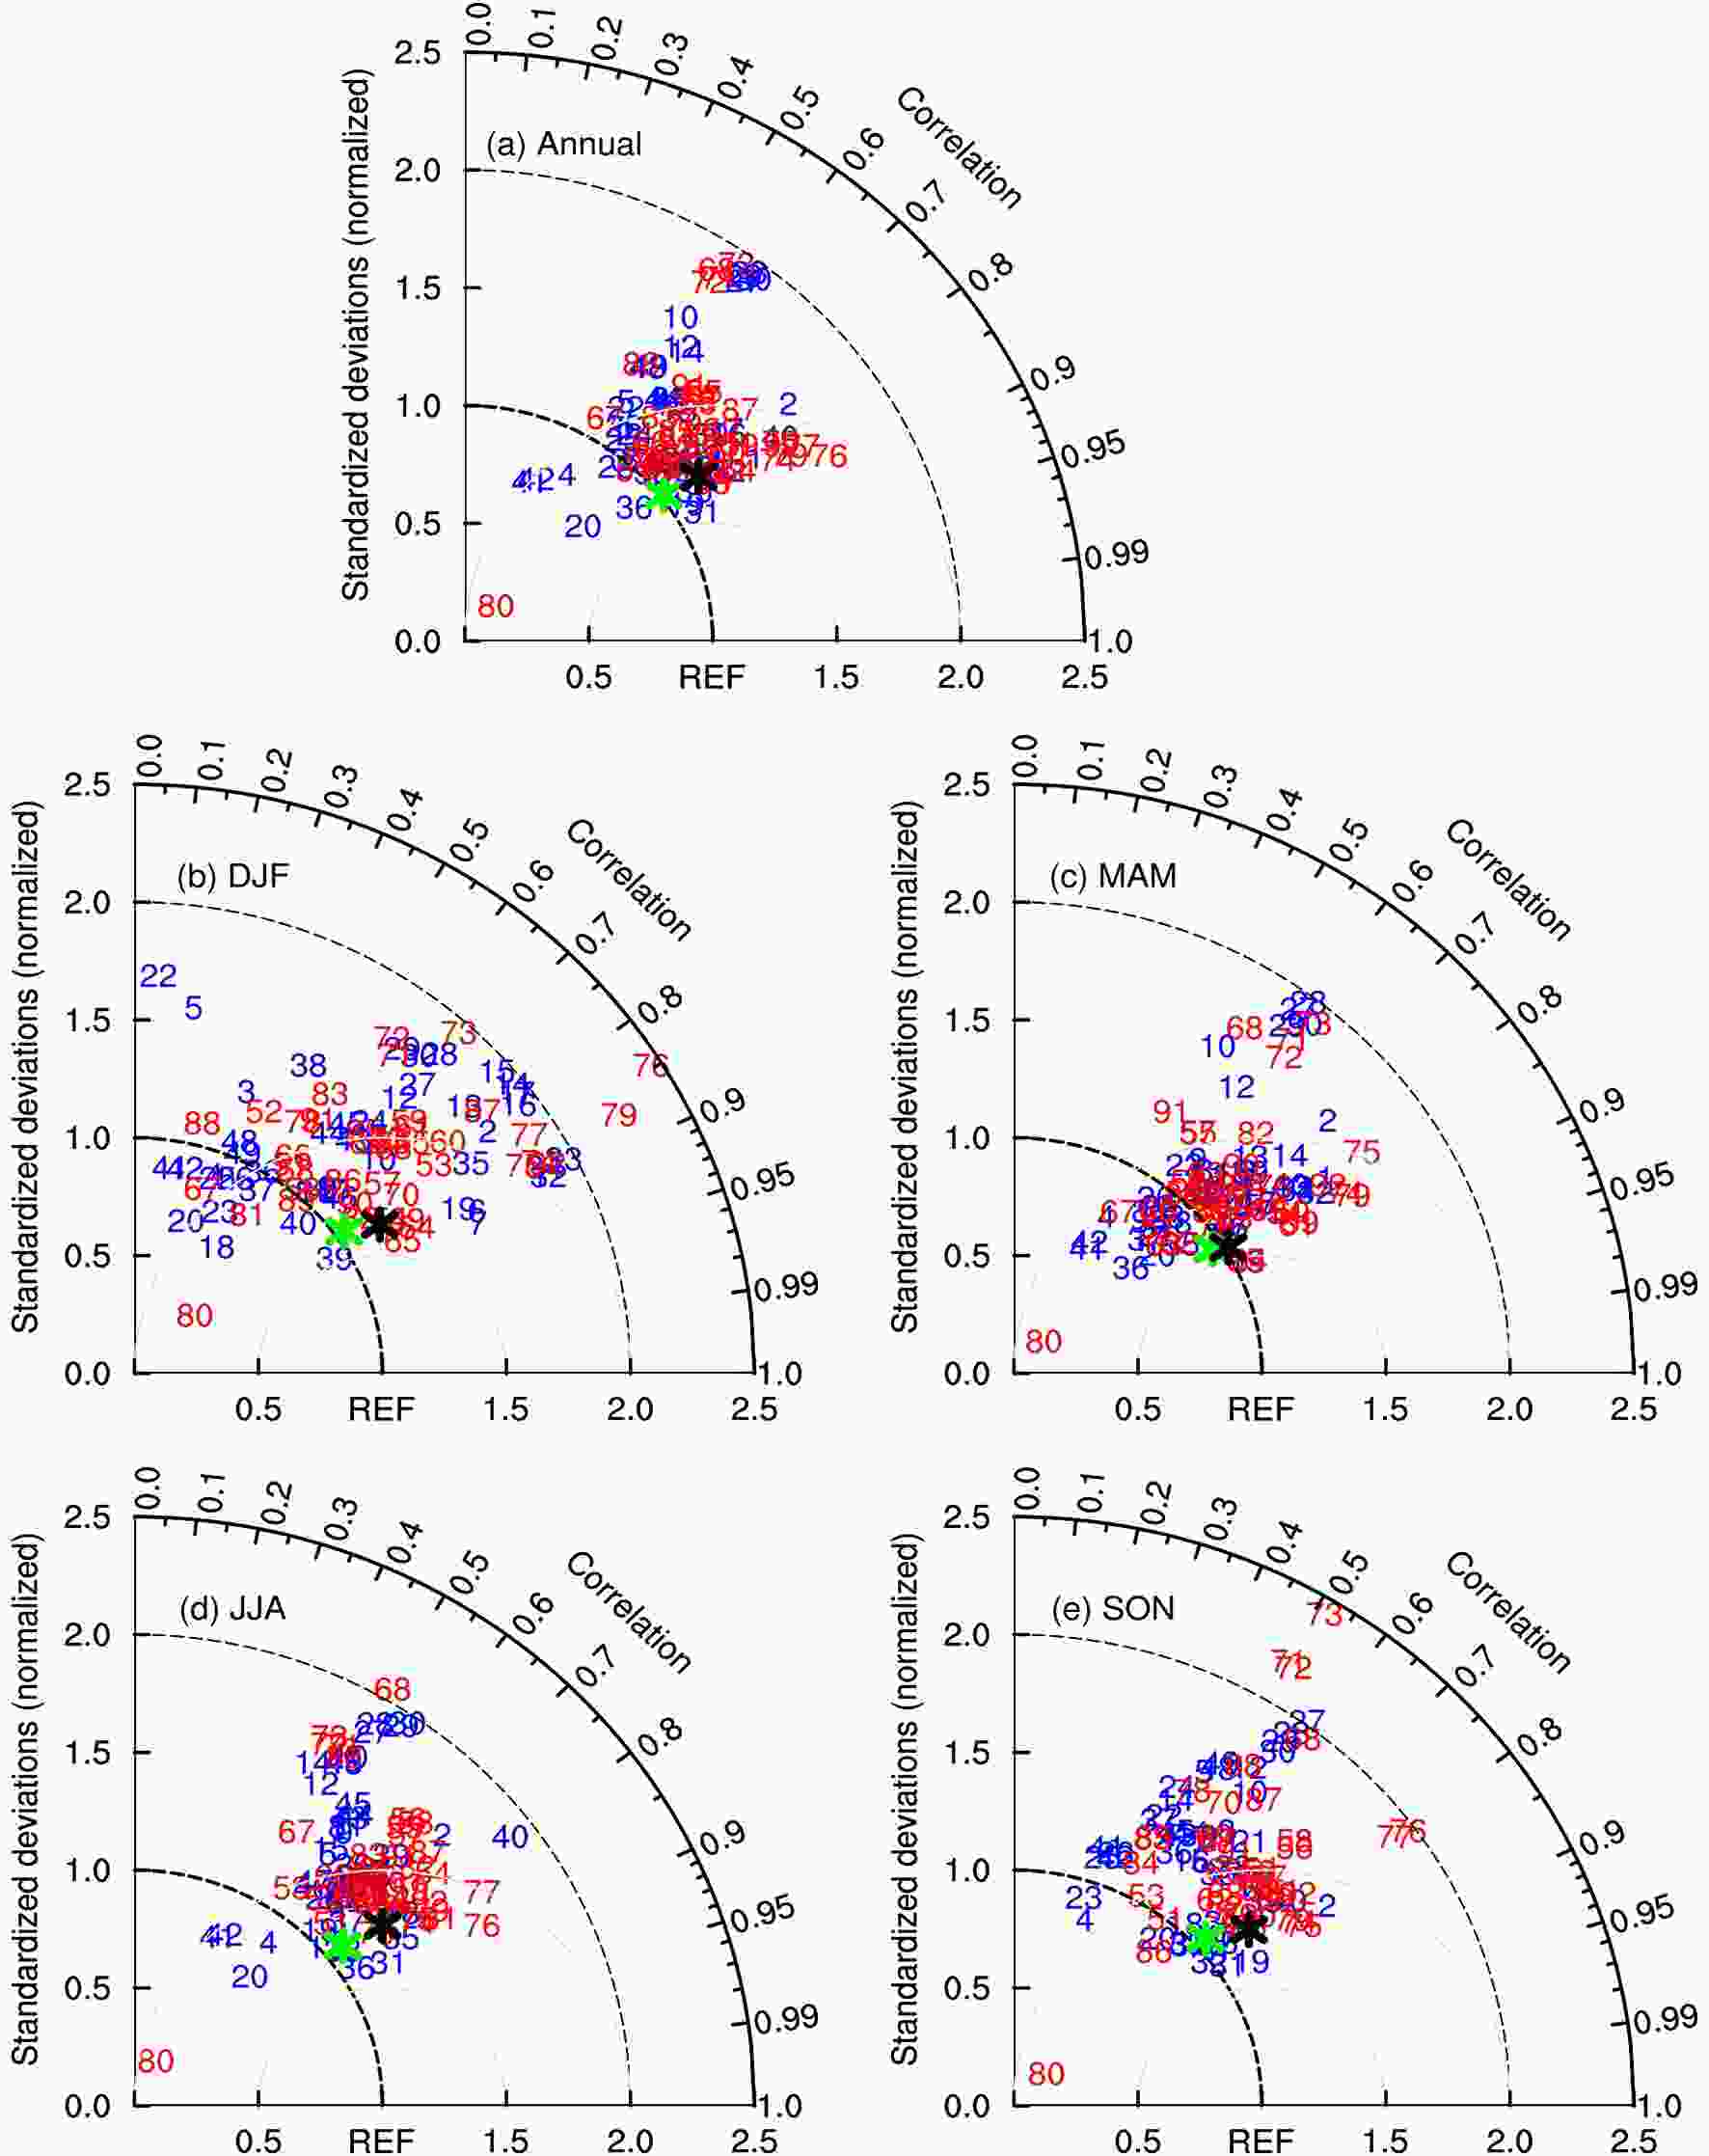
Figure 5. Taylor diagrams displaying normalized pattern statistics of climatological (a) annual, (b) DJF, (c) MAM, (d) JJA, and (e) SON precipitation over China for the period 1961–2005 between 91 GCMs and observations. Other aspects are the same as in Fig. 1.
Compared to the CMIP5 GCMs, SCCs are higher but standard deviations are further away from the observation in CMIP6 GCMs (Fig. 5), showing a relative superiority for reproducing the geographical distribution but an inferiority for the spatial variability. As a whole, the median of the 49 CMIP5 GCMs slightly outperforms the 42-CMIP6-GCM median since its normalized CRMSEs are generally smaller. Furthermore, 12 (4) of 25 CMIP6 GCMs show better (poorer) skills than their CMIP5 parents since the CRMSEs are overall smaller (larger) in the former than in the latter, and the remaining nine pairs of CMIP5 and CMIP6 GCMs have similar scores owing to comparable CRMSEs (Table S3). Taken together, the performance of GCMs for precipitation has slightly enhanced from CMIP5 to CMIP6, based on a fair comparison of GCMs developed from the same modeling group, which is suggested to intrinsically relate to the improvement of the main physics schemes with a single model analysis (Wu et al., 2019).
As the grid area grows, the normalized CRMSEs of CMIP6 GCMs slightly increase, with all correlation relationships being statistically insignificant at the 90% confidence level (Fig. 2d). This means that no evident relationship is seen between the skill of CMIP6 GCMs for climatological precipitation and model resolution, which is in line with the result from 13 CMIP3 and 19 CMIP5 GCMs in Song and Zhou (2014), but differs from the results of Gao et al. (2006) and Kusunoki and Arakawa (2015). Other than the model resolution, the model physics schemes (e.g., convection scheme) also need to be developed accordingly to reproduce the most realistic results. By comparison, when the horizontal resolution improves, the skill of CMIP5 GCMs is significantly promoted for winter and autumn precipitation (Fig. S7).
The Taylor diagrams feature similar statistics for precipitation climatology over China as obtained from the arithmetic mean and the median of the 42 CMIP6 GCMs, which outperform the majority of individual GCMs (Fig. 5). The large-scale characteristics are well captured by most individual GCMs and their means, such as a southeast–northwest gradient and an obvious seasonality with the annual total being determined in descending order by summer, spring, autumn, and winter precipitation (Sui et al., 2013) (Fig. 6). Meanwhile, national-scale precipitation is overestimated by GCMs, as already noted in previous studies (Jiang et al., 2005, 2016; Xu et al., 2007; Chen and Frauenfeld, 2014a), with an average of 35% for the annual mean, 79% for winter, 53% for spring, 19% for summer, and 33% for autumn according to the median of the 42 CMIP6 GCMs. These biases are similar in magnitude to the 49-CMIP5-GCM median (Fig. S8). Additionally, there is a statistically significant relationship between the country-averaged precipitation and temperature biases, with a positive correlation (weaker cold biases versus greater precipitation overestimate in models) for the annual mean, winter, spring, and autumn among the 27, 26, 31, and 25 CMIP6 GCMs, respectively, but only for summer among the 27 CMIP5 GCMs. At the regional scale, excessive precipitation is simulated in most of West, Northeast, and North China, while a deficit occurs in Southeast China. Compared to the CMIP5 GCMs, the above underestimation of the southeast–northwest gradient is overall weaker in the CMIP6 GCMs (Fig. S8), which may be partly originated from improvements of convective and microphysical parameterization schemes (Wu et al., 2019).
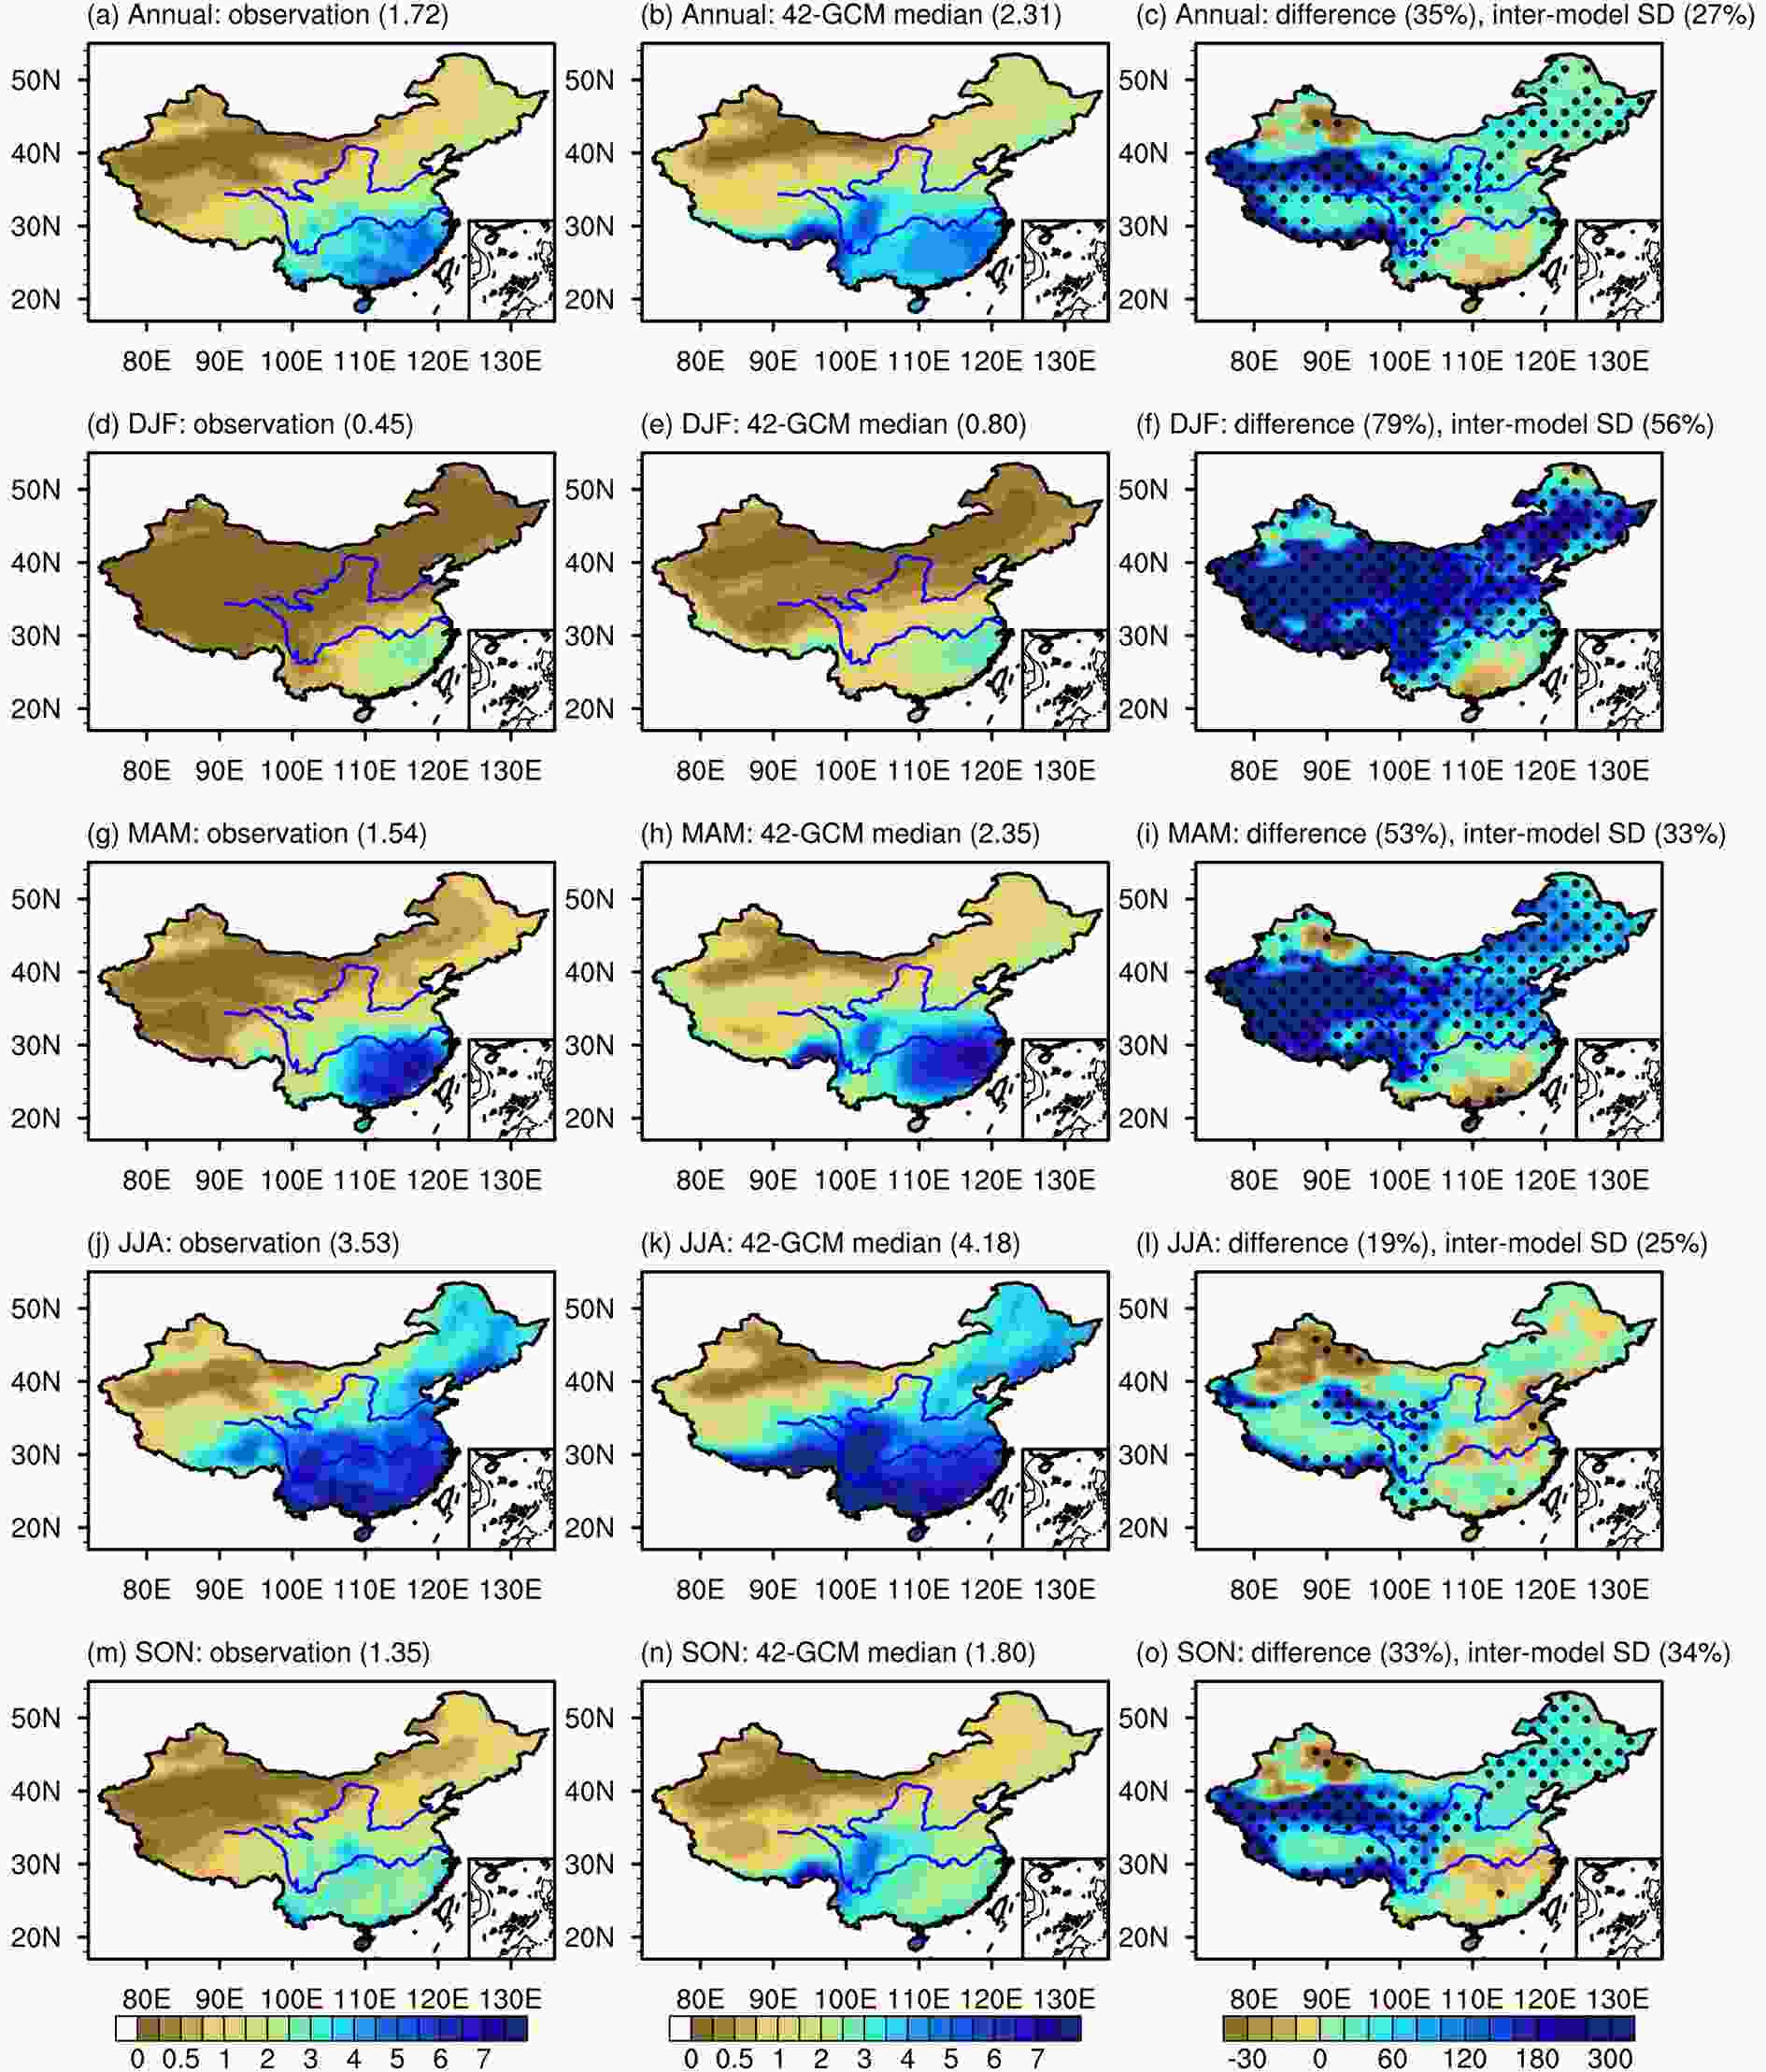
Figure 6. Climatological annual and seasonal precipitation over China for the period 1961–2005 as obtained from observation (left column, units: mm d−1), the median of the 42 CMIP6 GCMs (middle column, units: mm d−1), and the difference in percentage between the median and observation (right column). The regional average value in China and the inter-model standard deviation of the difference in percentage averaged over the country (right column, inter-model SD) are given in parentheses. The dotted areas in the right panels represent regions where at least 80% of the GCMs share the same sign of bias.
-
The capability of CMIP6 GCMs in simulating the geographical distribution of the interannual variability of precipitation is reasonably good, with annual and seasonal SCCs ranging from 0.45 to 0.92 (Fig. 7). Normalized standard deviations are 0.19−1.93 and greater than one in most CMIP6 GCMs, indicating an overestimation of the spatial variability. Normalized CRMSEs are 0.49−1.55 for the annual mean and vary from 0.45 to 1.63 on seasonal scales. The CMIP6 GCMs perform best in winter owing to best reproducibility of spatial variability, followed by autumn, and worse for the annual mean and the other seasons because of a relatively poorer reproducibility of both spatial pattern and variability. In general, the skill of CMIP6 GCMs for the interannual variability of precipitation is similar to its climatology and superior (inferior) to the interannual variability (climatology) of temperature, with the latter being mainly due to an overall better (worse) reproducibility of both geographical distribution and spatial variability (Figs. 1, 4, 5, and 7). In addition, the median of the 42 CMIP6 GCMs resembles the 49-CMIP5-GCM median (Fig. 7). Moreover, eight (eight) of 25 CMIP6 GCMs perform better (worse) than their CMIP5 parents because of overall smaller (larger) normalized CRMSEs, while the remaining nine pairs of GCMs are similar (Table S4). As such, there is little difference between the CMIP5 and CMIP6 GCMs in simulating the interannual precipitation variability.

Figure 7. Taylor diagrams displaying normalized pattern statistics of the interannual variability of (a) annual, (b) DJF, (c) MAM, (d) JJA, and (e) SON precipitation over China for the period 1961–2005 between the 91 GCMs and observations. Other aspects are the same as in Fig. 1.
Similar to the climatological precipitation, the normalized CRMSEs of CMIP6 GCMs for the interannual precipitation variability generally increase with the original grid mesh area, with the correlation relationship being statistically significant at the 90% confidence level in winter, summer, and autumn (Fig. S3d). In comparison, the normalized CRMSEs of CMIP5 GCMs increase more significantly with the grid area in winter and autumn, but vary very little in summer (Fig. S9). Altogether, the skill of GCMs for the interannual precipitation variability links to their resolutions in winter and autumn in both CMIP6 and CMIP5 but in summer in CMIP6 only.
The arithmetic mean and the median of all GCMs feature very close statistics and outperform most of the individual GCMs (Fig. 7). The observed geographical distribution of interannual precipitation variability has similar characteristics with that of the climatological mean (Fig. S10). Most of the individual GCMs and their means qualitatively reproduce those features, but overestimate both annual and seasonal magnitudes over most of the country. Concerning the median of the 42 CMIP6 GCMs, the annual and seasonal biases against the observation average 28%–65% over China, which are comparable to those from the 49-CMIP5-GCM median (Fig. S11). The interannual precipitation variability is notably overestimated in western and northeastern China excluding northwestern Xinjiang for winter, and over the Tibetan Plateau excluding its central and eastern parts for the annual mean and the other seasons. On the contrary, an underestimation occurs in parts of Southeast China and Xinjiang annually and in summer and autumn, and in parts of South China in winter and spring. These biases resemble each other in the median of CMIP5 and CMIP6 GCMs (Fig. S11).
-
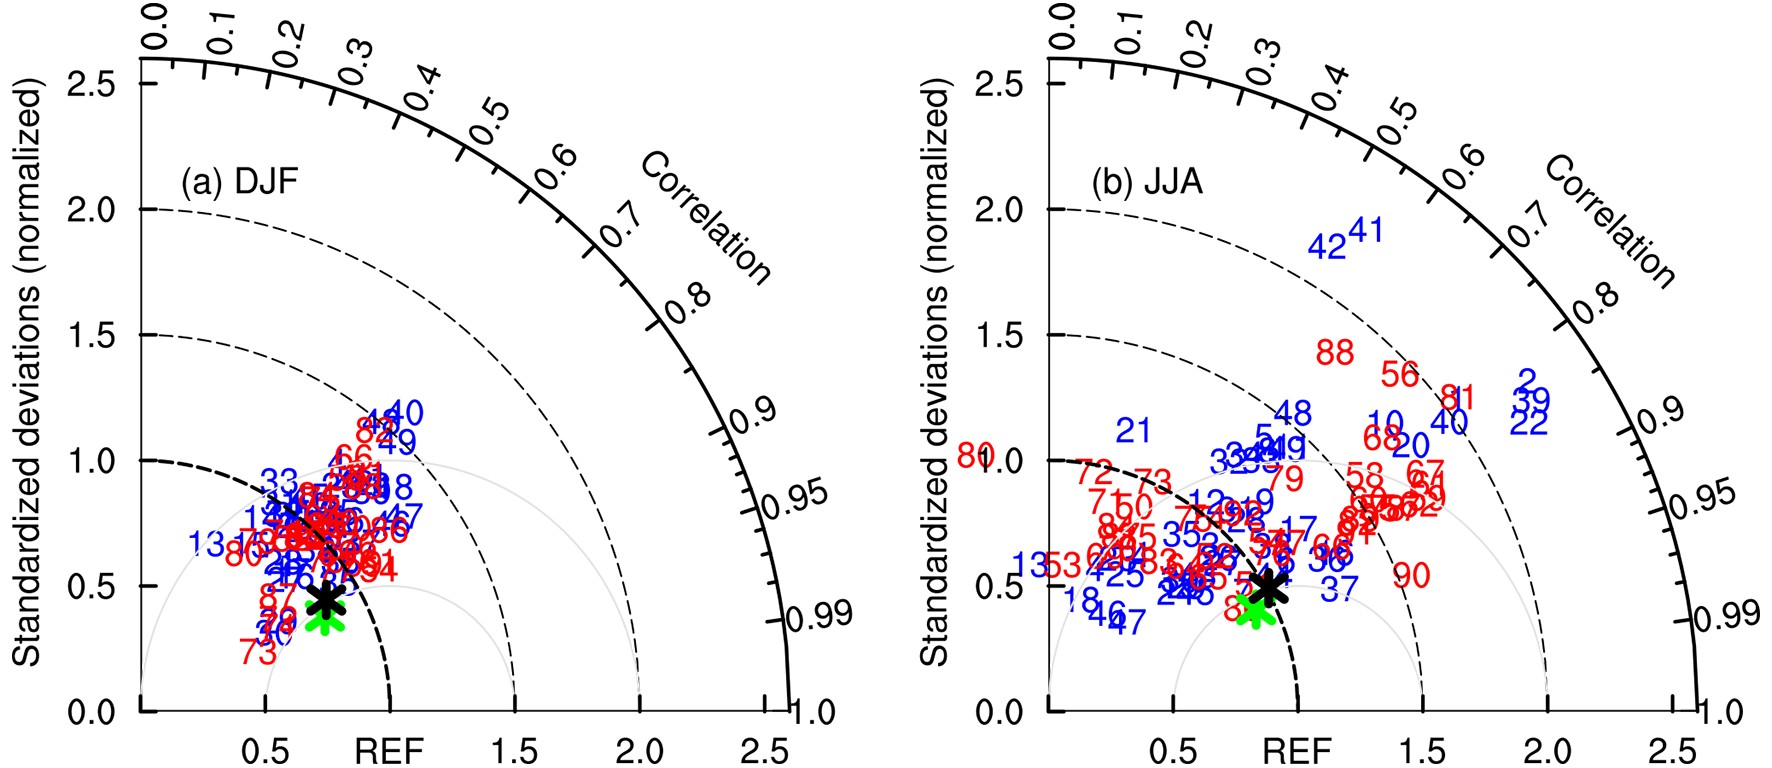
The East Asian winter monsoon (EAWM) is evaluated by the meridional wind speeds at 10 m averaged within (25°–40°N, 120°–140°E) and (10°–25°N, 110°–130°E) (Chen et al., 2000), and the East Asian summer monsoon (EASM) is evaluated by the meridional wind speeds at 850 hPa averaged within (20°–40°N, 105°–120°E) (Jiang and Tian, 2013; Jiang et al., 2016). The capability of CMIP6 GCMs in reproducing the EAWM is better than that for the EASM (Fig. 8). Based on 2400 grid points, the SCCs, normalized standard deviations and CRMSEs are 0.55−0.89, 0.53−1.46, and 0.57−1.12, respectively, for the climatological EAWM across the 31 CMIP6 GCMs. In summer, the ability of the 42 CMIP6 GCMs shows a large spread in simulating the EASM climatology. Based on 1135 grid points, SCCs vary from −0.25 to 0.93, with one negative value for MCM-UA-1-0; and normalized standard deviations and CRMSEs are 0.59–2.09 and 0.47–1.62, respectively.

Figure 8. Taylor diagrams displaying normalized pattern statistics of climatological meridional winds at (a) 10 m within the regions of (25°–40°N, 120°–140°E) and (10°–25°N, 110°–130°E) between the 71 GCMs and observations in winter, and (b) at 850 hPa within the region (20°–40°N, 105°–120°E) between the 90 GCMs and observations in summer, for the period 1979–2005. Blue and red numbers indicate CMIP5 and CMIP6 GCMs listed in Table 1, respectively. Green and black asterisks in (a) represent the median of the 40 CMIP5 and 31 CMIP6 GCMs; while those in (b) represent the median of the 48 CMIP5 and 42 CMIP6 GCMs, respectively. Other aspects are the same as in Fig. 1.
Figure 8 shows that the 31 CMIP6 and 40 CMIP5 GCMs have similar skills for winter monsoon, and the spread across the 42 CMIP6 GCMs is smaller than that across the 48 CMIP5 GCMs for summer monsoon. When viewed from the multi-model mean, the median of the 31 (42) CMIP6 GCMs performs slightly worse than the median of the 40 (48) CMIP5 GCMs in winter (summer) because of both a lower SCC and a larger normalized CRMSE. Furthermore, nine (two) of 19 CMIP6 GCMs are superior (inferior) to their CMIP5 parents since the CRMSEs are comparatively smaller (larger), and the remaining eight pairs of CMIP5 and CMIP6 GCMs perform similarly with comparable CRMSEs for winter monsoon. In summer, 12 (11) of 24 CMIP6 GCMs are more (less) skillful than their CMIP5 counterparts due to smaller (larger) normalized CRMSEs, with the remaining one pair of GCMs displaying comparable skills (Table S5). Taken together, the majority of CMIP6 GCMs have advantages over their CMIP5 parents for the EAWM, possibly due to their added value in capturing the Siberian high, the Aleutian low, or the El Niño–Southern Oscillation–EAWM relationship (Gong et al., 2014); however, there is little improvement from the CMIP5 to CMIP6 GCMs for the EASM, probably owing to their similar deficiencies in the El Niño–Southern Oscillation–EASM relationship (Fu and Lu, 2017), both of which need to be further studied.
As the grid area grows, the normalized CRMSEs of CMIP6 GCMs change very little for the EAWM, but increase significantly for the EASM at the 99% confidence level (Fig. 2f). By contrast, there is no obvious trend for the normalized CRMSEs of CMIP5 GCMs with the horizontal resolution for both the EAWM and EASM (Fig. 2e). Therefore, the skill of GCMs in simulating the EASM relates to the horizontal resolution in CMIP6, which may be partly associated with improvements in the deep convection schemes and reproducibility of the location and intensity of the western North Pacific subtropical high in summer (Kusunoki and Arakawa, 2015), whereas that for winter monsoon is not affected by resolution in CMIP5/6 GCMs.
The arithmetic mean and the median of CMIP5/6 GCMs outperform most of the individual GCMs (Fig. 8). In winter, there are two branches of surface northerly winds over the target regions. One turns eastward to the subtropical northwestern Pacific, and the other turns westward and blows along the East Asian coast to the South China Sea (Fig. 9a). The above large-scale feature holds for the 31-CMIP6-GCM median (Fig. 9b). However, GCMs simulate a weaker strength of northerly winds in the northern target region as demonstrated by anomalous southerly winds, and show small but not systematical wind anomalies in the southern part (Fig. 9c). Those biases of EAWM circulation are also true for the median of the 40 CMIP5 GCMs (Fig. S12). The EASM features prevailing southerly winds in the lower troposphere, which are converged from the cross-equatorial airflow in South Asia, the southwesterly wind from the Bay of Bengal, and the southeasterly wind from the western North Pacific (Fig. 9d). The median of the 42 CMIP6 GCMs has reliable skill in reproducing those main characteristics of the EASM circulation (Fig. 9e). Compared to the observation, however, an anomalous anticlockwise circulation exists in the southwestern North Pacific, leading to northerly wind anomalies in the southern part of the target region; and an anomalous clockwise circulation appears in the northwestern North Pacific, with southerly wind anomalies occurring in the northern part of the target region (Fig. 9f). That means the GCMs underestimate summer monsoon circulation in southern East Asia but overestimate it in the northern part. The median of the 48 CMIP5 GCMs displays similar summer wind anomalies over East Asia (Fig. S12). In addition, when considering all 28 CMIP6 (30 CMIP5) GCMs that reproduce both excessive winter precipitation averaged across eastern China (east of 105°E) and a weaker-than-observed EAWM, denoted by a positive meridional winter wind bias at 10 m regionally averaged within (25°–40°N, 120°–140°E) and (10°–25°N, 110°–130°E), the bias magnitudes correlate positively and statistically significantly at the 99% (87%) confidence level with each other (Fig. S13). For 16 CMIP5 GCMs that reproduce both insufficient summer precipitation across eastern China and a weakened EASM, represented by a negative meridional summer wind bias at 850 hPa regionally averaged within (20°–40°N, 105°–120°E), the underestimated magnitudes correlate positively and statistically significantly at the 95% confidence level with each other, but the relationship is insignificant for the 12 CMIP6 GCMs (Fig. S13).
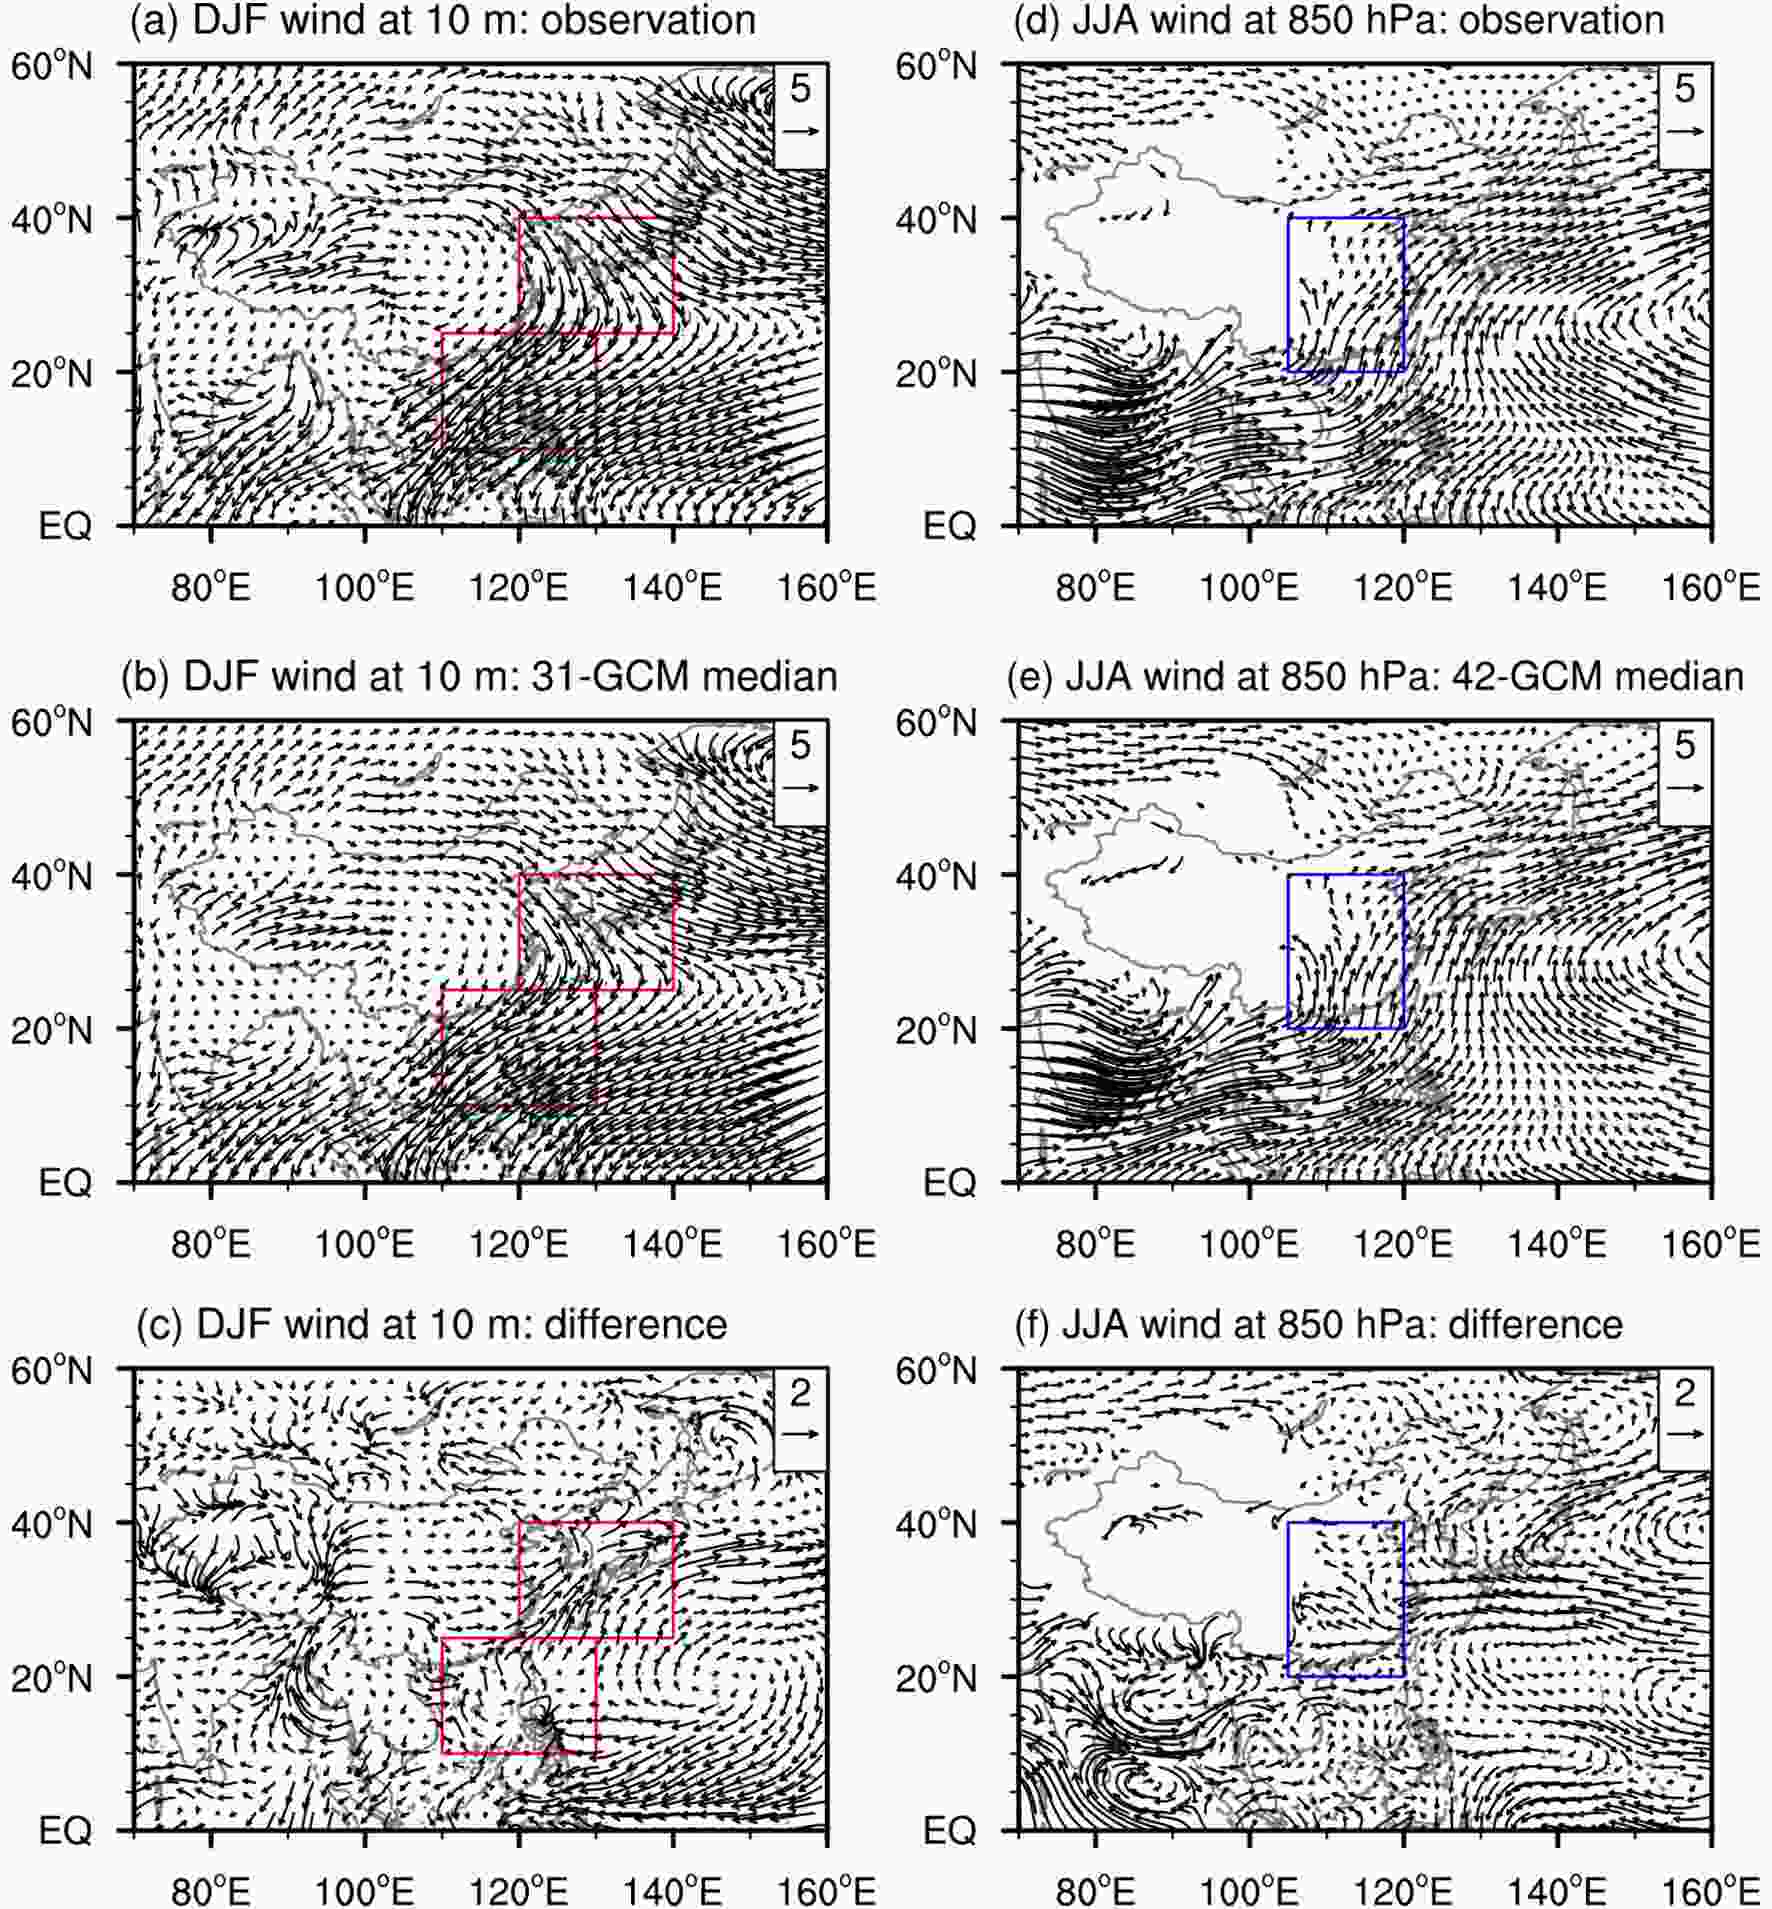
Figure 9. Climatological winter winds at 10 m (left panels, units: m s−1) and summer winds at 850 hPa (right panels, units: m s−1) for observation (top panels), the median of the 31 and 42 CMIP6 GCMs (middle panels), and the difference between the median and observation (bottom panels) for the period 1979–2005. The red rectangles in the upper panels show the regions of (25°–40°N, 120°–140°E) and (10°–25°N, 110°–130°E), and the blue rectangles in the bottom panels show the region of (20°–40°N, 105°–120°E). Regions with elevation higher than 1500 m, approximately 850 hPa, are left blank in the bottom row.
3.1. Temperature climatology over China
3.2. Interannual variability of temperature over China
3.3. Precipitation climatology over China
3.4. Interannual variability of precipitation over China
3.5. East Asian monsoon
-
This study assesses the skill of 49 CMIP5 and 43 CMIP6 GCMs in simulating the climatology and year-to-year variability of temperature and precipitation over China for the period 1961–2005, as well as the East Asian monsoon for the period 1979–2005. The primary conclusions are as follows.
The current CMIP6 GCMs have reliable abilities in simulating the geographical distribution of climatological temperature and precipitation over China, with better performance for temperature than for precipitation, and they outperform their CMIP5 predecessors. However, most of them simulate larger spatial variability of spring temperature and precipitation. Cold biases still exist in most GCMs, particularly in winter and spring. Based on their median, the CMIP6 GCMs produce average cold biases of 0.22°C−1.06°C on annual and seasonal scales (Fig. 3), which are weaker than those in the median of CMIP5 GCMs (Fig. S2). GCMs simulate 16%–80% more national-scale precipitation than observed, and there is a weaker underestimation of the southeast–northwest gradient in CMIP6 than in CMIP5 GCMs (Fig. S8). When the horizontal resolution becomes finer, the skills of GCMs increase for temperature and winter and autumn precipitation, with the relationship being clearer (less evident) in CMIP6 than in CMIP5 GCMs for the former (latter).
The performance of GCMs in simulating the interannual variability of temperature (precipitation) is worse than (comparable to) its climatic mean. Most GCMs reasonably simulate the geographical distribution but overestimate the spatial variability of the interannual variability, and there is little improvement from the CMIP5 to CMIP6 GCMs. The biases are relatively large (small) for the interannual variability of temperature and precipitation in winter and spring (summer and autumn).
The main characteristics of the East Asian monsoon are well captured by GCMs, although there is an underestimation (overestimation) of the strength over northern Asia in winter (summer) and over southern Asia in summer. The performance for the EAWM is better than that for the EASM. The majority of CMIP6 GCMs have advantages over their CMIP5 predecessors for the EAWM, but show little difference for the EASM. The skill of CMIP6 GCMs for the EASM links to their horizontal resolutions. As a whole, similar skills exist between the arithmetic mean and the median of multiple GCMs, both of which perform better than most of the individual GCMs in every respect.
Acknowledgements. We sincerely thank the three anonymous reviewers for their insightful comments and suggestions to improve this manuscript. We also acknowledge the climate modeling groups (listed in Table 1) for producing and sharing their model output. This research was supported by the National Natural Science Foundation of China (Grant Nos. 41991284 and 41888101) and the National Key R&D Program of China (Grant No. 2018YFA0606501).
Electronic supplementary material: Supplementary material is available in the online version of this article at
https://doi.org/10.1007/s00376-020-2034-y .
 AAS Website
 AAS WeChat