


 DownLoad:


-
In recent years, an increasing number of bulk microphysics schemes (BMSs) incorporating cloud condensation nuclei (CCN) have been made available for research and weather prediction. Many schemes are used in numerical modeling studies to explore aerosol effects on cloud and precipitation at various scales. As computational capability advances significantly, regional models can achieve a finer spatial-temporal resolution to smaller than 10 km horizontal grid spacing. There is an increasing demand to consider aerosols for weather prediction around the world. However, a simple and clear obstacle is that aerosol parameterizations vary from one BMS to another, and they are seldom compared and discussed. As Fan et al. (2016) concluded, the large variability of cloud microphysics parameterizations resulting in a large spread of modeling results would be a great challenge. This paper aims to identify the differences between two aerosol-aware BMSs, i.e., the Thompson and the Chen-Liu-Reisner (CLR), with the widely used Weather Research and Forecast (WRF) model (Skamarock et al., 2008) and gain insights into the parameterized aerosol effects.
Earlier observation has revealed some aerosol effects on precipitation. Andreae et al. (2004) and Lin et al. (2006) analyzed in situ and satellite observations and found that increases in smoke and surface heat due to biomass burning likely led to higher cloud top heights, augmentation of cold processes, and invigoration of the updraft, and increased rainfall over the Amazon basin. Qian et al. (2009) observed a decreasing trend in light rain (<10 mm d−1) and an increasing trend in heavy rain (>50 mm d−1) over heavily polluted East China from 1956−2005.
Numerical simulations have been performed extensively for a wide variety of polluted cloud systems. A robust result of warm-rain suppression has been found (e.g., Phillips et al., 2002; Khain and Pokrovsky, 2004; Khain et al., 2005; Rosenfeld, 1999; Rosenfeld et al., 2007; Cheng et al., 2007, 2010). A high concentration of aerosols can activate a significant number of small droplets leading to a low autoconversion and collision rate, resulting in a time delay of raindrop formation. These results are consistent with the cloud lifetime effect proposed by Albrecht (1989), in that higher concentrations of CCN led to smaller droplets, decreasing precipitation efficiency and prolonging cloud lifetime.
Several numerical studies have been conducted to understand aerosol effects on deep convection. Phillips et al. (2002) found that precipitation efficiency decreased substantially as CCN enhanced the ice glaciation in the numerical simulations of shallow cumulus clouds. In addition, as larger concentrations of cloud droplets elevated and froze aloft, the latent heating generated during freezing enhanced the cold-rain processes, known as the invigoration effect (Andreae et al., 2004; Khain et al., 2005; Koren et al., 2005; Rosenfeld et al., 2008; Altaratz et al., 2014; Alizadeh-Choobari and Gharaylou, 2017; Alizadeh-Choobari, 2018). Consequently, precipitation was enhanced in a polluted environment as the convective cloud developed to higher levels. Rosenfeld et al. (2008) introduced a conceptual model combining precipitation microphysics and dynamical feedback that explains the reason for why pristine tropical clouds with low CCN concentrations rain out quickly, whereas heavily polluted clouds are long-lived and evaporate much of their water before precipitation could occur. Moreover, the shift of hydrometeors to higher levels under polluted conditions appears to enhance the formation of large hail and results in more vigorous convection. Nevertheless, numerical results also show that the invigoration effect could lead to vigorous convection and cold-rain processes, but become insignificant when the initial CCN concentration exceeds a certain level (Wang, 2005). Often, the different interpretations of simulation results cast additional concerns about the parameterization of aerosol microphysical effects. For example, Morrison and Grabowski (2011) found that convection was slightly weakened in the polluted ensemble simulations by the upper-tropospheric radiative heating due to greater anvil height rather than being intensified by the aerosol-induced invigoration effect. More complicated factors include that the precipitation could be enhanced or suppressed in a dirty environment depending on the environmental moisture (Tao et al., 2007).
Some studies have also found that aerosol concentration likely play an important role in the convective dynamics of cloud systems through low-level evaporative cooling. Lee et al. (2009) concluded that in the WRF model, higher droplet number concentrations resulted in smaller auto-conversion of cloud liquid to rain, enabling a higher quantity of cloud liquid to be available for evaporative cooling, leading to more intense downdrafts, low-level convergence, and updrafts. Arguably, some studies showed that low-level evaporative cooling was primarily caused by rainwater with cloud or mesoscale models; thus, the cooling was weakened because of the decreased rainwater content when the cloud system developed in a polluted environment (for example, Han et al., 2012; Lim and Hong, 2010; Kalina et al., 2014). The results of both cloud and mesoscale models suggest that evaporative cooling in the lower troposphere is a key process to determine whether high concentrations of CCN reduce or enhance precipitation. Stronger evaporative cooling has been seen to produce a stronger cold pool and, therefore, stronger low-level convergence through interactions with low-level wind shear. Therefore, precipitation became vigorous (Tao et al., 2007). So far, these aerosol effects on clouds and precipitation were largely proposed based on numerical simulations with different aerosol concentrations and were highly dependent on the fundamental differences in the microphysics parameterization being used.
The same numerical model does not always provide the same results for the microphysical and dynamical responses to aerosols due to the large variability of cloud microphysics parameterization (Fan et al., 2016). Past studies have investigated the complexity of bulk microphysics schemes (Bao et al., 2016; Huang et al., 2020) as well as mechanisms of aerosol effects on cloud and precipitation, with a single scheme (Kalina et al., 2014; Thompson and Eidhammer, 2014; Alizadeh-Choobari and Gharaylou, 2017) or more than one scheme (Lee et al., 2019; Khadke and Pattnaik, 2021). Xie and Liu (2015) found aerosol-induced precipitation change was strongly dependent on auto-conversion parameterization schemes, but the precipitation could be enhanced or reduced with different schemes. A great part of the complexities could originate from parameterization methods, which are highly dependent on the fundamental differences in the microphysics parameterization being used. Therefore, the scheme-dependent assumptions and parameterization methods also need to be examined during the investigation of aerosol parameterizations.
In this study, two aerosol-aware BMSs, the Thompson scheme (Thompson and Eidhammer, 2014) and the CLR scheme (Reisner et al., 1998; Chen and Liu, 2004), are used with the WRF model to simulate idealized supercell storms. Formerly, the aerosol effects were only represented by a varied droplet concentration before explicit budget equations for aerosol concentration became available for use, which makes it possible to parameterize activation rate in terms of aerosol size distribution and chemical properties. In the initial conditions of the idealized supercell storms, clean and polluted vertical profiles of aerosol concentrations are prescribed for the parameterized aerosol effects. The CLR scheme originally allows trimodal aerosol size distribution (ASD) but is remodeled to match the unimodal ASD used in the Thompson scheme for better comparison in this study. CCN activation and auto-conversion, highly sensitive to aerosol concentrations at cloud initiation, are compared given the same prescribed aerosol loading. The purpose of this comparison is to understand the differences in aerosol parameterizations between the two aerosol-aware BMSs. The following sections describe the model setup and numerical experiments. Section 3 presents (a) precipitation characteristics, (b) hydrometeor characteristics, (c) latent heat profile characteristics, and (d) the dynamical responses. Section 3(e) discusses the uncertainties in the warm-rain process, such as CCN activation and auto-conversion. The summary and conclusion are provided in section 4.
-
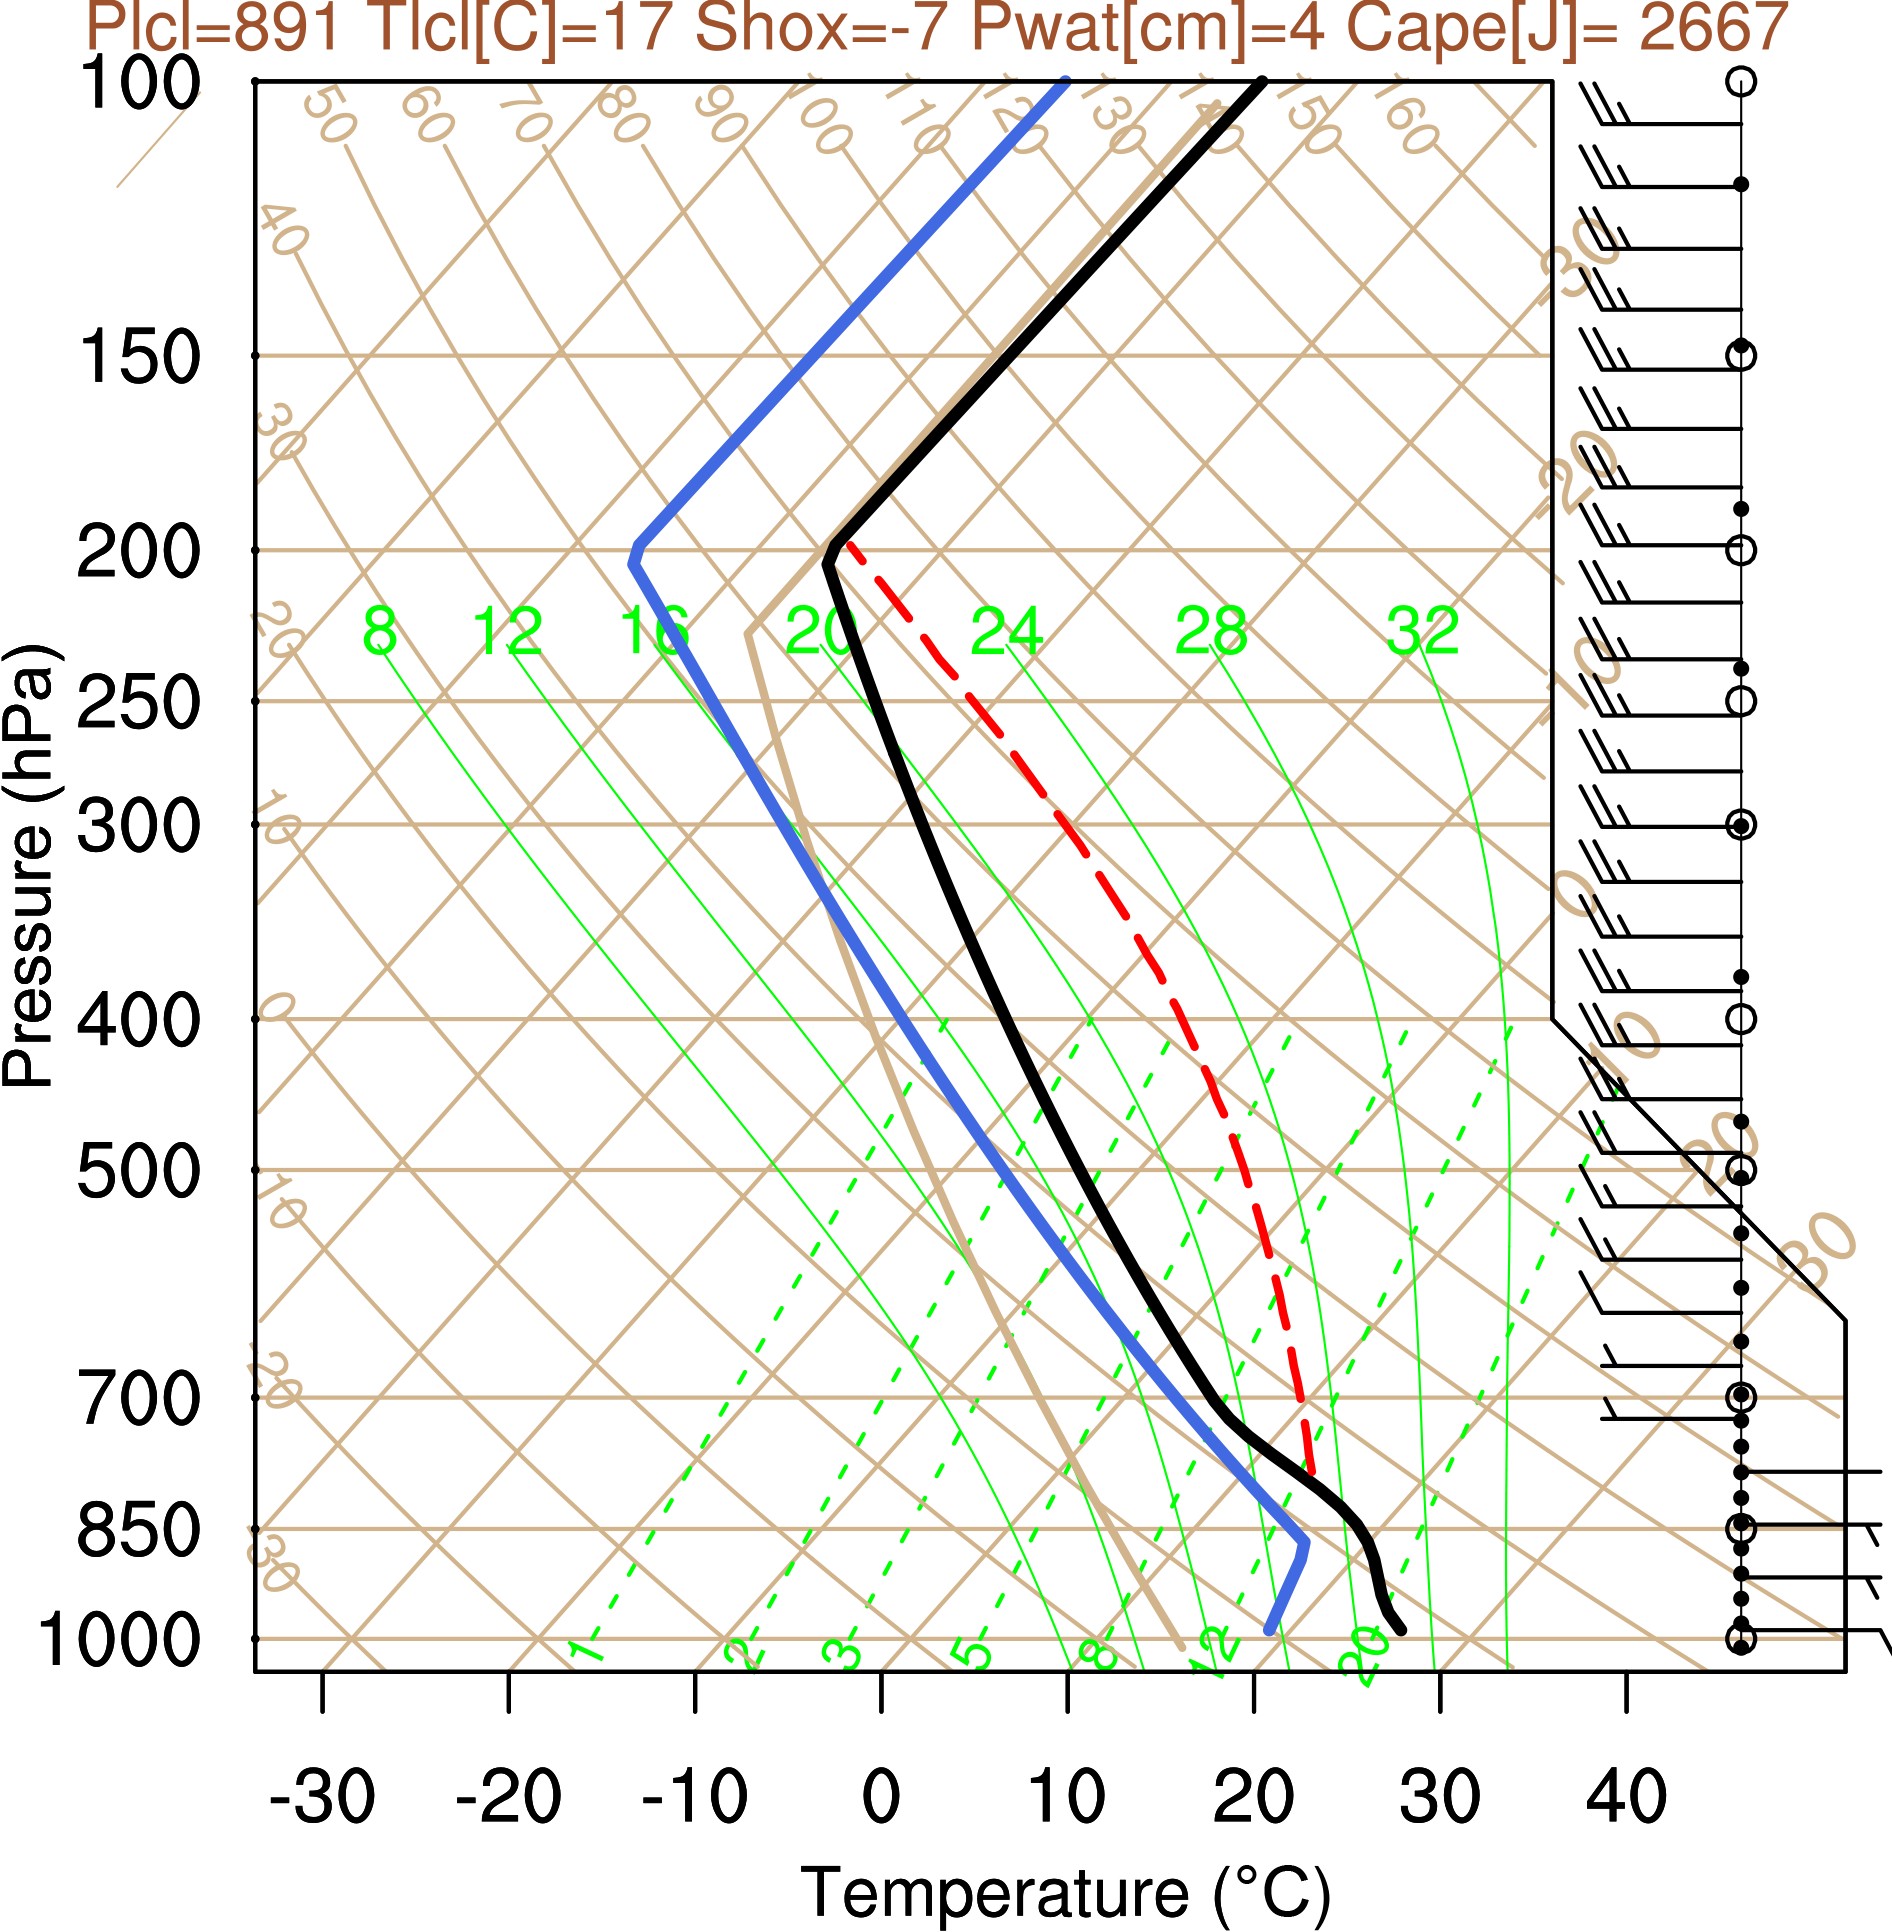
The simulations in this study use the WRF model version 3.8.1, employing aerosol-aware microphysics parameterization, open lateral boundary conditions, 3DTKE (Zhang et al., 2018), and a free-slip condition at the lower boundary. Dry aerosols are horizontally advected or locally diffused as cloud particles by model dynamics during the simulation. The model domain is 300 km × 300 km × 20 km, with each storm simulated for 3 h. Horizontal grid spacing is 1 km and vertical grid spacing is 200 m. The model has 101 vertical levels and the levels are equally spaced in height from the surface up to the top of the model. According to Weisman and Rotunno (2000), these resolutions are sufficient to resolve storm-scale features, such as mid-level updraft structure and low-level mesocyclogenesis but are not generally considered sufficient to accurately represent tornadogenesis. Storms are triggered using an ellipsoidal bubble of warm air with a horizontal radius of 10 km and a vertical radius of 1500 m, with a maximum temperature perturbation of 3 K specified at the center of the bubble, decreasing to zero at the edges. The thermodynamic profile used for each simulation is presented in Fig. 1, similar to that used by Weisman and Klemp (1982, 1984, 1986), representing an environment of moderate instability (2667 J kg−1 of Convective Available Potential Energy, CAPE), with moist conditions throughout the troposphere. The vertical wind shear is based on the unidirectional shear profile (or straight shear) in Weisman and Rotunno (2000) to simplify the interpretation of the results, leading to the generation of mirror-image "splitting" supercell storms.

Figure 1. Initial Skew-T diagram showing temperature (black line), dew point temperature (blue line), parcel ascent starting at the Level of Free Convection (red dashed line), and wind speed (bars) profiles used in model simulations.
Two 6-class aerosol-aware BMSs are used to represent aerosol effects in the simulations. Table 1 compares the predicted hydrometeor categories in the Thompson and CLR schemes: cloud water, cloud ice, rain, snow, and graupel; their density and size distribution (SD) are also listed. The Thompson scheme has a one-moment prediction of the mass mixing ratio for snow and graupel, and a two-moment prediction (addition of number concentration) for cloud water, cloud ice, and rainwater. Although the density and size distribution of hydrometeors are represented differently in the two schemes, the current study will show characteristic differences beyond those bulk properties. For aerosols, the types and chemical compositions are simplified into two categories: "water-friendly" aerosols (sulfates, sea salts, and organic matter) for CCN and "ice-friendly" aerosols, i.e., dust, for ice nuclei (IN), each with unimodal lognormal ASD. In comparison, the CLR scheme has two-moment predictions for each type of hydrometeor. The CCN is presumed to be non-coated background aerosols, and ice nuclei (IN) as dust, with a default trimodal lognormal ASD.
Prognostic variable Thompson CLR CCN (ASD) unimodal trimodal IN (ASD) unimodal trimodal Cloud water (moment, ρc, SD) double, 1000, gamma double, 1000, exp Rainwater (moment, ρr, SD) double, 1000, exp double, 1000, exp Cloud ice (moment, ρi, SD) double, 890, exp double, 500, exp Snow (moment, ρs, SD) single, 100, exp & gamma double, 100, exp Graupel (moment, ρg, SD) single, 500, exp double, 400, exp Table 1. The physical characteristics/properties of the prognostic variables in the Thompson and CLR schemes. The aerosol size distribution (ASD) is listed with the size distribution (SD) of each hydrometeor species along with the prognostic moment (s) and density (kg m−3). The exp and gamma stand for inverse exponential and incomplete gamma distributions, respectively.
Droplet nucleation is the most critical step for introducing dry aerosols into clouds. The Thompson scheme activates CCN using a look-up table as a function of five variables: air temperature, vertical velocity, number of available aerosols, pre-determined hygroscopicity (0.4, 0 for hydrophobic, and 1 for hydrophilic particulates), and the aerosol mean radius (0.04 μm). The look-up table is originally derived from an explicit treatment of the Köhler activation theory within a parcel model (Feingold and Heymsfield, 1992; Petters and Kreidenweis, 2007; Eidhammer et al., 2009). When the air is saturated, the condensation is parameterized by saturation adjustment in the Thompson scheme, but by explicit treatment of supersaturation in the CLR scheme. The CLR scheme activates CCN explicitly according to the Köhler equation. When supersaturation occurs, CCN with radii larger than the critical radius is activated. The critical radius is the minimum radius of activated CCN particles depending on supersaturation. According to Cheng et al. (2010), to simulate CCN activation and cloud diffusional growth, higher temporal resolution is needed, because supersaturation can change drastically after being explicitly resolved spatially. Therefore, the scheme uses time splitting integration in a Lagrangian framework, treating the airmass in each grid box as an ascending/descending air parcel, to resolve the changes in CCN and thermodynamic fields caused by activation and diffusional growth. In this way, the maximum supersaturation can be explicitly resolved, and the number of activated cloud drops can be more accurately simulated.
Some of the aerosol species are effective IN, such as mineral dust. IN activation is also parameterized by the two schemes independently of CCN activation. To be successfully activated, IN must compete with hydrometeors (and sometimes CCN) for water vapor. In the Thompson scheme, the deposition nucleation of IN is highly dependent on temperature and IN number concentration following the parameterization of DeMott et al. (2010). Part of the deliquesced CCN can also be nucleated to cloud ice as proposed by Koop et al. (2000). Besides, ice can also be initiated in the freezing processes (IN immersion or contact freezing), and the freezing rate would increase with increasing IN number concentration. In the CLR scheme, the total number concentration of cloud ice is predicted based on supersaturation with respect to the ice following Meyers et al. (1992). When the existing number of crystals exceeds the predicted amount, ice crystals are allowed to remain, but no additional condensation-freezing nucleation is performed. Contact freezing is not parameterized. When the IN is insufficient, cloud ice can be produced by the secondary ice production process (Hallett and Mossop, 1974) before homogeneous nucleation can occur in both schemes. To allow for the fully functional cold-rain process with the maximized IN effects, this study provides a sufficient IN number concentration of 400 per liter for all simulations, a concentration much larger than a typical background IN concentration of 0.1 particles per liter of air referred to by Eidhammer et al. (2010).
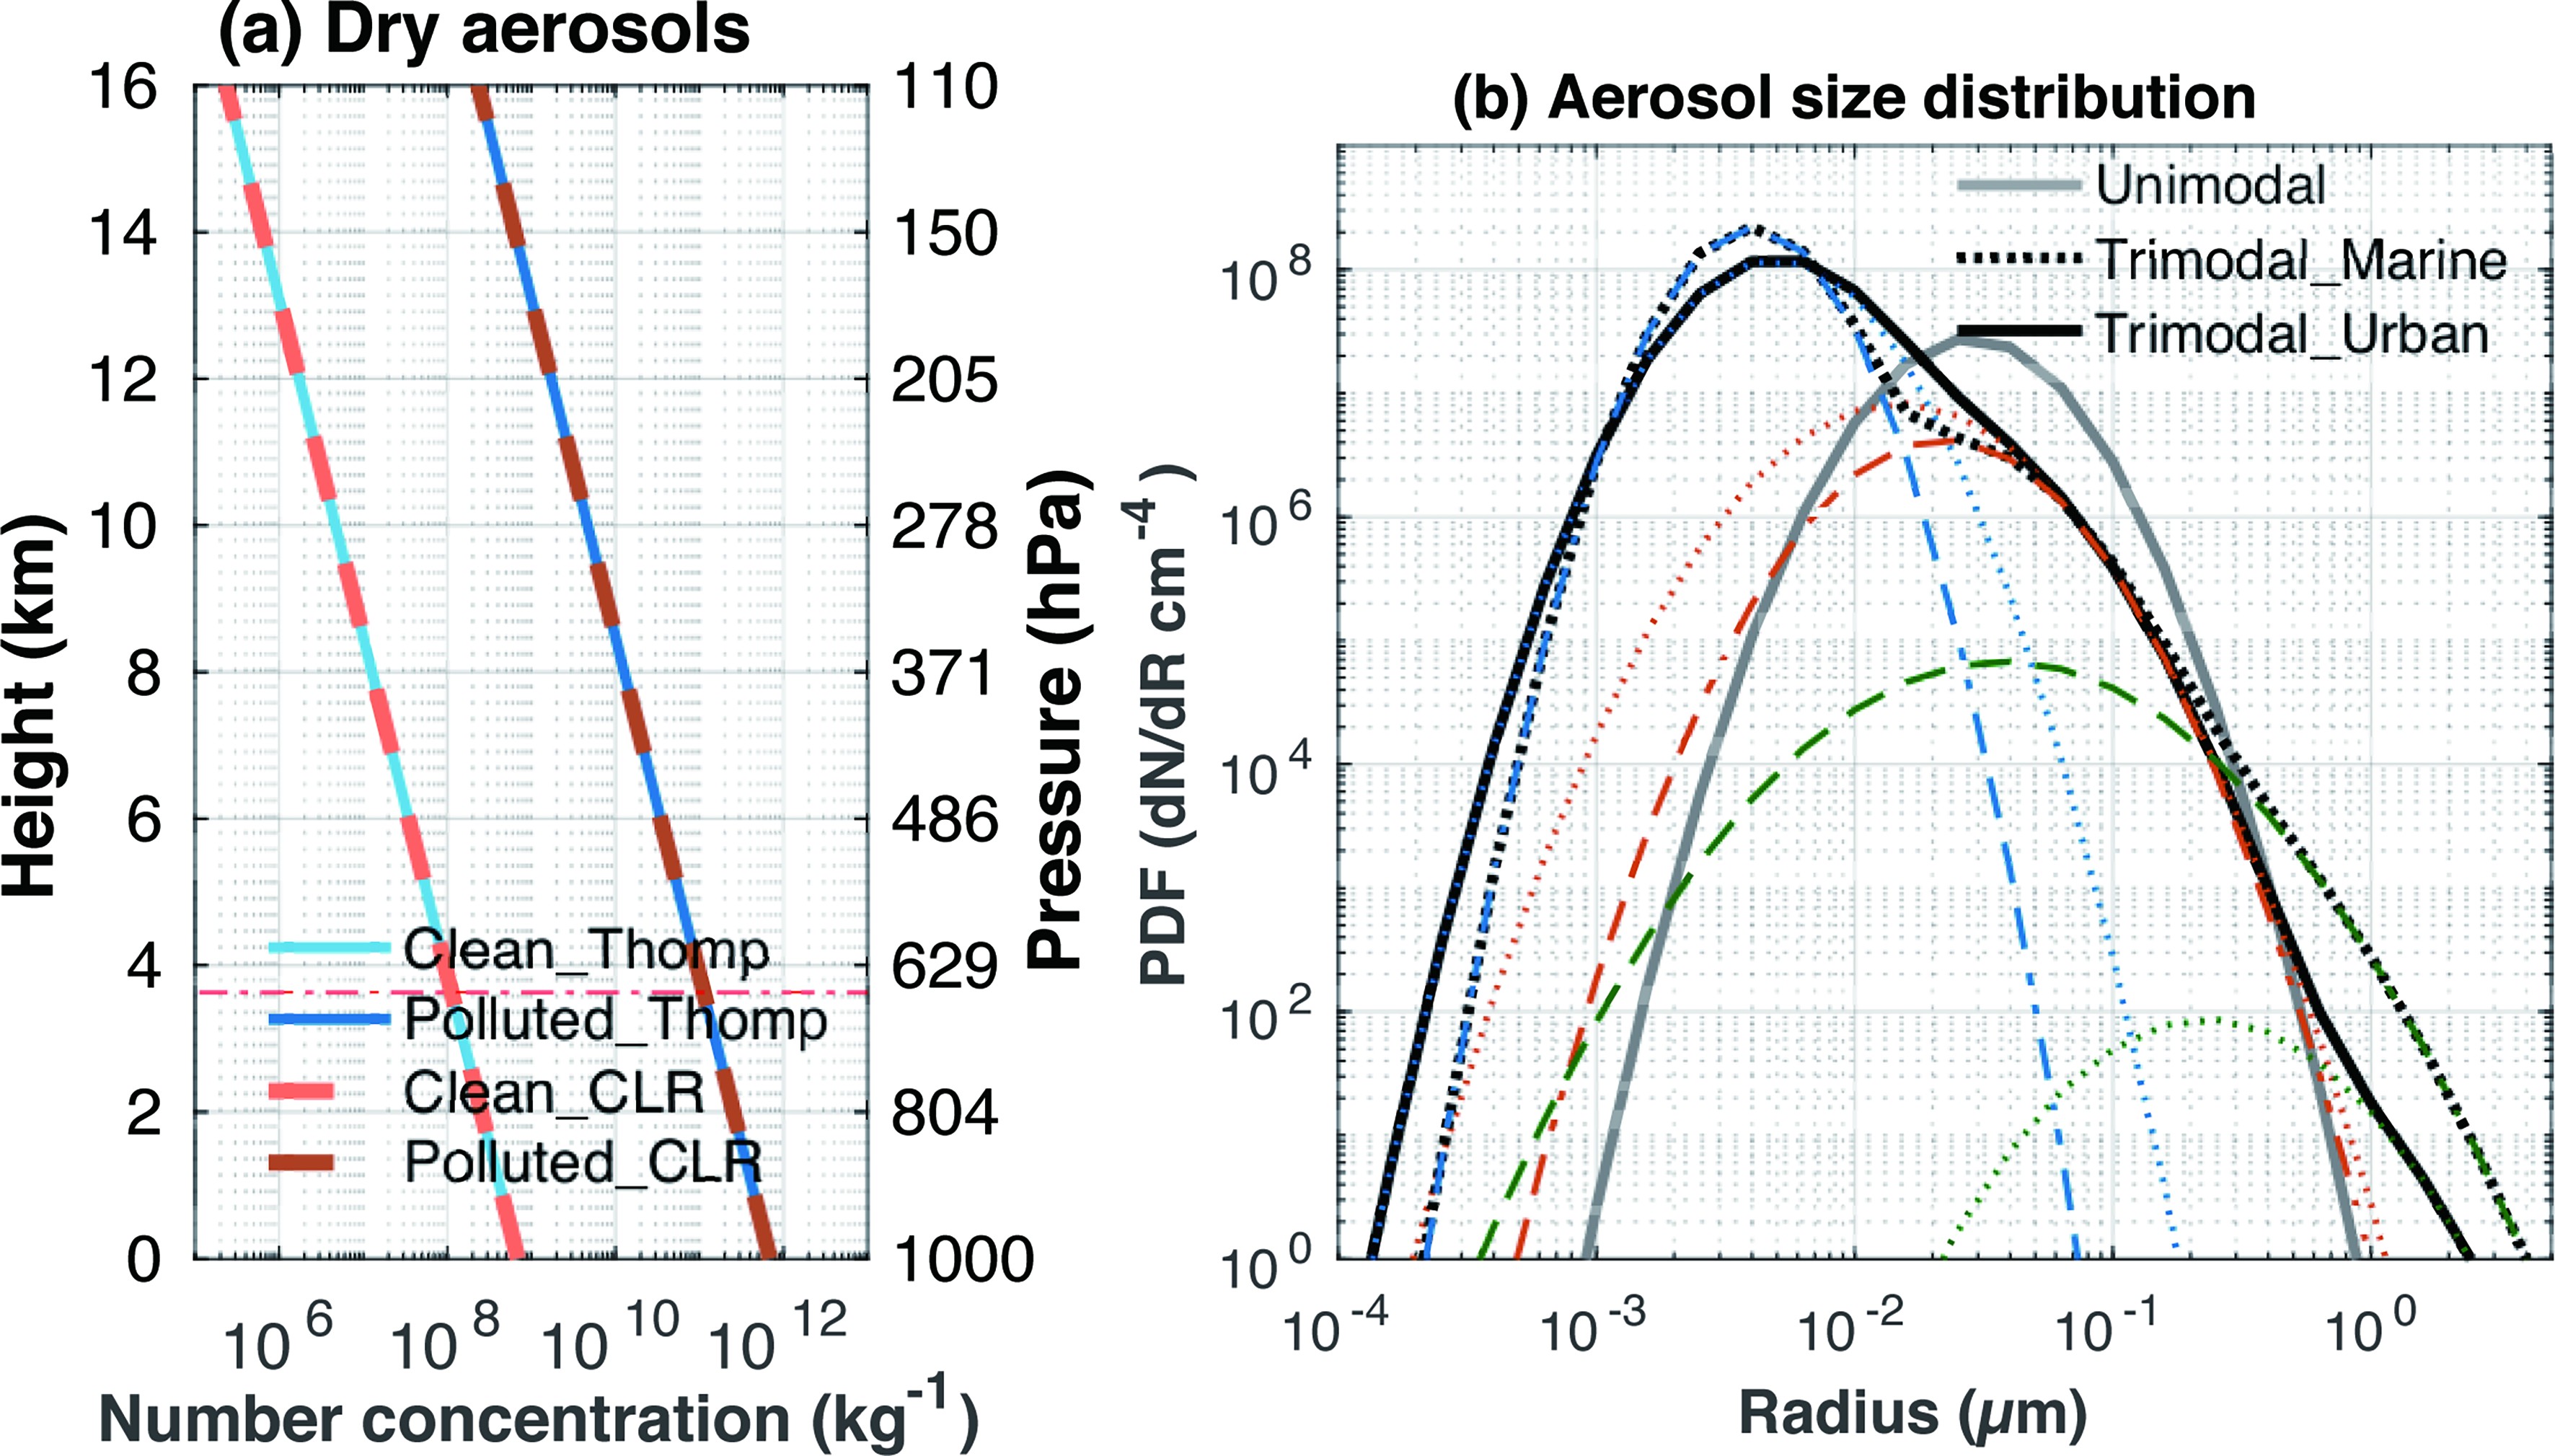
A key point of this study is to investigate the relative significance of aerosol number concentration and size distribution in the parameterized aerosol effects. Figure 2a shows the prescribed clean and polluted CCN profiles for the initial conditions of the four baseline experiments. The clean profile has a maximum concentration of 1.38 × 10⁸ m−3 at the surface that exponentially decreases as the height increases, whereas the concentration of the polluted profile is 1000 times greater than that of the clean profile. Figure 2b expands the lognormal aerosol-size spectra presumed by the Thompson scheme (Thompson and Eidhammer, 2014). The ASD in the two baseline experiments assumed by the CLR scheme is remodeled to match the unimodal distribution of the Thompson scheme. A comparison between unimodal and trimodal ASDs is briefly presented in section 3.5.1. The trimodal ASD (including a nucleation mode, an accumulation mode, and a coarse mode) is used only in two additional experiments to compare the droplet activation efficiency by different ASDs. The Trimodal_Marine and Trimodal_Urban use marine surface background and urban average trimodal ASDs, respectively, after Whitby (1978), but are normalized to the same total aerosol number concentration in the clean experiments. The trimodal number concentration, mass, mean radii, and standard deviations used in the experiments are listed in Table 2. Trimodal IN ASD is prescribed in the CLR scheme but not considered in the nucleation of cloud ice in the present study.
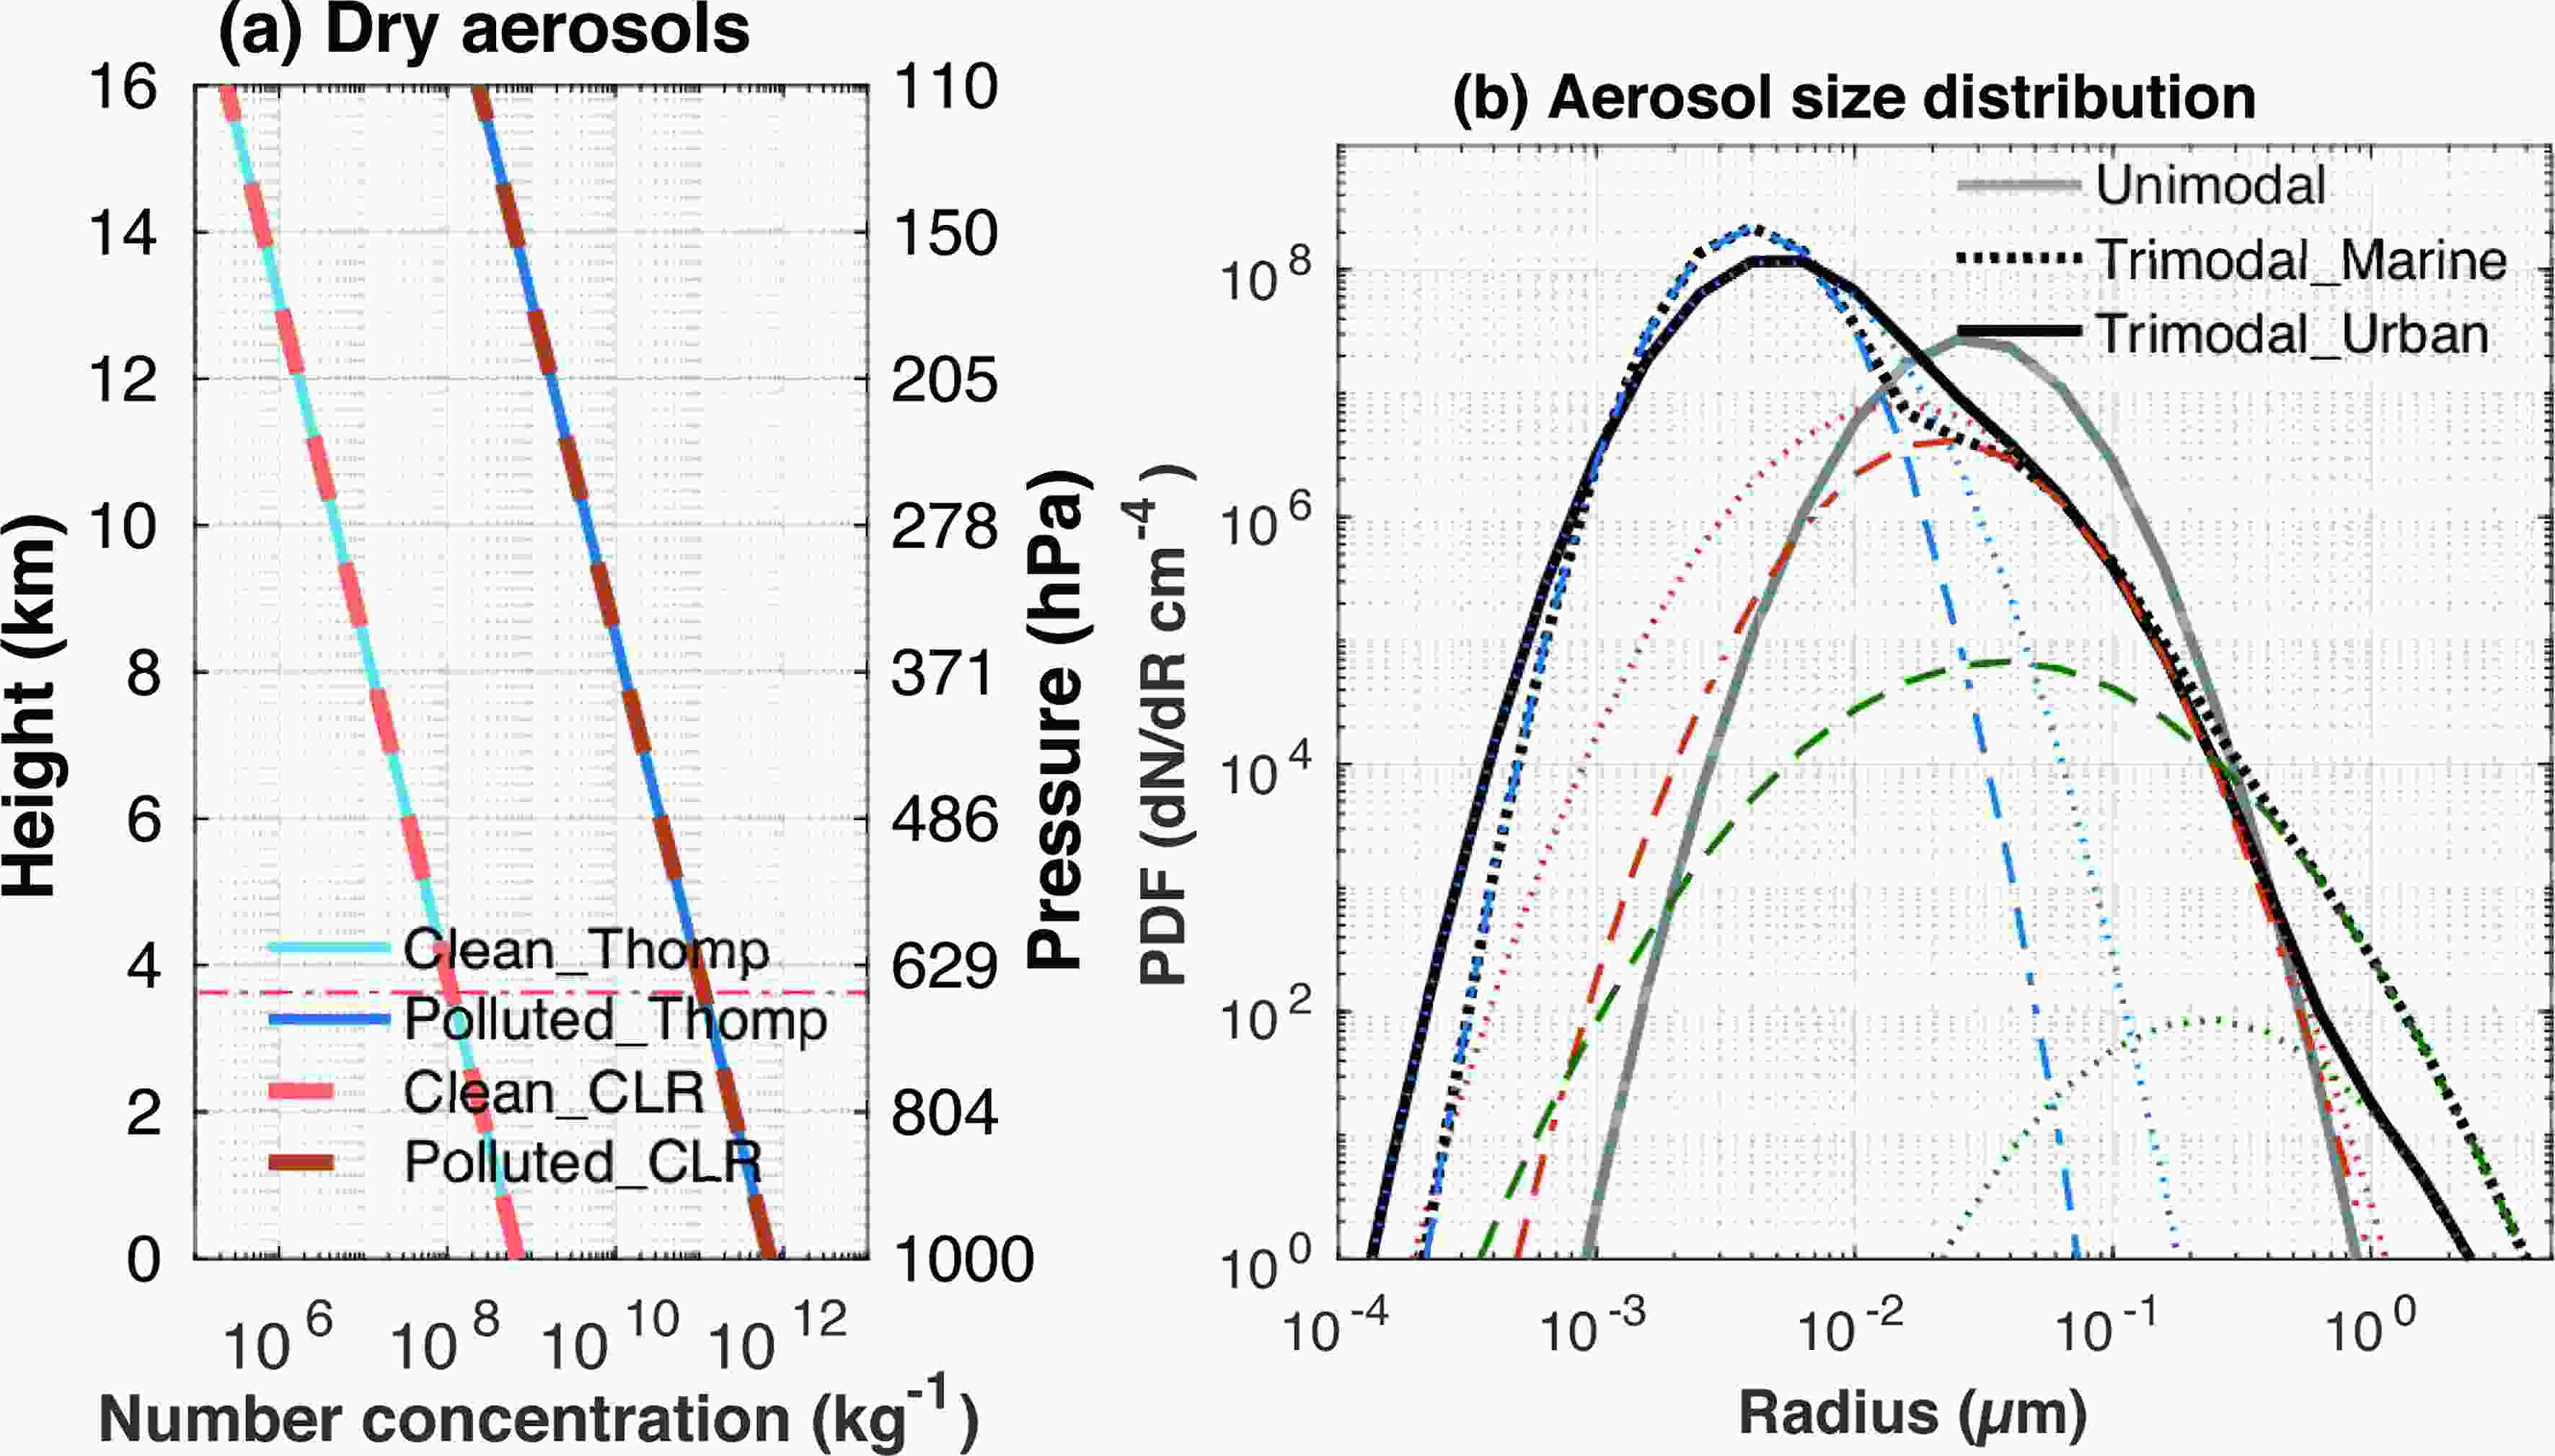
Figure 2. (a) Initial vertical profiles of the aerosol number concentration decreasing from the surface to the top of the atmosphere, with a scale height of 2 km for the four baseline experiments. (b) The presumed unimodal and trimodal aerosol probability density functions used in the experiments.
Trimodal_Marine Trimodal_Urban IN Mode Unimodal N A C N A C N A C Number concentration (%) 100 84.37 14.89 0.74 76.8 23.2 0 0 99.88 0.12 Mass (%) 100 0.011 0.289 99.7 1.1 55.46 43.5 0 6.5 93.5 Mean radius (μm) 0.04 0.005 0.036 0.31 0.007 0.027 0.43 0.0045 0.024 0.55 Standard deviation (σ) 0.59 0.47 0.69 0.99 0.59 0.77 0.79 0.53 0.75 0.74 Table 2. Unimodal and trimodal aerosol properties used in our experiments. N as nucleation mode, A as accumulation mode, and C as coarse mode.
-
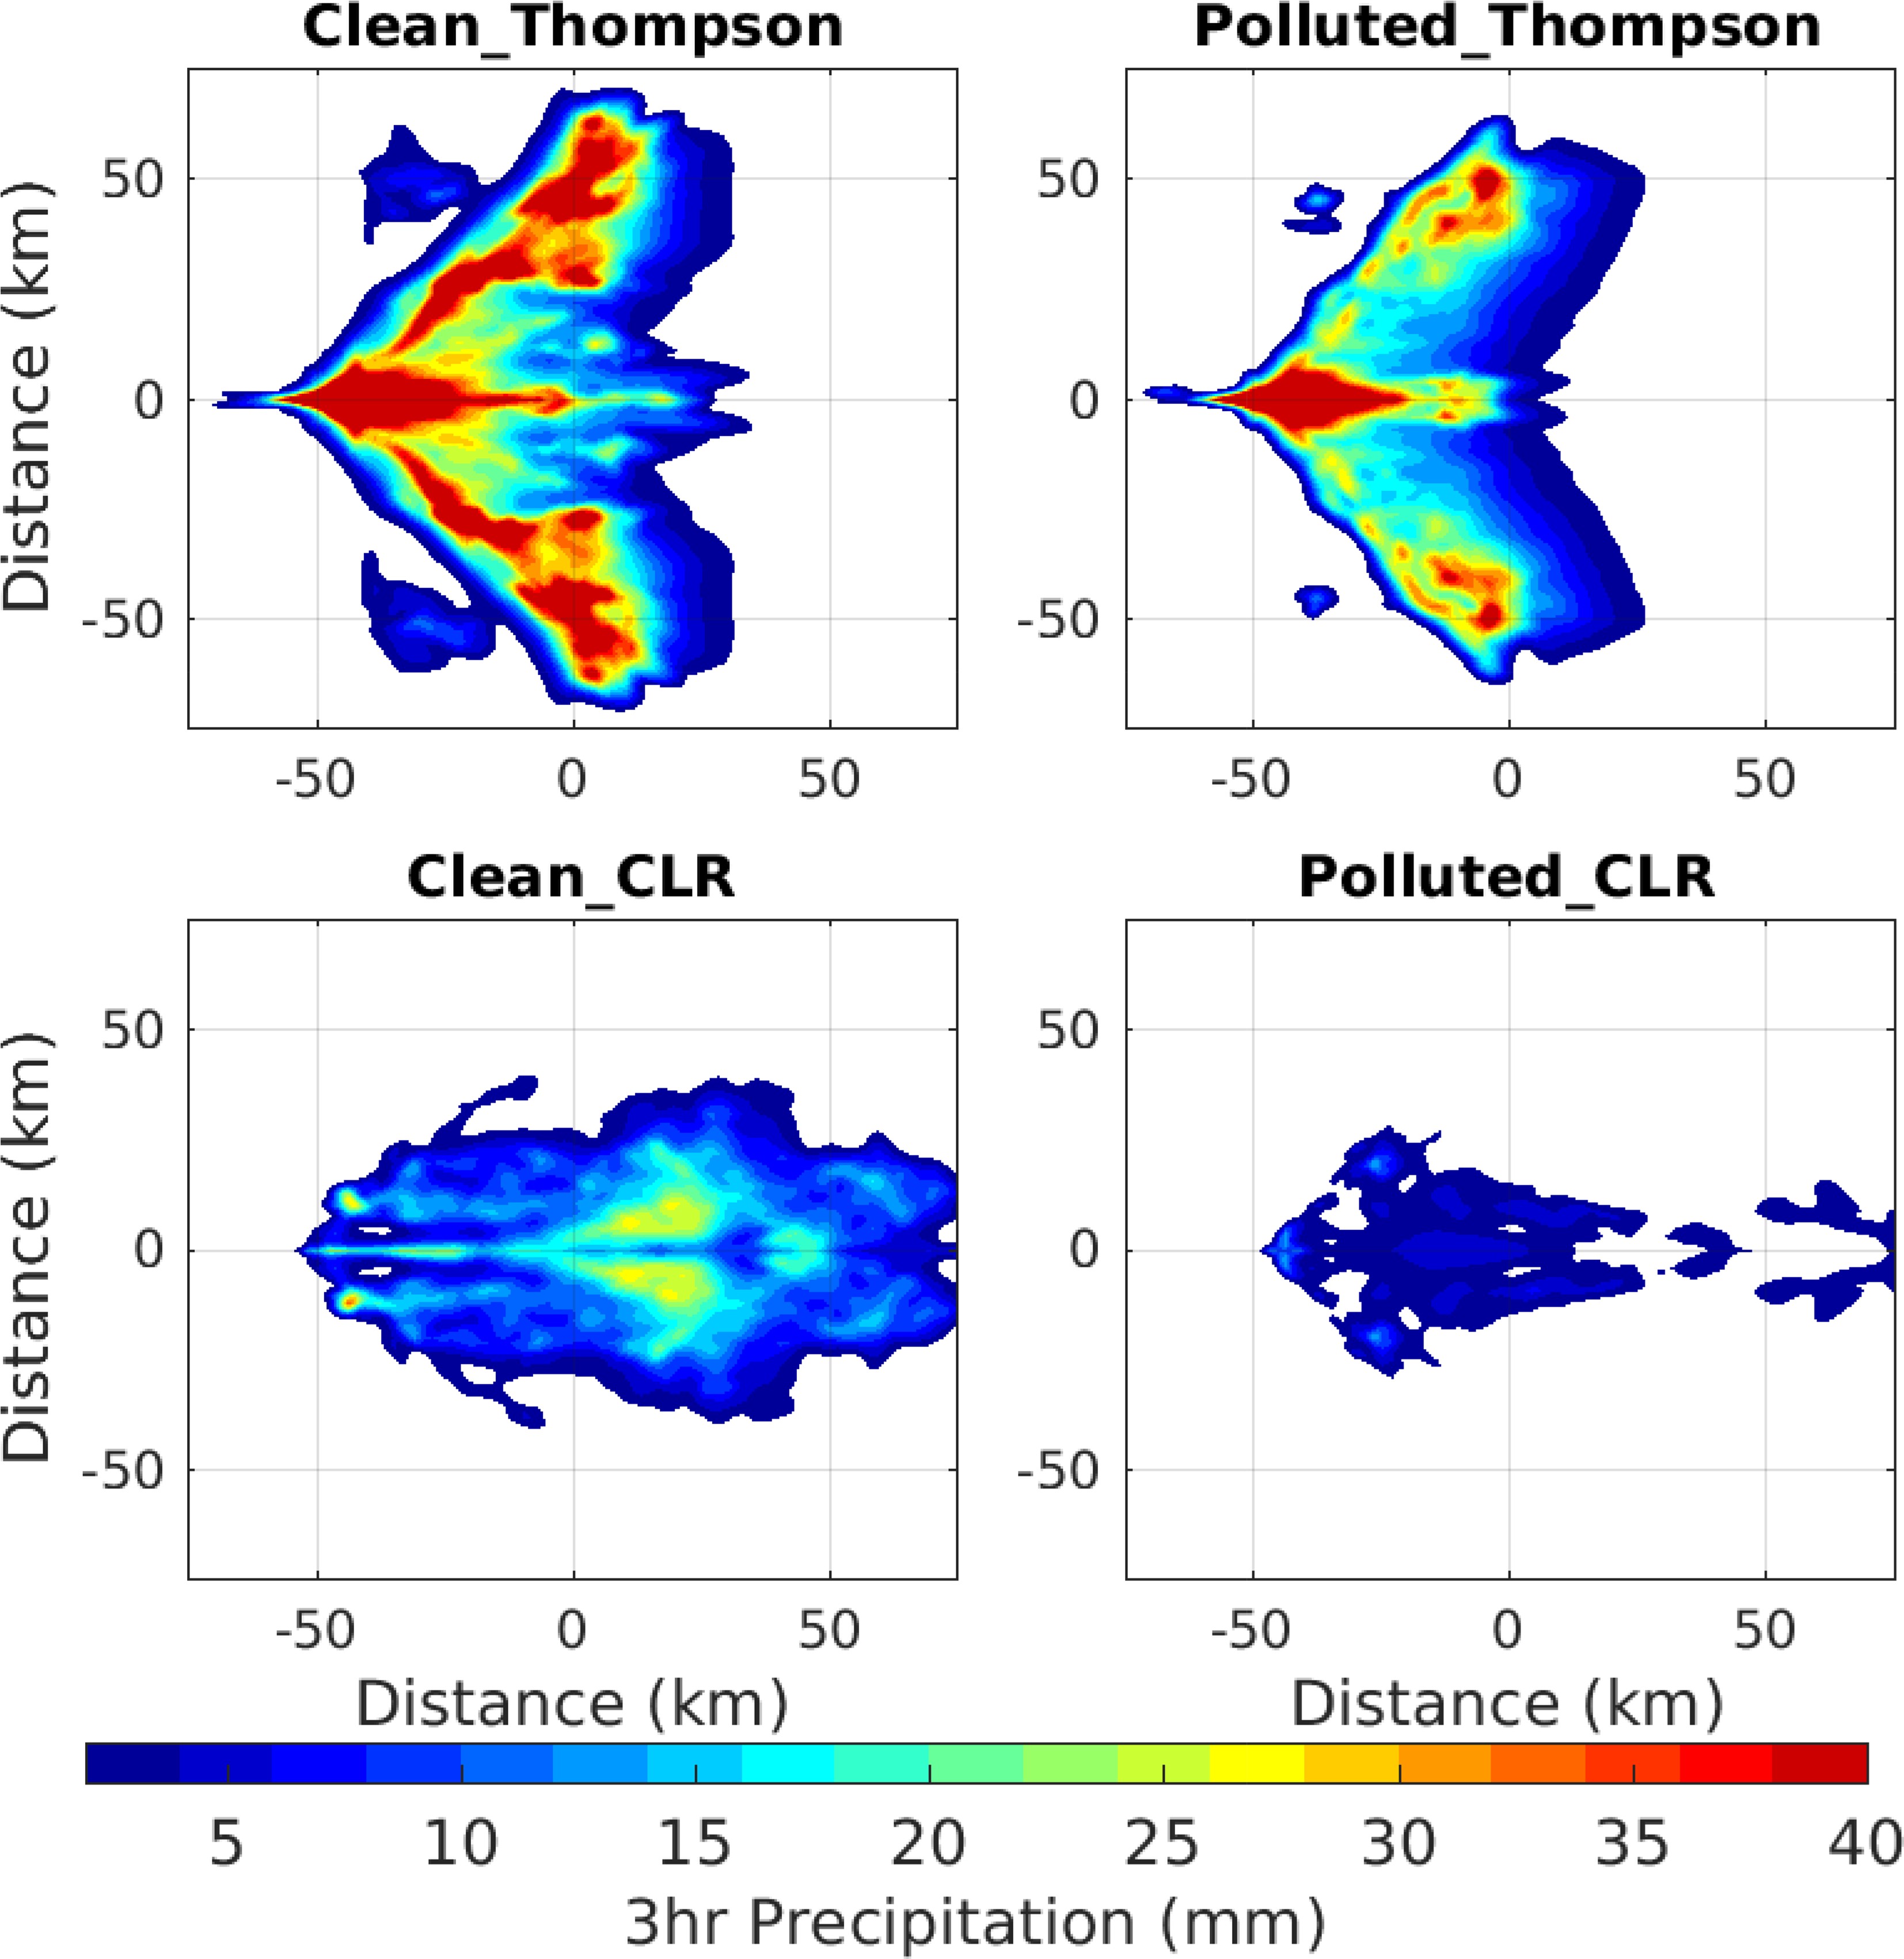
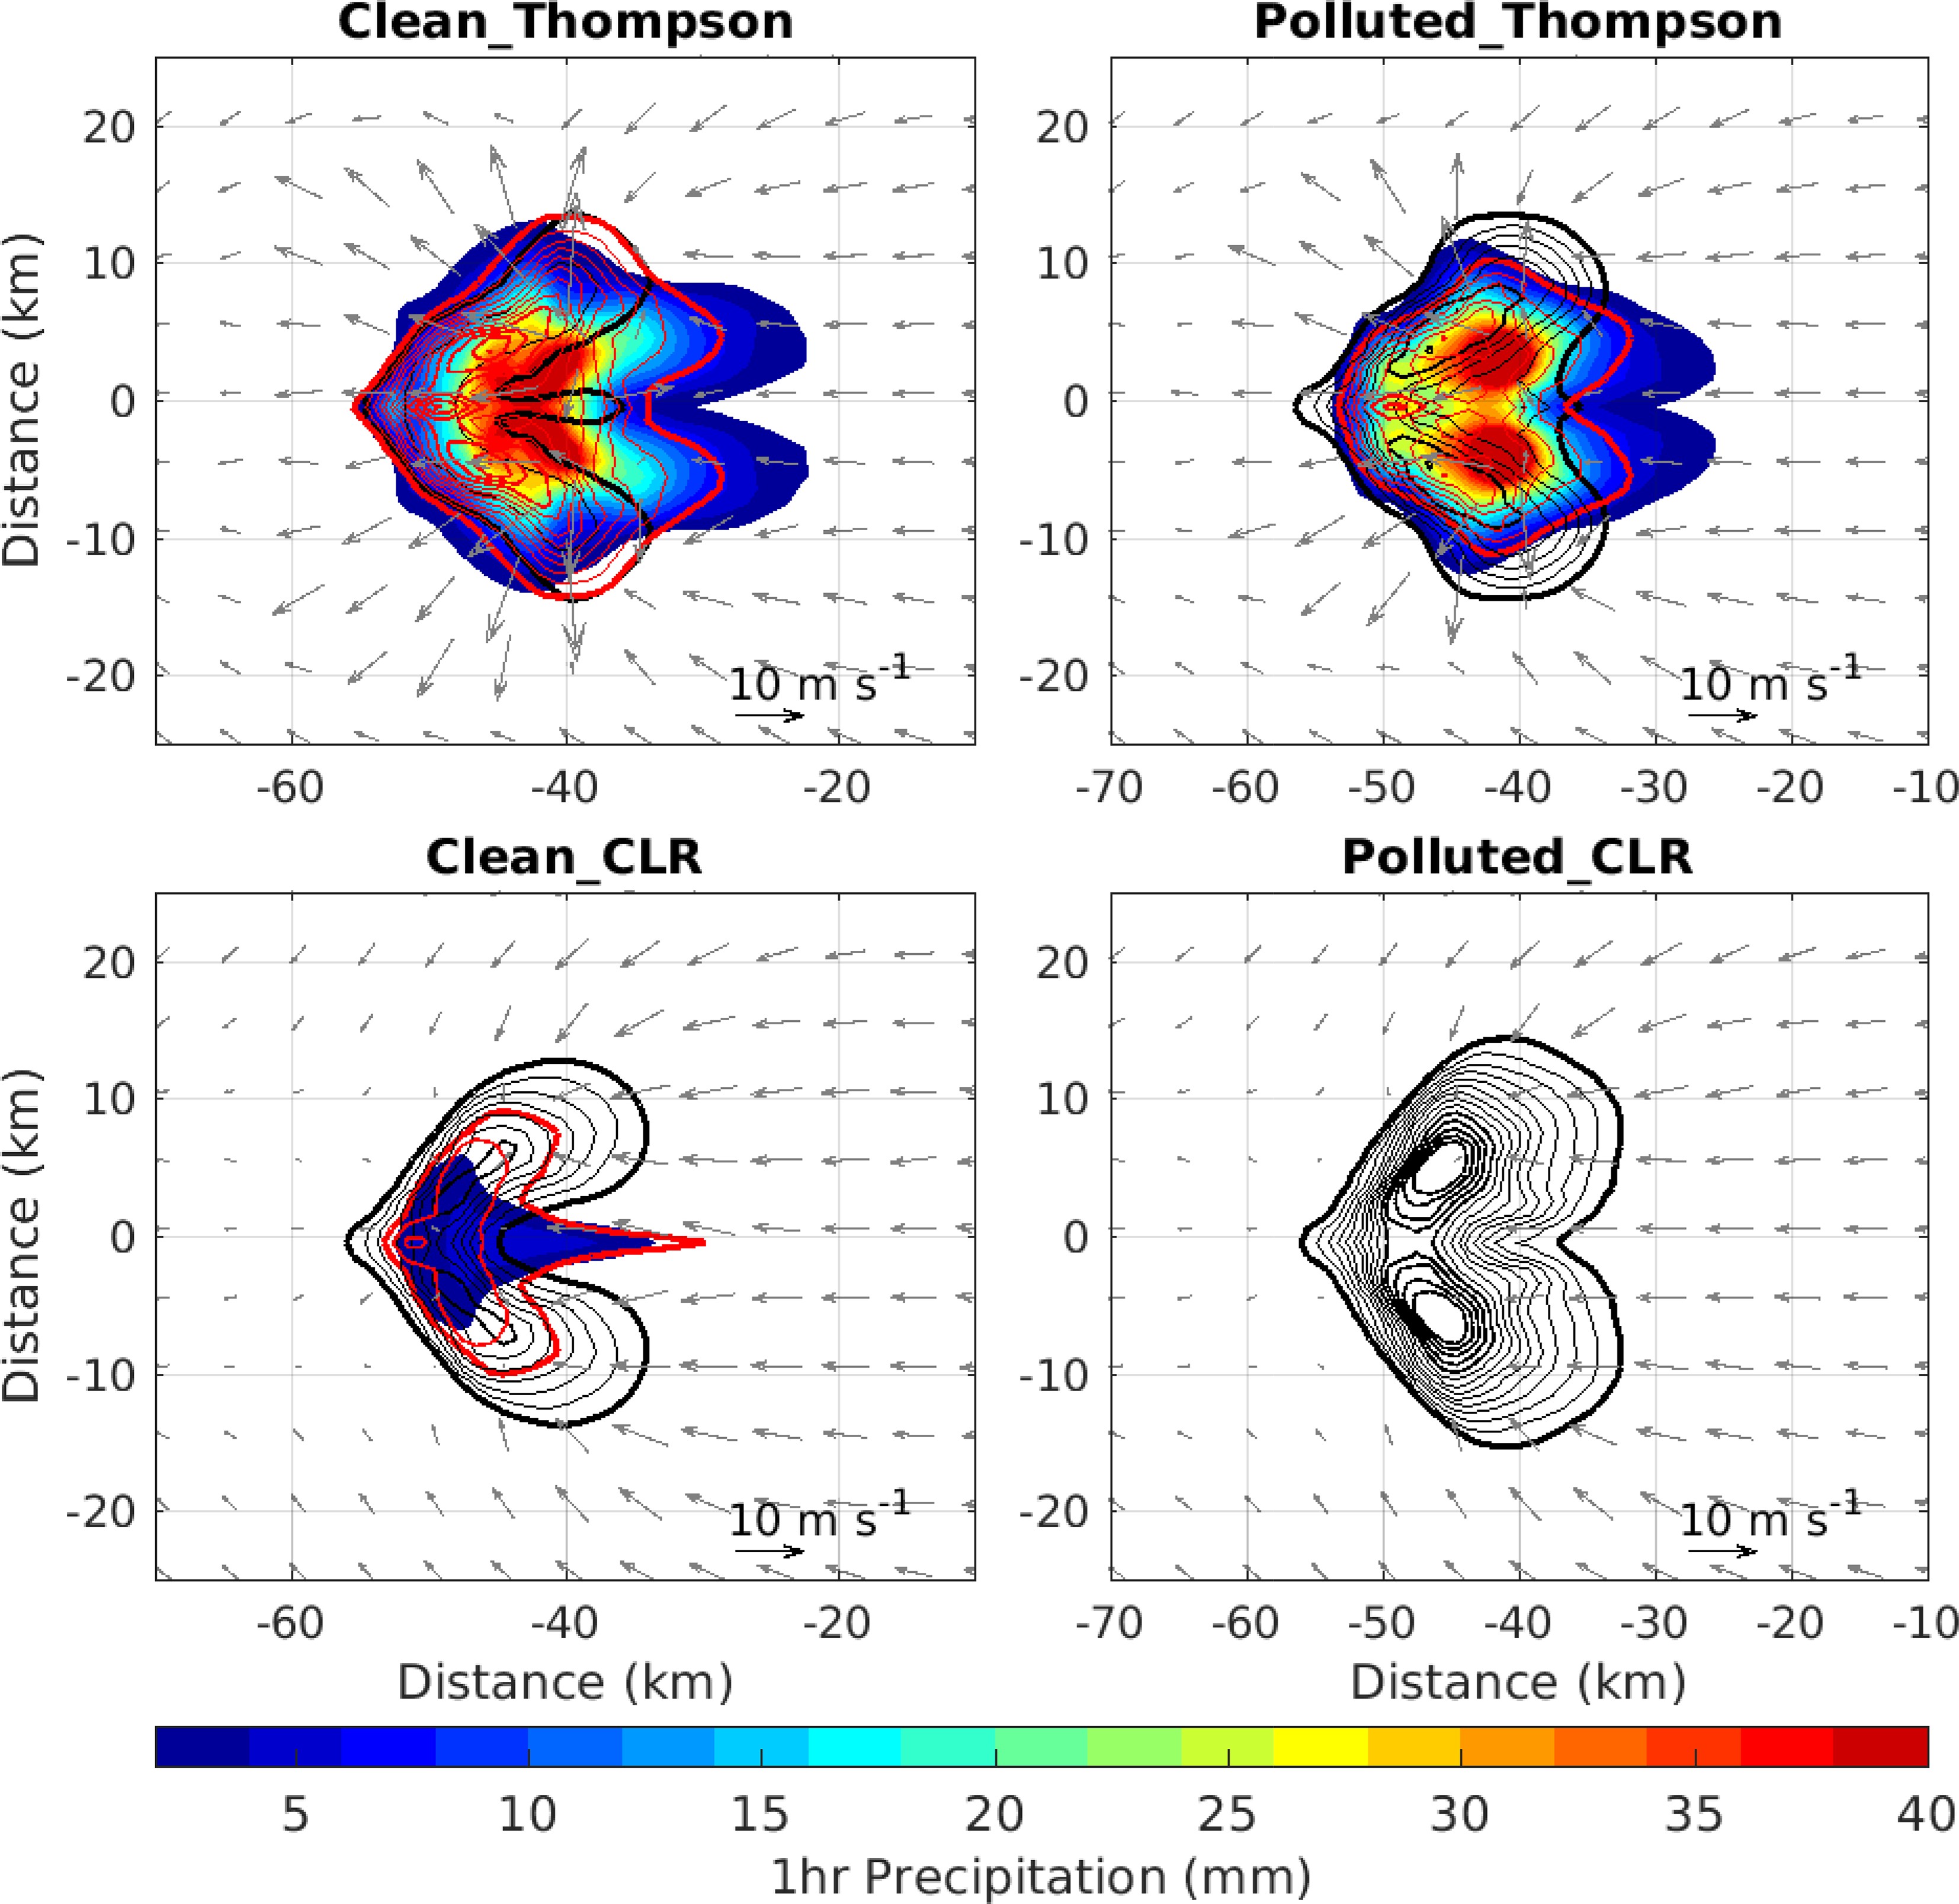
First of all, precipitation sensitivity to aerosol concentration and the BMSs in our experiments is examined. Figure 3 presents the intensity and spatial distribution of the rainfall horizontal distributions, showing high sensitivities to BMSs. The simulated supercell storm produces maximum precipitation at the initial location when it propagates eastward against the low-level wind and splits symmetrically at y = 0 owing to the unidirectional wind-shear profile. Although precipitation is slightly perturbed by different aerosol loadings overall, the storm simulated with the CLR scheme seems underdeveloped, compared to that simulated with the Thompson scheme. The domain-averaged precipitation and 10-min rainfall intensity histogram are shown in Fig. 4. The increasing trend of 3-h accumulated precipitation shows that the supercells simulated by the two BMSs develop in completely different ways. The Thompson scheme produces higher precipitation amounts and rain rates than the CLR scheme. The two schemes have different rainfall intensity structures; the 10-min rainfall rates of the CLR scheme are mostly below 5 mm, but that of the Thompson scheme exceed 20 mm. It is shown in our results that aerosols suppress the magnitude of intense precipitation. The decrease in heavy rain rates caused by higher aerosol concentration is consistent with the decrease in total precipitation in both schemes. Based on the condition that the initial large-scale forcing is controlled in the same manner, distinct rainfall characteristics can be attributed to the differences in microphysics parameterizations and the dynamical feedback. Figure 5 shows the differences in the schemes for the two liquid hydrometeors and 10-m wind fields. The supercell intensifies much more rapidly with the Thompson scheme, as featured by heavy rainfall and strong convergent and divergent winds. Precipitation is positively related to rainwater content at the beginning of the simulations. Increasing aerosol concentrations directly results in a corresponding increase in cloud water content and a decrease in rainwater content due to the warm-rain suppression. However, it is not clear why the CLR experiments have much more cloud water and much less rainwater than the Thompson experiments. The following sections investigate the microphysical processes and large-scale dynamical responses to uncover the mechanisms that caused these differences.

Figure 3. 3-h Accumulated precipitation for the four baseline experiments.

Figure 4. (a) Domain-averaged precipitation accumulated with time. (b) Histogram of the 10-min rain rate in 3 h.
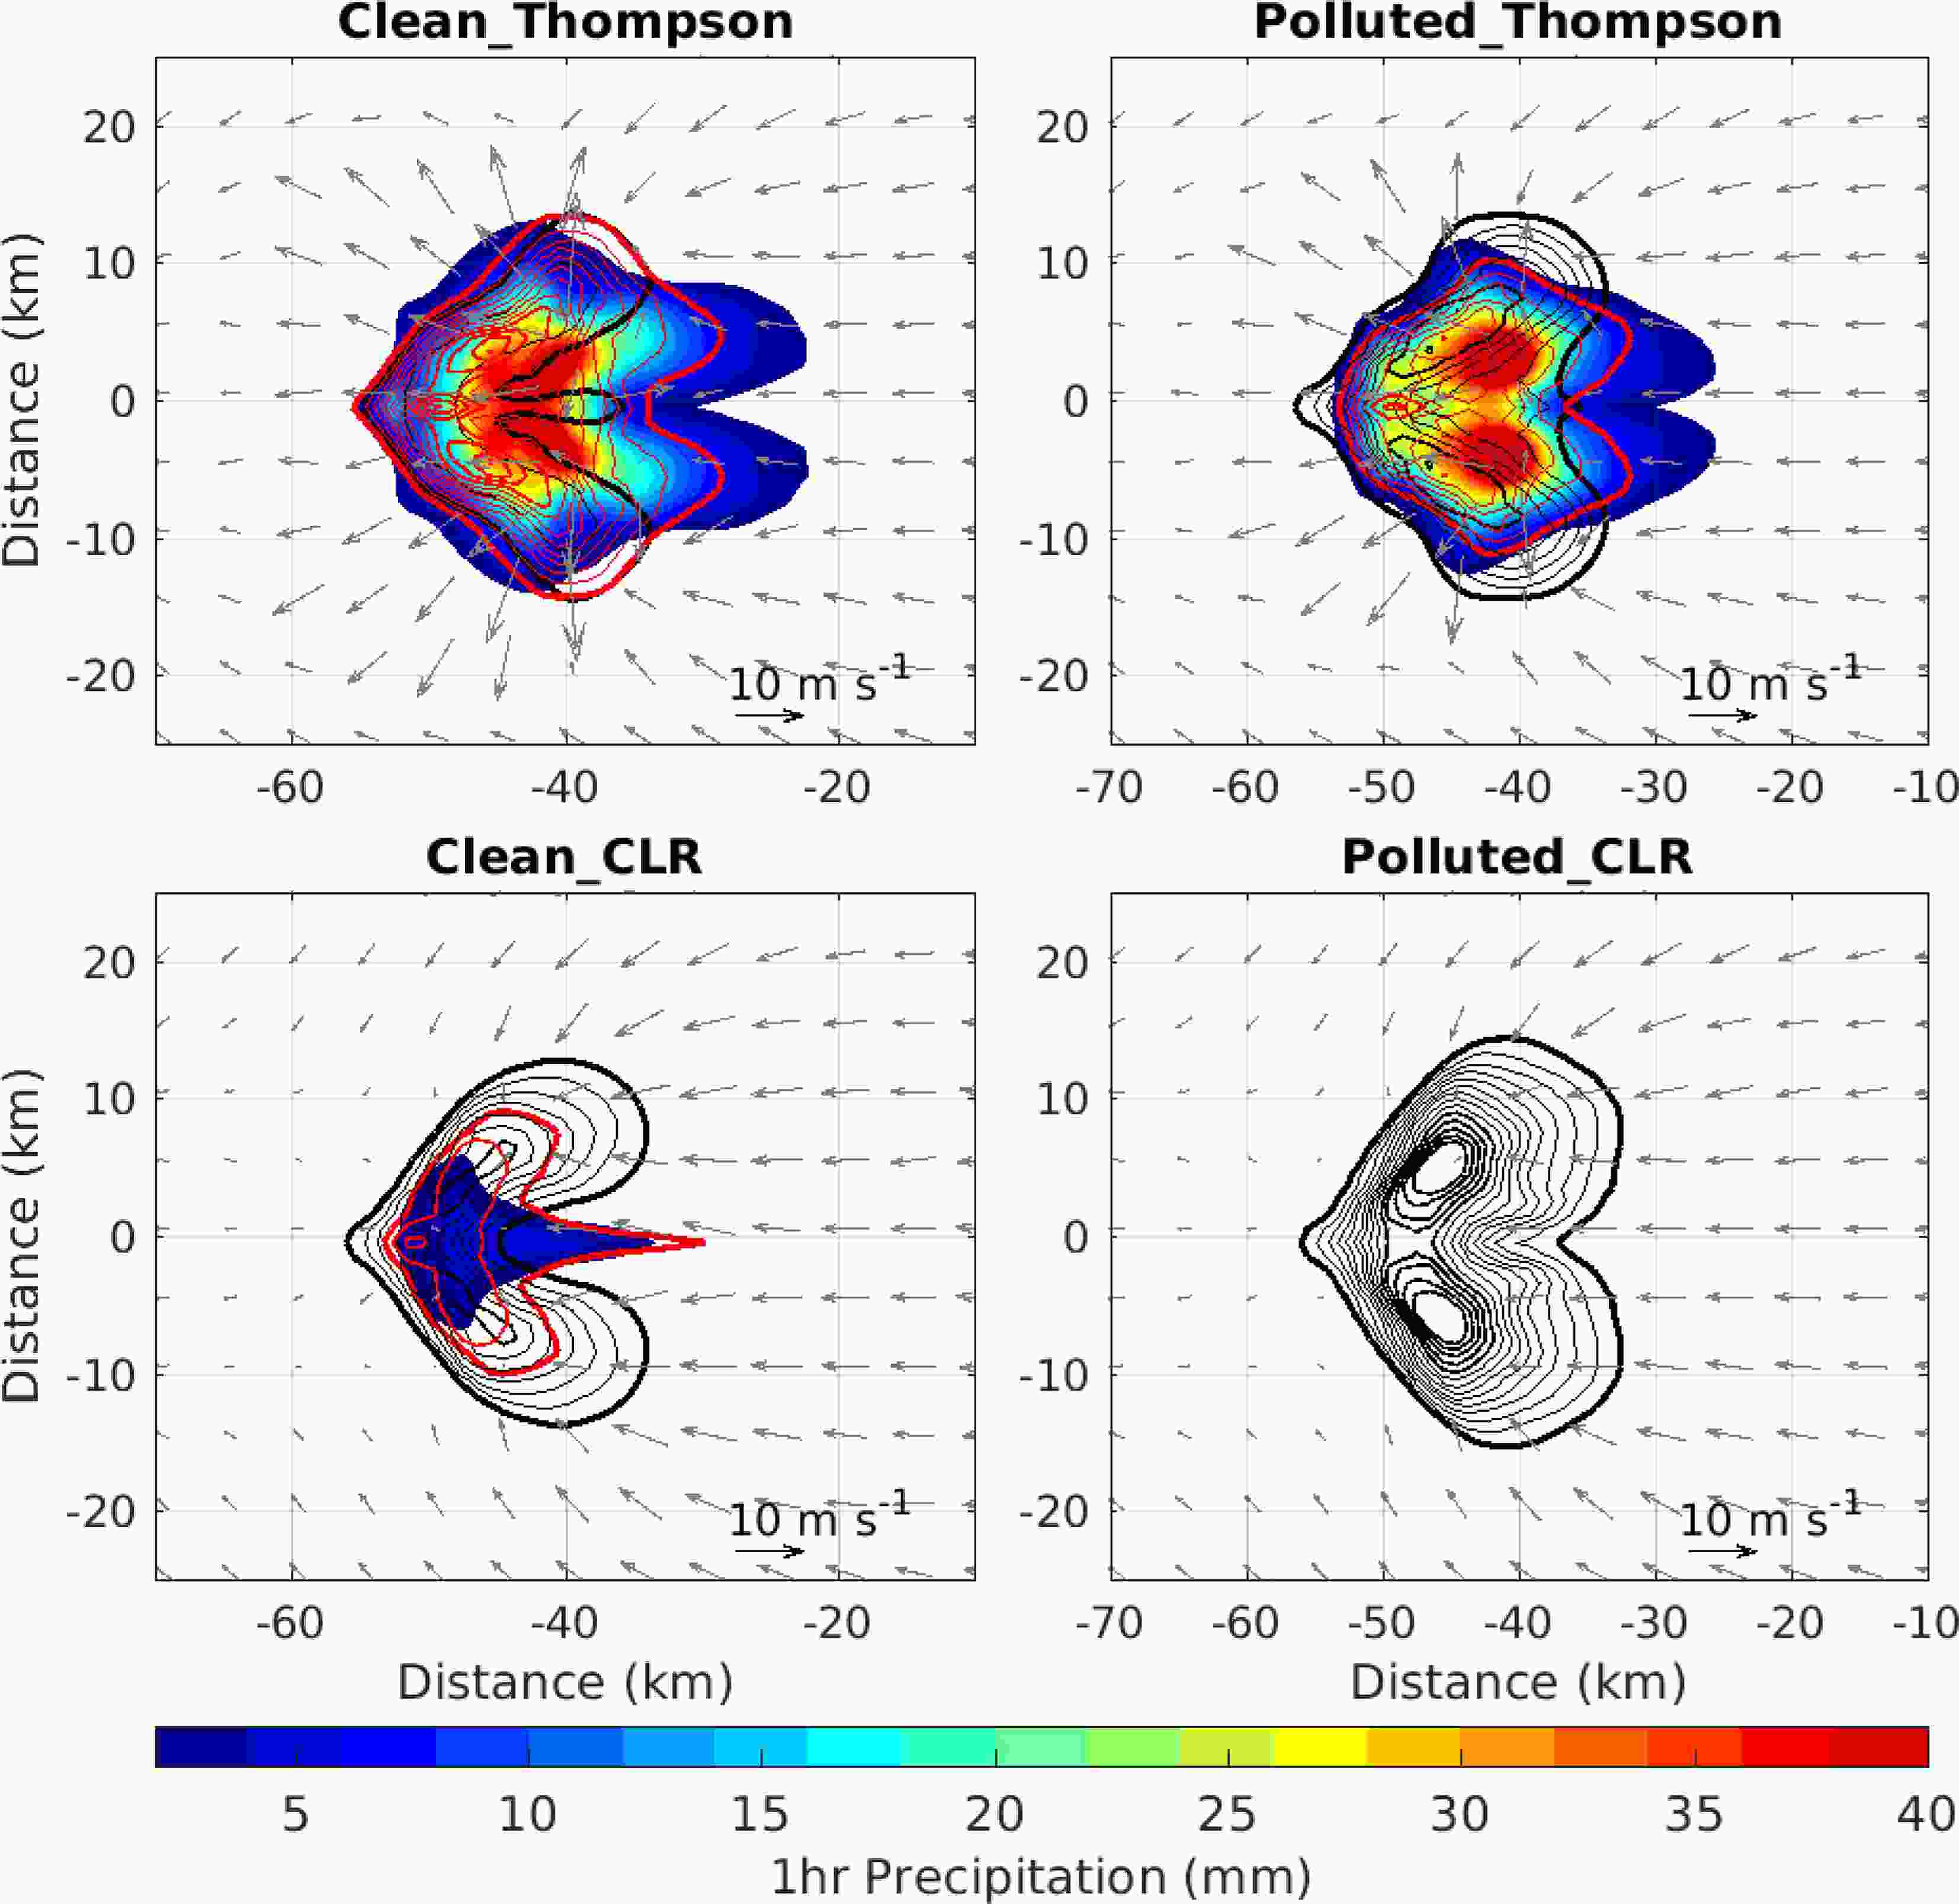
Figure 5. Accumulated precipitation, mean column-integrated cloud water (black) and rainwater (red) mass, and 10-m wind in the first hour. The contour line increment of 1 kg m−2 is shown in bold.
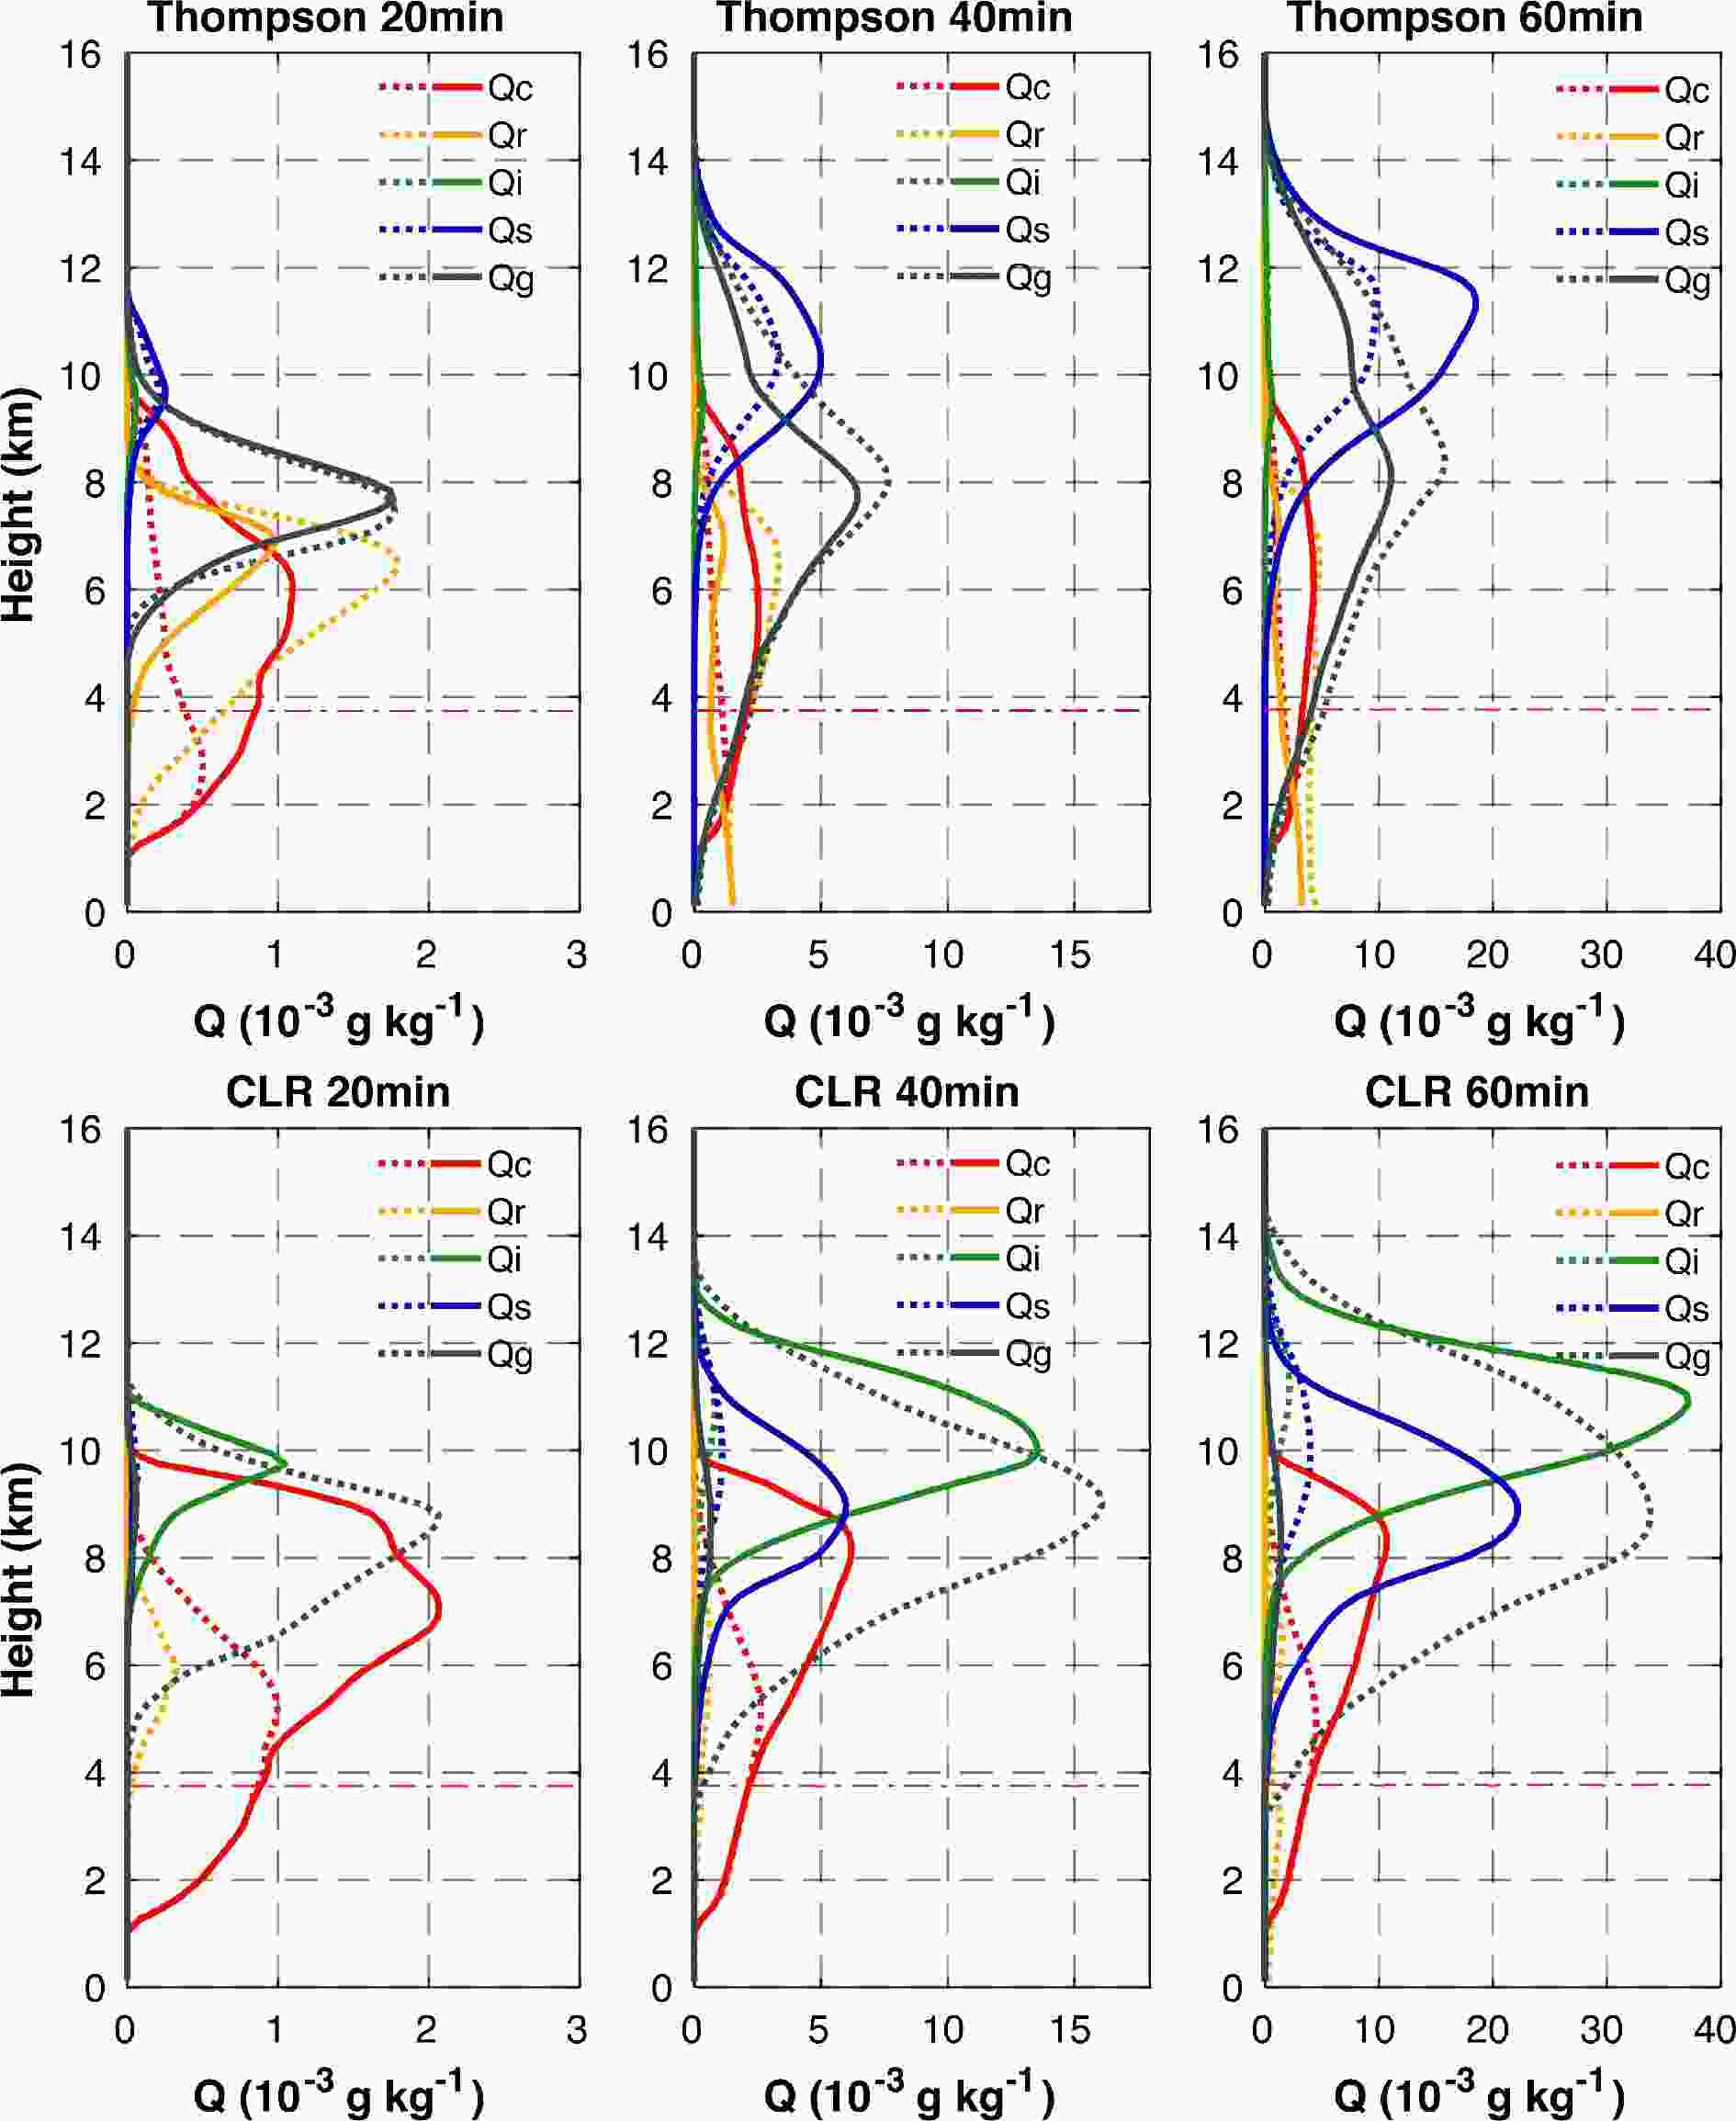
Figure 6. Time- and domain-mean vertical profiles of five hydrometeor mixing ratios for the four baseline experiments in the first 20, 40, and 60 min. Dotted lines represent the results for the clean experiments and solid lines represent those for the polluted experiments.
-
Hydrometeors are essential components of precipitation and are produced in solid or liquid form via a myriad of microphysical processes. Figures 6 and 7 show the time- and domain-averaged vertical profiles of five hydrometeor mixing ratios and number concentrations in the first 20, 40, and 60 min. The two schemes simulate completely different vertical distributions of the five hydrometeor species with different aerosol concentrations or microphysical processes.
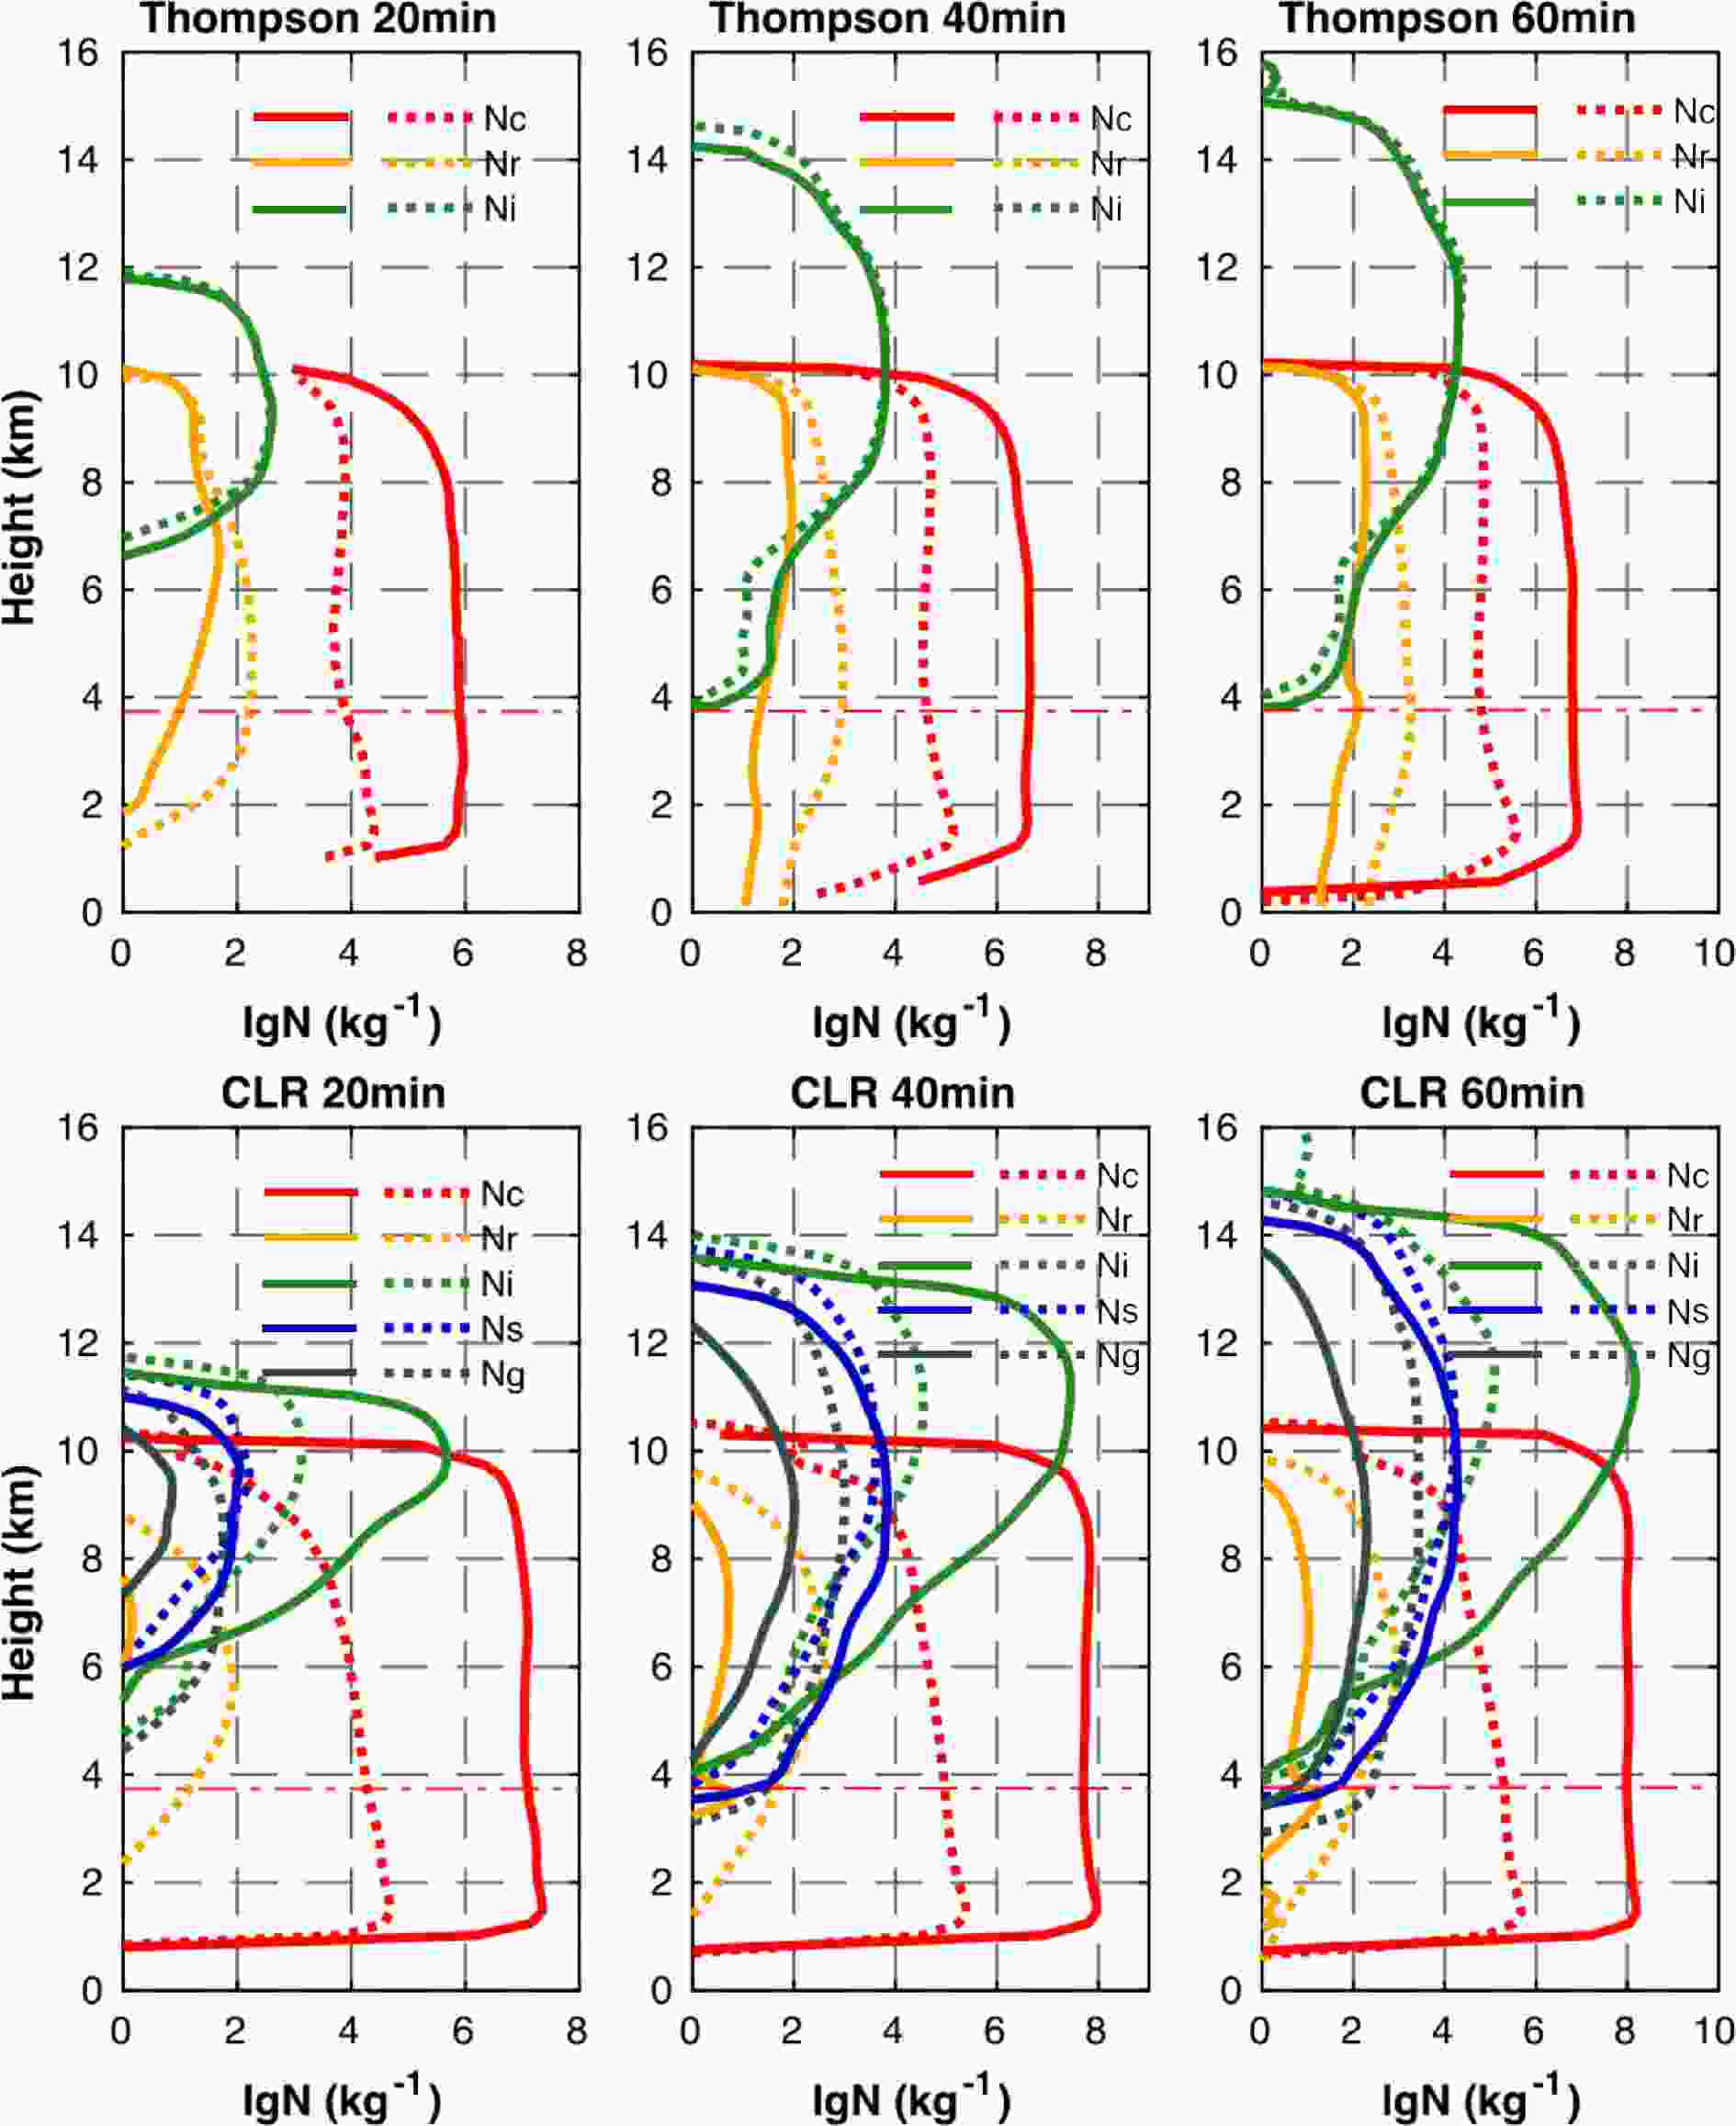
Figure 7. Time- and domain-mean vertical profiles of hydrometeor number concentration for the four baseline experiments in the first 20, 40, and 60 min. Dotted lines represent the results for the clean experiments and solid lines represent those for the polluted experiments.
The rainwater mixing ratio and number concentration are compared first since they are directly related to precipitation. Mass and number concentration of rainwater in the Thompson scheme are much greater than that in the CLR scheme throughout the simulation period. Since the cloud water and melted ice hydrometeors are the major sources of rainwater mixing ratio and number concentration, they are likely the keys to precipitation intensity. Higher cloud water mixing ratio and number concentration occurred simultaneously with a lower rainwater mixing ratio and number concentration in the first hour. The number concentration is more significant than the mixing ratio profile, which indicates that the auto-conversion process might have played a more decisive role than other warm-rain and melting processes because droplet number concentration has no contribution to raindrop number concentration during the collection growth of raindrops. In the first 20 minutes before the melting of graupel begins, cloud droplets grow and reach the size of drizzles at lower altitudes with the Thompson scheme than that with the CLR scheme. Drizzle seems to be an important source for the production of graupel above the freezing level. Also, the melted ice hydrometeors, more from graupel than snow, make contributions to replenish rainwater below the freezing level. Eventually, the Thompson scheme produces earlier precipitation onset and higher precipitation amount than the CLR scheme, both of which resulted from the increased efficiency of rainwater production in the Thompson scheme.
Figure 8 shows the scatterplots of the number concentration and mass mixing ratio of cloud water and rainwater in the four baseline experiments, along with the bulk-mean particle sizes. It is shown that as the aerosol concentration dramatically increased from a clean to polluted environment, both the mixing ratio and number concentration of cloud water increase considerably. The polluted experiments are characterized by greater cloud water mixing ratio, larger cloud droplet number concentration, smaller droplet sizes, less rainwater mixing ratio, and smaller raindrop number concentration than the clean experiments in both schemes. The patterns of scatterplots shift to the right, implying that the dominant size of cloud droplets is reduced. On the other hand, in the polluted experiments, rainwater decreases with the mass mixing ratio and number concentration, but some raindrops increase in size slightly, opposite to the trend of the mass mixing ratio and number concentration of cloud water. This cannot be explained by the narrow small droplet size spectrum. Those differences in the results are highly related to the CCN activation and auto-conversion coupling with the presumed size distributions in the two schemes.
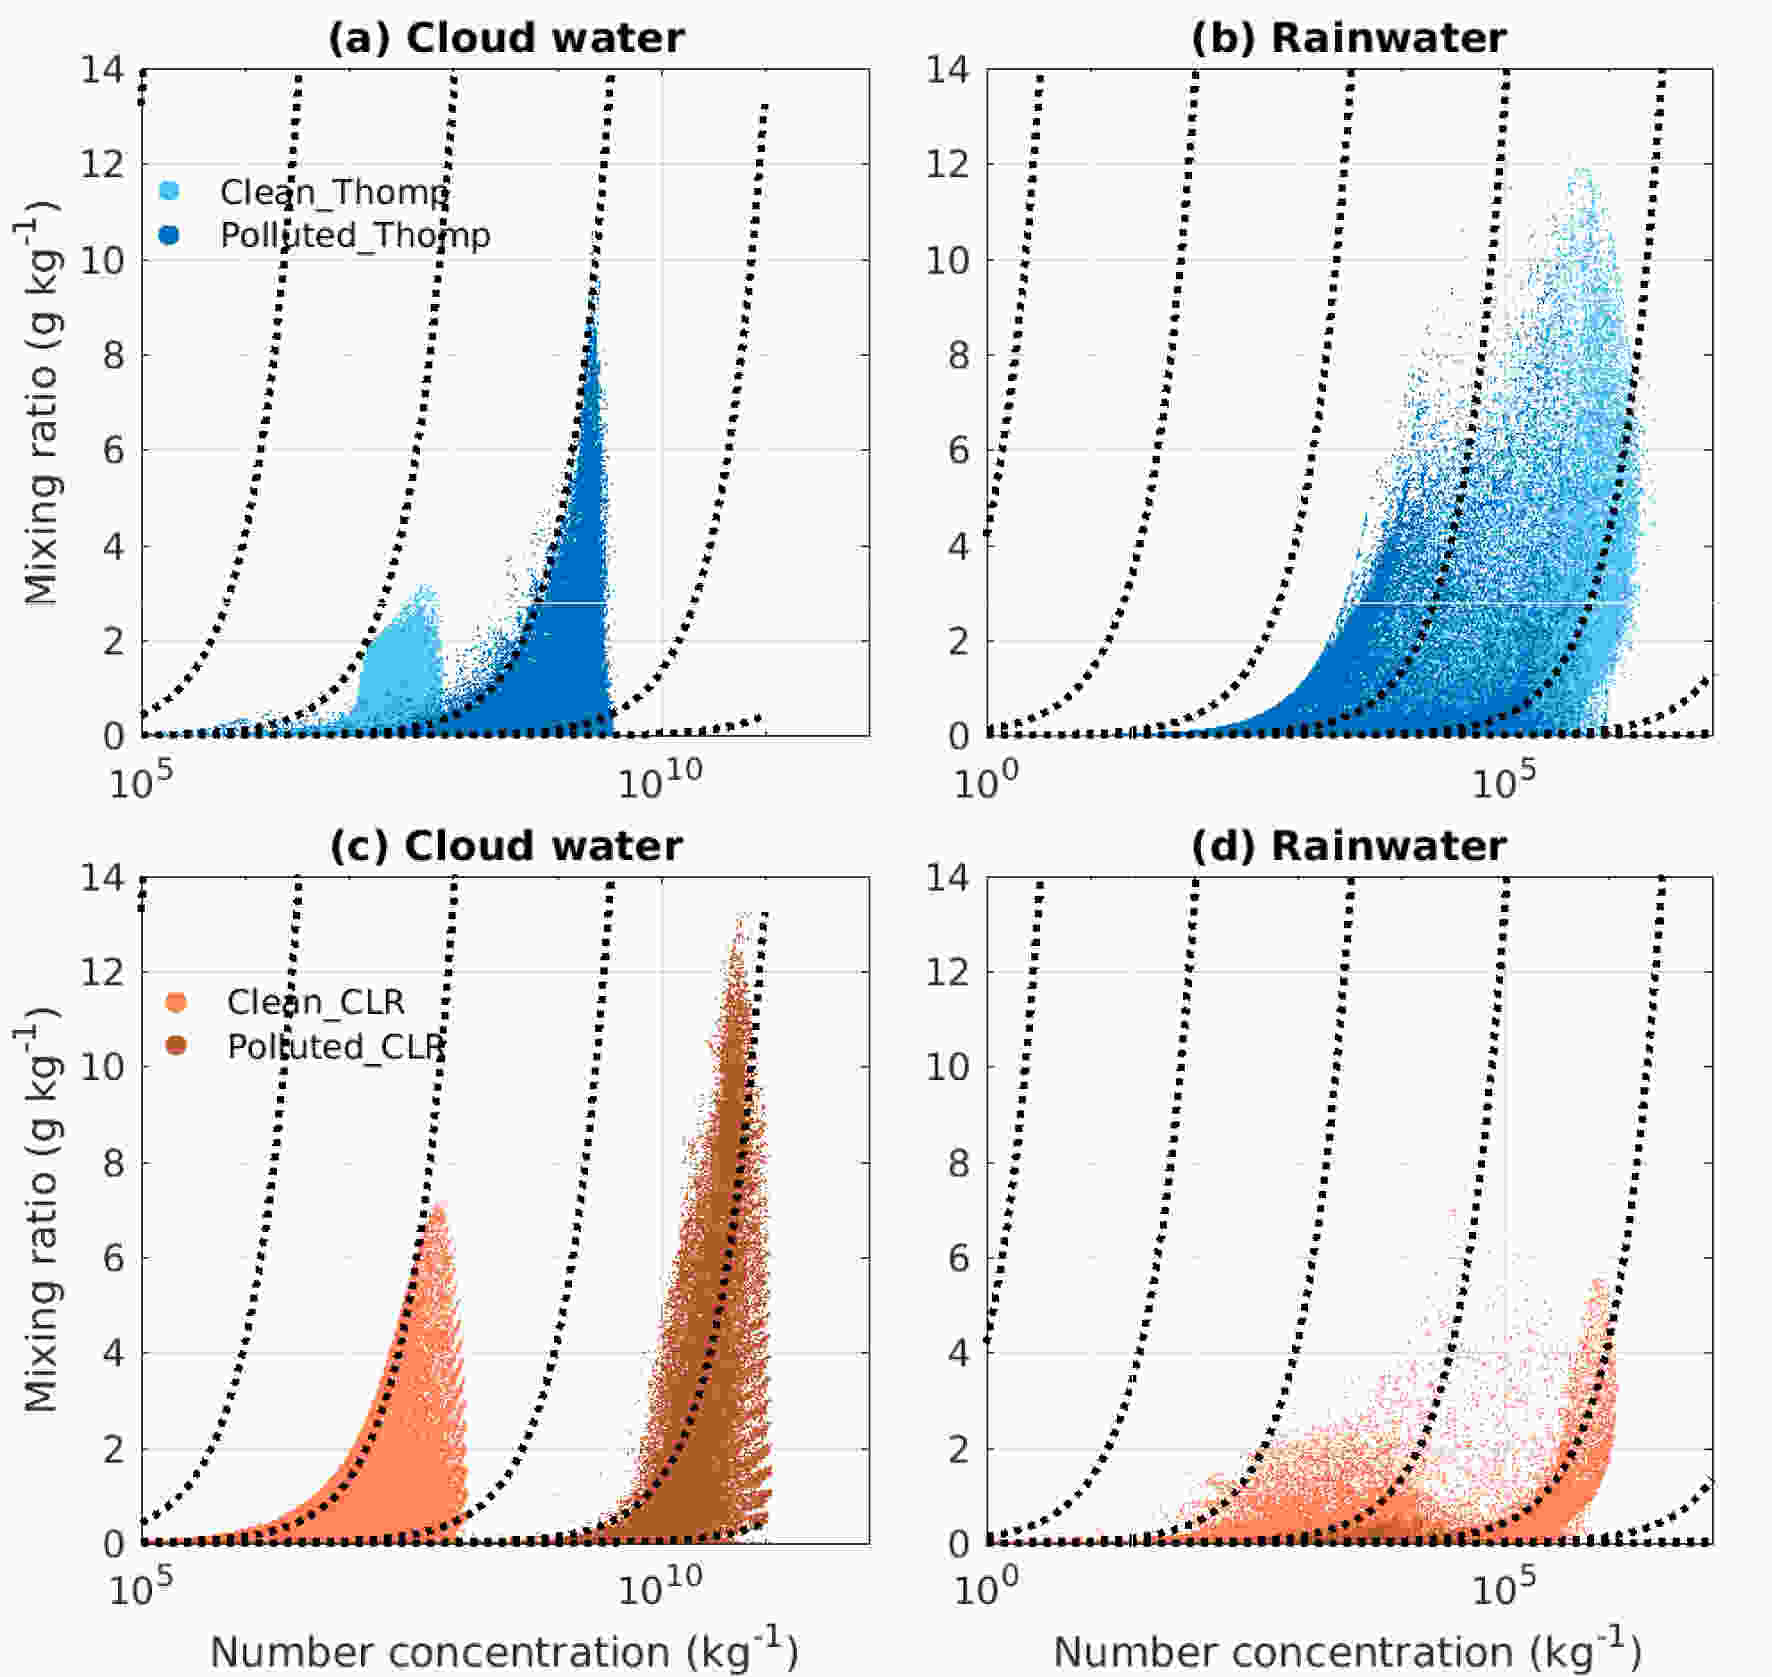
Figure 8. Scatterplots of 1-h cloud water properties and rainwater properties for the four baseline experiments. (a) Cloud water (x-axis: number concentration and y-axis: mixing ratio) from the Thompson experiments, (b) rainwater (x-axis: number concentration and y-axis: mixing ratio) from the Thompson experiments, (c) same with (a) except from the CLR experiments, and (d) same with (b) except from the CLR experiments. The dotted lines are the iso-particle size contours. Note that a minimum threshold of 0.001 g kg−1 for mass mixing ratio is applied as cloudy grids are preferred in our investigation.
Ice hydrometeors grow and contribute to precipitation as convection develops beyond the freezing level. The differences in the vertical distribution of the three ice hydrometeors between the two BMSs are remarkable due to the large variety of hydrometeor population attributes and microphysical processes. Aerosol effects on ice hydrometeor profiles are relatively similar for snow and graupel. The characteristic compositions of ice hydrometeors and cold-rain process are discussed with respect to different BMSs and aerosol concentrations here. First, Figs. 6 and 7 show that the ice hydrometeors increase as the storm intensifies and the total amount of ice hydrometeors gradually triumphs that of liquid ones. The Thompson scheme barely produces cloud ice but has a comparable amount of snow and graupel. By comparison, the CLR scheme produces more cloud ice and graupel than snow suspended in the air, in which supercooled cloud water apparently contributes greatly to the formation of cloud ice while supercooled rainwater contributes to graupel development. It is revealed that the production of snow and graupel is largely from supercooled liquid hydrometeors at the early development of a supercell storm. However, the relationship between ice hydrometeors and surface precipitation is elusive because the total amount is not directly associated with the surface precipitation simulated by the two schemes. Although graupel, the largest and fast-precipitating ice aggregates, is initiated in the first 20 min of the two clean experiments, it does not explain either the precipitation intensity or the horizontal pattern. Besides, the total ice amount is higher in the CLR scheme than in the Thompson scheme, in contrast to the differences in total precipitation between the two schemes. Therefore, the major differences in the early precipitation in the four baseline experiments are hardly attributable to the ice hydrometeors. However, some characteristics can be identified in the vertical profiles of ice hydrometeors due to the varied aerosol concentrations. As more droplets are lifted aloft in the supercooled state during the polluted experiments, these supercooled droplets seem to have little chance to grow compared to ice particles because the saturation point over the liquid is naturally higher than that over the ice. The droplets could re-evaporate for depositional growth, or they could be collected and rimed for the growth of ice hydrometeors. Therefore, it is found that the production of graupel (snow) increased greatly in the clean (polluted) experiments.
-
The latent heat profiles reveal the key microphysical processes contributing to the intensification of the storm and the interactions between the storm and the environment. Figure 9 decomposes the total latent heat profiles by six different phase changes to reveal the characteristic differences attributed to different BMSs and aerosol concentrations: condensational heating from vapor condensed to a liquid, freezing from liquid to ice, desublimation (or deposition hereafter) from vapor to ice, evaporation from liquid to vapor, melting ice to liquid, and sublimation from ice to vapor. Figures 9a-c shows that the total heating rates are comparable in the four experiments, in which condensational heating is dominant. The condensational profile is consistent with findings in Lebo et al. (2012) in that the use of saturation adjustment in the Thompson scheme encourages condensation and latent heating at low levels, leading to a minor weakening of convection in the polluted experiment compared to the clean one. In contrast, the CLR scheme with an explicit prediction of supersaturation simulates an increase in latent heating in mid-levels. More importantly, the storm simulated by the CLR scheme does not show any sign of weakness. The freezing profile, a total conversion of liquid water to ice water, and the deposition profile, a total conversion of water vapor to ice water, varies significantly with aerosol concentrations across the two BMSs. The primary peak results from frozen rainwater in the Clean_Thompson, due to graupel riming associated with supercooled liquid hydrometeors in the Clean_CLR, and from the freezing of cloud water in the Polluted_CLR. The two peaks in the Polluted_Thompson are associated with freezing of cloud water and rainwater, respectively. Since the latent heat of vaporization is more than seven times that of fusion per unit mass converted, given the magnitude of maximum freezing and deposition rates, the ice hydrometeors gain more mass from supercooled liquid hydrometeors than from water vapor. This suggests that frozen liquid water contributes to ice hydrometeors more than water vapor deposition. The two schemes depart from each other in the production of graupel, which is found to be important to dynamical feedbacks, as discussed below. The Thompson scheme produces graupel mainly from the freezing of rainwater by Bigg (1953) shown by the lower peaks in Fig. 9b. Instead, the CLR scheme produces most of the graupel from depositional growth (see Rutledge and Hobbs 1984), as shown by the deposition profile (Fig. 9c). Overall, the storm likely intensifies effectively with frozen liquid hydrometeors as seen in the Thompson experiments, with more supercooled rainwater in the clean experiment but more droplets in the polluted experiment. Meanwhile, the storm simulated with the CLR scheme seems to be overstocked with droplets and intensifies slowly with depositional growth on ice hydrometeors. Therefore, the freezing and deposition profiles reveal many important characteristics between the two schemes for clean and polluted experiments.
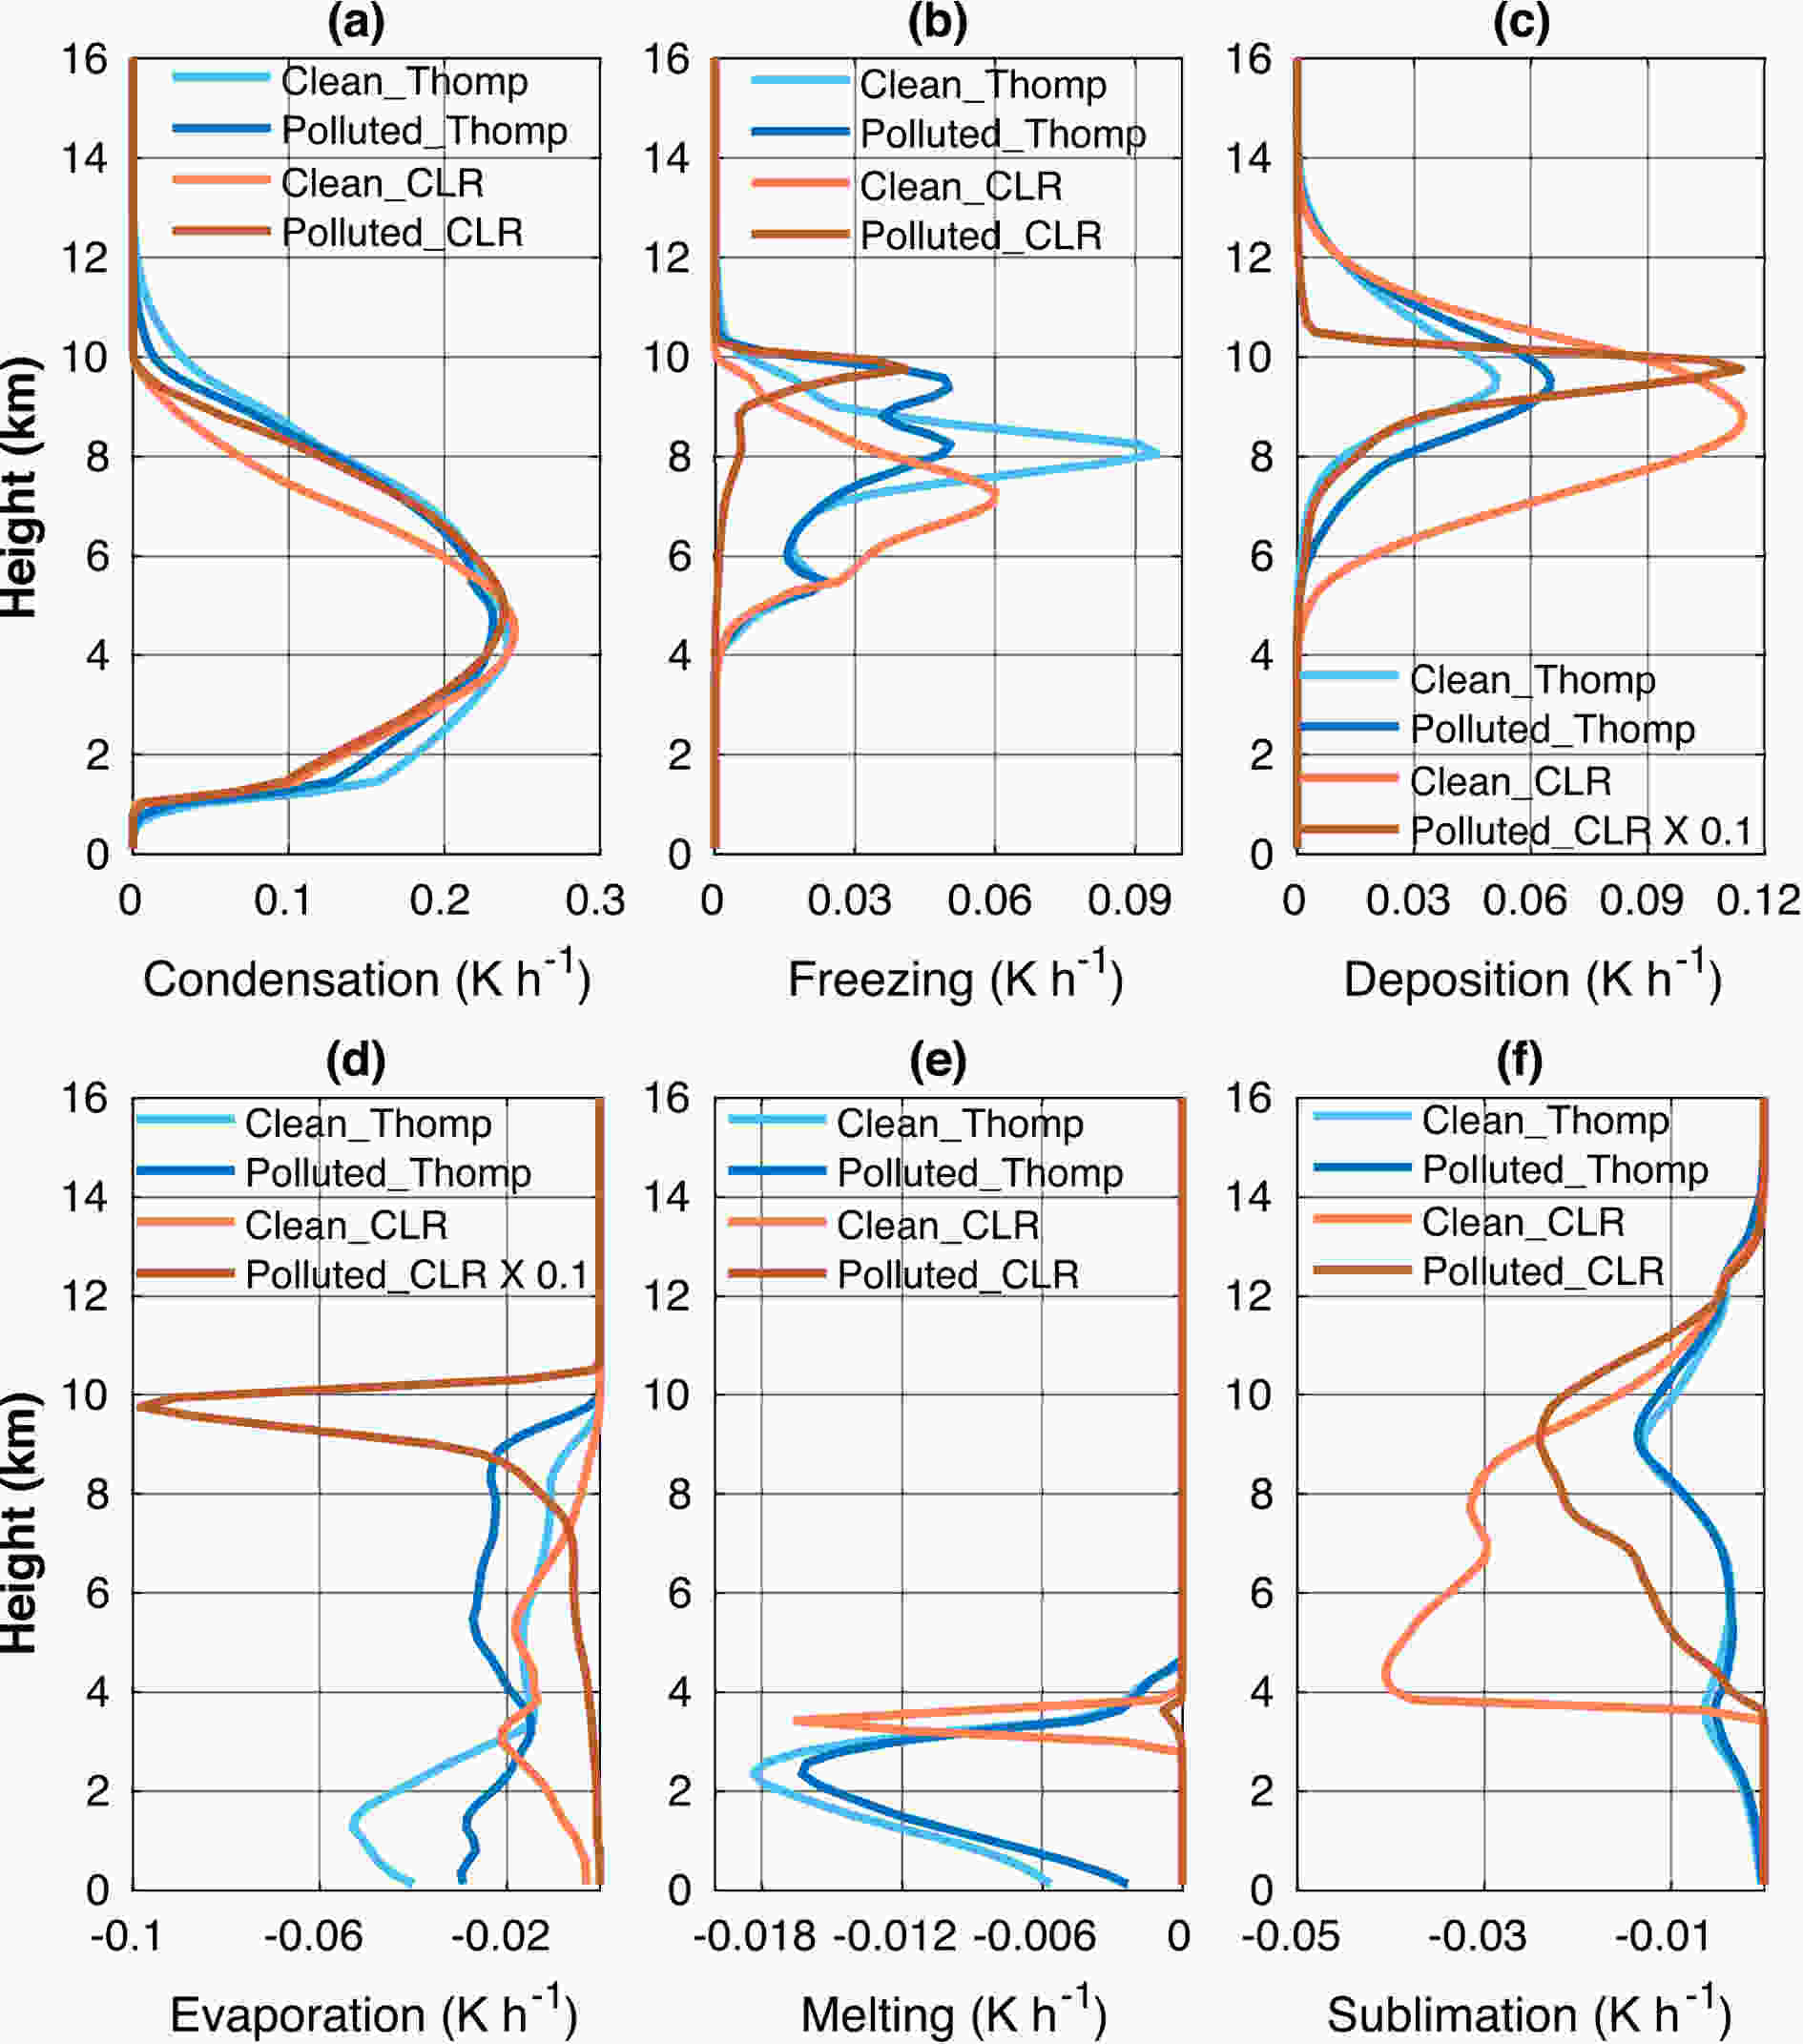
Figure 9. Decomposed latent heat terms resulting from the changes in water phases: (a) condensational heating from water vapor to liquid, (b) freezing from liquid to ice, (c) deposition from water vapor to ice, (d) evaporation from liquid to water vapor, (e) melting from ice to liquid, and (f) sublimation from ice to water vapor for the four baseline experiments in the first hour.
The cooling profiles also demonstrate important microphysical signatures associated with the cloud and precipitation characteristics. The sublimation profile of the CLR scheme reveals strong cooling around the freezing level and/or below the deposition peak. This could be a key to understanding the weak precipitation intensity in the two CLR experiments. As the aerosol concentration increases, the increased supercooled droplets undergo different microphysical processes in the polluted experiments. Evaporation dramatically increases with deposition aloft in the Polluted_CLR, implying that the droplets evaporate and are used for water vapor deposition on cloud ice or snow (note that the deposition heating rate and the evaporation cooling rate of Polluted_CLR is multiplied by 0.1 but the maximum is still outstanding in the figure). These are not seen in the evaporation profile of the Thompson experiments, in which the lower level peak can be simply attributed to rainwater and the upper-level evaporation to cloud water.
The melting profile is probably related to precipitation more than any other microphysical process profile. As depicted by Fig. 6, rainwater is mainly supplemented by the melting of graupel in all experiments. The results show that the dominant ice hydrometeor is graupel in the clean experiments, but is snow in the polluted experiments with both schemes. The clean experiments have more graupel than the polluted experiments, which explains the higher precipitation intensity in the clean experiments. However, more graupel is not associated with more precipitation since a great amount of graupel appears to be sublimated in the CLR experiments. An important feature explaining the differences between the two schemes is revealed in the cooling profiles showing that the CLR scheme produces more cooling in upper levels than the Thompson scheme does in lower levels. The strong low-level cooling in the two Thompson experiments is consistent with the amount of the rainwater and graupel mixing ratio, and rainfall intensity; this is absent in the CLR scheme. The low-level cooling can be associated with the cold pool which weakens slightly with increased aerosol loading in the Thompson experiments.
-
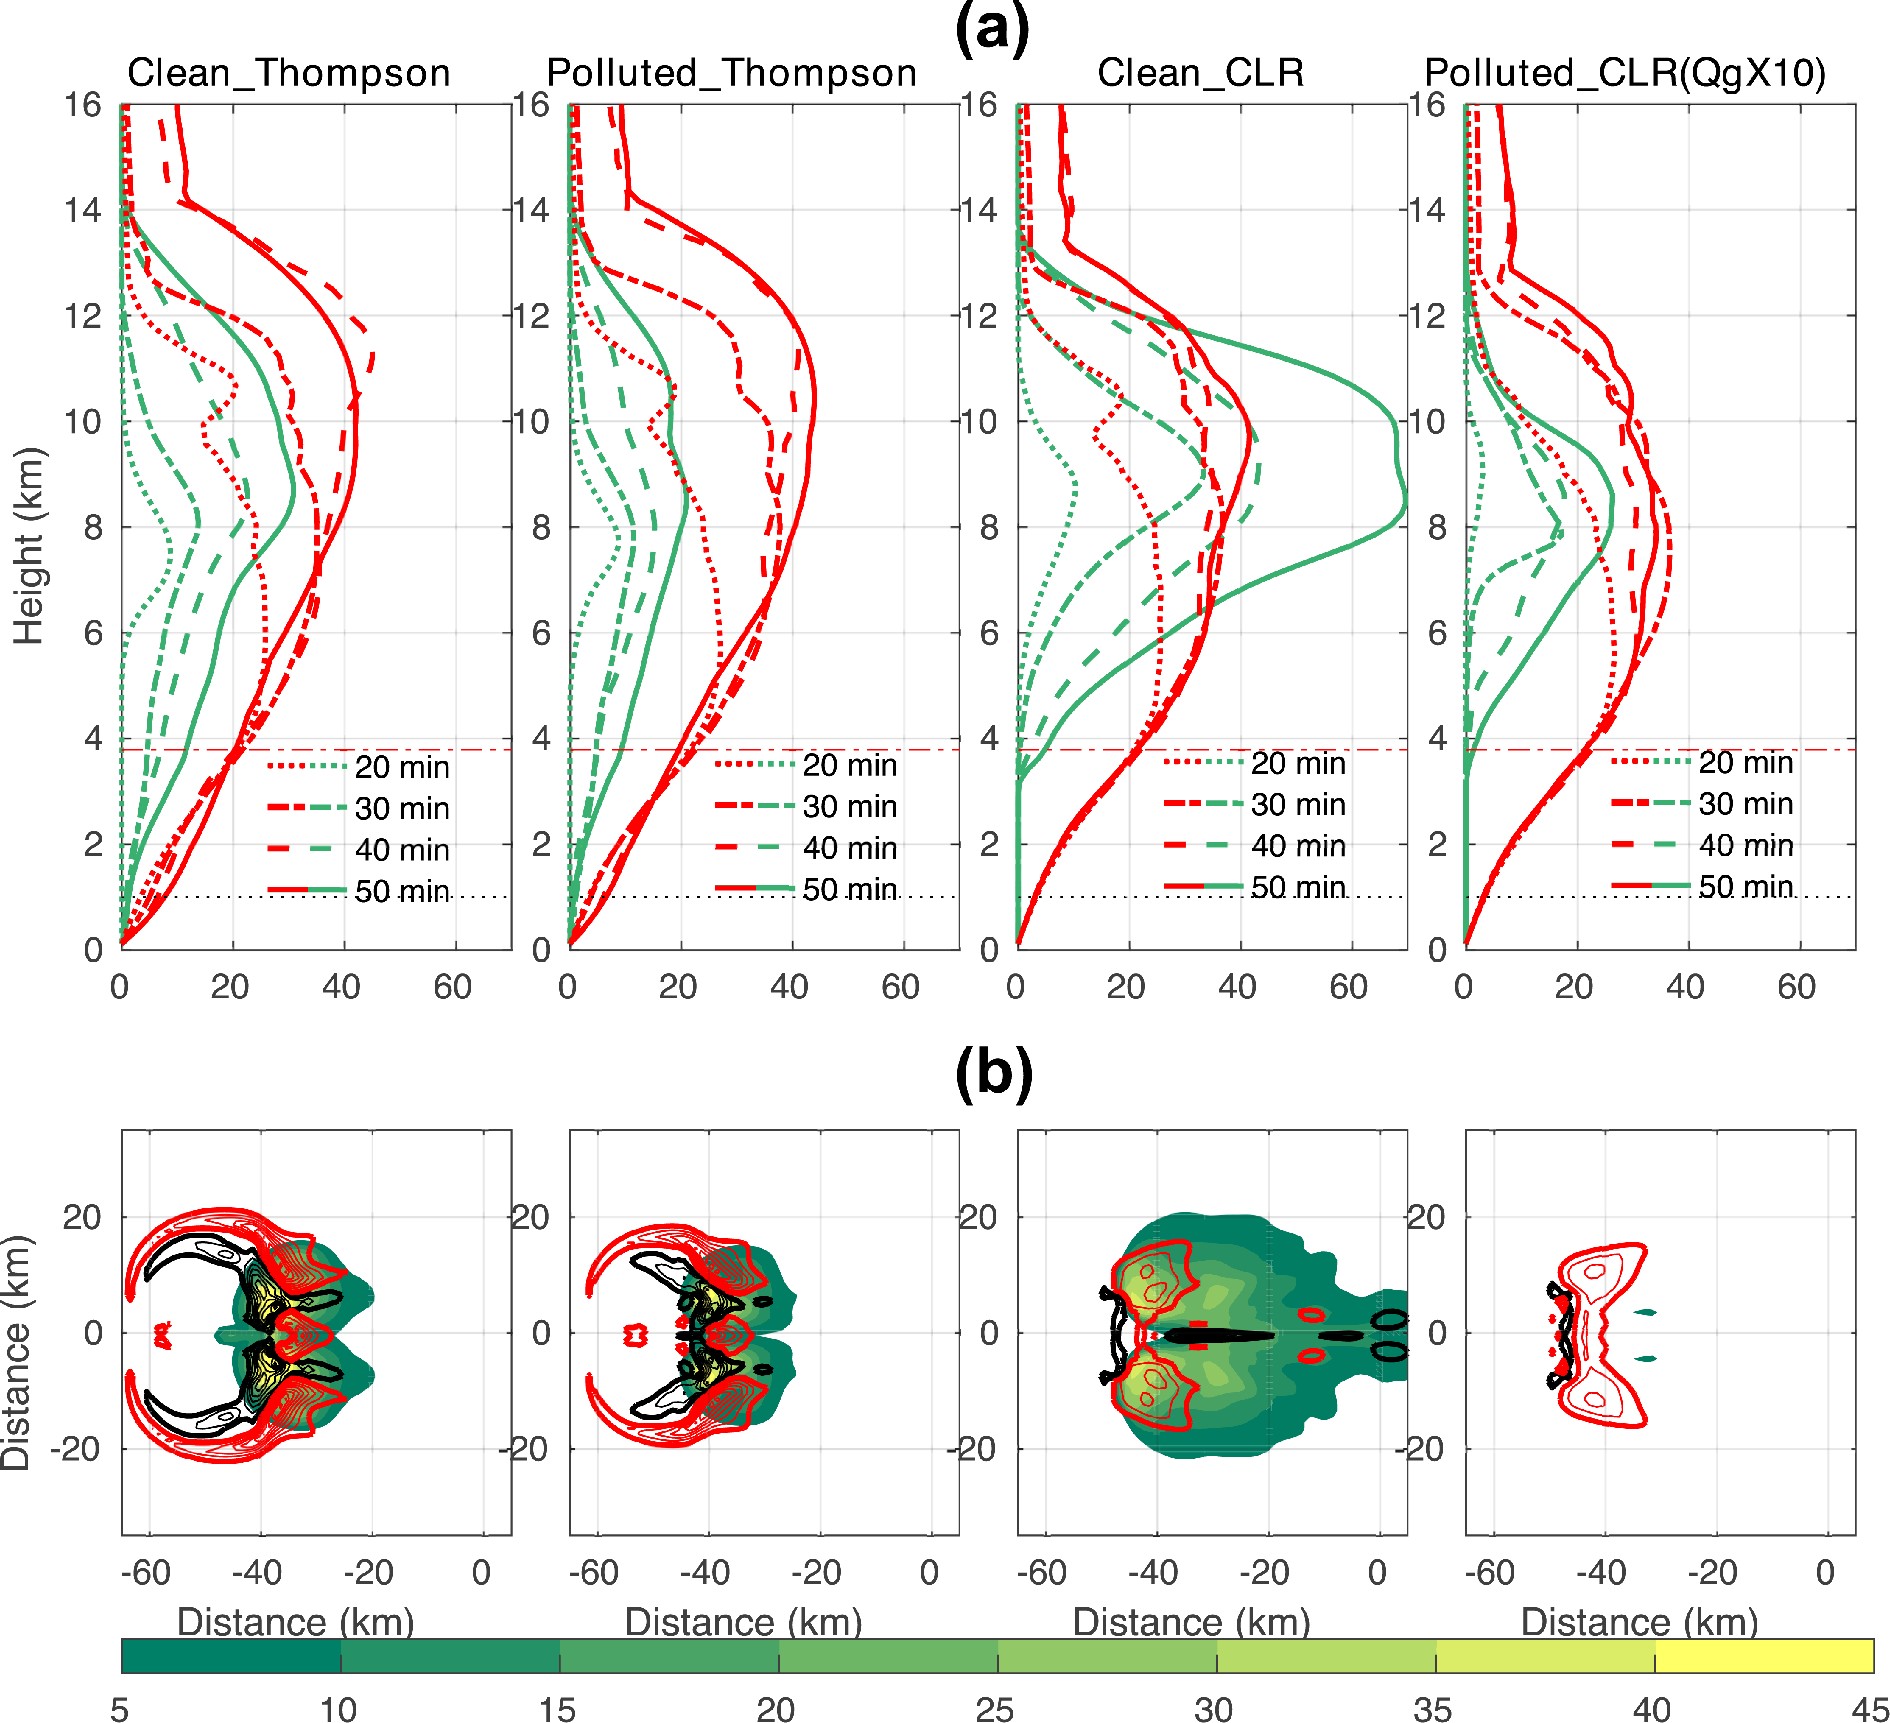
According to the four baseline experiments, storm intensification is very sensitive to different BMSs from the early stage of intensification. The cloud, precipitation, and wind fields in Fig. 5 indicate that the storm dynamics are simulated differently between the two schemes. The question is how BMS influences the convective dynamics as well as the intensities and propagation of the storm and precipitation. The latent heat profiles have revealed some of the most important features. Figure 10 shows the progressive evolution of vertical profiles of graupel and maximum vertical velocity, as well as column-integrated graupel mass and low-level vertical velocity in the first hour of the forecast. It is found that the CLR scheme produces extensive upper-level cooling, which might have detrimental effects on the vertical velocity and the cold-rain process during storm development. On the other hand, the low-level cooling in the Thompson experiments is associated with the intense, sheared downdraft and precipitation pattern, which are the result of the low-level cooling forcing the convective cell to propagate outwards. As a result, the supercells are organized differently and propagate eastward in different directions.
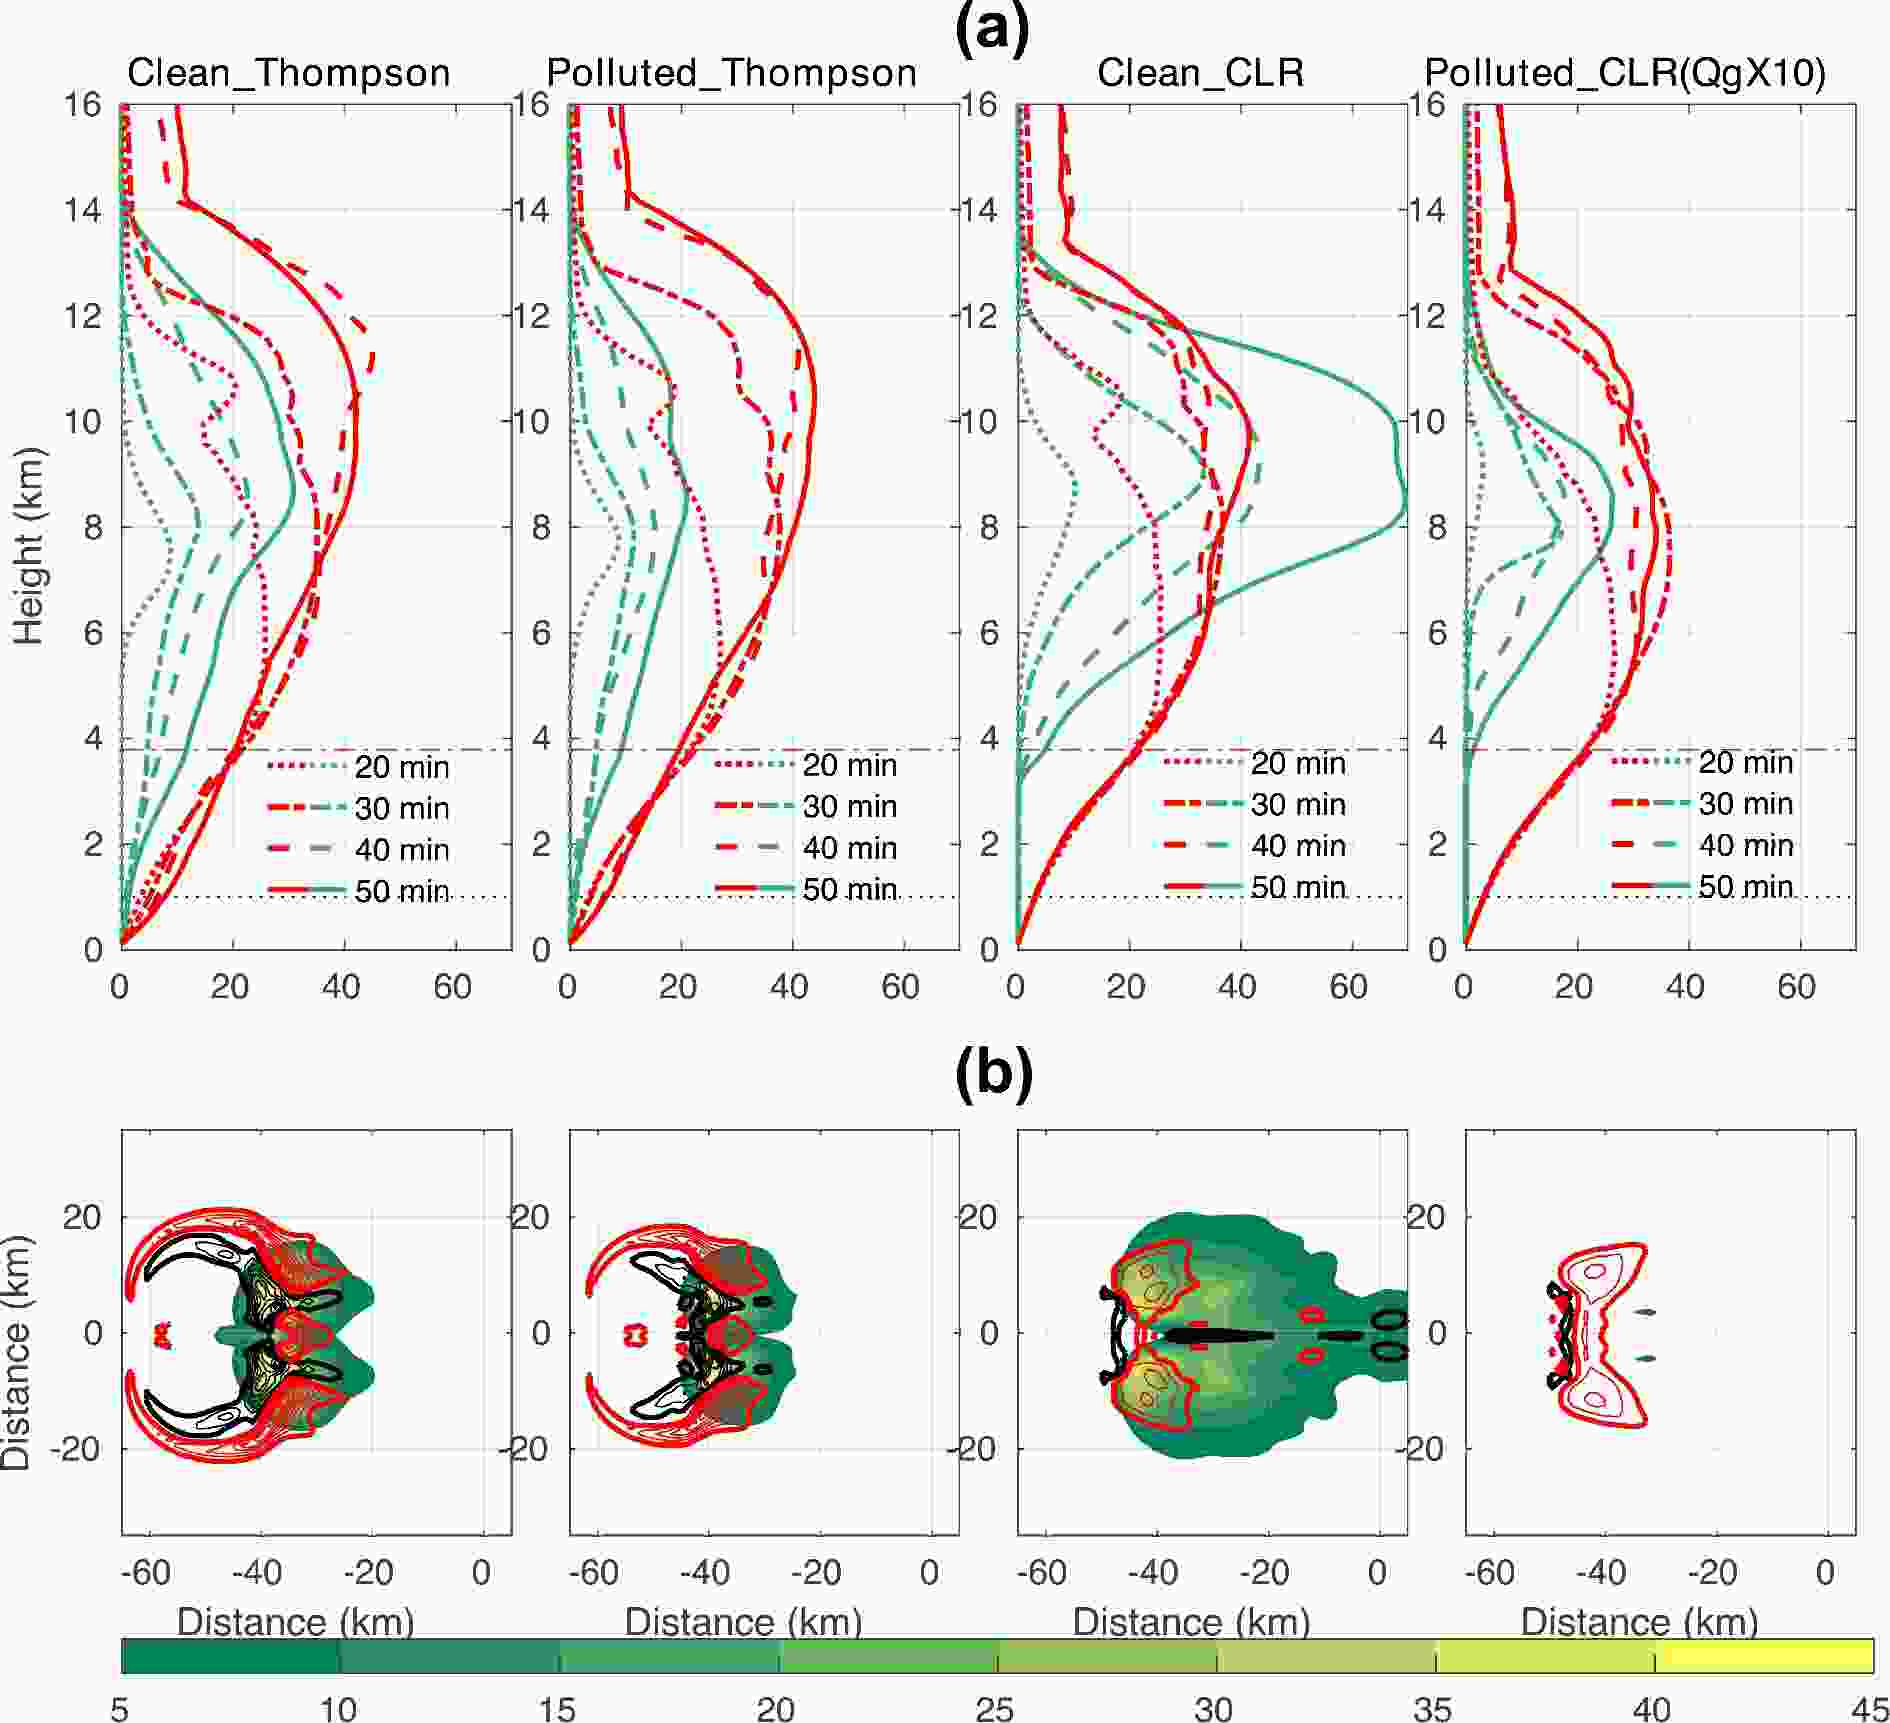
Figure 10. Graupel and vertical velocity. (a) Time evolution of graupel (green, units: 10−3 g kg−1) and maximum vertical velocity (red, units: m s−1) at 20th, 30th, 40th, and 50th min and (b) column-integrated graupel mass (shaded) (kg m−2) overlain with vertical velocity (contours, red for updraft, and black for downdraft) at 60th min for the four baseline experiments. The vertical velocity in (b) is at a height of 1 km: Contours are at intervals of 1 m s−1, with 1 m s−1 and −1 m s−1 in bold.
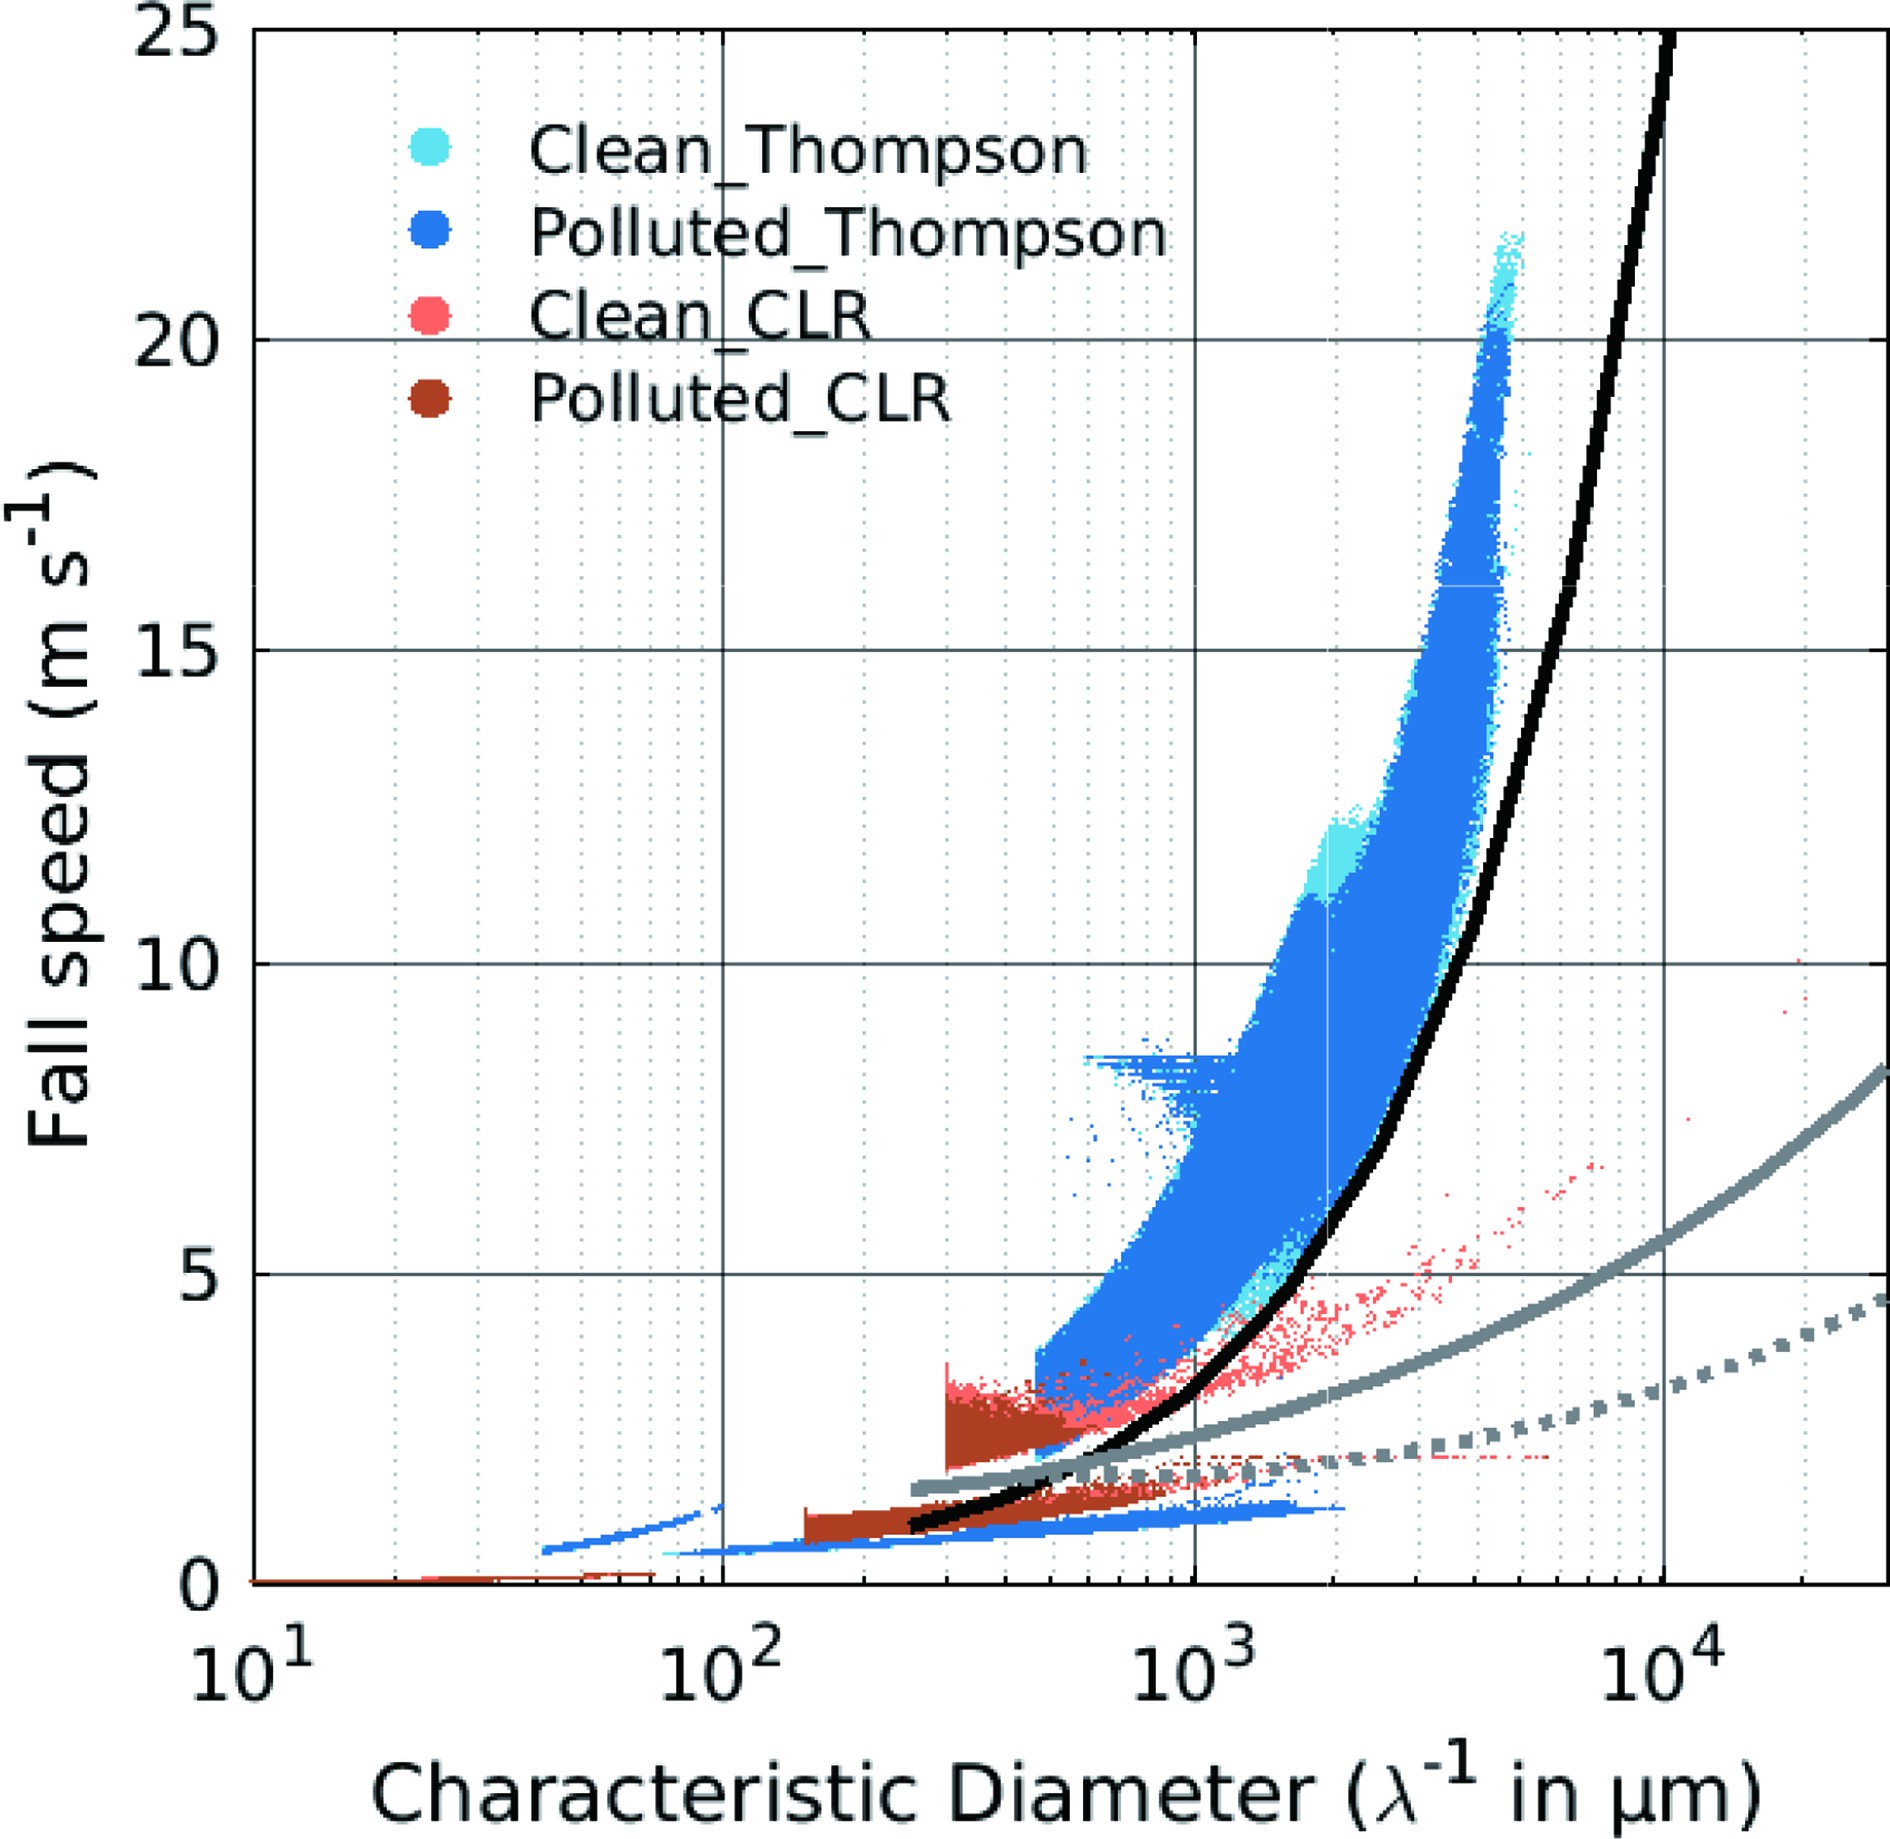
What microphysical processes are responsible for such different cooling profiles between the two schemes? First, it is important to note that the mutual cancellation of the latent heating and cooling has negative effects on storm intensification. For example, sublimation occurs with condensation at similar altitudes, as does the evaporation and deposition in the CLR schemes. Secondly, graupel is mainly produced by different microphysical processes in the two schemes in this case, but both schemes produce a significant amount of graupel regardless of the differences. Spatially, the graupel overlaps with the intense downdraft next to the updraft in the Thompson experiments but appears to be widespread across a large area in the CLR experiments. Moreover, some graupel particles fall below the freezing level in the Thompson experiments but none do so in the CLR experiments. Figure 10 shows that both the maximum and spatial distribution of low-level downdrafts between the two schemes largely overlaps with the maximum amount and spatial distribution of column-integrated graupel and rainwater and rainfall patterns (see Fig. 5). This distinct spatial distribution can be associated with the population fall speed characteristics presumed in the two schemes. Figure 11 shows the fall speed of the three ice hydrometeor types (cloud ice, snow, and graupel) versus their characteristic diameters in the four baseline experiments. The characteristic diameter is
${D_{\rm{n}}} = {\left[ {Q{{\left( {\pi {\rho _x}N} \right)}^{ - 1}}} \right]^{{1}/{3}}}$ for exponential size distribution, where Q, N, and ρx are the mixing ratio (kg kg−1), number concentration (kg−1), and density of the hydrometeor category x (kg m−3), respectively. The exponential distribution is generally used for large hydrometeors in many BMSs. Cloud ice is presumed as non-precipitating in both schemes, and the rate of snowfall is less than 3 m s−1. Graupel is the most important precipitating ice hydrometeor species because its fall speed in the CLR scheme is up to 10 m s−1, and the hail-like graupel in the Thompson scheme can fall at speeds up to 25 m s−1. Overall, the CLR scheme produces graupel with smaller sizes than does the Thompson scheme. The mean size of the graupel is only slightly reduced in the polluted experiment with the CLR scheme but is insensitive to different aerosol loadings in the Thompson scheme. Figure 10 shows that the Thompson scheme produces slightly less rainwater and graupel in the polluted experiment than in the clean experiment, while the Polluted_CLR barely produces graupel because of little rainwater (the amount of graupel mixing ratio of Polluted_CLR in the figure should be divided by 10). The hail-like graupel in the Thompson scheme cools the air near the convective core effectively. The graupel increases the amount of rainwater and enhances the low-level cooling by melting and evaporative cooling. Therefore, the precipitation, downdraft, and cold pool are particularly remarkable in the Thompson experiments. The updraft is enhanced, sheared, and split at a larger angle because the stronger downdraft induces stronger low-level convergence against the easterly flow.
Figure 11. Scatterplot of the characteristic diameters and mixing ratio fall speeds for cloud ice, snow, and graupel from the four experiments. The black (grey) line represents the results of the mixing ratio-weighted fall speed formula used by the Thompson (CLR) scheme. The grey dotted line denotes the number weighted-fall speed formula used by the CLR scheme.
-
Cloud water and rainwater initiation are discussed in this section. Given the same prescribed aerosol loading, the relative efficiency of the two processes coupled with the fundamental aerosol or cloud particle size distributions is compared to identify the fundamental differences in the aerosol parameterizations of the two schemes.
-
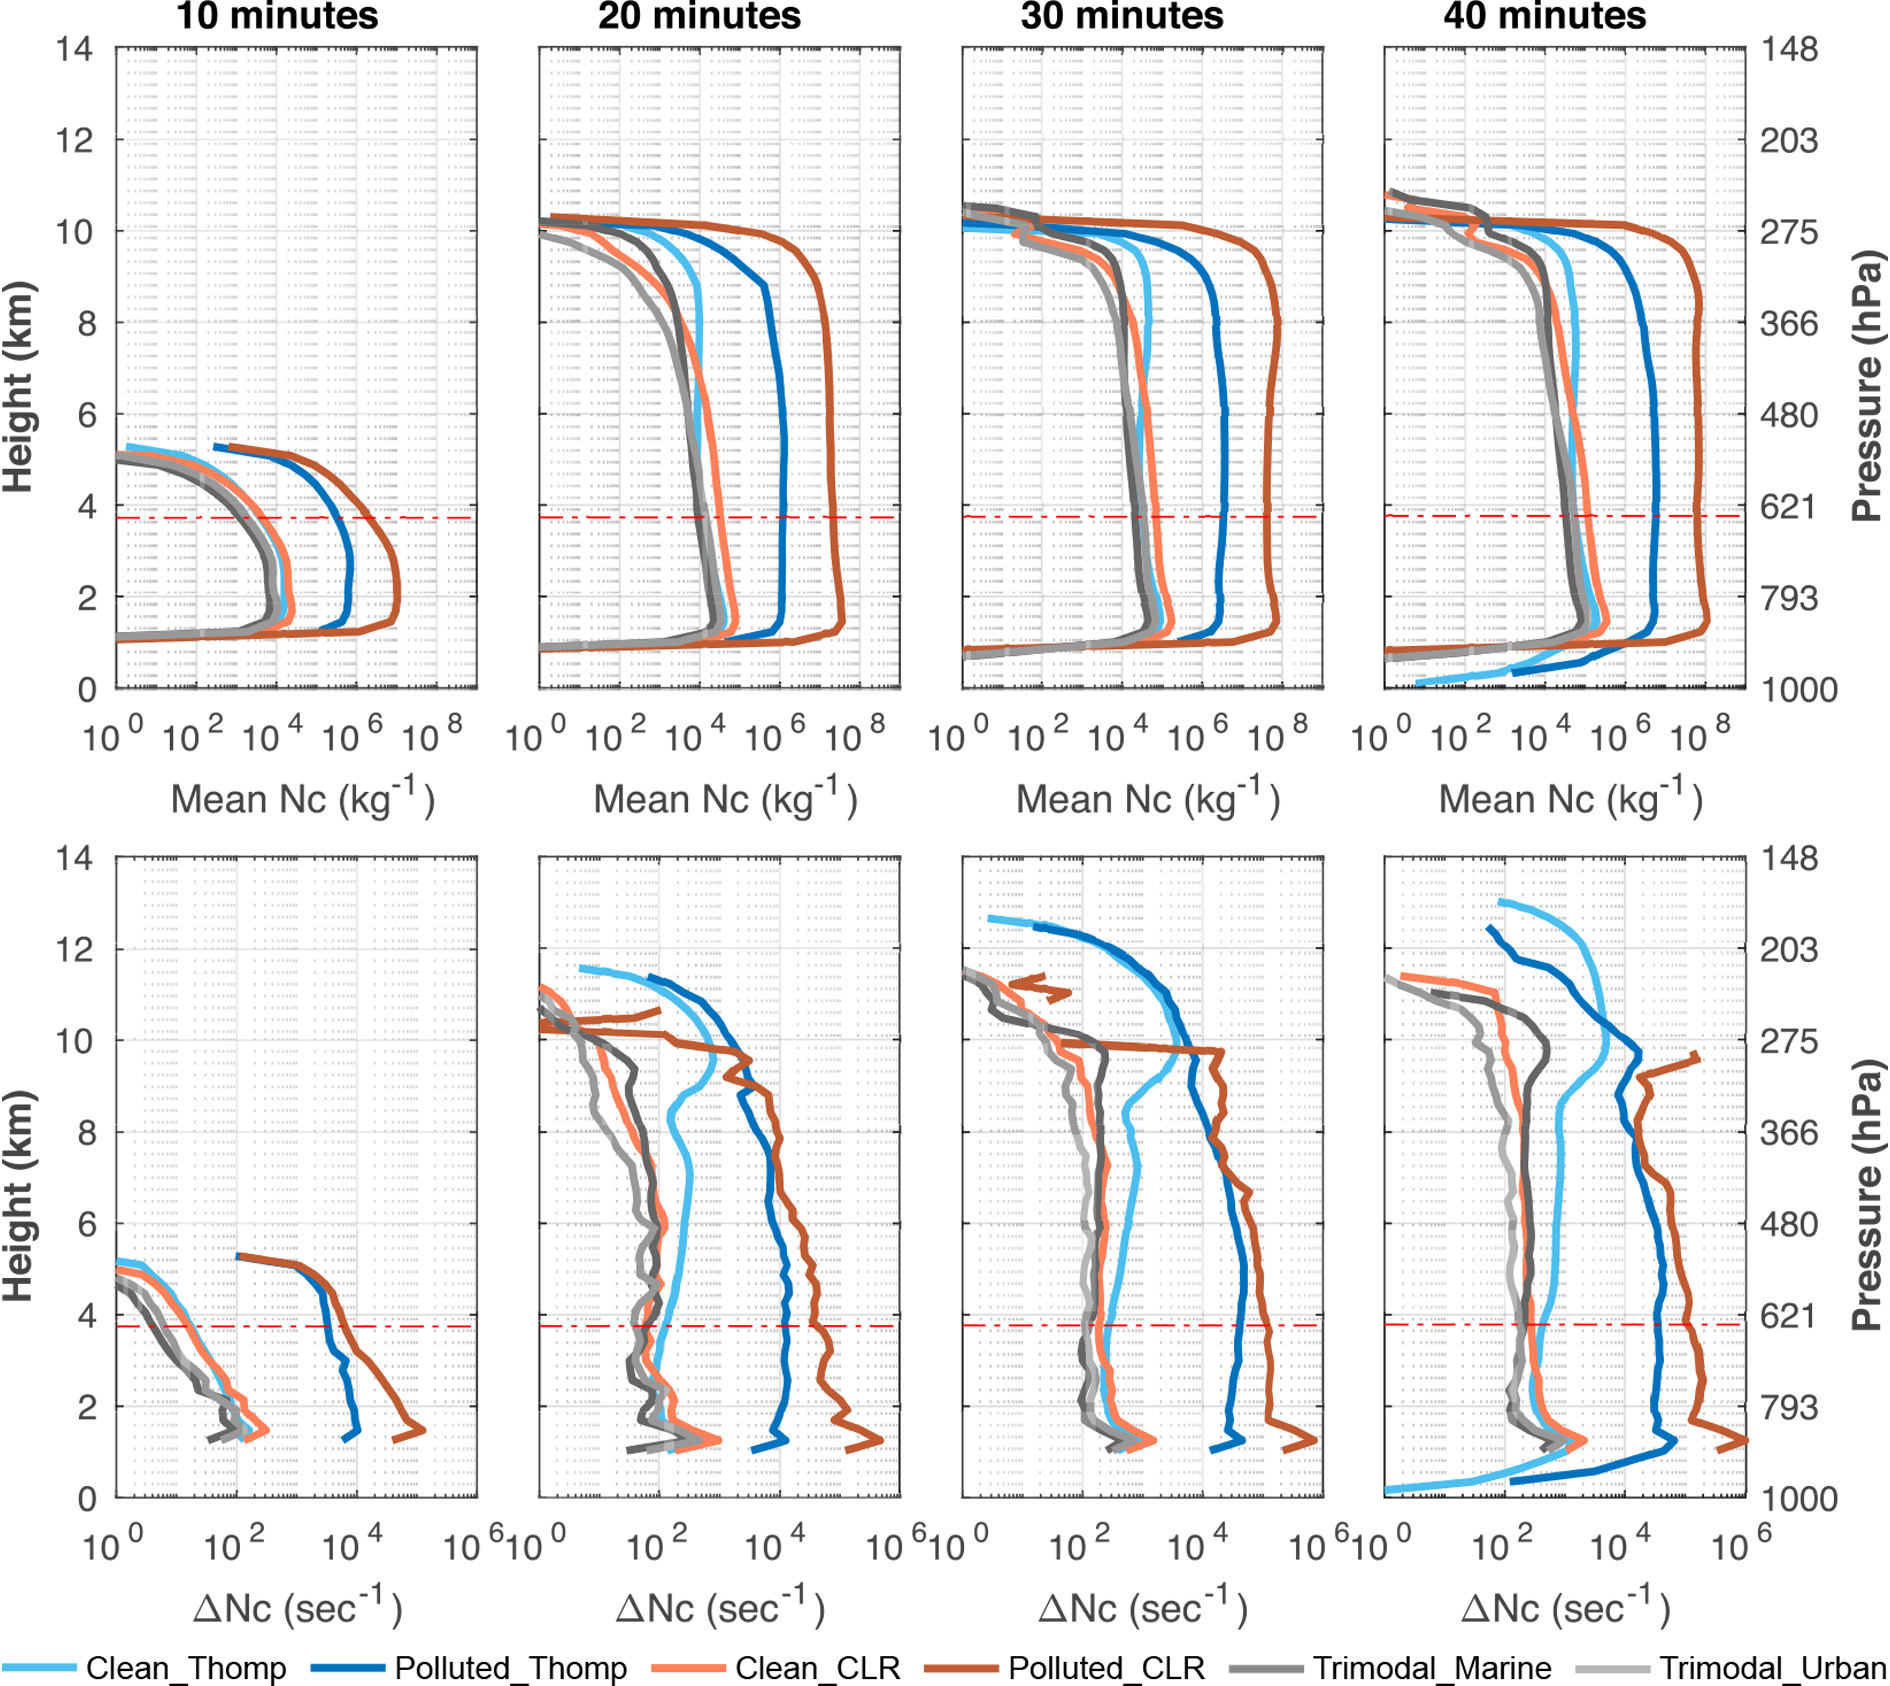
CCN activation rate is strongly related to aerosol concentrations. Figure 12 illustrates the evolution of 10-min mean vertical profiles of activated CCN number concentration (1st row) and droplet number concentration (2nd row) in the first 10, 20, 30, and 40 min of the storm simulations. The activation process is still active above 10 km in the Thompson experiments, but those supercooled droplets cannot live long since air temperature is lower than −40°C. The Polluted_CLR has approximately 10 times higher mean droplet number concentration than the Polluted_Thompson, which might be attributed to a higher activation rate with the CLR scheme and shall be discussed next. Trimodal_Marine and Trimodal_Urban are new experiments to illustrate the effects of trimodal ASD by the dark and light gray lines. As the previous study has suggested, aerosol effects likely become insignificant in extremely polluted conditions, so the ASD sensitivity experiments here are conducted based on the clean condition. The new experiments have the same total aerosol number concentration with the clean aerosol profile, except that the number concentration is redistributed to three modes like the default marine and urban ASDs. First, it is noticed that the storm deepens over time with a descending cloud base and rising cloud top. The cloud top developed higher in the two Thompson experiments, indicating that the storm intensified earlier. The two clean experiments generally activate slightly more aerosols than the two new experiments since the cloud base, which is likely related to the effect of ASD.
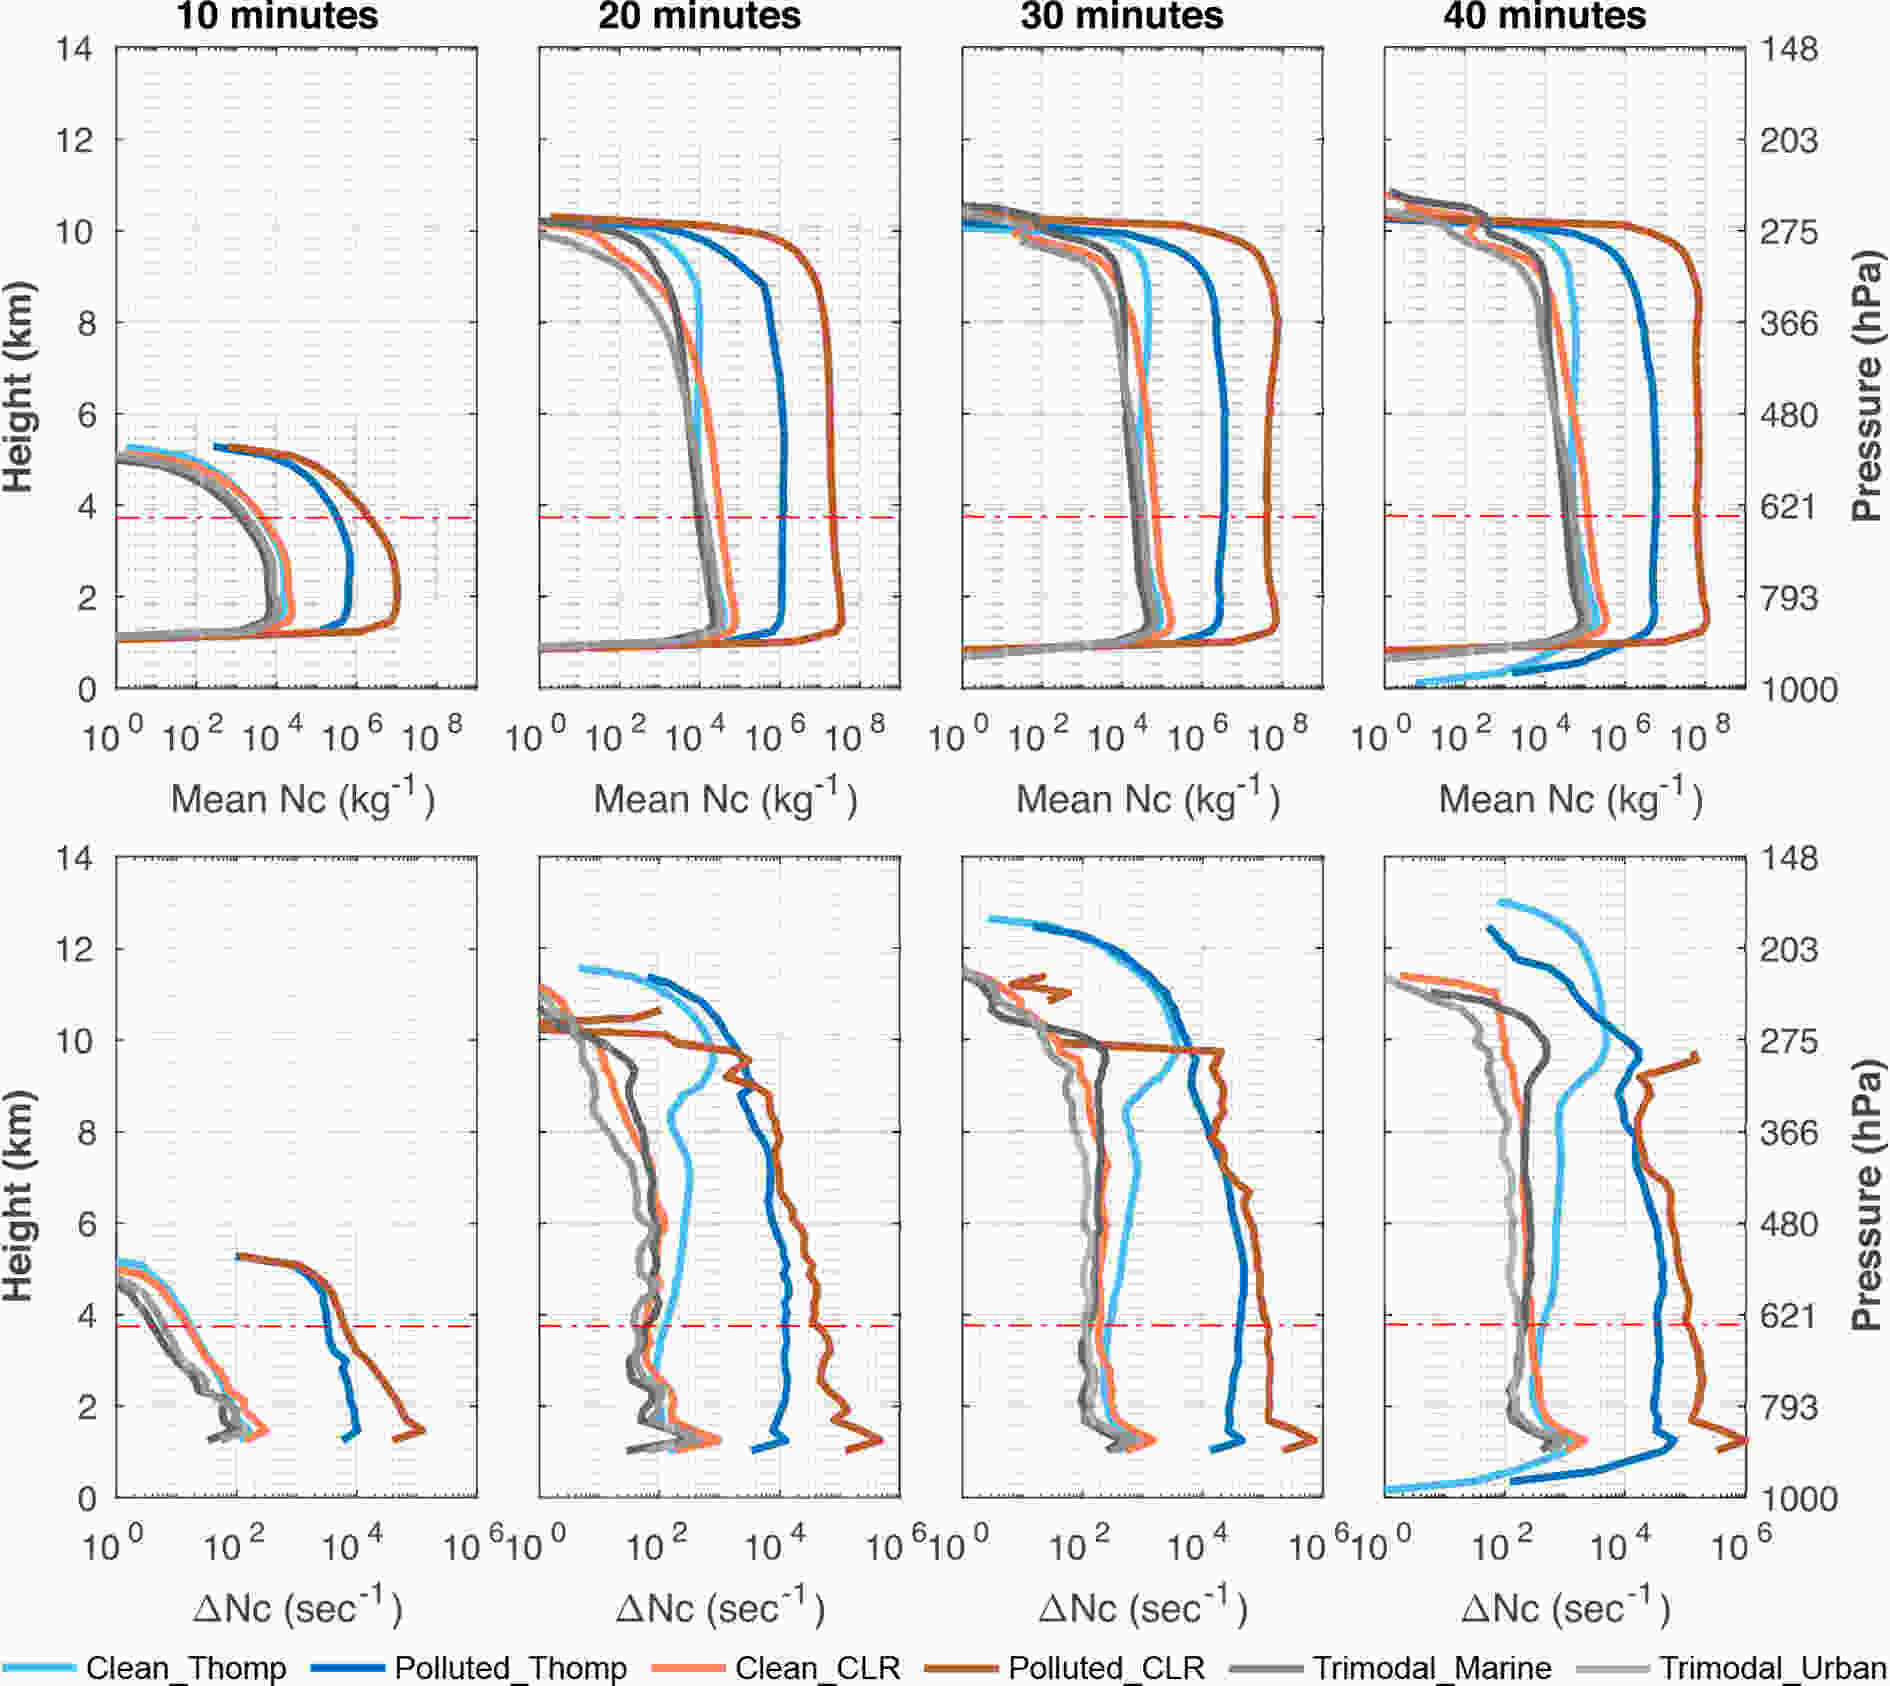
Figure 12. 10-min mean vertical profiles of the mean droplet number concentration (top row) and droplet number concentration activated (bottom row) in the first 10, 20, 30, and 40 min for the four baseline and two trimodal ASD experiments. The pressure corresponding to the height is specified on the right y-axis. A legend for multiple lines is placed in the bottom-left plot.
The sensitivity of the CCN activation rate to ASDs was explored with the default trimodal aerosol activation process in the CLR scheme. Figure 13 shows the CCN activation rate as functions of supersaturation and aerosol number concentration in the two schemes. It is seen that the activation rate is generally increasing with an increase of supersaturation but decreasing with an increase of aerosol concentration in the Thompson scheme. In the CLR scheme, the activation rates of the two trimodal ASDs are leveled after the supersaturation reaches 3% by default and are invariant to any increase or decrease in the total aerosol number concentration. The two trimodal ASDs have similar activation rates at small supersaturation but deviate above supersaturation of 0.3% where Trimodal_Urban has a higher activation rate than the Trimodal_Marine due to the higher mean radius in the dominant modal (Table 2). This shows that the activation rate in the CLR scheme is very sensitive to the mean radius of the dominant mode as the supersaturation determines the cut-off radius which is the minimum radius of aerosols that would be activated under such supersaturation ratio. For example, a supersaturation of 0.1% would have aerosols with radii larger than 0.068μm activated, and supersaturation of 3% would have aerosols with radii larger than 0.007μm activated. In practice, the unimodal ASD (blue and purple lines) used in the four baseline experiments has much higher activation rates than the two trimodal ASDs (red and yellow lines), which can be explained by the higher mean modal radius. The number concentration of activated droplets might vary dramatically with aerosol number concentration and supersaturation during the simulation, but Fig. 13 roughly illustrates the activation rate for all experiments based on the initial conditions. The Clean_Thompson (blue dashed) is supposed to have a higher activation rate than the Pollute_Thompson (blue dotted) due to lower aerosol number concentration. The Clean_CLR and the Polluted_CLR should follow the same activation rate (purple solid) because the activation efficiency is invariant with the aerosol concentration in the CLR scheme. The figure helps to explain that the two schemes activate similar droplet number concentrations for the clean experiments and that the CLR scheme activates many more droplets for the Polluted_CLR than the Thompson scheme for the Pollute_Thompson. Moreover, the Clean_Thompson and the Clean_CLR have slightly higher mean droplet number concentrations than the two trimodal experiments, likely also because of the higher activation rate. However, it is found that the CCN activation rate might be very sensitive to the ASD, but the effect is much less than the aerosol number concentration. The uncertainty in the aerosol number concentration can have deleterious effects on any benefits from the explicit representation of ASD. Therefore, aerosol number concentration is still the most effective and a more important parameter than the ASD to represent aerosol-cloud interactions even in an intense storm system such as the supercell.
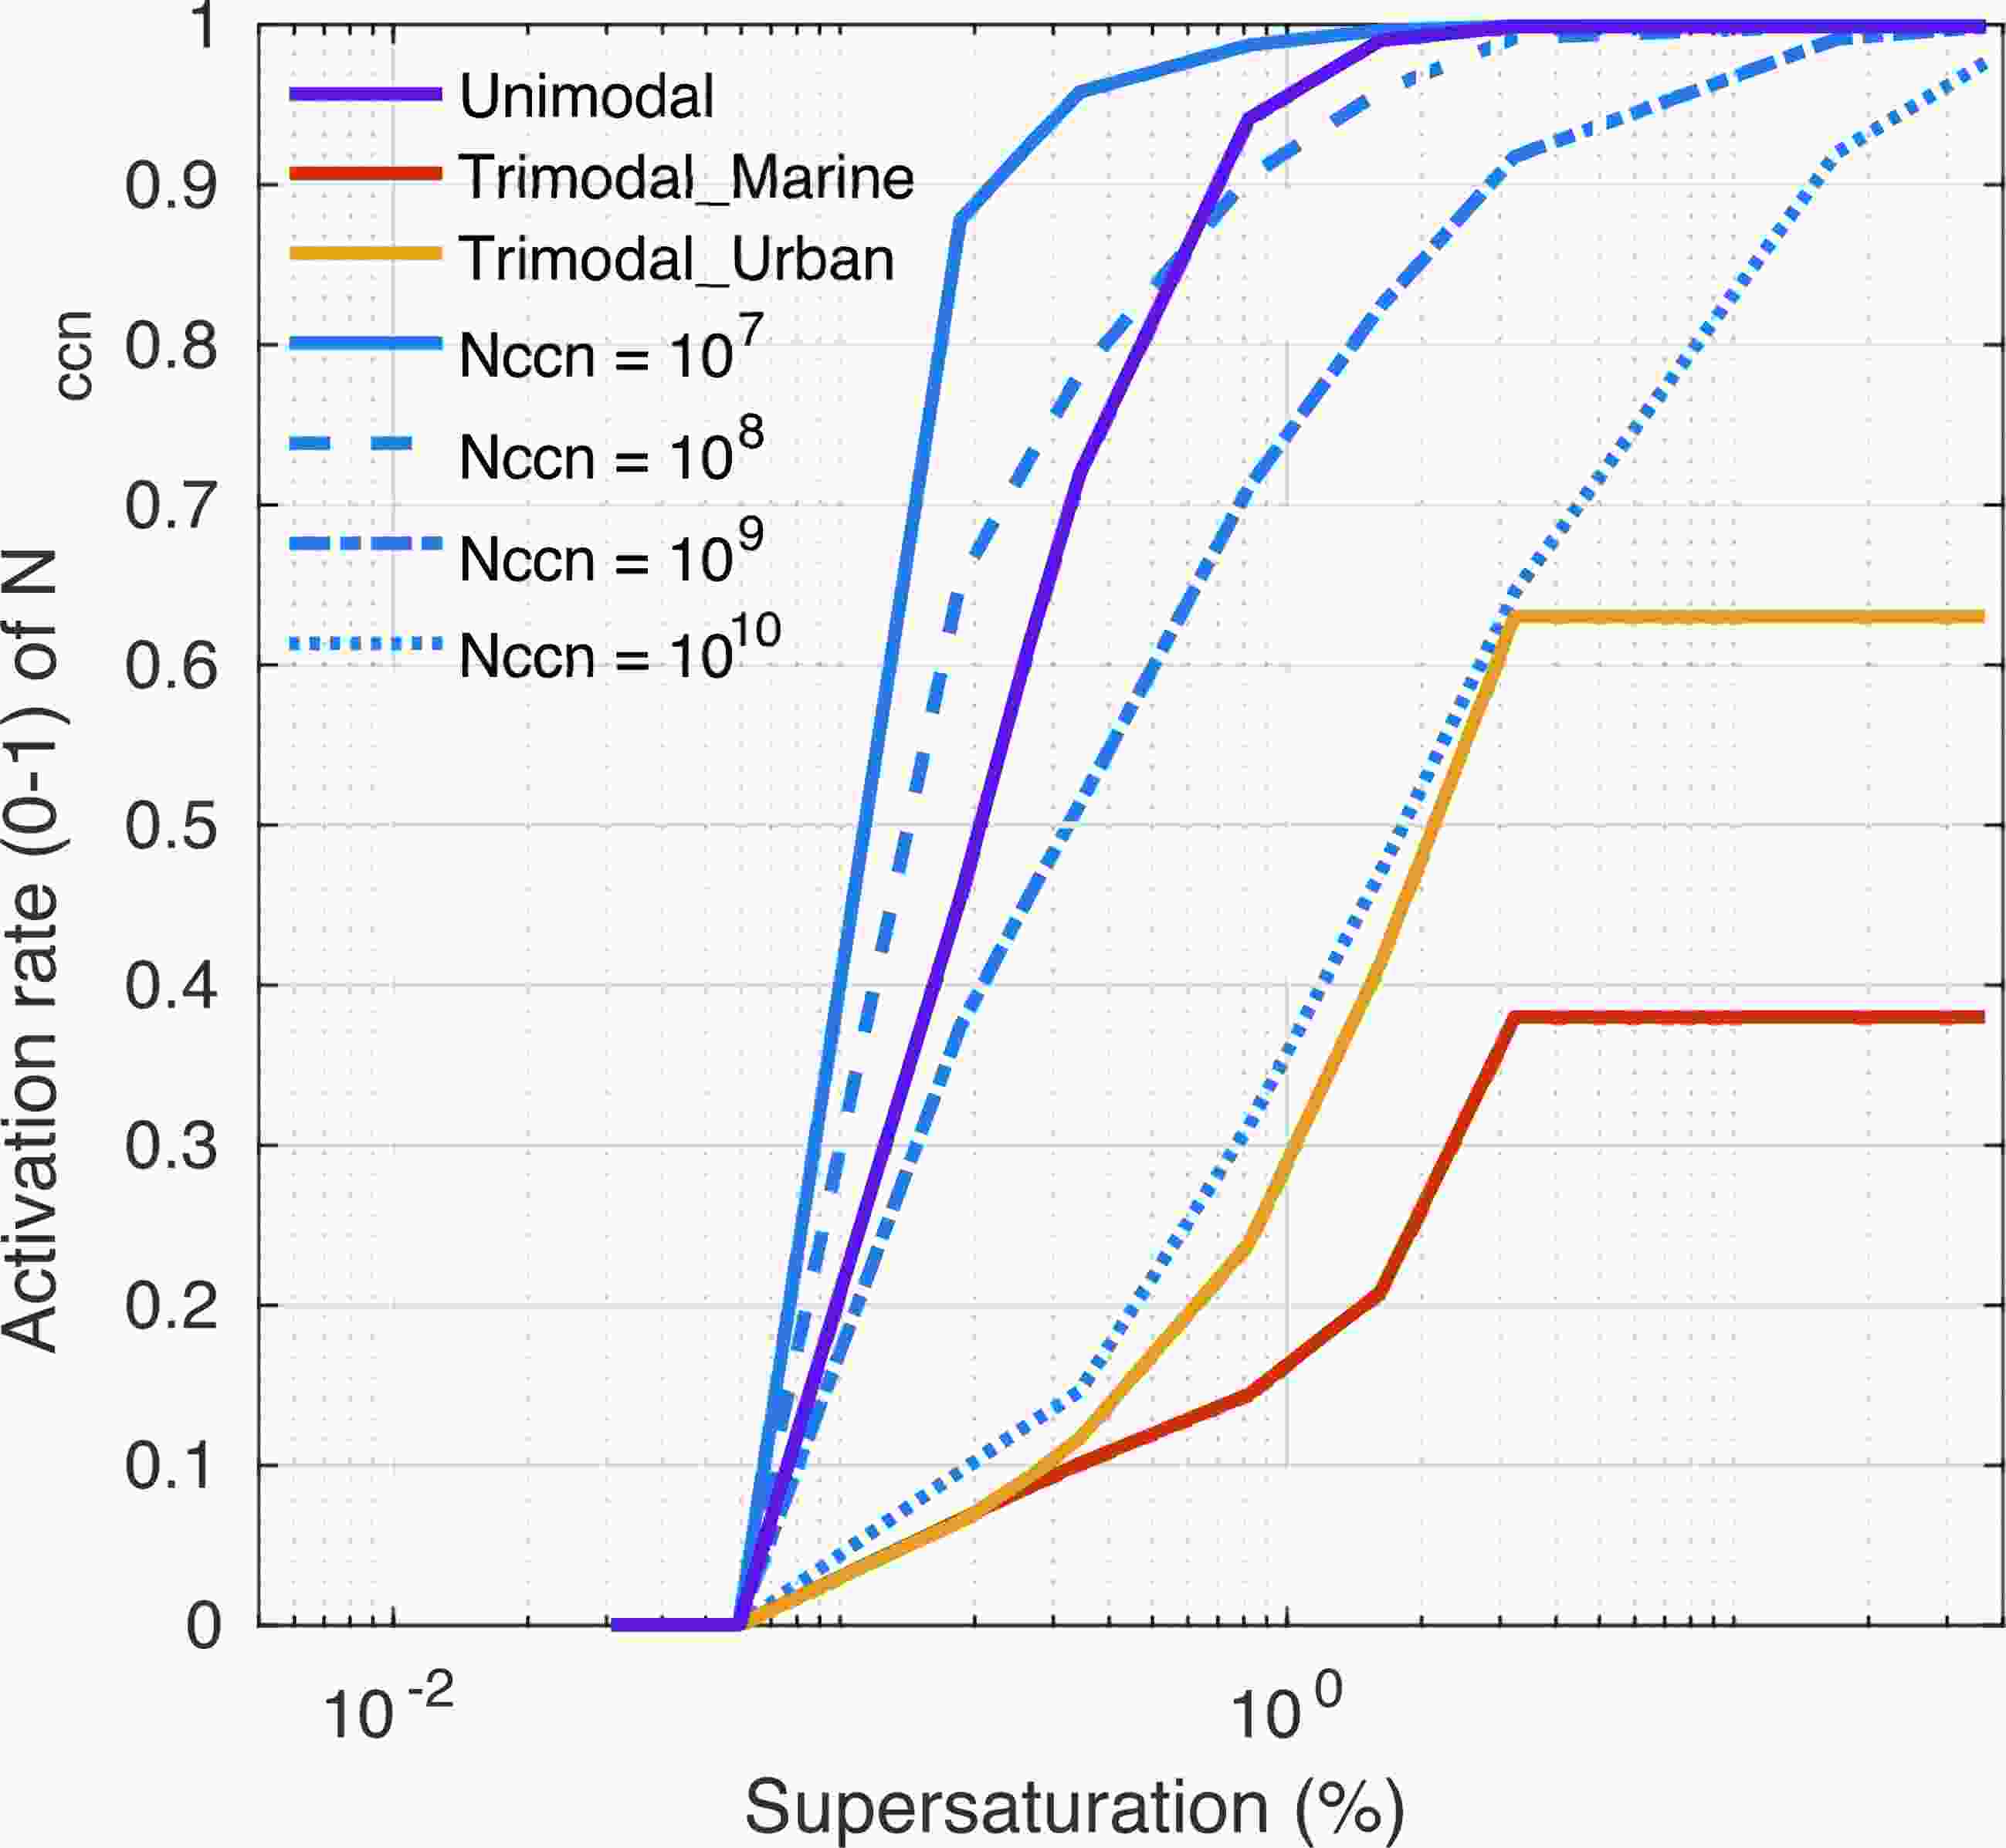
Figure 13. CCN activation rate (0−1) to supersaturation (%) in the Thompson (blue) and CLR schemes (purple, red, and yellow for different aerosol size distributions)
-
Auto-conversion is important for the early initiation of raindrops. Figure 6 shows that rainwater is displaced at different heights with the two schemes. The Thompson scheme begins producing rainwater immediately after the cloud droplets are nucleated at a height of approximately 2 km in the clean experiment, but the production of rainwater is delayed and begins at a height of approximately 4 km in the polluted experiment. The CLR scheme produces rainwater slower than the Thompson scheme; thus, rainwater is initiated at approximately 4 km in the clean experiment, and raindrops are barely produced in the polluted experiment, indicating that auto-conversion is likely slower in the CLR scheme than in the Thompson scheme and that the process is further suppressed as the simulated droplet size decreases.
To identify the fundamental differences in the auto-conversion process between the two schemes, the parameterization expressions are compared. According to Thompson et al. (2008), the autoconversion rate in the Thompson scheme listed in Eq. (1) is based on a classical treatment of Berry and Reinhardt (1974), in which the amount of cloud water converting to rain per unit of time is computed by the characteristic diameters of the assumed droplet spectrum.
ρa, Qc, and Qr are the air density (kg m−3), cloud water mixing ratio (kg kg−1), and rainwater mixing ratio (kg kg−1), respectively. The characteristic diameter (Dn) and mean-volume diameter (Df) are derived from Berry and Reinhardt (1974) [Eqs. (1)−(6)]. The formula in the CLR scheme is also provided by Eq. (2) and (3), where Nc, Nr, and mc are the cloud droplet number concentration, raindrop number concentration, and mean cloud droplet mass (Qr Nr−1), respectively.
where
The formulations differ greatly and use different mean size parameters, i.e., the modal diameter of the gamma distribution for the Thompson scheme and the mean-volume diameter of the Marshall-Palmer-like distribution in the CLR scheme, in which only modal diameter is particularly associated with the spectrum of size distributions. As a result, the auto-conversion rate of the Thompson scheme is likely influenced by the droplet size spectrum during the simulation time, which is obviously an advantage.
While the choice of mean diameter is critical to the consideration of the size spectrum, the mean diameter likely plays a more essential role than the shape parameter(s) in the auto-conversion rate. The mean droplet diameter is between 1−100 μm in the Thompson scheme versus 0.1−100 μm in the CLR scheme, whereas the range of mean raindrop diameter is between 50 μm−5 mm in the Thompson scheme versus 20 μm−6 mm in the CLR scheme. Figure 14 shows the auto-conversion diagram as a function of droplet number concentration and mean-volume radius, overlapped with the simulation results (contours) below 4 km (the freezing level) and within the first hour of simulation. The auto-conversion rate is dominated more by droplet size than by number concentration. Given the same cloud droplet number concentration and droplet size, the auto-conversion process of the Thompson scheme is more efficient than that of the CLR scheme, which explains why the Thompson scheme produced rainwater at lower levels than the CLR scheme. As the aerosol number concentration increases, the droplet number concentration is also increased, but the mean size is decreased, and the contours move to the bottom-right zone. Efficiency is suppressed in the polluted experiment more severely in the CLR scheme than in the Thompson scheme. Physically, this indicates that the smaller droplets require more time to grow in the rising air parcel; thus, auto-conversion occurs at higher altitudes.

Figure 14. Rainwater mass auto-conversion rate (shaded) as a function of droplet number concentration and mean-volume radius in the (a) Thompson and (b) CLR schemes. Light blue, dark blue, light red and dark red contours are probability density functions from experiment Clean_Thomp, Polluted_Thomp, Clean_CLR, and Polluted_CLR experiments, respectively. The data are gathered from the lower part of the air column (below 600 hPa) and 12-time slices in the first hour. Contour intervals are 100, 500, 1000, 2000, 3000, and 4000 grid points.
-
The aerosol effects on an idealized supercell storm are compared using the Thompson and CLR aerosol-aware BMSs in the Weather Research and Forecasting (WRF) model version 3.8.1. The objective of this study is to identify the fundamental differences between the two schemes that lead to their different responses to the same prescribed aerosol loading, more specifically, the CCN loading.
Our results illustrated that given the same aerosol loading, the two schemes did not necessarily produce the same cloud water mixing ratio, number concentration, or mean droplet size. At first, the cloud droplets were initiated and grew differently by activation and auto-conversion, respectively. As the aerosol concentration increased, more cloud droplets were activated, and less rainwater was produced. The activation rate was sensitive to ASD, but the aerosol number concentration was much more important than the ASD to the mean droplet number concentration. The production of rainwater was reduced because the mean droplet size was greatly reduced in the polluted experiments during the activation process, and the auto-conversion was later suppressed by the decreased mean droplet size. Rainfall characteristics of the two schemes were strongly associated with the production of rainwater, which was sensitive to auto-conversion from droplets and melting from graupel. Therefore, the efficiency of auto-conversion was crucial to the production of rainwater for the formation of graupel and precipitation early in the simulation. By comparison, the CLR scheme activated slightly more cloud water mixing ratio and number concentration and slower auto-conversion efficiency than did the Thompson scheme. As a result, the Thompson scheme produced rainwater and precipitation more efficiently than the CLR scheme. On the other hand, it was found that aerosol effects on ice hydrometeor profiles were relatively significant in both schemes. Graupel and snow appear to dominate the ice water content in the clean and polluted experiments, respectively, because the CCN number concentration is influential for the efficiency of the warm-rain process and the size of liquid hydrometeors, which can modify the production pathways of ice hydrometeors.
In addition to the representation of aerosol effects, huge fundamental differences were found between the two schemes, which caused the main differences in rainfall pattern and intensity. Latent heat profiles reflected the characteristic processes of phase change of water. The results revealed that storm dynamics were less sensitive to the initial aerosol concentrations than the low-level cooling associated with the large ice precipitating hydrometeor, i.e., graupel. The different dynamical responses and rainfall patterns simulated with the two schemes were greatly attributed to the fall speed characteristics of graupel. As aerosol concentration increased, the excess supercooled water made a greater contribution than the water vapor to the formation of precipitating ice hydrometeors before convection developed stronger and deeper. However, the characteristic sizes of graupel particles or snowflakes were rarely affected. Ice nuclei likely plays a significant role but the effects were not compared because it remains a great challenge to appropriately handle the complexities and uncertainties in and between the two BMSs in this study. Although the CLR scheme produced graupel earlier and in greater quantities than the Thompson scheme in the clean experiments, the precipitation was weaker and significantly delayed because the CLR graupel was smaller and precipitated slower than the hail-like graupel in the Thompson scheme. Hail-like graupel could exist below the freezing level and effectively cool the air below the convective core. Rainwater evaporation also increased because rainwater was bolstered by the melted graupel. Low-level cooling by evaporation and melting played an important role in storm intensification and propagation, as well as intense precipitation. Overall, aerosol effects on the liquid and ice hydrometeors, latent heat profiles, and precipitation intensity from the two schemes were qualitatively similar, but the magnitude could be suppressed or enhanced to different extents owing to uncertainties in the parameterizations.
In conclusion, implementing aerosol number concentration is convenient and effective to represent aerosol-cloud interactions for an operational model but there might be room for improvement in the cold rain process to increase the variety of aerosol effects on the ice hydrometeors. The vertical profile of latent heat release resulting from the phase change of water also shows substantial impacts on convective dynamics and precipitation, which implies the cold-rain process plays an important role in the representation of aerosol effects. Khadke and Pattnaik (2021) have identified a deficiency in the formation of frozen hydrometeors may be responsible for an underestimation of model rainfall in some circumstances due to the lack of cloud heating and dynamical response. Moreover, there are also many uncertainties in the parameterization methods or fundamental assumptions which still need to be adjusted according to regional weather characteristics such as fall-speed or particle population of individual hydrometeor categories, as mentioned in Bao et al. (2016, 2019) and Morrison et al. (2020). More observations are needed in future work to improve the representation of aerosol-cloud interactions coupled with both warm and cold rain processes as well as our understanding of the strengths and weaknesses of the BMSs.
Acknowledgements. This work was supported by the National Key Research and Development Program of China (Grant Nos. 2016YFE0109700 and 2017YFC150190X), Research Program from Science and Technology Committee of Shanghai (Grant No. 19dz1200101), and National Science Foundation of China (Grant Nos. 41575101 and 41975133). The authors are grateful to Drs. Jen-Ping CHEN and Tzu-Chin TSAI for providing the CLR scheme and guidance, and for fruitful discussions.
| Prognostic variable | Thompson | CLR |
| CCN (ASD) | unimodal | trimodal |
| IN (ASD) | unimodal | trimodal |
| Cloud water (moment, ρc, SD) | double, 1000, gamma | double, 1000, exp |
| Rainwater (moment, ρr, SD) | double, 1000, exp | double, 1000, exp |
| Cloud ice (moment, ρi, SD) | double, 890, exp | double, 500, exp |
| Snow (moment, ρs, SD) | single, 100, exp & gamma | double, 100, exp |
| Graupel (moment, ρg, SD) | single, 500, exp | double, 400, exp |

 AAS Website
 AAS WeChat